Zip Codes with the Highest Percentage of Population Employed in Administrative & Support Services in Bethlehem, PA
RELATED REPORTS & OPTIONS
Administrative & Support Services
Bethlehem
Compare Zip Codes
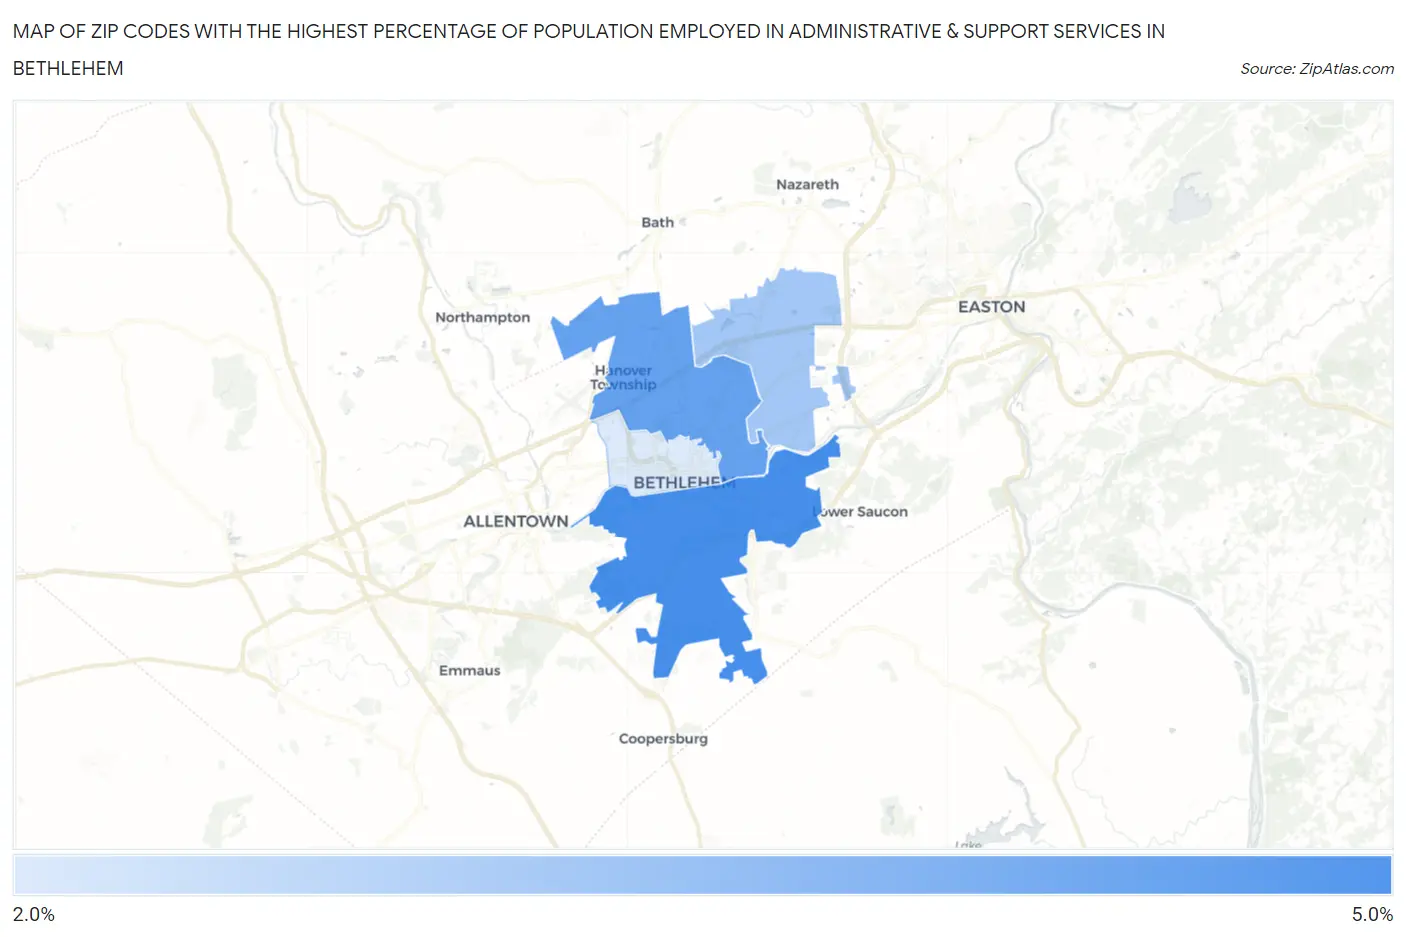
Map of Zip Codes with the Highest Percentage of Population Employed in Administrative & Support Services in Bethlehem
2.8%
4.6%
Zip Codes with the Highest Percentage of Population Employed in Administrative & Support Services in Bethlehem, PA
| Zip Code | % Employed | vs State | vs National | |
| 1. | 18015 | 4.6% | 3.6%(+1.04)#382 | 4.1%(+0.475)#8,284 |
| 2. | 18017 | 4.3% | 3.6%(+0.689)#440 | 4.1%(+0.124)#9,547 |
| 3. | 18020 | 3.5% | 3.6%(-0.083)#647 | 4.1%(-0.647)#12,952 |
| 4. | 18018 | 2.8% | 3.6%(-0.759)#866 | 4.1%(-1.32)#16,394 |
1
Common Questions
What are the Top 3 Zip Codes with the Highest Percentage of Population Employed in Administrative & Support Services in Bethlehem, PA?
Top 3 Zip Codes with the Highest Percentage of Population Employed in Administrative & Support Services in Bethlehem, PA are:
What zip code has the Highest Percentage of Population Employed in Administrative & Support Services in Bethlehem, PA?
18015 has the Highest Percentage of Population Employed in Administrative & Support Services in Bethlehem, PA with 4.6%.
What is the Percentage of Population Employed in Administrative & Support Services in Bethlehem, PA?
Percentage of Population Employed in Administrative & Support Services in Bethlehem is 4.0%.
What is the Percentage of Population Employed in Administrative & Support Services in Pennsylvania?
Percentage of Population Employed in Administrative & Support Services in Pennsylvania is 3.6%.
What is the Percentage of Population Employed in Administrative & Support Services in the United States?
Percentage of Population Employed in Administrative & Support Services in the United States is 4.1%.