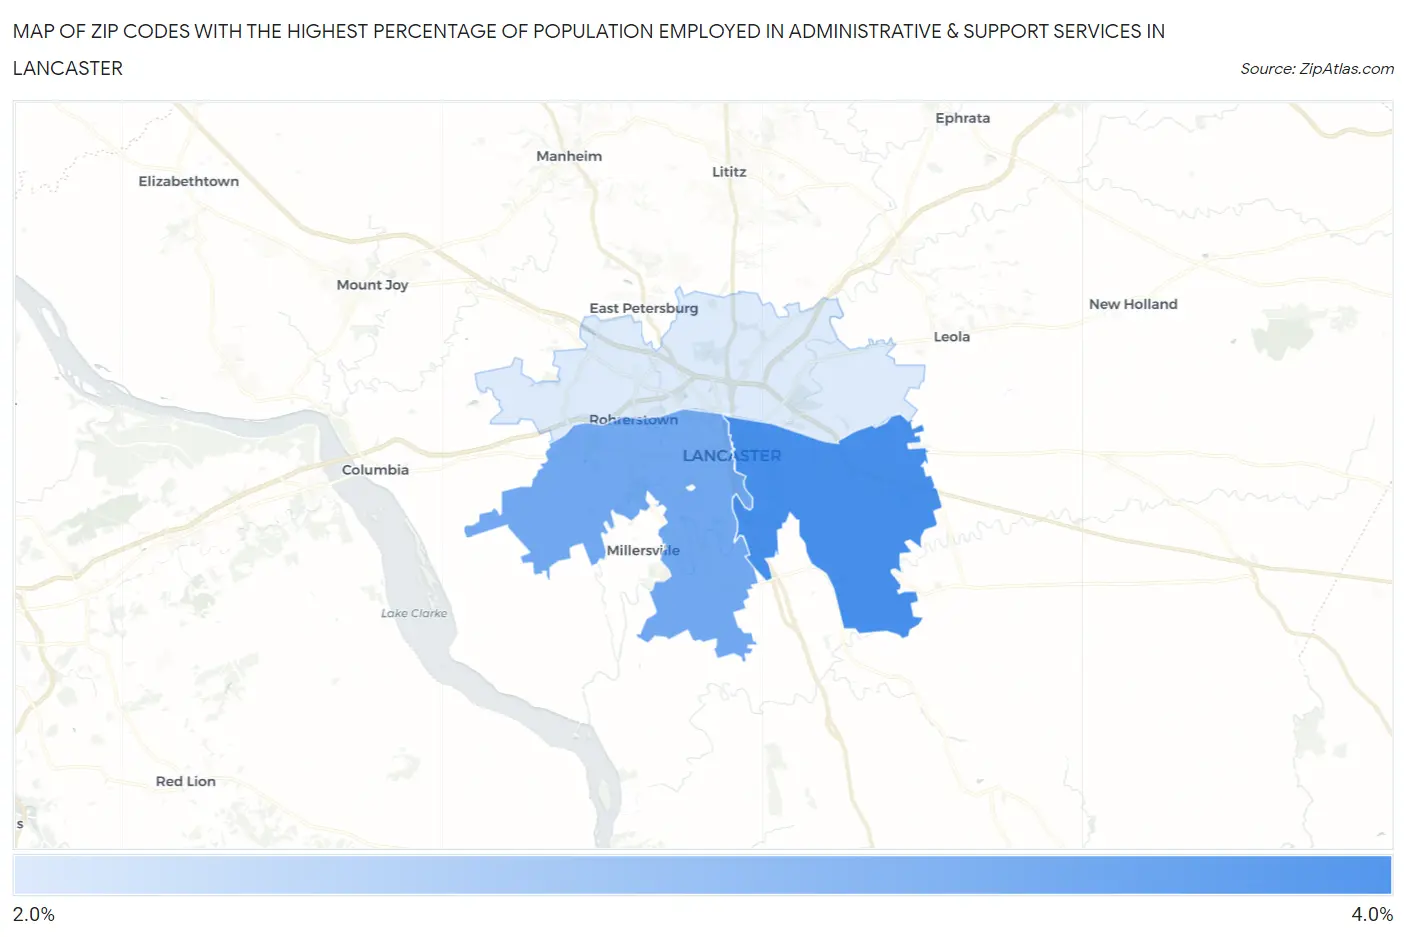
Zip Codes with the Highest Percentage of Population Employed in Administrative & Support Services in Lancaster, PA
RELATED REPORTS & OPTIONS
Administrative & Support Services
Lancaster
Compare Zip Codes
Map of Zip Codes with the Highest Percentage of Population Employed in Administrative & Support Services in Lancaster
2.6%
3.9%
Zip Codes with the Highest Percentage of Population Employed in Administrative & Support Services in Lancaster, PA
| Zip Code | % Employed | vs State | vs National | |
| 1. | 17602 | 3.9% | 3.6%(+0.359)#521 | 4.1%(-0.206)#10,914 |
| 2. | 17603 | 3.6% | 3.6%(-0.004)#620 | 4.1%(-0.569)#12,565 |
| 3. | 17601 | 2.6% | 3.6%(-0.964)#941 | 4.1%(-1.53)#17,493 |
1
Common Questions
What are the Top Zip Codes with the Highest Percentage of Population Employed in Administrative & Support Services in Lancaster, PA?
Top Zip Codes with the Highest Percentage of Population Employed in Administrative & Support Services in Lancaster, PA are:
What zip code has the Highest Percentage of Population Employed in Administrative & Support Services in Lancaster, PA?
17602 has the Highest Percentage of Population Employed in Administrative & Support Services in Lancaster, PA with 3.9%.
What is the Percentage of Population Employed in Administrative & Support Services in Lancaster, PA?
Percentage of Population Employed in Administrative & Support Services in Lancaster is 5.1%.
What is the Percentage of Population Employed in Administrative & Support Services in Pennsylvania?
Percentage of Population Employed in Administrative & Support Services in Pennsylvania is 3.6%.
What is the Percentage of Population Employed in Administrative & Support Services in the United States?
Percentage of Population Employed in Administrative & Support Services in the United States is 4.1%.