Zip Codes with the Highest Percentage of Population Employed in Administrative & Support Services in Pottstown, PA
RELATED REPORTS & OPTIONS
Administrative & Support Services
Pottstown
Compare Zip Codes
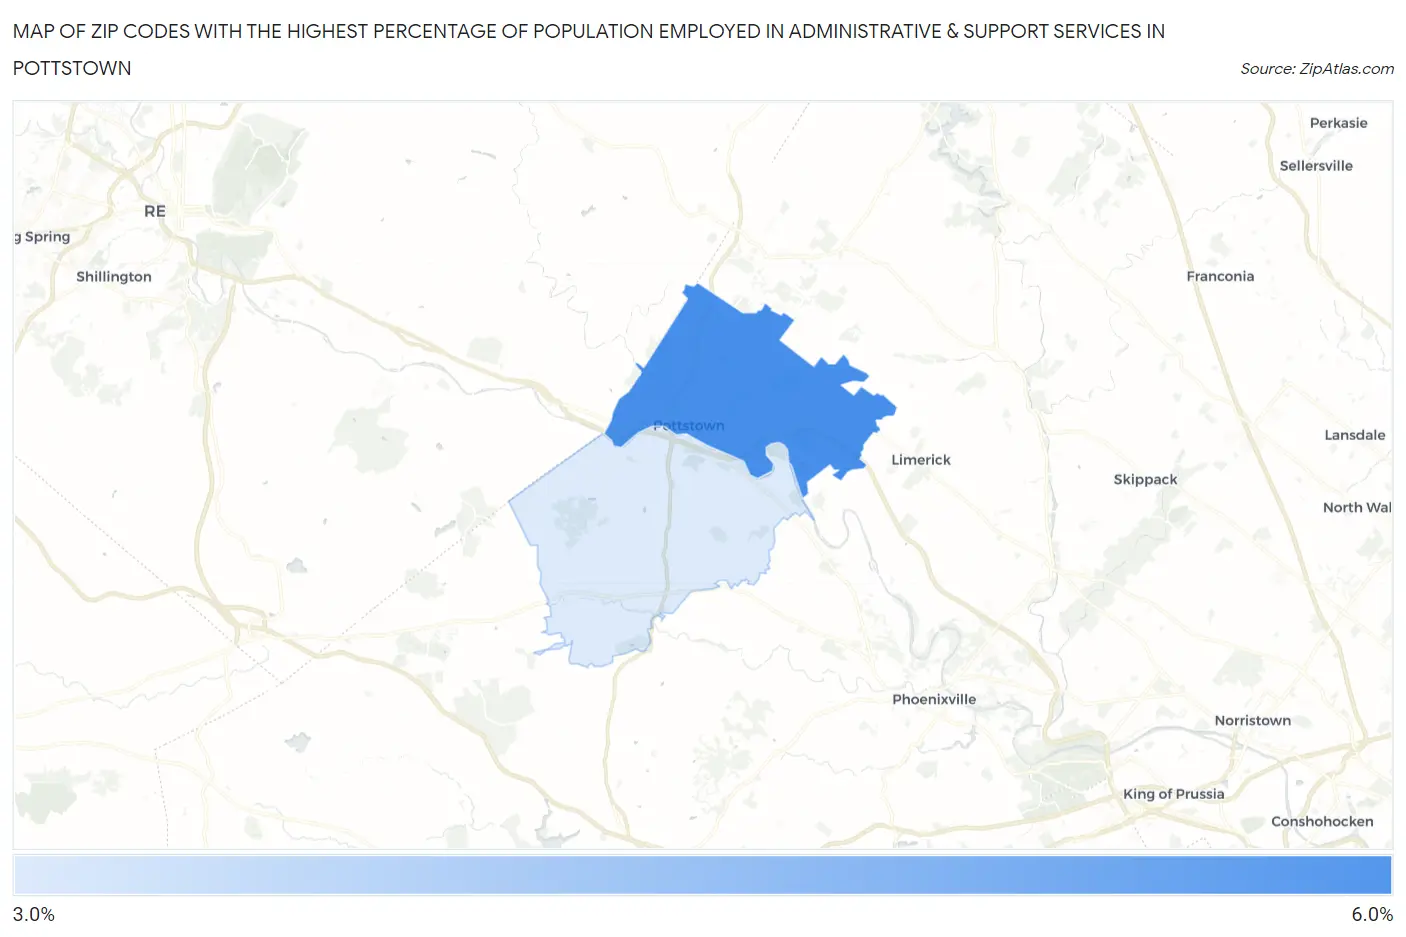
Map of Zip Codes with the Highest Percentage of Population Employed in Administrative & Support Services in Pottstown
3.9%
5.7%
Zip Codes with the Highest Percentage of Population Employed in Administrative & Support Services in Pottstown, PA
| Zip Code | % Employed | vs State | vs National | |
| 1. | 19464 | 5.7% | 3.6%(+2.09)#251 | 4.1%(+1.53)#5,396 |
| 2. | 19465 | 3.9% | 3.6%(+0.309)#531 | 4.1%(-0.255)#11,138 |
1
Common Questions
What are the Top Zip Codes with the Highest Percentage of Population Employed in Administrative & Support Services in Pottstown, PA?
Top Zip Codes with the Highest Percentage of Population Employed in Administrative & Support Services in Pottstown, PA are:
What zip code has the Highest Percentage of Population Employed in Administrative & Support Services in Pottstown, PA?
19464 has the Highest Percentage of Population Employed in Administrative & Support Services in Pottstown, PA with 5.7%.
What is the Percentage of Population Employed in Administrative & Support Services in Pennsylvania?
Percentage of Population Employed in Administrative & Support Services in Pennsylvania is 3.6%.
What is the Percentage of Population Employed in Administrative & Support Services in the United States?
Percentage of Population Employed in Administrative & Support Services in the United States is 4.1%.