Mckeesport, PA Map & Demographics
Mckeesport Map
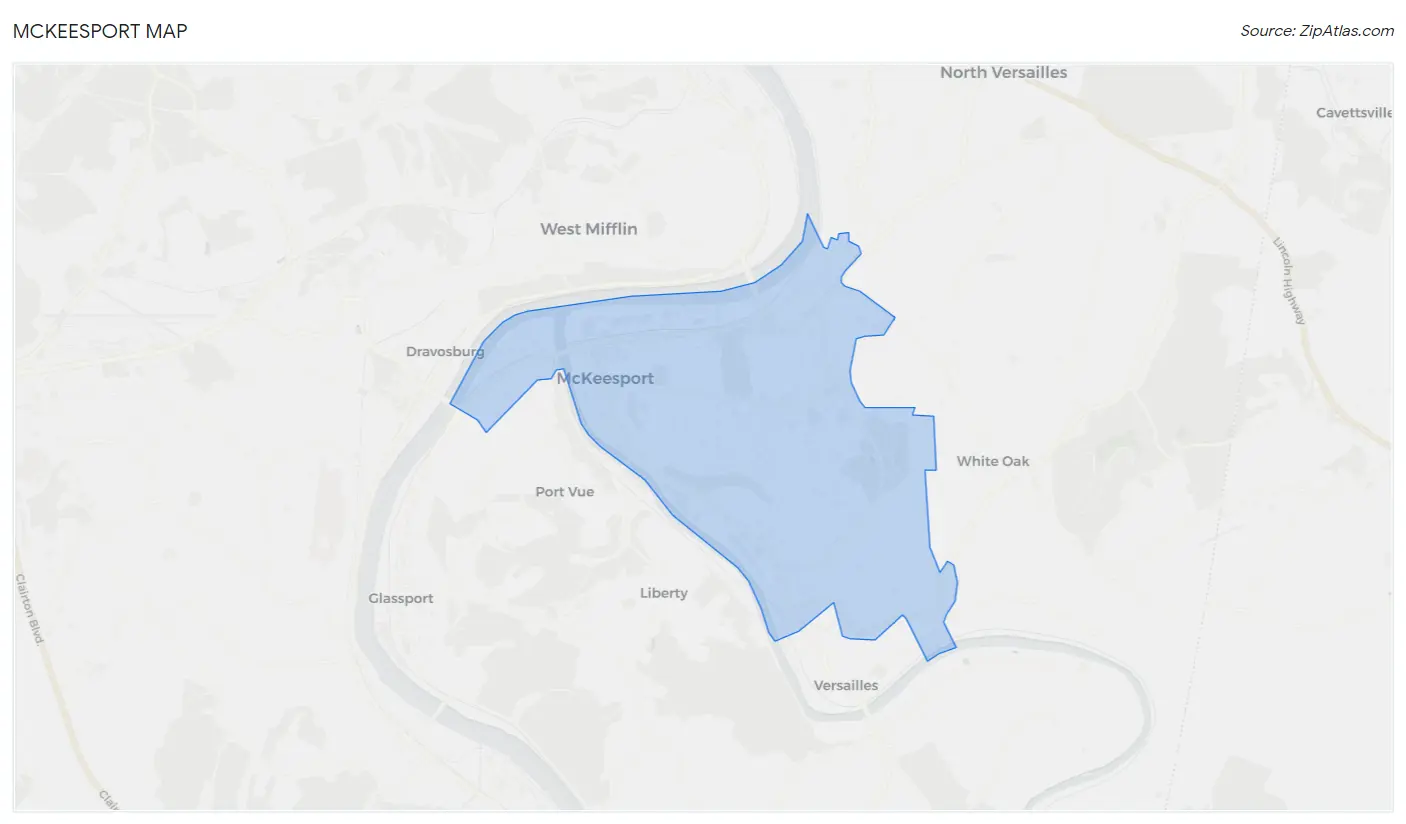
Mckeesport Overview
$23,388
PER CAPITA INCOME
$44,781
AVG FAMILY INCOME
$31,635
AVG HOUSEHOLD INCOME
21.5%
WAGE / INCOME GAP [ % ]
78.5¢/ $1
WAGE / INCOME GAP [ $ ]
$10,285
FAMILY INCOME DEFICIT
0.48
INEQUALITY / GINI INDEX
17,749
TOTAL POPULATION
8,130
MALE POPULATION
9,619
FEMALE POPULATION
84.52
MALES / 100 FEMALES
118.31
FEMALES / 100 MALES
42.1
MEDIAN AGE
2.9
AVG FAMILY SIZE
2.0
AVG HOUSEHOLD SIZE
7,485
LABOR FORCE [ PEOPLE ]
52.5%
PERCENT IN LABOR FORCE
7.8%
UNEMPLOYMENT RATE
Mckeesport Area Codes
Income in Mckeesport
Income Overview in Mckeesport
Per Capita Income in Mckeesport is $23,388, while median incomes of families and households are $44,781 and $31,635 respectively.
| Characteristic | Number | Measure |
| Per Capita Income | 17,749 | $23,388 |
| Median Family Income | 3,966 | $44,781 |
| Mean Family Income | 3,966 | $60,560 |
| Median Household Income | 8,266 | $31,635 |
| Mean Household Income | 8,266 | $47,291 |
| Income Deficit | 3,966 | $10,285 |
| Wage / Income Gap (%) | 17,749 | 21.50% |
| Wage / Income Gap ($) | 17,749 | 78.50¢ per $1 |
| Gini / Inequality Index | 17,749 | 0.48 |
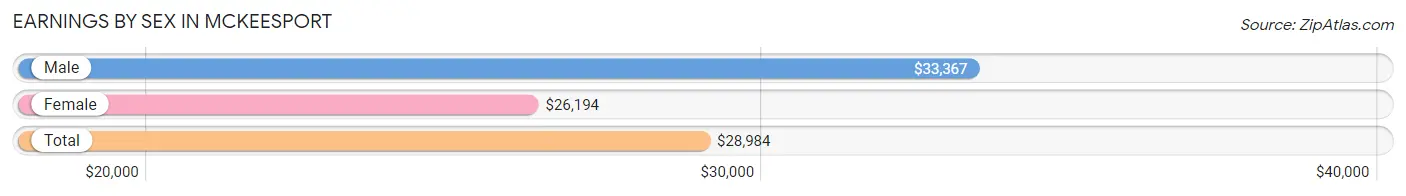
Earnings by Sex in Mckeesport
Average Earnings in Mckeesport are $28,984, $33,367 for men and $26,194 for women, a difference of 21.5%.
| Sex | Number | Average Earnings |
| Male | 3,280 (43.4%) | $33,367 |
| Female | 4,284 (56.6%) | $26,194 |
| Total | 7,564 (100.0%) | $28,984 |
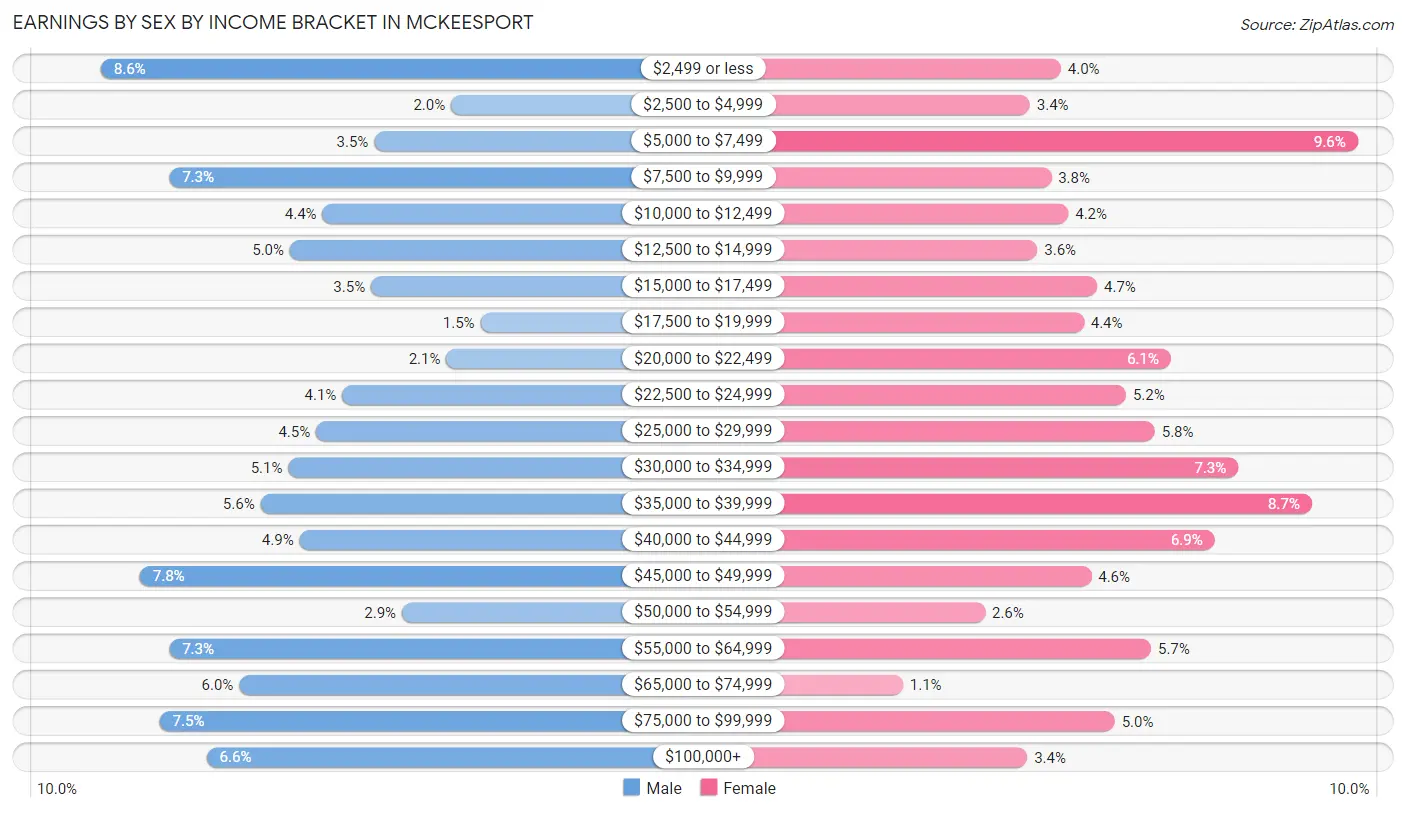
Earnings by Sex by Income Bracket in Mckeesport
The most common earnings brackets in Mckeesport are $2,499 or less for men (281 | 8.6%) and $5,000 to $7,499 for women (410 | 9.6%).
| Income | Male | Female |
| $2,499 or less | 281 (8.6%) | 172 (4.0%) |
| $2,500 to $4,999 | 66 (2.0%) | 147 (3.4%) |
| $5,000 to $7,499 | 113 (3.5%) | 410 (9.6%) |
| $7,500 to $9,999 | 239 (7.3%) | 164 (3.8%) |
| $10,000 to $12,499 | 145 (4.4%) | 178 (4.2%) |
| $12,500 to $14,999 | 165 (5.0%) | 153 (3.6%) |
| $15,000 to $17,499 | 115 (3.5%) | 201 (4.7%) |
| $17,500 to $19,999 | 48 (1.5%) | 190 (4.4%) |
| $20,000 to $22,499 | 69 (2.1%) | 260 (6.1%) |
| $22,500 to $24,999 | 133 (4.1%) | 224 (5.2%) |
| $25,000 to $29,999 | 149 (4.5%) | 247 (5.8%) |
| $30,000 to $34,999 | 166 (5.1%) | 314 (7.3%) |
| $35,000 to $39,999 | 183 (5.6%) | 373 (8.7%) |
| $40,000 to $44,999 | 159 (4.9%) | 295 (6.9%) |
| $45,000 to $49,999 | 257 (7.8%) | 196 (4.6%) |
| $50,000 to $54,999 | 96 (2.9%) | 111 (2.6%) |
| $55,000 to $64,999 | 239 (7.3%) | 244 (5.7%) |
| $65,000 to $74,999 | 196 (6.0%) | 45 (1.1%) |
| $75,000 to $99,999 | 245 (7.5%) | 215 (5.0%) |
| $100,000+ | 216 (6.6%) | 145 (3.4%) |
| Total | 3,280 (100.0%) | 4,284 (100.0%) |
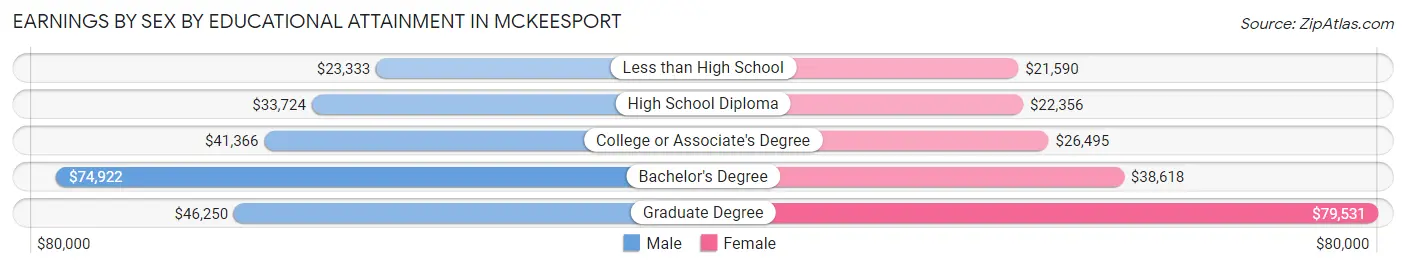
Earnings by Sex by Educational Attainment in Mckeesport
Average earnings in Mckeesport are $37,794 for men and $29,053 for women, a difference of 23.1%. Men with an educational attainment of bachelor's degree enjoy the highest average annual earnings of $74,922, while those with less than high school education earn the least with $23,333. Women with an educational attainment of graduate degree earn the most with the average annual earnings of $79,531, while those with less than high school education have the smallest earnings of $21,590.
| Educational Attainment | Male Income | Female Income |
| Less than High School | $23,333 | $21,590 |
| High School Diploma | $33,724 | $22,356 |
| College or Associate's Degree | $41,366 | $26,495 |
| Bachelor's Degree | $74,922 | $38,618 |
| Graduate Degree | $46,250 | $79,531 |
| Total | $37,794 | $29,053 |
Family Income in Mckeesport
Family Income Brackets in Mckeesport
According to the Mckeesport family income data, there are 662 families falling into the $50,000 to $74,999 income range, which is the most common income bracket and makes up 16.7% of all families. Conversely, the $200,000+ income bracket is the least frequent group with only 131 families (3.3%) belonging to this category.
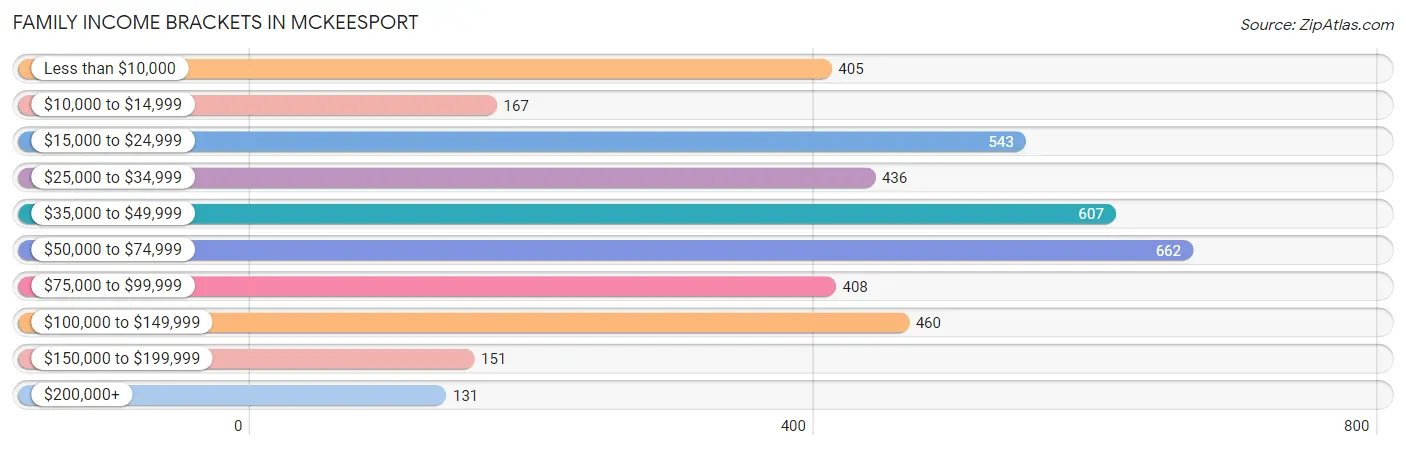
| Income Bracket | # Families | % Families |
| Less than $10,000 | 405 | 10.2% |
| $10,000 to $14,999 | 167 | 4.2% |
| $15,000 to $24,999 | 543 | 13.7% |
| $25,000 to $34,999 | 436 | 11.0% |
| $35,000 to $49,999 | 607 | 15.3% |
| $50,000 to $74,999 | 662 | 16.7% |
| $75,000 to $99,999 | 408 | 10.3% |
| $100,000 to $149,999 | 460 | 11.6% |
| $150,000 to $199,999 | 151 | 3.8% |
| $200,000+ | 131 | 3.3% |
Family Income by Famaliy Size in Mckeesport
6-person families (51 | 1.3%) account for the highest median family income in Mckeesport with $136,250 per family, while 6-person families (51 | 1.3%) have the highest median income of $22,708 per family member.
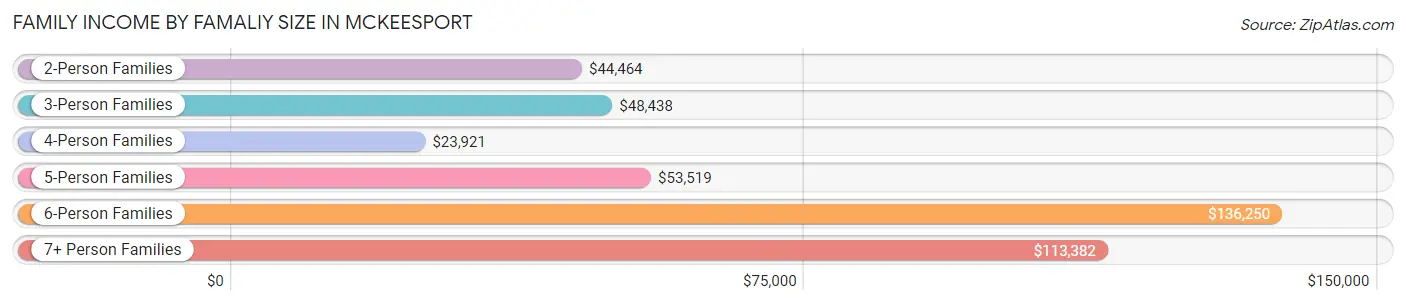
| Income Bracket | # Families | Median Income |
| 2-Person Families | 2,028 (51.1%) | $44,464 |
| 3-Person Families | 980 (24.7%) | $48,438 |
| 4-Person Families | 625 (15.8%) | $23,921 |
| 5-Person Families | 246 (6.2%) | $53,519 |
| 6-Person Families | 51 (1.3%) | $136,250 |
| 7+ Person Families | 36 (0.9%) | $113,382 |
| Total | 3,966 (100.0%) | $44,781 |
Family Income by Number of Earners in Mckeesport
The median family income in Mckeesport is $44,781, with families comprising 3+ earners (178) having the highest median family income of $111,081, while families with no earners (1,106) have the lowest median family income of $26,061, accounting for 4.5% and 27.9% of families, respectively.
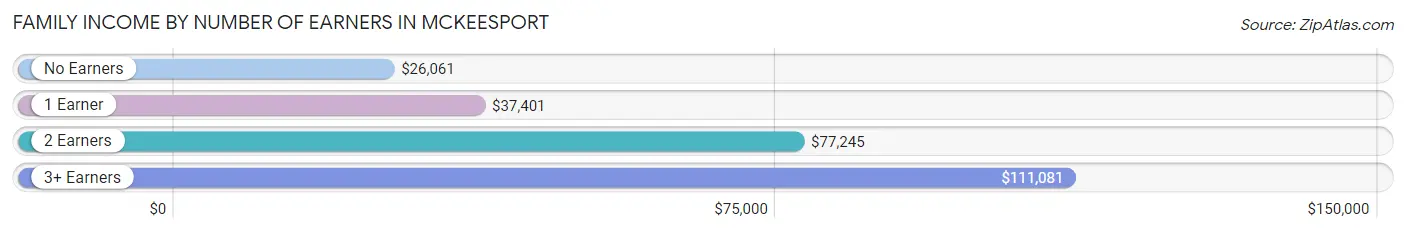
| Number of Earners | # Families | Median Income |
| No Earners | 1,106 (27.9%) | $26,061 |
| 1 Earner | 1,525 (38.5%) | $37,401 |
| 2 Earners | 1,157 (29.2%) | $77,245 |
| 3+ Earners | 178 (4.5%) | $111,081 |
| Total | 3,966 (100.0%) | $44,781 |
Household Income in Mckeesport
Household Income Brackets in Mckeesport
With 1,447 households falling in the category, the $15,000 to $24,999 income range is the most frequent in Mckeesport, accounting for 17.5% of all households. In contrast, only 174 households (2.1%) fall into the $150,000 to $199,999 income bracket, making it the least populous group.
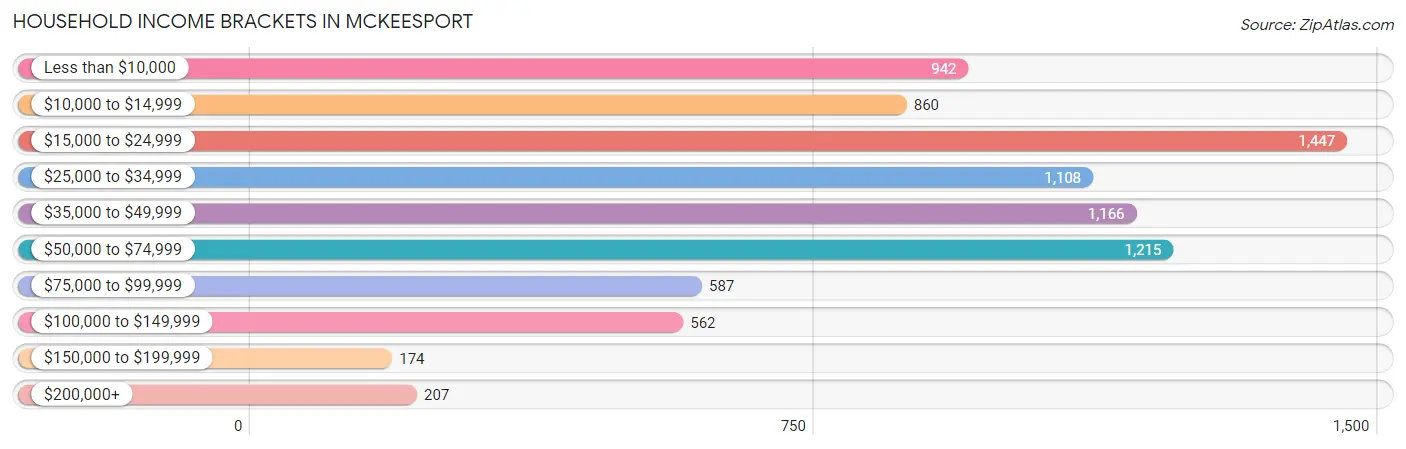
| Income Bracket | # Households | % Households |
| Less than $10,000 | 942 | 11.4% |
| $10,000 to $14,999 | 860 | 10.4% |
| $15,000 to $24,999 | 1,447 | 17.5% |
| $25,000 to $34,999 | 1,108 | 13.4% |
| $35,000 to $49,999 | 1,166 | 14.1% |
| $50,000 to $74,999 | 1,215 | 14.7% |
| $75,000 to $99,999 | 587 | 7.1% |
| $100,000 to $149,999 | 562 | 6.8% |
| $150,000 to $199,999 | 174 | 2.1% |
| $200,000+ | 207 | 2.5% |
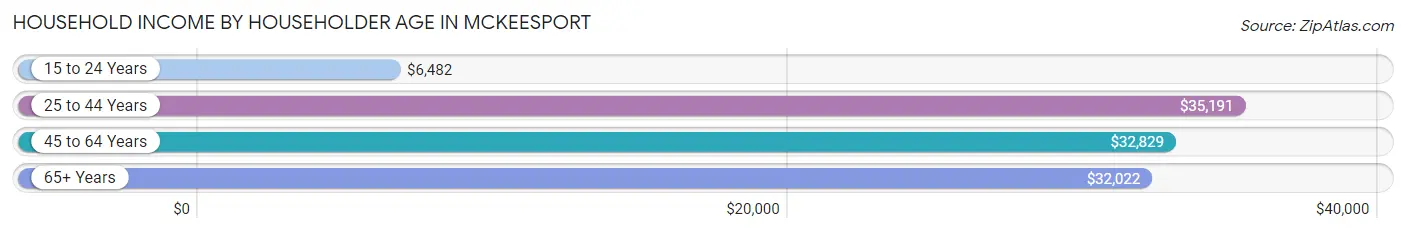
Household Income by Householder Age in Mckeesport
The median household income in Mckeesport is $31,635, with the highest median household income of $35,191 found in the 25 to 44 years age bracket for the primary householder. A total of 2,568 households (31.1%) fall into this category. Meanwhile, the 15 to 24 years age bracket for the primary householder has the lowest median household income of $6,482, with 204 households (2.5%) in this group.
| Income Bracket | # Households | Median Income |
| 15 to 24 Years | 204 (2.5%) | $6,482 |
| 25 to 44 Years | 2,568 (31.1%) | $35,191 |
| 45 to 64 Years | 3,041 (36.8%) | $32,829 |
| 65+ Years | 2,453 (29.7%) | $32,022 |
| Total | 8,266 (100.0%) | $31,635 |
Poverty in Mckeesport
Income Below Poverty by Sex and Age in Mckeesport
With 28.8% poverty level for males and 28.9% for females among the residents of Mckeesport, 6 to 11 year old males and 12 to 14 year old females are the most vulnerable to poverty, with 290 males (55.0%) and 255 females (73.1%) in their respective age groups living below the poverty level.
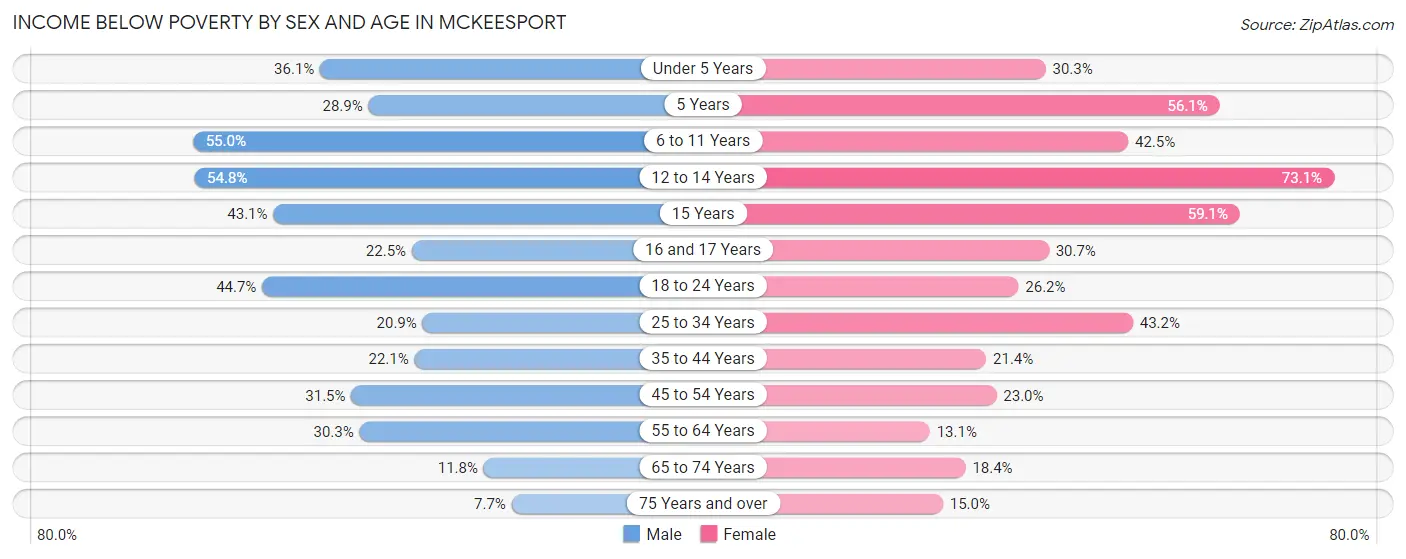
| Age Bracket | Male | Female |
| Under 5 Years | 156 (36.1%) | 157 (30.2%) |
| 5 Years | 35 (28.9%) | 69 (56.1%) |
| 6 to 11 Years | 290 (55.0%) | 272 (42.5%) |
| 12 to 14 Years | 221 (54.8%) | 255 (73.1%) |
| 15 Years | 62 (43.1%) | 91 (59.1%) |
| 16 and 17 Years | 47 (22.5%) | 47 (30.7%) |
| 18 to 24 Years | 233 (44.7%) | 134 (26.2%) |
| 25 to 34 Years | 186 (20.9%) | 741 (43.2%) |
| 35 to 44 Years | 175 (22.1%) | 207 (21.4%) |
| 45 to 54 Years | 306 (31.5%) | 216 (23.0%) |
| 55 to 64 Years | 397 (30.3%) | 194 (13.1%) |
| 65 to 74 Years | 113 (11.8%) | 184 (18.4%) |
| 75 Years and over | 44 (7.7%) | 99 (15.0%) |
| Total | 2,265 (28.8%) | 2,666 (28.9%) |
Income Above Poverty by Sex and Age in Mckeesport
According to the poverty statistics in Mckeesport, males aged 75 years and over and females aged 55 to 64 years are the age groups that are most secure financially, with 92.3% of males and 86.9% of females in these age groups living above the poverty line.
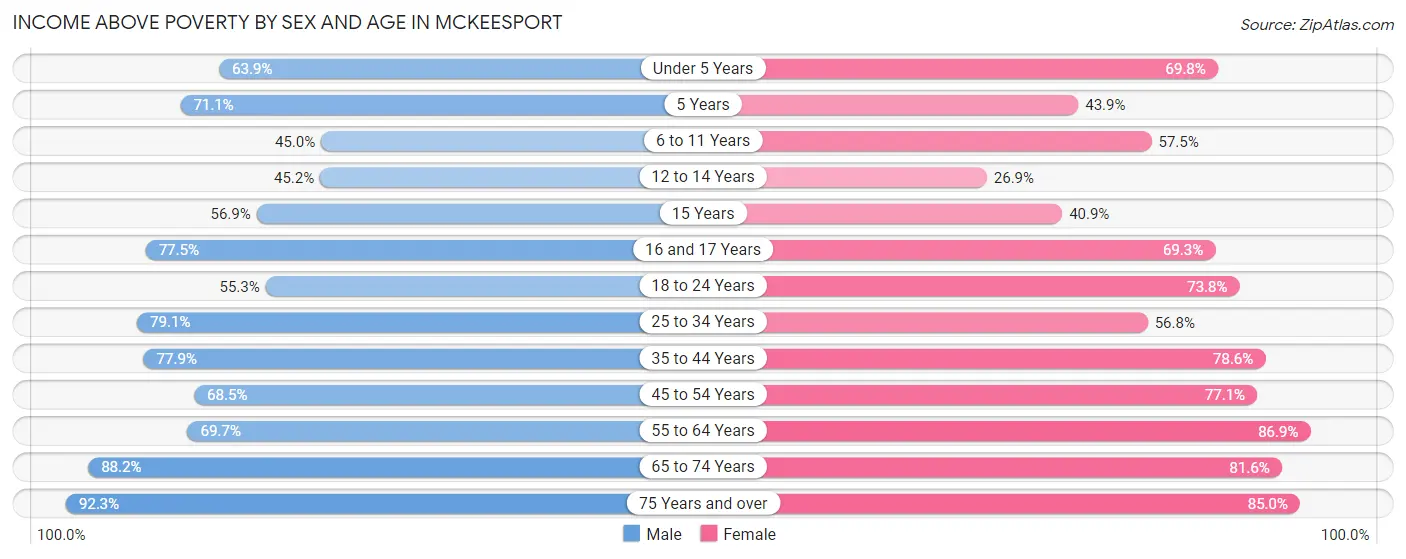
| Age Bracket | Male | Female |
| Under 5 Years | 276 (63.9%) | 362 (69.8%) |
| 5 Years | 86 (71.1%) | 54 (43.9%) |
| 6 to 11 Years | 237 (45.0%) | 368 (57.5%) |
| 12 to 14 Years | 182 (45.2%) | 94 (26.9%) |
| 15 Years | 82 (56.9%) | 63 (40.9%) |
| 16 and 17 Years | 162 (77.5%) | 106 (69.3%) |
| 18 to 24 Years | 288 (55.3%) | 377 (73.8%) |
| 25 to 34 Years | 704 (79.1%) | 974 (56.8%) |
| 35 to 44 Years | 617 (77.9%) | 759 (78.6%) |
| 45 to 54 Years | 666 (68.5%) | 725 (77.0%) |
| 55 to 64 Years | 915 (69.7%) | 1,291 (86.9%) |
| 65 to 74 Years | 844 (88.2%) | 818 (81.6%) |
| 75 Years and over | 530 (92.3%) | 561 (85.0%) |
| Total | 5,589 (71.2%) | 6,552 (71.1%) |
Income Below Poverty Among Married-Couple Families in Mckeesport
The poverty statistics for married-couple families in Mckeesport show that 10.8% or 196 of the total 1,811 families live below the poverty line. Families with 1 or 2 children have the highest poverty rate of 22.9%, comprising of 77 families. On the other hand, families with no children have the lowest poverty rate of 8.1%, which includes 108 families.
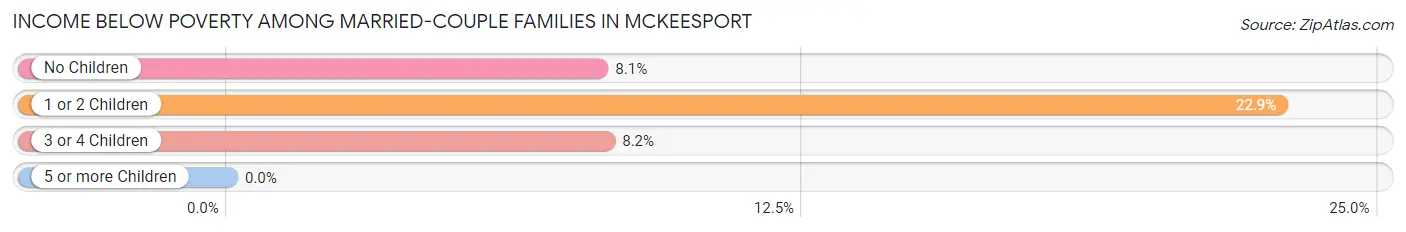
| Children | Above Poverty | Below Poverty |
| No Children | 1,232 (91.9%) | 108 (8.1%) |
| 1 or 2 Children | 260 (77.1%) | 77 (22.9%) |
| 3 or 4 Children | 123 (91.8%) | 11 (8.2%) |
| 5 or more Children | 0 (0.0%) | 0 (0.0%) |
| Total | 1,615 (89.2%) | 196 (10.8%) |
Income Below Poverty Among Single-Parent Households in Mckeesport
According to the poverty data in Mckeesport, 13.9% or 42 single-father households and 45.5% or 843 single-mother households are living below the poverty line. Among single-father households, those with 1 or 2 children have the highest poverty rate, with 23 households (28.1%) experiencing poverty. Likewise, among single-mother households, those with 5 or more children have the highest poverty rate, with 12 households (100.0%) falling below the poverty line.
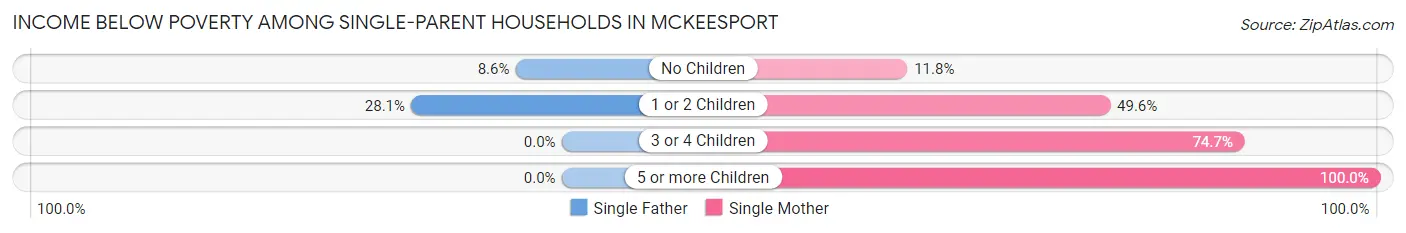
| Children | Single Father | Single Mother |
| No Children | 19 (8.6%) | 58 (11.8%) |
| 1 or 2 Children | 23 (28.1%) | 466 (49.6%) |
| 3 or 4 Children | 0 (0.0%) | 307 (74.7%) |
| 5 or more Children | 0 (0.0%) | 12 (100.0%) |
| Total | 42 (13.9%) | 843 (45.5%) |
Income Below Poverty Among Married-Couple vs Single-Parent Households in Mckeesport
The poverty data for Mckeesport shows that 196 of the married-couple family households (10.8%) and 885 of the single-parent households (41.1%) are living below the poverty level. Within the married-couple family households, those with 1 or 2 children have the highest poverty rate, with 77 households (22.9%) falling below the poverty line. Among the single-parent households, those with 5 or more children have the highest poverty rate, with 12 household (100.0%) living below poverty.
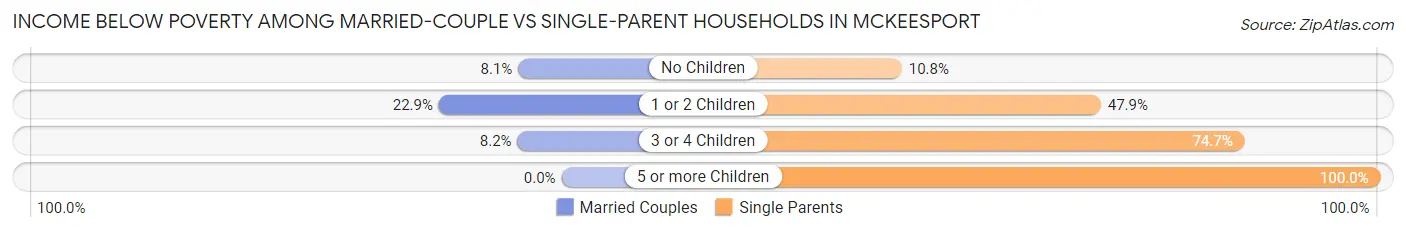
| Children | Married-Couple Families | Single-Parent Households |
| No Children | 108 (8.1%) | 77 (10.8%) |
| 1 or 2 Children | 77 (22.9%) | 489 (47.9%) |
| 3 or 4 Children | 11 (8.2%) | 307 (74.7%) |
| 5 or more Children | 0 (0.0%) | 12 (100.0%) |
| Total | 196 (10.8%) | 885 (41.1%) |
Race in Mckeesport
The most populous races in Mckeesport are White / Caucasian (9,513 | 53.6%), Black / African American (6,379 | 35.9%), and Two or more Races (1,247 | 7.0%).
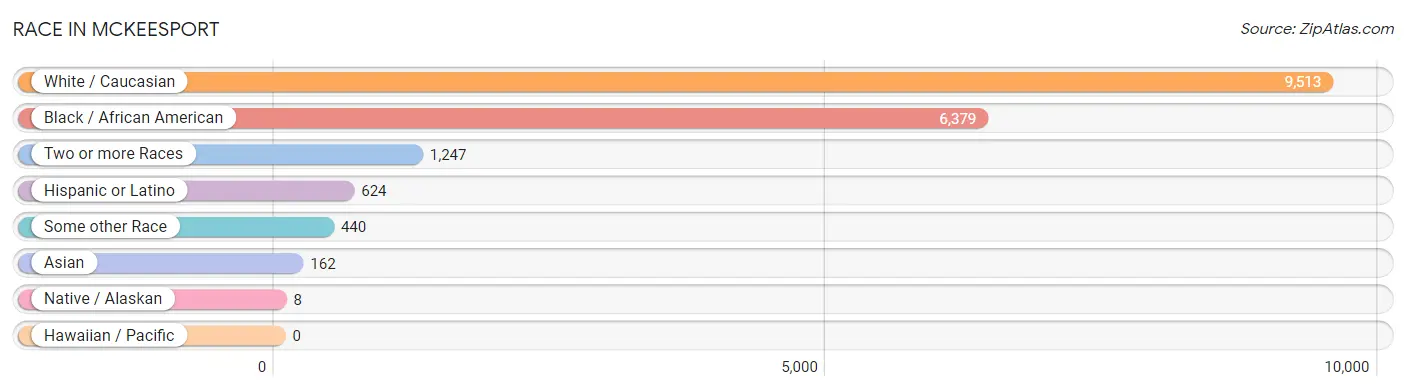
| Race | # Population | % Population |
| Asian | 162 | 0.9% |
| Black / African American | 6,379 | 35.9% |
| Hawaiian / Pacific | 0 | 0.0% |
| Hispanic or Latino | 624 | 3.5% |
| Native / Alaskan | 8 | 0.1% |
| White / Caucasian | 9,513 | 53.6% |
| Two or more Races | 1,247 | 7.0% |
| Some other Race | 440 | 2.5% |
| Total | 17,749 | 100.0% |
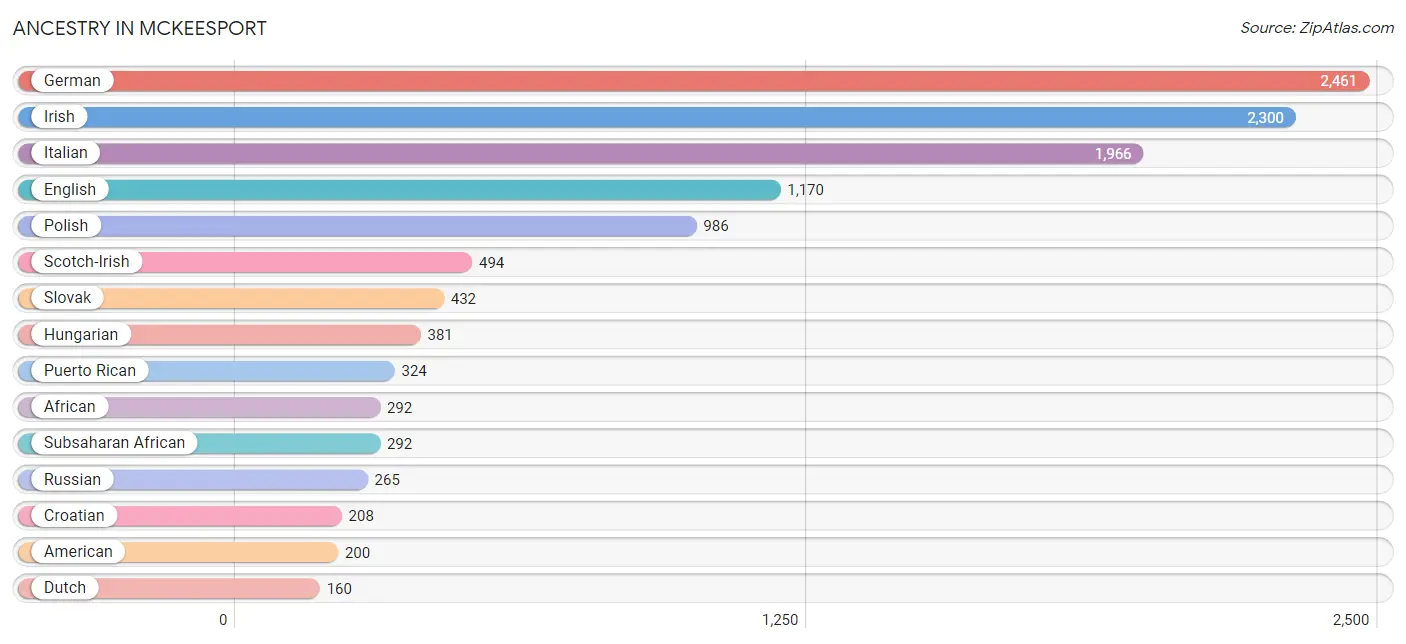
Ancestry in Mckeesport
The most populous ancestries reported in Mckeesport are German (2,461 | 13.9%), Irish (2,300 | 13.0%), Italian (1,966 | 11.1%), English (1,170 | 6.6%), and Polish (986 | 5.6%), together accounting for 50.1% of all Mckeesport residents.
| Ancestry | # Population | % Population |
| African | 292 | 1.7% |
| American | 200 | 1.1% |
| Apache | 73 | 0.4% |
| Arab | 76 | 0.4% |
| Australian | 20 | 0.1% |
| Austrian | 31 | 0.2% |
| Blackfeet | 119 | 0.7% |
| Brazilian | 11 | 0.1% |
| British | 19 | 0.1% |
| Bulgarian | 7 | 0.0% |
| Cajun | 24 | 0.1% |
| Central American | 159 | 0.9% |
| Cherokee | 145 | 0.8% |
| Croatian | 208 | 1.2% |
| Cuban | 7 | 0.0% |
| Czechoslovakian | 45 | 0.3% |
| Dutch | 160 | 0.9% |
| Eastern European | 30 | 0.2% |
| English | 1,170 | 6.6% |
| European | 27 | 0.2% |
| French | 91 | 0.5% |
| German | 2,461 | 13.9% |
| Greek | 25 | 0.1% |
| Guatemalan | 159 | 0.9% |
| Hungarian | 381 | 2.1% |
| Indian (Asian) | 87 | 0.5% |
| Iraqi | 19 | 0.1% |
| Irish | 2,300 | 13.0% |
| Italian | 1,966 | 11.1% |
| Jamaican | 78 | 0.4% |
| Korean | 46 | 0.3% |
| Lebanese | 17 | 0.1% |
| Lithuanian | 10 | 0.1% |
| Mexican | 47 | 0.3% |
| Native Hawaiian | 1 | 0.0% |
| Norwegian | 29 | 0.2% |
| Polish | 986 | 5.6% |
| Puerto Rican | 324 | 1.8% |
| Romanian | 123 | 0.7% |
| Russian | 265 | 1.5% |
| Scotch-Irish | 494 | 2.8% |
| Scottish | 119 | 0.7% |
| Serbian | 7 | 0.0% |
| Slavic | 60 | 0.3% |
| Slovak | 432 | 2.4% |
| Slovene | 49 | 0.3% |
| Spaniard | 50 | 0.3% |
| Sri Lankan | 50 | 0.3% |
| Subsaharan African | 292 | 1.7% |
| Swedish | 92 | 0.5% |
| Swiss | 1 | 0.0% |
| Syrian | 40 | 0.2% |
| Ukrainian | 66 | 0.4% |
| Welsh | 89 | 0.5% | View All 54 Rows |
Immigrants in Mckeesport
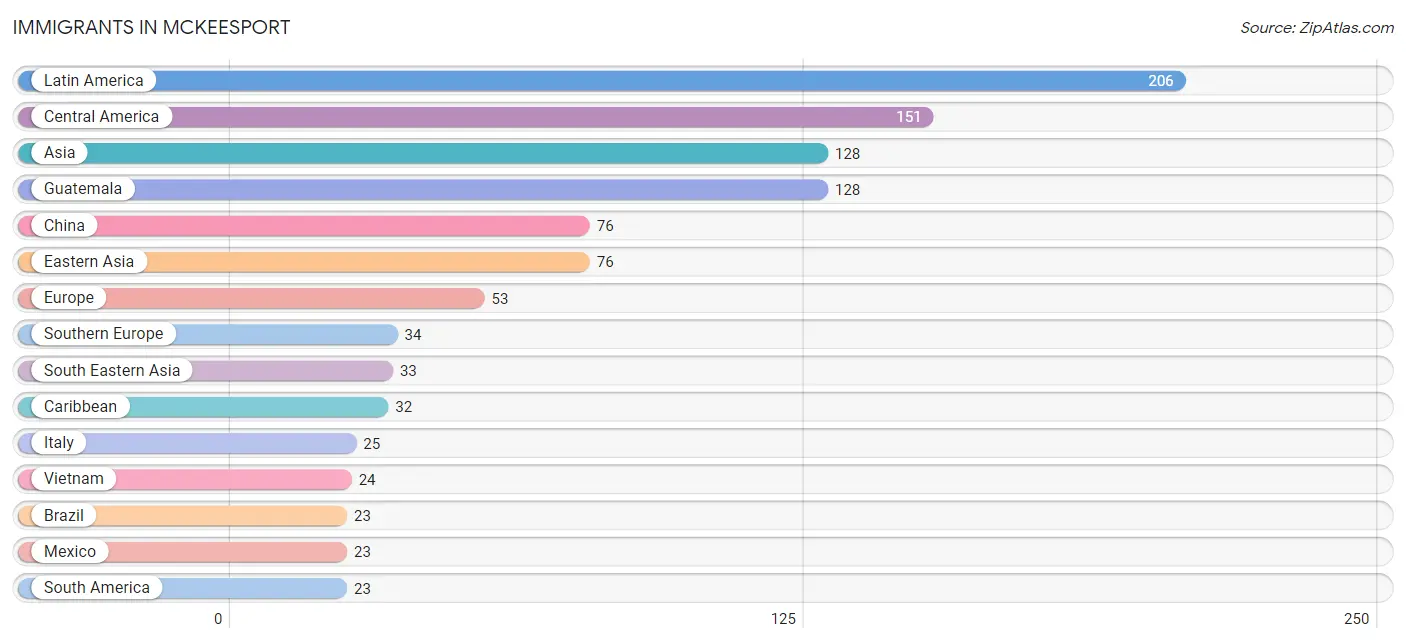
The most numerous immigrant groups reported in Mckeesport came from Latin America (206 | 1.2%), Central America (151 | 0.9%), Asia (128 | 0.7%), Guatemala (128 | 0.7%), and China (76 | 0.4%), together accounting for 3.9% of all Mckeesport residents.
| Immigration Origin | # Population | % Population |
| Africa | 1 | 0.0% |
| Asia | 128 | 0.7% |
| Brazil | 23 | 0.1% |
| Bulgaria | 1 | 0.0% |
| Canada | 8 | 0.1% |
| Caribbean | 32 | 0.2% |
| Central America | 151 | 0.9% |
| China | 76 | 0.4% |
| Cuba | 7 | 0.0% |
| Dominican Republic | 5 | 0.0% |
| Eastern Africa | 1 | 0.0% |
| Eastern Asia | 76 | 0.4% |
| Eastern Europe | 1 | 0.0% |
| England | 17 | 0.1% |
| Europe | 53 | 0.3% |
| Greece | 9 | 0.1% |
| Guatemala | 128 | 0.7% |
| Iraq | 19 | 0.1% |
| Italy | 25 | 0.1% |
| Jamaica | 20 | 0.1% |
| Latin America | 206 | 1.2% |
| Mexico | 23 | 0.1% |
| Northern Europe | 18 | 0.1% |
| Philippines | 9 | 0.1% |
| South America | 23 | 0.1% |
| South Eastern Asia | 33 | 0.2% |
| Southern Europe | 34 | 0.2% |
| Vietnam | 24 | 0.1% |
| Western Asia | 19 | 0.1% | View All 29 Rows |
Sex and Age in Mckeesport
Sex and Age in Mckeesport
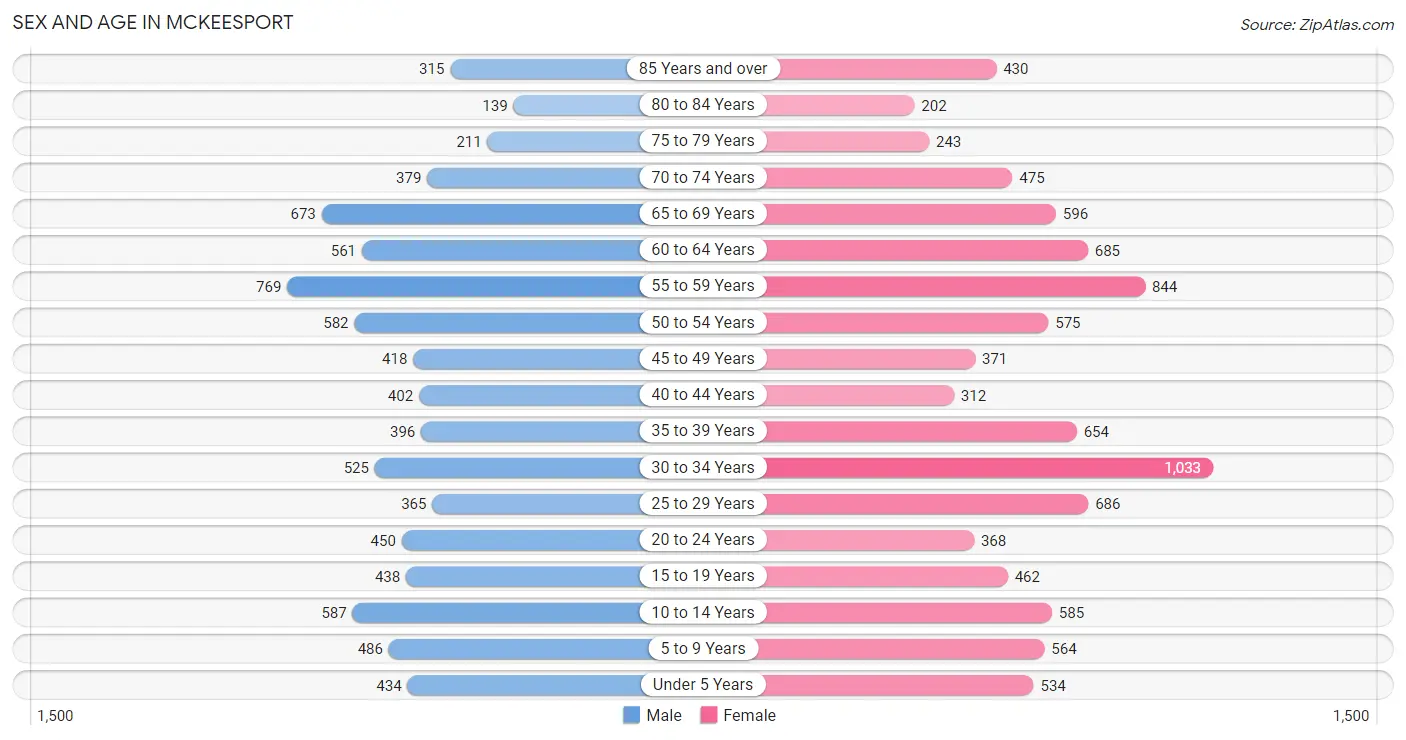
The most populous age groups in Mckeesport are 55 to 59 Years (769 | 9.5%) for men and 30 to 34 Years (1,033 | 10.7%) for women.
| Age Bracket | Male | Female |
| Under 5 Years | 434 (5.3%) | 534 (5.6%) |
| 5 to 9 Years | 486 (6.0%) | 564 (5.9%) |
| 10 to 14 Years | 587 (7.2%) | 585 (6.1%) |
| 15 to 19 Years | 438 (5.4%) | 462 (4.8%) |
| 20 to 24 Years | 450 (5.5%) | 368 (3.8%) |
| 25 to 29 Years | 365 (4.5%) | 686 (7.1%) |
| 30 to 34 Years | 525 (6.5%) | 1,033 (10.7%) |
| 35 to 39 Years | 396 (4.9%) | 654 (6.8%) |
| 40 to 44 Years | 402 (4.9%) | 312 (3.2%) |
| 45 to 49 Years | 418 (5.1%) | 371 (3.9%) |
| 50 to 54 Years | 582 (7.2%) | 575 (6.0%) |
| 55 to 59 Years | 769 (9.5%) | 844 (8.8%) |
| 60 to 64 Years | 561 (6.9%) | 685 (7.1%) |
| 65 to 69 Years | 673 (8.3%) | 596 (6.2%) |
| 70 to 74 Years | 379 (4.7%) | 475 (4.9%) |
| 75 to 79 Years | 211 (2.6%) | 243 (2.5%) |
| 80 to 84 Years | 139 (1.7%) | 202 (2.1%) |
| 85 Years and over | 315 (3.9%) | 430 (4.5%) |
| Total | 8,130 (100.0%) | 9,619 (100.0%) |
Families and Households in Mckeesport
Median Family Size in Mckeesport
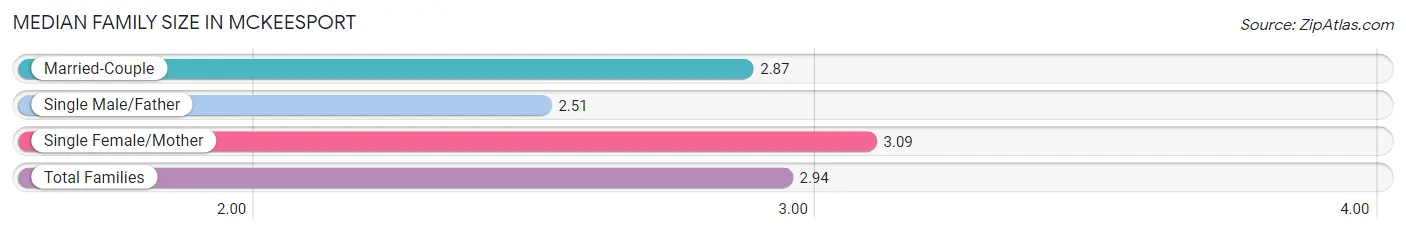
The median family size in Mckeesport is 2.94 persons per family, with single female/mother families (1,852 | 46.7%) accounting for the largest median family size of 3.09 persons per family. On the other hand, single male/father families (303 | 7.6%) represent the smallest median family size with 2.51 persons per family.
| Family Type | # Families | Family Size |
| Married-Couple | 1,811 (45.7%) | 2.87 |
| Single Male/Father | 303 (7.6%) | 2.51 |
| Single Female/Mother | 1,852 (46.7%) | 3.09 |
| Total Families | 3,966 (100.0%) | 2.94 |
Median Household Size in Mckeesport
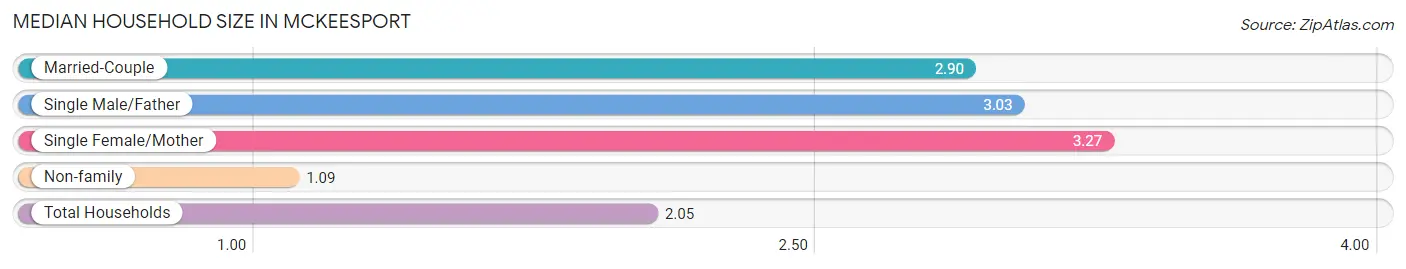
The median household size in Mckeesport is 2.05 persons per household, with single female/mother households (1,852 | 22.4%) accounting for the largest median household size of 3.27 persons per household. non-family households (4,300 | 52.0%) represent the smallest median household size with 1.09 persons per household.
| Household Type | # Households | Household Size |
| Married-Couple | 1,811 (21.9%) | 2.90 |
| Single Male/Father | 303 (3.7%) | 3.03 |
| Single Female/Mother | 1,852 (22.4%) | 3.27 |
| Non-family | 4,300 (52.0%) | 1.09 |
| Total Households | 8,266 (100.0%) | 2.05 |
Household Size by Marriage Status in Mckeesport
Out of a total of 8,266 households in Mckeesport, 3,966 (48.0%) are family households, while 4,300 (52.0%) are nonfamily households. The most numerous type of family households are 2-person households, comprising 1,853, and the most common type of nonfamily households are 1-person households, comprising 3,969.
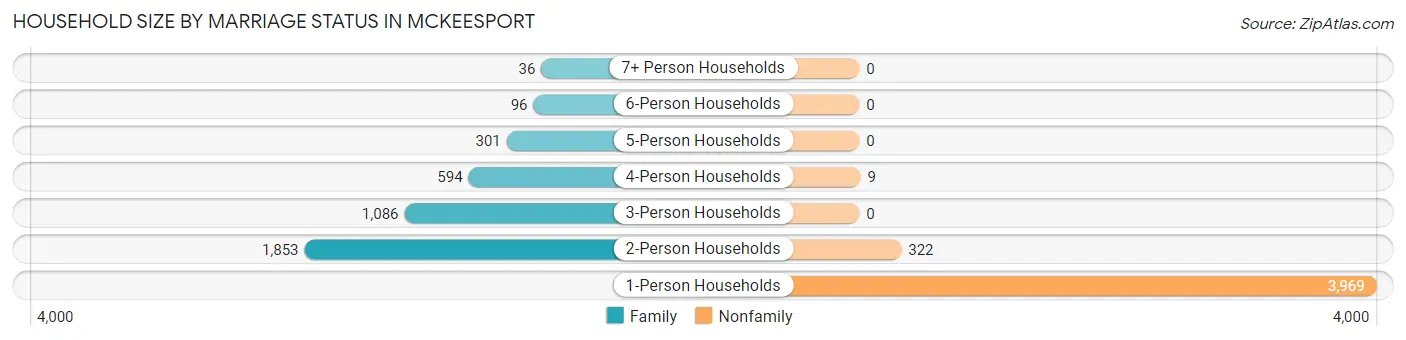
| Household Size | Family Households | Nonfamily Households |
| 1-Person Households | - | 3,969 (48.0%) |
| 2-Person Households | 1,853 (22.4%) | 322 (3.9%) |
| 3-Person Households | 1,086 (13.1%) | 0 (0.0%) |
| 4-Person Households | 594 (7.2%) | 9 (0.1%) |
| 5-Person Households | 301 (3.6%) | 0 (0.0%) |
| 6-Person Households | 96 (1.2%) | 0 (0.0%) |
| 7+ Person Households | 36 (0.4%) | 0 (0.0%) |
| Total | 3,966 (48.0%) | 4,300 (52.0%) |
Female Fertility in Mckeesport
Fertility by Age in Mckeesport
Average fertility rate in Mckeesport is 50.0 births per 1,000 women. Women in the age bracket of 20 to 34 years have the highest fertility rate with 69.0 births per 1,000 women. Women in the age bracket of 20 to 34 years acount for 72.1% of all women with births.
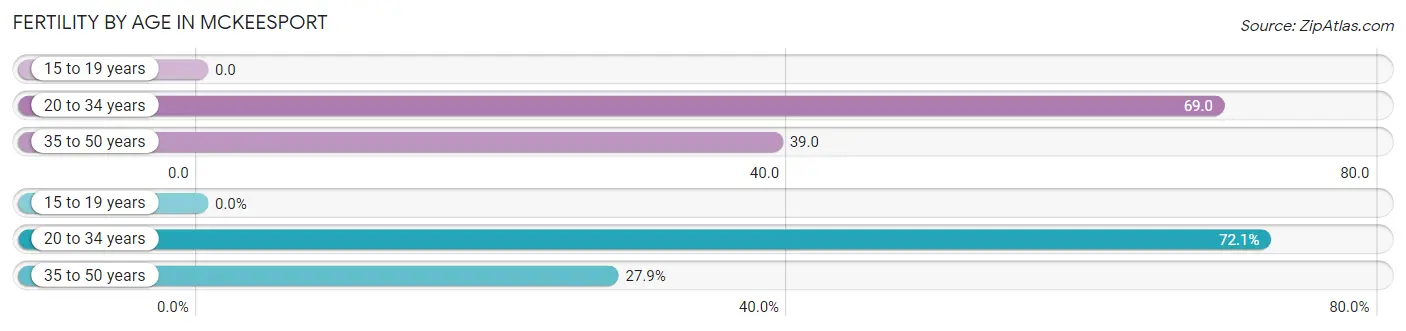
| Age Bracket | Women with Births | Births / 1,000 Women |
| 15 to 19 years | 0 (0.0%) | 0.0 |
| 20 to 34 years | 145 (72.1%) | 69.0 |
| 35 to 50 years | 56 (27.9%) | 39.0 |
| Total | 201 (100.0%) | 50.0 |
Fertility by Age by Marriage Status in Mckeesport
25.9% of women with births (201) in Mckeesport are married. The highest percentage of unmarried women with births falls into 35 to 50 years age bracket with 80.4% of them unmarried at the time of birth, while the lowest percentage of unmarried women with births belong to 20 to 34 years age bracket with 71.7% of them unmarried.
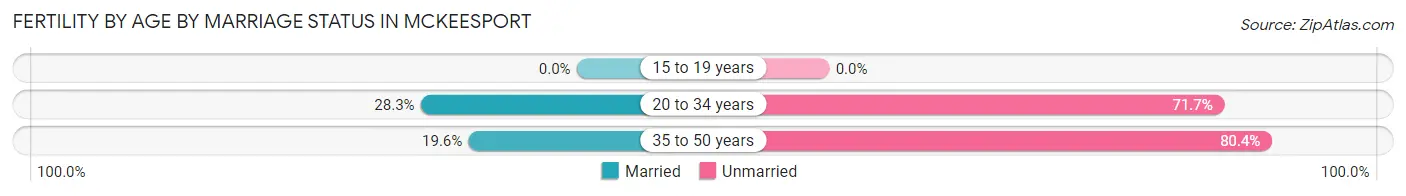
| Age Bracket | Married | Unmarried |
| 15 to 19 years | 0 (0.0%) | 0 (0.0%) |
| 20 to 34 years | 41 (28.3%) | 104 (71.7%) |
| 35 to 50 years | 11 (19.6%) | 45 (80.4%) |
| Total | 52 (25.9%) | 149 (74.1%) |
Fertility by Education in Mckeesport
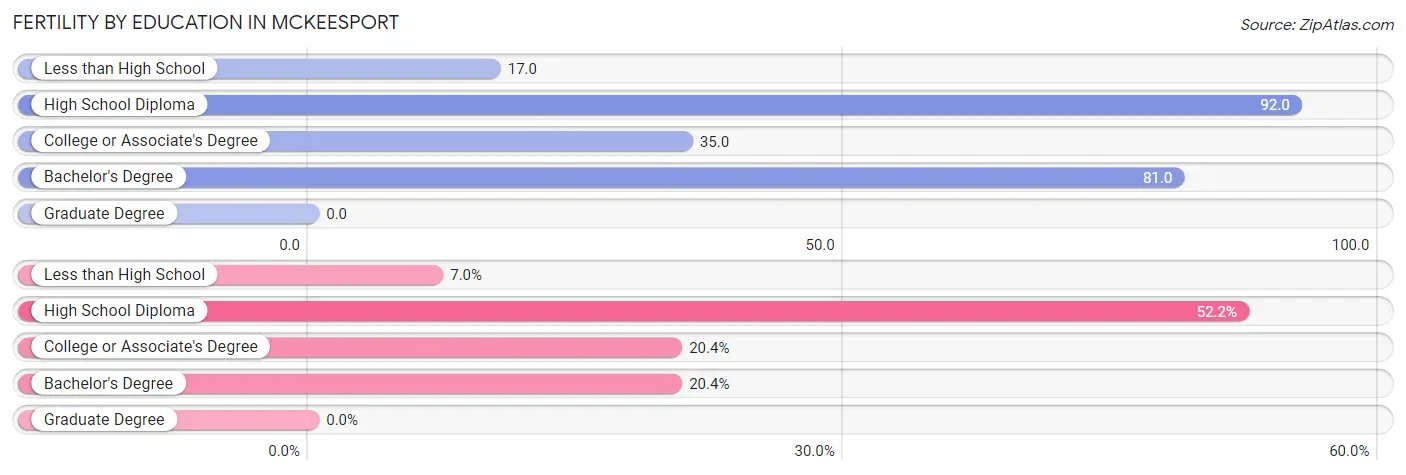
| Educational Attainment | Women with Births | Births / 1,000 Women |
| Less than High School | 14 (7.0%) | 17.0 |
| High School Diploma | 105 (52.2%) | 92.0 |
| College or Associate's Degree | 41 (20.4%) | 35.0 |
| Bachelor's Degree | 41 (20.4%) | 81.0 |
| Graduate Degree | 0 (0.0%) | 0.0 |
| Total | 201 (100.0%) | 50.0 |
Fertility by Education by Marriage Status in Mckeesport
74.1% of women with births in Mckeesport are unmarried. Women with the educational attainment of college or associate's degree are most likely to be married with 100.0% of them married at childbirth, while women with the educational attainment of less than high school are least likely to be married with 100.0% of them unmarried at childbirth.
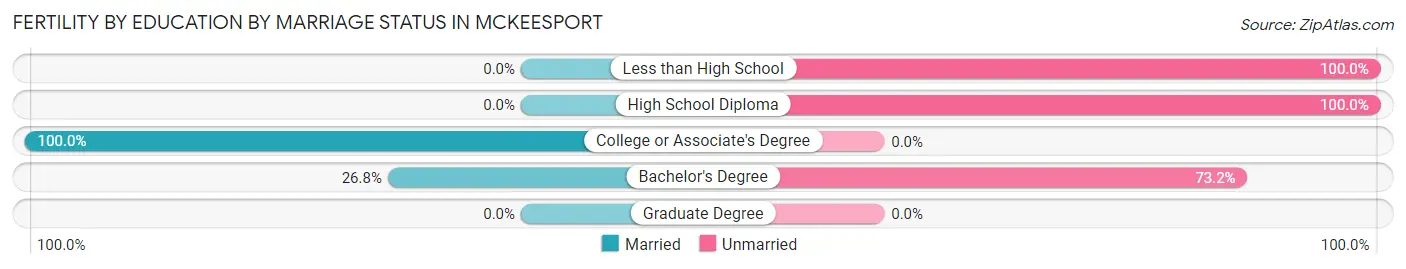
| Educational Attainment | Married | Unmarried |
| Less than High School | 0 (0.0%) | 14 (100.0%) |
| High School Diploma | 0 (0.0%) | 105 (100.0%) |
| College or Associate's Degree | 41 (100.0%) | 0 (0.0%) |
| Bachelor's Degree | 11 (26.8%) | 30 (73.2%) |
| Graduate Degree | 0 (0.0%) | 0 (0.0%) |
| Total | 52 (25.9%) | 149 (74.1%) |
Employment Characteristics in Mckeesport
Employment by Class of Employer in Mckeesport
Among the 6,537 employed individuals in Mckeesport, private company employees (4,239 | 64.8%), not-for-profit organizations (1,132 | 17.3%), and local government employees (372 | 5.7%) make up the most common classes of employment.
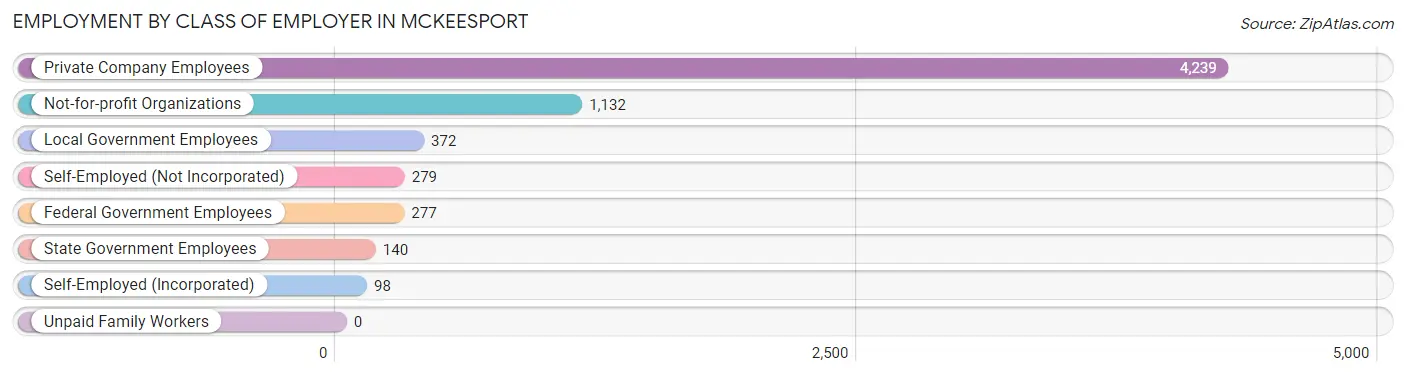
| Employer Class | # Employees | % Employees |
| Private Company Employees | 4,239 | 64.8% |
| Self-Employed (Incorporated) | 98 | 1.5% |
| Self-Employed (Not Incorporated) | 279 | 4.3% |
| Not-for-profit Organizations | 1,132 | 17.3% |
| Local Government Employees | 372 | 5.7% |
| State Government Employees | 140 | 2.1% |
| Federal Government Employees | 277 | 4.2% |
| Unpaid Family Workers | 0 | 0.0% |
| Total | 6,537 | 100.0% |
Employment Status by Age in Mckeesport
According to the labor force statistics for Mckeesport, out of the total population over 16 years of age (14,258), 52.5% or 7,485 individuals are in the labor force, with 7.8% or 584 of them unemployed. The age group with the highest labor force participation rate is 35 to 44 years, with 80.0% or 1,411 individuals in the labor force. Within the labor force, the 20 to 24 years age range has the highest percentage of unemployed individuals, with 17.5% or 88 of them being unemployed.
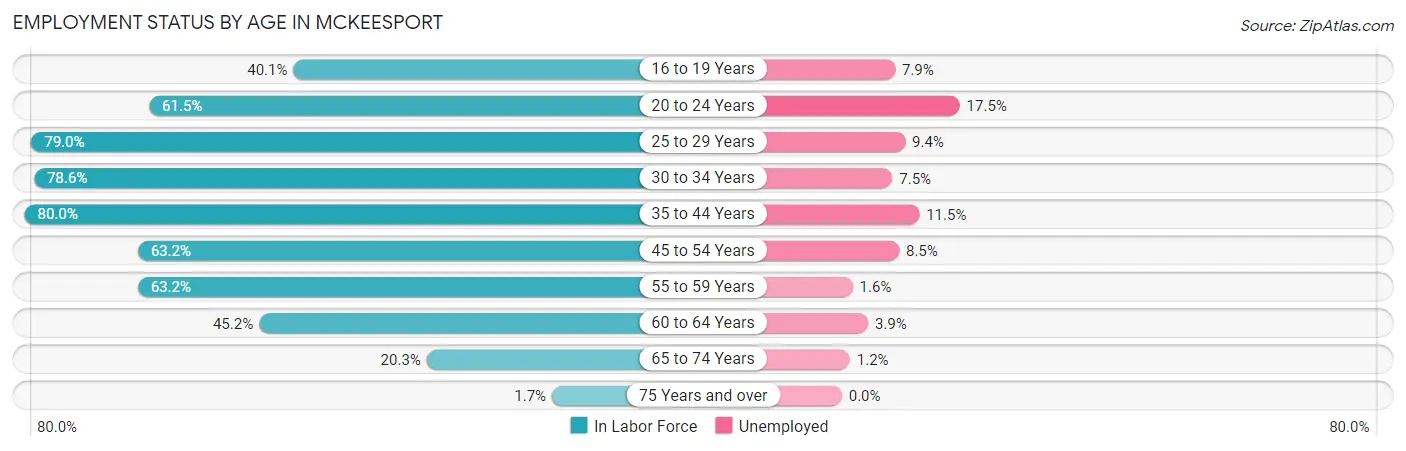
| Age Bracket | In Labor Force | Unemployed |
| 16 to 19 Years | 240 (40.1%) | 19 (7.9%) |
| 20 to 24 Years | 503 (61.5%) | 88 (17.5%) |
| 25 to 29 Years | 830 (79.0%) | 78 (9.4%) |
| 30 to 34 Years | 1,225 (78.6%) | 92 (7.5%) |
| 35 to 44 Years | 1,411 (80.0%) | 162 (11.5%) |
| 45 to 54 Years | 1,230 (63.2%) | 105 (8.5%) |
| 55 to 59 Years | 1,019 (63.2%) | 16 (1.6%) |
| 60 to 64 Years | 563 (45.2%) | 22 (3.9%) |
| 65 to 74 Years | 431 (20.3%) | 5 (1.2%) |
| 75 Years and over | 26 (1.7%) | 0 (0.0%) |
| Total | 7,485 (52.5%) | 584 (7.8%) |
Employment Status by Educational Attainment in Mckeesport
According to labor force statistics for Mckeesport, 68.4% of individuals (6,278) out of the total population between 25 and 64 years of age (9,178) are in the labor force, with 7.6% or 477 of them being unemployed. The group with the highest labor force participation rate are those with the educational attainment of bachelor's degree or higher, with 84.8% or 1,124 individuals in the labor force. Within the labor force, individuals with college / associate degree education have the highest percentage of unemployment, with 9.4% or 222 of them being unemployed.
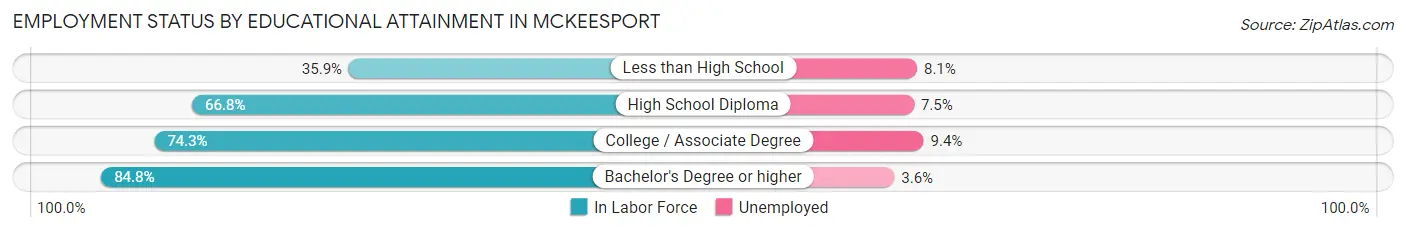
| Educational Attainment | In Labor Force | Unemployed |
| Less than High School | 385 (35.9%) | 87 (8.1%) |
| High School Diploma | 2,402 (66.8%) | 270 (7.5%) |
| College / Associate Degree | 2,366 (74.3%) | 299 (9.4%) |
| Bachelor's Degree or higher | 1,124 (84.8%) | 48 (3.6%) |
| Total | 6,278 (68.4%) | 698 (7.6%) |
Employment Occupations by Sex in Mckeesport
Management, Business, Science and Arts Occupations
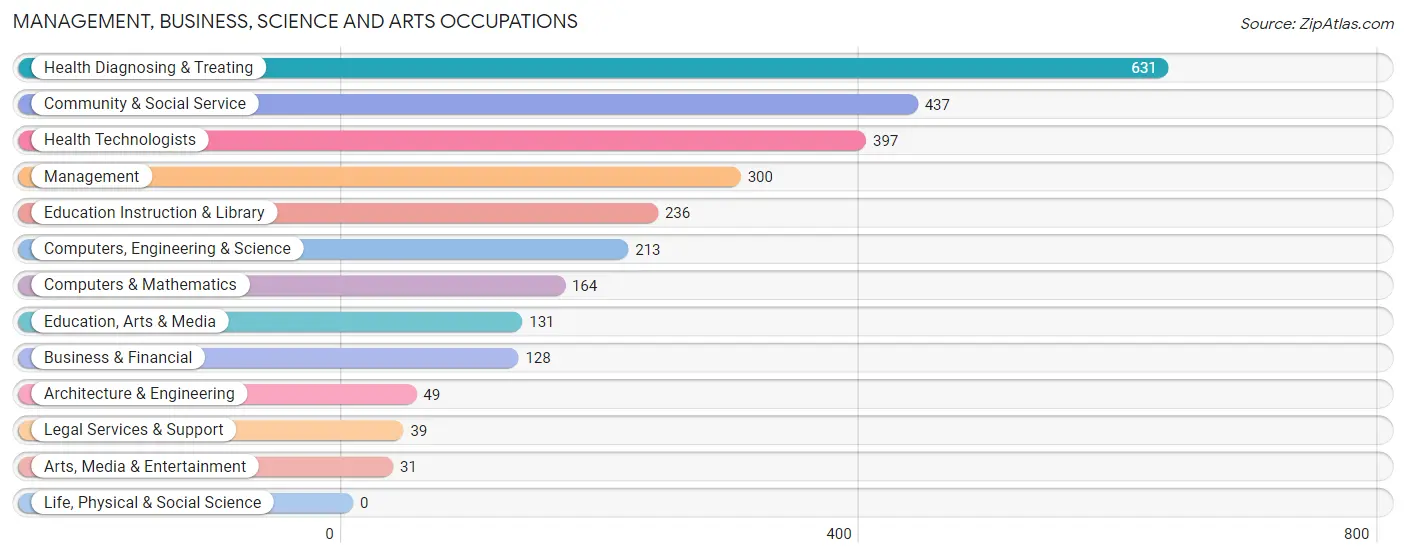
The most common Management, Business, Science and Arts occupations in Mckeesport are Health Diagnosing & Treating (631 | 9.2%), Community & Social Service (437 | 6.4%), Health Technologists (397 | 5.8%), Management (300 | 4.4%), and Education Instruction & Library (236 | 3.4%).
Management, Business, Science and Arts Occupations by Sex
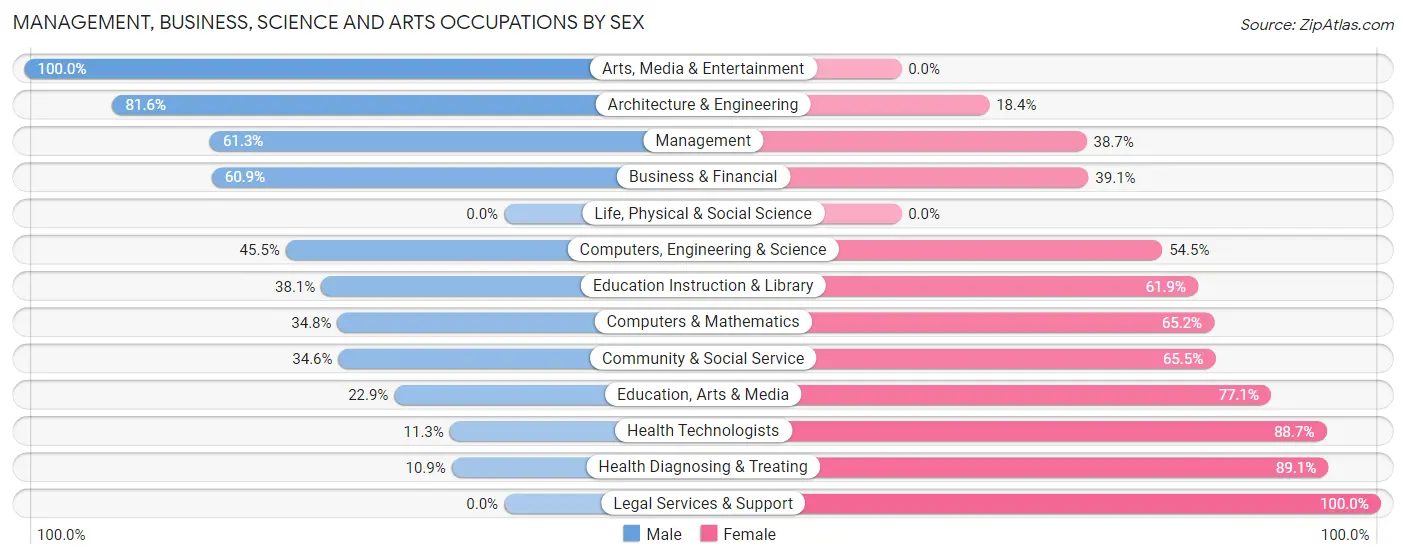
Within the Management, Business, Science and Arts occupations in Mckeesport, the most male-oriented occupations are Arts, Media & Entertainment (100.0%), Architecture & Engineering (81.6%), and Management (61.3%), while the most female-oriented occupations are Legal Services & Support (100.0%), Health Diagnosing & Treating (89.1%), and Health Technologists (88.7%).
| Occupation | Male | Female |
| Management | 184 (61.3%) | 116 (38.7%) |
| Business & Financial | 78 (60.9%) | 50 (39.1%) |
| Computers, Engineering & Science | 97 (45.5%) | 116 (54.5%) |
| Computers & Mathematics | 57 (34.8%) | 107 (65.2%) |
| Architecture & Engineering | 40 (81.6%) | 9 (18.4%) |
| Life, Physical & Social Science | 0 (0.0%) | 0 (0.0%) |
| Community & Social Service | 151 (34.5%) | 286 (65.4%) |
| Education, Arts & Media | 30 (22.9%) | 101 (77.1%) |
| Legal Services & Support | 0 (0.0%) | 39 (100.0%) |
| Education Instruction & Library | 90 (38.1%) | 146 (61.9%) |
| Arts, Media & Entertainment | 31 (100.0%) | 0 (0.0%) |
| Health Diagnosing & Treating | 69 (10.9%) | 562 (89.1%) |
| Health Technologists | 45 (11.3%) | 352 (88.7%) |
| Total (Category) | 579 (33.9%) | 1,130 (66.1%) |
| Total (Overall) | 2,924 (42.6%) | 3,937 (57.4%) |
Services Occupations
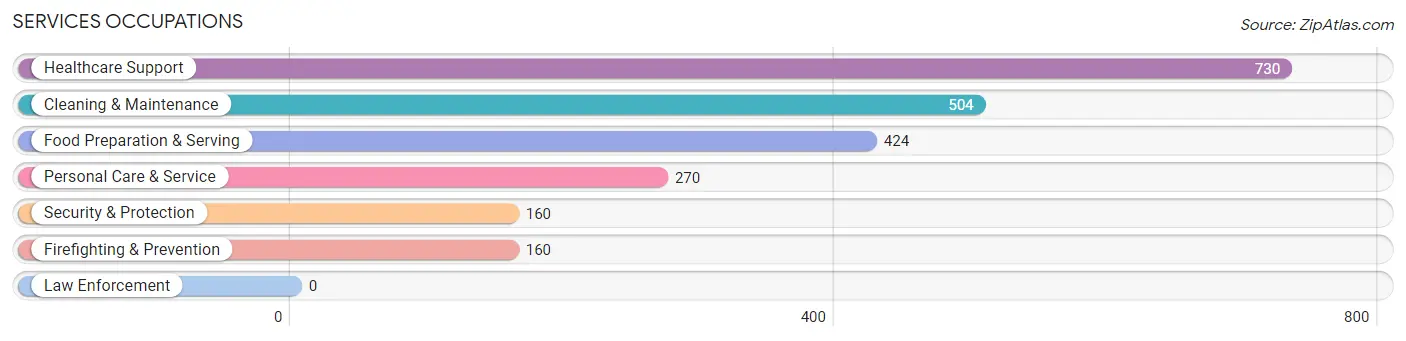
The most common Services occupations in Mckeesport are Healthcare Support (730 | 10.6%), Cleaning & Maintenance (504 | 7.3%), Food Preparation & Serving (424 | 6.2%), Personal Care & Service (270 | 3.9%), and Security & Protection (160 | 2.3%).
Services Occupations by Sex
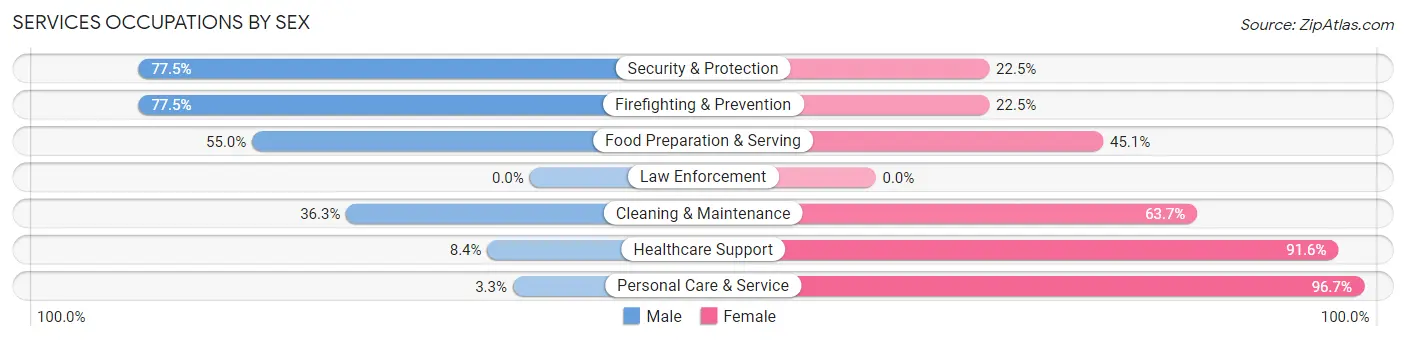
Within the Services occupations in Mckeesport, the most male-oriented occupations are Security & Protection (77.5%), Firefighting & Prevention (77.5%), and Food Preparation & Serving (54.9%), while the most female-oriented occupations are Personal Care & Service (96.7%), Healthcare Support (91.6%), and Cleaning & Maintenance (63.7%).
| Occupation | Male | Female |
| Healthcare Support | 61 (8.4%) | 669 (91.6%) |
| Security & Protection | 124 (77.5%) | 36 (22.5%) |
| Firefighting & Prevention | 124 (77.5%) | 36 (22.5%) |
| Law Enforcement | 0 (0.0%) | 0 (0.0%) |
| Food Preparation & Serving | 233 (54.9%) | 191 (45.1%) |
| Cleaning & Maintenance | 183 (36.3%) | 321 (63.7%) |
| Personal Care & Service | 9 (3.3%) | 261 (96.7%) |
| Total (Category) | 610 (29.2%) | 1,478 (70.8%) |
| Total (Overall) | 2,924 (42.6%) | 3,937 (57.4%) |
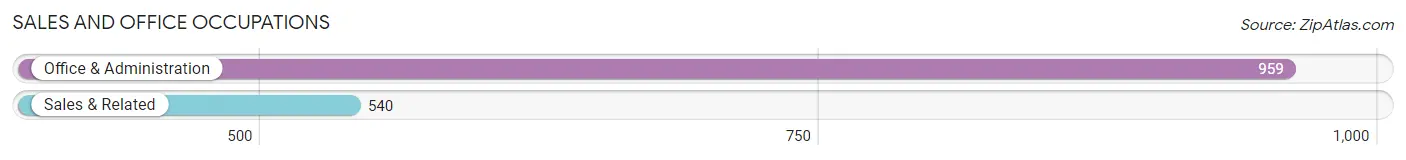
Sales and Office Occupations
The most common Sales and Office occupations in Mckeesport are Office & Administration (959 | 14.0%), and Sales & Related (540 | 7.9%).
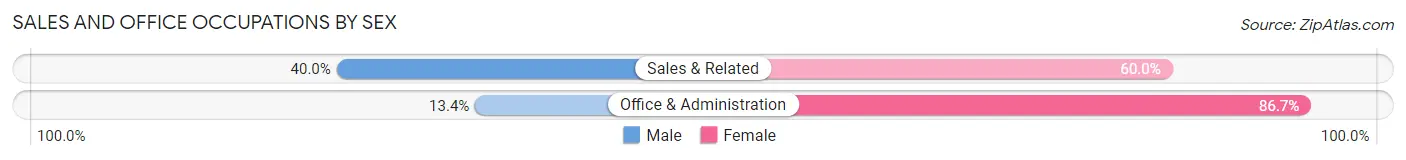
Sales and Office Occupations by Sex
| Occupation | Male | Female |
| Sales & Related | 216 (40.0%) | 324 (60.0%) |
| Office & Administration | 128 (13.4%) | 831 (86.7%) |
| Total (Category) | 344 (23.0%) | 1,155 (77.0%) |
| Total (Overall) | 2,924 (42.6%) | 3,937 (57.4%) |
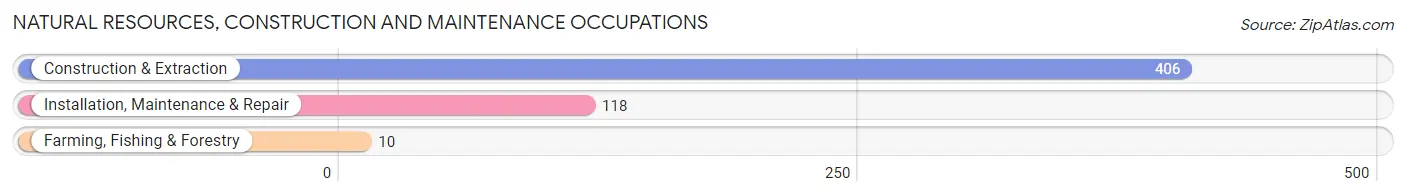
Natural Resources, Construction and Maintenance Occupations
The most common Natural Resources, Construction and Maintenance occupations in Mckeesport are Construction & Extraction (406 | 5.9%), Installation, Maintenance & Repair (118 | 1.7%), and Farming, Fishing & Forestry (10 | 0.2%).
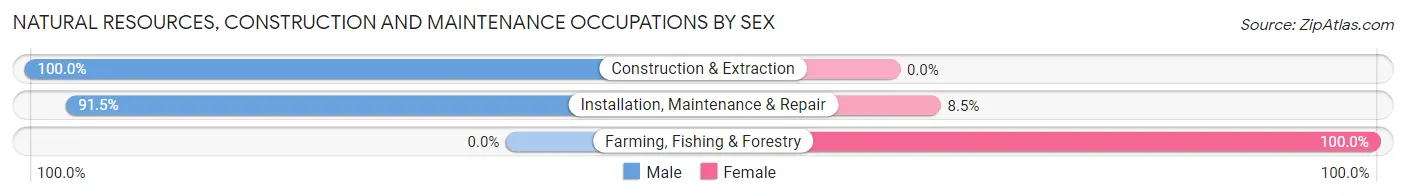
Natural Resources, Construction and Maintenance Occupations by Sex
| Occupation | Male | Female |
| Farming, Fishing & Forestry | 0 (0.0%) | 10 (100.0%) |
| Construction & Extraction | 406 (100.0%) | 0 (0.0%) |
| Installation, Maintenance & Repair | 108 (91.5%) | 10 (8.5%) |
| Total (Category) | 514 (96.3%) | 20 (3.7%) |
| Total (Overall) | 2,924 (42.6%) | 3,937 (57.4%) |
Production, Transportation and Moving Occupations
The most common Production, Transportation and Moving occupations in Mckeesport are Material Moving (400 | 5.8%), Production (354 | 5.2%), and Transportation (277 | 4.0%).
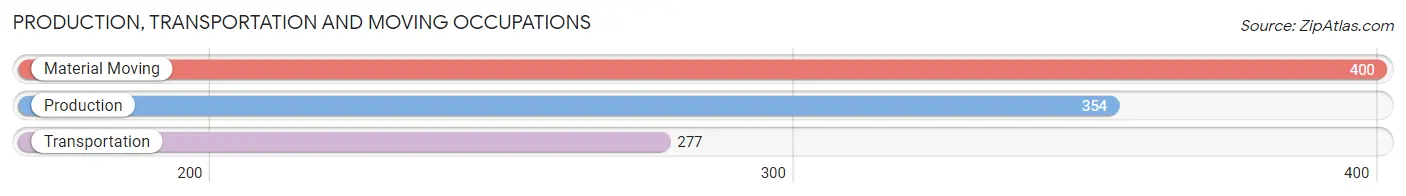
Production, Transportation and Moving Occupations by Sex
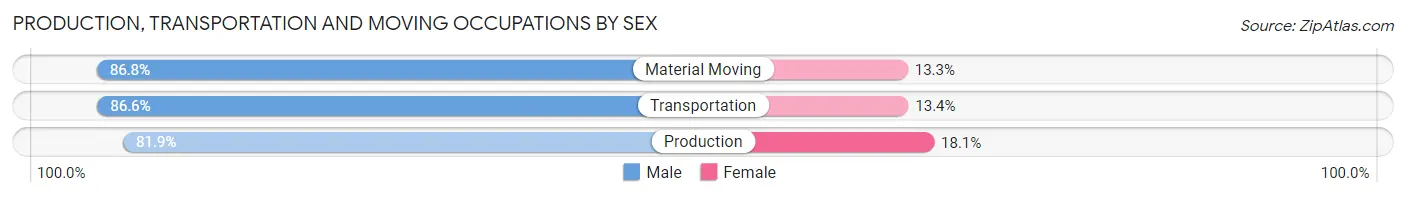
| Occupation | Male | Female |
| Production | 290 (81.9%) | 64 (18.1%) |
| Transportation | 240 (86.6%) | 37 (13.4%) |
| Material Moving | 347 (86.8%) | 53 (13.3%) |
| Total (Category) | 877 (85.1%) | 154 (14.9%) |
| Total (Overall) | 2,924 (42.6%) | 3,937 (57.4%) |
Employment Industries by Sex in Mckeesport
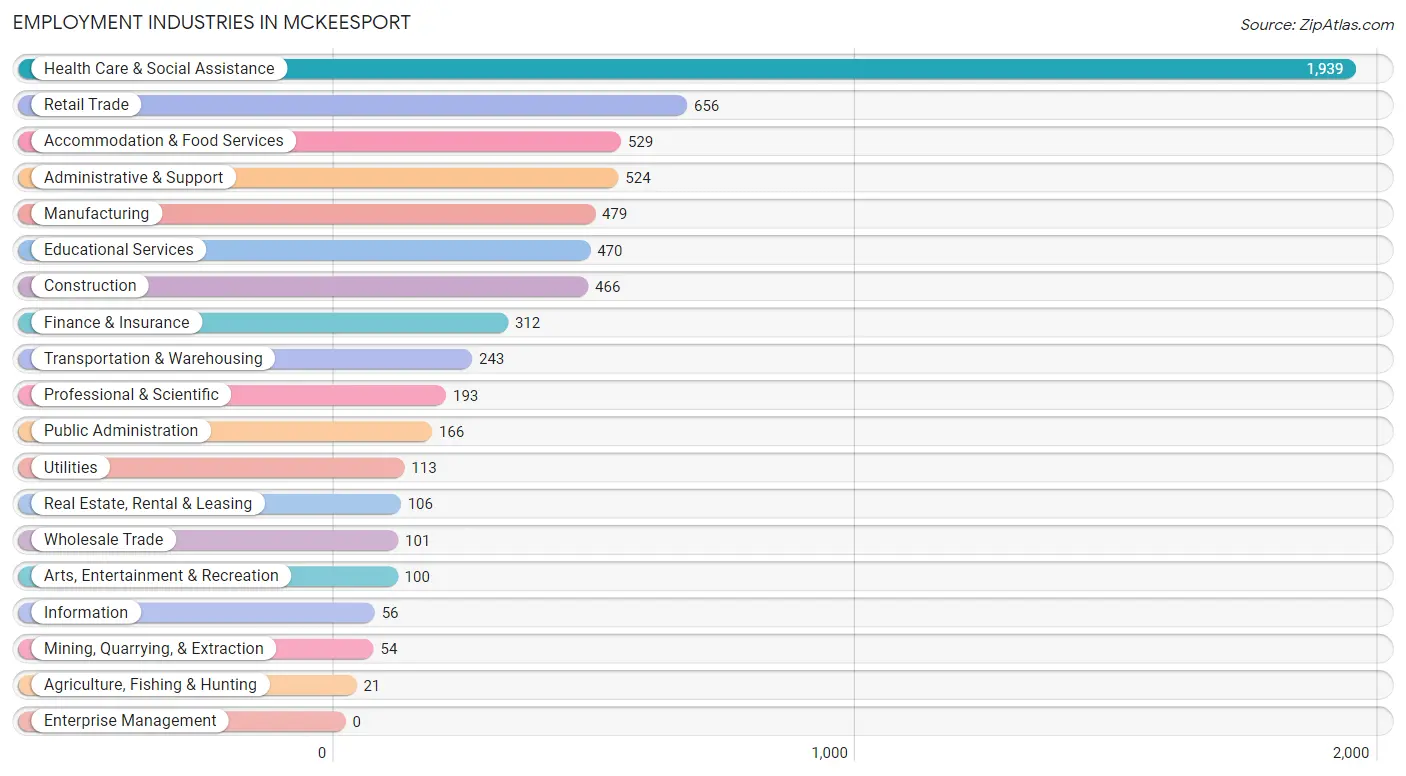
Employment Industries in Mckeesport
The major employment industries in Mckeesport include Health Care & Social Assistance (1,939 | 28.3%), Retail Trade (656 | 9.6%), Accommodation & Food Services (529 | 7.7%), Administrative & Support (524 | 7.6%), and Manufacturing (479 | 7.0%).
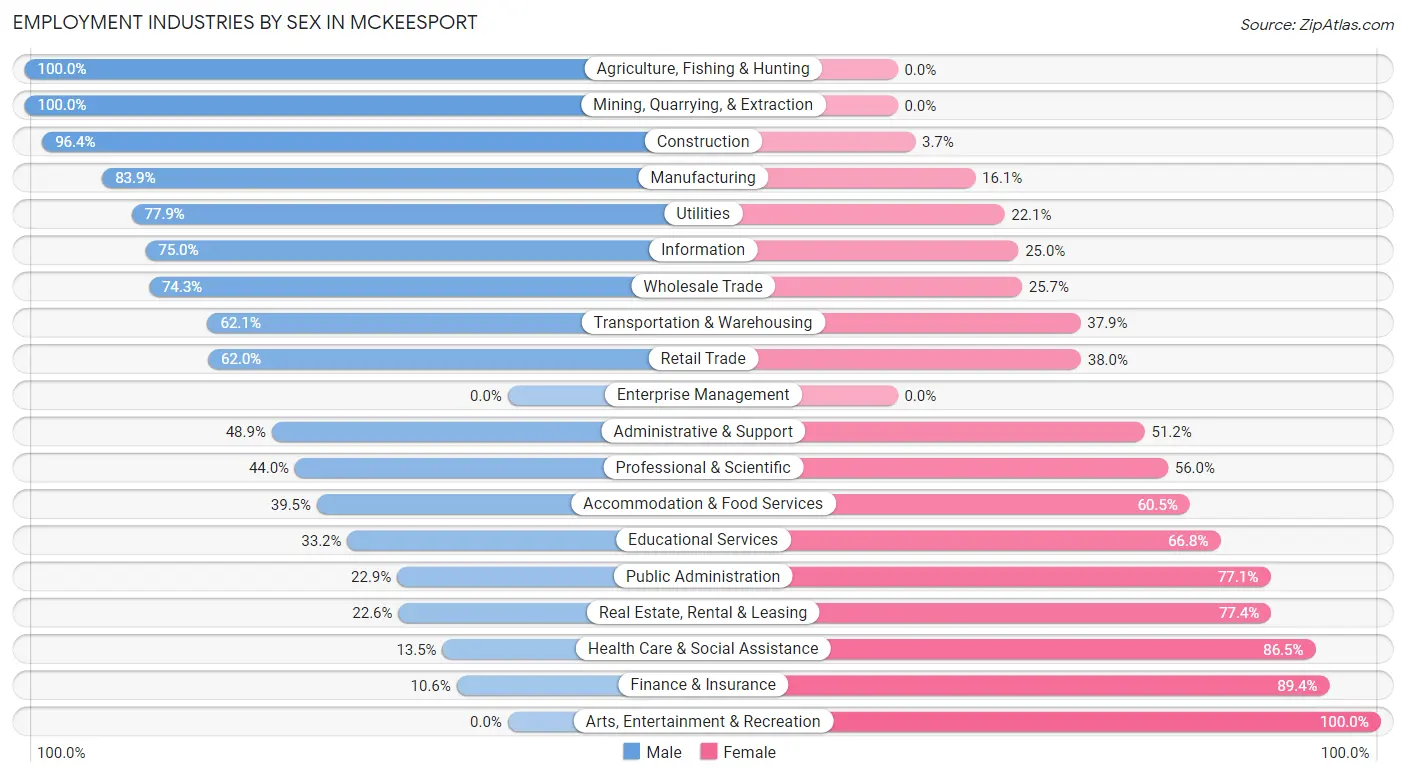
Employment Industries by Sex in Mckeesport
The Mckeesport industries that see more men than women are Agriculture, Fishing & Hunting (100.0%), Mining, Quarrying, & Extraction (100.0%), and Construction (96.4%), whereas the industries that tend to have a higher number of women are Arts, Entertainment & Recreation (100.0%), Finance & Insurance (89.4%), and Health Care & Social Assistance (86.5%).
| Industry | Male | Female |
| Agriculture, Fishing & Hunting | 21 (100.0%) | 0 (0.0%) |
| Mining, Quarrying, & Extraction | 54 (100.0%) | 0 (0.0%) |
| Construction | 449 (96.4%) | 17 (3.6%) |
| Manufacturing | 402 (83.9%) | 77 (16.1%) |
| Wholesale Trade | 75 (74.3%) | 26 (25.7%) |
| Retail Trade | 407 (62.0%) | 249 (38.0%) |
| Transportation & Warehousing | 151 (62.1%) | 92 (37.9%) |
| Utilities | 88 (77.9%) | 25 (22.1%) |
| Information | 42 (75.0%) | 14 (25.0%) |
| Finance & Insurance | 33 (10.6%) | 279 (89.4%) |
| Real Estate, Rental & Leasing | 24 (22.6%) | 82 (77.4%) |
| Professional & Scientific | 85 (44.0%) | 108 (56.0%) |
| Enterprise Management | 0 (0.0%) | 0 (0.0%) |
| Administrative & Support | 256 (48.8%) | 268 (51.1%) |
| Educational Services | 156 (33.2%) | 314 (66.8%) |
| Health Care & Social Assistance | 262 (13.5%) | 1,677 (86.5%) |
| Arts, Entertainment & Recreation | 0 (0.0%) | 100 (100.0%) |
| Accommodation & Food Services | 209 (39.5%) | 320 (60.5%) |
| Public Administration | 38 (22.9%) | 128 (77.1%) |
| Total | 2,924 (42.6%) | 3,937 (57.4%) |
Education in Mckeesport
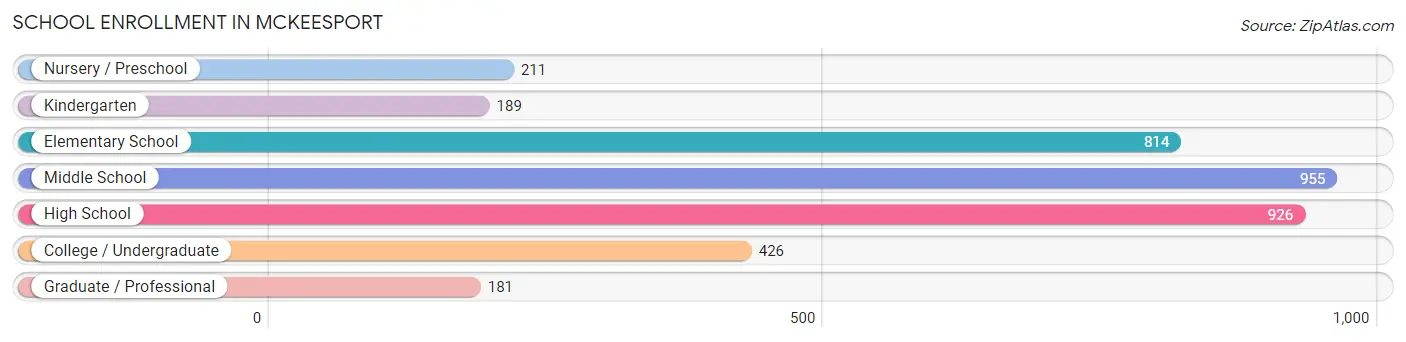
School Enrollment in Mckeesport
The most common levels of schooling among the 3,702 students in Mckeesport are middle school (955 | 25.8%), high school (926 | 25.0%), and elementary school (814 | 22.0%).
| School Level | # Students | % Students |
| Nursery / Preschool | 211 | 5.7% |
| Kindergarten | 189 | 5.1% |
| Elementary School | 814 | 22.0% |
| Middle School | 955 | 25.8% |
| High School | 926 | 25.0% |
| College / Undergraduate | 426 | 11.5% |
| Graduate / Professional | 181 | 4.9% |
| Total | 3,702 | 100.0% |
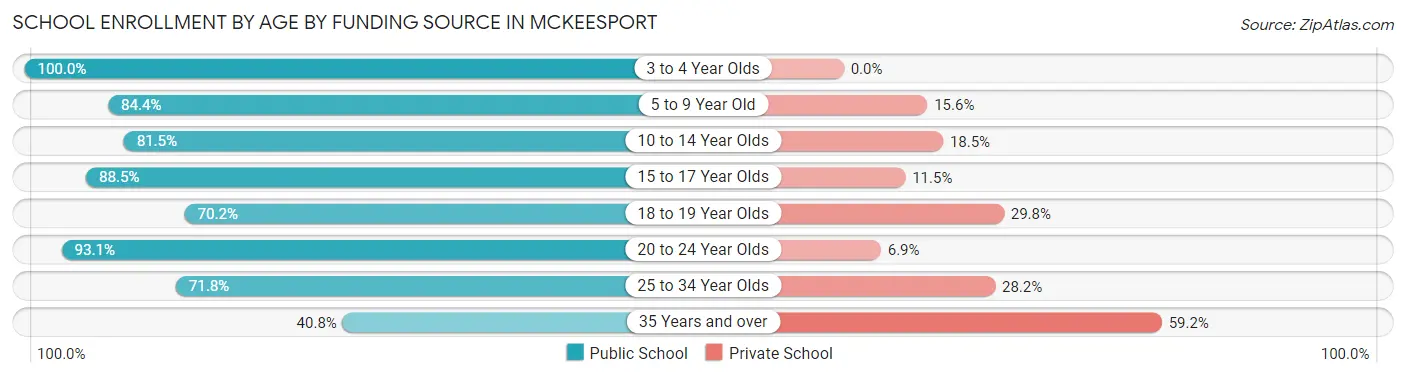
School Enrollment by Age by Funding Source in Mckeesport
Out of a total of 3,702 students who are enrolled in schools in Mckeesport, 666 (18.0%) attend a private institution, while the remaining 3,036 (82.0%) are enrolled in public schools. The age group of 35 years and over has the highest likelihood of being enrolled in private schools, with 93 (59.2% in the age bracket) enrolled. Conversely, the age group of 3 to 4 year olds has the lowest likelihood of being enrolled in a private school, with 112 (100.0% in the age bracket) attending a public institution.
| Age Bracket | Public School | Private School |
| 3 to 4 Year Olds | 112 (100.0%) | 0 (0.0%) |
| 5 to 9 Year Old | 862 (84.4%) | 159 (15.6%) |
| 10 to 14 Year Olds | 952 (81.5%) | 216 (18.5%) |
| 15 to 17 Year Olds | 579 (88.5%) | 75 (11.5%) |
| 18 to 19 Year Olds | 80 (70.2%) | 34 (29.8%) |
| 20 to 24 Year Olds | 202 (93.1%) | 15 (6.9%) |
| 25 to 34 Year Olds | 186 (71.8%) | 73 (28.2%) |
| 35 Years and over | 64 (40.8%) | 93 (59.2%) |
| Total | 3,036 (82.0%) | 666 (18.0%) |
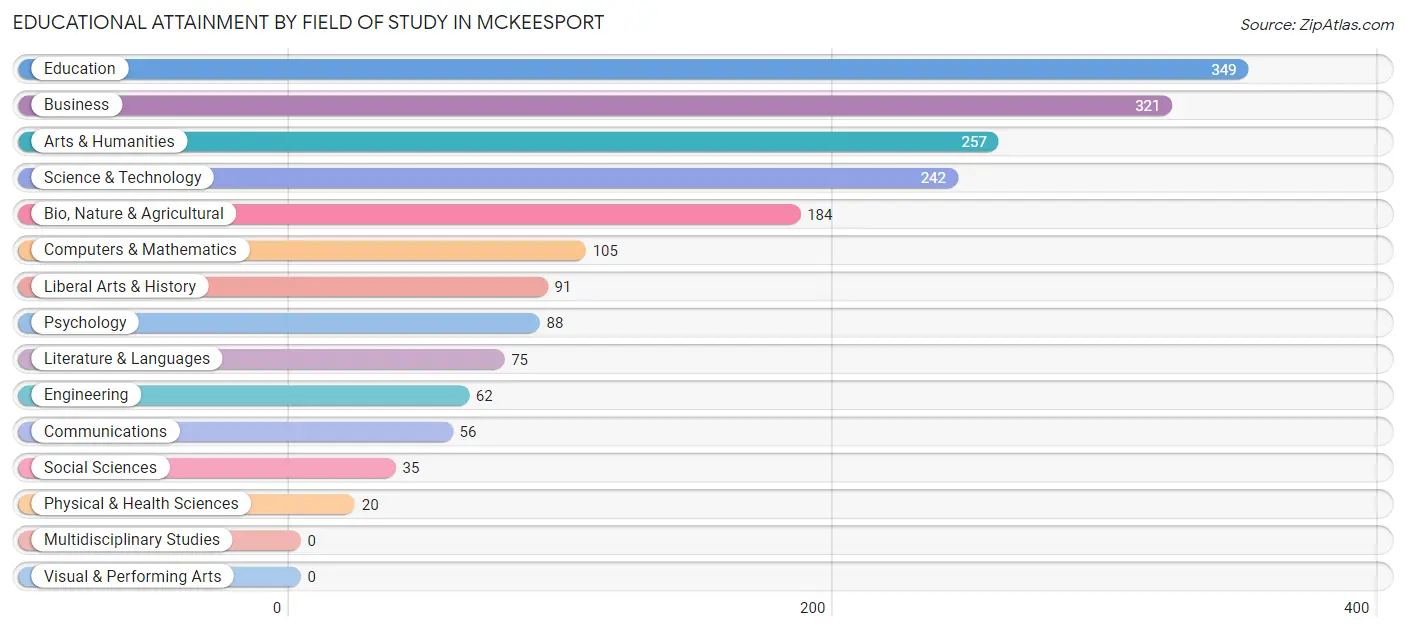
Educational Attainment by Field of Study in Mckeesport
Education (349 | 18.5%), business (321 | 17.0%), arts & humanities (257 | 13.6%), science & technology (242 | 12.8%), and bio, nature & agricultural (184 | 9.8%) are the most common fields of study among 1,885 individuals in Mckeesport who have obtained a bachelor's degree or higher.
| Field of Study | # Graduates | % Graduates |
| Computers & Mathematics | 105 | 5.6% |
| Bio, Nature & Agricultural | 184 | 9.8% |
| Physical & Health Sciences | 20 | 1.1% |
| Psychology | 88 | 4.7% |
| Social Sciences | 35 | 1.9% |
| Engineering | 62 | 3.3% |
| Multidisciplinary Studies | 0 | 0.0% |
| Science & Technology | 242 | 12.8% |
| Business | 321 | 17.0% |
| Education | 349 | 18.5% |
| Literature & Languages | 75 | 4.0% |
| Liberal Arts & History | 91 | 4.8% |
| Visual & Performing Arts | 0 | 0.0% |
| Communications | 56 | 3.0% |
| Arts & Humanities | 257 | 13.6% |
| Total | 1,885 | 100.0% |
Transportation & Commute in Mckeesport
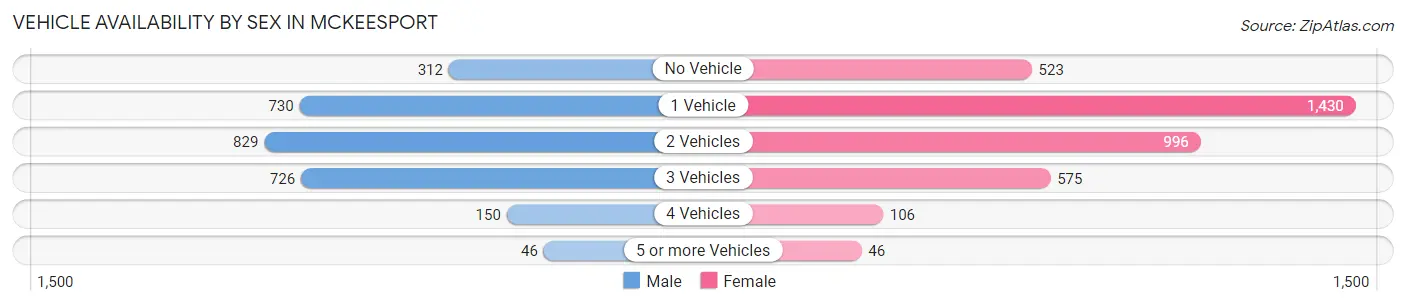
Vehicle Availability by Sex in Mckeesport
The most prevalent vehicle ownership categories in Mckeesport are males with 2 vehicles (829, accounting for 29.7%) and females with 2 vehicles (996, making up 22.6%).
| Vehicles Available | Male | Female |
| No Vehicle | 312 (11.2%) | 523 (14.2%) |
| 1 Vehicle | 730 (26.1%) | 1,430 (38.9%) |
| 2 Vehicles | 829 (29.7%) | 996 (27.1%) |
| 3 Vehicles | 726 (26.0%) | 575 (15.6%) |
| 4 Vehicles | 150 (5.4%) | 106 (2.9%) |
| 5 or more Vehicles | 46 (1.7%) | 46 (1.3%) |
| Total | 2,793 (100.0%) | 3,676 (100.0%) |
Commute Time in Mckeesport
The most frequently occuring commute durations in Mckeesport are 30 to 34 minutes (875 commuters, 14.5%), 10 to 14 minutes (774 commuters, 12.8%), and 45 to 59 minutes (772 commuters, 12.8%).
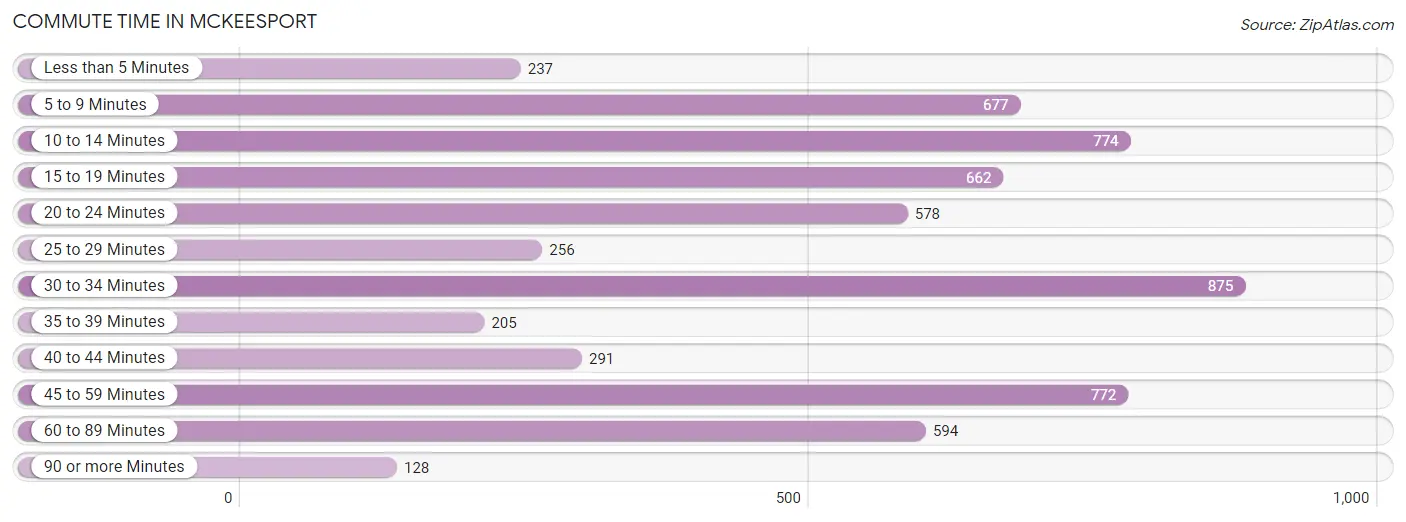
| Commute Time | # Commuters | % Commuters |
| Less than 5 Minutes | 237 | 3.9% |
| 5 to 9 Minutes | 677 | 11.2% |
| 10 to 14 Minutes | 774 | 12.8% |
| 15 to 19 Minutes | 662 | 10.9% |
| 20 to 24 Minutes | 578 | 9.6% |
| 25 to 29 Minutes | 256 | 4.2% |
| 30 to 34 Minutes | 875 | 14.5% |
| 35 to 39 Minutes | 205 | 3.4% |
| 40 to 44 Minutes | 291 | 4.8% |
| 45 to 59 Minutes | 772 | 12.8% |
| 60 to 89 Minutes | 594 | 9.8% |
| 90 or more Minutes | 128 | 2.1% |
Commute Time by Sex in Mckeesport
The most common commute times in Mckeesport are 45 to 59 minutes (397 commuters, 15.2%) for males and 30 to 34 minutes (505 commuters, 14.7%) for females.
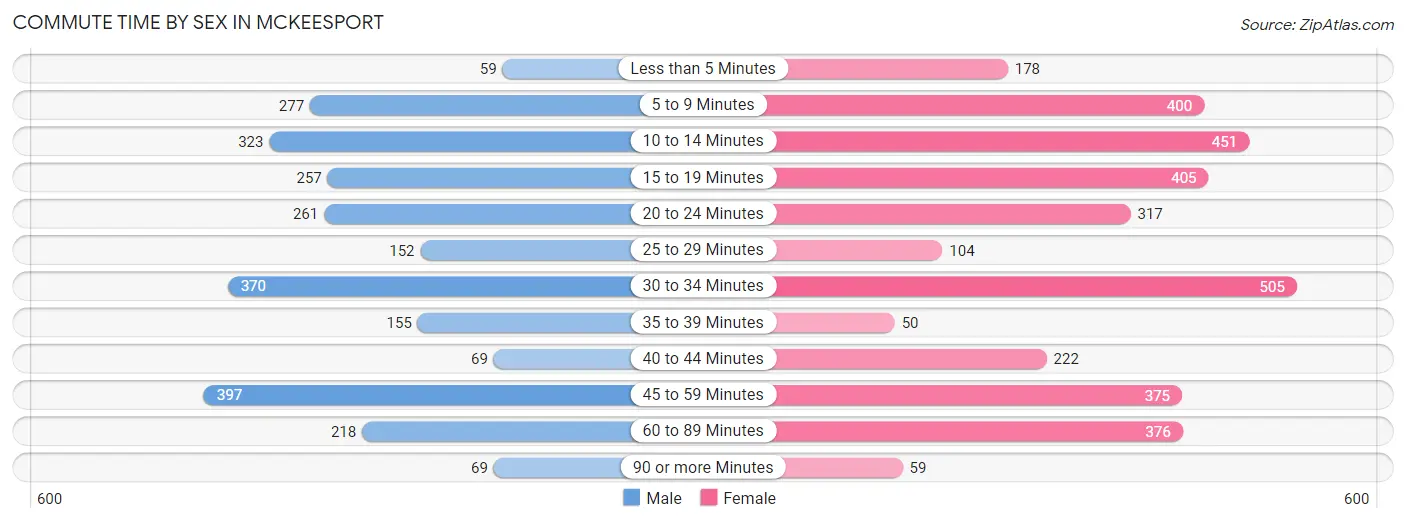
| Commute Time | Male | Female |
| Less than 5 Minutes | 59 (2.3%) | 178 (5.2%) |
| 5 to 9 Minutes | 277 (10.6%) | 400 (11.6%) |
| 10 to 14 Minutes | 323 (12.4%) | 451 (13.1%) |
| 15 to 19 Minutes | 257 (9.9%) | 405 (11.8%) |
| 20 to 24 Minutes | 261 (10.0%) | 317 (9.2%) |
| 25 to 29 Minutes | 152 (5.8%) | 104 (3.0%) |
| 30 to 34 Minutes | 370 (14.2%) | 505 (14.7%) |
| 35 to 39 Minutes | 155 (5.9%) | 50 (1.5%) |
| 40 to 44 Minutes | 69 (2.6%) | 222 (6.5%) |
| 45 to 59 Minutes | 397 (15.2%) | 375 (10.9%) |
| 60 to 89 Minutes | 218 (8.4%) | 376 (10.9%) |
| 90 or more Minutes | 69 (2.6%) | 59 (1.7%) |
Time of Departure to Work by Sex in Mckeesport
The most frequent times of departure to work in Mckeesport are 6:00 AM to 6:29 AM (439, 16.8%) for males and 12:00 PM to 3:59 PM (671, 19.5%) for females.
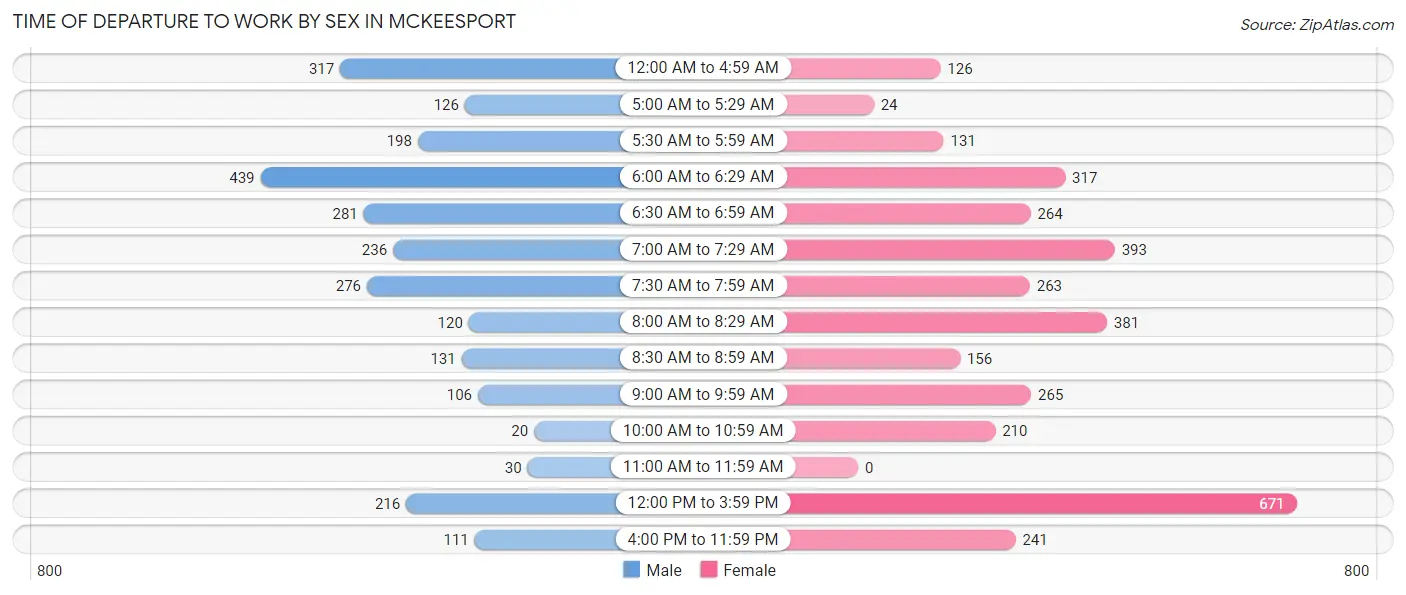
| Time of Departure | Male | Female |
| 12:00 AM to 4:59 AM | 317 (12.2%) | 126 (3.7%) |
| 5:00 AM to 5:29 AM | 126 (4.8%) | 24 (0.7%) |
| 5:30 AM to 5:59 AM | 198 (7.6%) | 131 (3.8%) |
| 6:00 AM to 6:29 AM | 439 (16.8%) | 317 (9.2%) |
| 6:30 AM to 6:59 AM | 281 (10.8%) | 264 (7.7%) |
| 7:00 AM to 7:29 AM | 236 (9.0%) | 393 (11.4%) |
| 7:30 AM to 7:59 AM | 276 (10.6%) | 263 (7.6%) |
| 8:00 AM to 8:29 AM | 120 (4.6%) | 381 (11.1%) |
| 8:30 AM to 8:59 AM | 131 (5.0%) | 156 (4.5%) |
| 9:00 AM to 9:59 AM | 106 (4.1%) | 265 (7.7%) |
| 10:00 AM to 10:59 AM | 20 (0.8%) | 210 (6.1%) |
| 11:00 AM to 11:59 AM | 30 (1.1%) | 0 (0.0%) |
| 12:00 PM to 3:59 PM | 216 (8.3%) | 671 (19.5%) |
| 4:00 PM to 11:59 PM | 111 (4.3%) | 241 (7.0%) |
| Total | 2,607 (100.0%) | 3,442 (100.0%) |
Housing Occupancy in Mckeesport
Occupancy by Ownership in Mckeesport
Of the total 8,266 dwellings in Mckeesport, owner-occupied units account for 4,116 (49.8%), while renter-occupied units make up 4,150 (50.2%).
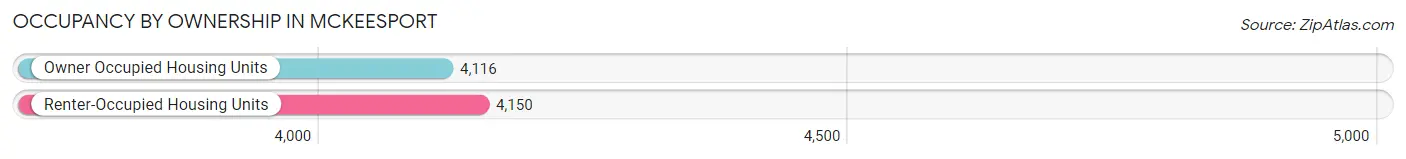
| Occupancy | # Housing Units | % Housing Units |
| Owner Occupied Housing Units | 4,116 | 49.8% |
| Renter-Occupied Housing Units | 4,150 | 50.2% |
| Total Occupied Housing Units | 8,266 | 100.0% |
Occupancy by Household Size in Mckeesport
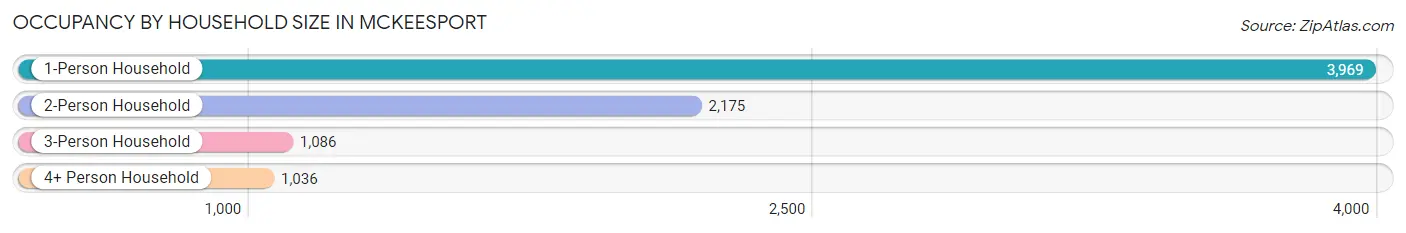
| Household Size | # Housing Units | % Housing Units |
| 1-Person Household | 3,969 | 48.0% |
| 2-Person Household | 2,175 | 26.3% |
| 3-Person Household | 1,086 | 13.1% |
| 4+ Person Household | 1,036 | 12.5% |
| Total Housing Units | 8,266 | 100.0% |
Occupancy by Ownership by Household Size in Mckeesport
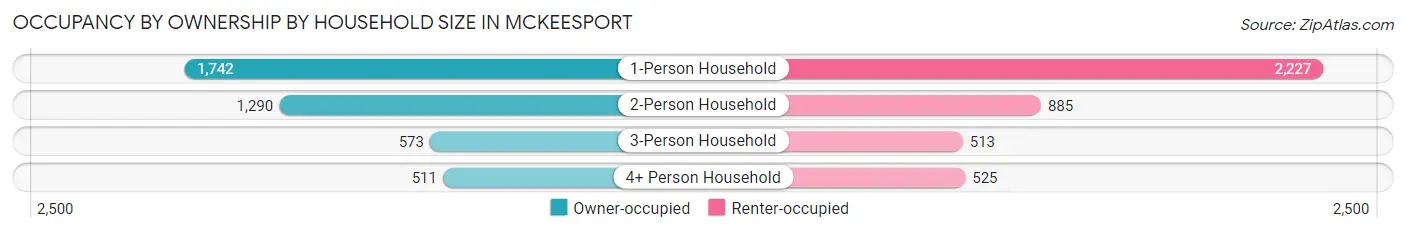
| Household Size | Owner-occupied | Renter-occupied |
| 1-Person Household | 1,742 (43.9%) | 2,227 (56.1%) |
| 2-Person Household | 1,290 (59.3%) | 885 (40.7%) |
| 3-Person Household | 573 (52.8%) | 513 (47.2%) |
| 4+ Person Household | 511 (49.3%) | 525 (50.7%) |
| Total Housing Units | 4,116 (49.8%) | 4,150 (50.2%) |
Occupancy by Educational Attainment in Mckeesport
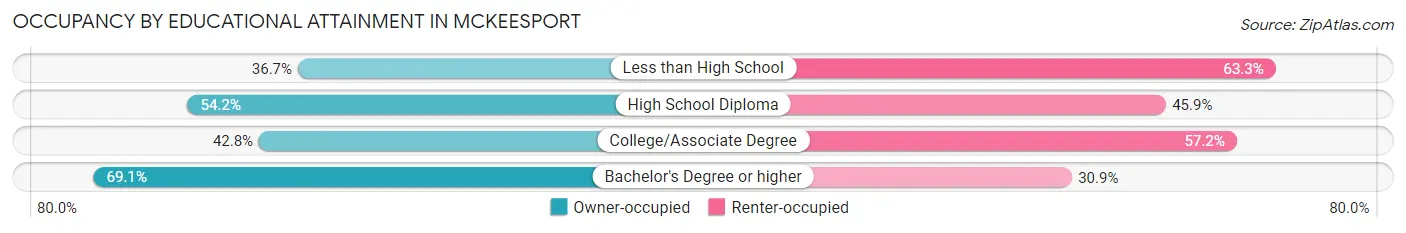
| Household Size | Owner-occupied | Renter-occupied |
| Less than High School | 393 (36.7%) | 679 (63.3%) |
| High School Diploma | 1,793 (54.1%) | 1,518 (45.9%) |
| College/Associate Degree | 1,227 (42.8%) | 1,638 (57.2%) |
| Bachelor's Degree or higher | 703 (69.1%) | 315 (30.9%) |
Occupancy by Age of Householder in Mckeesport
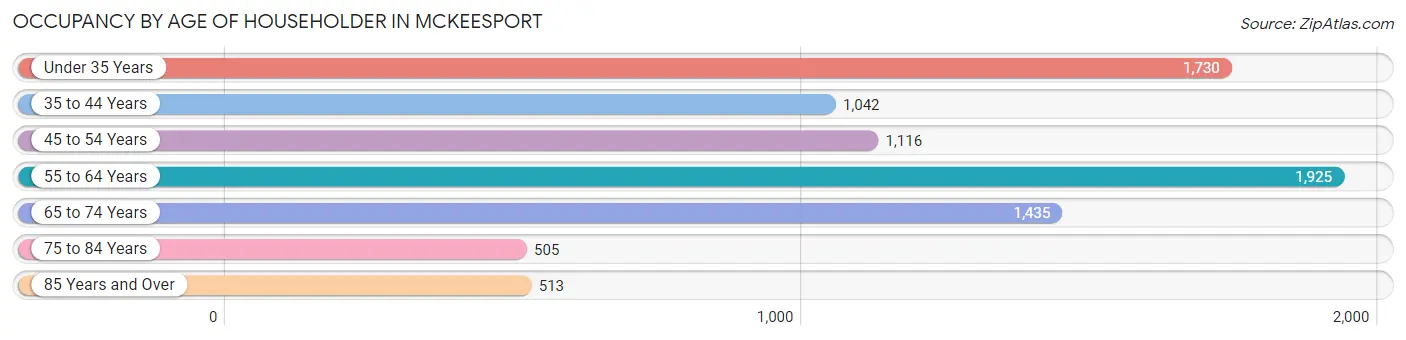
| Age Bracket | # Households | % Households |
| Under 35 Years | 1,730 | 20.9% |
| 35 to 44 Years | 1,042 | 12.6% |
| 45 to 54 Years | 1,116 | 13.5% |
| 55 to 64 Years | 1,925 | 23.3% |
| 65 to 74 Years | 1,435 | 17.4% |
| 75 to 84 Years | 505 | 6.1% |
| 85 Years and Over | 513 | 6.2% |
| Total | 8,266 | 100.0% |
Housing Finances in Mckeesport
Median Income by Occupancy in Mckeesport
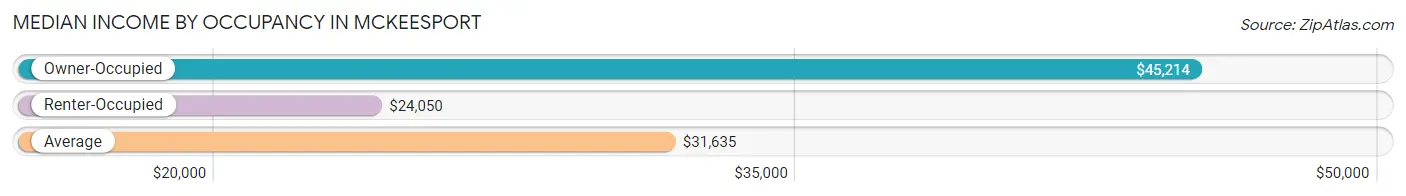
| Occupancy Type | # Households | Median Income |
| Owner-Occupied | 4,116 (49.8%) | $45,214 |
| Renter-Occupied | 4,150 (50.2%) | $24,050 |
| Average | 8,266 (100.0%) | $31,635 |
Occupancy by Householder Income Bracket in Mckeesport
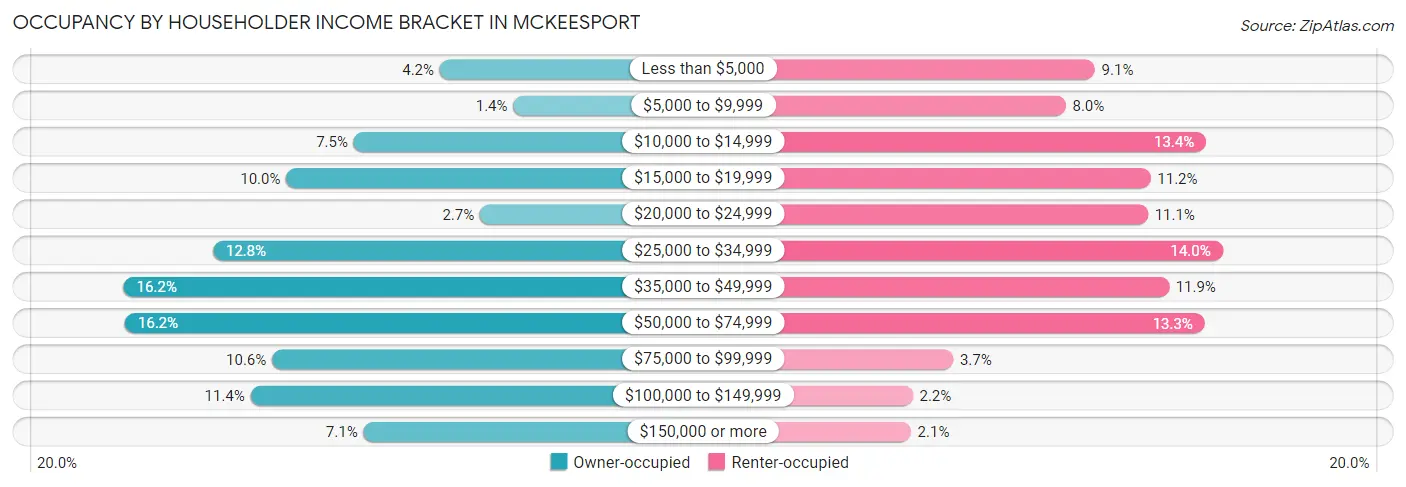
| Income Bracket | Owner-occupied | Renter-occupied |
| Less than $5,000 | 172 (4.2%) | 378 (9.1%) |
| $5,000 to $9,999 | 57 (1.4%) | 332 (8.0%) |
| $10,000 to $14,999 | 307 (7.5%) | 554 (13.4%) |
| $15,000 to $19,999 | 413 (10.0%) | 466 (11.2%) |
| $20,000 to $24,999 | 109 (2.6%) | 462 (11.1%) |
| $25,000 to $34,999 | 528 (12.8%) | 580 (14.0%) |
| $35,000 to $49,999 | 668 (16.2%) | 495 (11.9%) |
| $50,000 to $74,999 | 666 (16.2%) | 552 (13.3%) |
| $75,000 to $99,999 | 435 (10.6%) | 154 (3.7%) |
| $100,000 to $149,999 | 469 (11.4%) | 90 (2.2%) |
| $150,000 or more | 292 (7.1%) | 87 (2.1%) |
| Total | 4,116 (100.0%) | 4,150 (100.0%) |
Monthly Housing Cost Tiers in Mckeesport
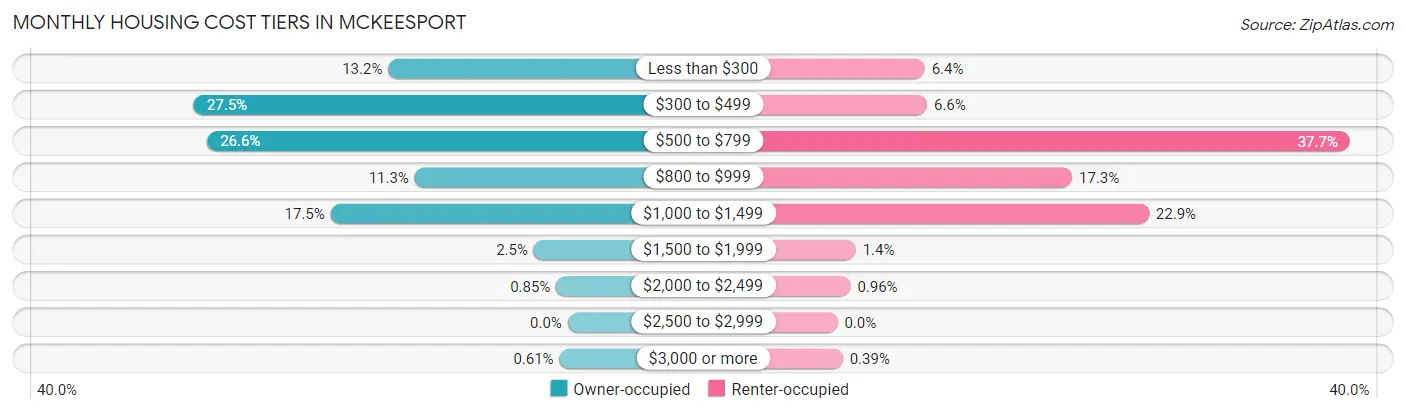
| Monthly Cost | Owner-occupied | Renter-occupied |
| Less than $300 | 544 (13.2%) | 267 (6.4%) |
| $300 to $499 | 1,133 (27.5%) | 274 (6.6%) |
| $500 to $799 | 1,093 (26.6%) | 1,566 (37.7%) |
| $800 to $999 | 464 (11.3%) | 717 (17.3%) |
| $1,000 to $1,499 | 719 (17.5%) | 952 (22.9%) |
| $1,500 to $1,999 | 103 (2.5%) | 56 (1.3%) |
| $2,000 to $2,499 | 35 (0.9%) | 40 (1.0%) |
| $2,500 to $2,999 | 0 (0.0%) | 0 (0.0%) |
| $3,000 or more | 25 (0.6%) | 16 (0.4%) |
| Total | 4,116 (100.0%) | 4,150 (100.0%) |
Physical Housing Characteristics in Mckeesport
Housing Structures in Mckeesport
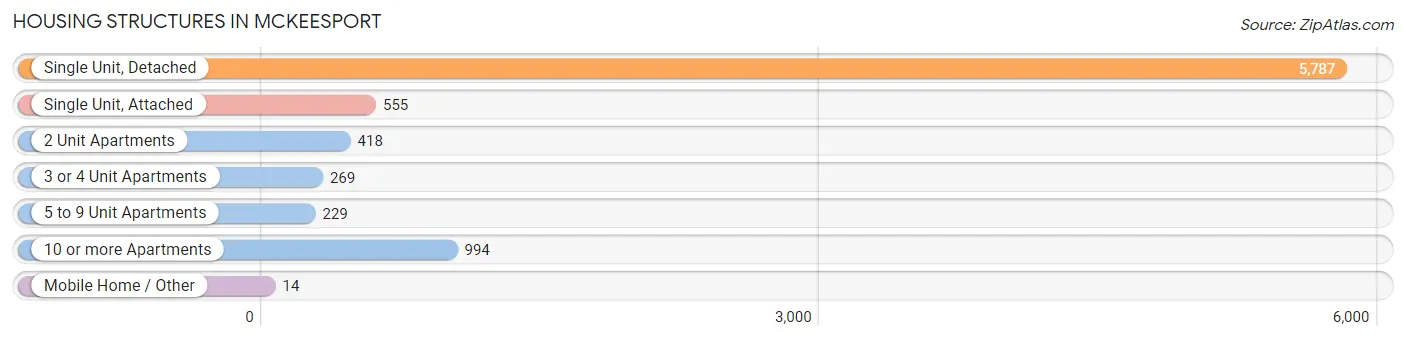
| Structure Type | # Housing Units | % Housing Units |
| Single Unit, Detached | 5,787 | 70.0% |
| Single Unit, Attached | 555 | 6.7% |
| 2 Unit Apartments | 418 | 5.1% |
| 3 or 4 Unit Apartments | 269 | 3.3% |
| 5 to 9 Unit Apartments | 229 | 2.8% |
| 10 or more Apartments | 994 | 12.0% |
| Mobile Home / Other | 14 | 0.2% |
| Total | 8,266 | 100.0% |
Housing Structures by Occupancy in Mckeesport
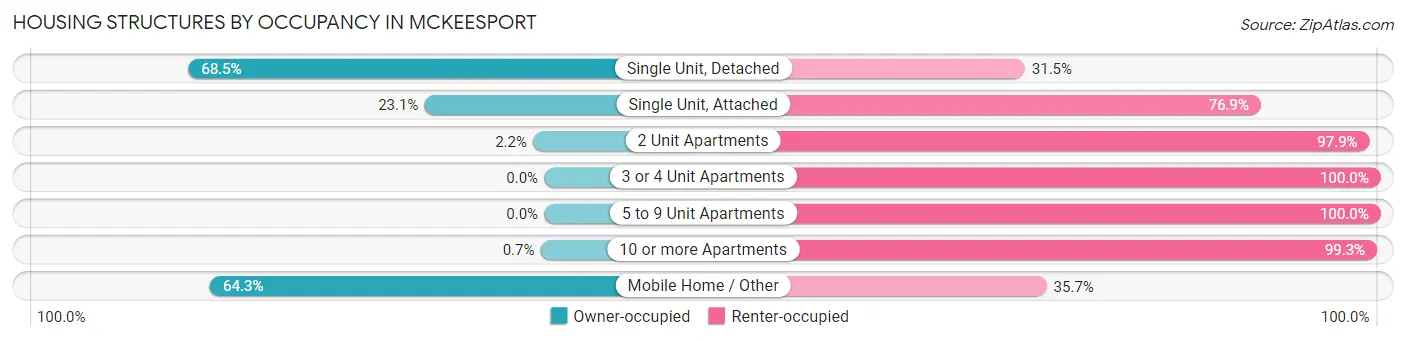
| Structure Type | Owner-occupied | Renter-occupied |
| Single Unit, Detached | 3,963 (68.5%) | 1,824 (31.5%) |
| Single Unit, Attached | 128 (23.1%) | 427 (76.9%) |
| 2 Unit Apartments | 9 (2.1%) | 409 (97.9%) |
| 3 or 4 Unit Apartments | 0 (0.0%) | 269 (100.0%) |
| 5 to 9 Unit Apartments | 0 (0.0%) | 229 (100.0%) |
| 10 or more Apartments | 7 (0.7%) | 987 (99.3%) |
| Mobile Home / Other | 9 (64.3%) | 5 (35.7%) |
| Total | 4,116 (49.8%) | 4,150 (50.2%) |
Housing Structures by Number of Rooms in Mckeesport
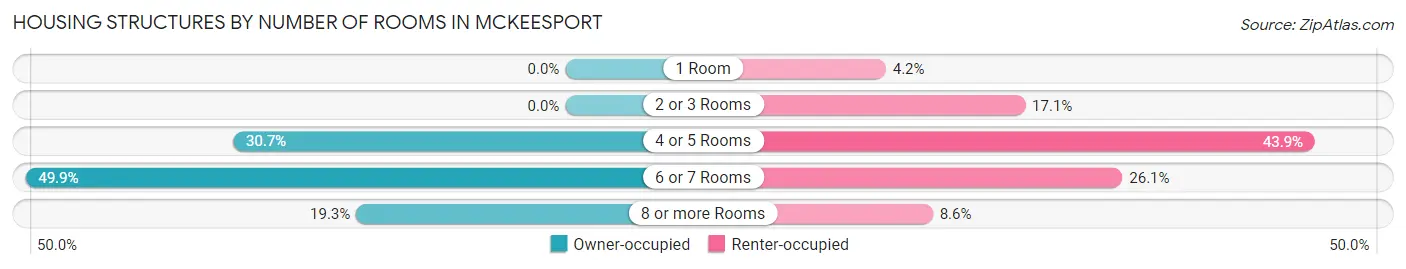
| Number of Rooms | Owner-occupied | Renter-occupied |
| 1 Room | 0 (0.0%) | 176 (4.2%) |
| 2 or 3 Rooms | 0 (0.0%) | 711 (17.1%) |
| 4 or 5 Rooms | 1,265 (30.7%) | 1,823 (43.9%) |
| 6 or 7 Rooms | 2,055 (49.9%) | 1,084 (26.1%) |
| 8 or more Rooms | 796 (19.3%) | 356 (8.6%) |
| Total | 4,116 (100.0%) | 4,150 (100.0%) |
Housing Structure by Heating Type in Mckeesport
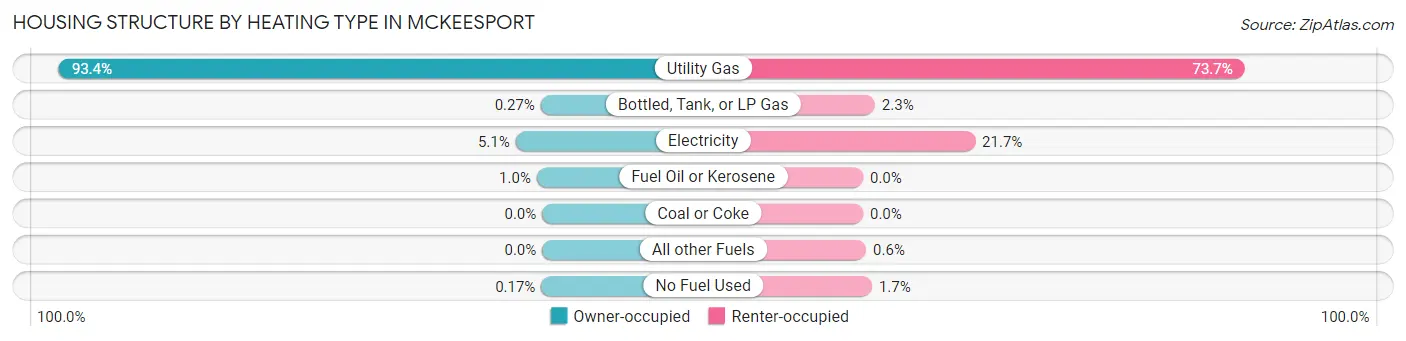
| Heating Type | Owner-occupied | Renter-occupied |
| Utility Gas | 3,844 (93.4%) | 3,059 (73.7%) |
| Bottled, Tank, or LP Gas | 11 (0.3%) | 95 (2.3%) |
| Electricity | 211 (5.1%) | 899 (21.7%) |
| Fuel Oil or Kerosene | 43 (1.0%) | 0 (0.0%) |
| Coal or Coke | 0 (0.0%) | 0 (0.0%) |
| All other Fuels | 0 (0.0%) | 25 (0.6%) |
| No Fuel Used | 7 (0.2%) | 72 (1.7%) |
| Total | 4,116 (100.0%) | 4,150 (100.0%) |
Household Vehicle Usage in Mckeesport
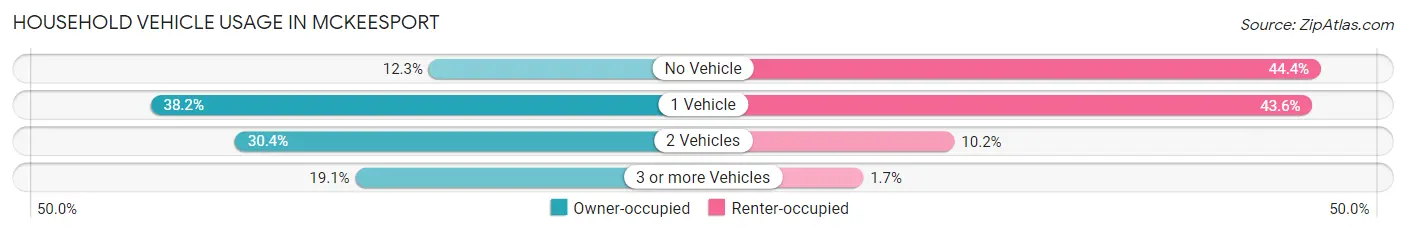
| Vehicles per Household | Owner-occupied | Renter-occupied |
| No Vehicle | 505 (12.3%) | 1,844 (44.4%) |
| 1 Vehicle | 1,574 (38.2%) | 1,811 (43.6%) |
| 2 Vehicles | 1,250 (30.4%) | 424 (10.2%) |
| 3 or more Vehicles | 787 (19.1%) | 71 (1.7%) |
| Total | 4,116 (100.0%) | 4,150 (100.0%) |
Real Estate & Mortgages in Mckeesport
Real Estate and Mortgage Overview in Mckeesport
| Characteristic | Without Mortgage | With Mortgage |
| Housing Units | 2,463 | 1,653 |
| Median Property Value | $50,700 | $73,900 |
| Median Household Income | $36,171 | $175 |
| Monthly Housing Costs | $404 | $18 |
| Real Estate Taxes | $784 | $120 |
Property Value by Mortgage Status in Mckeesport
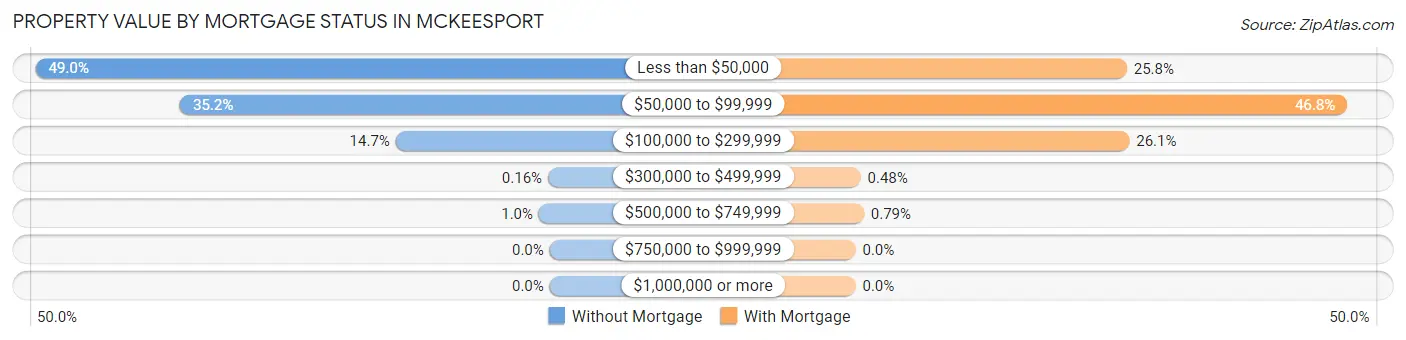
| Property Value | Without Mortgage | With Mortgage |
| Less than $50,000 | 1,206 (49.0%) | 427 (25.8%) |
| $50,000 to $99,999 | 867 (35.2%) | 774 (46.8%) |
| $100,000 to $299,999 | 361 (14.7%) | 431 (26.1%) |
| $300,000 to $499,999 | 4 (0.2%) | 8 (0.5%) |
| $500,000 to $749,999 | 25 (1.0%) | 13 (0.8%) |
| $750,000 to $999,999 | 0 (0.0%) | 0 (0.0%) |
| $1,000,000 or more | 0 (0.0%) | 0 (0.0%) |
| Total | 2,463 (100.0%) | 1,653 (100.0%) |
Household Income by Mortgage Status in Mckeesport
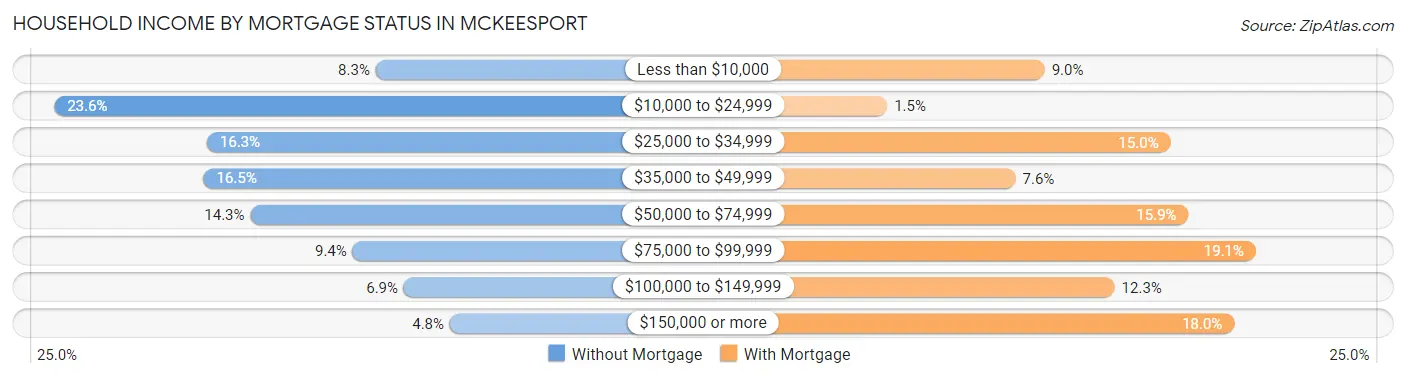
| Household Income | Without Mortgage | With Mortgage |
| Less than $10,000 | 204 (8.3%) | 149 (9.0%) |
| $10,000 to $24,999 | 581 (23.6%) | 25 (1.5%) |
| $25,000 to $34,999 | 402 (16.3%) | 248 (15.0%) |
| $35,000 to $49,999 | 406 (16.5%) | 126 (7.6%) |
| $50,000 to $74,999 | 351 (14.2%) | 262 (15.9%) |
| $75,000 to $99,999 | 231 (9.4%) | 315 (19.1%) |
| $100,000 to $149,999 | 171 (6.9%) | 204 (12.3%) |
| $150,000 or more | 117 (4.8%) | 298 (18.0%) |
| Total | 2,463 (100.0%) | 1,653 (100.0%) |
Property Value to Household Income Ratio in Mckeesport
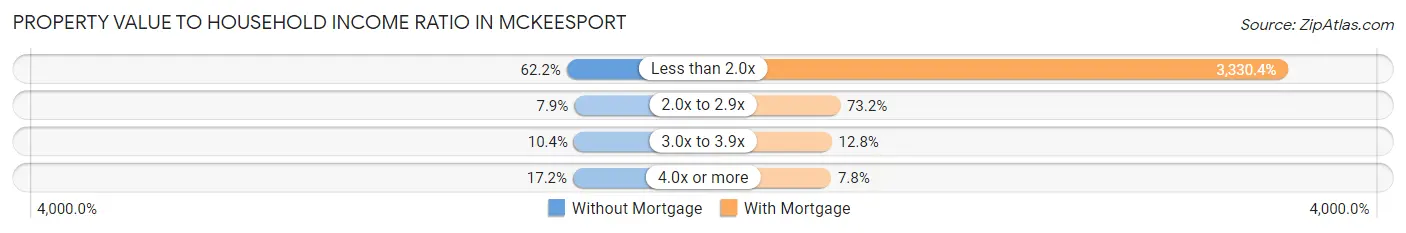
| Value-to-Income Ratio | Without Mortgage | With Mortgage |
| Less than 2.0x | 1,533 (62.2%) | 55,052 (3,330.4%) |
| 2.0x to 2.9x | 194 (7.9%) | 1,210 (73.2%) |
| 3.0x to 3.9x | 255 (10.3%) | 211 (12.8%) |
| 4.0x or more | 424 (17.2%) | 129 (7.8%) |
| Total | 2,463 (100.0%) | 1,653 (100.0%) |
Real Estate Taxes by Mortgage Status in Mckeesport

| Property Taxes | Without Mortgage | With Mortgage |
| Less than $800 | 1,211 (49.2%) | 4 (0.2%) |
| $800 to $1,499 | 650 (26.4%) | 507 (30.7%) |
| $800 to $1,499 | 532 (21.6%) | 445 (26.9%) |
| Total | 2,463 (100.0%) | 1,653 (100.0%) |
Health & Disability in Mckeesport
Health Insurance Coverage by Age in Mckeesport
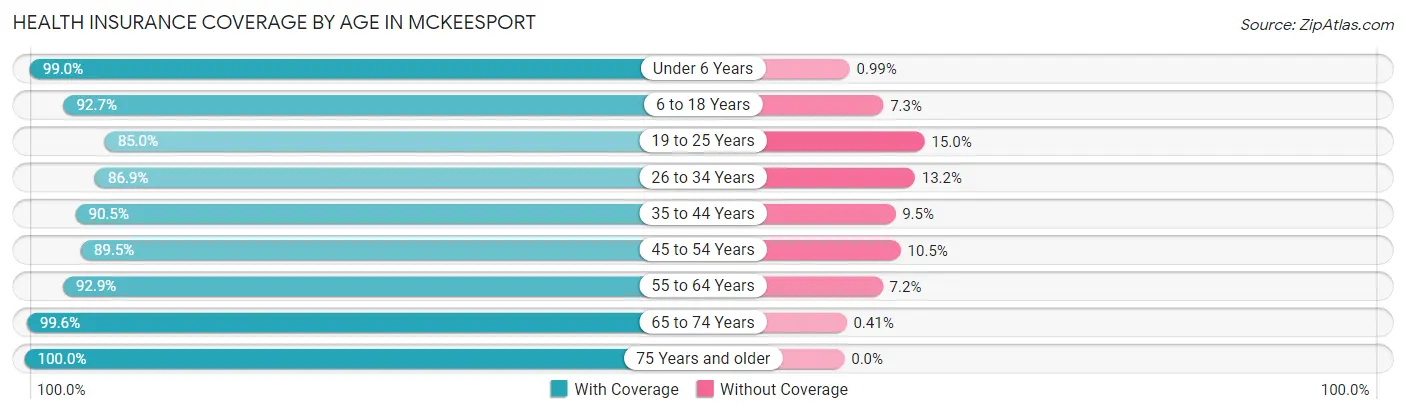
| Age Bracket | With Coverage | Without Coverage |
| Under 6 Years | 1,199 (99.0%) | 12 (1.0%) |
| 6 to 18 Years | 2,531 (92.7%) | 198 (7.3%) |
| 19 to 25 Years | 881 (85.0%) | 155 (15.0%) |
| 26 to 34 Years | 2,147 (86.9%) | 325 (13.2%) |
| 35 to 44 Years | 1,591 (90.5%) | 167 (9.5%) |
| 45 to 54 Years | 1,712 (89.5%) | 201 (10.5%) |
| 55 to 64 Years | 2,597 (92.8%) | 200 (7.1%) |
| 65 to 74 Years | 1,951 (99.6%) | 8 (0.4%) |
| 75 Years and older | 1,234 (100.0%) | 0 (0.0%) |
| Total | 15,843 (92.6%) | 1,266 (7.4%) |
Health Insurance Coverage by Citizenship Status in Mckeesport
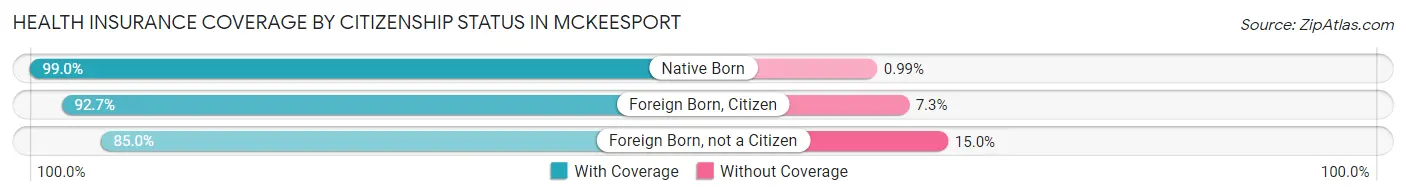
| Citizenship Status | With Coverage | Without Coverage |
| Native Born | 1,199 (99.0%) | 12 (1.0%) |
| Foreign Born, Citizen | 2,531 (92.7%) | 198 (7.3%) |
| Foreign Born, not a Citizen | 881 (85.0%) | 155 (15.0%) |
Health Insurance Coverage by Household Income in Mckeesport
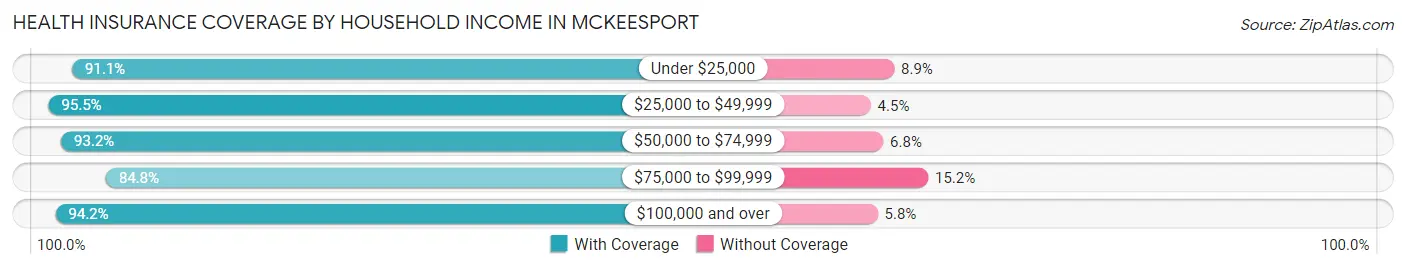
| Household Income | With Coverage | Without Coverage |
| Under $25,000 | 4,878 (91.1%) | 475 (8.9%) |
| $25,000 to $49,999 | 4,016 (95.5%) | 188 (4.5%) |
| $50,000 to $74,999 | 2,519 (93.2%) | 184 (6.8%) |
| $75,000 to $99,999 | 1,337 (84.8%) | 240 (15.2%) |
| $100,000 and over | 2,872 (94.2%) | 176 (5.8%) |
Public vs Private Health Insurance Coverage by Age in Mckeesport
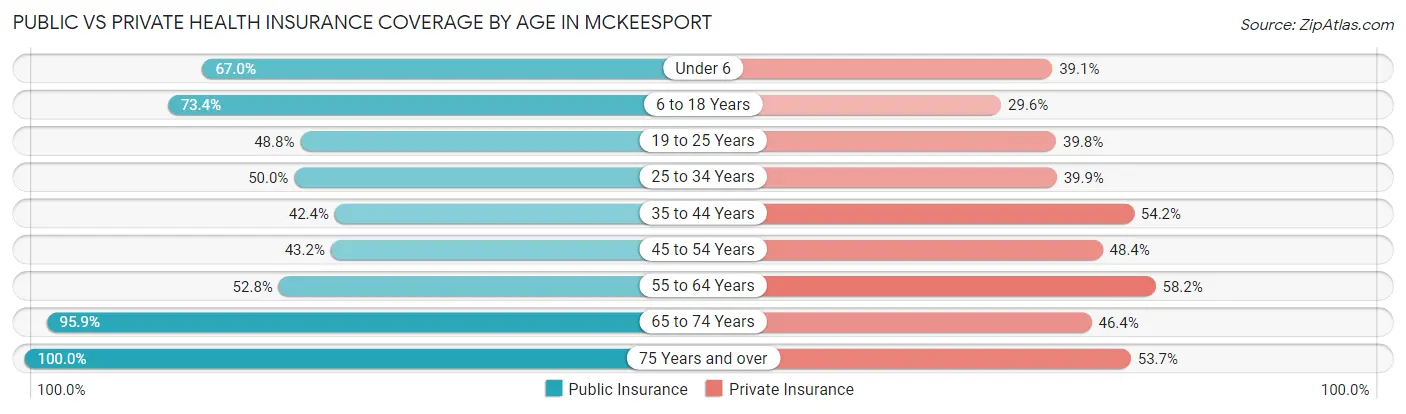
| Age Bracket | Public Insurance | Private Insurance |
| Under 6 | 811 (67.0%) | 473 (39.1%) |
| 6 to 18 Years | 2,004 (73.4%) | 807 (29.6%) |
| 19 to 25 Years | 506 (48.8%) | 412 (39.8%) |
| 25 to 34 Years | 1,235 (50.0%) | 986 (39.9%) |
| 35 to 44 Years | 746 (42.4%) | 953 (54.2%) |
| 45 to 54 Years | 826 (43.2%) | 926 (48.4%) |
| 55 to 64 Years | 1,478 (52.8%) | 1,629 (58.2%) |
| 65 to 74 Years | 1,879 (95.9%) | 908 (46.4%) |
| 75 Years and over | 1,234 (100.0%) | 662 (53.6%) |
| Total | 10,719 (62.6%) | 7,756 (45.3%) |
Disability Status by Sex by Age in Mckeesport
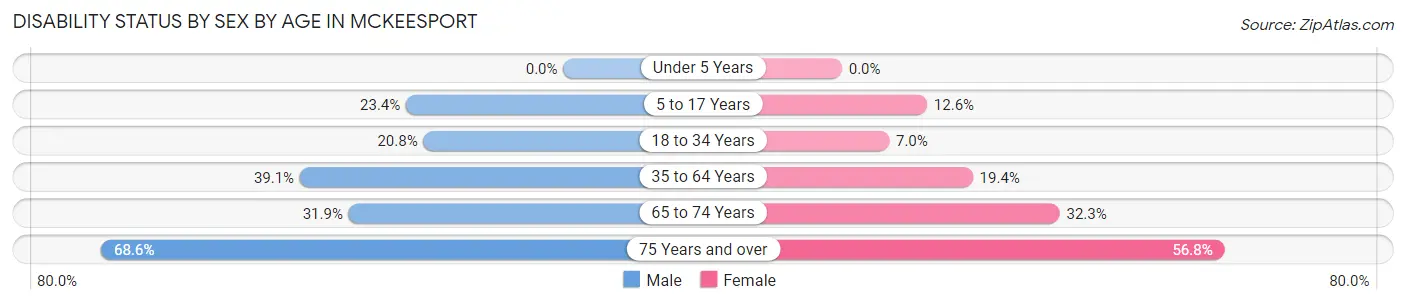
| Age Bracket | Male | Female |
| Under 5 Years | 0 (0.0%) | 0 (0.0%) |
| 5 to 17 Years | 332 (23.4%) | 184 (12.6%) |
| 18 to 34 Years | 286 (20.8%) | 156 (7.0%) |
| 35 to 64 Years | 1,203 (39.1%) | 659 (19.4%) |
| 65 to 74 Years | 305 (31.9%) | 324 (32.3%) |
| 75 Years and over | 394 (68.6%) | 375 (56.8%) |
Disability Class by Sex by Age in Mckeesport
Disability Class: Hearing Difficulty
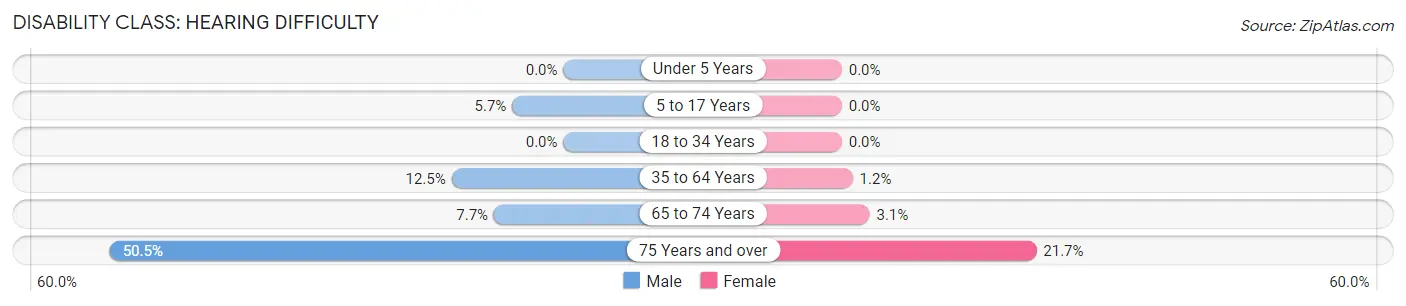
| Age Bracket | Male | Female |
| Under 5 Years | 0 (0.0%) | 0 (0.0%) |
| 5 to 17 Years | 81 (5.7%) | 0 (0.0%) |
| 18 to 34 Years | 0 (0.0%) | 0 (0.0%) |
| 35 to 64 Years | 383 (12.4%) | 41 (1.2%) |
| 65 to 74 Years | 74 (7.7%) | 31 (3.1%) |
| 75 Years and over | 290 (50.5%) | 143 (21.7%) |
Disability Class: Vision Difficulty
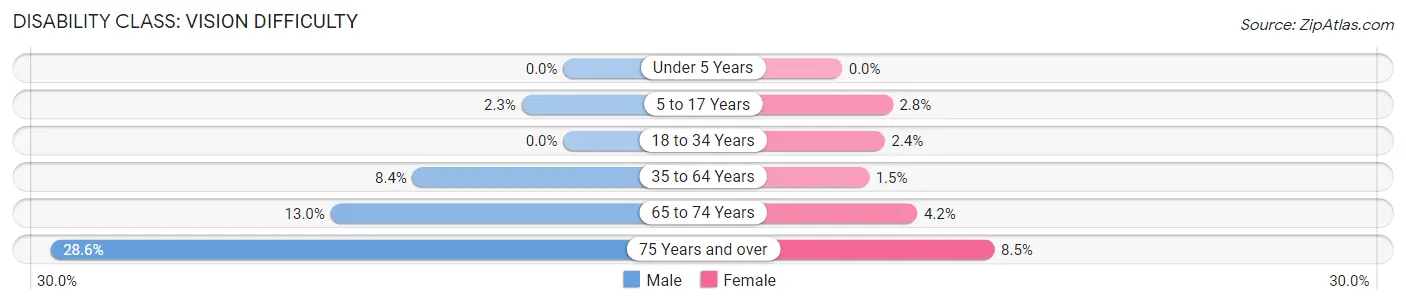
| Age Bracket | Male | Female |
| Under 5 Years | 0 (0.0%) | 0 (0.0%) |
| 5 to 17 Years | 33 (2.3%) | 41 (2.8%) |
| 18 to 34 Years | 0 (0.0%) | 53 (2.4%) |
| 35 to 64 Years | 258 (8.4%) | 51 (1.5%) |
| 65 to 74 Years | 124 (13.0%) | 42 (4.2%) |
| 75 Years and over | 164 (28.6%) | 56 (8.5%) |
Disability Class: Cognitive Difficulty
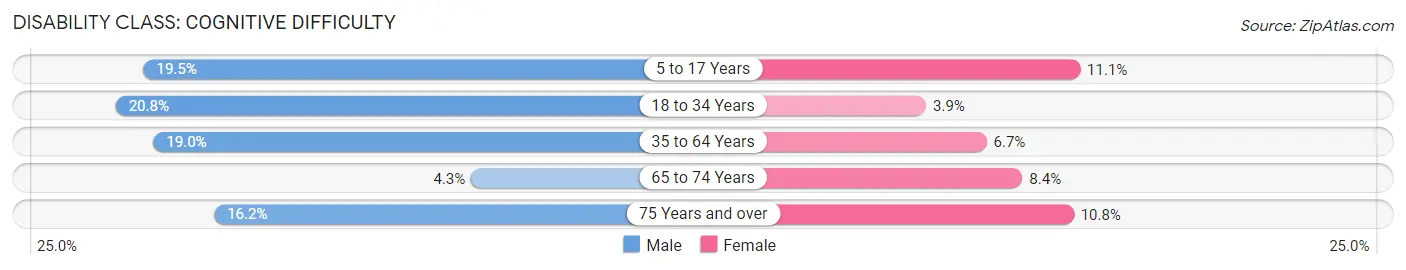
| Age Bracket | Male | Female |
| 5 to 17 Years | 277 (19.5%) | 161 (11.1%) |
| 18 to 34 Years | 286 (20.8%) | 87 (3.9%) |
| 35 to 64 Years | 585 (19.0%) | 228 (6.7%) |
| 65 to 74 Years | 41 (4.3%) | 84 (8.4%) |
| 75 Years and over | 93 (16.2%) | 71 (10.8%) |
Disability Class: Ambulatory Difficulty
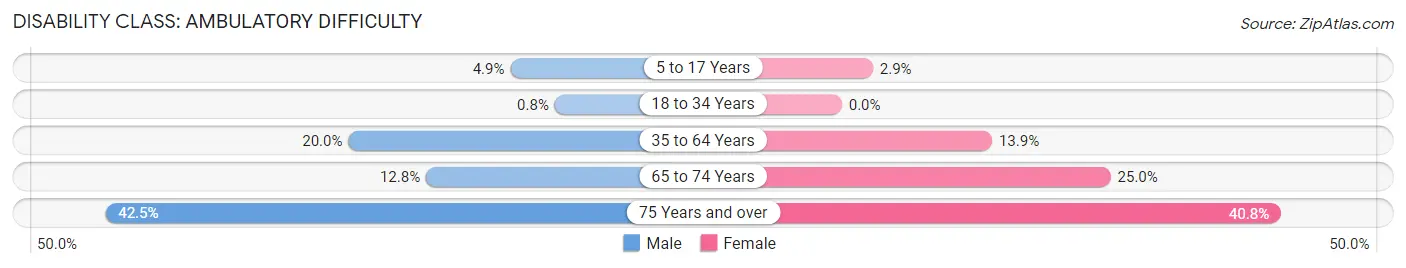
| Age Bracket | Male | Female |
| 5 to 17 Years | 70 (4.9%) | 42 (2.9%) |
| 18 to 34 Years | 11 (0.8%) | 0 (0.0%) |
| 35 to 64 Years | 614 (20.0%) | 473 (13.9%) |
| 65 to 74 Years | 122 (12.8%) | 250 (24.9%) |
| 75 Years and over | 244 (42.5%) | 269 (40.8%) |
Disability Class: Self-Care Difficulty
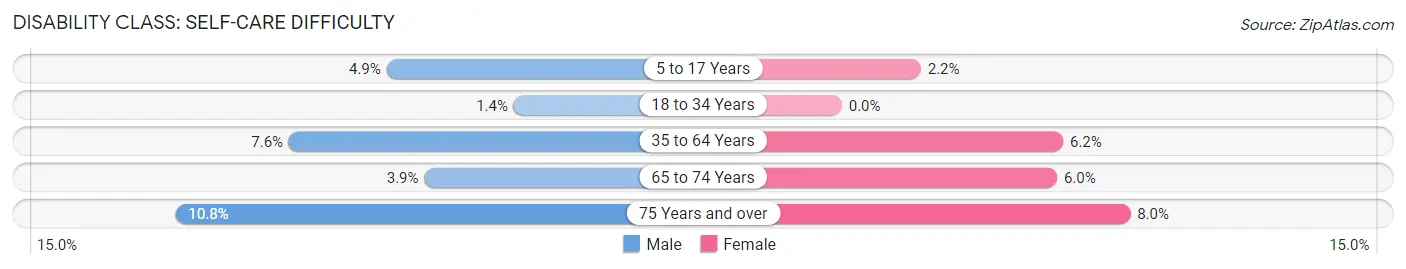
| Age Bracket | Male | Female |
| 5 to 17 Years | 70 (4.9%) | 32 (2.2%) |
| 18 to 34 Years | 19 (1.4%) | 0 (0.0%) |
| 35 to 64 Years | 235 (7.6%) | 209 (6.2%) |
| 65 to 74 Years | 37 (3.9%) | 60 (6.0%) |
| 75 Years and over | 62 (10.8%) | 53 (8.0%) |
Technology Access in Mckeesport
Computing Device Access in Mckeesport
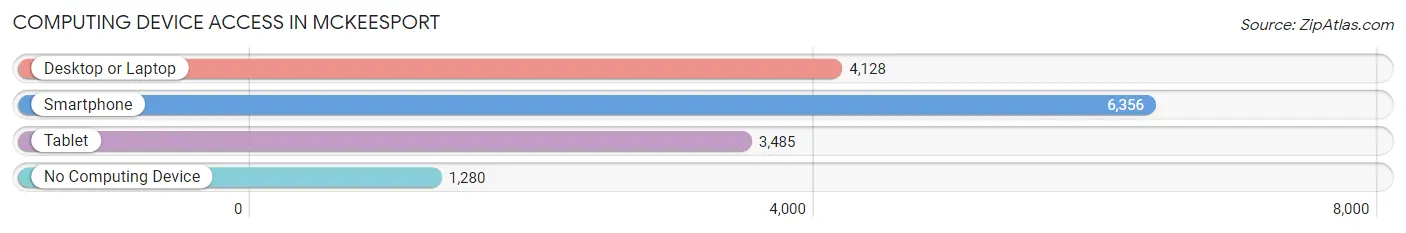
| Device Type | # Households | % Households |
| Desktop or Laptop | 4,128 | 49.9% |
| Smartphone | 6,356 | 76.9% |
| Tablet | 3,485 | 42.2% |
| No Computing Device | 1,280 | 15.5% |
| Total | 8,266 | 100.0% |
Internet Access in Mckeesport
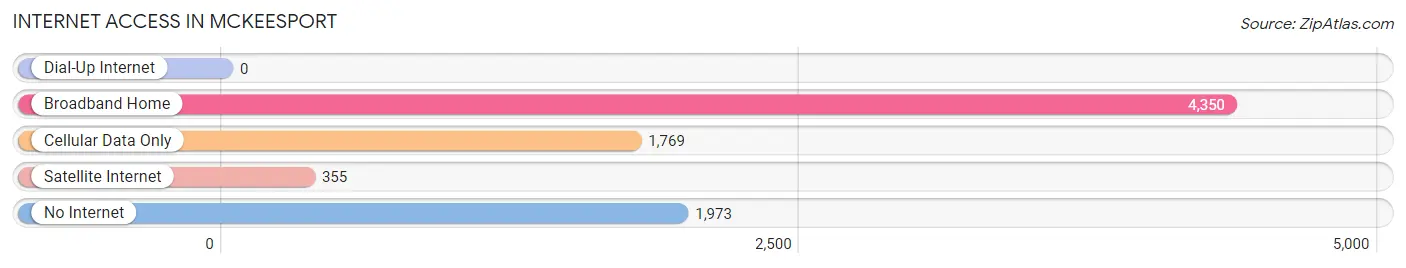
| Internet Type | # Households | % Households |
| Dial-Up Internet | 0 | 0.0% |
| Broadband Home | 4,350 | 52.6% |
| Cellular Data Only | 1,769 | 21.4% |
| Satellite Internet | 355 | 4.3% |
| No Internet | 1,973 | 23.9% |
| Total | 8,266 | 100.0% |
Mckeesport Summary
McKeesport is a city located in Allegheny County, Pennsylvania, United States. It is situated along the Monongahela River and is part of the Pittsburgh metropolitan area. The city has a population of 19,731 as of the 2010 census.
History
McKeesport was founded in 1795 by David McKee, a Scots-Irish immigrant. The city was named after him and was incorporated as a borough in 1842 and as a city in 1891. The city grew rapidly in the 19th century due to its location at the confluence of the Youghiogheny and Monongahela rivers, which provided easy access to transportation and trade. The city was a major steel producer and was home to several steel mills, including the National Tube Company, which was the largest steel mill in the world at the time.
Geography
McKeesport is located at 40°20'25" North, 79°50'45" West (40.340278, -79.845556). It is situated along the Monongahela River and is part of the Pittsburgh metropolitan area. The city has a total area of 4.2 square miles, all of which is land.
Economy
McKeesport’s economy is largely based on manufacturing and services. The city is home to several large manufacturing companies, including U.S. Steel, Allegheny Technologies, and Alcoa. The city also has a large service sector, with many businesses providing services such as healthcare, education, and retail.
Demographics
As of the 2010 census, the population of McKeesport was 19,731. The racial makeup of the city was 79.2% White, 15.3% African American, 0.3% Native American, 0.7% Asian, 0.1% Pacific Islander, 1.2% from other races, and 3.2% from two or more races. The median household income was $27,945 and the median family income was $35,945. The per capita income was $15,945.
Conclusion
McKeesport is a city located in Allegheny County, Pennsylvania, United States. It is situated along the Monongahela River and is part of the Pittsburgh metropolitan area. The city has a population of 19,731 as of the 2010 census. The city was founded in 1795 by David McKee and has a long history of steel production. The economy of McKeesport is largely based on manufacturing and services, with many businesses providing services such as healthcare, education, and retail. The racial makeup of the city was 79.2% White, 15.3% African American, 0.3% Native American, 0.7% Asian, 0.1% Pacific Islander, 1.2% from other races, and 3.2% from two or more races. The median household income was $27,945 and the median family income was $35,945.
Common Questions
What is Per Capita Income in Mckeesport?
Per Capita income in Mckeesport is $23,388.
What is the Median Family Income in Mckeesport?
Median Family Income in Mckeesport is $44,781.
What is the Median Household income in Mckeesport?
Median Household Income in Mckeesport is $31,635.
What is Income or Wage Gap in Mckeesport?
Income or Wage Gap in Mckeesport is 21.5%.
Women in Mckeesport earn 78.5 cents for every dollar earned by a man.
What is Family Income Deficit in Mckeesport?
Family Income Deficit in Mckeesport is $10,285.
Families that are below poverty line in Mckeesport earn $10,285 less on average than the poverty threshold level.
What is Inequality or Gini Index in Mckeesport?
Inequality or Gini Index in Mckeesport is 0.48.
What is the Total Population of Mckeesport?
Total Population of Mckeesport is 17,749.
What is the Total Male Population of Mckeesport?
Total Male Population of Mckeesport is 8,130.
What is the Total Female Population of Mckeesport?
Total Female Population of Mckeesport is 9,619.
What is the Ratio of Males per 100 Females in Mckeesport?
There are 84.52 Males per 100 Females in Mckeesport.
What is the Ratio of Females per 100 Males in Mckeesport?
There are 118.31 Females per 100 Males in Mckeesport.
What is the Median Population Age in Mckeesport?
Median Population Age in Mckeesport is 42.1 Years.
What is the Average Family Size in Mckeesport
Average Family Size in Mckeesport is 2.9 People.
What is the Average Household Size in Mckeesport
Average Household Size in Mckeesport is 2.0 People.
How Large is the Labor Force in Mckeesport?
There are 7,485 People in the Labor Forcein in Mckeesport.
What is the Percentage of People in the Labor Force in Mckeesport?
52.5% of People are in the Labor Force in Mckeesport.
What is the Unemployment Rate in Mckeesport?
Unemployment Rate in Mckeesport is 7.8%.