Meadville, PA Map & Demographics
Meadville Map
Meadville Overview
$27,830
PER CAPITA INCOME
$58,026
AVG FAMILY INCOME
$46,157
AVG HOUSEHOLD INCOME
35.3%
WAGE / INCOME GAP [ % ]
64.7¢/ $1
WAGE / INCOME GAP [ $ ]
$8,877
FAMILY INCOME DEFICIT
0.49
INEQUALITY / GINI INDEX
12,929
TOTAL POPULATION
6,194
MALE POPULATION
6,735
FEMALE POPULATION
91.97
MALES / 100 FEMALES
108.73
FEMALES / 100 MALES
35.7
MEDIAN AGE
2.9
AVG FAMILY SIZE
2.3
AVG HOUSEHOLD SIZE
5,970
LABOR FORCE [ PEOPLE ]
55.3%
PERCENT IN LABOR FORCE
6.9%
UNEMPLOYMENT RATE
Meadville Zip Codes
Meadville Area Codes
Income in Meadville
Income Overview in Meadville
Per Capita Income in Meadville is $27,830, while median incomes of families and households are $58,026 and $46,157 respectively.
| Characteristic | Number | Measure |
| Per Capita Income | 12,929 | $27,830 |
| Median Family Income | 2,862 | $58,026 |
| Mean Family Income | 2,862 | $74,863 |
| Median Household Income | 4,812 | $46,157 |
| Mean Household Income | 4,812 | $68,988 |
| Income Deficit | 2,862 | $8,877 |
| Wage / Income Gap (%) | 12,929 | 35.33% |
| Wage / Income Gap ($) | 12,929 | 64.67¢ per $1 |
| Gini / Inequality Index | 12,929 | 0.49 |
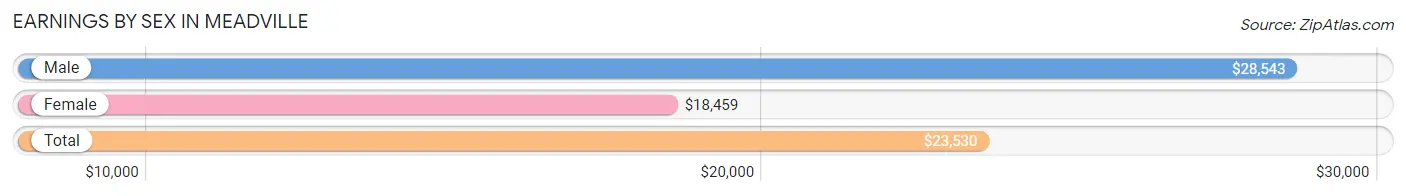
Earnings by Sex in Meadville
Average Earnings in Meadville are $23,530, $28,543 for men and $18,459 for women, a difference of 35.3%.
| Sex | Number | Average Earnings |
| Male | 3,177 (48.2%) | $28,543 |
| Female | 3,418 (51.8%) | $18,459 |
| Total | 6,595 (100.0%) | $23,530 |
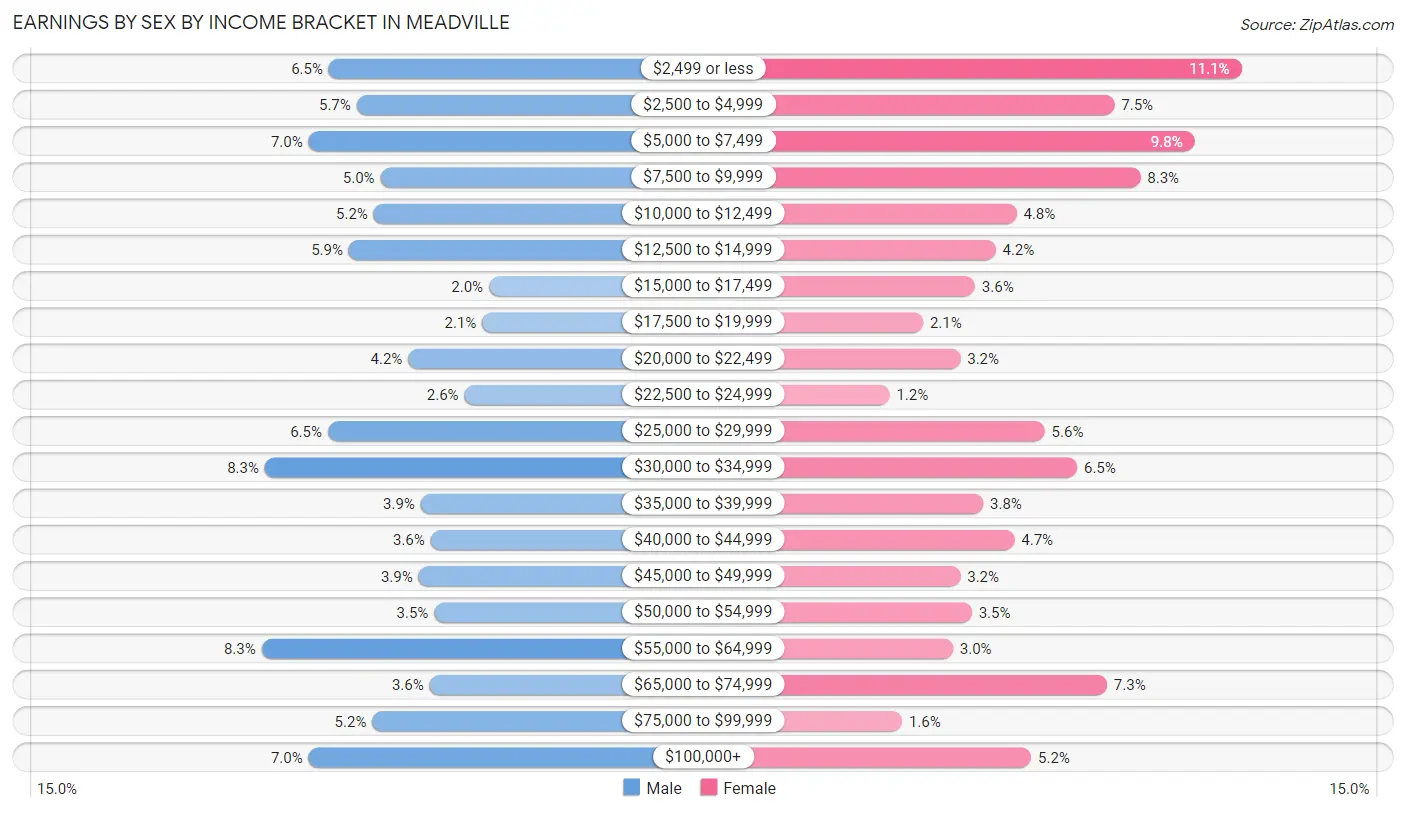
Earnings by Sex by Income Bracket in Meadville
The most common earnings brackets in Meadville are $55,000 to $64,999 for men (265 | 8.3%) and $2,499 or less for women (379 | 11.1%).
| Income | Male | Female |
| $2,499 or less | 205 (6.5%) | 379 (11.1%) |
| $2,500 to $4,999 | 180 (5.7%) | 257 (7.5%) |
| $5,000 to $7,499 | 223 (7.0%) | 334 (9.8%) |
| $7,500 to $9,999 | 159 (5.0%) | 282 (8.3%) |
| $10,000 to $12,499 | 165 (5.2%) | 163 (4.8%) |
| $12,500 to $14,999 | 187 (5.9%) | 143 (4.2%) |
| $15,000 to $17,499 | 62 (1.9%) | 123 (3.6%) |
| $17,500 to $19,999 | 68 (2.1%) | 73 (2.1%) |
| $20,000 to $22,499 | 134 (4.2%) | 109 (3.2%) |
| $22,500 to $24,999 | 84 (2.6%) | 41 (1.2%) |
| $25,000 to $29,999 | 206 (6.5%) | 190 (5.6%) |
| $30,000 to $34,999 | 262 (8.3%) | 221 (6.5%) |
| $35,000 to $39,999 | 123 (3.9%) | 131 (3.8%) |
| $40,000 to $44,999 | 114 (3.6%) | 161 (4.7%) |
| $45,000 to $49,999 | 125 (3.9%) | 109 (3.2%) |
| $50,000 to $54,999 | 111 (3.5%) | 120 (3.5%) |
| $55,000 to $64,999 | 265 (8.3%) | 102 (3.0%) |
| $65,000 to $74,999 | 115 (3.6%) | 250 (7.3%) |
| $75,000 to $99,999 | 166 (5.2%) | 53 (1.5%) |
| $100,000+ | 223 (7.0%) | 177 (5.2%) |
| Total | 3,177 (100.0%) | 3,418 (100.0%) |
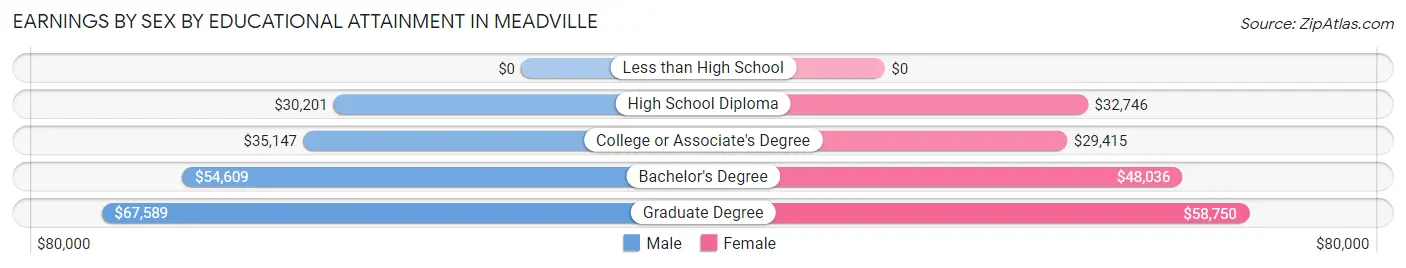
Earnings by Sex by Educational Attainment in Meadville
Average earnings in Meadville are $38,237 for men and $34,875 for women, a difference of 8.8%. Men with an educational attainment of graduate degree enjoy the highest average annual earnings of $67,589, while those with high school diploma education earn the least with $30,201. Women with an educational attainment of graduate degree earn the most with the average annual earnings of $58,750, while those with college or associate's degree education have the smallest earnings of $29,415.
| Educational Attainment | Male Income | Female Income |
| Less than High School | - | - |
| High School Diploma | $30,201 | $32,746 |
| College or Associate's Degree | $35,147 | $29,415 |
| Bachelor's Degree | $54,609 | $48,036 |
| Graduate Degree | $67,589 | $58,750 |
| Total | $38,237 | $34,875 |
Family Income in Meadville
Family Income Brackets in Meadville
According to the Meadville family income data, there are 627 families falling into the $100,000 to $149,999 income range, which is the most common income bracket and makes up 21.9% of all families. Conversely, the $10,000 to $14,999 income bracket is the least frequent group with only 74 families (2.6%) belonging to this category.
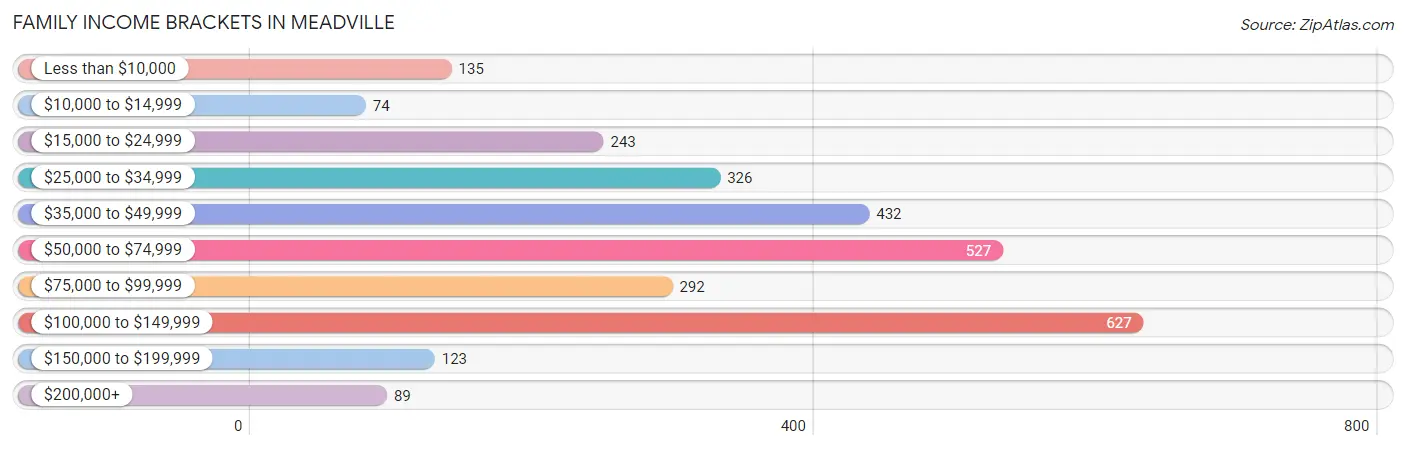
| Income Bracket | # Families | % Families |
| Less than $10,000 | 135 | 4.7% |
| $10,000 to $14,999 | 74 | 2.6% |
| $15,000 to $24,999 | 243 | 8.5% |
| $25,000 to $34,999 | 326 | 11.4% |
| $35,000 to $49,999 | 432 | 15.1% |
| $50,000 to $74,999 | 527 | 18.4% |
| $75,000 to $99,999 | 292 | 10.2% |
| $100,000 to $149,999 | 627 | 21.9% |
| $150,000 to $199,999 | 123 | 4.3% |
| $200,000+ | 89 | 3.1% |
Family Income by Famaliy Size in Meadville
4-person families (513 | 17.9%) account for the highest median family income in Meadville with $64,896 per family, while 2-person families (1,374 | 48.0%) have the highest median income of $27,341 per family member.
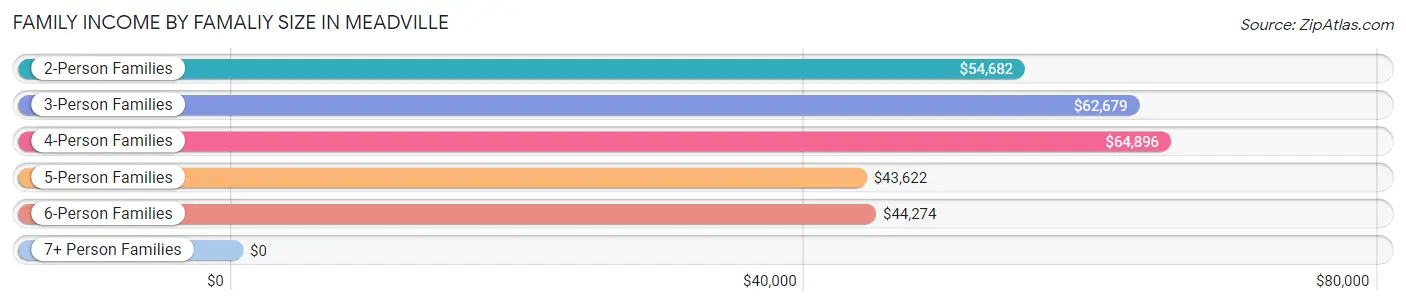
| Income Bracket | # Families | Median Income |
| 2-Person Families | 1,374 (48.0%) | $54,682 |
| 3-Person Families | 743 (26.0%) | $62,679 |
| 4-Person Families | 513 (17.9%) | $64,896 |
| 5-Person Families | 136 (4.8%) | $43,622 |
| 6-Person Families | 96 (3.4%) | $44,274 |
| 7+ Person Families | 0 (0.0%) | $0 |
| Total | 2,862 (100.0%) | $58,026 |
Family Income by Number of Earners in Meadville
The median family income in Meadville is $58,026, with families comprising 3+ earners (228) having the highest median family income of $97,143, while families with 1 earner (1,059) have the lowest median family income of $38,272, accounting for 8.0% and 37.0% of families, respectively.
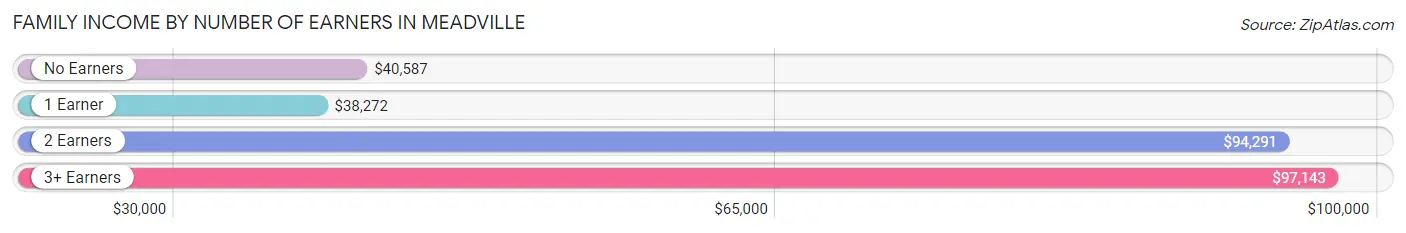
| Number of Earners | # Families | Median Income |
| No Earners | 487 (17.0%) | $40,587 |
| 1 Earner | 1,059 (37.0%) | $38,272 |
| 2 Earners | 1,088 (38.0%) | $94,291 |
| 3+ Earners | 228 (8.0%) | $97,143 |
| Total | 2,862 (100.0%) | $58,026 |
Household Income in Meadville
Household Income Brackets in Meadville
With 780 households falling in the category, the $50,000 to $74,999 income range is the most frequent in Meadville, accounting for 16.2% of all households. In contrast, only 130 households (2.7%) fall into the $200,000+ income bracket, making it the least populous group.
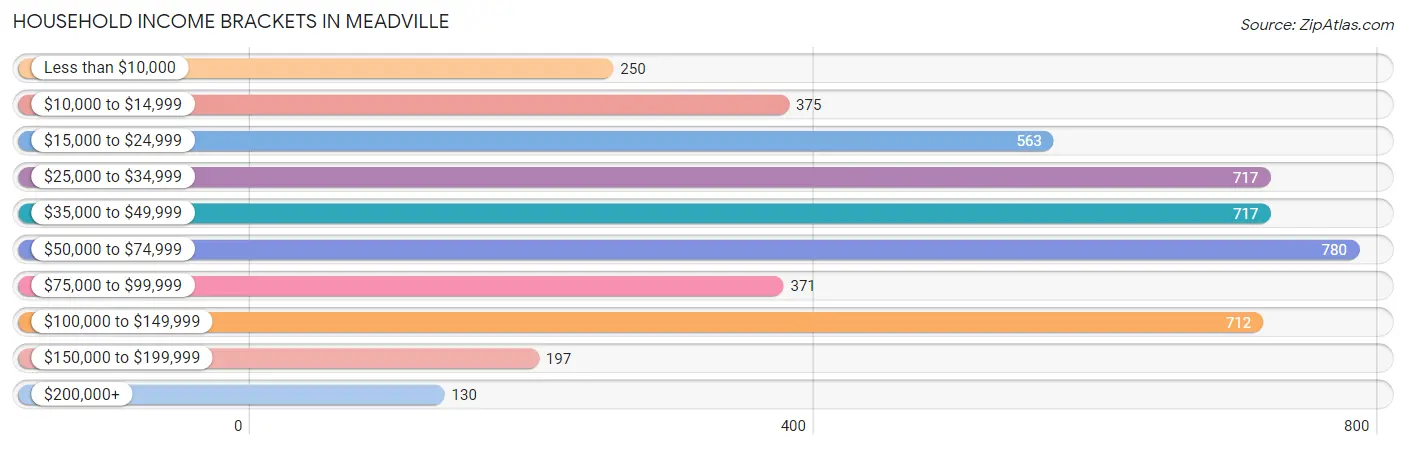
| Income Bracket | # Households | % Households |
| Less than $10,000 | 250 | 5.2% |
| $10,000 to $14,999 | 375 | 7.8% |
| $15,000 to $24,999 | 563 | 11.7% |
| $25,000 to $34,999 | 717 | 14.9% |
| $35,000 to $49,999 | 717 | 14.9% |
| $50,000 to $74,999 | 780 | 16.2% |
| $75,000 to $99,999 | 371 | 7.7% |
| $100,000 to $149,999 | 712 | 14.8% |
| $150,000 to $199,999 | 197 | 4.1% |
| $200,000+ | 130 | 2.7% |
Household Income by Householder Age in Meadville
The median household income in Meadville is $46,157, with the highest median household income of $59,260 found in the 25 to 44 years age bracket for the primary householder. A total of 1,371 households (28.5%) fall into this category. Meanwhile, the 15 to 24 years age bracket for the primary householder has the lowest median household income of $36,393, with 153 households (3.2%) in this group.
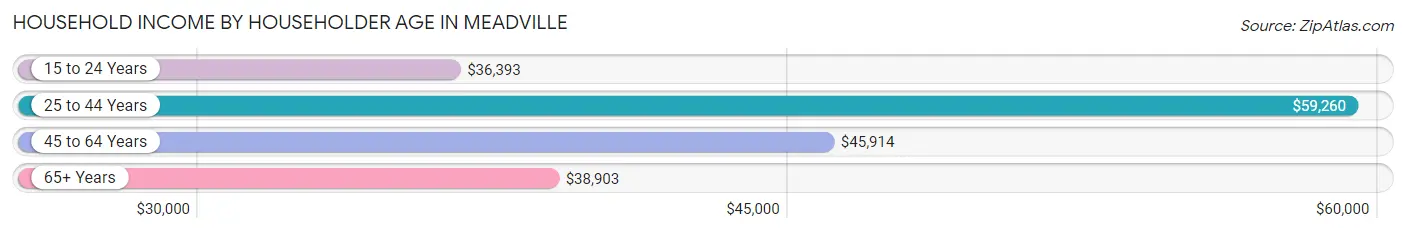
| Income Bracket | # Households | Median Income |
| 15 to 24 Years | 153 (3.2%) | $36,393 |
| 25 to 44 Years | 1,371 (28.5%) | $59,260 |
| 45 to 64 Years | 1,979 (41.1%) | $45,914 |
| 65+ Years | 1,309 (27.2%) | $38,903 |
| Total | 4,812 (100.0%) | $46,157 |
Poverty in Meadville
Income Below Poverty by Sex and Age in Meadville
With 17.4% poverty level for males and 18.8% for females among the residents of Meadville, under 5 year old males and 18 to 24 year old females are the most vulnerable to poverty, with 99 males (40.1%) and 212 females (47.2%) in their respective age groups living below the poverty level.
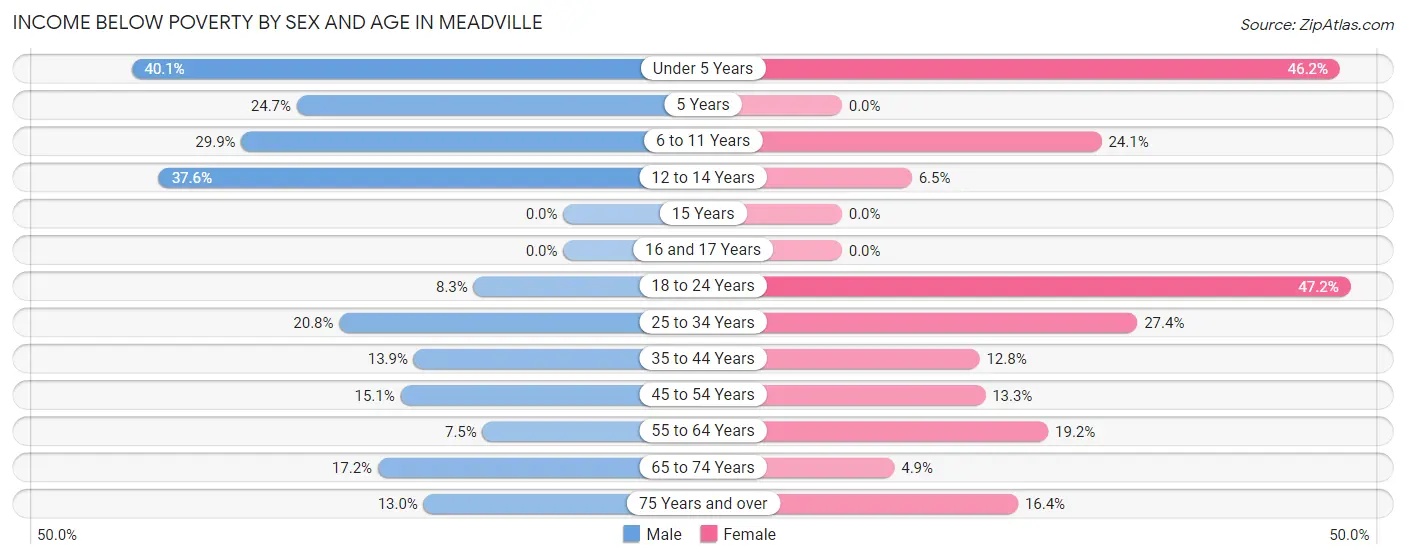
| Age Bracket | Male | Female |
| Under 5 Years | 99 (40.1%) | 110 (46.2%) |
| 5 Years | 23 (24.7%) | 0 (0.0%) |
| 6 to 11 Years | 153 (29.9%) | 114 (24.1%) |
| 12 to 14 Years | 92 (37.6%) | 10 (6.5%) |
| 15 Years | 0 (0.0%) | 0 (0.0%) |
| 16 and 17 Years | 0 (0.0%) | 0 (0.0%) |
| 18 to 24 Years | 40 (8.3%) | 212 (47.2%) |
| 25 to 34 Years | 147 (20.8%) | 156 (27.4%) |
| 35 to 44 Years | 89 (13.9%) | 114 (12.8%) |
| 45 to 54 Years | 92 (15.1%) | 105 (13.3%) |
| 55 to 64 Years | 56 (7.5%) | 149 (19.2%) |
| 65 to 74 Years | 89 (17.2%) | 33 (4.9%) |
| 75 Years and over | 35 (13.0%) | 86 (16.4%) |
| Total | 915 (17.4%) | 1,089 (18.8%) |
Income Above Poverty by Sex and Age in Meadville
According to the poverty statistics in Meadville, males aged 15 years and females aged 5 years are the age groups that are most secure financially, with 100.0% of males and 100.0% of females in these age groups living above the poverty line.
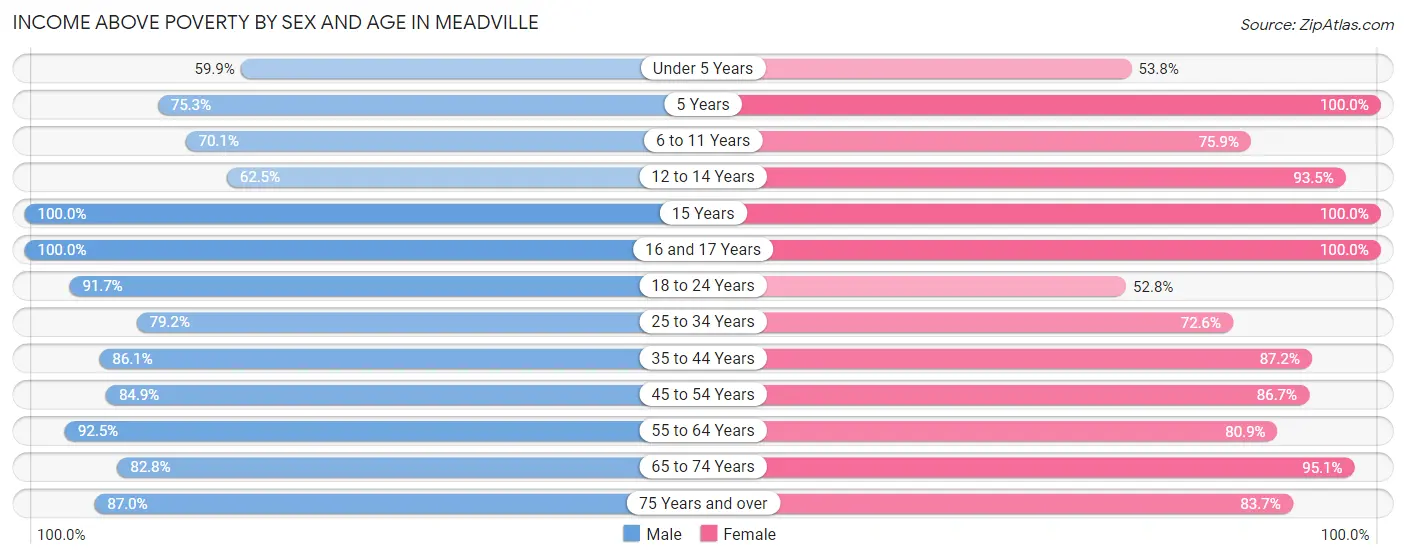
| Age Bracket | Male | Female |
| Under 5 Years | 148 (59.9%) | 128 (53.8%) |
| 5 Years | 70 (75.3%) | 60 (100.0%) |
| 6 to 11 Years | 359 (70.1%) | 359 (75.9%) |
| 12 to 14 Years | 153 (62.5%) | 144 (93.5%) |
| 15 Years | 68 (100.0%) | 26 (100.0%) |
| 16 and 17 Years | 135 (100.0%) | 160 (100.0%) |
| 18 to 24 Years | 440 (91.7%) | 237 (52.8%) |
| 25 to 34 Years | 560 (79.2%) | 413 (72.6%) |
| 35 to 44 Years | 552 (86.1%) | 778 (87.2%) |
| 45 to 54 Years | 517 (84.9%) | 684 (86.7%) |
| 55 to 64 Years | 692 (92.5%) | 629 (80.8%) |
| 65 to 74 Years | 428 (82.8%) | 645 (95.1%) |
| 75 Years and over | 235 (87.0%) | 440 (83.7%) |
| Total | 4,357 (82.6%) | 4,703 (81.2%) |
Income Below Poverty Among Married-Couple Families in Meadville
The poverty statistics for married-couple families in Meadville show that 3.3% or 51 of the total 1,551 families live below the poverty line. Families with 3 or 4 children have the highest poverty rate of 18.4%, comprising of 26 families. On the other hand, families with no children have the lowest poverty rate of 0.0%, which includes 0 families.
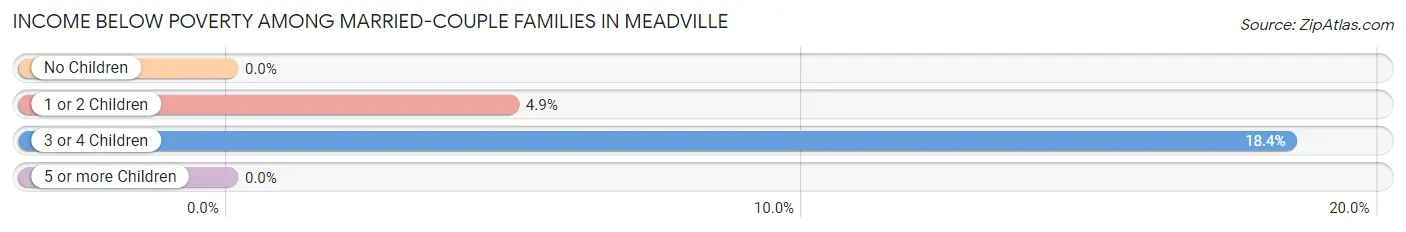
| Children | Above Poverty | Below Poverty |
| No Children | 899 (100.0%) | 0 (0.0%) |
| 1 or 2 Children | 486 (95.1%) | 25 (4.9%) |
| 3 or 4 Children | 115 (81.6%) | 26 (18.4%) |
| 5 or more Children | 0 (0.0%) | 0 (0.0%) |
| Total | 1,500 (96.7%) | 51 (3.3%) |
Income Below Poverty Among Single-Parent Households in Meadville
According to the poverty data in Meadville, 22.7% or 78 single-father households and 25.4% or 246 single-mother households are living below the poverty line. Among single-father households, those with 1 or 2 children have the highest poverty rate, with 63 households (35.6%) experiencing poverty. Likewise, among single-mother households, those with 3 or 4 children have the highest poverty rate, with 52 households (60.5%) falling below the poverty line.
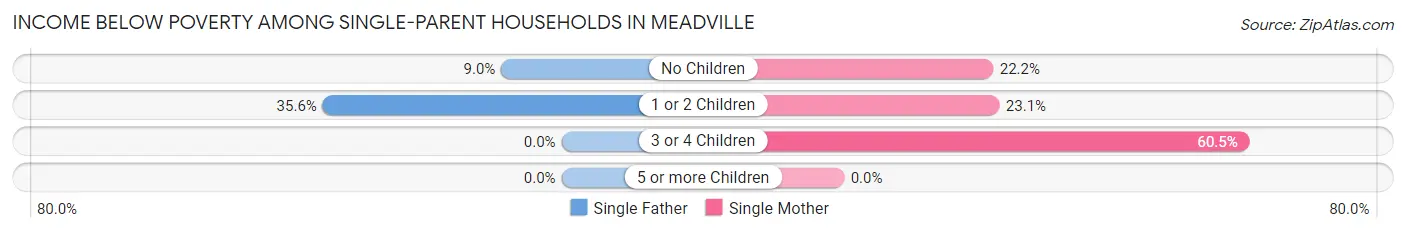
| Children | Single Father | Single Mother |
| No Children | 15 (9.0%) | 64 (22.2%) |
| 1 or 2 Children | 63 (35.6%) | 130 (23.1%) |
| 3 or 4 Children | 0 (0.0%) | 52 (60.5%) |
| 5 or more Children | 0 (0.0%) | 0 (0.0%) |
| Total | 78 (22.7%) | 246 (25.4%) |
Income Below Poverty Among Married-Couple vs Single-Parent Households in Meadville
The poverty data for Meadville shows that 51 of the married-couple family households (3.3%) and 324 of the single-parent households (24.7%) are living below the poverty level. Within the married-couple family households, those with 3 or 4 children have the highest poverty rate, with 26 households (18.4%) falling below the poverty line. Among the single-parent households, those with 3 or 4 children have the highest poverty rate, with 52 household (60.5%) living below poverty.
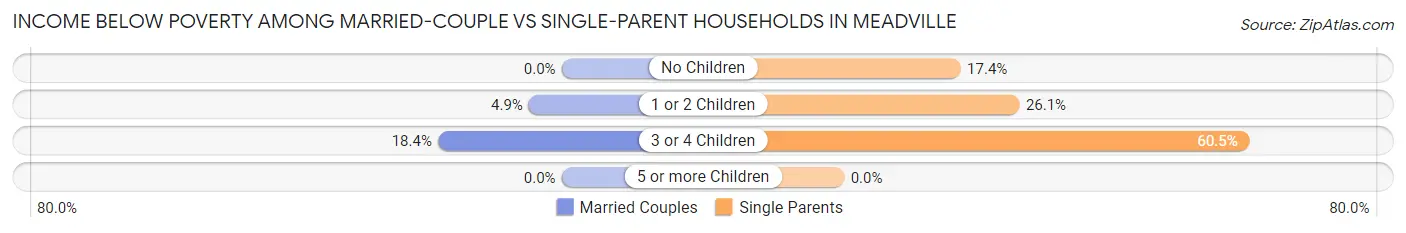
| Children | Married-Couple Families | Single-Parent Households |
| No Children | 0 (0.0%) | 79 (17.4%) |
| 1 or 2 Children | 25 (4.9%) | 193 (26.1%) |
| 3 or 4 Children | 26 (18.4%) | 52 (60.5%) |
| 5 or more Children | 0 (0.0%) | 0 (0.0%) |
| Total | 51 (3.3%) | 324 (24.7%) |
Race in Meadville
The most populous races in Meadville are White / Caucasian (11,272 | 87.2%), Two or more Races (770 | 6.0%), and Black / African American (693 | 5.4%).
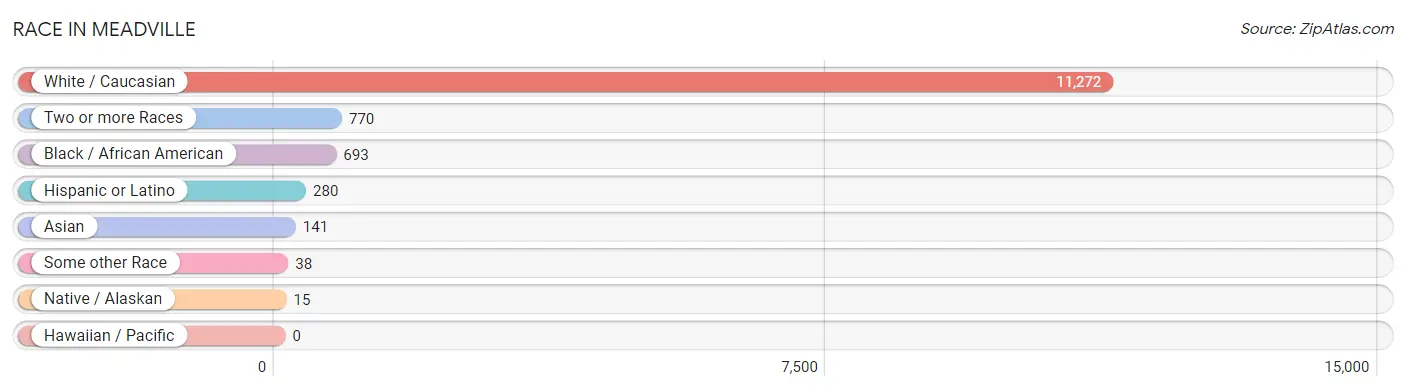
| Race | # Population | % Population |
| Asian | 141 | 1.1% |
| Black / African American | 693 | 5.4% |
| Hawaiian / Pacific | 0 | 0.0% |
| Hispanic or Latino | 280 | 2.2% |
| Native / Alaskan | 15 | 0.1% |
| White / Caucasian | 11,272 | 87.2% |
| Two or more Races | 770 | 6.0% |
| Some other Race | 38 | 0.3% |
| Total | 12,929 | 100.0% |
Ancestry in Meadville
The most populous ancestries reported in Meadville are German (4,070 | 31.5%), Irish (2,197 | 17.0%), English (1,291 | 10.0%), Italian (1,264 | 9.8%), and Polish (607 | 4.7%), together accounting for 72.9% of all Meadville residents.
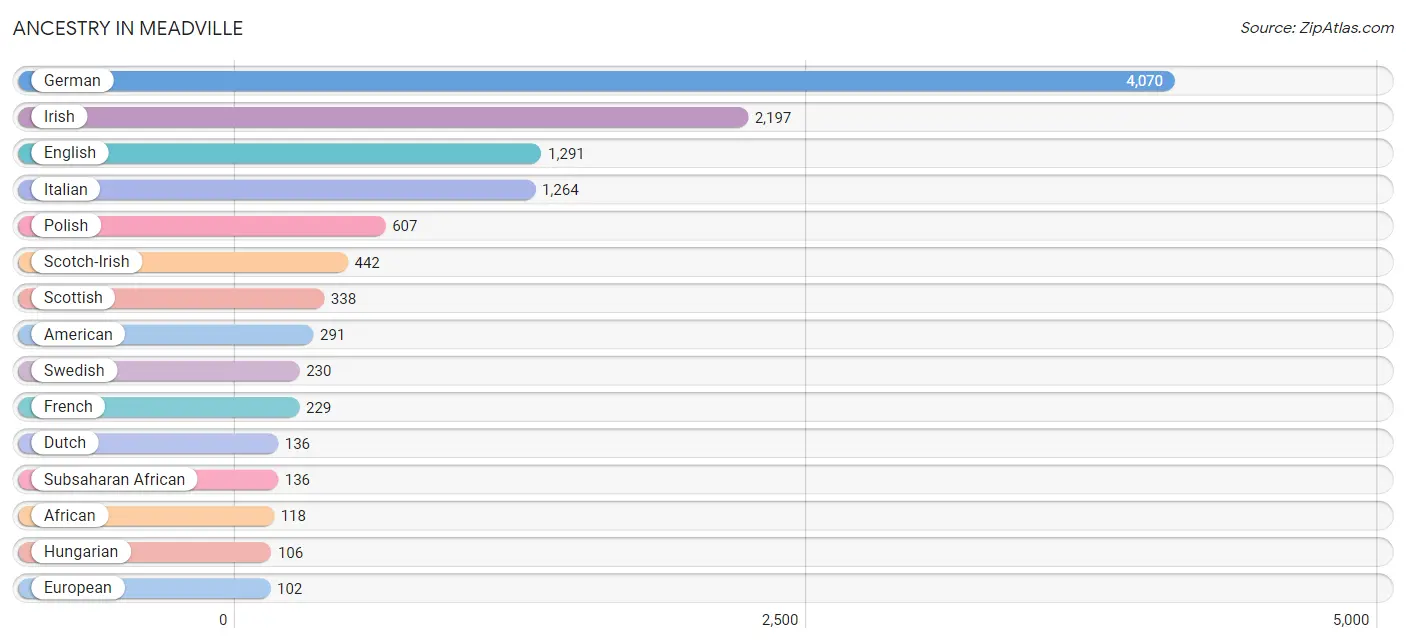
| Ancestry | # Population | % Population |
| African | 118 | 0.9% |
| American | 291 | 2.2% |
| Arab | 79 | 0.6% |
| Australian | 20 | 0.2% |
| Austrian | 7 | 0.1% |
| Bhutanese | 30 | 0.2% |
| British | 42 | 0.3% |
| Burmese | 9 | 0.1% |
| Canadian | 14 | 0.1% |
| Central American | 53 | 0.4% |
| Central American Indian | 46 | 0.4% |
| Cherokee | 99 | 0.8% |
| Cheyenne | 4 | 0.0% |
| Croatian | 17 | 0.1% |
| Cuban | 14 | 0.1% |
| Czech | 19 | 0.2% |
| Czechoslovakian | 20 | 0.2% |
| Danish | 47 | 0.4% |
| Dominican | 2 | 0.0% |
| Dutch | 136 | 1.1% |
| Eastern European | 30 | 0.2% |
| English | 1,291 | 10.0% |
| European | 102 | 0.8% |
| Finnish | 35 | 0.3% |
| French | 229 | 1.8% |
| French Canadian | 92 | 0.7% |
| German | 4,070 | 31.5% |
| Greek | 13 | 0.1% |
| Guatemalan | 45 | 0.4% |
| Guyanese | 51 | 0.4% |
| Hungarian | 106 | 0.8% |
| Indian (Asian) | 73 | 0.6% |
| Irish | 2,197 | 17.0% |
| Iroquois | 47 | 0.4% |
| Italian | 1,264 | 9.8% |
| Korean | 53 | 0.4% |
| Lebanese | 46 | 0.4% |
| Lithuanian | 18 | 0.1% |
| Mexican | 90 | 0.7% |
| Native Hawaiian | 38 | 0.3% |
| Norwegian | 65 | 0.5% |
| Palestinian | 20 | 0.2% |
| Pennsylvania German | 50 | 0.4% |
| Polish | 607 | 4.7% |
| Portuguese | 41 | 0.3% |
| Puerto Rican | 92 | 0.7% |
| Romanian | 23 | 0.2% |
| Russian | 35 | 0.3% |
| Salvadoran | 8 | 0.1% |
| Scandinavian | 8 | 0.1% |
| Scotch-Irish | 442 | 3.4% |
| Scottish | 338 | 2.6% |
| Slovak | 64 | 0.5% |
| Slovene | 5 | 0.0% |
| Somali | 18 | 0.1% |
| Sri Lankan | 12 | 0.1% |
| Subsaharan African | 136 | 1.1% |
| Swedish | 230 | 1.8% |
| Syrian | 13 | 0.1% |
| Thai | 47 | 0.4% |
| Turkish | 14 | 0.1% |
| Ukrainian | 7 | 0.1% |
| Welsh | 96 | 0.7% |
| West Indian | 3 | 0.0% |
| Yugoslavian | 4 | 0.0% | View All 65 Rows |
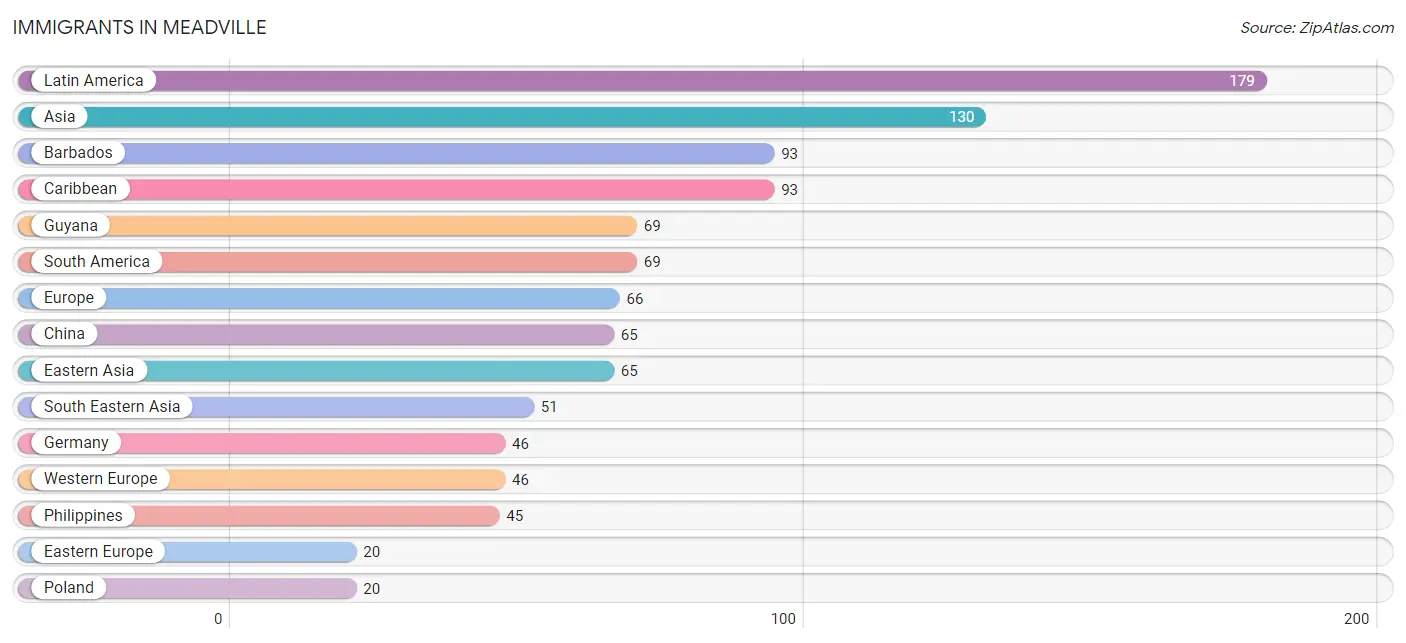
Immigrants in Meadville
The most numerous immigrant groups reported in Meadville came from Latin America (179 | 1.4%), Asia (130 | 1.0%), Barbados (93 | 0.7%), Caribbean (93 | 0.7%), and Guyana (69 | 0.5%), together accounting for 4.4% of all Meadville residents.
| Immigration Origin | # Population | % Population |
| Africa | 18 | 0.1% |
| Asia | 130 | 1.0% |
| Barbados | 93 | 0.7% |
| Canada | 17 | 0.1% |
| Caribbean | 93 | 0.7% |
| Central America | 17 | 0.1% |
| China | 65 | 0.5% |
| Eastern Africa | 18 | 0.1% |
| Eastern Asia | 65 | 0.5% |
| Eastern Europe | 20 | 0.2% |
| Europe | 66 | 0.5% |
| Germany | 46 | 0.4% |
| Guatemala | 17 | 0.1% |
| Guyana | 69 | 0.5% |
| Latin America | 179 | 1.4% |
| Philippines | 45 | 0.4% |
| Poland | 20 | 0.2% |
| Somalia | 18 | 0.1% |
| South America | 69 | 0.5% |
| South Eastern Asia | 51 | 0.4% |
| Turkey | 14 | 0.1% |
| Vietnam | 6 | 0.1% |
| Western Asia | 14 | 0.1% |
| Western Europe | 46 | 0.4% | View All 24 Rows |
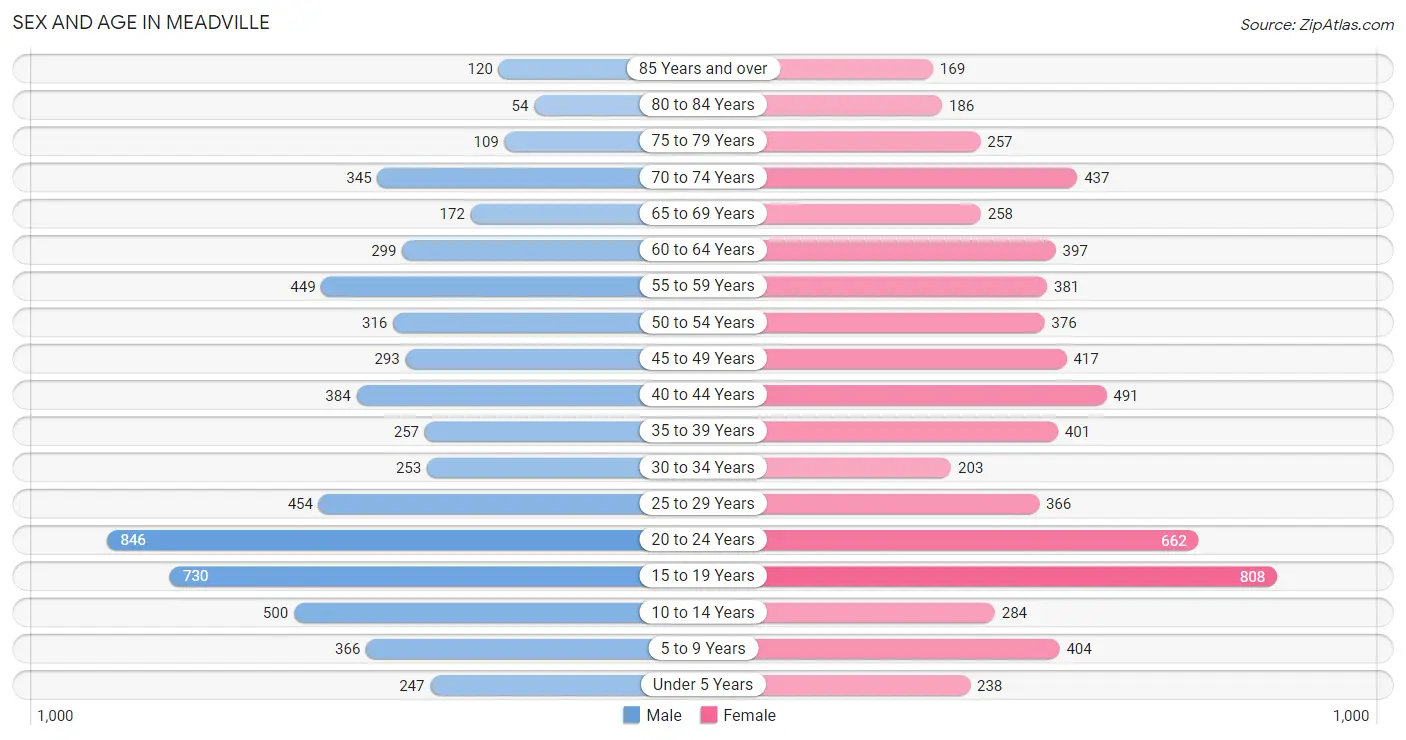
Sex and Age in Meadville
Sex and Age in Meadville
The most populous age groups in Meadville are 20 to 24 Years (846 | 13.7%) for men and 15 to 19 Years (808 | 12.0%) for women.
| Age Bracket | Male | Female |
| Under 5 Years | 247 (4.0%) | 238 (3.5%) |
| 5 to 9 Years | 366 (5.9%) | 404 (6.0%) |
| 10 to 14 Years | 500 (8.1%) | 284 (4.2%) |
| 15 to 19 Years | 730 (11.8%) | 808 (12.0%) |
| 20 to 24 Years | 846 (13.7%) | 662 (9.8%) |
| 25 to 29 Years | 454 (7.3%) | 366 (5.4%) |
| 30 to 34 Years | 253 (4.1%) | 203 (3.0%) |
| 35 to 39 Years | 257 (4.2%) | 401 (5.9%) |
| 40 to 44 Years | 384 (6.2%) | 491 (7.3%) |
| 45 to 49 Years | 293 (4.7%) | 417 (6.2%) |
| 50 to 54 Years | 316 (5.1%) | 376 (5.6%) |
| 55 to 59 Years | 449 (7.2%) | 381 (5.7%) |
| 60 to 64 Years | 299 (4.8%) | 397 (5.9%) |
| 65 to 69 Years | 172 (2.8%) | 258 (3.8%) |
| 70 to 74 Years | 345 (5.6%) | 437 (6.5%) |
| 75 to 79 Years | 109 (1.8%) | 257 (3.8%) |
| 80 to 84 Years | 54 (0.9%) | 186 (2.8%) |
| 85 Years and over | 120 (1.9%) | 169 (2.5%) |
| Total | 6,194 (100.0%) | 6,735 (100.0%) |
Families and Households in Meadville
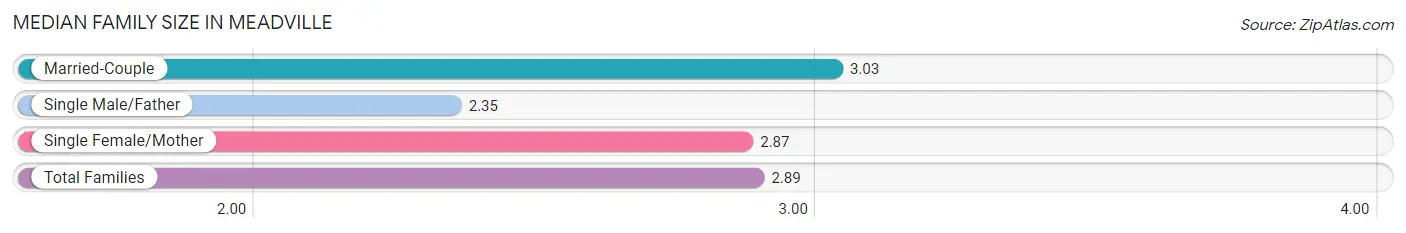
Median Family Size in Meadville
The median family size in Meadville is 2.89 persons per family, with married-couple families (1,551 | 54.2%) accounting for the largest median family size of 3.03 persons per family. On the other hand, single male/father families (344 | 12.0%) represent the smallest median family size with 2.35 persons per family.
| Family Type | # Families | Family Size |
| Married-Couple | 1,551 (54.2%) | 3.03 |
| Single Male/Father | 344 (12.0%) | 2.35 |
| Single Female/Mother | 967 (33.8%) | 2.87 |
| Total Families | 2,862 (100.0%) | 2.89 |
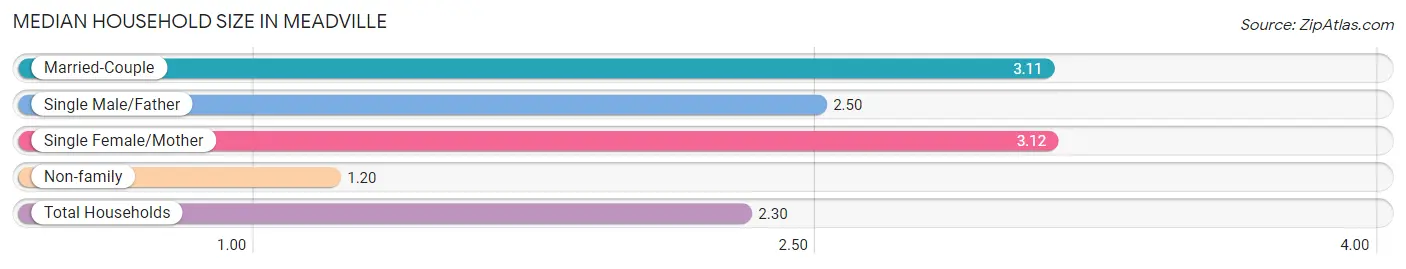
Median Household Size in Meadville
The median household size in Meadville is 2.30 persons per household, with single female/mother households (967 | 20.1%) accounting for the largest median household size of 3.12 persons per household. non-family households (1,950 | 40.5%) represent the smallest median household size with 1.20 persons per household.
| Household Type | # Households | Household Size |
| Married-Couple | 1,551 (32.2%) | 3.11 |
| Single Male/Father | 344 (7.1%) | 2.50 |
| Single Female/Mother | 967 (20.1%) | 3.12 |
| Non-family | 1,950 (40.5%) | 1.20 |
| Total Households | 4,812 (100.0%) | 2.30 |
Household Size by Marriage Status in Meadville
Out of a total of 4,812 households in Meadville, 2,862 (59.5%) are family households, while 1,950 (40.5%) are nonfamily households. The most numerous type of family households are 2-person households, comprising 1,240, and the most common type of nonfamily households are 1-person households, comprising 1,628.
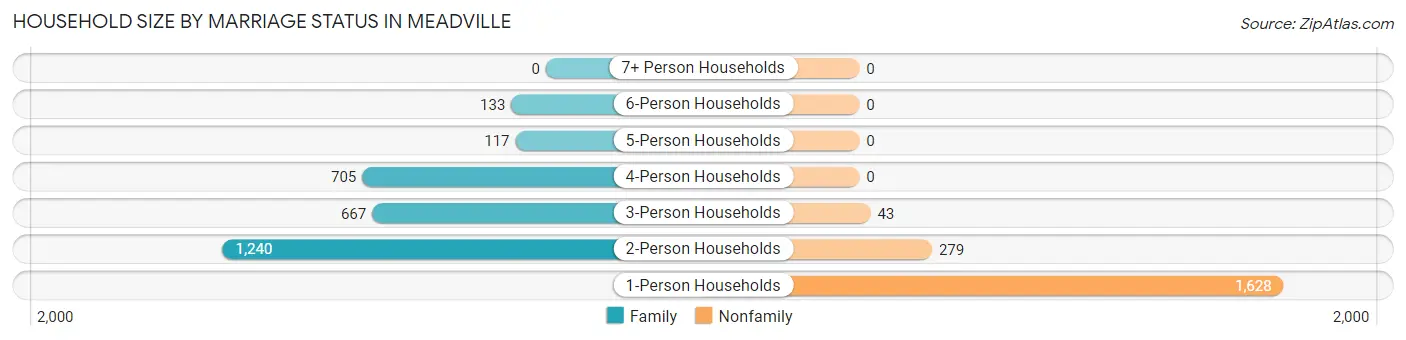
| Household Size | Family Households | Nonfamily Households |
| 1-Person Households | - | 1,628 (33.8%) |
| 2-Person Households | 1,240 (25.8%) | 279 (5.8%) |
| 3-Person Households | 667 (13.9%) | 43 (0.9%) |
| 4-Person Households | 705 (14.6%) | 0 (0.0%) |
| 5-Person Households | 117 (2.4%) | 0 (0.0%) |
| 6-Person Households | 133 (2.8%) | 0 (0.0%) |
| 7+ Person Households | 0 (0.0%) | 0 (0.0%) |
| Total | 2,862 (59.5%) | 1,950 (40.5%) |
Female Fertility in Meadville
Fertility by Age in Meadville
Average fertility rate in Meadville is 68.0 births per 1,000 women. Women in the age bracket of 20 to 34 years have the highest fertility rate with 122.0 births per 1,000 women. Women in the age bracket of 20 to 34 years acount for 65.8% of all women with births.
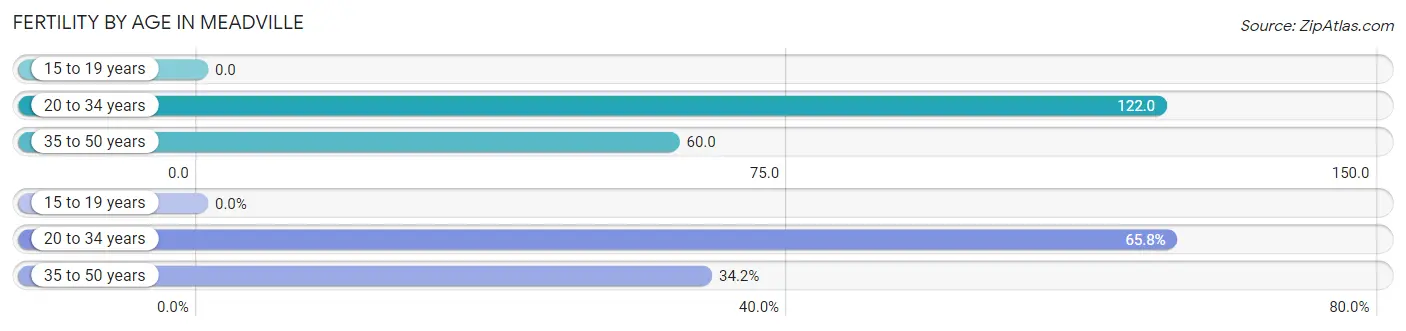
| Age Bracket | Women with Births | Births / 1,000 Women |
| 15 to 19 years | 0 (0.0%) | 0.0 |
| 20 to 34 years | 150 (65.8%) | 122.0 |
| 35 to 50 years | 78 (34.2%) | 60.0 |
| Total | 228 (100.0%) | 68.0 |
Fertility by Age by Marriage Status in Meadville
46.1% of women with births (228) in Meadville are married. The highest percentage of unmarried women with births falls into 20 to 34 years age bracket with 64.0% of them unmarried at the time of birth, while the lowest percentage of unmarried women with births belong to 35 to 50 years age bracket with 34.6% of them unmarried.
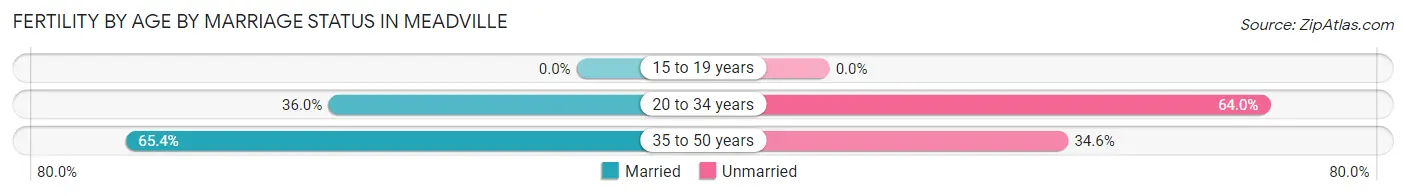
| Age Bracket | Married | Unmarried |
| 15 to 19 years | 0 (0.0%) | 0 (0.0%) |
| 20 to 34 years | 54 (36.0%) | 96 (64.0%) |
| 35 to 50 years | 51 (65.4%) | 27 (34.6%) |
| Total | 105 (46.1%) | 123 (53.9%) |
Fertility by Education in Meadville
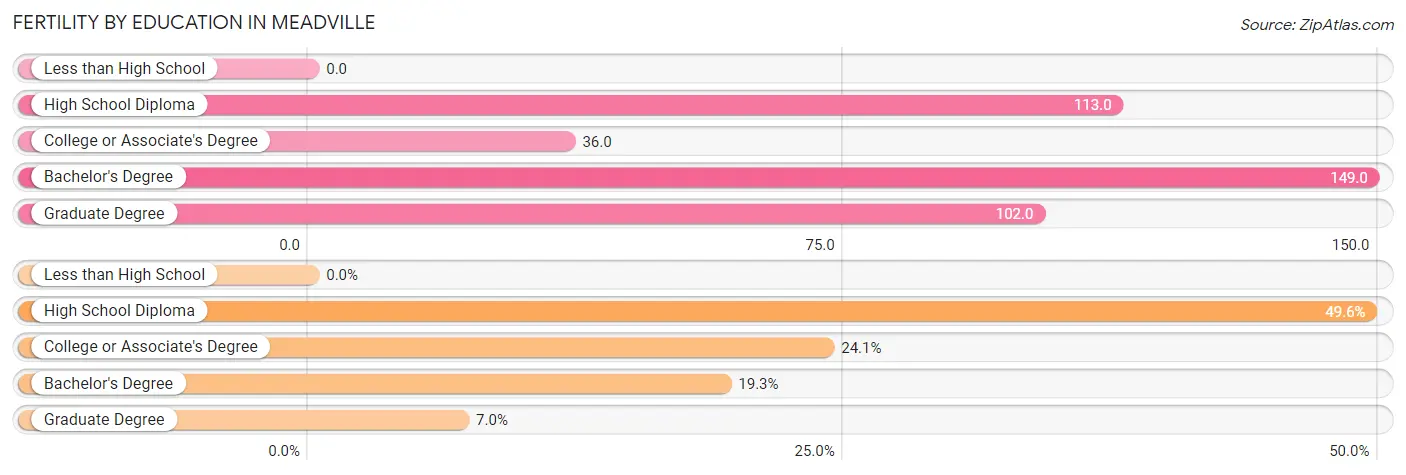
| Educational Attainment | Women with Births | Births / 1,000 Women |
| Less than High School | 0 (0.0%) | 0.0 |
| High School Diploma | 113 (49.6%) | 113.0 |
| College or Associate's Degree | 55 (24.1%) | 36.0 |
| Bachelor's Degree | 44 (19.3%) | 149.0 |
| Graduate Degree | 16 (7.0%) | 102.0 |
| Total | 228 (100.0%) | 68.0 |
Fertility by Education by Marriage Status in Meadville
53.9% of women with births in Meadville are unmarried. Women with the educational attainment of graduate degree are most likely to be married with 100.0% of them married at childbirth, while women with the educational attainment of high school diploma are least likely to be married with 66.4% of them unmarried at childbirth.
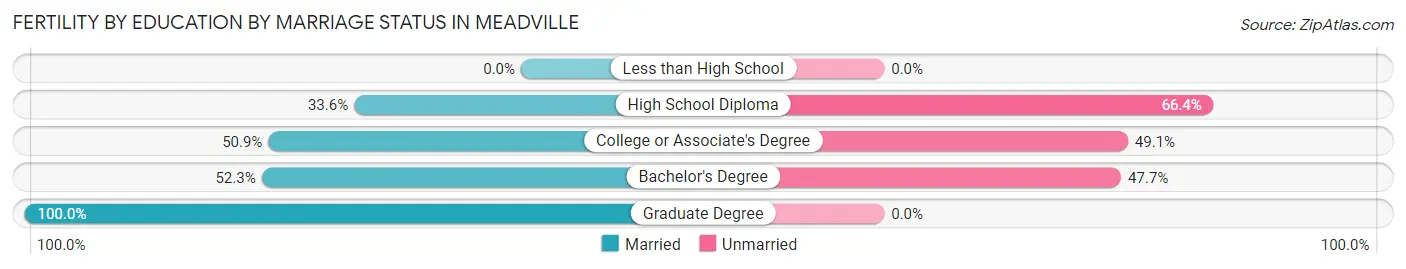
| Educational Attainment | Married | Unmarried |
| Less than High School | 0 (0.0%) | 0 (0.0%) |
| High School Diploma | 38 (33.6%) | 75 (66.4%) |
| College or Associate's Degree | 28 (50.9%) | 27 (49.1%) |
| Bachelor's Degree | 23 (52.3%) | 21 (47.7%) |
| Graduate Degree | 16 (100.0%) | 0 (0.0%) |
| Total | 105 (46.1%) | 123 (53.9%) |
Employment Characteristics in Meadville
Employment by Class of Employer in Meadville
Among the 5,439 employed individuals in Meadville, private company employees (3,418 | 62.8%), not-for-profit organizations (1,109 | 20.4%), and local government employees (304 | 5.6%) make up the most common classes of employment.
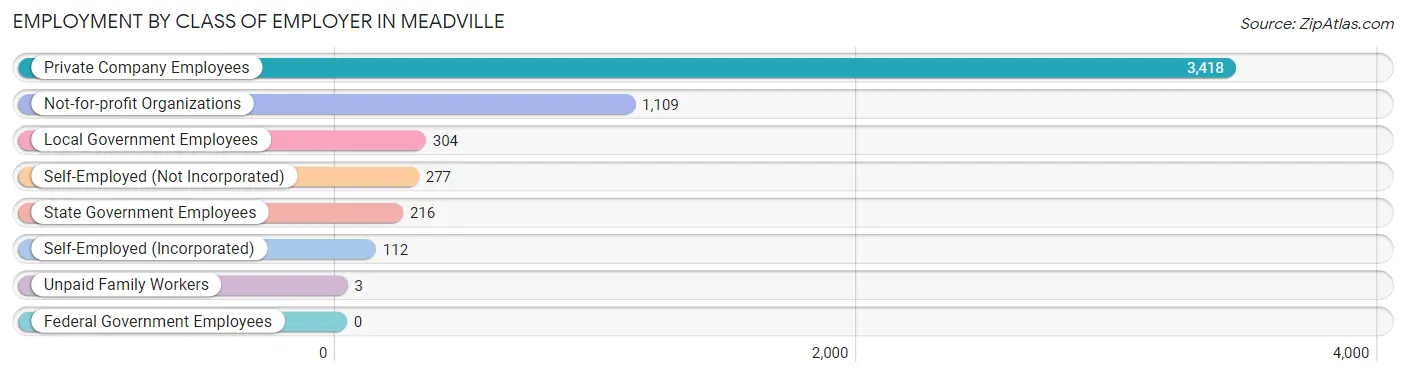
| Employer Class | # Employees | % Employees |
| Private Company Employees | 3,418 | 62.8% |
| Self-Employed (Incorporated) | 112 | 2.1% |
| Self-Employed (Not Incorporated) | 277 | 5.1% |
| Not-for-profit Organizations | 1,109 | 20.4% |
| Local Government Employees | 304 | 5.6% |
| State Government Employees | 216 | 4.0% |
| Federal Government Employees | 0 | 0.0% |
| Unpaid Family Workers | 3 | 0.1% |
| Total | 5,439 | 100.0% |
Employment Status by Age in Meadville
According to the labor force statistics for Meadville, out of the total population over 16 years of age (10,796), 55.3% or 5,970 individuals are in the labor force, with 6.9% or 412 of them unemployed. The age group with the highest labor force participation rate is 25 to 29 years, with 84.3% or 691 individuals in the labor force. Within the labor force, the 25 to 29 years age range has the highest percentage of unemployed individuals, with 12.6% or 87 of them being unemployed.
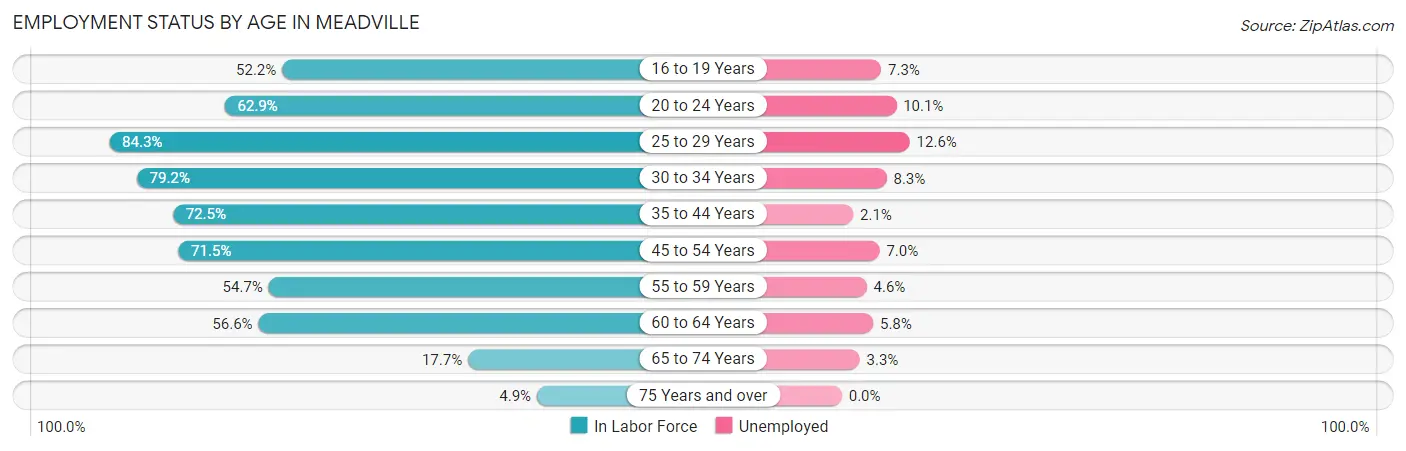
| Age Bracket | In Labor Force | Unemployed |
| 16 to 19 Years | 754 (52.2%) | 55 (7.3%) |
| 20 to 24 Years | 949 (62.9%) | 96 (10.1%) |
| 25 to 29 Years | 691 (84.3%) | 87 (12.6%) |
| 30 to 34 Years | 361 (79.2%) | 30 (8.3%) |
| 35 to 44 Years | 1,111 (72.5%) | 23 (2.1%) |
| 45 to 54 Years | 1,002 (71.5%) | 70 (7.0%) |
| 55 to 59 Years | 454 (54.7%) | 21 (4.6%) |
| 60 to 64 Years | 394 (56.6%) | 23 (5.8%) |
| 65 to 74 Years | 215 (17.7%) | 7 (3.3%) |
| 75 Years and over | 44 (4.9%) | 0 (0.0%) |
| Total | 5,970 (55.3%) | 412 (6.9%) |
Employment Status by Educational Attainment in Meadville
According to labor force statistics for Meadville, 70.0% of individuals (4,016) out of the total population between 25 and 64 years of age (5,737) are in the labor force, with 6.3% or 253 of them being unemployed. The group with the highest labor force participation rate are those with the educational attainment of bachelor's degree or higher, with 81.3% or 1,207 individuals in the labor force. Within the labor force, individuals with less than high school education have the highest percentage of unemployment, with 14.1% or 27 of them being unemployed.
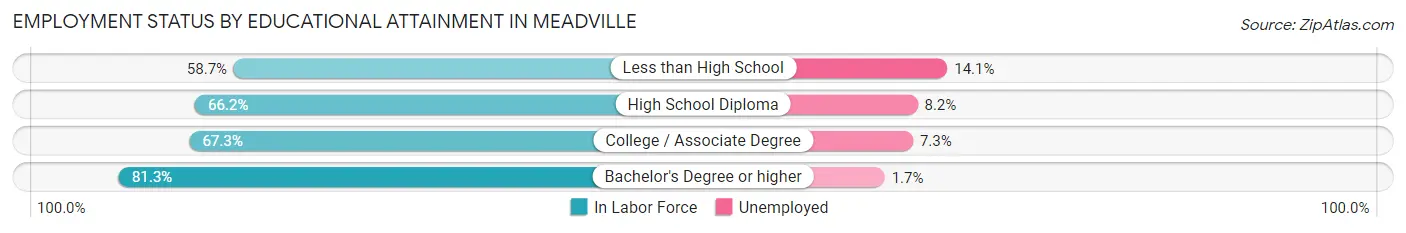
| Educational Attainment | In Labor Force | Unemployed |
| Less than High School | 192 (58.7%) | 46 (14.1%) |
| High School Diploma | 1,618 (66.2%) | 200 (8.2%) |
| College / Associate Degree | 997 (67.3%) | 108 (7.3%) |
| Bachelor's Degree or higher | 1,207 (81.3%) | 25 (1.7%) |
| Total | 4,016 (70.0%) | 361 (6.3%) |
Employment Occupations by Sex in Meadville
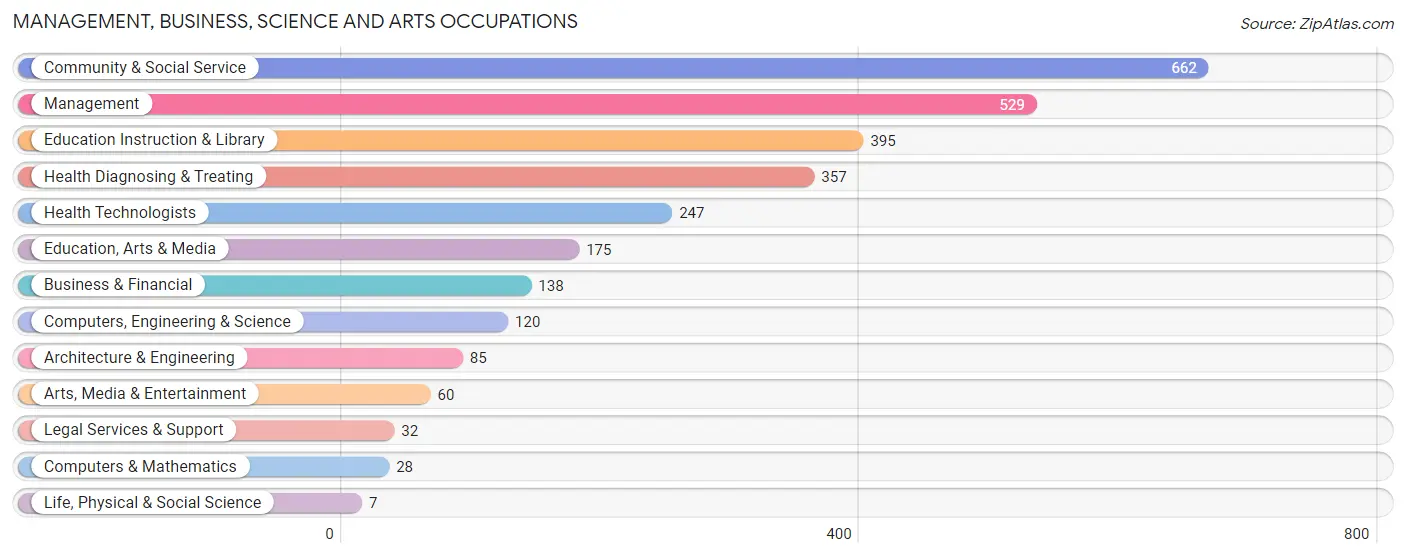
Management, Business, Science and Arts Occupations
The most common Management, Business, Science and Arts occupations in Meadville are Community & Social Service (662 | 11.9%), Management (529 | 9.5%), Education Instruction & Library (395 | 7.1%), Health Diagnosing & Treating (357 | 6.4%), and Health Technologists (247 | 4.4%).
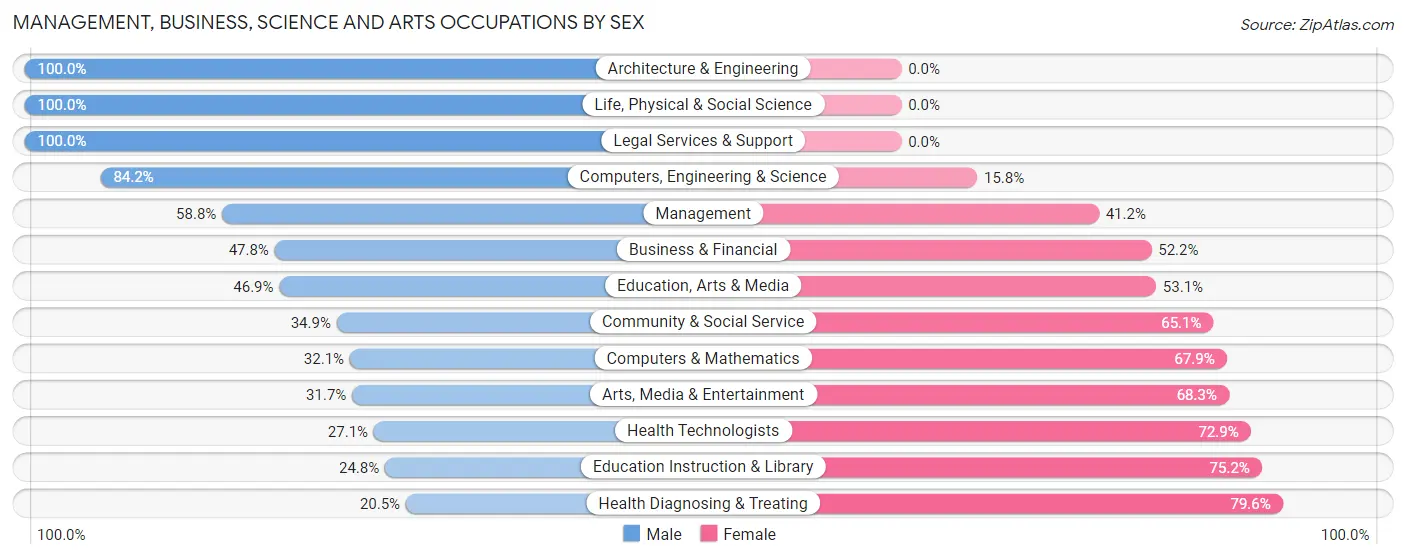
Management, Business, Science and Arts Occupations by Sex
Within the Management, Business, Science and Arts occupations in Meadville, the most male-oriented occupations are Architecture & Engineering (100.0%), Life, Physical & Social Science (100.0%), and Legal Services & Support (100.0%), while the most female-oriented occupations are Health Diagnosing & Treating (79.5%), Education Instruction & Library (75.2%), and Health Technologists (72.9%).
| Occupation | Male | Female |
| Management | 311 (58.8%) | 218 (41.2%) |
| Business & Financial | 66 (47.8%) | 72 (52.2%) |
| Computers, Engineering & Science | 101 (84.2%) | 19 (15.8%) |
| Computers & Mathematics | 9 (32.1%) | 19 (67.9%) |
| Architecture & Engineering | 85 (100.0%) | 0 (0.0%) |
| Life, Physical & Social Science | 7 (100.0%) | 0 (0.0%) |
| Community & Social Service | 231 (34.9%) | 431 (65.1%) |
| Education, Arts & Media | 82 (46.9%) | 93 (53.1%) |
| Legal Services & Support | 32 (100.0%) | 0 (0.0%) |
| Education Instruction & Library | 98 (24.8%) | 297 (75.2%) |
| Arts, Media & Entertainment | 19 (31.7%) | 41 (68.3%) |
| Health Diagnosing & Treating | 73 (20.4%) | 284 (79.5%) |
| Health Technologists | 67 (27.1%) | 180 (72.9%) |
| Total (Category) | 782 (43.3%) | 1,024 (56.7%) |
| Total (Overall) | 2,564 (46.1%) | 2,999 (53.9%) |
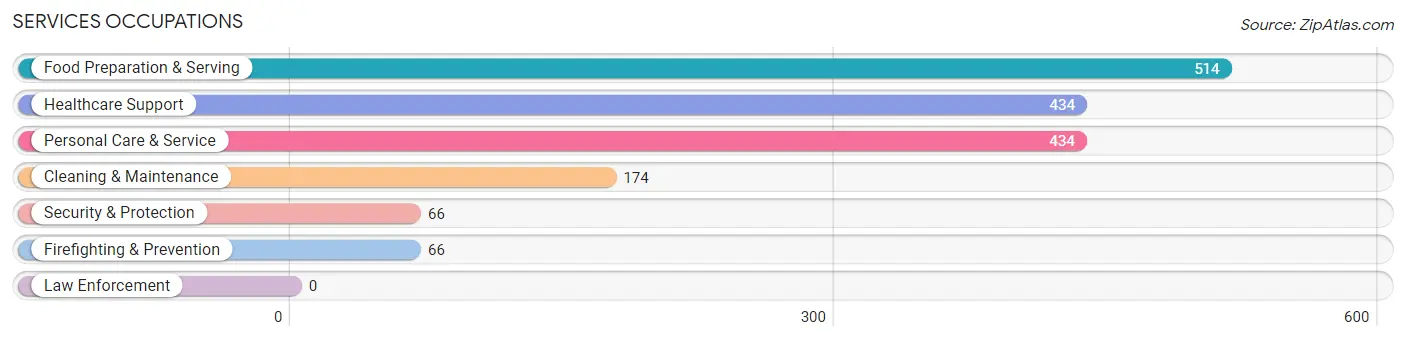
Services Occupations
The most common Services occupations in Meadville are Food Preparation & Serving (514 | 9.2%), Healthcare Support (434 | 7.8%), Personal Care & Service (434 | 7.8%), Cleaning & Maintenance (174 | 3.1%), and Security & Protection (66 | 1.2%).
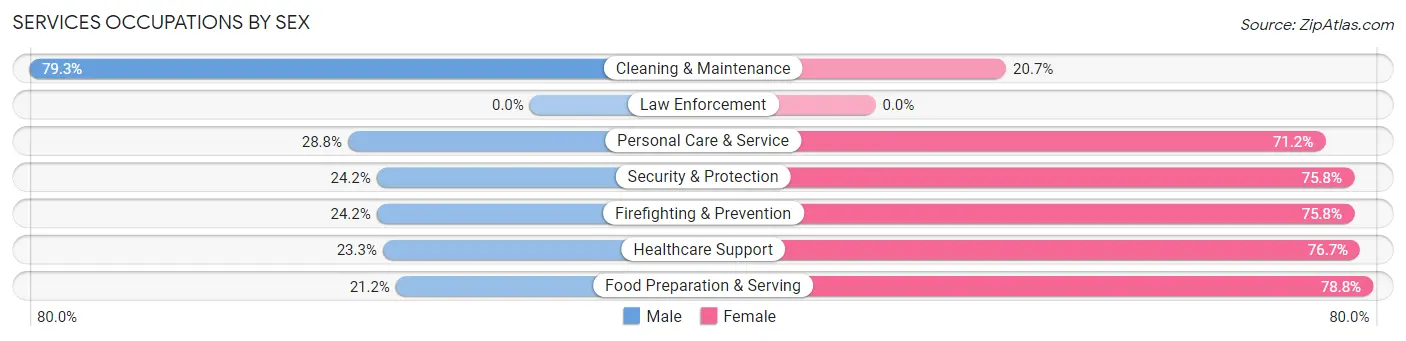
Services Occupations by Sex
Within the Services occupations in Meadville, the most male-oriented occupations are Cleaning & Maintenance (79.3%), Personal Care & Service (28.8%), and Security & Protection (24.2%), while the most female-oriented occupations are Food Preparation & Serving (78.8%), Healthcare Support (76.7%), and Security & Protection (75.8%).
| Occupation | Male | Female |
| Healthcare Support | 101 (23.3%) | 333 (76.7%) |
| Security & Protection | 16 (24.2%) | 50 (75.8%) |
| Firefighting & Prevention | 16 (24.2%) | 50 (75.8%) |
| Law Enforcement | 0 (0.0%) | 0 (0.0%) |
| Food Preparation & Serving | 109 (21.2%) | 405 (78.8%) |
| Cleaning & Maintenance | 138 (79.3%) | 36 (20.7%) |
| Personal Care & Service | 125 (28.8%) | 309 (71.2%) |
| Total (Category) | 489 (30.1%) | 1,133 (69.9%) |
| Total (Overall) | 2,564 (46.1%) | 2,999 (53.9%) |
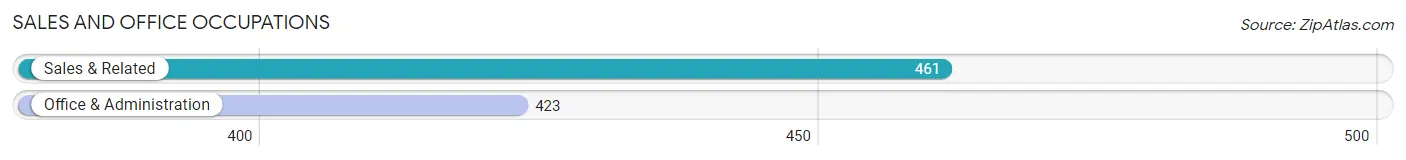
Sales and Office Occupations
The most common Sales and Office occupations in Meadville are Sales & Related (461 | 8.3%), and Office & Administration (423 | 7.6%).
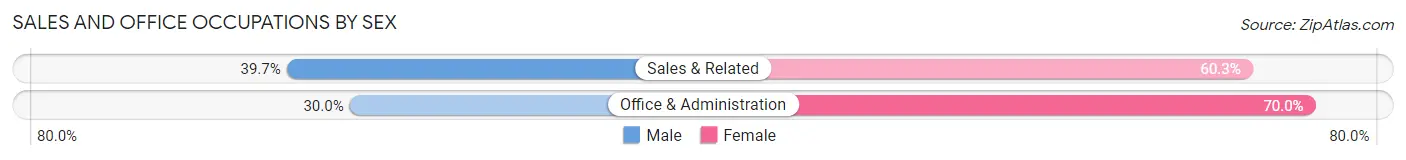
Sales and Office Occupations by Sex
| Occupation | Male | Female |
| Sales & Related | 183 (39.7%) | 278 (60.3%) |
| Office & Administration | 127 (30.0%) | 296 (70.0%) |
| Total (Category) | 310 (35.1%) | 574 (64.9%) |
| Total (Overall) | 2,564 (46.1%) | 2,999 (53.9%) |
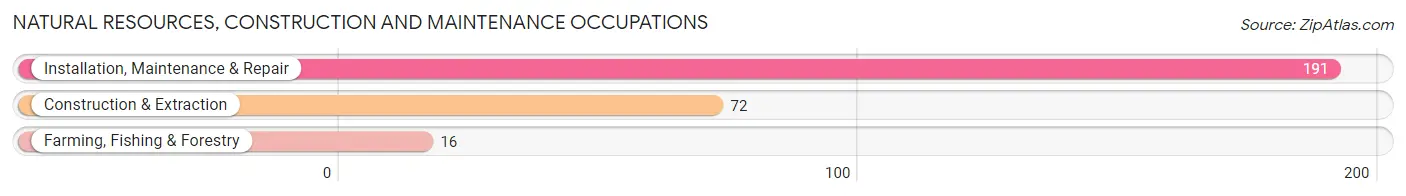
Natural Resources, Construction and Maintenance Occupations
The most common Natural Resources, Construction and Maintenance occupations in Meadville are Installation, Maintenance & Repair (191 | 3.4%), Construction & Extraction (72 | 1.3%), and Farming, Fishing & Forestry (16 | 0.3%).
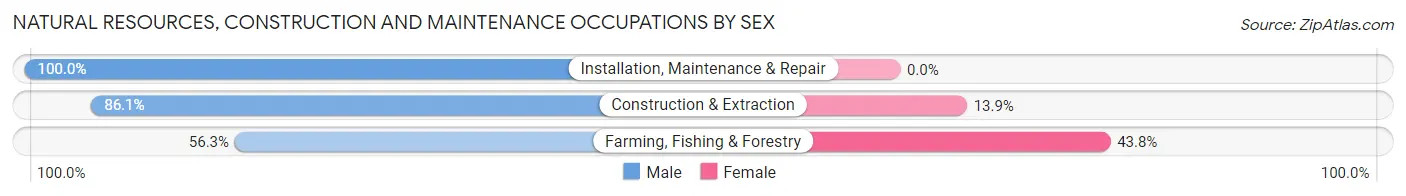
Natural Resources, Construction and Maintenance Occupations by Sex
| Occupation | Male | Female |
| Farming, Fishing & Forestry | 9 (56.2%) | 7 (43.8%) |
| Construction & Extraction | 62 (86.1%) | 10 (13.9%) |
| Installation, Maintenance & Repair | 191 (100.0%) | 0 (0.0%) |
| Total (Category) | 262 (93.9%) | 17 (6.1%) |
| Total (Overall) | 2,564 (46.1%) | 2,999 (53.9%) |
Production, Transportation and Moving Occupations
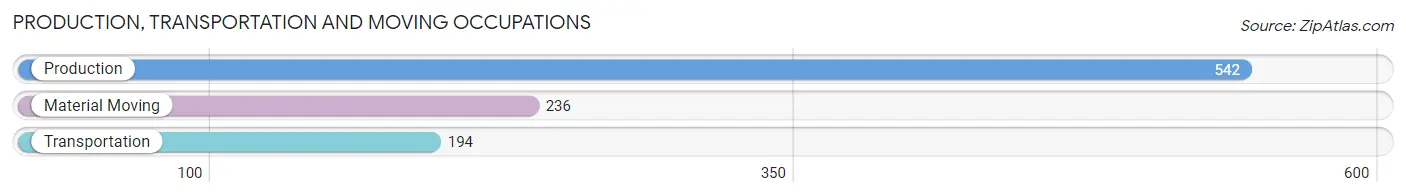
The most common Production, Transportation and Moving occupations in Meadville are Production (542 | 9.7%), Material Moving (236 | 4.2%), and Transportation (194 | 3.5%).
Production, Transportation and Moving Occupations by Sex
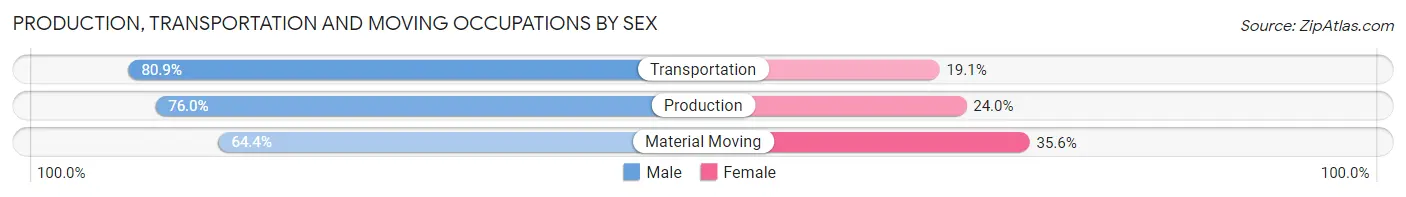
| Occupation | Male | Female |
| Production | 412 (76.0%) | 130 (24.0%) |
| Transportation | 157 (80.9%) | 37 (19.1%) |
| Material Moving | 152 (64.4%) | 84 (35.6%) |
| Total (Category) | 721 (74.2%) | 251 (25.8%) |
| Total (Overall) | 2,564 (46.1%) | 2,999 (53.9%) |
Employment Industries by Sex in Meadville
Employment Industries in Meadville
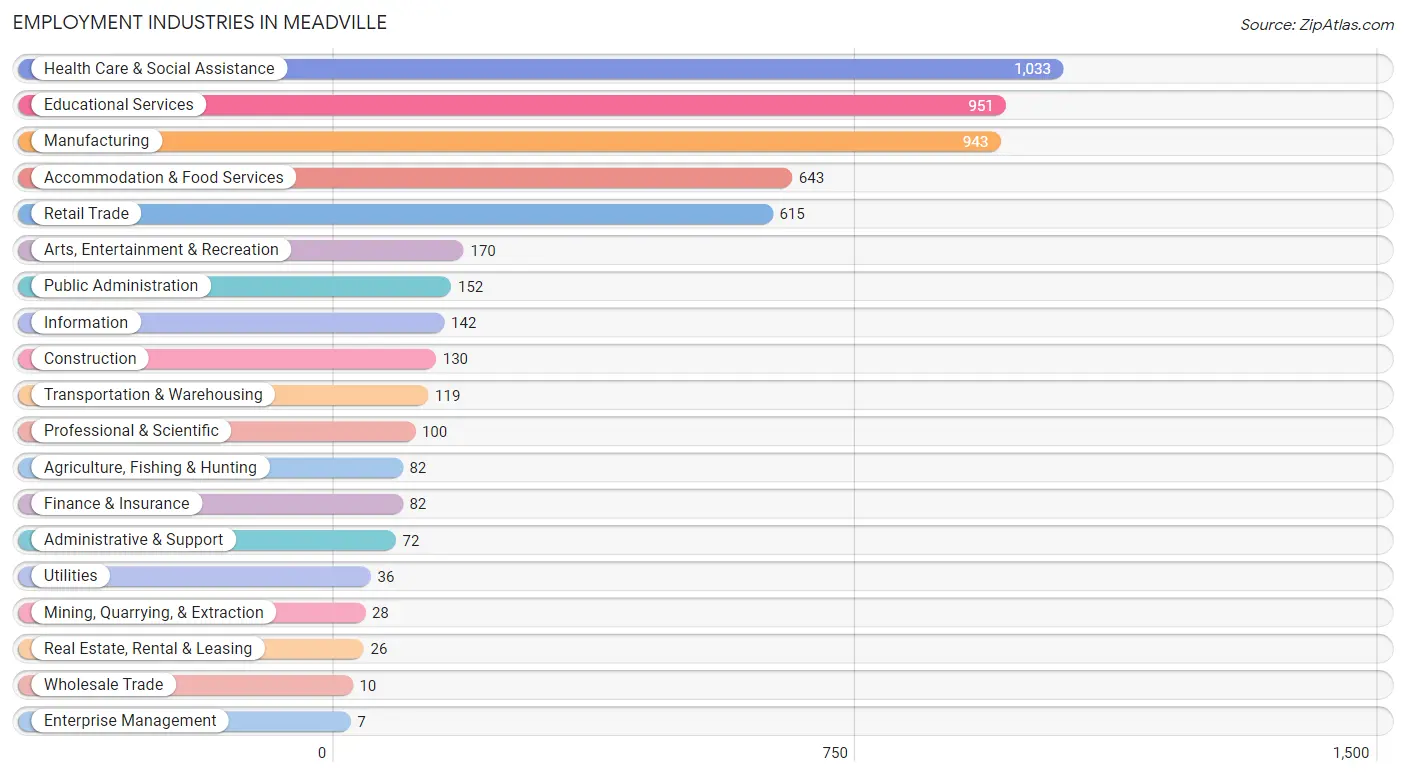
The major employment industries in Meadville include Health Care & Social Assistance (1,033 | 18.6%), Educational Services (951 | 17.1%), Manufacturing (943 | 17.0%), Accommodation & Food Services (643 | 11.6%), and Retail Trade (615 | 11.1%).
Employment Industries by Sex in Meadville
The Meadville industries that see more men than women are Mining, Quarrying, & Extraction (100.0%), Wholesale Trade (100.0%), and Utilities (100.0%), whereas the industries that tend to have a higher number of women are Enterprise Management (100.0%), Finance & Insurance (89.0%), and Information (86.6%).
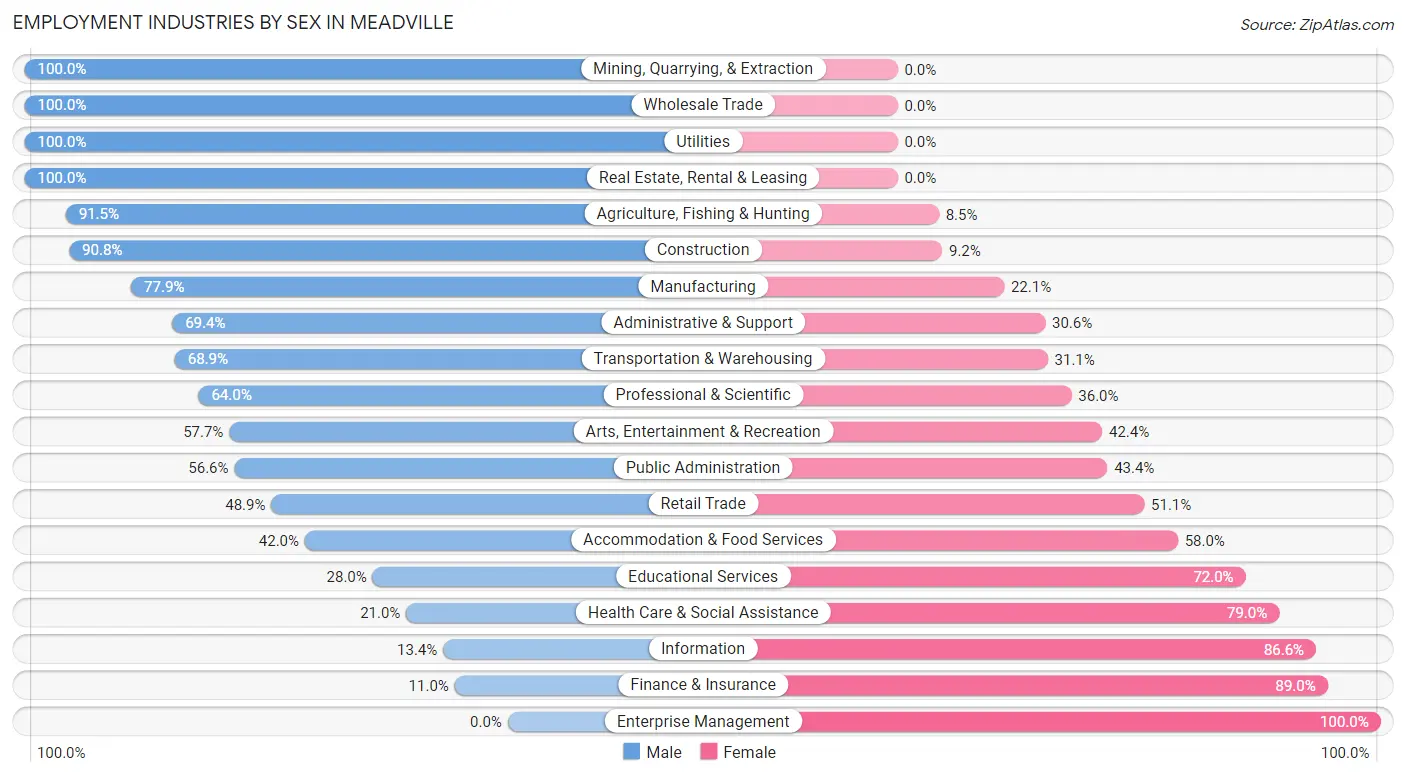
| Industry | Male | Female |
| Agriculture, Fishing & Hunting | 75 (91.5%) | 7 (8.5%) |
| Mining, Quarrying, & Extraction | 28 (100.0%) | 0 (0.0%) |
| Construction | 118 (90.8%) | 12 (9.2%) |
| Manufacturing | 735 (77.9%) | 208 (22.1%) |
| Wholesale Trade | 10 (100.0%) | 0 (0.0%) |
| Retail Trade | 301 (48.9%) | 314 (51.1%) |
| Transportation & Warehousing | 82 (68.9%) | 37 (31.1%) |
| Utilities | 36 (100.0%) | 0 (0.0%) |
| Information | 19 (13.4%) | 123 (86.6%) |
| Finance & Insurance | 9 (11.0%) | 73 (89.0%) |
| Real Estate, Rental & Leasing | 26 (100.0%) | 0 (0.0%) |
| Professional & Scientific | 64 (64.0%) | 36 (36.0%) |
| Enterprise Management | 0 (0.0%) | 7 (100.0%) |
| Administrative & Support | 50 (69.4%) | 22 (30.6%) |
| Educational Services | 266 (28.0%) | 685 (72.0%) |
| Health Care & Social Assistance | 217 (21.0%) | 816 (79.0%) |
| Arts, Entertainment & Recreation | 98 (57.7%) | 72 (42.3%) |
| Accommodation & Food Services | 270 (42.0%) | 373 (58.0%) |
| Public Administration | 86 (56.6%) | 66 (43.4%) |
| Total | 2,564 (46.1%) | 2,999 (53.9%) |
Education in Meadville
School Enrollment in Meadville
The most common levels of schooling among the 3,879 students in Meadville are college / undergraduate (1,896 | 48.9%), elementary school (675 | 17.4%), and middle school (582 | 15.0%).
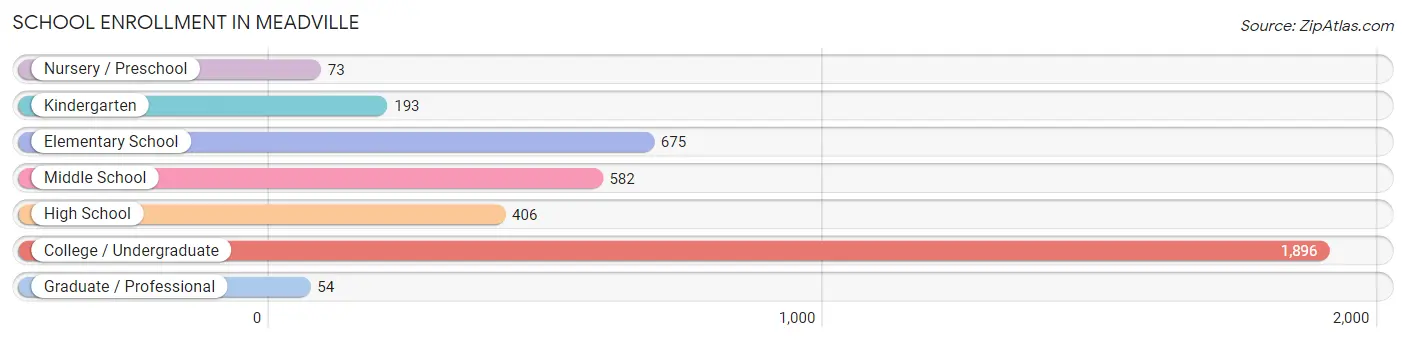
| School Level | # Students | % Students |
| Nursery / Preschool | 73 | 1.9% |
| Kindergarten | 193 | 5.0% |
| Elementary School | 675 | 17.4% |
| Middle School | 582 | 15.0% |
| High School | 406 | 10.5% |
| College / Undergraduate | 1,896 | 48.9% |
| Graduate / Professional | 54 | 1.4% |
| Total | 3,879 | 100.0% |
School Enrollment by Age by Funding Source in Meadville
Out of a total of 3,879 students who are enrolled in schools in Meadville, 2,110 (54.4%) attend a private institution, while the remaining 1,769 (45.6%) are enrolled in public schools. The age group of 20 to 24 year olds has the highest likelihood of being enrolled in private schools, with 851 (95.5% in the age bracket) enrolled. Conversely, the age group of 3 to 4 year olds has the lowest likelihood of being enrolled in a private school, with 53 (100.0% in the age bracket) attending a public institution.
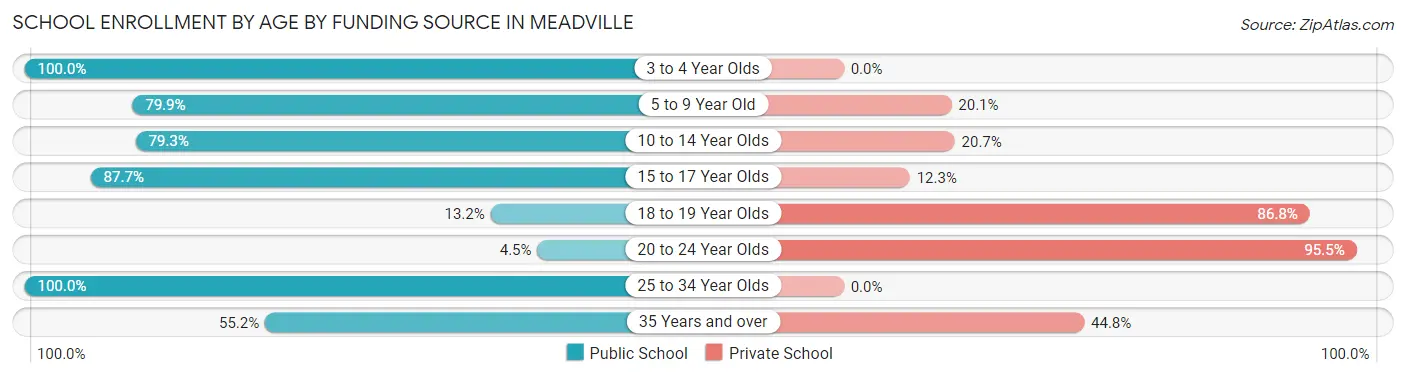
| Age Bracket | Public School | Private School |
| 3 to 4 Year Olds | 53 (100.0%) | 0 (0.0%) |
| 5 to 9 Year Old | 562 (79.9%) | 141 (20.1%) |
| 10 to 14 Year Olds | 622 (79.3%) | 162 (20.7%) |
| 15 to 17 Year Olds | 285 (87.7%) | 40 (12.3%) |
| 18 to 19 Year Olds | 135 (13.2%) | 887 (86.8%) |
| 20 to 24 Year Olds | 40 (4.5%) | 851 (95.5%) |
| 25 to 34 Year Olds | 34 (100.0%) | 0 (0.0%) |
| 35 Years and over | 37 (55.2%) | 30 (44.8%) |
| Total | 1,769 (45.6%) | 2,110 (54.4%) |
Educational Attainment by Field of Study in Meadville
Education (396 | 19.2%), business (377 | 18.3%), social sciences (263 | 12.7%), science & technology (231 | 11.2%), and communications (138 | 6.7%) are the most common fields of study among 2,064 individuals in Meadville who have obtained a bachelor's degree or higher.
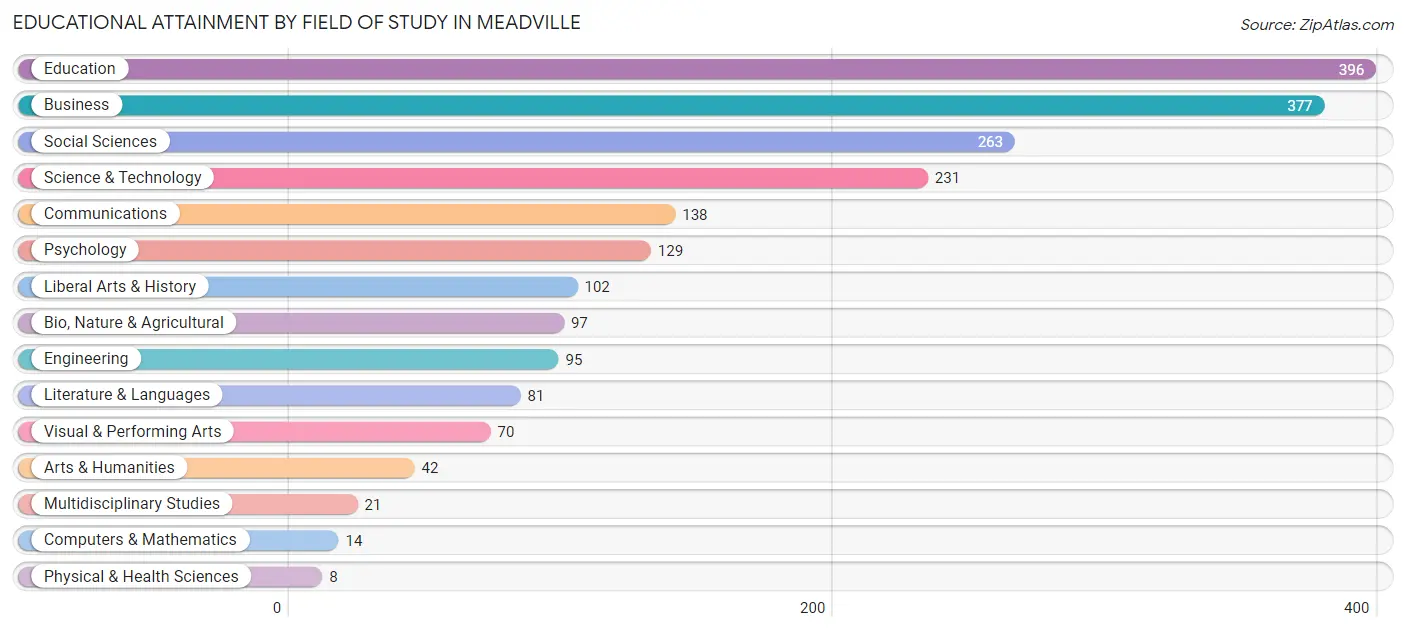
| Field of Study | # Graduates | % Graduates |
| Computers & Mathematics | 14 | 0.7% |
| Bio, Nature & Agricultural | 97 | 4.7% |
| Physical & Health Sciences | 8 | 0.4% |
| Psychology | 129 | 6.2% |
| Social Sciences | 263 | 12.7% |
| Engineering | 95 | 4.6% |
| Multidisciplinary Studies | 21 | 1.0% |
| Science & Technology | 231 | 11.2% |
| Business | 377 | 18.3% |
| Education | 396 | 19.2% |
| Literature & Languages | 81 | 3.9% |
| Liberal Arts & History | 102 | 4.9% |
| Visual & Performing Arts | 70 | 3.4% |
| Communications | 138 | 6.7% |
| Arts & Humanities | 42 | 2.0% |
| Total | 2,064 | 100.0% |
Transportation & Commute in Meadville
Vehicle Availability by Sex in Meadville
The most prevalent vehicle ownership categories in Meadville are males with 2 vehicles (1,236, accounting for 53.3%) and females with 2 vehicles (1,223, making up 52.5%).
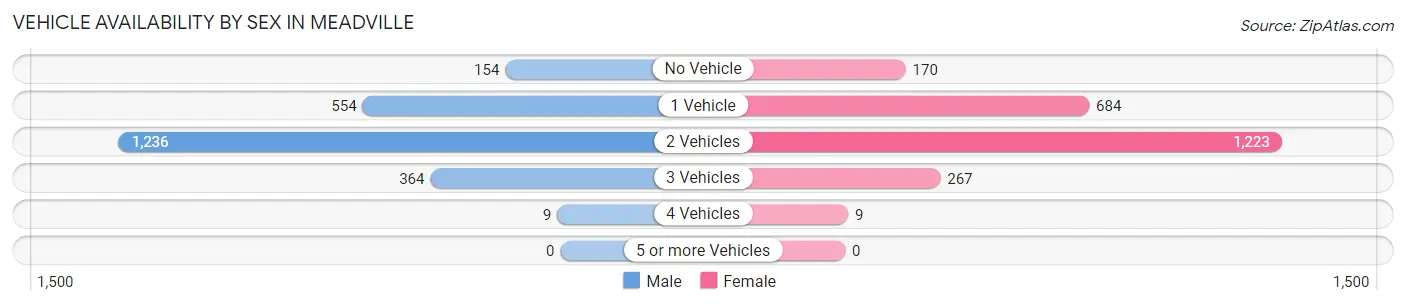
| Vehicles Available | Male | Female |
| No Vehicle | 154 (6.7%) | 170 (7.2%) |
| 1 Vehicle | 554 (23.9%) | 684 (29.1%) |
| 2 Vehicles | 1,236 (53.3%) | 1,223 (52.0%) |
| 3 Vehicles | 364 (15.7%) | 267 (11.4%) |
| 4 Vehicles | 9 (0.4%) | 9 (0.4%) |
| 5 or more Vehicles | 0 (0.0%) | 0 (0.0%) |
| Total | 2,317 (100.0%) | 2,353 (100.0%) |
Commute Time in Meadville
The most frequently occuring commute durations in Meadville are 5 to 9 minutes (1,693 commuters, 34.6%), 10 to 14 minutes (1,164 commuters, 23.8%), and 15 to 19 minutes (702 commuters, 14.3%).
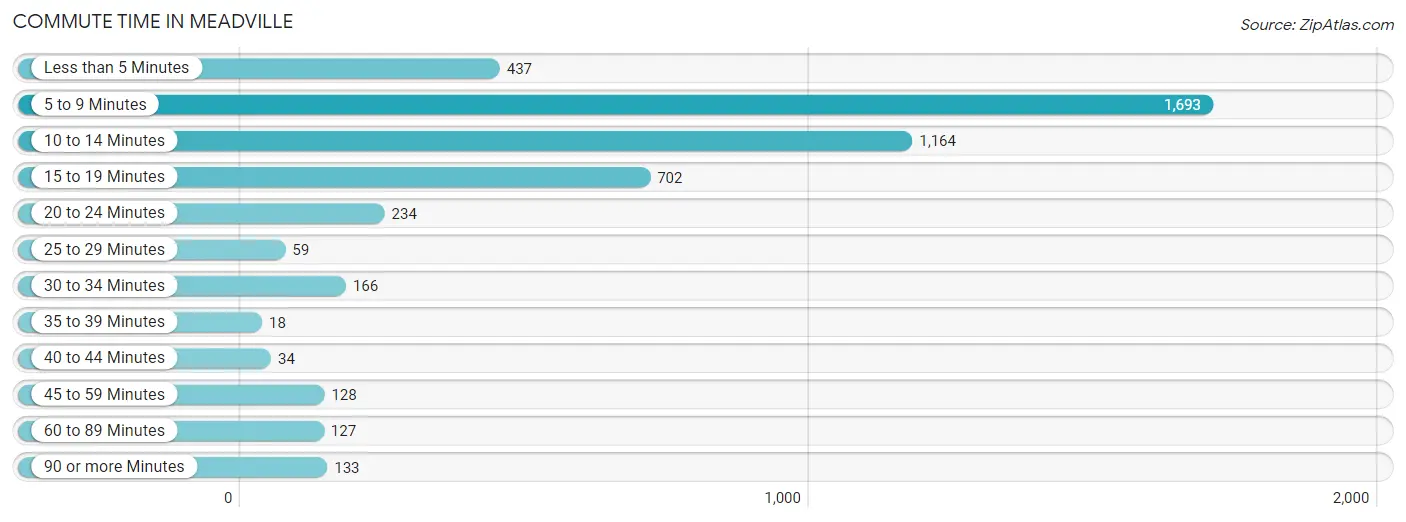
| Commute Time | # Commuters | % Commuters |
| Less than 5 Minutes | 437 | 8.9% |
| 5 to 9 Minutes | 1,693 | 34.6% |
| 10 to 14 Minutes | 1,164 | 23.8% |
| 15 to 19 Minutes | 702 | 14.3% |
| 20 to 24 Minutes | 234 | 4.8% |
| 25 to 29 Minutes | 59 | 1.2% |
| 30 to 34 Minutes | 166 | 3.4% |
| 35 to 39 Minutes | 18 | 0.4% |
| 40 to 44 Minutes | 34 | 0.7% |
| 45 to 59 Minutes | 128 | 2.6% |
| 60 to 89 Minutes | 127 | 2.6% |
| 90 or more Minutes | 133 | 2.7% |
Commute Time by Sex in Meadville
The most common commute times in Meadville are 5 to 9 minutes (865 commuters, 37.1%) for males and 5 to 9 minutes (828 commuters, 32.3%) for females.
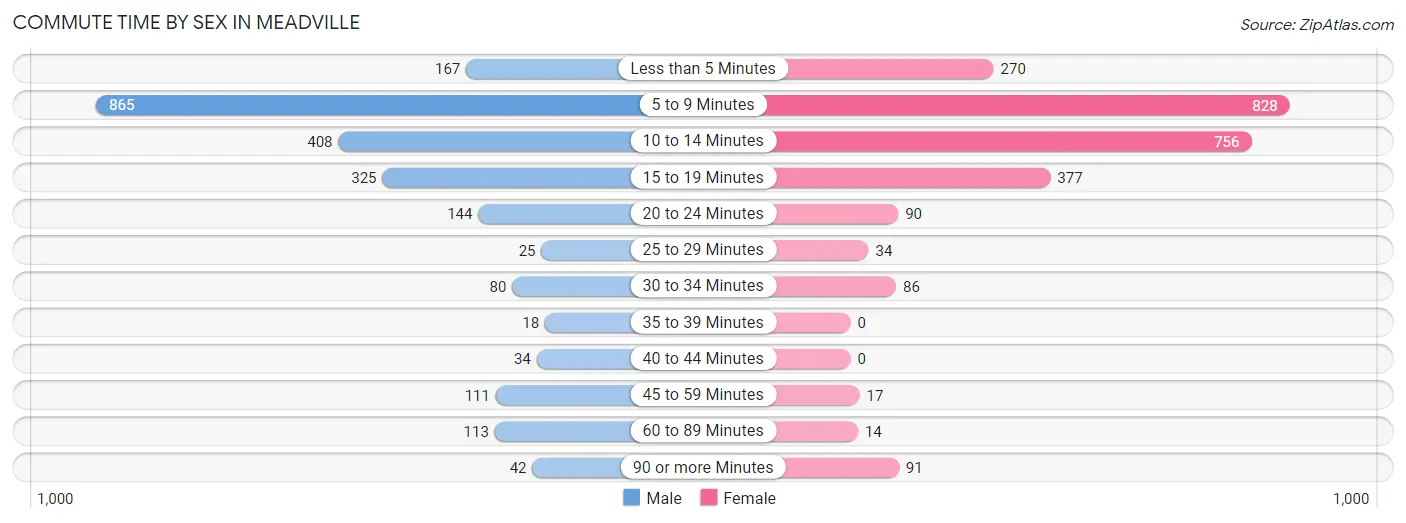
| Commute Time | Male | Female |
| Less than 5 Minutes | 167 (7.2%) | 270 (10.5%) |
| 5 to 9 Minutes | 865 (37.1%) | 828 (32.3%) |
| 10 to 14 Minutes | 408 (17.5%) | 756 (29.5%) |
| 15 to 19 Minutes | 325 (13.9%) | 377 (14.7%) |
| 20 to 24 Minutes | 144 (6.2%) | 90 (3.5%) |
| 25 to 29 Minutes | 25 (1.1%) | 34 (1.3%) |
| 30 to 34 Minutes | 80 (3.4%) | 86 (3.4%) |
| 35 to 39 Minutes | 18 (0.8%) | 0 (0.0%) |
| 40 to 44 Minutes | 34 (1.5%) | 0 (0.0%) |
| 45 to 59 Minutes | 111 (4.8%) | 17 (0.7%) |
| 60 to 89 Minutes | 113 (4.9%) | 14 (0.5%) |
| 90 or more Minutes | 42 (1.8%) | 91 (3.5%) |
Time of Departure to Work by Sex in Meadville
The most frequent times of departure to work in Meadville are 12:00 PM to 3:59 PM (444, 19.0%) for males and 12:00 PM to 3:59 PM (392, 15.3%) for females.
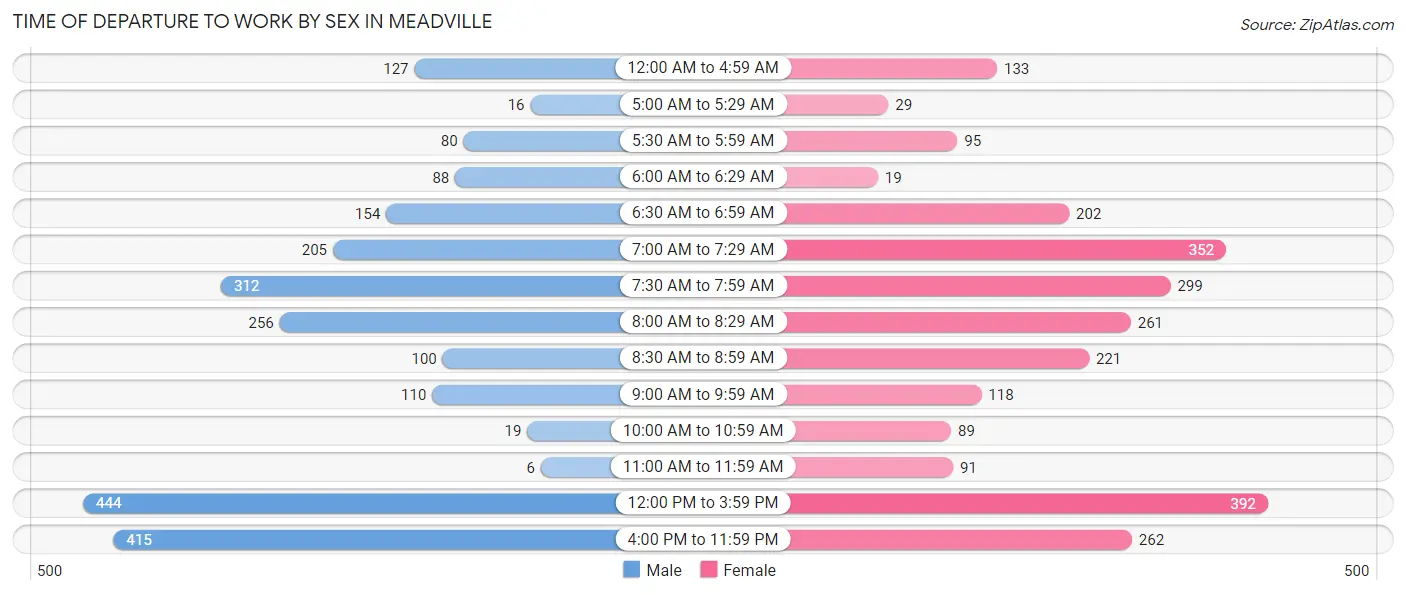
| Time of Departure | Male | Female |
| 12:00 AM to 4:59 AM | 127 (5.4%) | 133 (5.2%) |
| 5:00 AM to 5:29 AM | 16 (0.7%) | 29 (1.1%) |
| 5:30 AM to 5:59 AM | 80 (3.4%) | 95 (3.7%) |
| 6:00 AM to 6:29 AM | 88 (3.8%) | 19 (0.7%) |
| 6:30 AM to 6:59 AM | 154 (6.6%) | 202 (7.9%) |
| 7:00 AM to 7:29 AM | 205 (8.8%) | 352 (13.7%) |
| 7:30 AM to 7:59 AM | 312 (13.4%) | 299 (11.7%) |
| 8:00 AM to 8:29 AM | 256 (11.0%) | 261 (10.2%) |
| 8:30 AM to 8:59 AM | 100 (4.3%) | 221 (8.6%) |
| 9:00 AM to 9:59 AM | 110 (4.7%) | 118 (4.6%) |
| 10:00 AM to 10:59 AM | 19 (0.8%) | 89 (3.5%) |
| 11:00 AM to 11:59 AM | 6 (0.3%) | 91 (3.5%) |
| 12:00 PM to 3:59 PM | 444 (19.0%) | 392 (15.3%) |
| 4:00 PM to 11:59 PM | 415 (17.8%) | 262 (10.2%) |
| Total | 2,332 (100.0%) | 2,563 (100.0%) |
Housing Occupancy in Meadville
Occupancy by Ownership in Meadville
Of the total 4,812 dwellings in Meadville, owner-occupied units account for 1,698 (35.3%), while renter-occupied units make up 3,114 (64.7%).
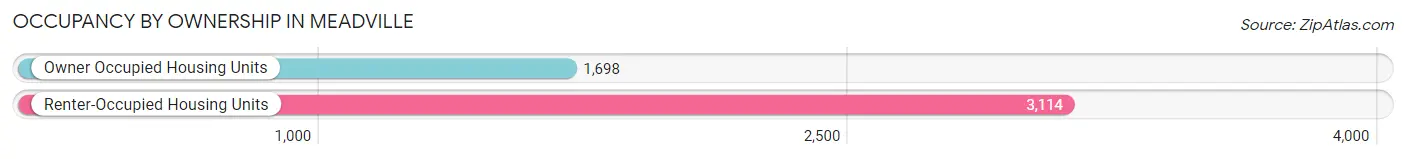
| Occupancy | # Housing Units | % Housing Units |
| Owner Occupied Housing Units | 1,698 | 35.3% |
| Renter-Occupied Housing Units | 3,114 | 64.7% |
| Total Occupied Housing Units | 4,812 | 100.0% |
Occupancy by Household Size in Meadville
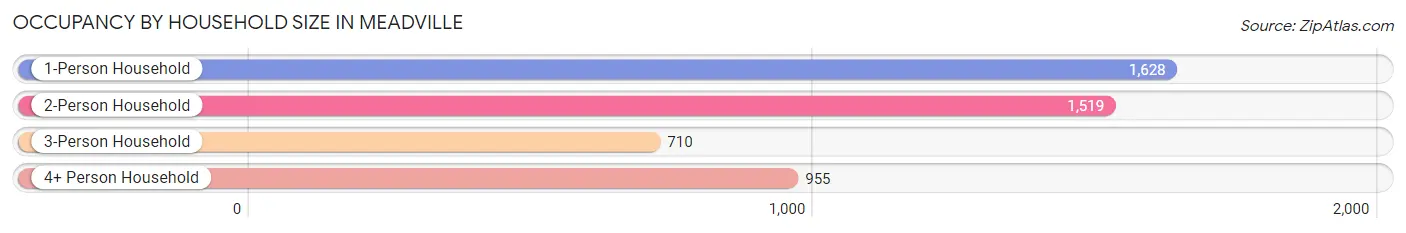
| Household Size | # Housing Units | % Housing Units |
| 1-Person Household | 1,628 | 33.8% |
| 2-Person Household | 1,519 | 31.6% |
| 3-Person Household | 710 | 14.7% |
| 4+ Person Household | 955 | 19.9% |
| Total Housing Units | 4,812 | 100.0% |
Occupancy by Ownership by Household Size in Meadville
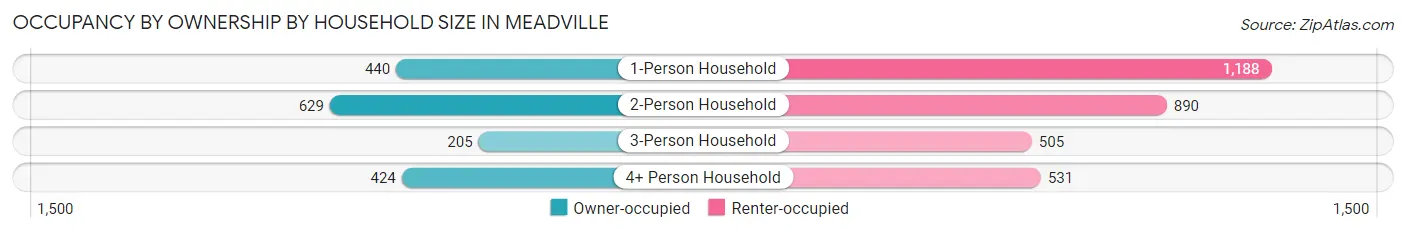
| Household Size | Owner-occupied | Renter-occupied |
| 1-Person Household | 440 (27.0%) | 1,188 (73.0%) |
| 2-Person Household | 629 (41.4%) | 890 (58.6%) |
| 3-Person Household | 205 (28.9%) | 505 (71.1%) |
| 4+ Person Household | 424 (44.4%) | 531 (55.6%) |
| Total Housing Units | 1,698 (35.3%) | 3,114 (64.7%) |
Occupancy by Educational Attainment in Meadville
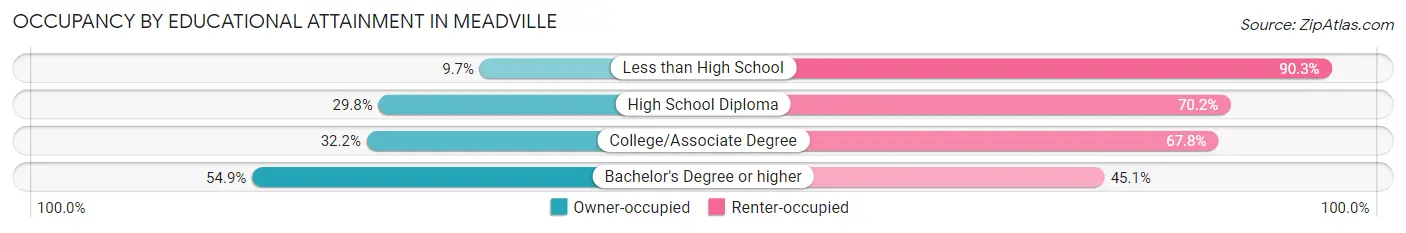
| Household Size | Owner-occupied | Renter-occupied |
| Less than High School | 37 (9.7%) | 343 (90.3%) |
| High School Diploma | 561 (29.8%) | 1,320 (70.2%) |
| College/Associate Degree | 425 (32.2%) | 896 (67.8%) |
| Bachelor's Degree or higher | 675 (54.9%) | 555 (45.1%) |
Occupancy by Age of Householder in Meadville
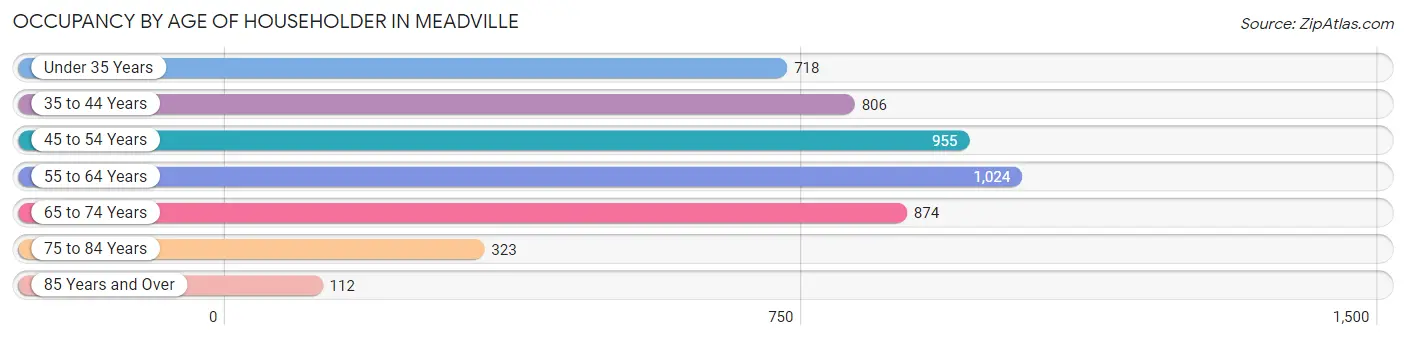
| Age Bracket | # Households | % Households |
| Under 35 Years | 718 | 14.9% |
| 35 to 44 Years | 806 | 16.8% |
| 45 to 54 Years | 955 | 19.9% |
| 55 to 64 Years | 1,024 | 21.3% |
| 65 to 74 Years | 874 | 18.2% |
| 75 to 84 Years | 323 | 6.7% |
| 85 Years and Over | 112 | 2.3% |
| Total | 4,812 | 100.0% |
Housing Finances in Meadville
Median Income by Occupancy in Meadville
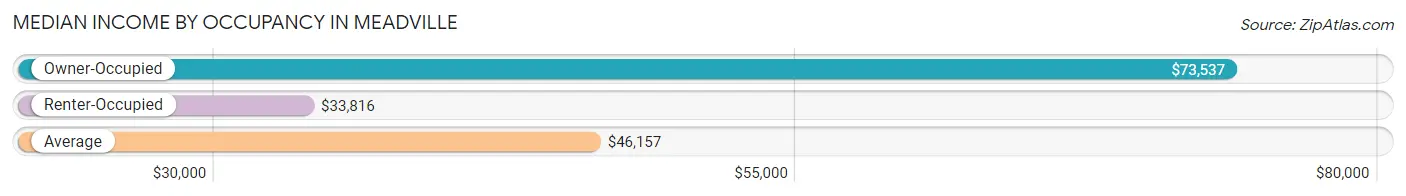
| Occupancy Type | # Households | Median Income |
| Owner-Occupied | 1,698 (35.3%) | $73,537 |
| Renter-Occupied | 3,114 (64.7%) | $33,816 |
| Average | 4,812 (100.0%) | $46,157 |
Occupancy by Householder Income Bracket in Meadville
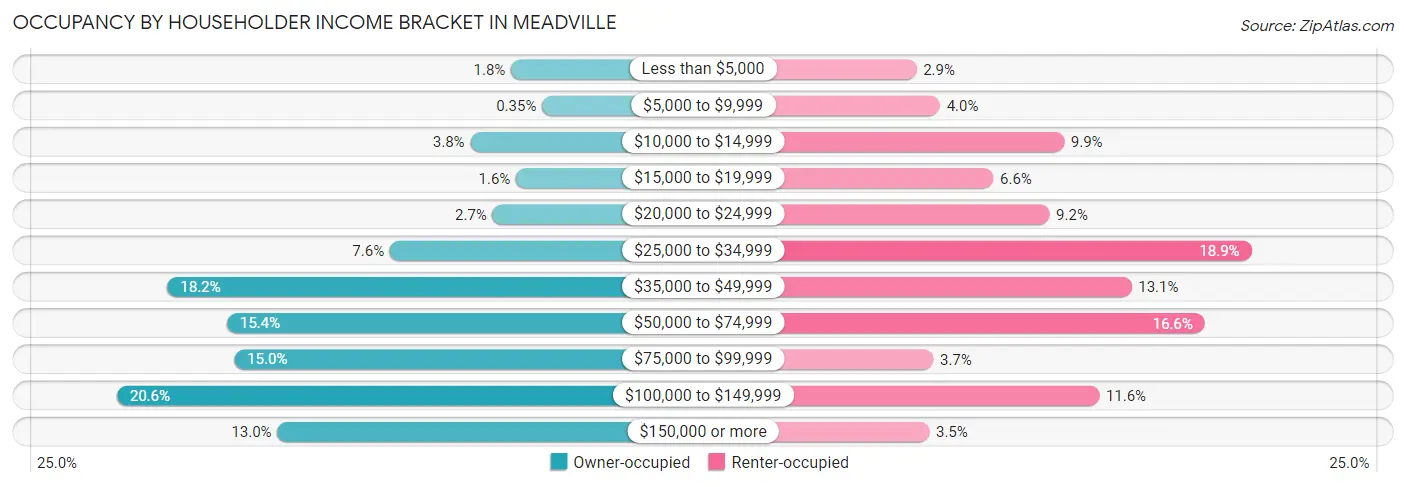
| Income Bracket | Owner-occupied | Renter-occupied |
| Less than $5,000 | 31 (1.8%) | 90 (2.9%) |
| $5,000 to $9,999 | 6 (0.4%) | 125 (4.0%) |
| $10,000 to $14,999 | 64 (3.8%) | 309 (9.9%) |
| $15,000 to $19,999 | 27 (1.6%) | 204 (6.6%) |
| $20,000 to $24,999 | 46 (2.7%) | 287 (9.2%) |
| $25,000 to $34,999 | 129 (7.6%) | 587 (18.9%) |
| $35,000 to $49,999 | 309 (18.2%) | 409 (13.1%) |
| $50,000 to $74,999 | 261 (15.4%) | 518 (16.6%) |
| $75,000 to $99,999 | 255 (15.0%) | 115 (3.7%) |
| $100,000 to $149,999 | 350 (20.6%) | 361 (11.6%) |
| $150,000 or more | 220 (13.0%) | 109 (3.5%) |
| Total | 1,698 (100.0%) | 3,114 (100.0%) |
Monthly Housing Cost Tiers in Meadville
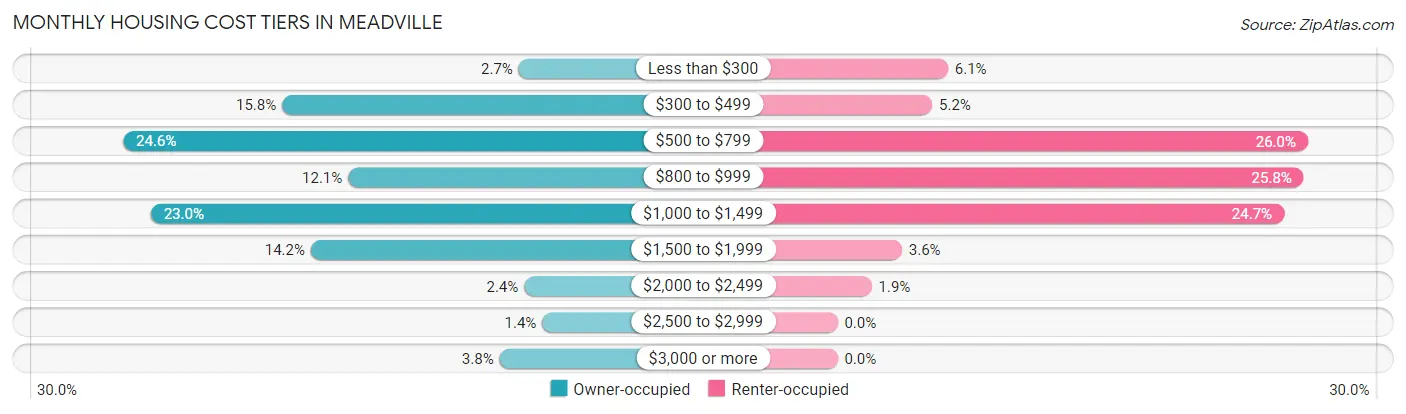
| Monthly Cost | Owner-occupied | Renter-occupied |
| Less than $300 | 46 (2.7%) | 190 (6.1%) |
| $300 to $499 | 268 (15.8%) | 163 (5.2%) |
| $500 to $799 | 417 (24.6%) | 809 (26.0%) |
| $800 to $999 | 206 (12.1%) | 802 (25.8%) |
| $1,000 to $1,499 | 391 (23.0%) | 768 (24.7%) |
| $1,500 to $1,999 | 241 (14.2%) | 111 (3.6%) |
| $2,000 to $2,499 | 41 (2.4%) | 59 (1.9%) |
| $2,500 to $2,999 | 24 (1.4%) | 0 (0.0%) |
| $3,000 or more | 64 (3.8%) | 0 (0.0%) |
| Total | 1,698 (100.0%) | 3,114 (100.0%) |
Physical Housing Characteristics in Meadville
Housing Structures in Meadville
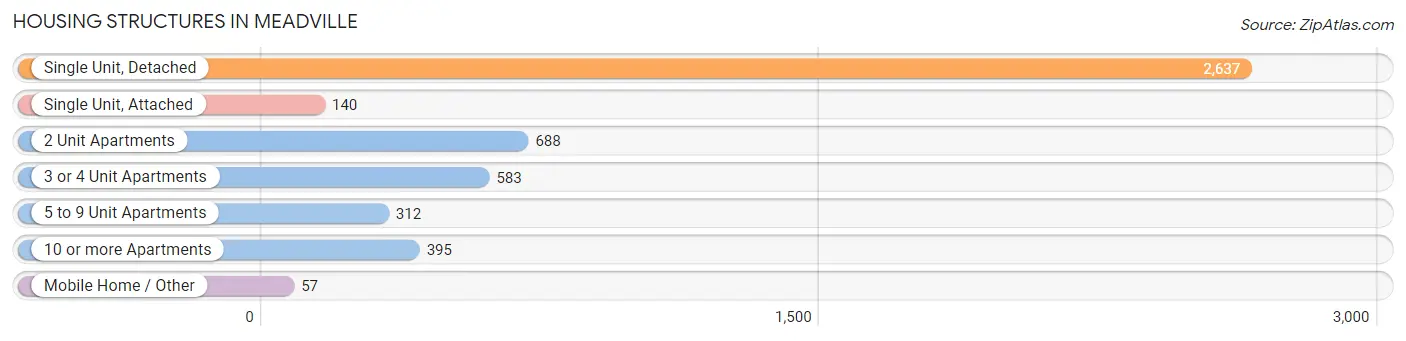
| Structure Type | # Housing Units | % Housing Units |
| Single Unit, Detached | 2,637 | 54.8% |
| Single Unit, Attached | 140 | 2.9% |
| 2 Unit Apartments | 688 | 14.3% |
| 3 or 4 Unit Apartments | 583 | 12.1% |
| 5 to 9 Unit Apartments | 312 | 6.5% |
| 10 or more Apartments | 395 | 8.2% |
| Mobile Home / Other | 57 | 1.2% |
| Total | 4,812 | 100.0% |
Housing Structures by Occupancy in Meadville
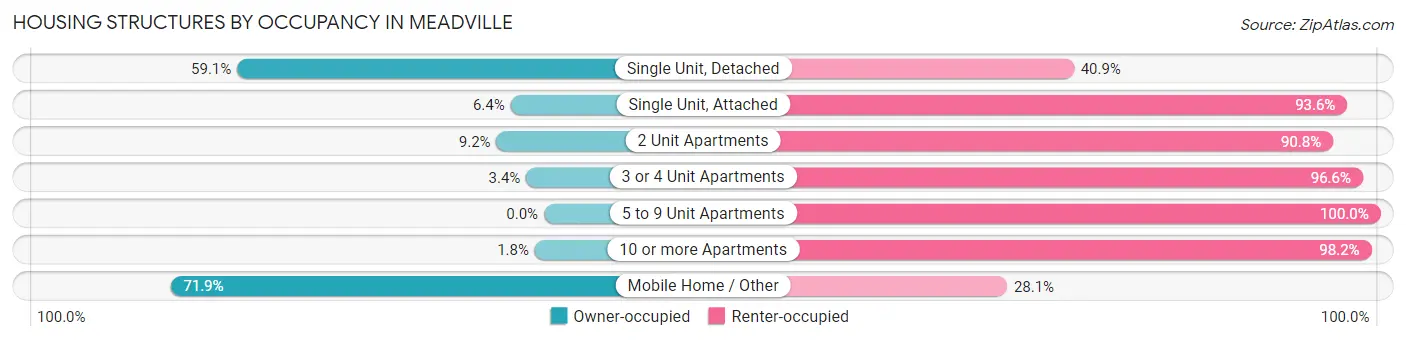
| Structure Type | Owner-occupied | Renter-occupied |
| Single Unit, Detached | 1,558 (59.1%) | 1,079 (40.9%) |
| Single Unit, Attached | 9 (6.4%) | 131 (93.6%) |
| 2 Unit Apartments | 63 (9.2%) | 625 (90.8%) |
| 3 or 4 Unit Apartments | 20 (3.4%) | 563 (96.6%) |
| 5 to 9 Unit Apartments | 0 (0.0%) | 312 (100.0%) |
| 10 or more Apartments | 7 (1.8%) | 388 (98.2%) |
| Mobile Home / Other | 41 (71.9%) | 16 (28.1%) |
| Total | 1,698 (35.3%) | 3,114 (64.7%) |
Housing Structures by Number of Rooms in Meadville
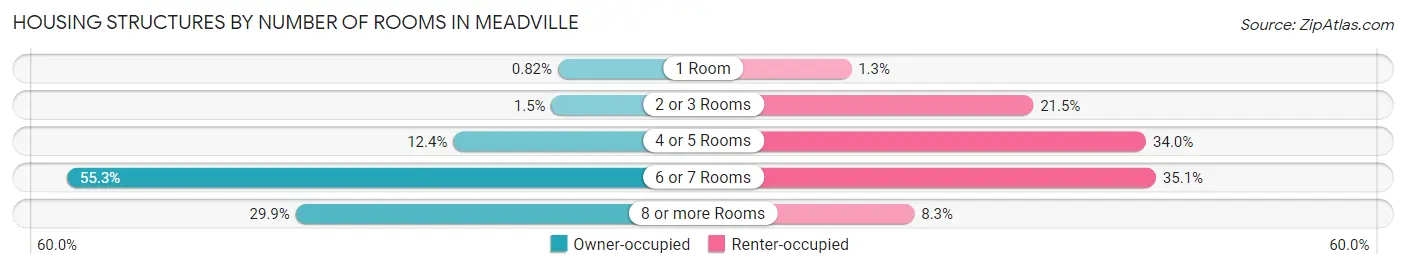
| Number of Rooms | Owner-occupied | Renter-occupied |
| 1 Room | 14 (0.8%) | 39 (1.3%) |
| 2 or 3 Rooms | 26 (1.5%) | 668 (21.4%) |
| 4 or 5 Rooms | 211 (12.4%) | 1,058 (34.0%) |
| 6 or 7 Rooms | 939 (55.3%) | 1,092 (35.1%) |
| 8 or more Rooms | 508 (29.9%) | 257 (8.3%) |
| Total | 1,698 (100.0%) | 3,114 (100.0%) |
Housing Structure by Heating Type in Meadville
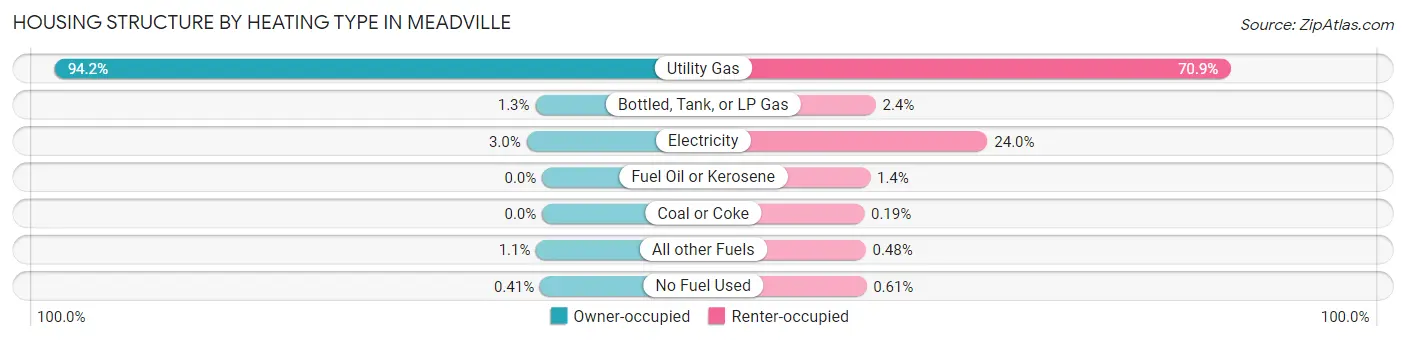
| Heating Type | Owner-occupied | Renter-occupied |
| Utility Gas | 1,599 (94.2%) | 2,209 (70.9%) |
| Bottled, Tank, or LP Gas | 22 (1.3%) | 75 (2.4%) |
| Electricity | 51 (3.0%) | 748 (24.0%) |
| Fuel Oil or Kerosene | 0 (0.0%) | 42 (1.3%) |
| Coal or Coke | 0 (0.0%) | 6 (0.2%) |
| All other Fuels | 19 (1.1%) | 15 (0.5%) |
| No Fuel Used | 7 (0.4%) | 19 (0.6%) |
| Total | 1,698 (100.0%) | 3,114 (100.0%) |
Household Vehicle Usage in Meadville
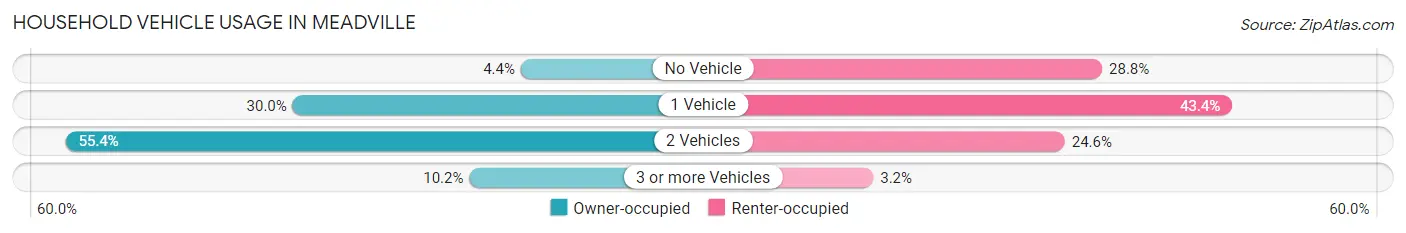
| Vehicles per Household | Owner-occupied | Renter-occupied |
| No Vehicle | 75 (4.4%) | 897 (28.8%) |
| 1 Vehicle | 509 (30.0%) | 1,351 (43.4%) |
| 2 Vehicles | 941 (55.4%) | 767 (24.6%) |
| 3 or more Vehicles | 173 (10.2%) | 99 (3.2%) |
| Total | 1,698 (100.0%) | 3,114 (100.0%) |
Real Estate & Mortgages in Meadville
Real Estate and Mortgage Overview in Meadville
| Characteristic | Without Mortgage | With Mortgage |
| Housing Units | 677 | 1,021 |
| Median Property Value | $101,600 | $148,800 |
| Median Household Income | $53,375 | $117 |
| Monthly Housing Costs | $551 | $64 |
| Real Estate Taxes | $2,696 | $31 |
Property Value by Mortgage Status in Meadville
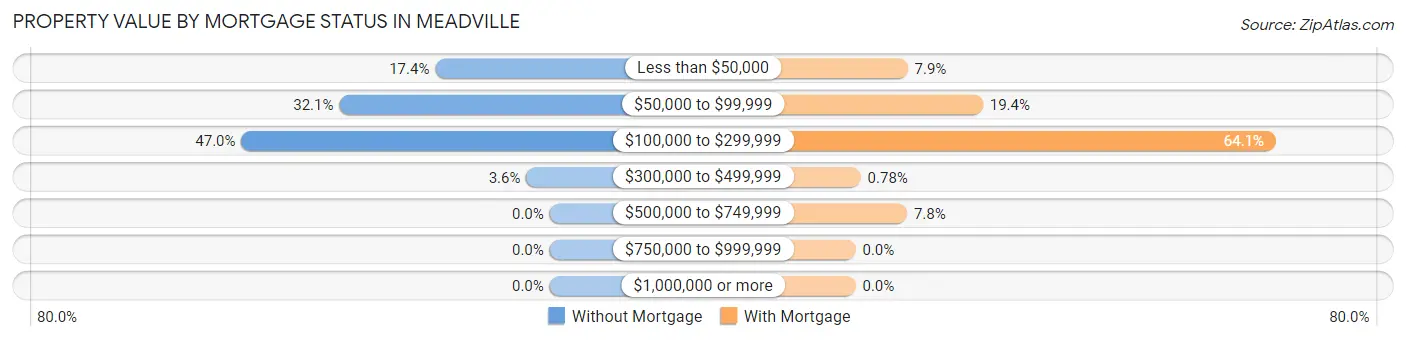
| Property Value | Without Mortgage | With Mortgage |
| Less than $50,000 | 118 (17.4%) | 81 (7.9%) |
| $50,000 to $99,999 | 217 (32.1%) | 198 (19.4%) |
| $100,000 to $299,999 | 318 (47.0%) | 654 (64.0%) |
| $300,000 to $499,999 | 24 (3.5%) | 8 (0.8%) |
| $500,000 to $749,999 | 0 (0.0%) | 80 (7.8%) |
| $750,000 to $999,999 | 0 (0.0%) | 0 (0.0%) |
| $1,000,000 or more | 0 (0.0%) | 0 (0.0%) |
| Total | 677 (100.0%) | 1,021 (100.0%) |
Household Income by Mortgage Status in Meadville
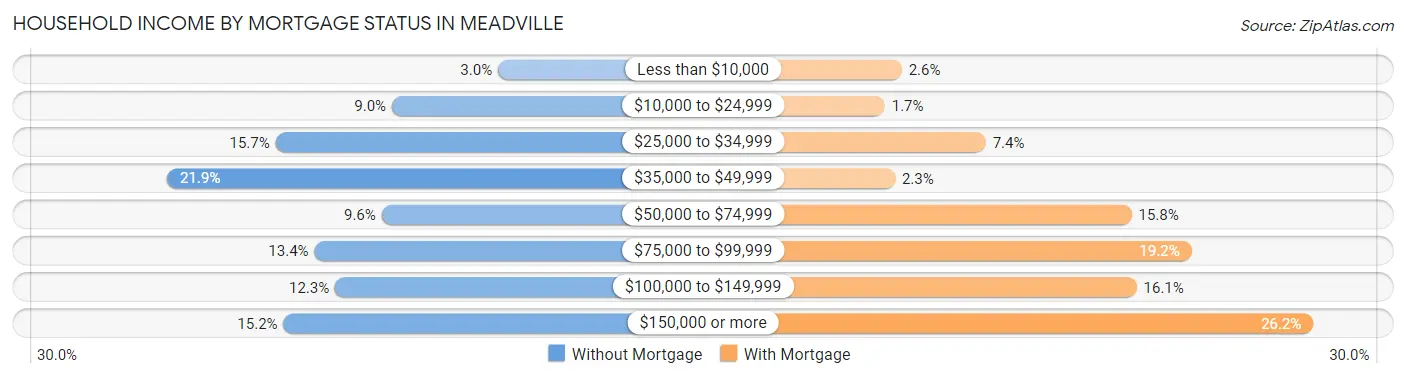
| Household Income | Without Mortgage | With Mortgage |
| Less than $10,000 | 20 (2.9%) | 27 (2.6%) |
| $10,000 to $24,999 | 61 (9.0%) | 17 (1.7%) |
| $25,000 to $34,999 | 106 (15.7%) | 76 (7.4%) |
| $35,000 to $49,999 | 148 (21.9%) | 23 (2.2%) |
| $50,000 to $74,999 | 65 (9.6%) | 161 (15.8%) |
| $75,000 to $99,999 | 91 (13.4%) | 196 (19.2%) |
| $100,000 to $149,999 | 83 (12.3%) | 164 (16.1%) |
| $150,000 or more | 103 (15.2%) | 267 (26.2%) |
| Total | 677 (100.0%) | 1,021 (100.0%) |
Property Value to Household Income Ratio in Meadville
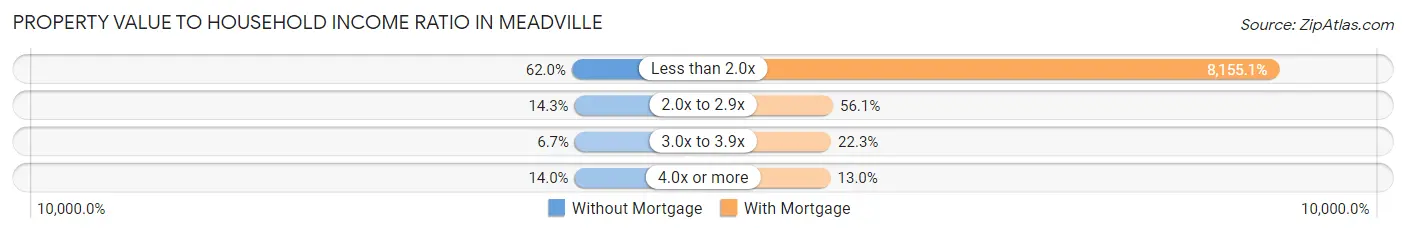
| Value-to-Income Ratio | Without Mortgage | With Mortgage |
| Less than 2.0x | 420 (62.0%) | 83,264 (8,155.1%) |
| 2.0x to 2.9x | 97 (14.3%) | 573 (56.1%) |
| 3.0x to 3.9x | 45 (6.7%) | 228 (22.3%) |
| 4.0x or more | 95 (14.0%) | 133 (13.0%) |
| Total | 677 (100.0%) | 1,021 (100.0%) |
Real Estate Taxes by Mortgage Status in Meadville
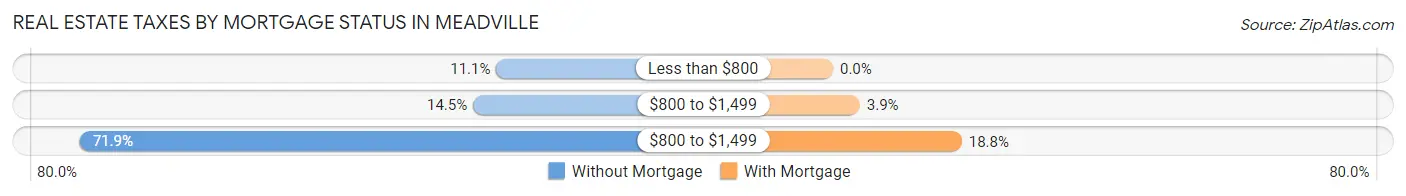
| Property Taxes | Without Mortgage | With Mortgage |
| Less than $800 | 75 (11.1%) | 0 (0.0%) |
| $800 to $1,499 | 98 (14.5%) | 40 (3.9%) |
| $800 to $1,499 | 487 (71.9%) | 192 (18.8%) |
| Total | 677 (100.0%) | 1,021 (100.0%) |
Health & Disability in Meadville
Health Insurance Coverage by Age in Meadville
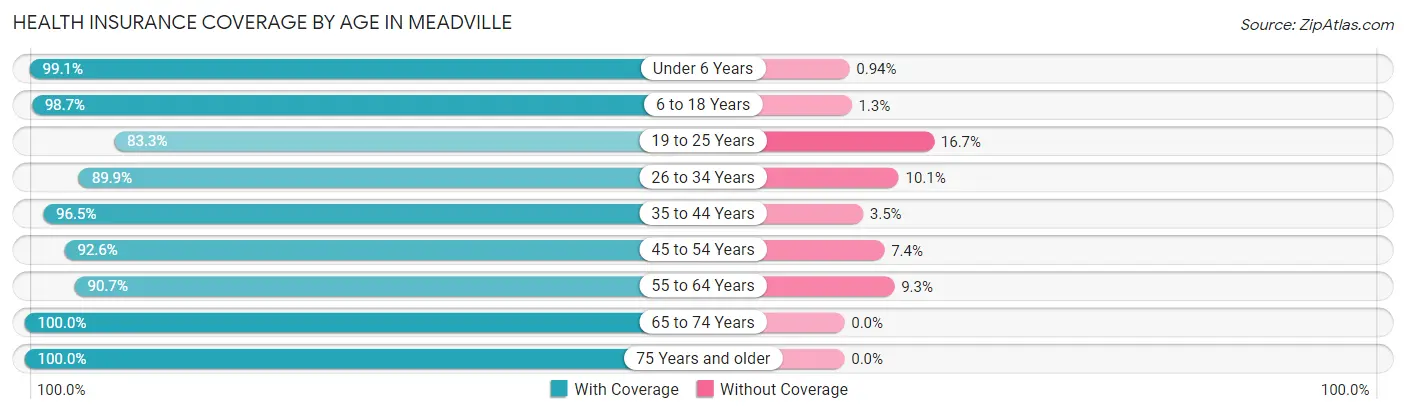
| Age Bracket | With Coverage | Without Coverage |
| Under 6 Years | 632 (99.1%) | 6 (0.9%) |
| 6 to 18 Years | 2,079 (98.7%) | 28 (1.3%) |
| 19 to 25 Years | 2,090 (83.3%) | 419 (16.7%) |
| 26 to 34 Years | 995 (89.9%) | 112 (10.1%) |
| 35 to 44 Years | 1,480 (96.5%) | 53 (3.5%) |
| 45 to 54 Years | 1,294 (92.6%) | 104 (7.4%) |
| 55 to 64 Years | 1,384 (90.7%) | 142 (9.3%) |
| 65 to 74 Years | 1,195 (100.0%) | 0 (0.0%) |
| 75 Years and older | 796 (100.0%) | 0 (0.0%) |
| Total | 11,945 (93.2%) | 864 (6.8%) |
Health Insurance Coverage by Citizenship Status in Meadville
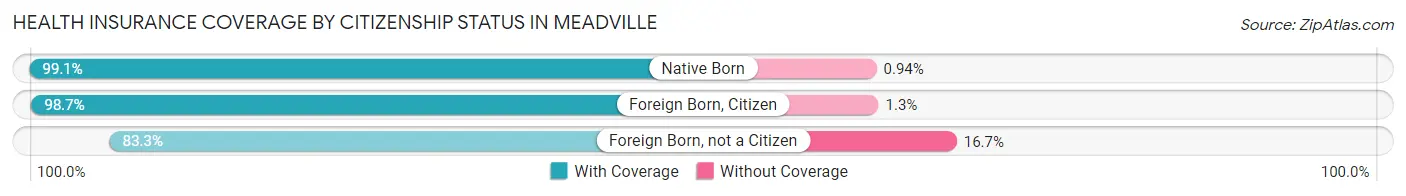
| Citizenship Status | With Coverage | Without Coverage |
| Native Born | 632 (99.1%) | 6 (0.9%) |
| Foreign Born, Citizen | 2,079 (98.7%) | 28 (1.3%) |
| Foreign Born, not a Citizen | 2,090 (83.3%) | 419 (16.7%) |
Health Insurance Coverage by Household Income in Meadville
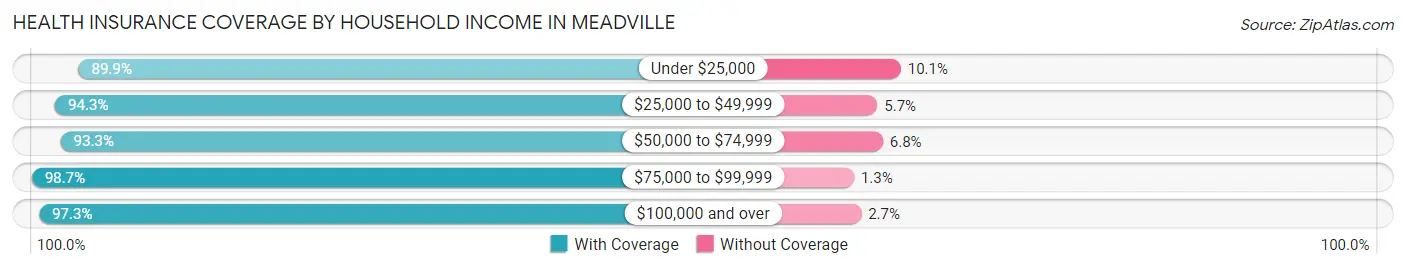
| Household Income | With Coverage | Without Coverage |
| Under $25,000 | 1,786 (89.9%) | 201 (10.1%) |
| $25,000 to $49,999 | 2,671 (94.3%) | 162 (5.7%) |
| $50,000 to $74,999 | 2,141 (93.2%) | 155 (6.8%) |
| $75,000 to $99,999 | 1,027 (98.7%) | 14 (1.3%) |
| $100,000 and over | 2,809 (97.3%) | 78 (2.7%) |
Public vs Private Health Insurance Coverage by Age in Meadville
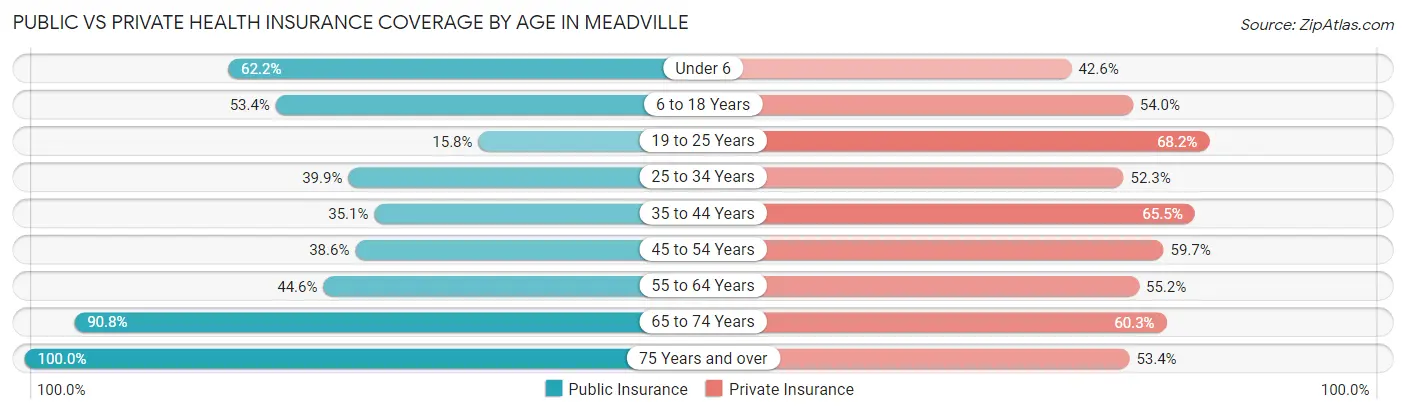
| Age Bracket | Public Insurance | Private Insurance |
| Under 6 | 397 (62.2%) | 272 (42.6%) |
| 6 to 18 Years | 1,125 (53.4%) | 1,138 (54.0%) |
| 19 to 25 Years | 396 (15.8%) | 1,711 (68.2%) |
| 25 to 34 Years | 442 (39.9%) | 579 (52.3%) |
| 35 to 44 Years | 538 (35.1%) | 1,004 (65.5%) |
| 45 to 54 Years | 540 (38.6%) | 835 (59.7%) |
| 55 to 64 Years | 680 (44.6%) | 842 (55.2%) |
| 65 to 74 Years | 1,085 (90.8%) | 720 (60.3%) |
| 75 Years and over | 796 (100.0%) | 425 (53.4%) |
| Total | 5,999 (46.8%) | 7,526 (58.8%) |
Disability Status by Sex by Age in Meadville
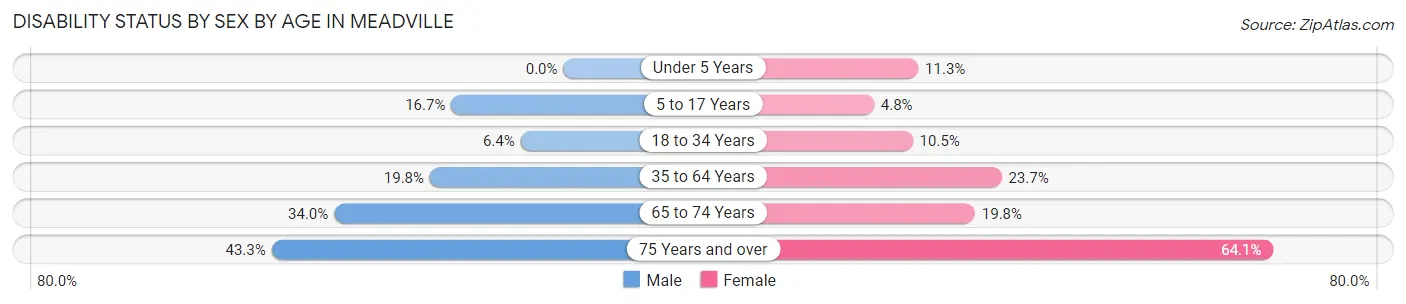
| Age Bracket | Male | Female |
| Under 5 Years | 0 (0.0%) | 27 (11.3%) |
| 5 to 17 Years | 178 (16.7%) | 42 (4.8%) |
| 18 to 34 Years | 132 (6.4%) | 194 (10.5%) |
| 35 to 64 Years | 396 (19.8%) | 583 (23.7%) |
| 65 to 74 Years | 176 (34.0%) | 134 (19.8%) |
| 75 Years and over | 117 (43.3%) | 337 (64.1%) |
Disability Class by Sex by Age in Meadville
Disability Class: Hearing Difficulty
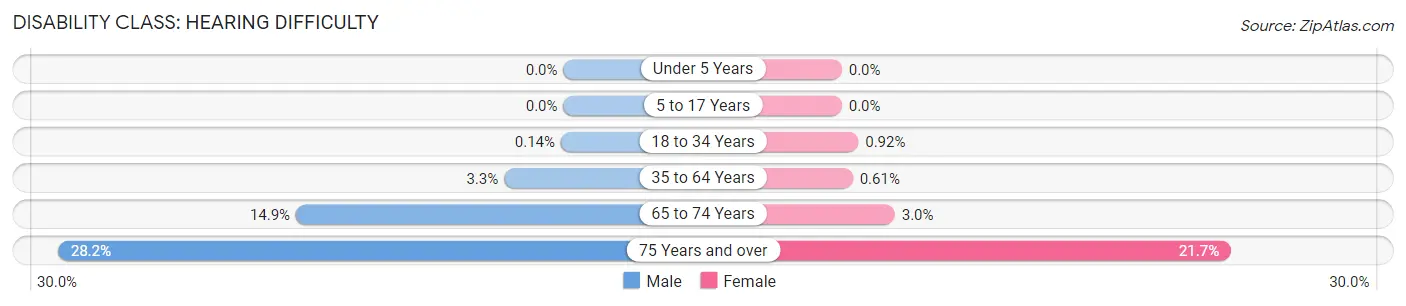
| Age Bracket | Male | Female |
| Under 5 Years | 0 (0.0%) | 0 (0.0%) |
| 5 to 17 Years | 0 (0.0%) | 0 (0.0%) |
| 18 to 34 Years | 3 (0.1%) | 17 (0.9%) |
| 35 to 64 Years | 66 (3.3%) | 15 (0.6%) |
| 65 to 74 Years | 77 (14.9%) | 20 (2.9%) |
| 75 Years and over | 76 (28.1%) | 114 (21.7%) |
Disability Class: Vision Difficulty
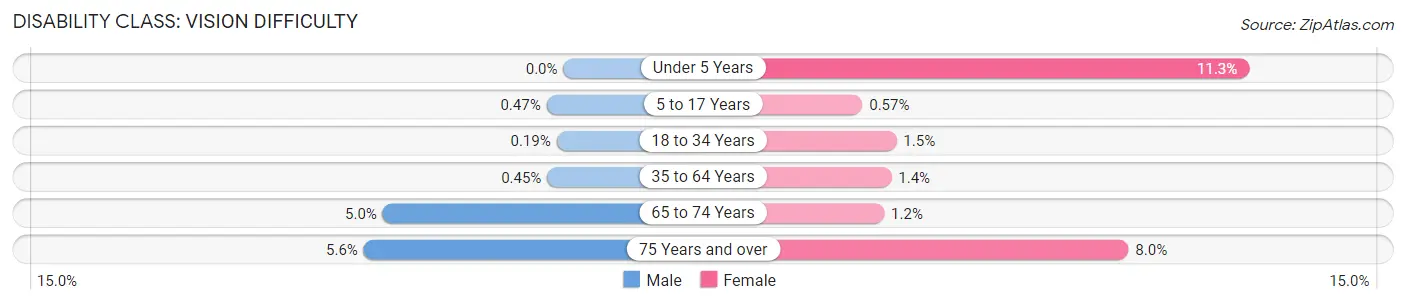
| Age Bracket | Male | Female |
| Under 5 Years | 0 (0.0%) | 27 (11.3%) |
| 5 to 17 Years | 5 (0.5%) | 5 (0.6%) |
| 18 to 34 Years | 4 (0.2%) | 28 (1.5%) |
| 35 to 64 Years | 9 (0.4%) | 34 (1.4%) |
| 65 to 74 Years | 26 (5.0%) | 8 (1.2%) |
| 75 Years and over | 15 (5.6%) | 42 (8.0%) |
Disability Class: Cognitive Difficulty
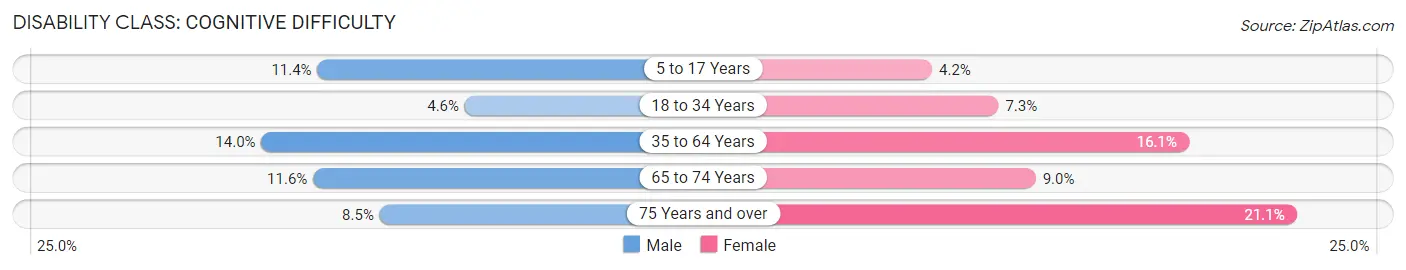
| Age Bracket | Male | Female |
| 5 to 17 Years | 122 (11.4%) | 37 (4.2%) |
| 18 to 34 Years | 95 (4.6%) | 134 (7.3%) |
| 35 to 64 Years | 280 (14.0%) | 396 (16.1%) |
| 65 to 74 Years | 60 (11.6%) | 61 (9.0%) |
| 75 Years and over | 23 (8.5%) | 111 (21.1%) |
Disability Class: Ambulatory Difficulty
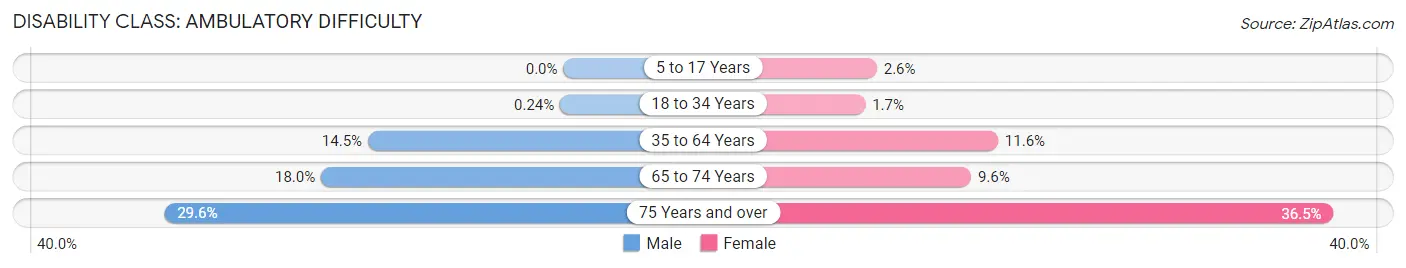
| Age Bracket | Male | Female |
| 5 to 17 Years | 0 (0.0%) | 23 (2.6%) |
| 18 to 34 Years | 5 (0.2%) | 32 (1.7%) |
| 35 to 64 Years | 290 (14.5%) | 285 (11.6%) |
| 65 to 74 Years | 93 (18.0%) | 65 (9.6%) |
| 75 Years and over | 80 (29.6%) | 192 (36.5%) |
Disability Class: Self-Care Difficulty
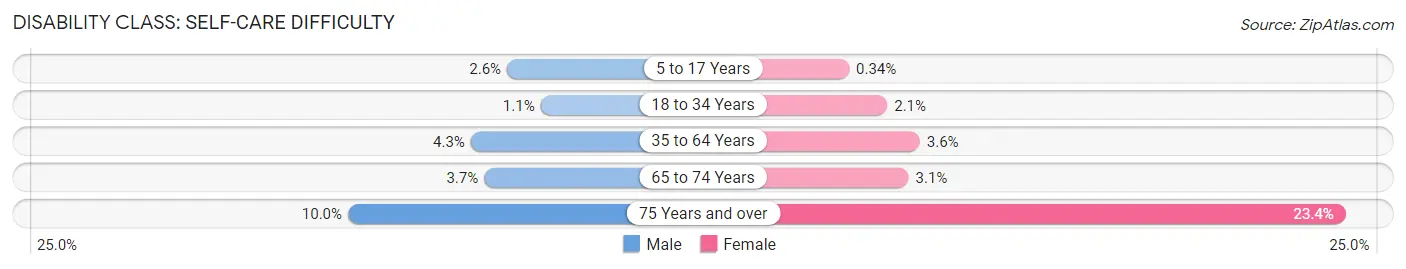
| Age Bracket | Male | Female |
| 5 to 17 Years | 28 (2.6%) | 3 (0.3%) |
| 18 to 34 Years | 22 (1.1%) | 39 (2.1%) |
| 35 to 64 Years | 86 (4.3%) | 89 (3.6%) |
| 65 to 74 Years | 19 (3.7%) | 21 (3.1%) |
| 75 Years and over | 27 (10.0%) | 123 (23.4%) |
Technology Access in Meadville
Computing Device Access in Meadville
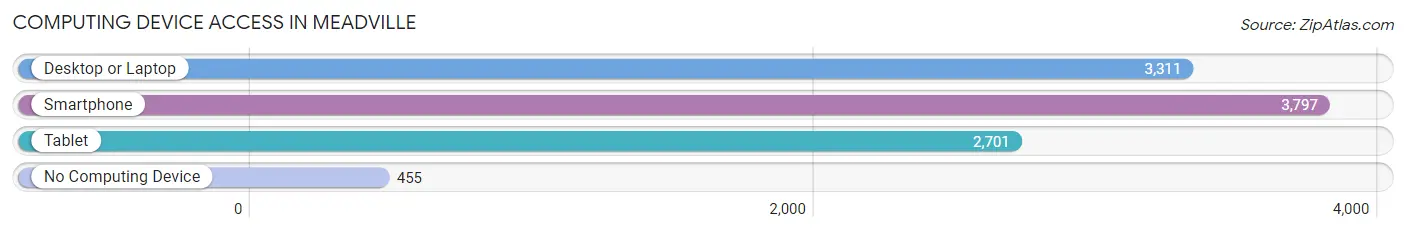
| Device Type | # Households | % Households |
| Desktop or Laptop | 3,311 | 68.8% |
| Smartphone | 3,797 | 78.9% |
| Tablet | 2,701 | 56.1% |
| No Computing Device | 455 | 9.5% |
| Total | 4,812 | 100.0% |
Internet Access in Meadville
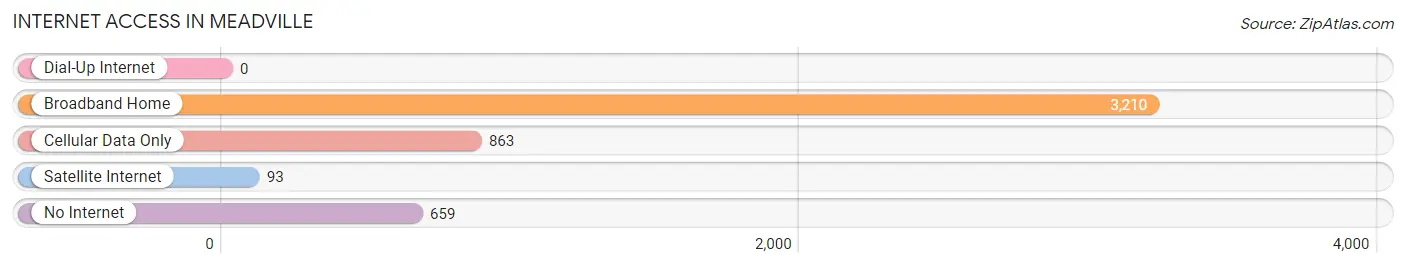
| Internet Type | # Households | % Households |
| Dial-Up Internet | 0 | 0.0% |
| Broadband Home | 3,210 | 66.7% |
| Cellular Data Only | 863 | 17.9% |
| Satellite Internet | 93 | 1.9% |
| No Internet | 659 | 13.7% |
| Total | 4,812 | 100.0% |
Meadville Summary
Meadville is a city located in Crawford County, Pennsylvania, United States. It is the county seat of Crawford County and is located along French Creek, approximately 80 miles (130 km) north of Pittsburgh. As of the 2010 census, the city had a total population of 13,388. The city is the principal city of the Meadville, PA Micropolitan Statistical Area.
History
Meadville was founded in 1788 by David Mead, a Revolutionary War veteran, and was incorporated as a borough in 1807. It was named after its founder and was the first borough in Crawford County. The borough was later incorporated as a city in 1866.
Meadville was an important stop on the Underground Railroad, as it was located near the Ohio border. It was also the site of the first free public library in the United States, established in 1833.
Geography
Meadville is located at 41°37′N 80°08′W (41.619, -80.133). According to the United States Census Bureau, the city has a total area of 5.4 square miles (14.0 km2), all of it land.
Economy
Meadville is home to a variety of industries, including manufacturing, healthcare, education, and retail. The city is home to several large employers, including Allegheny College, Meadville Medical Center, and the Meadville-Western Crawford County Chamber of Commerce.
The city is also home to several small businesses including restaurants shops and galleries
Demographics
As of the 2010 census, there were 13,388 people, 5,717 households, and 3,072 families residing in the city. The population density was 2,468.2 people per square mile (953.3/km2). There were 6,299 housing units at an average density of 1,164.3 per square mile (449.2/km2). The racial makeup of the city was 92.2% White, 4.2% African American, 0.2% Native American, 0.7% Asian, 0.1% Pacific Islander, 0.7% from other races, and 1.9% from two or more races. Hispanic or Latino of any race were 2.2% of the population.
There were 5,717 households, out of which 24.2% had children under the age of 18 living with them, 37.2% were married couples living together, 14.2% had a female householder with no husband present, and 44.3% were non-families. 37.2% of all households were made up of individuals, and 15.2% had someone living alone who was 65 years of age or older. The average household size was 2.20 and the average family size was 2.90.
In the city, the population was spread out, with 21.2% under the age of 18, 13.2% from 18 to 24, 24.2% from 25 to 44, 22.3% from 45 to 64, and 19.1% who were 65 years of age or older. The median age was 38 years. For every 100 females, there were 87.2 males. For every 100 females age 18 and over, there were 82.7 males.
The median income for a household in the city was $30,935, and the median income for a family was $41,945. Males had a median income of $31,945 versus $22,917 for females. The per capita income for the city was $17,945. About 11.2% of families and 15.3% of the population were below the poverty line, including 22.2% of those under age 18 and 8.7% of those age 65 or over.
Common Questions
What is Per Capita Income in Meadville?
Per Capita income in Meadville is $27,830.
What is the Median Family Income in Meadville?
Median Family Income in Meadville is $58,026.
What is the Median Household income in Meadville?
Median Household Income in Meadville is $46,157.
What is Income or Wage Gap in Meadville?
Income or Wage Gap in Meadville is 35.3%.
Women in Meadville earn 64.7 cents for every dollar earned by a man.
What is Family Income Deficit in Meadville?
Family Income Deficit in Meadville is $8,877.
Families that are below poverty line in Meadville earn $8,877 less on average than the poverty threshold level.
What is Inequality or Gini Index in Meadville?
Inequality or Gini Index in Meadville is 0.49.
What is the Total Population of Meadville?
Total Population of Meadville is 12,929.
What is the Total Male Population of Meadville?
Total Male Population of Meadville is 6,194.
What is the Total Female Population of Meadville?
Total Female Population of Meadville is 6,735.
What is the Ratio of Males per 100 Females in Meadville?
There are 91.97 Males per 100 Females in Meadville.
What is the Ratio of Females per 100 Males in Meadville?
There are 108.73 Females per 100 Males in Meadville.
What is the Median Population Age in Meadville?
Median Population Age in Meadville is 35.7 Years.
What is the Average Family Size in Meadville
Average Family Size in Meadville is 2.9 People.
What is the Average Household Size in Meadville
Average Household Size in Meadville is 2.3 People.
How Large is the Labor Force in Meadville?
There are 5,970 People in the Labor Forcein in Meadville.
What is the Percentage of People in the Labor Force in Meadville?
55.3% of People are in the Labor Force in Meadville.
What is the Unemployment Rate in Meadville?
Unemployment Rate in Meadville is 6.9%.