Wyndmoor, PA Map & Demographics
Wyndmoor Map
Wyndmoor Overview
$68,699
PER CAPITA INCOME
$185,000
AVG FAMILY INCOME
$142,853
AVG HOUSEHOLD INCOME
24.1%
WAGE / INCOME GAP [ % ]
75.9¢/ $1
WAGE / INCOME GAP [ $ ]
0.42
INEQUALITY / GINI INDEX
5,698
TOTAL POPULATION
2,698
MALE POPULATION
3,000
FEMALE POPULATION
89.93
MALES / 100 FEMALES
111.19
FEMALES / 100 MALES
49.6
MEDIAN AGE
3.2
AVG FAMILY SIZE
2.5
AVG HOUSEHOLD SIZE
2,714
LABOR FORCE [ PEOPLE ]
60.1%
PERCENT IN LABOR FORCE
5.2%
UNEMPLOYMENT RATE
Income in Wyndmoor
Income Overview in Wyndmoor
Per Capita Income in Wyndmoor is $68,699, while median incomes of families and households are $185,000 and $142,853 respectively.
| Characteristic | Number | Measure |
| Per Capita Income | 5,698 | $68,699 |
| Median Family Income | 1,376 | $185,000 |
| Mean Family Income | 1,376 | $229,383 |
| Median Household Income | 2,079 | $142,853 |
| Mean Household Income | 2,079 | $182,024 |
| Income Deficit | 1,376 | $0 |
| Wage / Income Gap (%) | 5,698 | 24.07% |
| Wage / Income Gap ($) | 5,698 | 75.93¢ per $1 |
| Gini / Inequality Index | 5,698 | 0.42 |
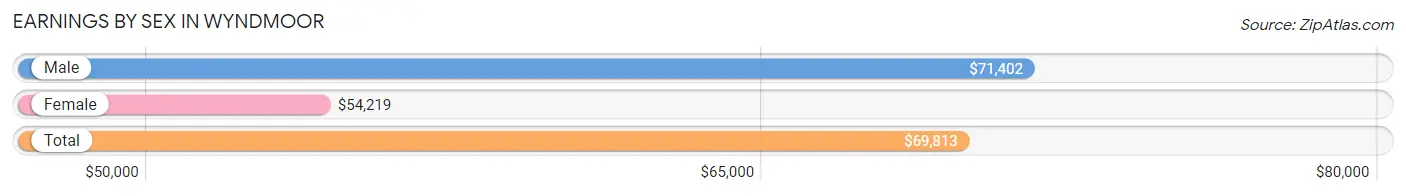
Earnings by Sex in Wyndmoor
Average Earnings in Wyndmoor are $69,813, $71,402 for men and $54,219 for women, a difference of 24.1%.
| Sex | Number | Average Earnings |
| Male | 1,544 (52.5%) | $71,402 |
| Female | 1,394 (47.4%) | $54,219 |
| Total | 2,938 (100.0%) | $69,813 |
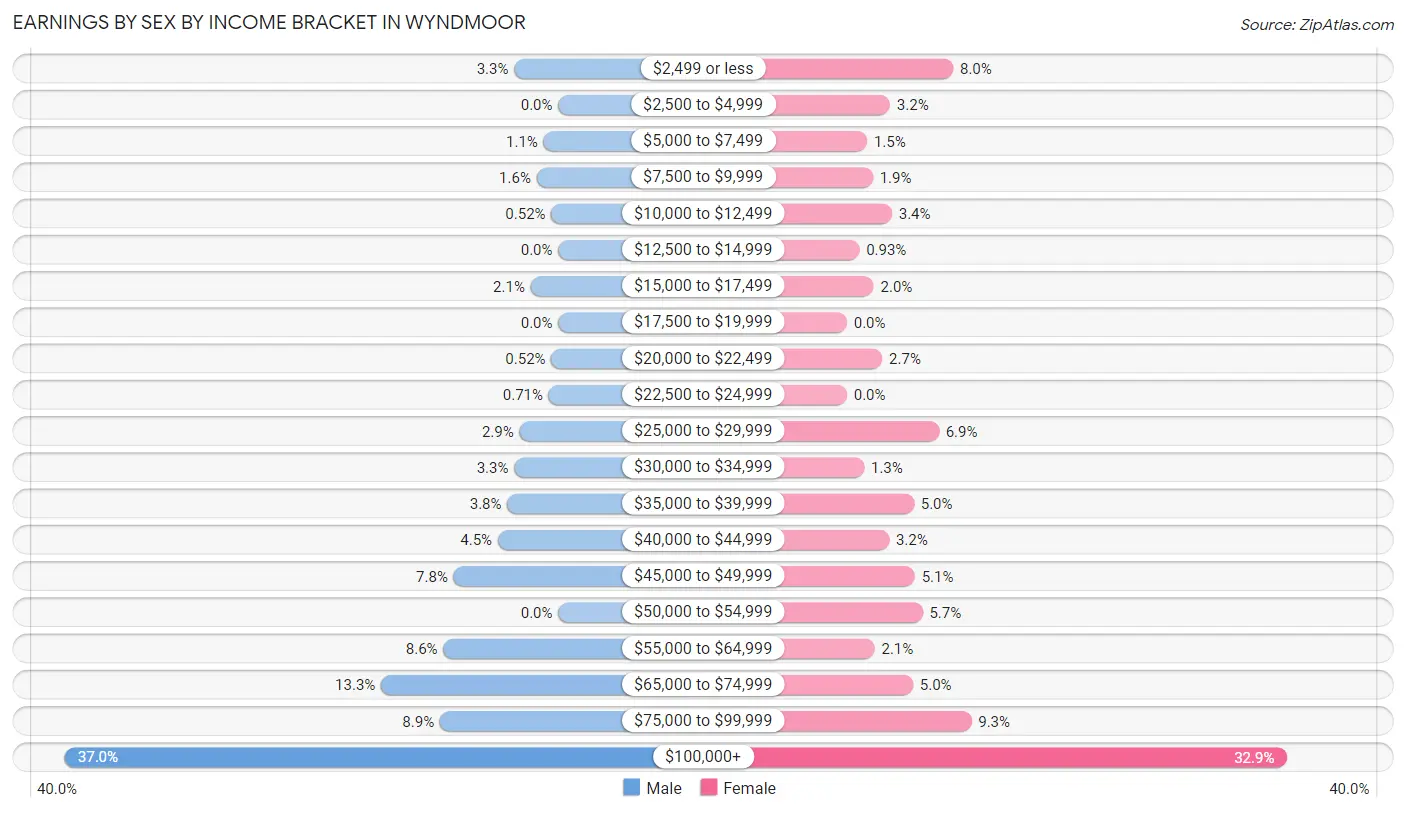
Earnings by Sex by Income Bracket in Wyndmoor
The most common earnings brackets in Wyndmoor are $100,000+ for men (571 | 37.0%) and $100,000+ for women (459 | 32.9%).
| Income | Male | Female |
| $2,499 or less | 51 (3.3%) | 111 (8.0%) |
| $2,500 to $4,999 | 0 (0.0%) | 45 (3.2%) |
| $5,000 to $7,499 | 17 (1.1%) | 21 (1.5%) |
| $7,500 to $9,999 | 25 (1.6%) | 27 (1.9%) |
| $10,000 to $12,499 | 8 (0.5%) | 47 (3.4%) |
| $12,500 to $14,999 | 0 (0.0%) | 13 (0.9%) |
| $15,000 to $17,499 | 32 (2.1%) | 28 (2.0%) |
| $17,500 to $19,999 | 0 (0.0%) | 0 (0.0%) |
| $20,000 to $22,499 | 8 (0.5%) | 37 (2.6%) |
| $22,500 to $24,999 | 11 (0.7%) | 0 (0.0%) |
| $25,000 to $29,999 | 45 (2.9%) | 96 (6.9%) |
| $30,000 to $34,999 | 51 (3.3%) | 18 (1.3%) |
| $35,000 to $39,999 | 59 (3.8%) | 70 (5.0%) |
| $40,000 to $44,999 | 70 (4.5%) | 44 (3.2%) |
| $45,000 to $49,999 | 121 (7.8%) | 71 (5.1%) |
| $50,000 to $54,999 | 0 (0.0%) | 79 (5.7%) |
| $55,000 to $64,999 | 133 (8.6%) | 29 (2.1%) |
| $65,000 to $74,999 | 205 (13.3%) | 69 (5.0%) |
| $75,000 to $99,999 | 137 (8.9%) | 130 (9.3%) |
| $100,000+ | 571 (37.0%) | 459 (32.9%) |
| Total | 1,544 (100.0%) | 1,394 (100.0%) |
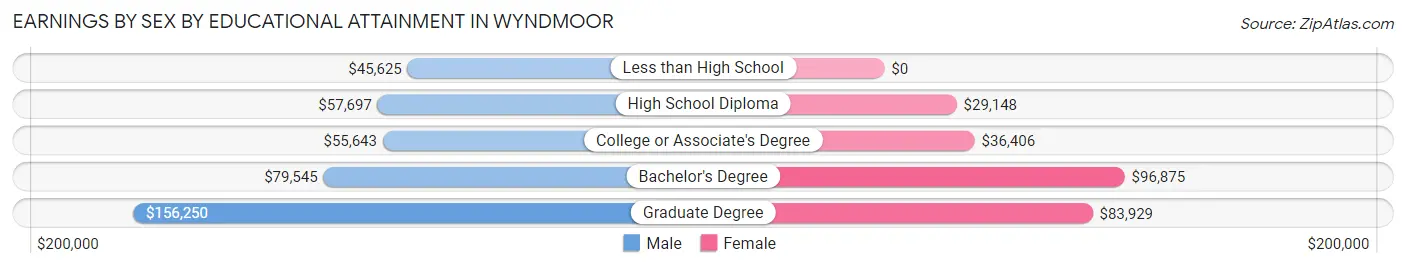
Earnings by Sex by Educational Attainment in Wyndmoor
Average earnings in Wyndmoor are $72,053 for men and $66,450 for women, a difference of 7.8%. Men with an educational attainment of graduate degree enjoy the highest average annual earnings of $156,250, while those with less than high school education earn the least with $45,625. Women with an educational attainment of bachelor's degree earn the most with the average annual earnings of $96,875, while those with high school diploma education have the smallest earnings of $29,148.
| Educational Attainment | Male Income | Female Income |
| Less than High School | $45,625 | $0 |
| High School Diploma | $57,697 | $29,148 |
| College or Associate's Degree | $55,643 | $36,406 |
| Bachelor's Degree | $79,545 | $96,875 |
| Graduate Degree | $156,250 | $83,929 |
| Total | $72,053 | $66,450 |
Family Income in Wyndmoor
Family Income Brackets in Wyndmoor
According to the Wyndmoor family income data, there are 663 families falling into the $200,000+ income range, which is the most common income bracket and makes up 48.2% of all families.
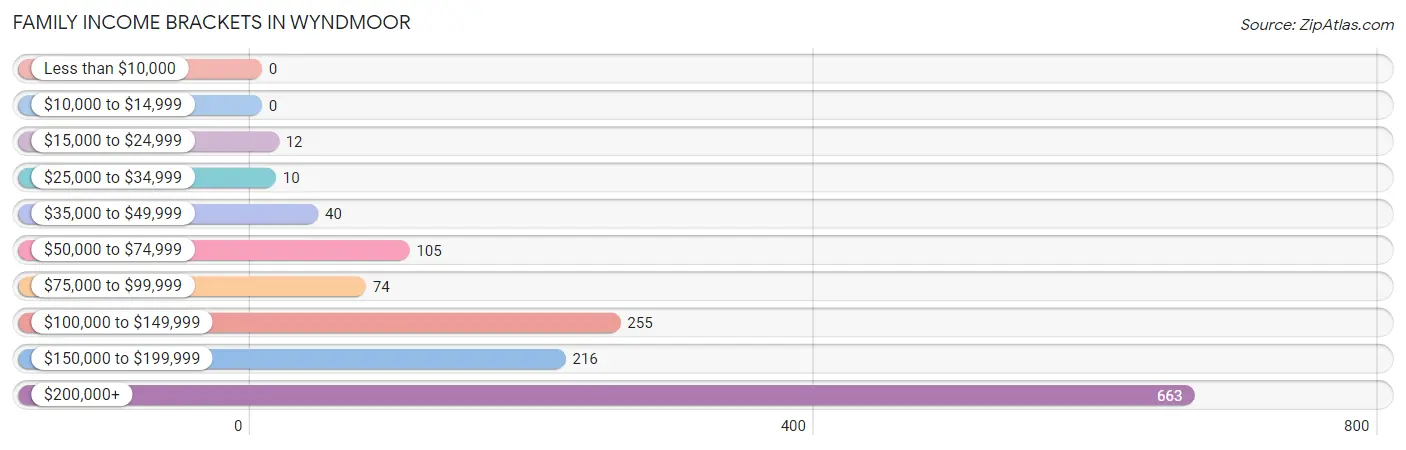
| Income Bracket | # Families | % Families |
| Less than $10,000 | 0 | 0.0% |
| $10,000 to $14,999 | 0 | 0.0% |
| $15,000 to $24,999 | 12 | 0.9% |
| $25,000 to $34,999 | 10 | 0.7% |
| $35,000 to $49,999 | 40 | 2.9% |
| $50,000 to $74,999 | 105 | 7.6% |
| $75,000 to $99,999 | 74 | 5.4% |
| $100,000 to $149,999 | 255 | 18.5% |
| $150,000 to $199,999 | 216 | 15.7% |
| $200,000+ | 663 | 48.2% |
Family Income by Famaliy Size in Wyndmoor
4-person families (251 | 18.2%) account for the highest median family income in Wyndmoor with $244,803 per family, while 2-person families (578 | 42.0%) have the highest median income of $86,146 per family member.
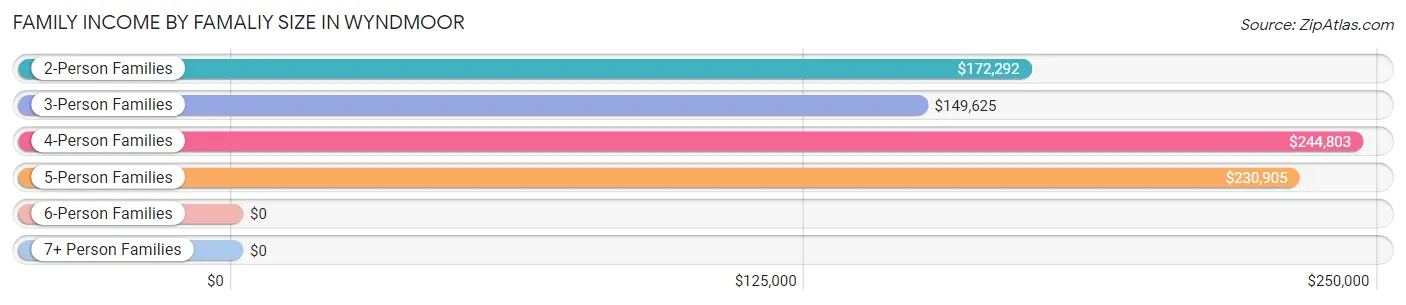
| Income Bracket | # Families | Median Income |
| 2-Person Families | 578 (42.0%) | $172,292 |
| 3-Person Families | 321 (23.3%) | $149,625 |
| 4-Person Families | 251 (18.2%) | $244,803 |
| 5-Person Families | 210 (15.3%) | $230,905 |
| 6-Person Families | 5 (0.4%) | $0 |
| 7+ Person Families | 11 (0.8%) | $0 |
| Total | 1,376 (100.0%) | $185,000 |
Family Income by Number of Earners in Wyndmoor
The median family income in Wyndmoor is $185,000, with families comprising 2 earners (668) having the highest median family income of $230,172, while families with 1 earner (451) have the lowest median family income of $133,542, accounting for 48.5% and 32.8% of families, respectively.
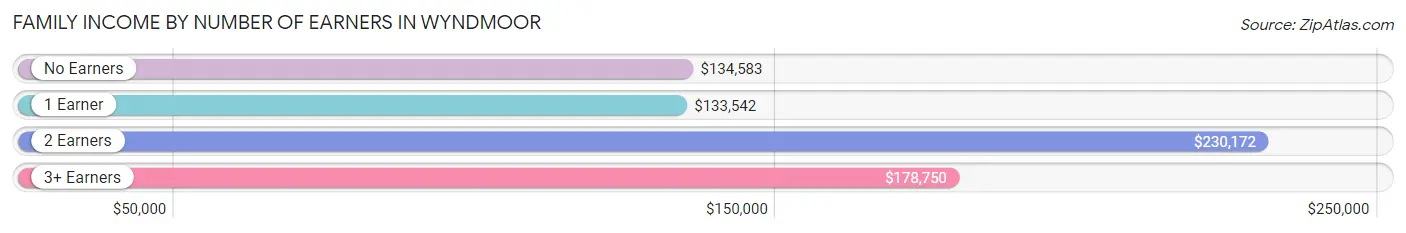
| Number of Earners | # Families | Median Income |
| No Earners | 114 (8.3%) | $134,583 |
| 1 Earner | 451 (32.8%) | $133,542 |
| 2 Earners | 668 (48.5%) | $230,172 |
| 3+ Earners | 143 (10.4%) | $178,750 |
| Total | 1,376 (100.0%) | $185,000 |
Household Income in Wyndmoor
Household Income Brackets in Wyndmoor
With 707 households falling in the category, the $200,000+ income range is the most frequent in Wyndmoor, accounting for 34.0% of all households. In contrast, only 17 households (0.8%) fall into the $10,000 to $14,999 income bracket, making it the least populous group.
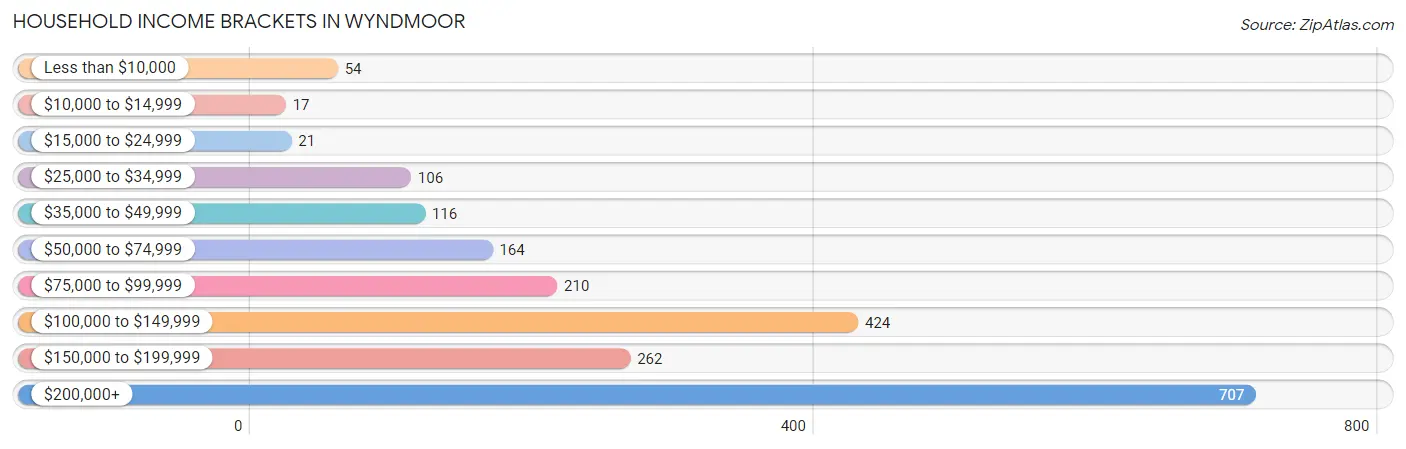
| Income Bracket | # Households | % Households |
| Less than $10,000 | 54 | 2.6% |
| $10,000 to $14,999 | 17 | 0.8% |
| $15,000 to $24,999 | 21 | 1.0% |
| $25,000 to $34,999 | 106 | 5.1% |
| $35,000 to $49,999 | 116 | 5.6% |
| $50,000 to $74,999 | 164 | 7.9% |
| $75,000 to $99,999 | 210 | 10.1% |
| $100,000 to $149,999 | 424 | 20.4% |
| $150,000 to $199,999 | 262 | 12.6% |
| $200,000+ | 707 | 34.0% |
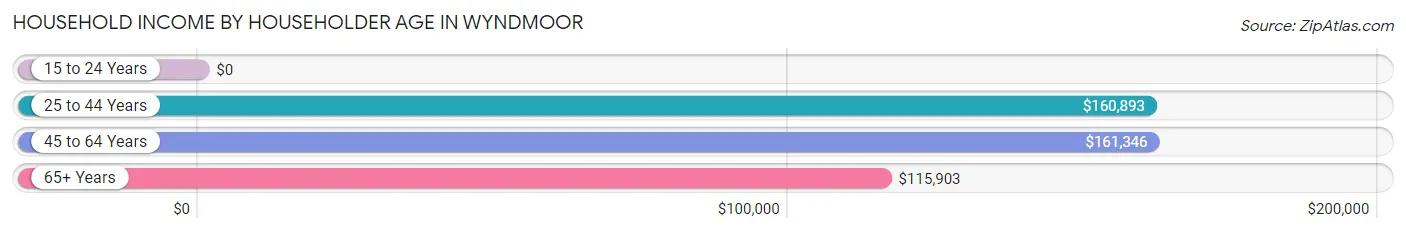
Household Income by Householder Age in Wyndmoor
The median household income in Wyndmoor is $142,853, with the highest median household income of $161,346 found in the 45 to 64 years age bracket for the primary householder. A total of 962 households (46.3%) fall into this category. Meanwhile, the 15 to 24 years age bracket for the primary householder has the lowest median household income of $0, with 10 households (0.5%) in this group.
| Income Bracket | # Households | Median Income |
| 15 to 24 Years | 10 (0.5%) | $0 |
| 25 to 44 Years | 491 (23.6%) | $160,893 |
| 45 to 64 Years | 962 (46.3%) | $161,346 |
| 65+ Years | 616 (29.6%) | $115,903 |
| Total | 2,079 (100.0%) | $142,853 |
Poverty in Wyndmoor
Income Below Poverty by Sex and Age in Wyndmoor
With 1.5% poverty level for males and 4.3% for females among the residents of Wyndmoor, 25 to 34 year old males and 75 year old and over females are the most vulnerable to poverty, with 31 males (10.7%) and 33 females (15.4%) in their respective age groups living below the poverty level.
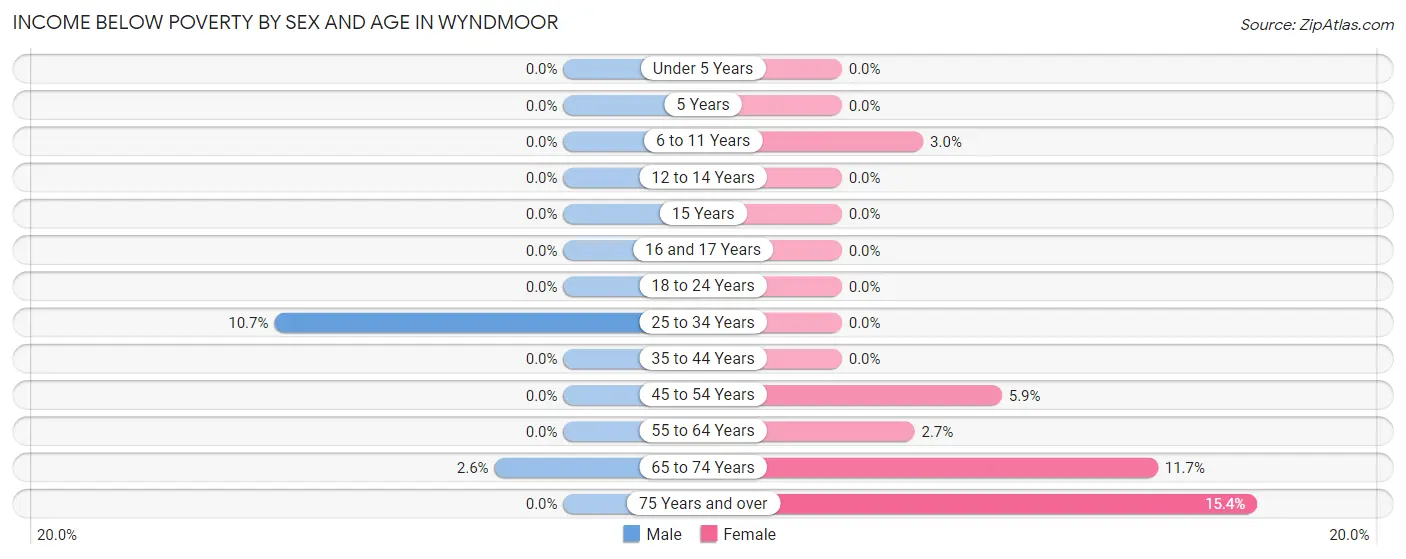
| Age Bracket | Male | Female |
| Under 5 Years | 0 (0.0%) | 0 (0.0%) |
| 5 Years | 0 (0.0%) | 0 (0.0%) |
| 6 to 11 Years | 0 (0.0%) | 9 (3.0%) |
| 12 to 14 Years | 0 (0.0%) | 0 (0.0%) |
| 15 Years | 0 (0.0%) | 0 (0.0%) |
| 16 and 17 Years | 0 (0.0%) | 0 (0.0%) |
| 18 to 24 Years | 0 (0.0%) | 0 (0.0%) |
| 25 to 34 Years | 31 (10.7%) | 0 (0.0%) |
| 35 to 44 Years | 0 (0.0%) | 0 (0.0%) |
| 45 to 54 Years | 0 (0.0%) | 23 (5.9%) |
| 55 to 64 Years | 0 (0.0%) | 12 (2.7%) |
| 65 to 74 Years | 8 (2.6%) | 38 (11.7%) |
| 75 Years and over | 0 (0.0%) | 33 (15.4%) |
| Total | 39 (1.5%) | 115 (4.3%) |
Income Above Poverty by Sex and Age in Wyndmoor
According to the poverty statistics in Wyndmoor, males aged under 5 years and females aged under 5 years are the age groups that are most secure financially, with 100.0% of males and 100.0% of females in these age groups living above the poverty line.
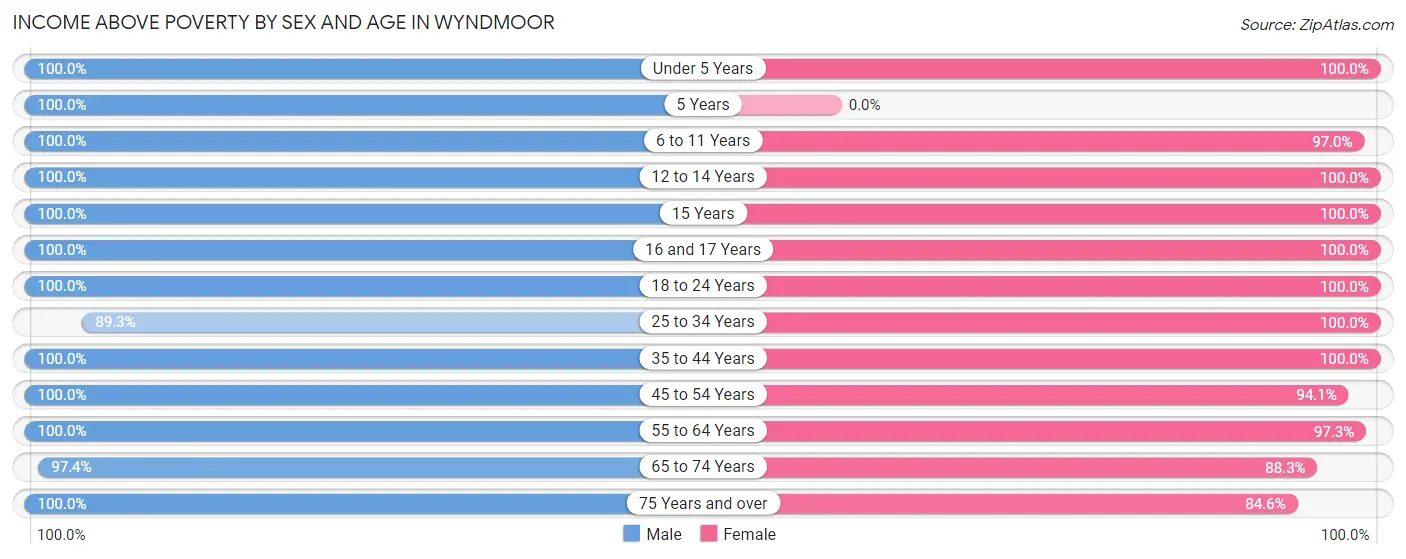
| Age Bracket | Male | Female |
| Under 5 Years | 195 (100.0%) | 184 (100.0%) |
| 5 Years | 74 (100.0%) | 0 (0.0%) |
| 6 to 11 Years | 223 (100.0%) | 289 (97.0%) |
| 12 to 14 Years | 74 (100.0%) | 76 (100.0%) |
| 15 Years | 32 (100.0%) | 26 (100.0%) |
| 16 and 17 Years | 51 (100.0%) | 46 (100.0%) |
| 18 to 24 Years | 65 (100.0%) | 131 (100.0%) |
| 25 to 34 Years | 258 (89.3%) | 125 (100.0%) |
| 35 to 44 Years | 287 (100.0%) | 451 (100.0%) |
| 45 to 54 Years | 264 (100.0%) | 364 (94.1%) |
| 55 to 64 Years | 543 (100.0%) | 433 (97.3%) |
| 65 to 74 Years | 304 (97.4%) | 286 (88.3%) |
| 75 Years and over | 150 (100.0%) | 181 (84.6%) |
| Total | 2,520 (98.5%) | 2,592 (95.8%) |
Income Below Poverty Among Married-Couple Families in Wyndmoor
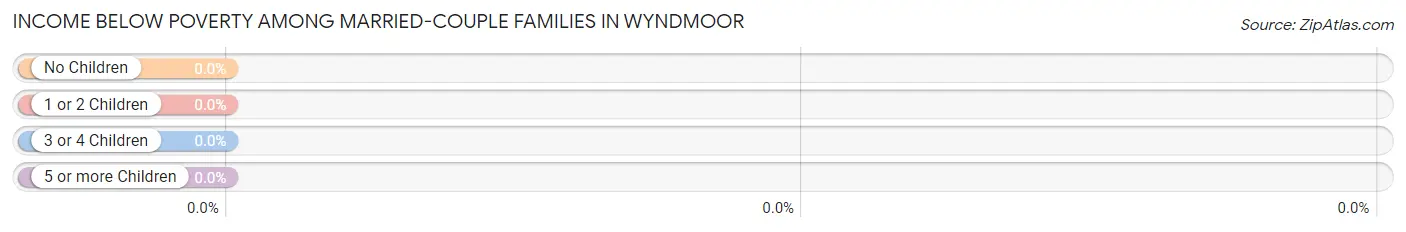
| Children | Above Poverty | Below Poverty |
| No Children | 639 (100.0%) | 0 (0.0%) |
| 1 or 2 Children | 416 (100.0%) | 0 (0.0%) |
| 3 or 4 Children | 166 (100.0%) | 0 (0.0%) |
| 5 or more Children | 11 (100.0%) | 0 (0.0%) |
| Total | 1,232 (100.0%) | 0 (0.0%) |
Income Below Poverty Among Single-Parent Households in Wyndmoor
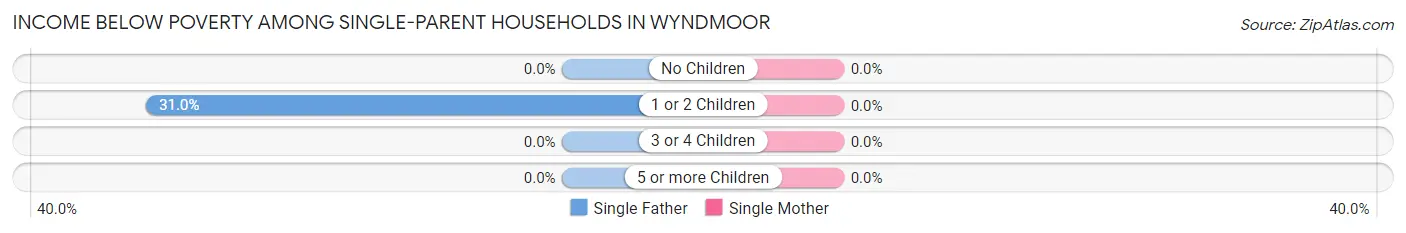
| Children | Single Father | Single Mother |
| No Children | 0 (0.0%) | 0 (0.0%) |
| 1 or 2 Children | 13 (30.9%) | 0 (0.0%) |
| 3 or 4 Children | 0 (0.0%) | 0 (0.0%) |
| 5 or more Children | 0 (0.0%) | 0 (0.0%) |
| Total | 13 (21.7%) | 0 (0.0%) |
Income Below Poverty Among Married-Couple vs Single-Parent Households in Wyndmoor
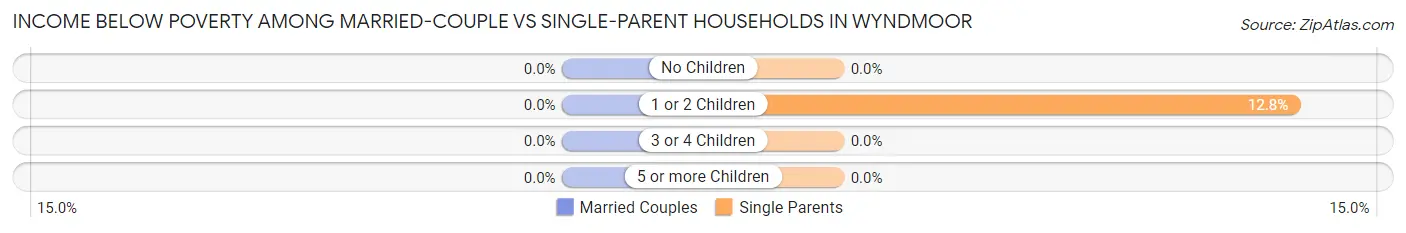
| Children | Married-Couple Families | Single-Parent Households |
| No Children | 0 (0.0%) | 0 (0.0%) |
| 1 or 2 Children | 0 (0.0%) | 13 (12.8%) |
| 3 or 4 Children | 0 (0.0%) | 0 (0.0%) |
| 5 or more Children | 0 (0.0%) | 0 (0.0%) |
| Total | 0 (0.0%) | 13 (9.0%) |
Race in Wyndmoor
The most populous races in Wyndmoor are White / Caucasian (4,389 | 77.0%), Black / African American (914 | 16.0%), and Two or more Races (243 | 4.3%).
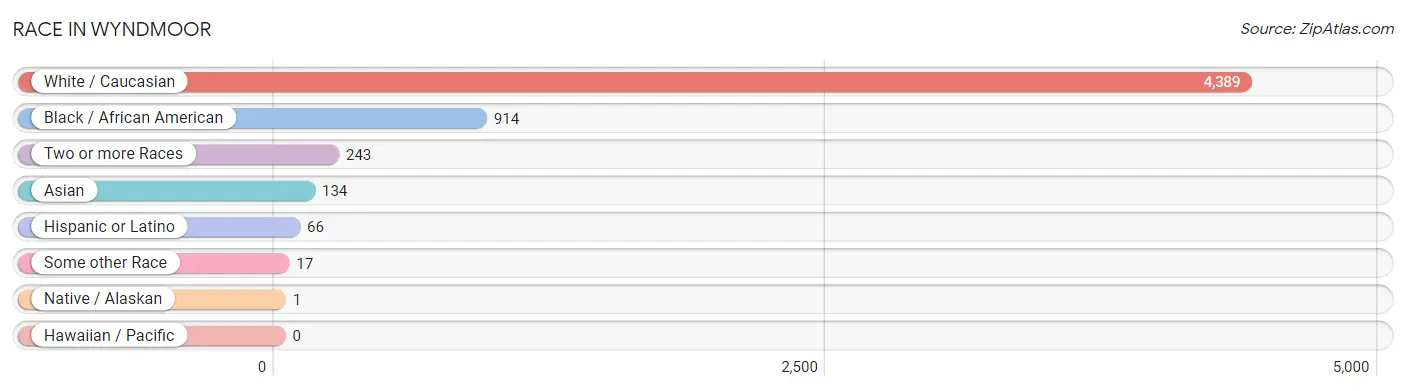
| Race | # Population | % Population |
| Asian | 134 | 2.4% |
| Black / African American | 914 | 16.0% |
| Hawaiian / Pacific | 0 | 0.0% |
| Hispanic or Latino | 66 | 1.2% |
| Native / Alaskan | 1 | 0.0% |
| White / Caucasian | 4,389 | 77.0% |
| Two or more Races | 243 | 4.3% |
| Some other Race | 17 | 0.3% |
| Total | 5,698 | 100.0% |
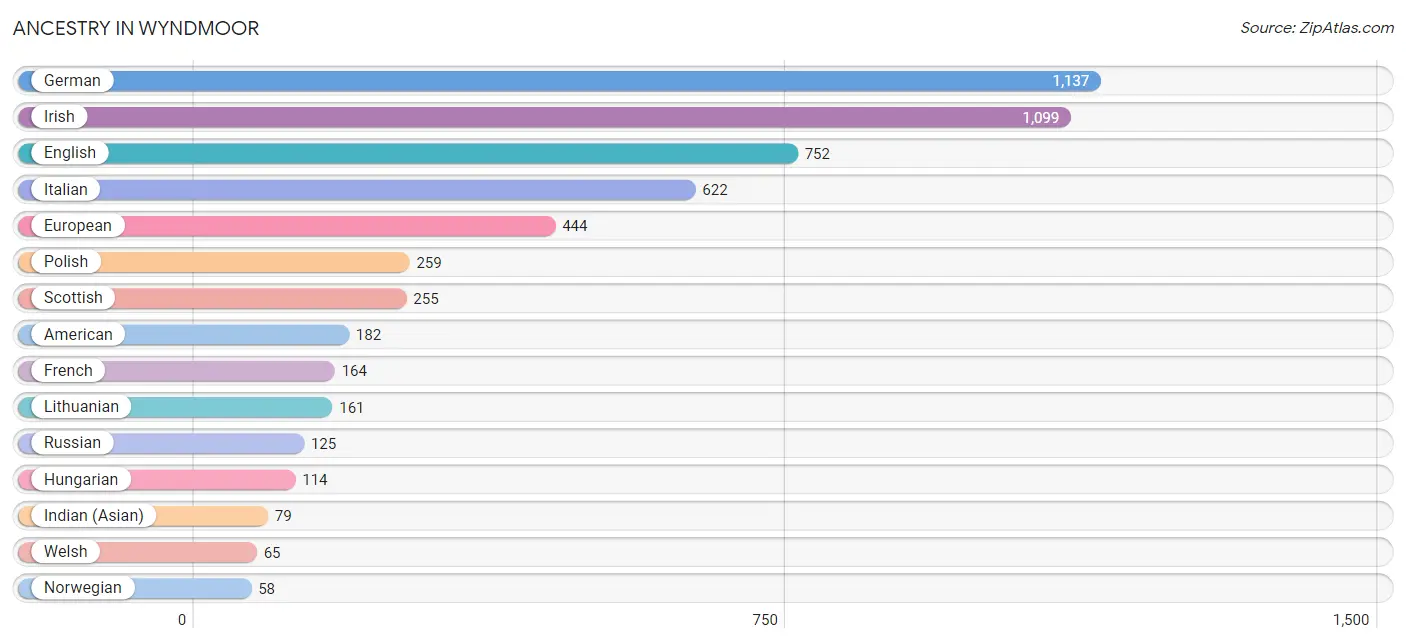
Ancestry in Wyndmoor
The most populous ancestries reported in Wyndmoor are German (1,137 | 20.0%), Irish (1,099 | 19.3%), English (752 | 13.2%), Italian (622 | 10.9%), and European (444 | 7.8%), together accounting for 71.1% of all Wyndmoor residents.
| Ancestry | # Population | % Population |
| African | 57 | 1.0% |
| Albanian | 23 | 0.4% |
| American | 182 | 3.2% |
| Arab | 9 | 0.2% |
| Argentinean | 36 | 0.6% |
| Austrian | 21 | 0.4% |
| Belgian | 8 | 0.1% |
| British | 55 | 1.0% |
| Burmese | 49 | 0.9% |
| Chickasaw | 8 | 0.1% |
| Choctaw | 8 | 0.1% |
| Dutch | 27 | 0.5% |
| Eastern European | 29 | 0.5% |
| English | 752 | 13.2% |
| European | 444 | 7.8% |
| French | 164 | 2.9% |
| French Canadian | 34 | 0.6% |
| German | 1,137 | 20.0% |
| Greek | 7 | 0.1% |
| Hungarian | 114 | 2.0% |
| Indian (Asian) | 79 | 1.4% |
| Irish | 1,099 | 19.3% |
| Iroquois | 1 | 0.0% |
| Italian | 622 | 10.9% |
| Korean | 57 | 1.0% |
| Lithuanian | 161 | 2.8% |
| Maltese | 20 | 0.4% |
| Mexican | 20 | 0.4% |
| Norwegian | 58 | 1.0% |
| Pennsylvania German | 7 | 0.1% |
| Polish | 259 | 4.5% |
| Puerto Rican | 10 | 0.2% |
| Romanian | 8 | 0.1% |
| Russian | 125 | 2.2% |
| Scotch-Irish | 43 | 0.7% |
| Scottish | 255 | 4.5% |
| Slavic | 6 | 0.1% |
| Slovak | 9 | 0.2% |
| South American | 36 | 0.6% |
| Subsaharan African | 57 | 1.0% |
| Swedish | 34 | 0.6% |
| Swiss | 37 | 0.6% |
| Thai | 6 | 0.1% |
| Trinidadian and Tobagonian | 18 | 0.3% |
| Ukrainian | 38 | 0.7% |
| Welsh | 65 | 1.1% |
| West Indian | 11 | 0.2% | View All 47 Rows |
Immigrants in Wyndmoor
The most numerous immigrant groups reported in Wyndmoor came from Europe (114 | 2.0%), Asia (77 | 1.3%), Eastern Asia (77 | 1.3%), China (68 | 1.2%), and Latin America (59 | 1.0%), together accounting for 6.9% of all Wyndmoor residents.
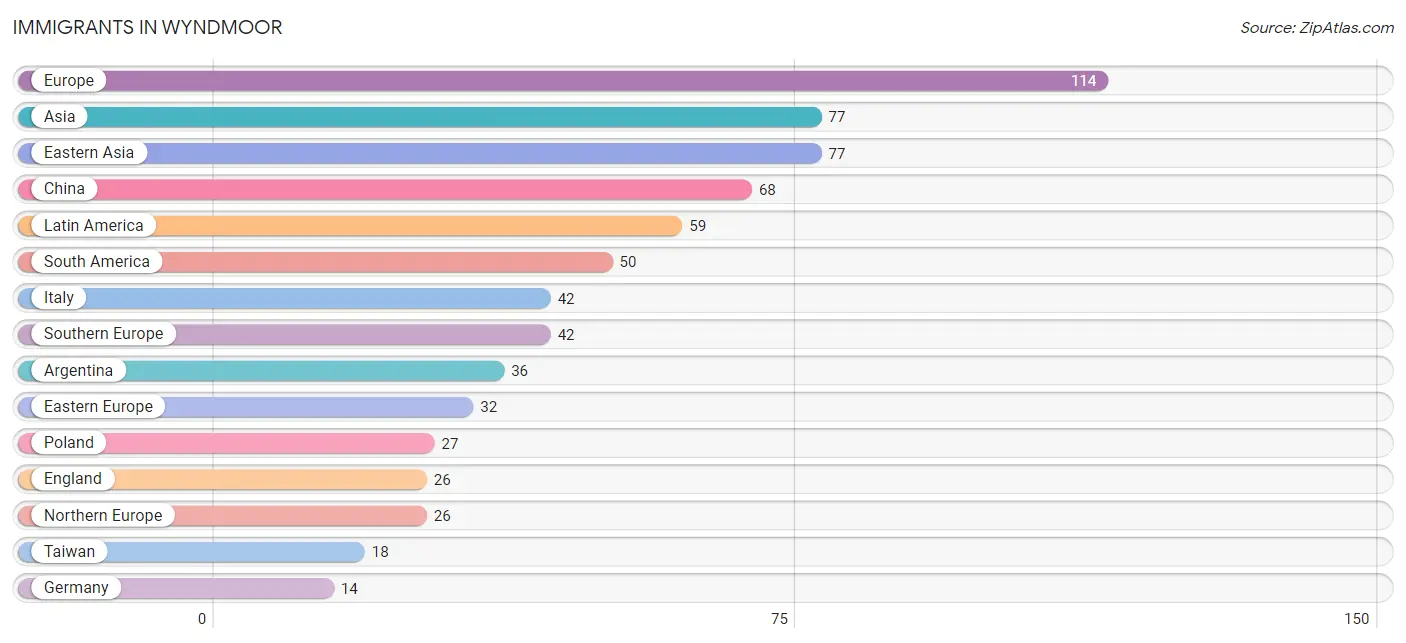
| Immigration Origin | # Population | % Population |
| Argentina | 36 | 0.6% |
| Asia | 77 | 1.3% |
| Canada | 6 | 0.1% |
| Caribbean | 9 | 0.2% |
| China | 68 | 1.2% |
| Eastern Asia | 77 | 1.3% |
| Eastern Europe | 32 | 0.6% |
| England | 26 | 0.5% |
| Europe | 114 | 2.0% |
| Germany | 14 | 0.3% |
| Italy | 42 | 0.7% |
| Jamaica | 9 | 0.2% |
| Korea | 9 | 0.2% |
| Latin America | 59 | 1.0% |
| Northern Europe | 26 | 0.5% |
| Poland | 27 | 0.5% |
| Russia | 5 | 0.1% |
| South America | 50 | 0.9% |
| Southern Europe | 42 | 0.7% |
| Taiwan | 18 | 0.3% |
| Venezuela | 14 | 0.3% |
| Western Europe | 14 | 0.3% | View All 22 Rows |
Sex and Age in Wyndmoor
Sex and Age in Wyndmoor
The most populous age groups in Wyndmoor are 60 to 64 Years (359 | 13.3%) for men and 35 to 39 Years (299 | 10.0%) for women.
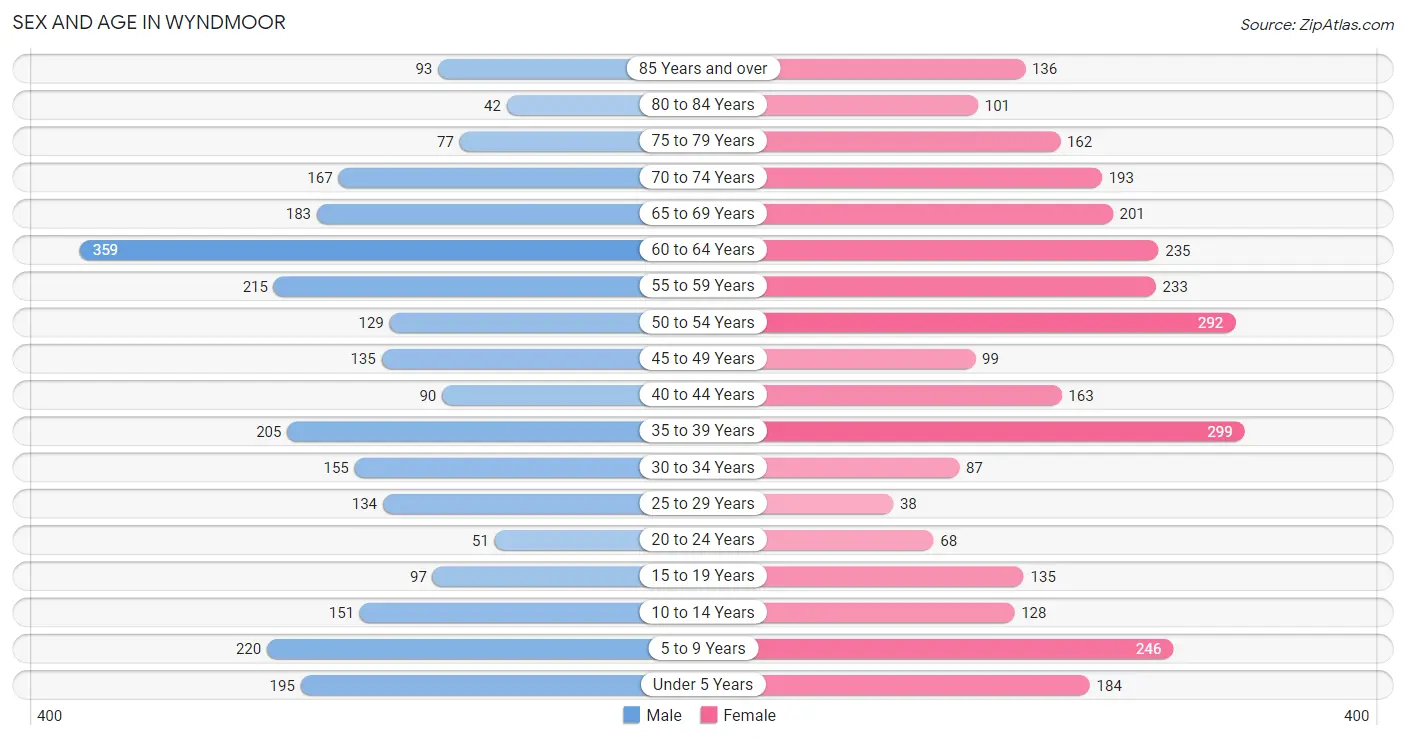
| Age Bracket | Male | Female |
| Under 5 Years | 195 (7.2%) | 184 (6.1%) |
| 5 to 9 Years | 220 (8.2%) | 246 (8.2%) |
| 10 to 14 Years | 151 (5.6%) | 128 (4.3%) |
| 15 to 19 Years | 97 (3.6%) | 135 (4.5%) |
| 20 to 24 Years | 51 (1.9%) | 68 (2.3%) |
| 25 to 29 Years | 134 (5.0%) | 38 (1.3%) |
| 30 to 34 Years | 155 (5.7%) | 87 (2.9%) |
| 35 to 39 Years | 205 (7.6%) | 299 (10.0%) |
| 40 to 44 Years | 90 (3.3%) | 163 (5.4%) |
| 45 to 49 Years | 135 (5.0%) | 99 (3.3%) |
| 50 to 54 Years | 129 (4.8%) | 292 (9.7%) |
| 55 to 59 Years | 215 (8.0%) | 233 (7.8%) |
| 60 to 64 Years | 359 (13.3%) | 235 (7.8%) |
| 65 to 69 Years | 183 (6.8%) | 201 (6.7%) |
| 70 to 74 Years | 167 (6.2%) | 193 (6.4%) |
| 75 to 79 Years | 77 (2.9%) | 162 (5.4%) |
| 80 to 84 Years | 42 (1.6%) | 101 (3.4%) |
| 85 Years and over | 93 (3.5%) | 136 (4.5%) |
| Total | 2,698 (100.0%) | 3,000 (100.0%) |
Families and Households in Wyndmoor
Median Family Size in Wyndmoor
The median family size in Wyndmoor is 3.19 persons per family, with married-couple families (1,232 | 89.5%) accounting for the largest median family size of 3.23 persons per family. On the other hand, single male/father families (60 | 4.4%) represent the smallest median family size with 2.68 persons per family.
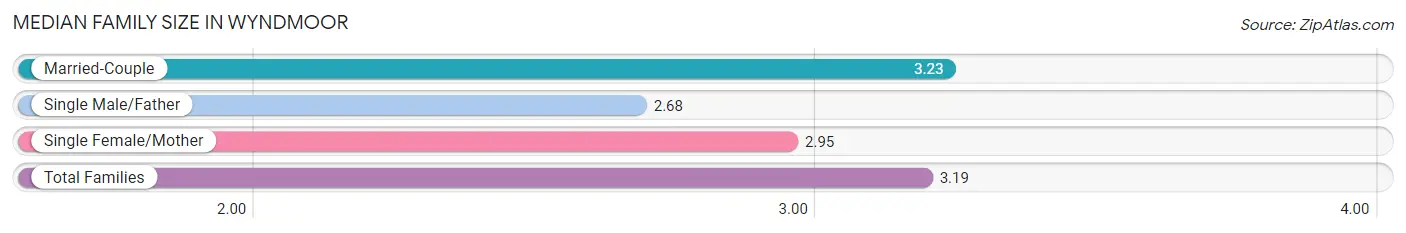
| Family Type | # Families | Family Size |
| Married-Couple | 1,232 (89.5%) | 3.23 |
| Single Male/Father | 60 (4.4%) | 2.68 |
| Single Female/Mother | 84 (6.1%) | 2.95 |
| Total Families | 1,376 (100.0%) | 3.19 |
Median Household Size in Wyndmoor
The median household size in Wyndmoor is 2.51 persons per household, with married-couple households (1,232 | 59.3%) accounting for the largest median household size of 3.28 persons per household. non-family households (703 | 33.8%) represent the smallest median household size with 1.06 persons per household.
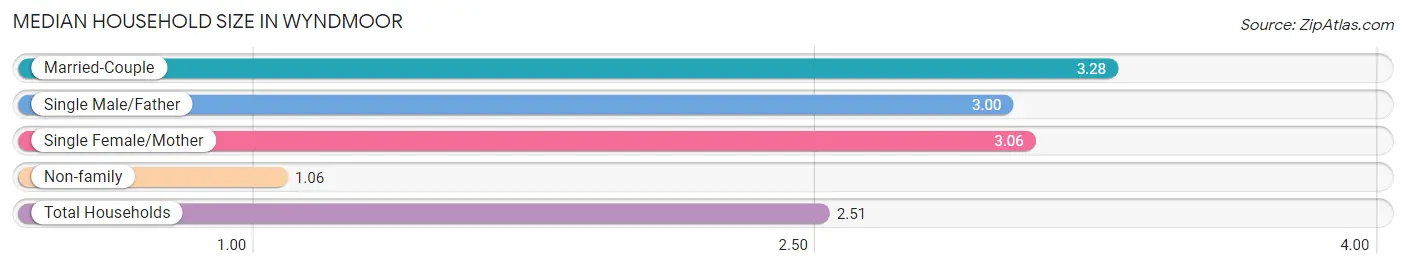
| Household Type | # Households | Household Size |
| Married-Couple | 1,232 (59.3%) | 3.28 |
| Single Male/Father | 60 (2.9%) | 3.00 |
| Single Female/Mother | 84 (4.0%) | 3.06 |
| Non-family | 703 (33.8%) | 1.06 |
| Total Households | 2,079 (100.0%) | 2.51 |
Household Size by Marriage Status in Wyndmoor
Out of a total of 2,079 households in Wyndmoor, 1,376 (66.2%) are family households, while 703 (33.8%) are nonfamily households. The most numerous type of family households are 2-person households, comprising 558, and the most common type of nonfamily households are 1-person households, comprising 659.
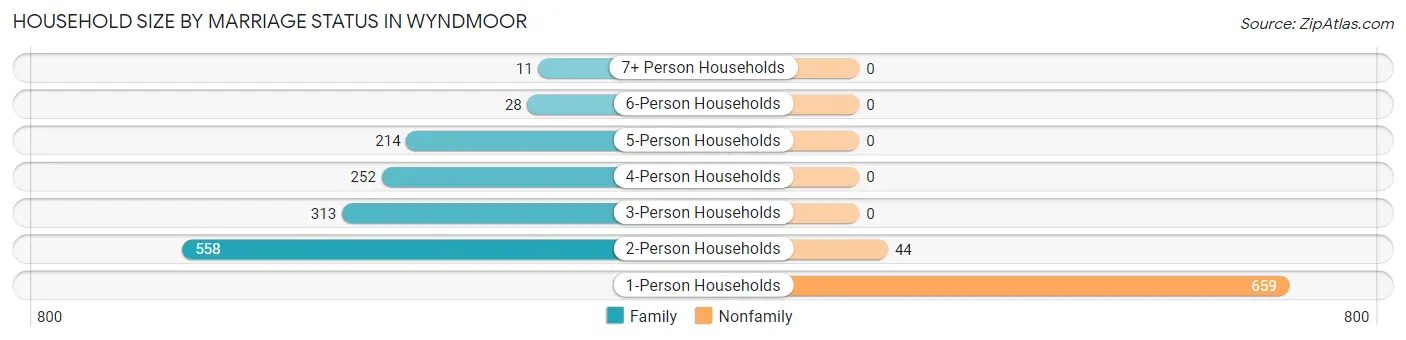
| Household Size | Family Households | Nonfamily Households |
| 1-Person Households | - | 659 (31.7%) |
| 2-Person Households | 558 (26.8%) | 44 (2.1%) |
| 3-Person Households | 313 (15.1%) | 0 (0.0%) |
| 4-Person Households | 252 (12.1%) | 0 (0.0%) |
| 5-Person Households | 214 (10.3%) | 0 (0.0%) |
| 6-Person Households | 28 (1.3%) | 0 (0.0%) |
| 7+ Person Households | 11 (0.5%) | 0 (0.0%) |
| Total | 1,376 (66.2%) | 703 (33.8%) |
Female Fertility in Wyndmoor
Fertility by Age in Wyndmoor
Average fertility rate in Wyndmoor is 45.0 births per 1,000 women. Women in the age bracket of 20 to 34 years have the highest fertility rate with 57.0 births per 1,000 women. Women in the age bracket of 35 to 50 years acount for 75.0% of all women with births.
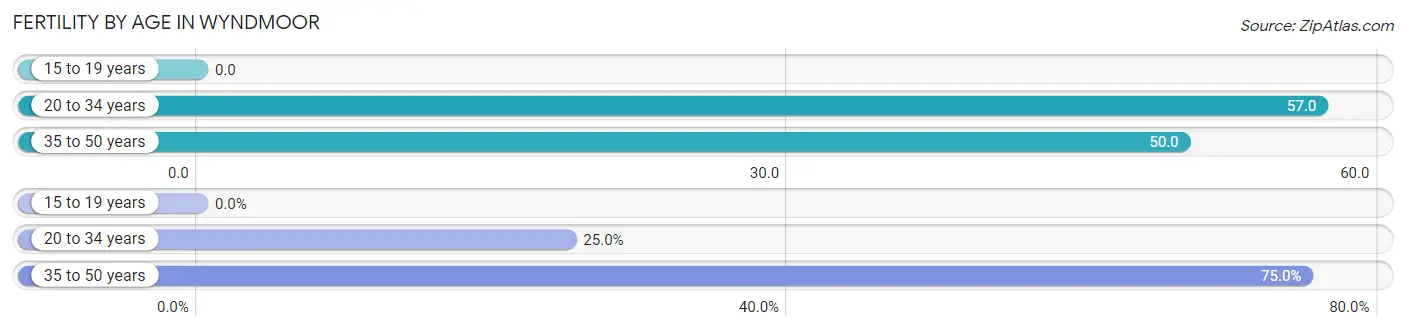
| Age Bracket | Women with Births | Births / 1,000 Women |
| 15 to 19 years | 0 (0.0%) | 0.0 |
| 20 to 34 years | 11 (25.0%) | 57.0 |
| 35 to 50 years | 33 (75.0%) | 50.0 |
| Total | 44 (100.0%) | 45.0 |
Fertility by Age by Marriage Status in Wyndmoor
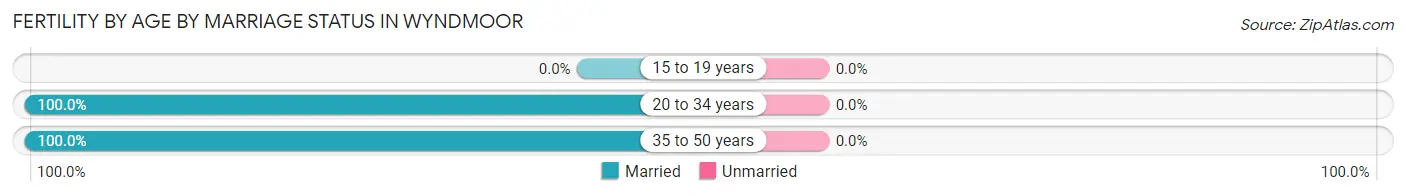
| Age Bracket | Married | Unmarried |
| 15 to 19 years | 0 (0.0%) | 0 (0.0%) |
| 20 to 34 years | 11 (100.0%) | 0 (0.0%) |
| 35 to 50 years | 33 (100.0%) | 0 (0.0%) |
| Total | 44 (100.0%) | 0 (0.0%) |
Fertility by Education in Wyndmoor
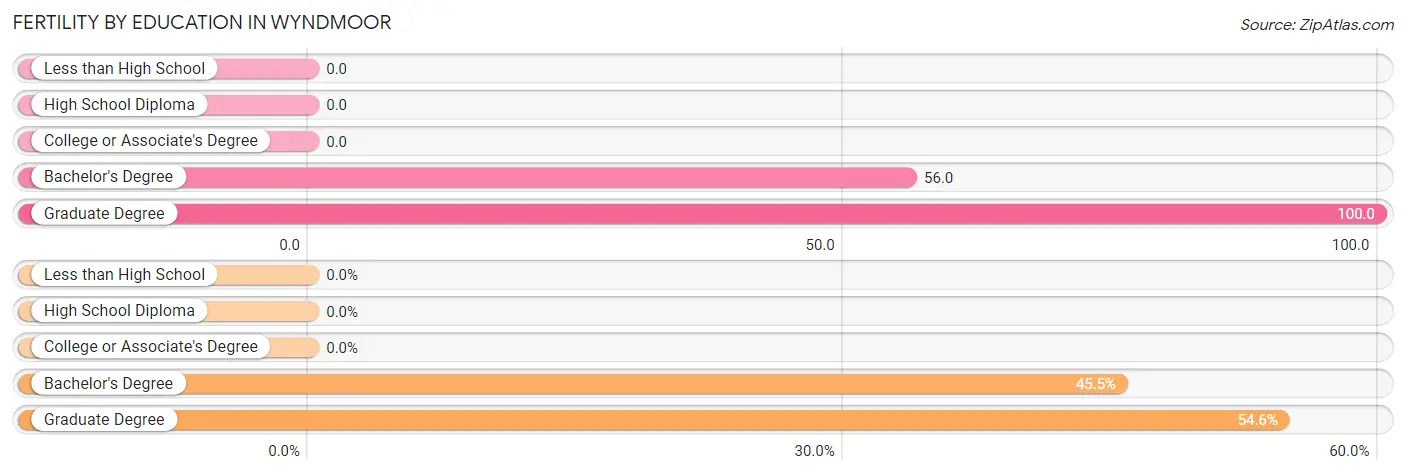
| Educational Attainment | Women with Births | Births / 1,000 Women |
| Less than High School | 0 (0.0%) | 0.0 |
| High School Diploma | 0 (0.0%) | 0.0 |
| College or Associate's Degree | 0 (0.0%) | 0.0 |
| Bachelor's Degree | 20 (45.5%) | 56.0 |
| Graduate Degree | 24 (54.5%) | 100.0 |
| Total | 44 (100.0%) | 45.0 |
Fertility by Education by Marriage Status in Wyndmoor
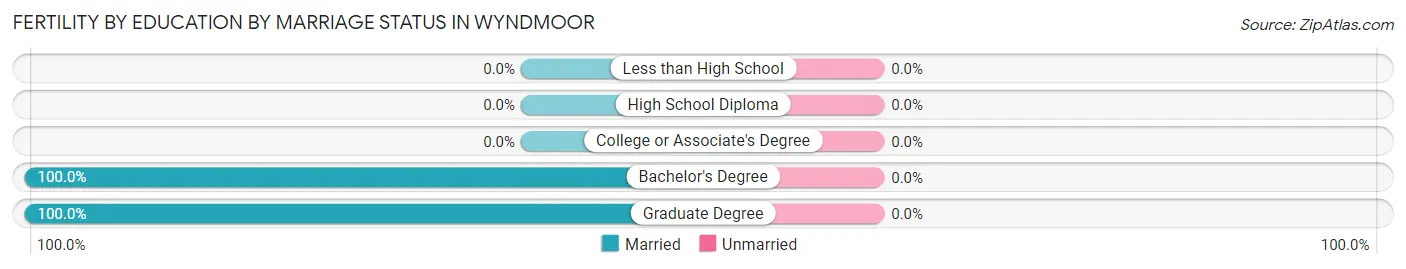
| Educational Attainment | Married | Unmarried |
| Less than High School | 0 (0.0%) | 0 (0.0%) |
| High School Diploma | 0 (0.0%) | 0 (0.0%) |
| College or Associate's Degree | 0 (0.0%) | 0 (0.0%) |
| Bachelor's Degree | 20 (100.0%) | 0 (0.0%) |
| Graduate Degree | 24 (100.0%) | 0 (0.0%) |
| Total | 44 (100.0%) | 0 (0.0%) |
Employment Characteristics in Wyndmoor
Employment by Class of Employer in Wyndmoor
Among the 2,504 employed individuals in Wyndmoor, private company employees (1,356 | 54.1%), not-for-profit organizations (449 | 17.9%), and self-employed (not incorporated) (228 | 9.1%) make up the most common classes of employment.
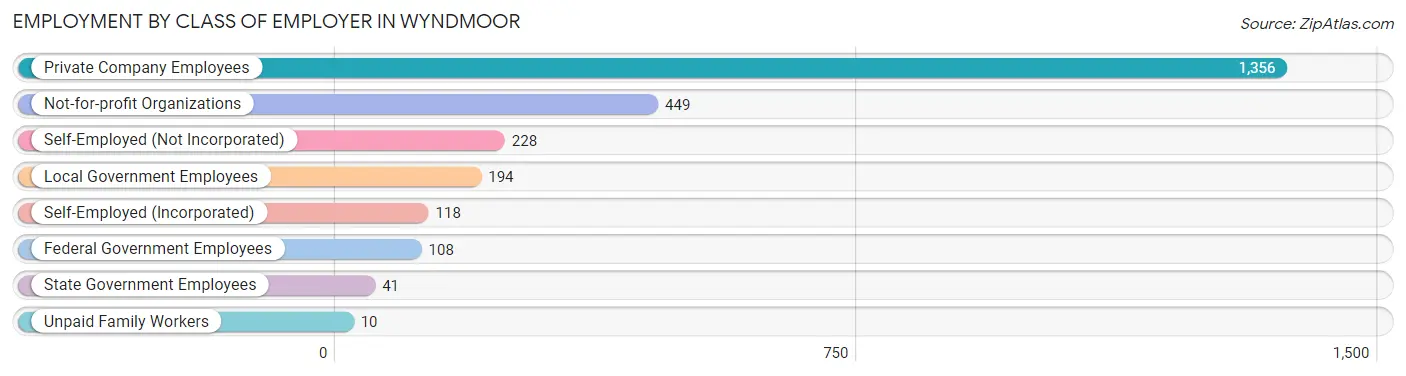
| Employer Class | # Employees | % Employees |
| Private Company Employees | 1,356 | 54.1% |
| Self-Employed (Incorporated) | 118 | 4.7% |
| Self-Employed (Not Incorporated) | 228 | 9.1% |
| Not-for-profit Organizations | 449 | 17.9% |
| Local Government Employees | 194 | 7.7% |
| State Government Employees | 41 | 1.6% |
| Federal Government Employees | 108 | 4.3% |
| Unpaid Family Workers | 10 | 0.4% |
| Total | 2,504 | 100.0% |
Employment Status by Age in Wyndmoor
According to the labor force statistics for Wyndmoor, out of the total population over 16 years of age (4,516), 60.1% or 2,714 individuals are in the labor force, with 5.2% or 141 of them unemployed. The age group with the highest labor force participation rate is 35 to 44 years, with 88.8% or 672 individuals in the labor force. Within the labor force, the 16 to 19 years age range has the highest percentage of unemployed individuals, with 27.8% or 10 of them being unemployed.
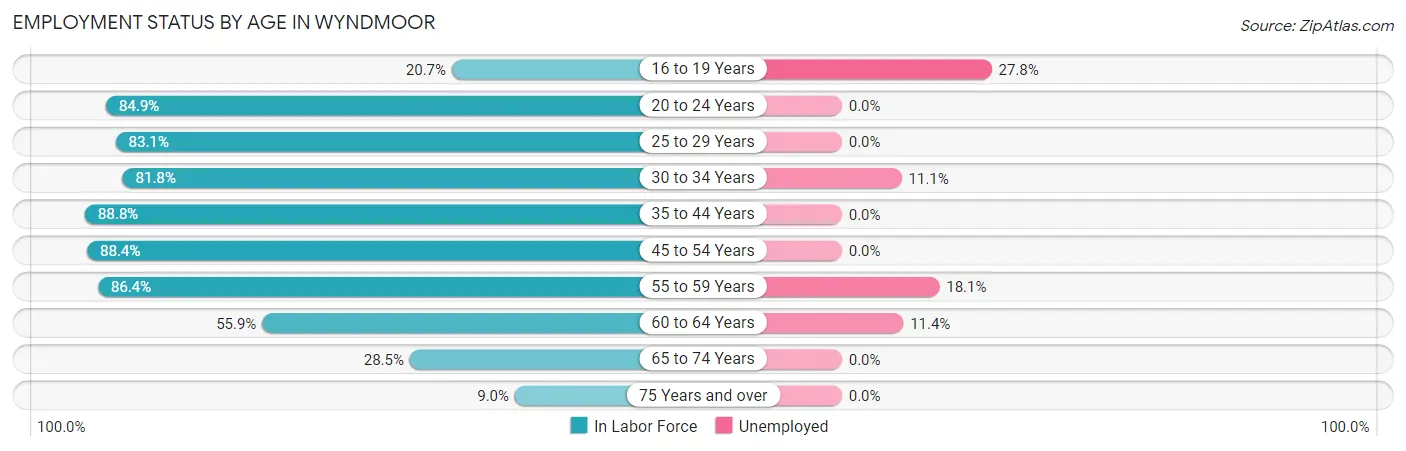
| Age Bracket | In Labor Force | Unemployed |
| 16 to 19 Years | 36 (20.7%) | 10 (27.8%) |
| 20 to 24 Years | 101 (84.9%) | 0 (0.0%) |
| 25 to 29 Years | 143 (83.1%) | 0 (0.0%) |
| 30 to 34 Years | 198 (81.8%) | 22 (11.1%) |
| 35 to 44 Years | 672 (88.8%) | 0 (0.0%) |
| 45 to 54 Years | 579 (88.4%) | 0 (0.0%) |
| 55 to 59 Years | 387 (86.4%) | 70 (18.1%) |
| 60 to 64 Years | 332 (55.9%) | 38 (11.4%) |
| 65 to 74 Years | 212 (28.5%) | 0 (0.0%) |
| 75 Years and over | 55 (9.0%) | 0 (0.0%) |
| Total | 2,714 (60.1%) | 141 (5.2%) |
Employment Status by Educational Attainment in Wyndmoor
According to labor force statistics for Wyndmoor, 80.6% of individuals (2,312) out of the total population between 25 and 64 years of age (2,868) are in the labor force, with 5.6% or 129 of them being unemployed. The group with the highest labor force participation rate are those with the educational attainment of bachelor's degree or higher, with 81.9% or 1,685 individuals in the labor force. Within the labor force, individuals with high school diploma education have the highest percentage of unemployment, with 17.9% or 38 of them being unemployed.
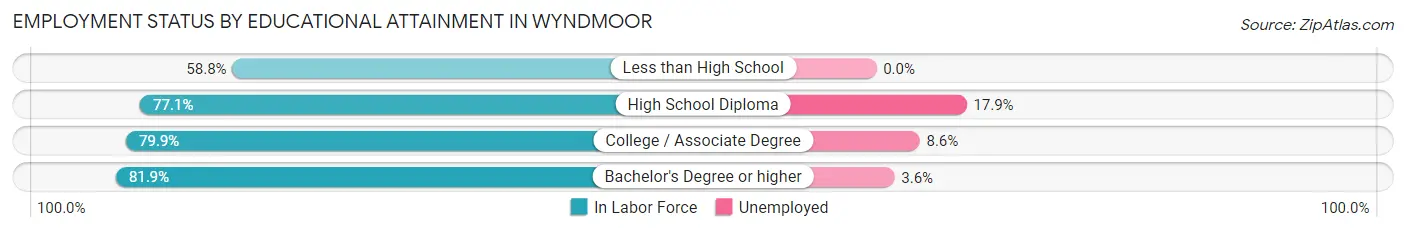
| Educational Attainment | In Labor Force | Unemployed |
| Less than High School | 40 (58.8%) | 0 (0.0%) |
| High School Diploma | 212 (77.1%) | 49 (17.9%) |
| College / Associate Degree | 374 (79.9%) | 40 (8.6%) |
| Bachelor's Degree or higher | 1,685 (81.9%) | 74 (3.6%) |
| Total | 2,312 (80.6%) | 161 (5.6%) |
Employment Occupations by Sex in Wyndmoor
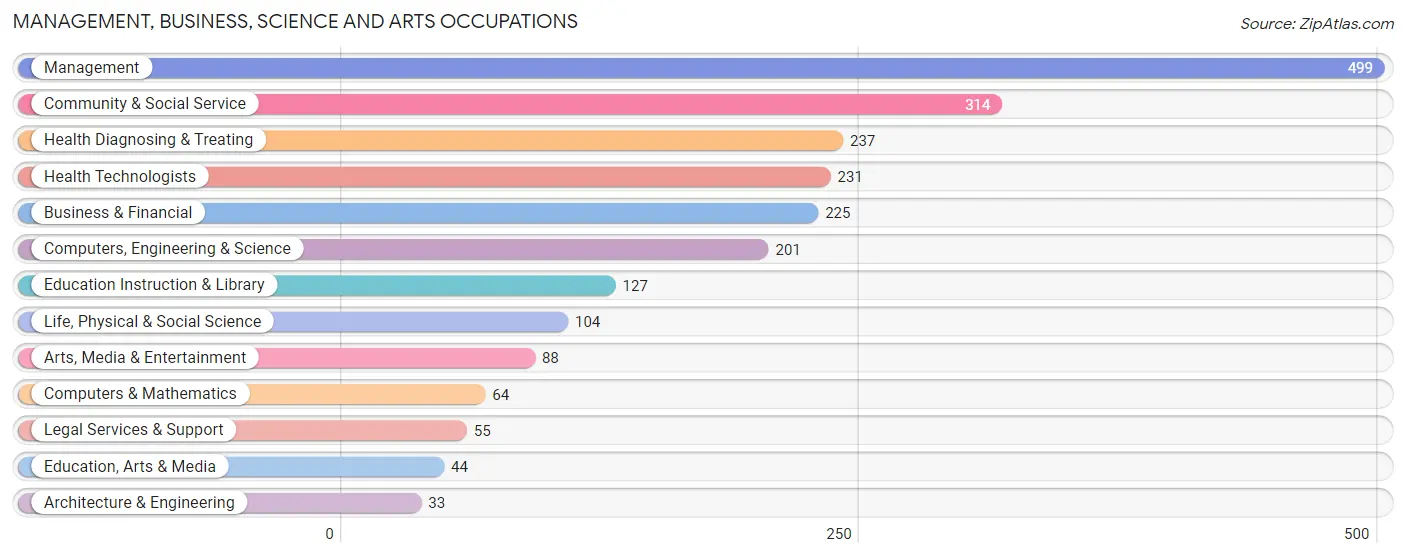
Management, Business, Science and Arts Occupations
The most common Management, Business, Science and Arts occupations in Wyndmoor are Management (499 | 19.4%), Community & Social Service (314 | 12.2%), Health Diagnosing & Treating (237 | 9.2%), Health Technologists (231 | 9.0%), and Business & Financial (225 | 8.7%).
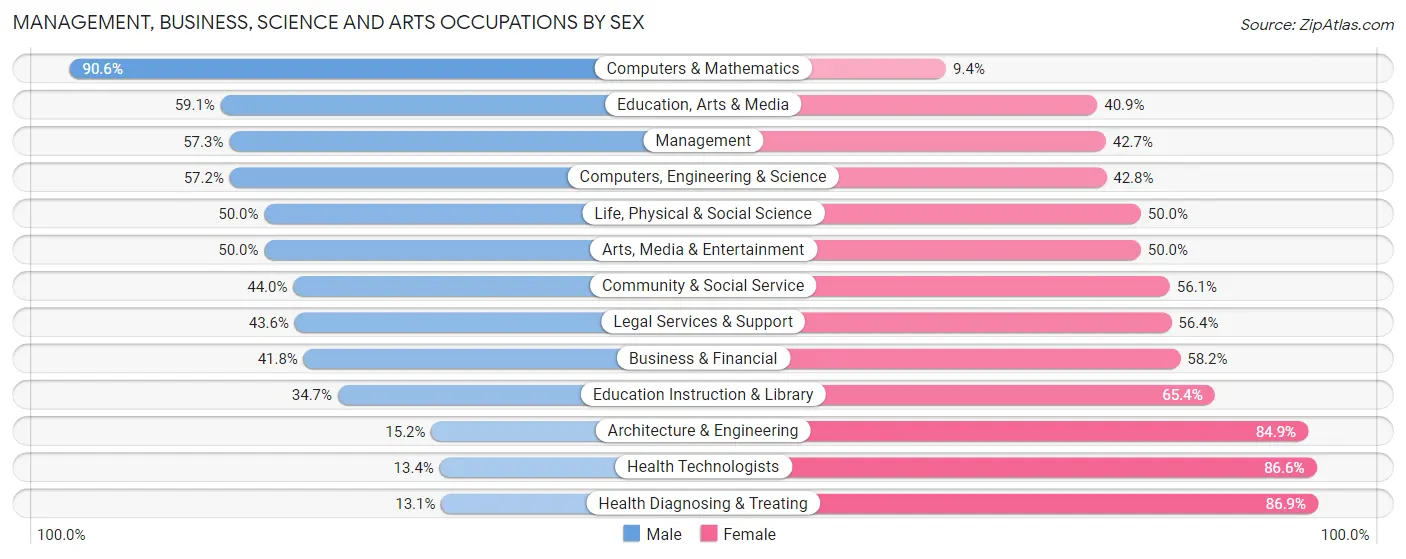
Management, Business, Science and Arts Occupations by Sex
Within the Management, Business, Science and Arts occupations in Wyndmoor, the most male-oriented occupations are Computers & Mathematics (90.6%), Education, Arts & Media (59.1%), and Management (57.3%), while the most female-oriented occupations are Health Diagnosing & Treating (86.9%), Health Technologists (86.6%), and Architecture & Engineering (84.9%).
| Occupation | Male | Female |
| Management | 286 (57.3%) | 213 (42.7%) |
| Business & Financial | 94 (41.8%) | 131 (58.2%) |
| Computers, Engineering & Science | 115 (57.2%) | 86 (42.8%) |
| Computers & Mathematics | 58 (90.6%) | 6 (9.4%) |
| Architecture & Engineering | 5 (15.1%) | 28 (84.9%) |
| Life, Physical & Social Science | 52 (50.0%) | 52 (50.0%) |
| Community & Social Service | 138 (44.0%) | 176 (56.0%) |
| Education, Arts & Media | 26 (59.1%) | 18 (40.9%) |
| Legal Services & Support | 24 (43.6%) | 31 (56.4%) |
| Education Instruction & Library | 44 (34.6%) | 83 (65.3%) |
| Arts, Media & Entertainment | 44 (50.0%) | 44 (50.0%) |
| Health Diagnosing & Treating | 31 (13.1%) | 206 (86.9%) |
| Health Technologists | 31 (13.4%) | 200 (86.6%) |
| Total (Category) | 664 (45.0%) | 812 (55.0%) |
| Total (Overall) | 1,302 (50.6%) | 1,273 (49.4%) |
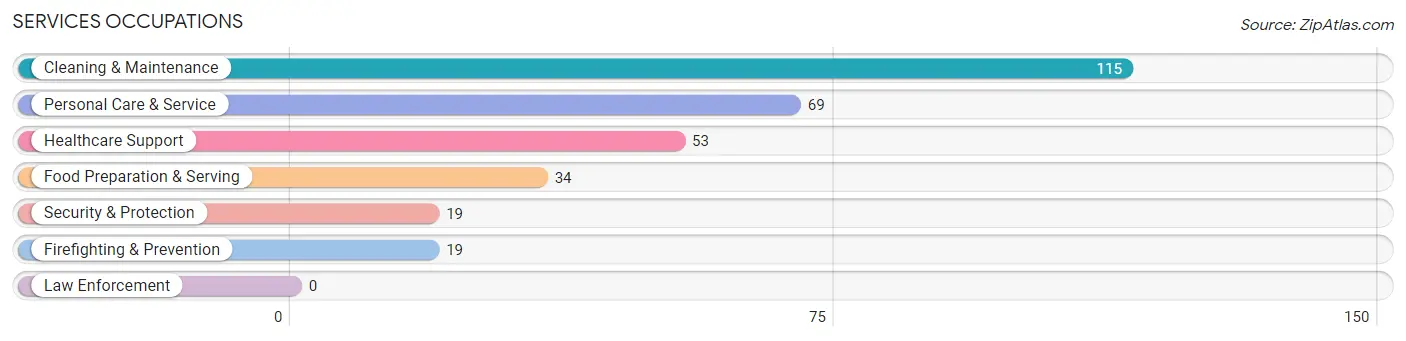
Services Occupations
The most common Services occupations in Wyndmoor are Cleaning & Maintenance (115 | 4.5%), Personal Care & Service (69 | 2.7%), Healthcare Support (53 | 2.1%), Food Preparation & Serving (34 | 1.3%), and Security & Protection (19 | 0.7%).
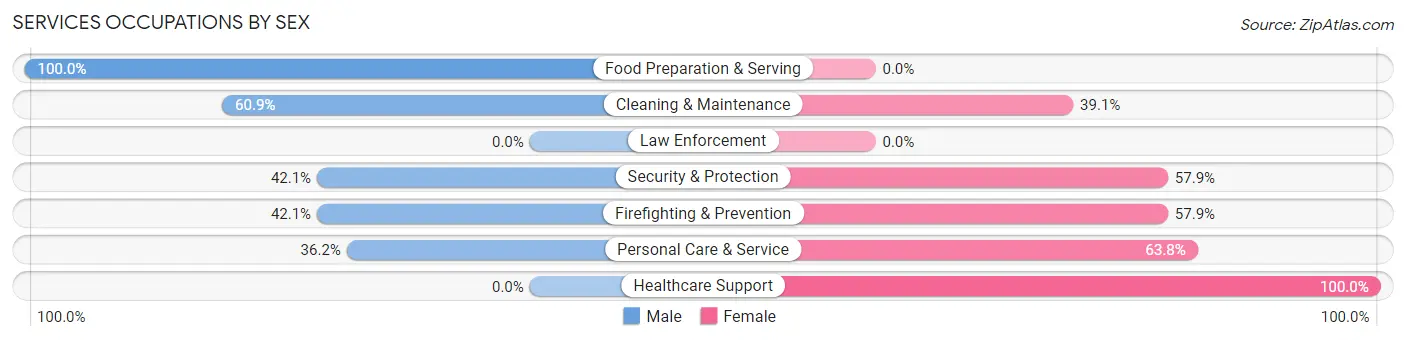
Services Occupations by Sex
Within the Services occupations in Wyndmoor, the most male-oriented occupations are Food Preparation & Serving (100.0%), Cleaning & Maintenance (60.9%), and Security & Protection (42.1%), while the most female-oriented occupations are Healthcare Support (100.0%), Personal Care & Service (63.8%), and Security & Protection (57.9%).
| Occupation | Male | Female |
| Healthcare Support | 0 (0.0%) | 53 (100.0%) |
| Security & Protection | 8 (42.1%) | 11 (57.9%) |
| Firefighting & Prevention | 8 (42.1%) | 11 (57.9%) |
| Law Enforcement | 0 (0.0%) | 0 (0.0%) |
| Food Preparation & Serving | 34 (100.0%) | 0 (0.0%) |
| Cleaning & Maintenance | 70 (60.9%) | 45 (39.1%) |
| Personal Care & Service | 25 (36.2%) | 44 (63.8%) |
| Total (Category) | 137 (47.2%) | 153 (52.8%) |
| Total (Overall) | 1,302 (50.6%) | 1,273 (49.4%) |
Sales and Office Occupations
The most common Sales and Office occupations in Wyndmoor are Sales & Related (413 | 16.0%), and Office & Administration (168 | 6.5%).
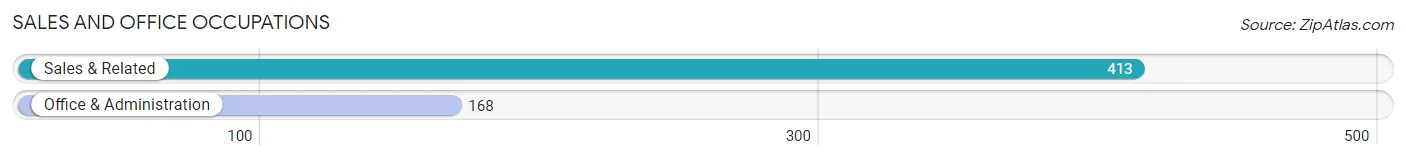
Sales and Office Occupations by Sex
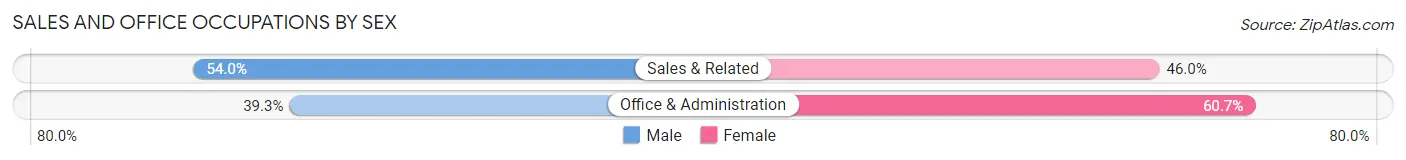
| Occupation | Male | Female |
| Sales & Related | 223 (54.0%) | 190 (46.0%) |
| Office & Administration | 66 (39.3%) | 102 (60.7%) |
| Total (Category) | 289 (49.7%) | 292 (50.3%) |
| Total (Overall) | 1,302 (50.6%) | 1,273 (49.4%) |
Natural Resources, Construction and Maintenance Occupations
The most common Natural Resources, Construction and Maintenance occupations in Wyndmoor are Construction & Extraction (99 | 3.8%), and Installation, Maintenance & Repair (46 | 1.8%).
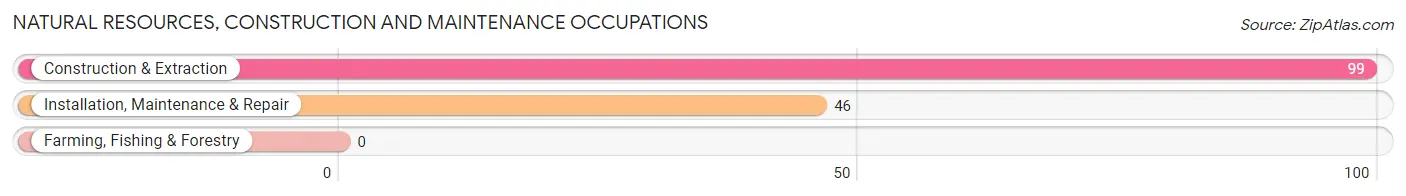
Natural Resources, Construction and Maintenance Occupations by Sex
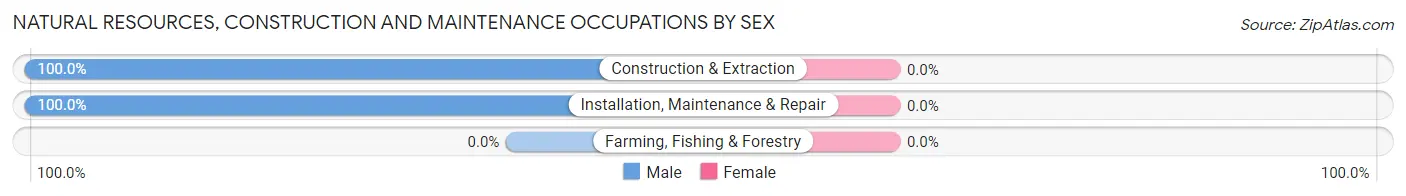
| Occupation | Male | Female |
| Farming, Fishing & Forestry | 0 (0.0%) | 0 (0.0%) |
| Construction & Extraction | 99 (100.0%) | 0 (0.0%) |
| Installation, Maintenance & Repair | 46 (100.0%) | 0 (0.0%) |
| Total (Category) | 145 (100.0%) | 0 (0.0%) |
| Total (Overall) | 1,302 (50.6%) | 1,273 (49.4%) |
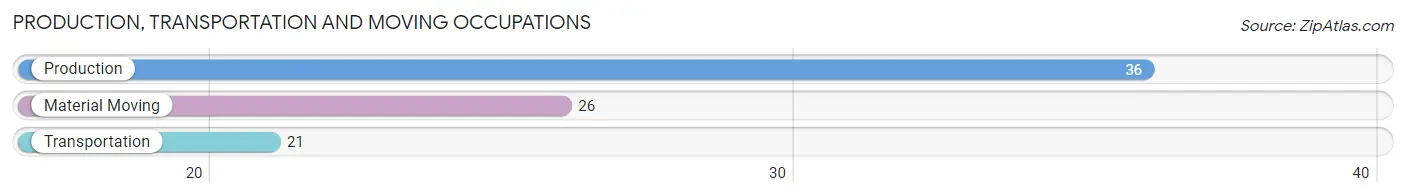
Production, Transportation and Moving Occupations
The most common Production, Transportation and Moving occupations in Wyndmoor are Production (36 | 1.4%), Material Moving (26 | 1.0%), and Transportation (21 | 0.8%).
Production, Transportation and Moving Occupations by Sex
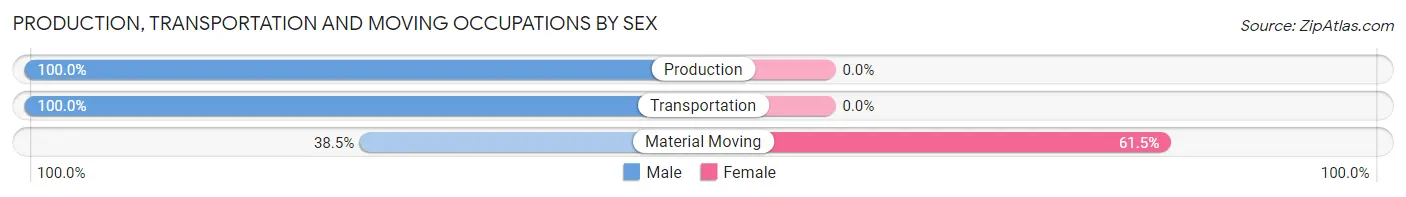
| Occupation | Male | Female |
| Production | 36 (100.0%) | 0 (0.0%) |
| Transportation | 21 (100.0%) | 0 (0.0%) |
| Material Moving | 10 (38.5%) | 16 (61.5%) |
| Total (Category) | 67 (80.7%) | 16 (19.3%) |
| Total (Overall) | 1,302 (50.6%) | 1,273 (49.4%) |
Employment Industries by Sex in Wyndmoor
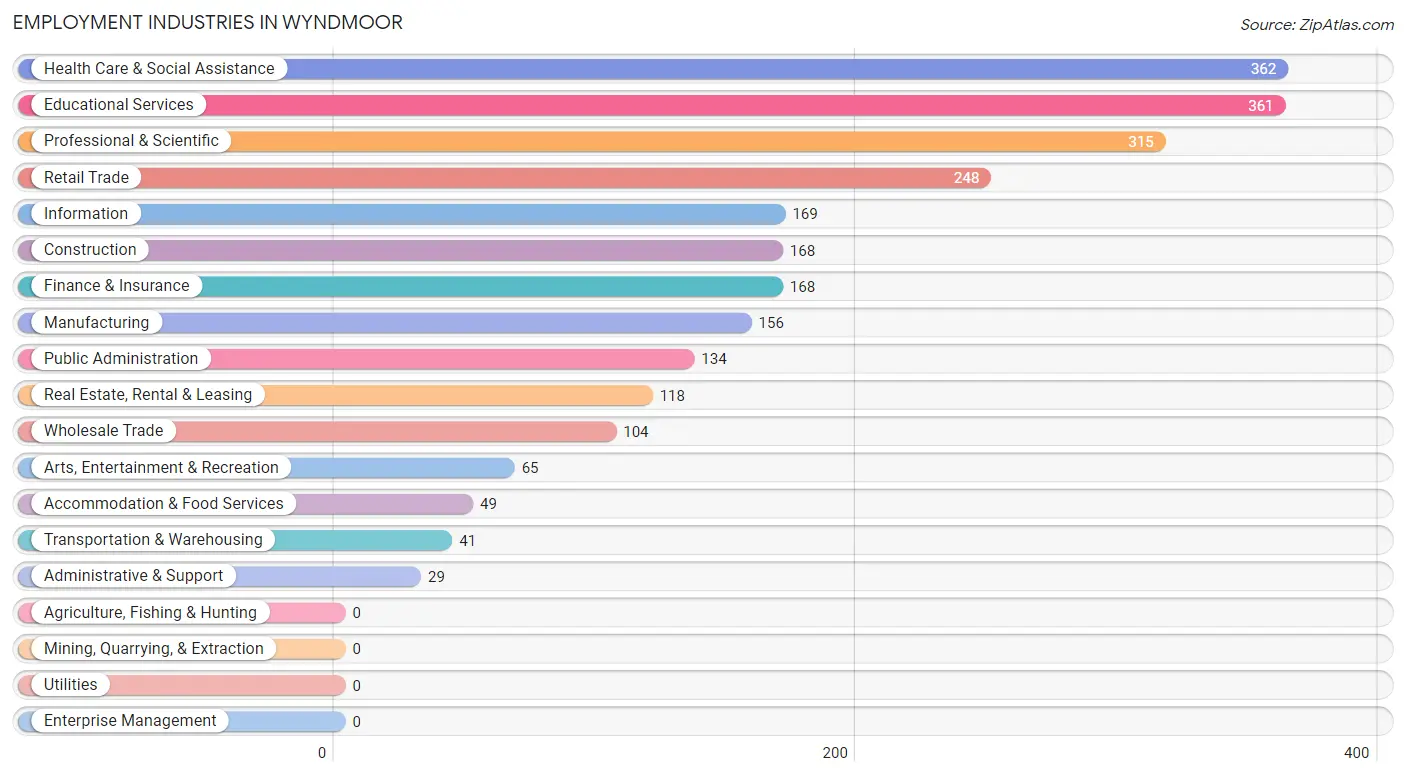
Employment Industries in Wyndmoor
The major employment industries in Wyndmoor include Health Care & Social Assistance (362 | 14.1%), Educational Services (361 | 14.0%), Professional & Scientific (315 | 12.2%), Retail Trade (248 | 9.6%), and Information (169 | 6.6%).
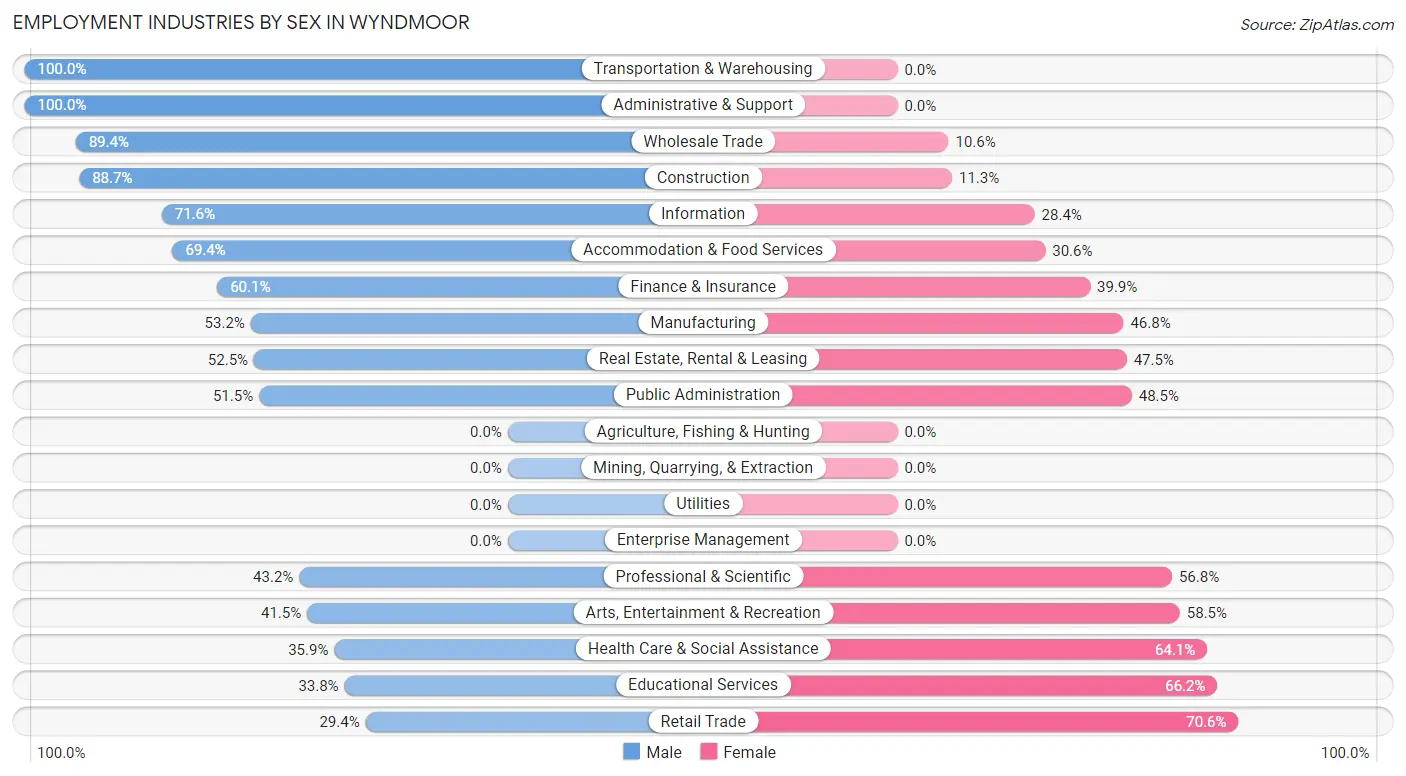
Employment Industries by Sex in Wyndmoor
The Wyndmoor industries that see more men than women are Transportation & Warehousing (100.0%), Administrative & Support (100.0%), and Wholesale Trade (89.4%), whereas the industries that tend to have a higher number of women are Retail Trade (70.6%), Educational Services (66.2%), and Health Care & Social Assistance (64.1%).
| Industry | Male | Female |
| Agriculture, Fishing & Hunting | 0 (0.0%) | 0 (0.0%) |
| Mining, Quarrying, & Extraction | 0 (0.0%) | 0 (0.0%) |
| Construction | 149 (88.7%) | 19 (11.3%) |
| Manufacturing | 83 (53.2%) | 73 (46.8%) |
| Wholesale Trade | 93 (89.4%) | 11 (10.6%) |
| Retail Trade | 73 (29.4%) | 175 (70.6%) |
| Transportation & Warehousing | 41 (100.0%) | 0 (0.0%) |
| Utilities | 0 (0.0%) | 0 (0.0%) |
| Information | 121 (71.6%) | 48 (28.4%) |
| Finance & Insurance | 101 (60.1%) | 67 (39.9%) |
| Real Estate, Rental & Leasing | 62 (52.5%) | 56 (47.5%) |
| Professional & Scientific | 136 (43.2%) | 179 (56.8%) |
| Enterprise Management | 0 (0.0%) | 0 (0.0%) |
| Administrative & Support | 29 (100.0%) | 0 (0.0%) |
| Educational Services | 122 (33.8%) | 239 (66.2%) |
| Health Care & Social Assistance | 130 (35.9%) | 232 (64.1%) |
| Arts, Entertainment & Recreation | 27 (41.5%) | 38 (58.5%) |
| Accommodation & Food Services | 34 (69.4%) | 15 (30.6%) |
| Public Administration | 69 (51.5%) | 65 (48.5%) |
| Total | 1,302 (50.6%) | 1,273 (49.4%) |
Education in Wyndmoor
School Enrollment in Wyndmoor
The most common levels of schooling among the 1,200 students in Wyndmoor are elementary school (335 | 27.9%), high school (220 | 18.3%), and middle school (171 | 14.2%).
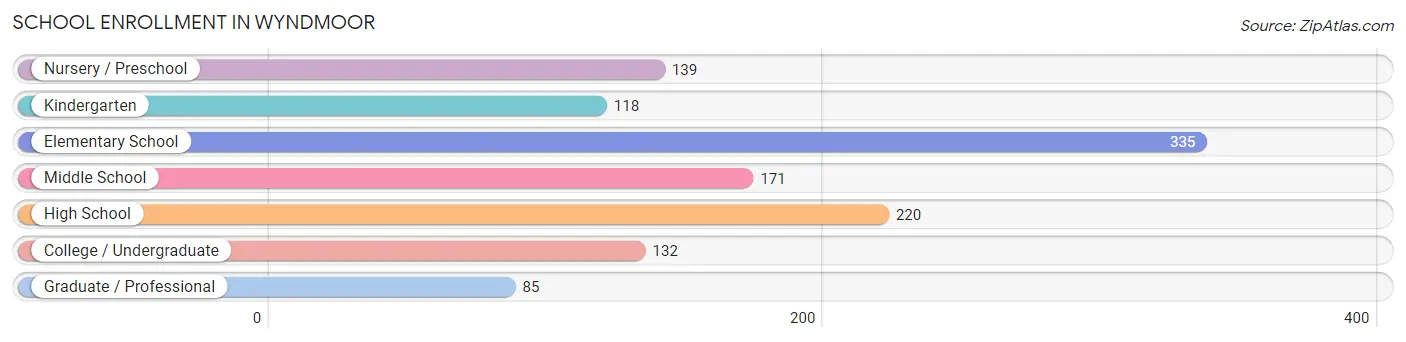
| School Level | # Students | % Students |
| Nursery / Preschool | 139 | 11.6% |
| Kindergarten | 118 | 9.8% |
| Elementary School | 335 | 27.9% |
| Middle School | 171 | 14.2% |
| High School | 220 | 18.3% |
| College / Undergraduate | 132 | 11.0% |
| Graduate / Professional | 85 | 7.1% |
| Total | 1,200 | 100.0% |
School Enrollment by Age by Funding Source in Wyndmoor
Out of a total of 1,200 students who are enrolled in schools in Wyndmoor, 536 (44.7%) attend a private institution, while the remaining 664 (55.3%) are enrolled in public schools. The age group of 3 to 4 year olds has the highest likelihood of being enrolled in private schools, with 95 (100.0% in the age bracket) enrolled. Conversely, the age group of 18 to 19 year olds has the lowest likelihood of being enrolled in a private school, with 61 (89.7% in the age bracket) attending a public institution.
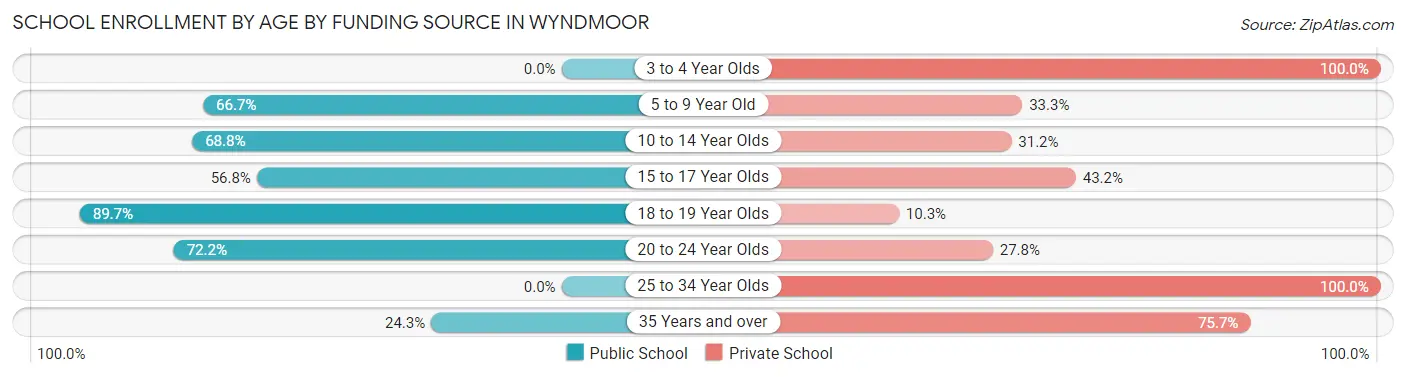
| Age Bracket | Public School | Private School |
| 3 to 4 Year Olds | 0 (0.0%) | 95 (100.0%) |
| 5 to 9 Year Old | 287 (66.7%) | 143 (33.3%) |
| 10 to 14 Year Olds | 185 (68.8%) | 84 (31.2%) |
| 15 to 17 Year Olds | 88 (56.8%) | 67 (43.2%) |
| 18 to 19 Year Olds | 61 (89.7%) | 7 (10.3%) |
| 20 to 24 Year Olds | 26 (72.2%) | 10 (27.8%) |
| 25 to 34 Year Olds | 0 (0.0%) | 77 (100.0%) |
| 35 Years and over | 17 (24.3%) | 53 (75.7%) |
| Total | 664 (55.3%) | 536 (44.7%) |
Educational Attainment by Field of Study in Wyndmoor
Business (544 | 17.8%), bio, nature & agricultural (306 | 10.0%), psychology (300 | 9.8%), science & technology (271 | 8.9%), and social sciences (263 | 8.6%) are the most common fields of study among 3,053 individuals in Wyndmoor who have obtained a bachelor's degree or higher.
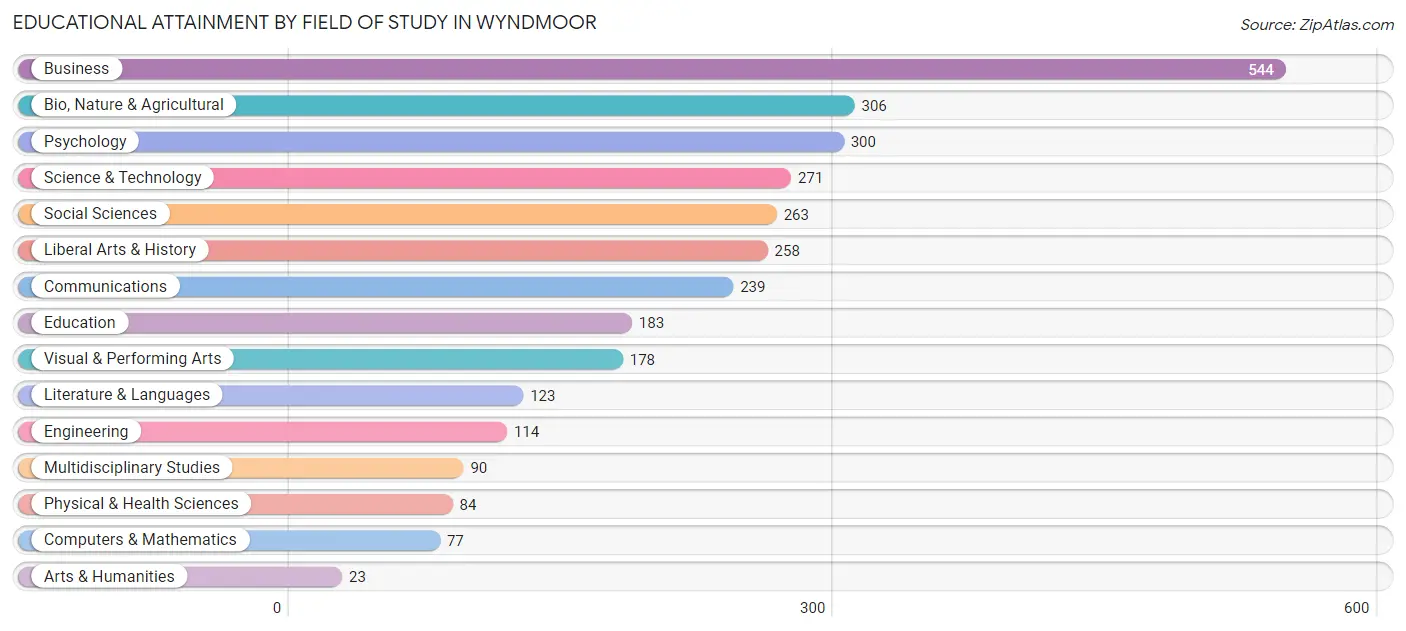
| Field of Study | # Graduates | % Graduates |
| Computers & Mathematics | 77 | 2.5% |
| Bio, Nature & Agricultural | 306 | 10.0% |
| Physical & Health Sciences | 84 | 2.8% |
| Psychology | 300 | 9.8% |
| Social Sciences | 263 | 8.6% |
| Engineering | 114 | 3.7% |
| Multidisciplinary Studies | 90 | 2.9% |
| Science & Technology | 271 | 8.9% |
| Business | 544 | 17.8% |
| Education | 183 | 6.0% |
| Literature & Languages | 123 | 4.0% |
| Liberal Arts & History | 258 | 8.5% |
| Visual & Performing Arts | 178 | 5.8% |
| Communications | 239 | 7.8% |
| Arts & Humanities | 23 | 0.7% |
| Total | 3,053 | 100.0% |
Transportation & Commute in Wyndmoor
Vehicle Availability by Sex in Wyndmoor
The most prevalent vehicle ownership categories in Wyndmoor are males with 2 vehicles (747, accounting for 59.5%) and females with 2 vehicles (554, making up 60.7%).
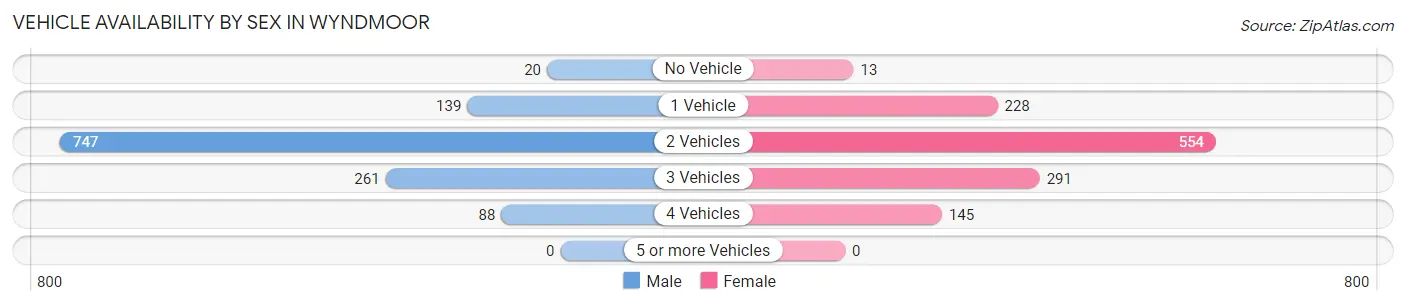
| Vehicles Available | Male | Female |
| No Vehicle | 20 (1.6%) | 13 (1.1%) |
| 1 Vehicle | 139 (11.1%) | 228 (18.5%) |
| 2 Vehicles | 747 (59.5%) | 554 (45.0%) |
| 3 Vehicles | 261 (20.8%) | 291 (23.6%) |
| 4 Vehicles | 88 (7.0%) | 145 (11.8%) |
| 5 or more Vehicles | 0 (0.0%) | 0 (0.0%) |
| Total | 1,255 (100.0%) | 1,231 (100.0%) |
Commute Time in Wyndmoor
The most frequently occuring commute durations in Wyndmoor are 30 to 34 minutes (479 commuters, 24.3%), 45 to 59 minutes (305 commuters, 15.5%), and 5 to 9 minutes (299 commuters, 15.2%).
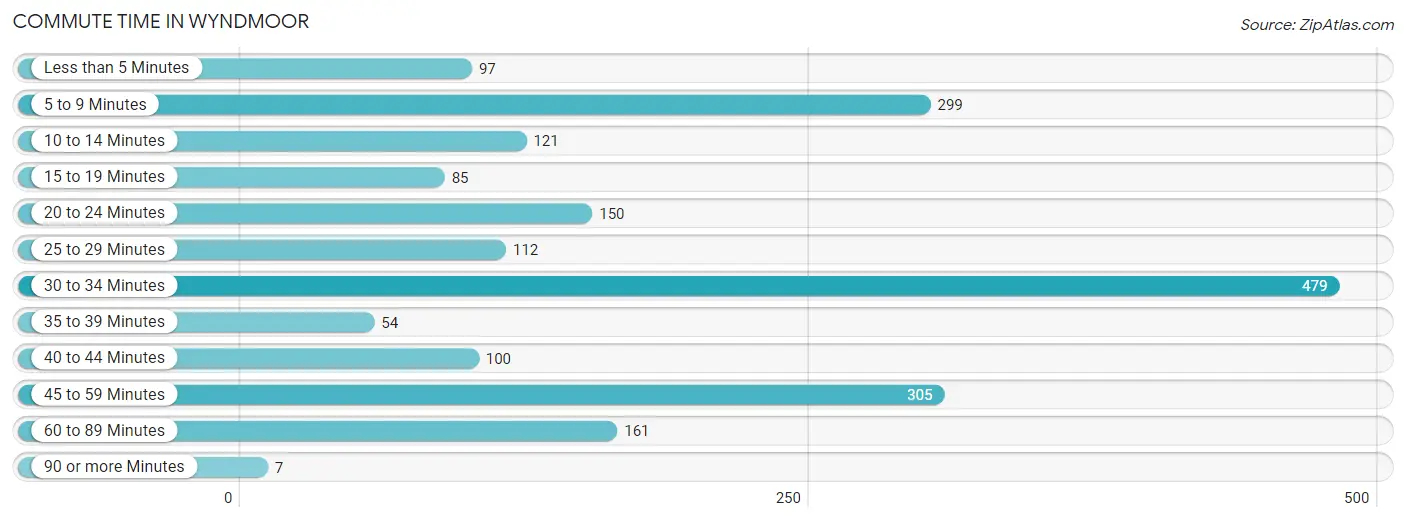
| Commute Time | # Commuters | % Commuters |
| Less than 5 Minutes | 97 | 4.9% |
| 5 to 9 Minutes | 299 | 15.2% |
| 10 to 14 Minutes | 121 | 6.1% |
| 15 to 19 Minutes | 85 | 4.3% |
| 20 to 24 Minutes | 150 | 7.6% |
| 25 to 29 Minutes | 112 | 5.7% |
| 30 to 34 Minutes | 479 | 24.3% |
| 35 to 39 Minutes | 54 | 2.7% |
| 40 to 44 Minutes | 100 | 5.1% |
| 45 to 59 Minutes | 305 | 15.5% |
| 60 to 89 Minutes | 161 | 8.2% |
| 90 or more Minutes | 7 | 0.4% |
Commute Time by Sex in Wyndmoor
The most common commute times in Wyndmoor are 30 to 34 minutes (232 commuters, 22.9%) for males and 30 to 34 minutes (247 commuters, 25.8%) for females.
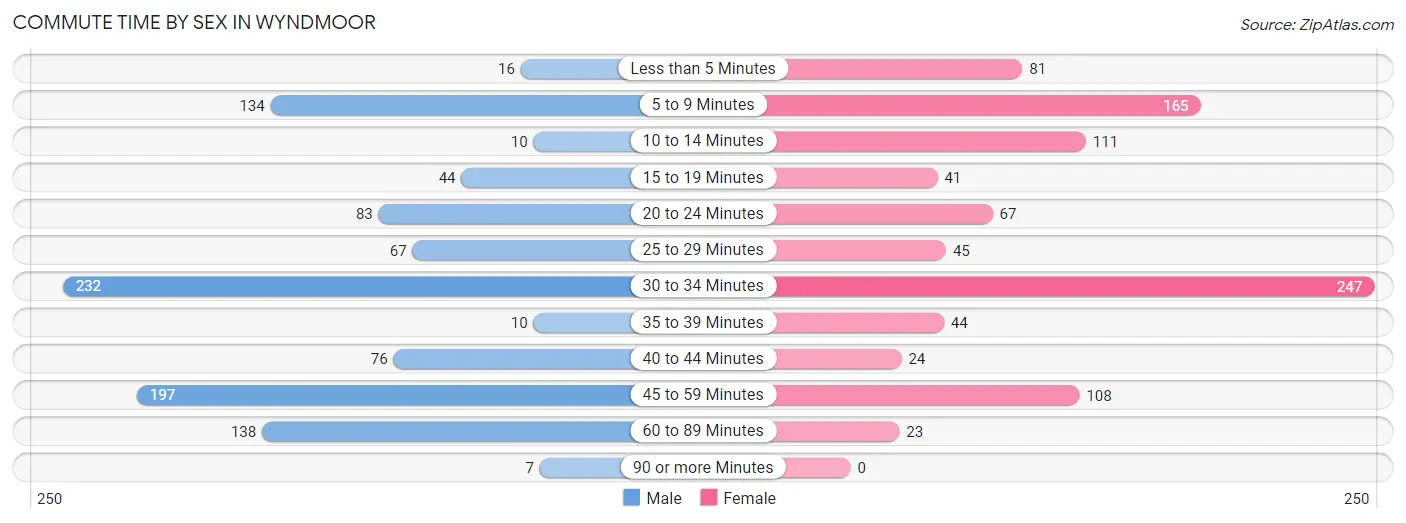
| Commute Time | Male | Female |
| Less than 5 Minutes | 16 (1.6%) | 81 (8.5%) |
| 5 to 9 Minutes | 134 (13.2%) | 165 (17.3%) |
| 10 to 14 Minutes | 10 (1.0%) | 111 (11.6%) |
| 15 to 19 Minutes | 44 (4.3%) | 41 (4.3%) |
| 20 to 24 Minutes | 83 (8.2%) | 67 (7.0%) |
| 25 to 29 Minutes | 67 (6.6%) | 45 (4.7%) |
| 30 to 34 Minutes | 232 (22.9%) | 247 (25.8%) |
| 35 to 39 Minutes | 10 (1.0%) | 44 (4.6%) |
| 40 to 44 Minutes | 76 (7.5%) | 24 (2.5%) |
| 45 to 59 Minutes | 197 (19.4%) | 108 (11.3%) |
| 60 to 89 Minutes | 138 (13.6%) | 23 (2.4%) |
| 90 or more Minutes | 7 (0.7%) | 0 (0.0%) |
Time of Departure to Work by Sex in Wyndmoor
The most frequent times of departure to work in Wyndmoor are 7:00 AM to 7:29 AM (254, 25.1%) for males and 7:30 AM to 7:59 AM (195, 20.4%) for females.
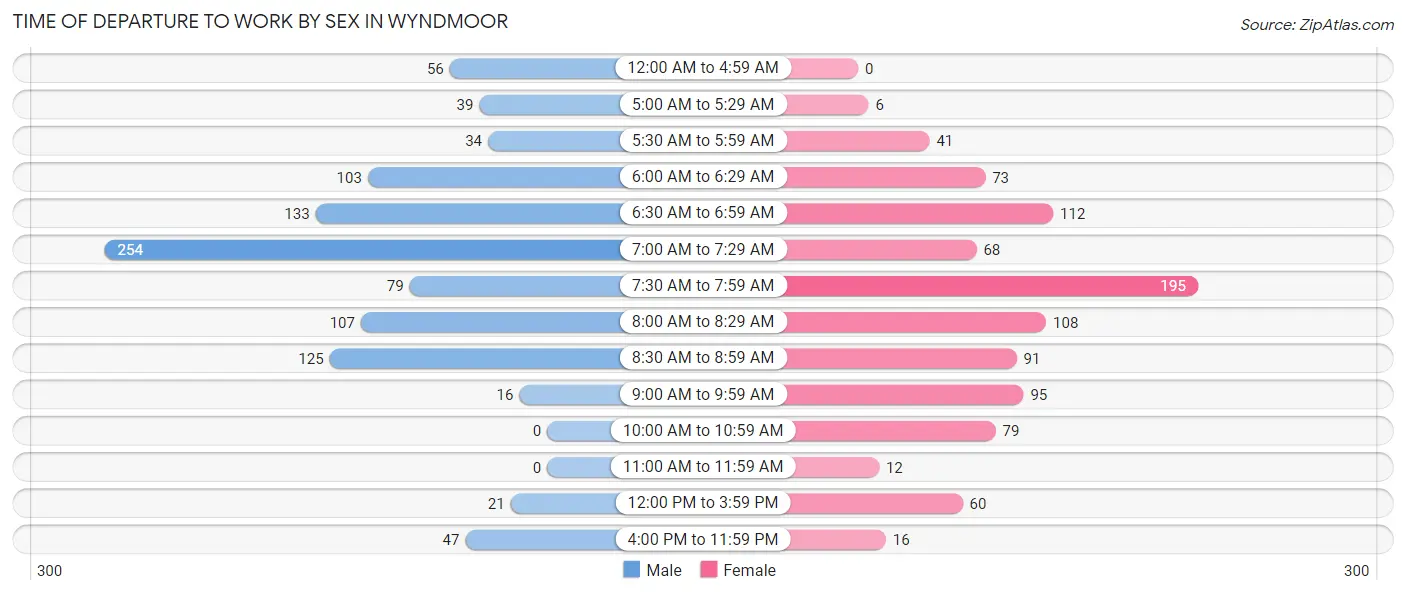
| Time of Departure | Male | Female |
| 12:00 AM to 4:59 AM | 56 (5.5%) | 0 (0.0%) |
| 5:00 AM to 5:29 AM | 39 (3.8%) | 6 (0.6%) |
| 5:30 AM to 5:59 AM | 34 (3.4%) | 41 (4.3%) |
| 6:00 AM to 6:29 AM | 103 (10.2%) | 73 (7.6%) |
| 6:30 AM to 6:59 AM | 133 (13.1%) | 112 (11.7%) |
| 7:00 AM to 7:29 AM | 254 (25.1%) | 68 (7.1%) |
| 7:30 AM to 7:59 AM | 79 (7.8%) | 195 (20.4%) |
| 8:00 AM to 8:29 AM | 107 (10.5%) | 108 (11.3%) |
| 8:30 AM to 8:59 AM | 125 (12.3%) | 91 (9.5%) |
| 9:00 AM to 9:59 AM | 16 (1.6%) | 95 (9.9%) |
| 10:00 AM to 10:59 AM | 0 (0.0%) | 79 (8.3%) |
| 11:00 AM to 11:59 AM | 0 (0.0%) | 12 (1.3%) |
| 12:00 PM to 3:59 PM | 21 (2.1%) | 60 (6.3%) |
| 4:00 PM to 11:59 PM | 47 (4.6%) | 16 (1.7%) |
| Total | 1,014 (100.0%) | 956 (100.0%) |
Housing Occupancy in Wyndmoor
Occupancy by Ownership in Wyndmoor
Of the total 2,079 dwellings in Wyndmoor, owner-occupied units account for 1,816 (87.4%), while renter-occupied units make up 263 (12.7%).
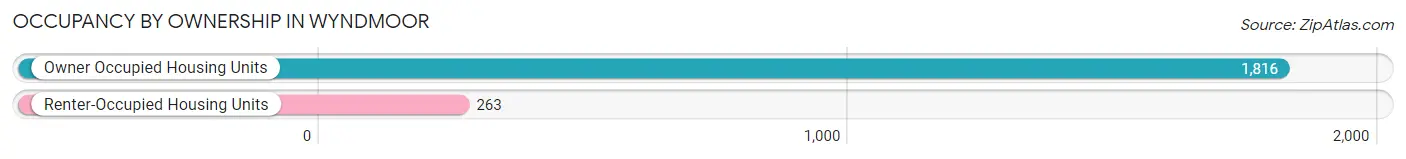
| Occupancy | # Housing Units | % Housing Units |
| Owner Occupied Housing Units | 1,816 | 87.4% |
| Renter-Occupied Housing Units | 263 | 12.7% |
| Total Occupied Housing Units | 2,079 | 100.0% |
Occupancy by Household Size in Wyndmoor
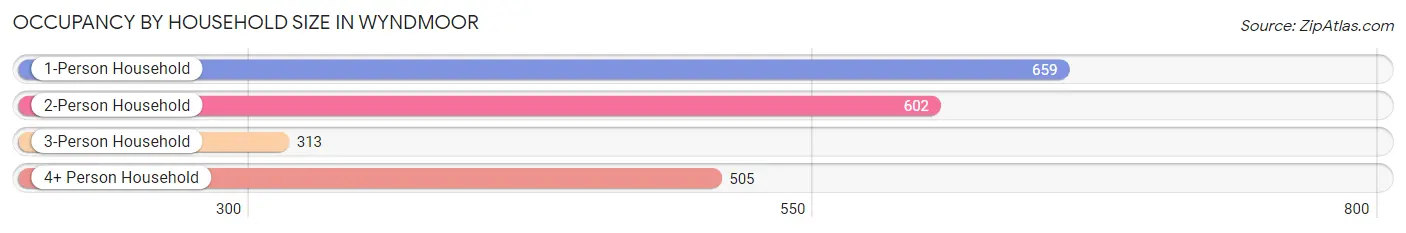
| Household Size | # Housing Units | % Housing Units |
| 1-Person Household | 659 | 31.7% |
| 2-Person Household | 602 | 29.0% |
| 3-Person Household | 313 | 15.1% |
| 4+ Person Household | 505 | 24.3% |
| Total Housing Units | 2,079 | 100.0% |
Occupancy by Ownership by Household Size in Wyndmoor
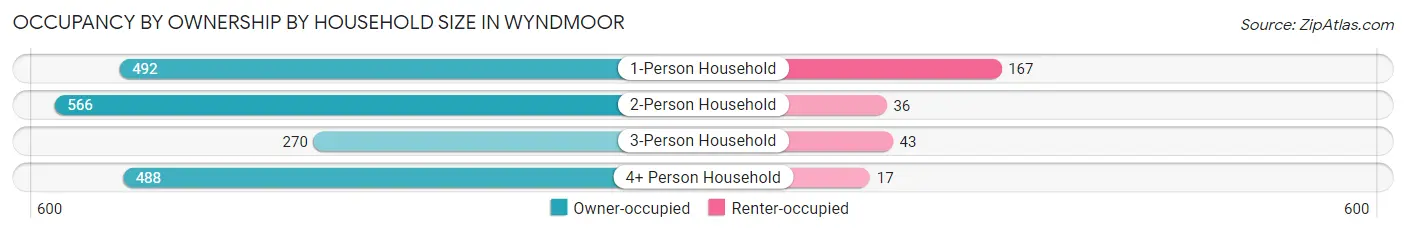
| Household Size | Owner-occupied | Renter-occupied |
| 1-Person Household | 492 (74.7%) | 167 (25.3%) |
| 2-Person Household | 566 (94.0%) | 36 (6.0%) |
| 3-Person Household | 270 (86.3%) | 43 (13.7%) |
| 4+ Person Household | 488 (96.6%) | 17 (3.4%) |
| Total Housing Units | 1,816 (87.4%) | 263 (12.7%) |
Occupancy by Educational Attainment in Wyndmoor
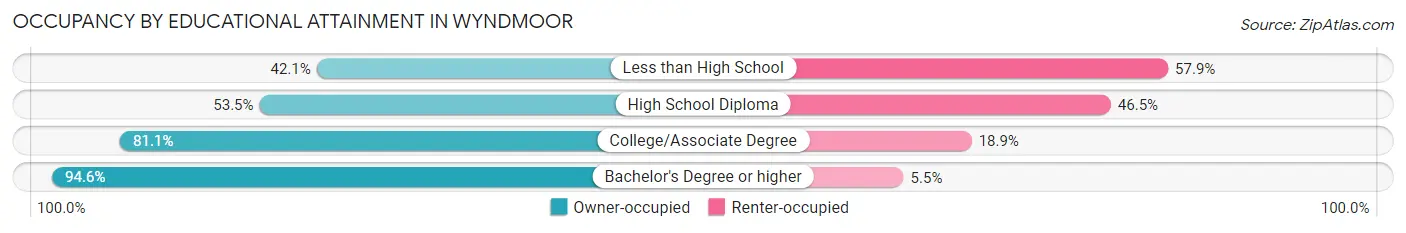
| Household Size | Owner-occupied | Renter-occupied |
| Less than High School | 24 (42.1%) | 33 (57.9%) |
| High School Diploma | 116 (53.5%) | 101 (46.5%) |
| College/Associate Degree | 184 (81.1%) | 43 (18.9%) |
| Bachelor's Degree or higher | 1,492 (94.6%) | 86 (5.4%) |
Occupancy by Age of Householder in Wyndmoor
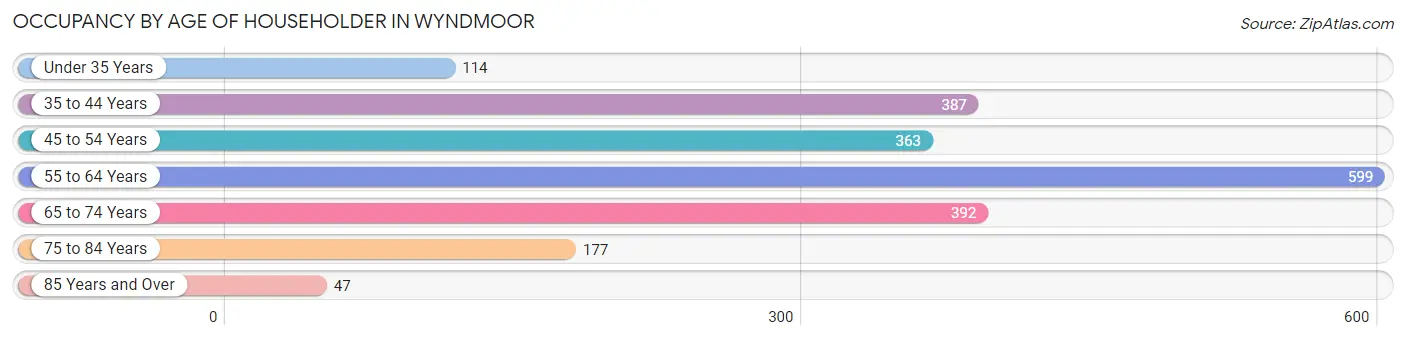
| Age Bracket | # Households | % Households |
| Under 35 Years | 114 | 5.5% |
| 35 to 44 Years | 387 | 18.6% |
| 45 to 54 Years | 363 | 17.5% |
| 55 to 64 Years | 599 | 28.8% |
| 65 to 74 Years | 392 | 18.9% |
| 75 to 84 Years | 177 | 8.5% |
| 85 Years and Over | 47 | 2.3% |
| Total | 2,079 | 100.0% |
Housing Finances in Wyndmoor
Median Income by Occupancy in Wyndmoor
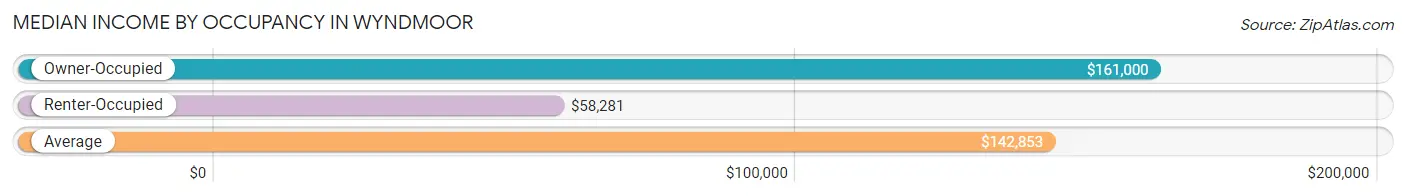
| Occupancy Type | # Households | Median Income |
| Owner-Occupied | 1,816 (87.4%) | $161,000 |
| Renter-Occupied | 263 (12.7%) | $58,281 |
| Average | 2,079 (100.0%) | $142,853 |
Occupancy by Householder Income Bracket in Wyndmoor
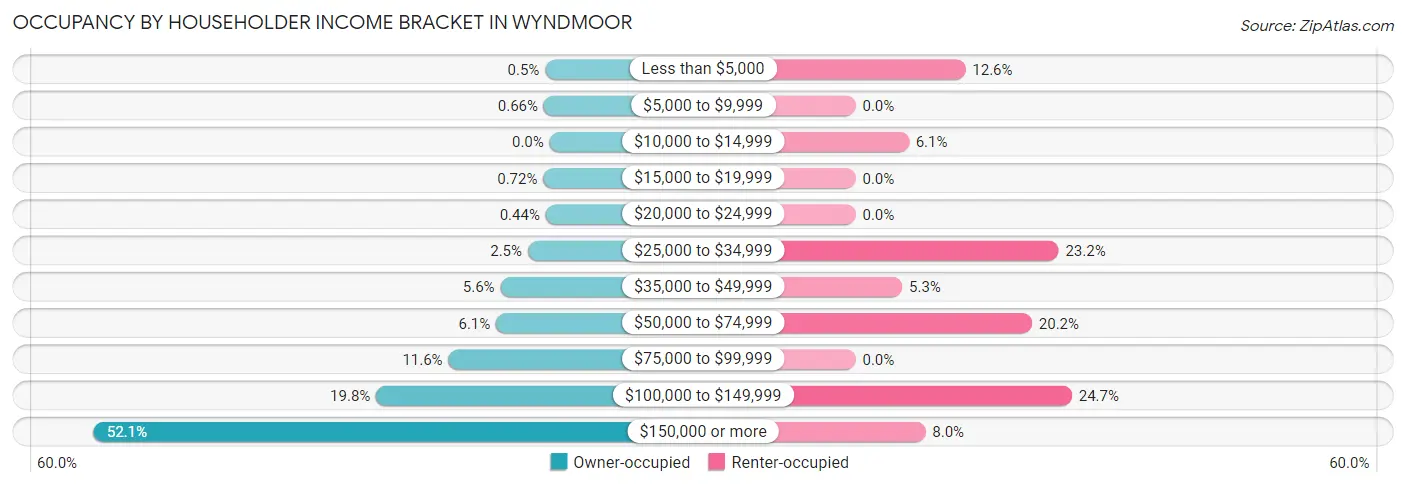
| Income Bracket | Owner-occupied | Renter-occupied |
| Less than $5,000 | 9 (0.5%) | 33 (12.6%) |
| $5,000 to $9,999 | 12 (0.7%) | 0 (0.0%) |
| $10,000 to $14,999 | 0 (0.0%) | 16 (6.1%) |
| $15,000 to $19,999 | 13 (0.7%) | 0 (0.0%) |
| $20,000 to $24,999 | 8 (0.4%) | 0 (0.0%) |
| $25,000 to $34,999 | 45 (2.5%) | 61 (23.2%) |
| $35,000 to $49,999 | 102 (5.6%) | 14 (5.3%) |
| $50,000 to $74,999 | 111 (6.1%) | 53 (20.2%) |
| $75,000 to $99,999 | 210 (11.6%) | 0 (0.0%) |
| $100,000 to $149,999 | 360 (19.8%) | 65 (24.7%) |
| $150,000 or more | 946 (52.1%) | 21 (8.0%) |
| Total | 1,816 (100.0%) | 263 (100.0%) |
Monthly Housing Cost Tiers in Wyndmoor
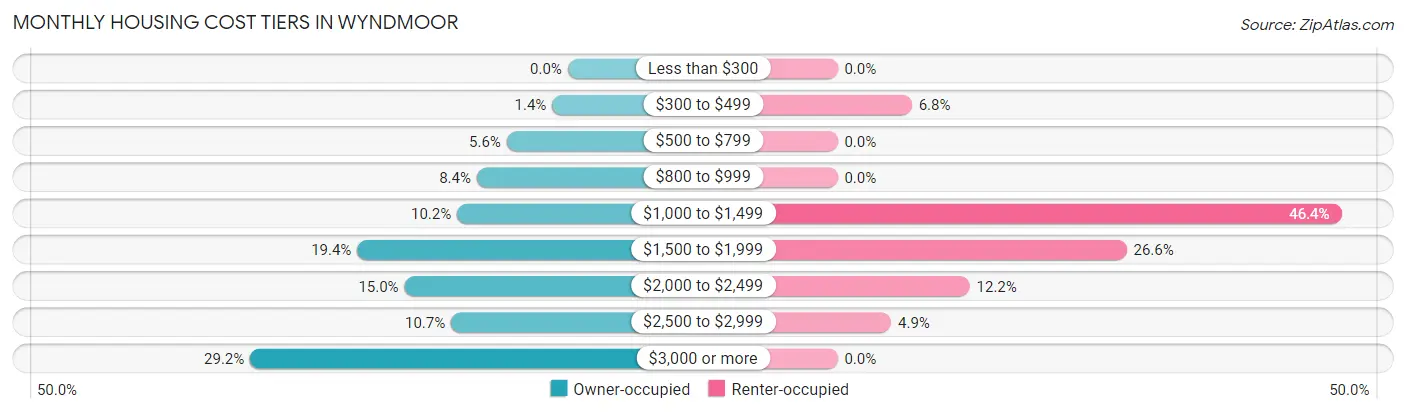
| Monthly Cost | Owner-occupied | Renter-occupied |
| Less than $300 | 0 (0.0%) | 0 (0.0%) |
| $300 to $499 | 26 (1.4%) | 18 (6.8%) |
| $500 to $799 | 102 (5.6%) | 0 (0.0%) |
| $800 to $999 | 152 (8.4%) | 0 (0.0%) |
| $1,000 to $1,499 | 185 (10.2%) | 122 (46.4%) |
| $1,500 to $1,999 | 352 (19.4%) | 70 (26.6%) |
| $2,000 to $2,499 | 273 (15.0%) | 32 (12.2%) |
| $2,500 to $2,999 | 195 (10.7%) | 13 (4.9%) |
| $3,000 or more | 531 (29.2%) | 0 (0.0%) |
| Total | 1,816 (100.0%) | 263 (100.0%) |
Physical Housing Characteristics in Wyndmoor
Housing Structures in Wyndmoor
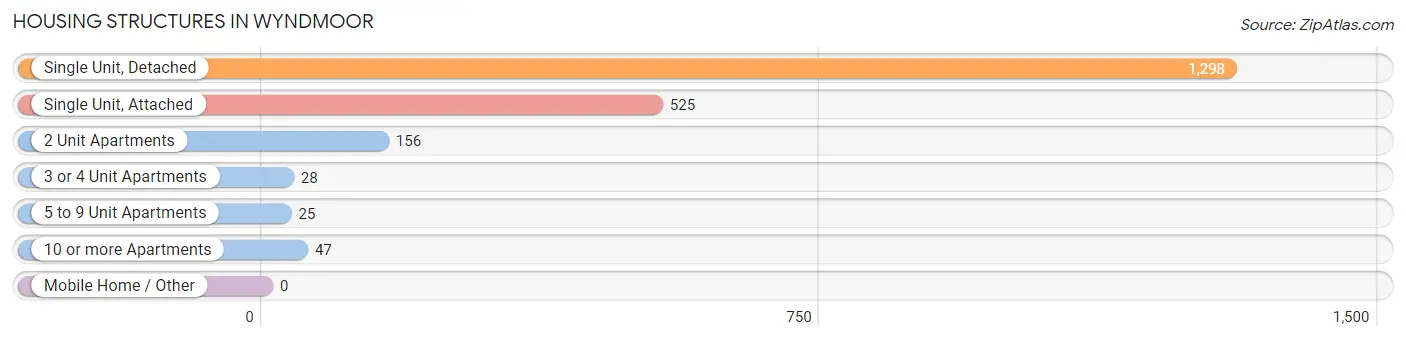
| Structure Type | # Housing Units | % Housing Units |
| Single Unit, Detached | 1,298 | 62.4% |
| Single Unit, Attached | 525 | 25.3% |
| 2 Unit Apartments | 156 | 7.5% |
| 3 or 4 Unit Apartments | 28 | 1.3% |
| 5 to 9 Unit Apartments | 25 | 1.2% |
| 10 or more Apartments | 47 | 2.3% |
| Mobile Home / Other | 0 | 0.0% |
| Total | 2,079 | 100.0% |
Housing Structures by Occupancy in Wyndmoor
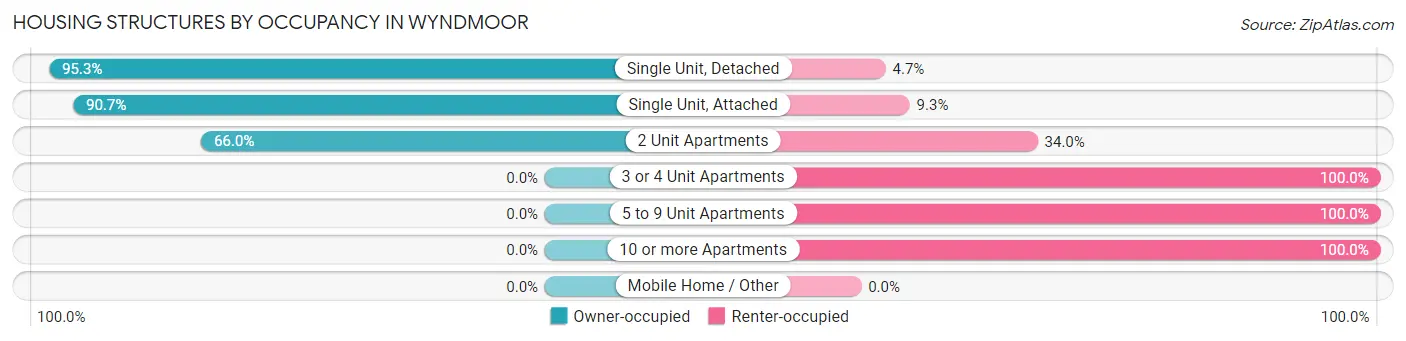
| Structure Type | Owner-occupied | Renter-occupied |
| Single Unit, Detached | 1,237 (95.3%) | 61 (4.7%) |
| Single Unit, Attached | 476 (90.7%) | 49 (9.3%) |
| 2 Unit Apartments | 103 (66.0%) | 53 (34.0%) |
| 3 or 4 Unit Apartments | 0 (0.0%) | 28 (100.0%) |
| 5 to 9 Unit Apartments | 0 (0.0%) | 25 (100.0%) |
| 10 or more Apartments | 0 (0.0%) | 47 (100.0%) |
| Mobile Home / Other | 0 (0.0%) | 0 (0.0%) |
| Total | 1,816 (87.4%) | 263 (12.7%) |
Housing Structures by Number of Rooms in Wyndmoor
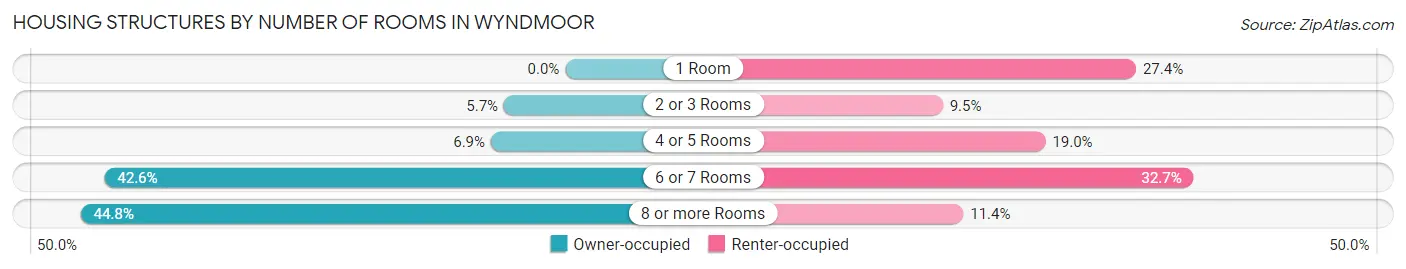
| Number of Rooms | Owner-occupied | Renter-occupied |
| 1 Room | 0 (0.0%) | 72 (27.4%) |
| 2 or 3 Rooms | 103 (5.7%) | 25 (9.5%) |
| 4 or 5 Rooms | 125 (6.9%) | 50 (19.0%) |
| 6 or 7 Rooms | 774 (42.6%) | 86 (32.7%) |
| 8 or more Rooms | 814 (44.8%) | 30 (11.4%) |
| Total | 1,816 (100.0%) | 263 (100.0%) |
Housing Structure by Heating Type in Wyndmoor
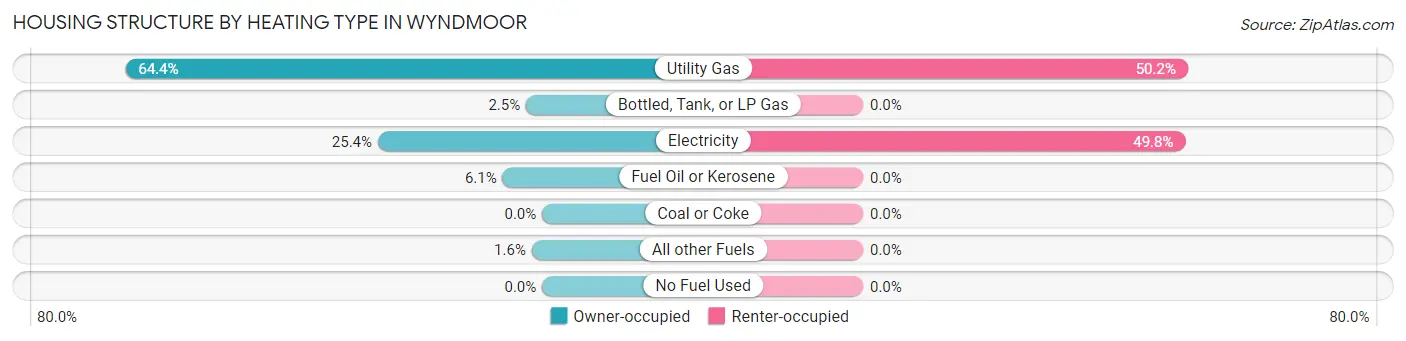
| Heating Type | Owner-occupied | Renter-occupied |
| Utility Gas | 1,170 (64.4%) | 132 (50.2%) |
| Bottled, Tank, or LP Gas | 45 (2.5%) | 0 (0.0%) |
| Electricity | 461 (25.4%) | 131 (49.8%) |
| Fuel Oil or Kerosene | 111 (6.1%) | 0 (0.0%) |
| Coal or Coke | 0 (0.0%) | 0 (0.0%) |
| All other Fuels | 29 (1.6%) | 0 (0.0%) |
| No Fuel Used | 0 (0.0%) | 0 (0.0%) |
| Total | 1,816 (100.0%) | 263 (100.0%) |
Household Vehicle Usage in Wyndmoor
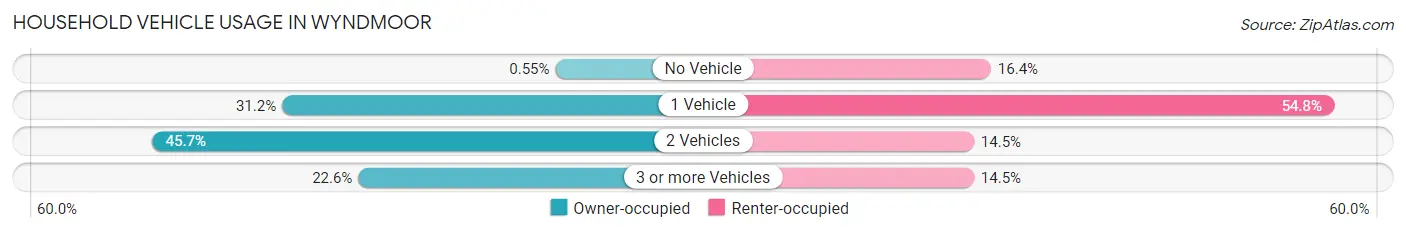
| Vehicles per Household | Owner-occupied | Renter-occupied |
| No Vehicle | 10 (0.5%) | 43 (16.4%) |
| 1 Vehicle | 566 (31.2%) | 144 (54.7%) |
| 2 Vehicles | 829 (45.7%) | 38 (14.4%) |
| 3 or more Vehicles | 411 (22.6%) | 38 (14.4%) |
| Total | 1,816 (100.0%) | 263 (100.0%) |
Real Estate & Mortgages in Wyndmoor
Real Estate and Mortgage Overview in Wyndmoor
| Characteristic | Without Mortgage | With Mortgage |
| Housing Units | 468 | 1,348 |
| Median Property Value | $489,700 | $454,700 |
| Median Household Income | $147,083 | $715 |
| Monthly Housing Costs | $955 | $492 |
| Real Estate Taxes | $6,656 | $103 |
Property Value by Mortgage Status in Wyndmoor
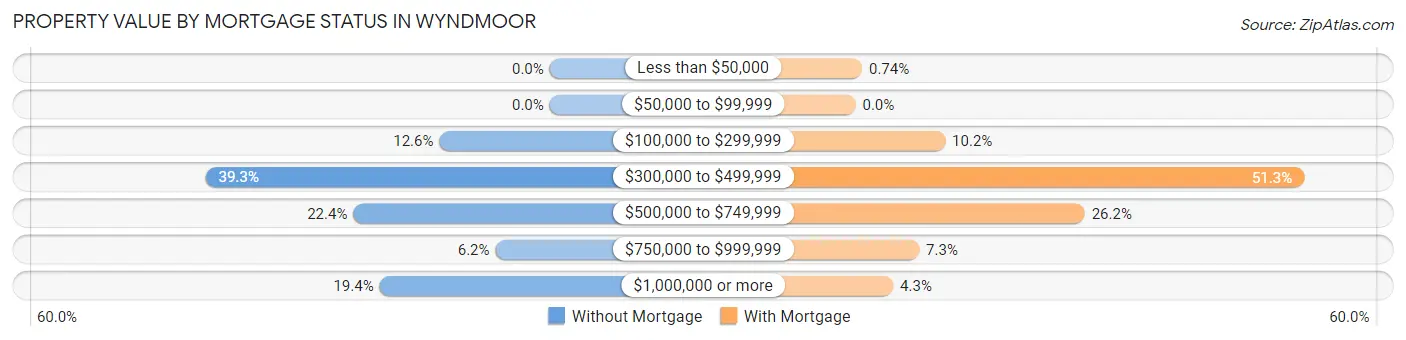
| Property Value | Without Mortgage | With Mortgage |
| Less than $50,000 | 0 (0.0%) | 10 (0.7%) |
| $50,000 to $99,999 | 0 (0.0%) | 0 (0.0%) |
| $100,000 to $299,999 | 59 (12.6%) | 138 (10.2%) |
| $300,000 to $499,999 | 184 (39.3%) | 691 (51.3%) |
| $500,000 to $749,999 | 105 (22.4%) | 353 (26.2%) |
| $750,000 to $999,999 | 29 (6.2%) | 98 (7.3%) |
| $1,000,000 or more | 91 (19.4%) | 58 (4.3%) |
| Total | 468 (100.0%) | 1,348 (100.0%) |
Household Income by Mortgage Status in Wyndmoor
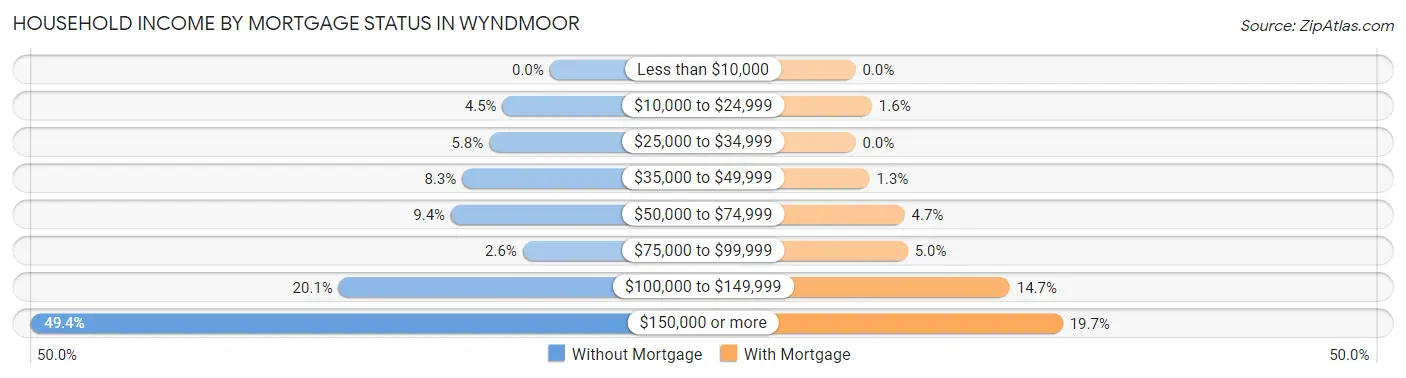
| Household Income | Without Mortgage | With Mortgage |
| Less than $10,000 | 0 (0.0%) | 0 (0.0%) |
| $10,000 to $24,999 | 21 (4.5%) | 21 (1.6%) |
| $25,000 to $34,999 | 27 (5.8%) | 0 (0.0%) |
| $35,000 to $49,999 | 39 (8.3%) | 18 (1.3%) |
| $50,000 to $74,999 | 44 (9.4%) | 63 (4.7%) |
| $75,000 to $99,999 | 12 (2.6%) | 67 (5.0%) |
| $100,000 to $149,999 | 94 (20.1%) | 198 (14.7%) |
| $150,000 or more | 231 (49.4%) | 266 (19.7%) |
| Total | 468 (100.0%) | 1,348 (100.0%) |
Property Value to Household Income Ratio in Wyndmoor
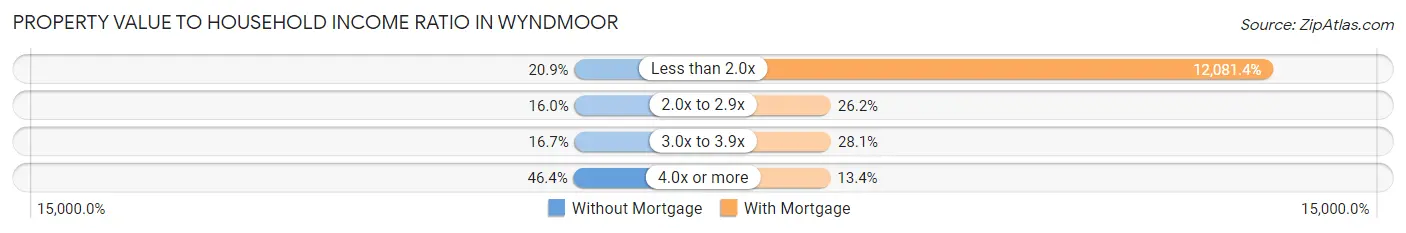
| Value-to-Income Ratio | Without Mortgage | With Mortgage |
| Less than 2.0x | 98 (20.9%) | 162,857 (12,081.4%) |
| 2.0x to 2.9x | 75 (16.0%) | 353 (26.2%) |
| 3.0x to 3.9x | 78 (16.7%) | 379 (28.1%) |
| 4.0x or more | 217 (46.4%) | 180 (13.4%) |
| Total | 468 (100.0%) | 1,348 (100.0%) |
Real Estate Taxes by Mortgage Status in Wyndmoor
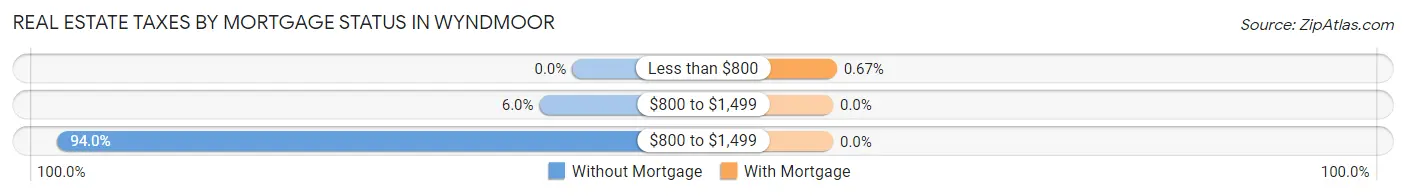
| Property Taxes | Without Mortgage | With Mortgage |
| Less than $800 | 0 (0.0%) | 9 (0.7%) |
| $800 to $1,499 | 28 (6.0%) | 0 (0.0%) |
| $800 to $1,499 | 440 (94.0%) | 0 (0.0%) |
| Total | 468 (100.0%) | 1,348 (100.0%) |
Health & Disability in Wyndmoor
Health Insurance Coverage by Age in Wyndmoor
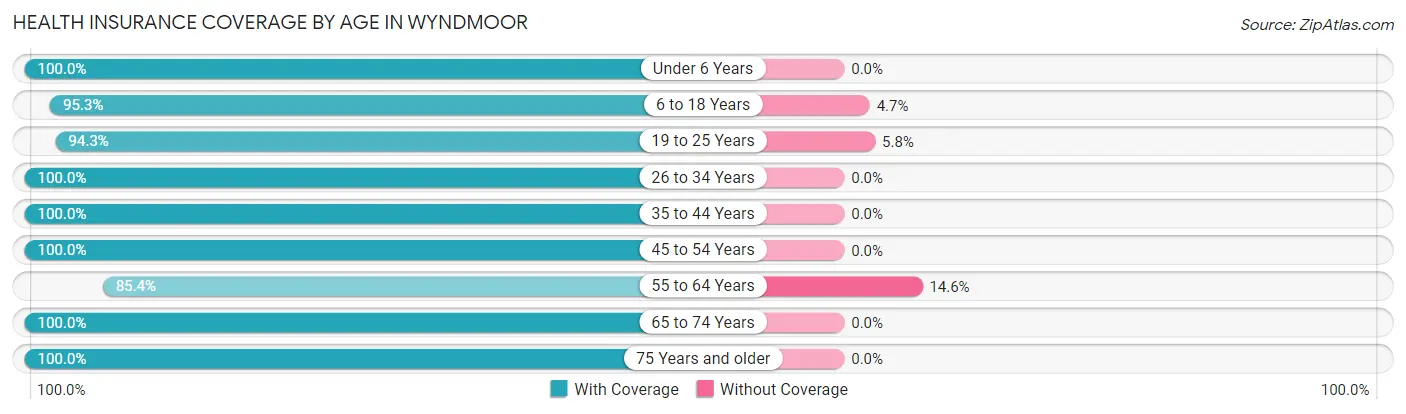
| Age Bracket | With Coverage | Without Coverage |
| Under 6 Years | 453 (100.0%) | 0 (0.0%) |
| 6 to 18 Years | 845 (95.3%) | 42 (4.7%) |
| 19 to 25 Years | 164 (94.3%) | 10 (5.8%) |
| 26 to 34 Years | 375 (100.0%) | 0 (0.0%) |
| 35 to 44 Years | 738 (100.0%) | 0 (0.0%) |
| 45 to 54 Years | 651 (100.0%) | 0 (0.0%) |
| 55 to 64 Years | 844 (85.4%) | 144 (14.6%) |
| 65 to 74 Years | 636 (100.0%) | 0 (0.0%) |
| 75 Years and older | 364 (100.0%) | 0 (0.0%) |
| Total | 5,070 (96.3%) | 196 (3.7%) |
Health Insurance Coverage by Citizenship Status in Wyndmoor
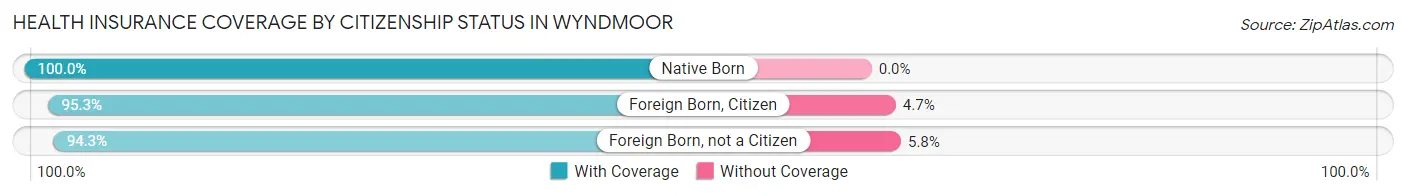
| Citizenship Status | With Coverage | Without Coverage |
| Native Born | 453 (100.0%) | 0 (0.0%) |
| Foreign Born, Citizen | 845 (95.3%) | 42 (4.7%) |
| Foreign Born, not a Citizen | 164 (94.3%) | 10 (5.8%) |
Health Insurance Coverage by Household Income in Wyndmoor
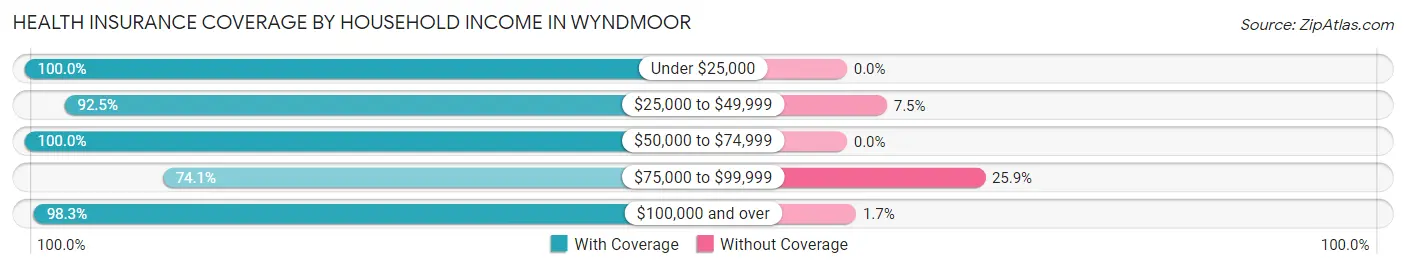
| Household Income | With Coverage | Without Coverage |
| Under $25,000 | 109 (100.0%) | 0 (0.0%) |
| $25,000 to $49,999 | 284 (92.5%) | 23 (7.5%) |
| $50,000 to $74,999 | 352 (100.0%) | 0 (0.0%) |
| $75,000 to $99,999 | 295 (74.1%) | 103 (25.9%) |
| $100,000 and over | 3,989 (98.3%) | 70 (1.7%) |
Public vs Private Health Insurance Coverage by Age in Wyndmoor
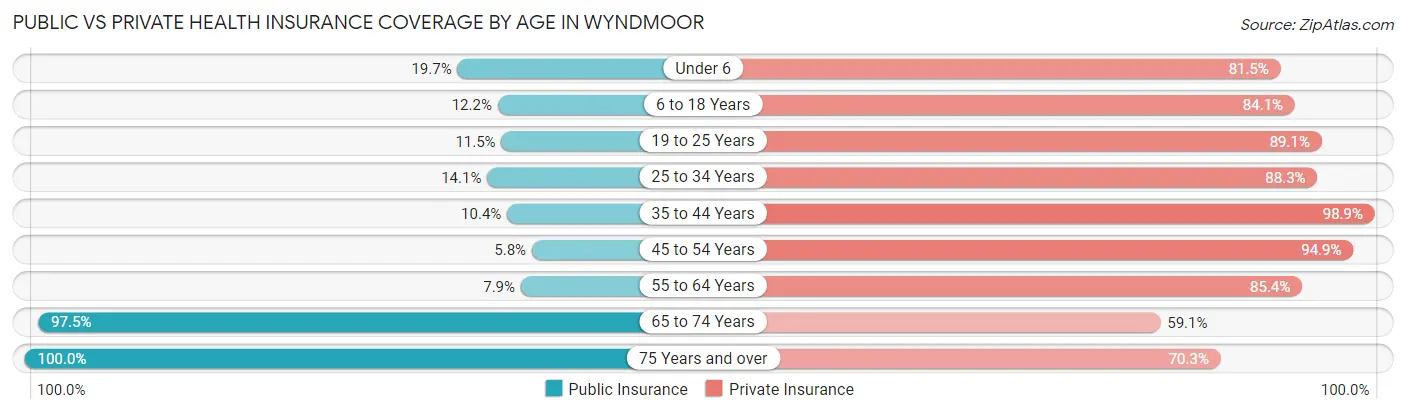
| Age Bracket | Public Insurance | Private Insurance |
| Under 6 | 89 (19.7%) | 369 (81.5%) |
| 6 to 18 Years | 108 (12.2%) | 746 (84.1%) |
| 19 to 25 Years | 20 (11.5%) | 155 (89.1%) |
| 25 to 34 Years | 53 (14.1%) | 331 (88.3%) |
| 35 to 44 Years | 77 (10.4%) | 730 (98.9%) |
| 45 to 54 Years | 38 (5.8%) | 618 (94.9%) |
| 55 to 64 Years | 78 (7.9%) | 844 (85.4%) |
| 65 to 74 Years | 620 (97.5%) | 376 (59.1%) |
| 75 Years and over | 364 (100.0%) | 256 (70.3%) |
| Total | 1,447 (27.5%) | 4,425 (84.0%) |
Disability Status by Sex by Age in Wyndmoor
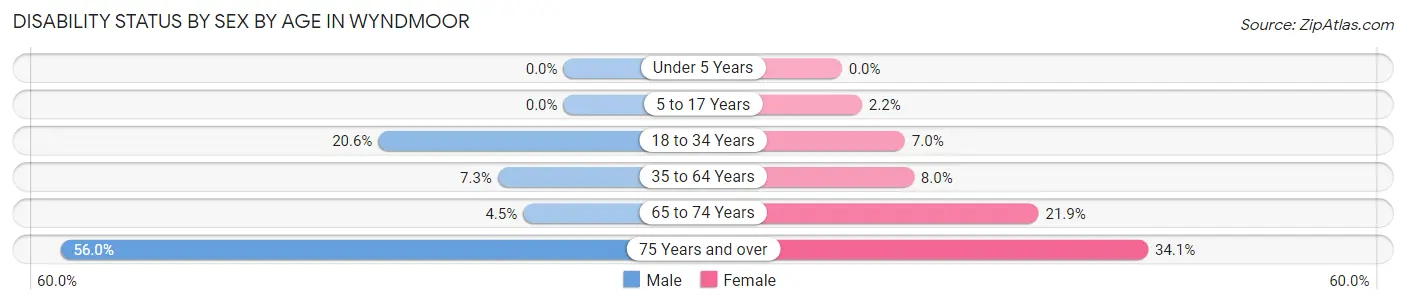
| Age Bracket | Male | Female |
| Under 5 Years | 0 (0.0%) | 0 (0.0%) |
| 5 to 17 Years | 0 (0.0%) | 10 (2.2%) |
| 18 to 34 Years | 73 (20.6%) | 18 (7.0%) |
| 35 to 64 Years | 80 (7.3%) | 103 (8.0%) |
| 65 to 74 Years | 14 (4.5%) | 71 (21.9%) |
| 75 Years and over | 84 (56.0%) | 73 (34.1%) |
Disability Class by Sex by Age in Wyndmoor
Disability Class: Hearing Difficulty
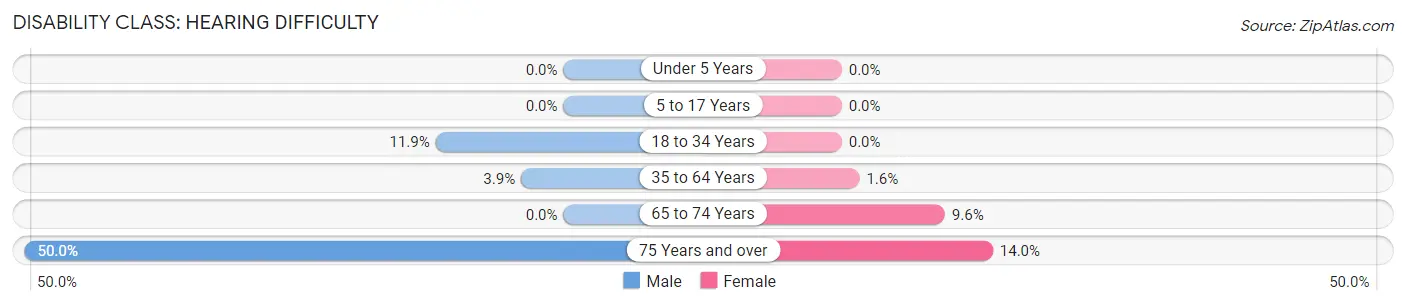
| Age Bracket | Male | Female |
| Under 5 Years | 0 (0.0%) | 0 (0.0%) |
| 5 to 17 Years | 0 (0.0%) | 0 (0.0%) |
| 18 to 34 Years | 42 (11.9%) | 0 (0.0%) |
| 35 to 64 Years | 43 (3.9%) | 21 (1.6%) |
| 65 to 74 Years | 0 (0.0%) | 31 (9.6%) |
| 75 Years and over | 75 (50.0%) | 30 (14.0%) |
Disability Class: Vision Difficulty
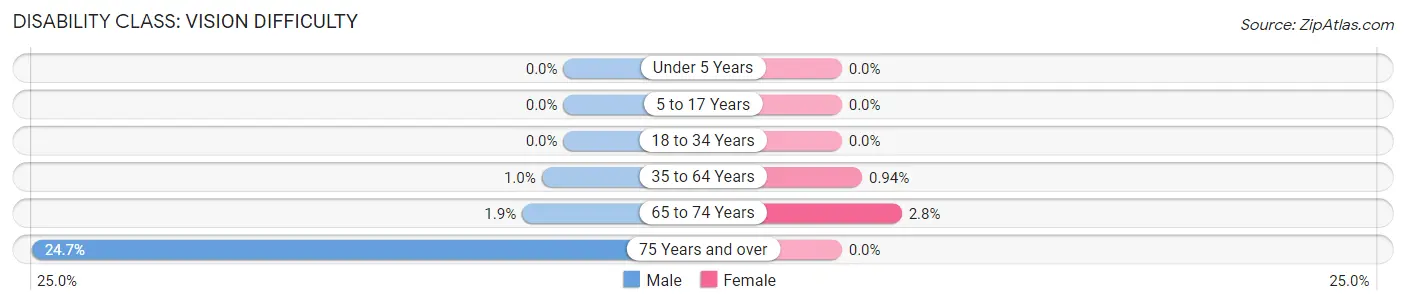
| Age Bracket | Male | Female |
| Under 5 Years | 0 (0.0%) | 0 (0.0%) |
| 5 to 17 Years | 0 (0.0%) | 0 (0.0%) |
| 18 to 34 Years | 0 (0.0%) | 0 (0.0%) |
| 35 to 64 Years | 11 (1.0%) | 12 (0.9%) |
| 65 to 74 Years | 6 (1.9%) | 9 (2.8%) |
| 75 Years and over | 37 (24.7%) | 0 (0.0%) |
Disability Class: Cognitive Difficulty
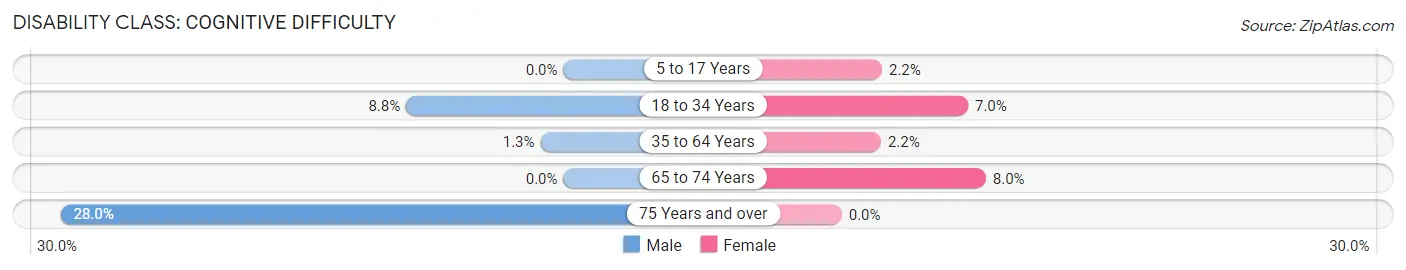
| Age Bracket | Male | Female |
| 5 to 17 Years | 0 (0.0%) | 10 (2.2%) |
| 18 to 34 Years | 31 (8.8%) | 18 (7.0%) |
| 35 to 64 Years | 14 (1.3%) | 28 (2.2%) |
| 65 to 74 Years | 0 (0.0%) | 26 (8.0%) |
| 75 Years and over | 42 (28.0%) | 0 (0.0%) |
Disability Class: Ambulatory Difficulty
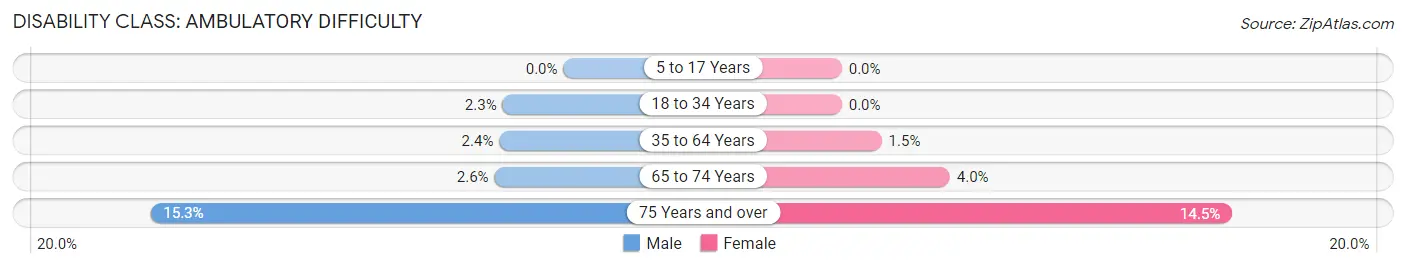
| Age Bracket | Male | Female |
| 5 to 17 Years | 0 (0.0%) | 0 (0.0%) |
| 18 to 34 Years | 8 (2.3%) | 0 (0.0%) |
| 35 to 64 Years | 26 (2.4%) | 19 (1.5%) |
| 65 to 74 Years | 8 (2.6%) | 13 (4.0%) |
| 75 Years and over | 23 (15.3%) | 31 (14.5%) |
Disability Class: Self-Care Difficulty
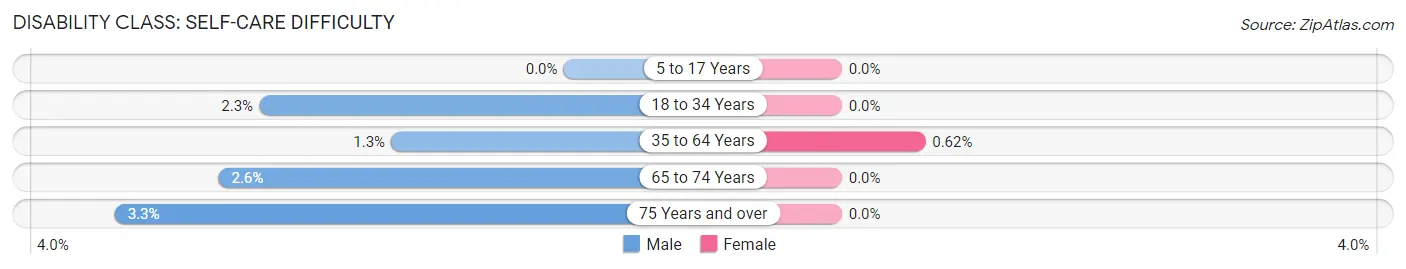
| Age Bracket | Male | Female |
| 5 to 17 Years | 0 (0.0%) | 0 (0.0%) |
| 18 to 34 Years | 8 (2.3%) | 0 (0.0%) |
| 35 to 64 Years | 14 (1.3%) | 8 (0.6%) |
| 65 to 74 Years | 8 (2.6%) | 0 (0.0%) |
| 75 Years and over | 5 (3.3%) | 0 (0.0%) |
Technology Access in Wyndmoor
Computing Device Access in Wyndmoor
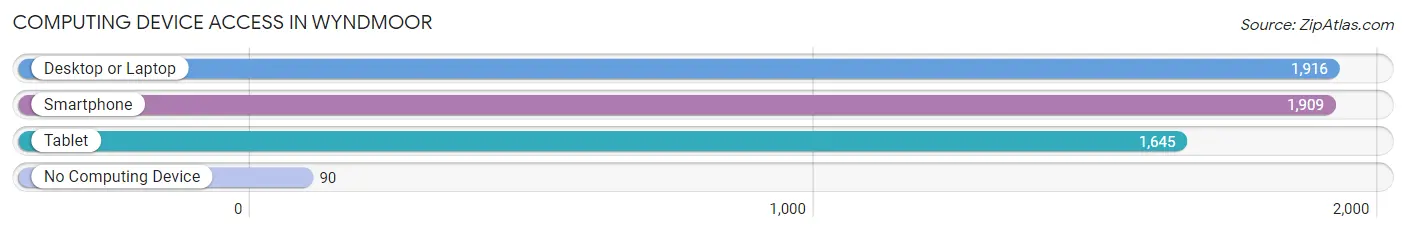
| Device Type | # Households | % Households |
| Desktop or Laptop | 1,916 | 92.2% |
| Smartphone | 1,909 | 91.8% |
| Tablet | 1,645 | 79.1% |
| No Computing Device | 90 | 4.3% |
| Total | 2,079 | 100.0% |
Internet Access in Wyndmoor
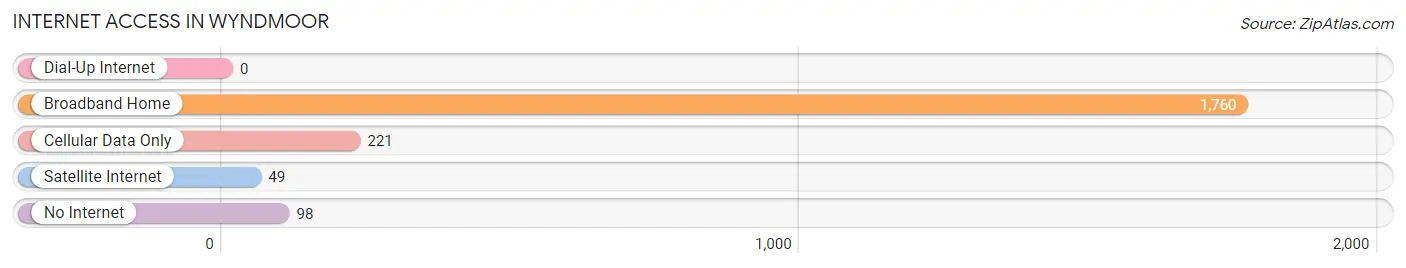
| Internet Type | # Households | % Households |
| Dial-Up Internet | 0 | 0.0% |
| Broadband Home | 1,760 | 84.7% |
| Cellular Data Only | 221 | 10.6% |
| Satellite Internet | 49 | 2.4% |
| No Internet | 98 | 4.7% |
| Total | 2,079 | 100.0% |
Wyndmoor Summary
Wyndmoor is a small borough located in Montgomery County, Pennsylvania, United States. It is situated approximately 8 miles northwest of Philadelphia and is part of the Chestnut Hill area. The population was 4,819 at the 2010 census.
History
Wyndmoor was first settled in the late 17th century by Welsh Quakers. The area was originally known as “Welsh Tract” and was part of Springfield Township. In 1891, the area was incorporated as the Borough of Wyndmoor. The name “Wyndmoor” is derived from the Welsh words “gwyn” (white) and “mawr” (large).
Geography
Wyndmoor is located at 40°05'17" North, 75°11'45" West (40.0879, -75.1958). According to the United States Census Bureau, the borough has a total area of 0.6 square miles, all of it land.
Economy
Wyndmoor is primarily a residential community, with a few small businesses located in the area. The largest employer in the borough is the Wyndmoor Country Club, which employs approximately 200 people. Other businesses in the area include a few restaurants, a grocery store, a pharmacy, and a few small retail stores.
Demographics
As of the 2010 census, there were 4,819 people, 1,945 households, and 1,323 families residing in the borough. The population density was 8,068.3 people per square mile. The racial makeup of the borough was 91.2% White, 4.2% African American, 0.2% Native American, 2.2% Asian, 0.1% Pacific Islander, 0.7% from other races, and 1.2% from two or more races. Hispanic or Latino of any race were 2.3% of the population.
The median income for a household in the borough was $76,944, and the median income for a family was $97,917. The per capita income for the borough was $41,945. About 2.2% of families and 3.3% of the population were below the poverty line, including 3.7% of those under age 18 and 4.2% of those age 65 or over.
Common Questions
What is Per Capita Income in Wyndmoor?
Per Capita income in Wyndmoor is $68,699.
What is the Median Family Income in Wyndmoor?
Median Family Income in Wyndmoor is $185,000.
What is the Median Household income in Wyndmoor?
Median Household Income in Wyndmoor is $142,853.
What is Income or Wage Gap in Wyndmoor?
Income or Wage Gap in Wyndmoor is 24.1%.
Women in Wyndmoor earn 75.9 cents for every dollar earned by a man.
What is Inequality or Gini Index in Wyndmoor?
Inequality or Gini Index in Wyndmoor is 0.42.
What is the Total Population of Wyndmoor?
Total Population of Wyndmoor is 5,698.
What is the Total Male Population of Wyndmoor?
Total Male Population of Wyndmoor is 2,698.
What is the Total Female Population of Wyndmoor?
Total Female Population of Wyndmoor is 3,000.
What is the Ratio of Males per 100 Females in Wyndmoor?
There are 89.93 Males per 100 Females in Wyndmoor.
What is the Ratio of Females per 100 Males in Wyndmoor?
There are 111.19 Females per 100 Males in Wyndmoor.
What is the Median Population Age in Wyndmoor?
Median Population Age in Wyndmoor is 49.6 Years.
What is the Average Family Size in Wyndmoor
Average Family Size in Wyndmoor is 3.2 People.
What is the Average Household Size in Wyndmoor
Average Household Size in Wyndmoor is 2.5 People.
How Large is the Labor Force in Wyndmoor?
There are 2,714 People in the Labor Forcein in Wyndmoor.
What is the Percentage of People in the Labor Force in Wyndmoor?
60.1% of People are in the Labor Force in Wyndmoor.
What is the Unemployment Rate in Wyndmoor?
Unemployment Rate in Wyndmoor is 5.2%.