Fort Washington, PA Map & Demographics
Fort Washington Map
Fort Washington Overview
$68,369
PER CAPITA INCOME
$181,333
AVG FAMILY INCOME
$140,455
AVG HOUSEHOLD INCOME
44.1%
WAGE / INCOME GAP [ % ]
55.9¢/ $1
WAGE / INCOME GAP [ $ ]
0.46
INEQUALITY / GINI INDEX
6,312
TOTAL POPULATION
3,080
MALE POPULATION
3,232
FEMALE POPULATION
95.30
MALES / 100 FEMALES
104.94
FEMALES / 100 MALES
43.4
MEDIAN AGE
3.2
AVG FAMILY SIZE
2.8
AVG HOUSEHOLD SIZE
3,411
LABOR FORCE [ PEOPLE ]
67.6%
PERCENT IN LABOR FORCE
3.1%
UNEMPLOYMENT RATE
Fort Washington Zip Codes
Income in Fort Washington
Income Overview in Fort Washington
Per Capita Income in Fort Washington is $68,369, while median incomes of families and households are $181,333 and $140,455 respectively.
| Characteristic | Number | Measure |
| Per Capita Income | 6,312 | $68,369 |
| Median Family Income | 1,708 | $181,333 |
| Mean Family Income | 1,708 | $212,729 |
| Median Household Income | 2,256 | $140,455 |
| Mean Household Income | 2,256 | $187,854 |
| Income Deficit | 1,708 | $0 |
| Wage / Income Gap (%) | 6,312 | 44.07% |
| Wage / Income Gap ($) | 6,312 | 55.93¢ per $1 |
| Gini / Inequality Index | 6,312 | 0.46 |
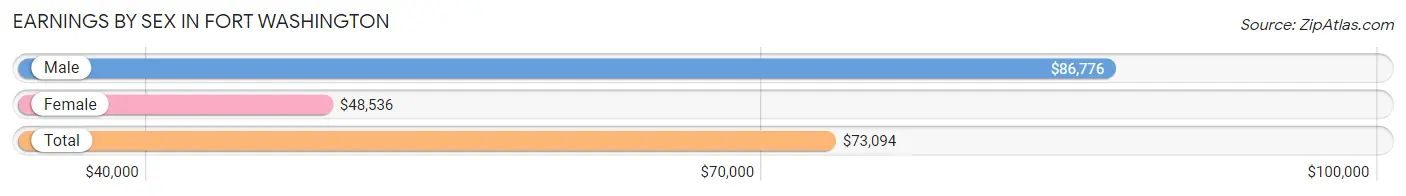
Earnings by Sex in Fort Washington
Average Earnings in Fort Washington are $73,094, $86,776 for men and $48,536 for women, a difference of 44.1%.
| Sex | Number | Average Earnings |
| Male | 1,890 (53.3%) | $86,776 |
| Female | 1,657 (46.7%) | $48,536 |
| Total | 3,547 (100.0%) | $73,094 |
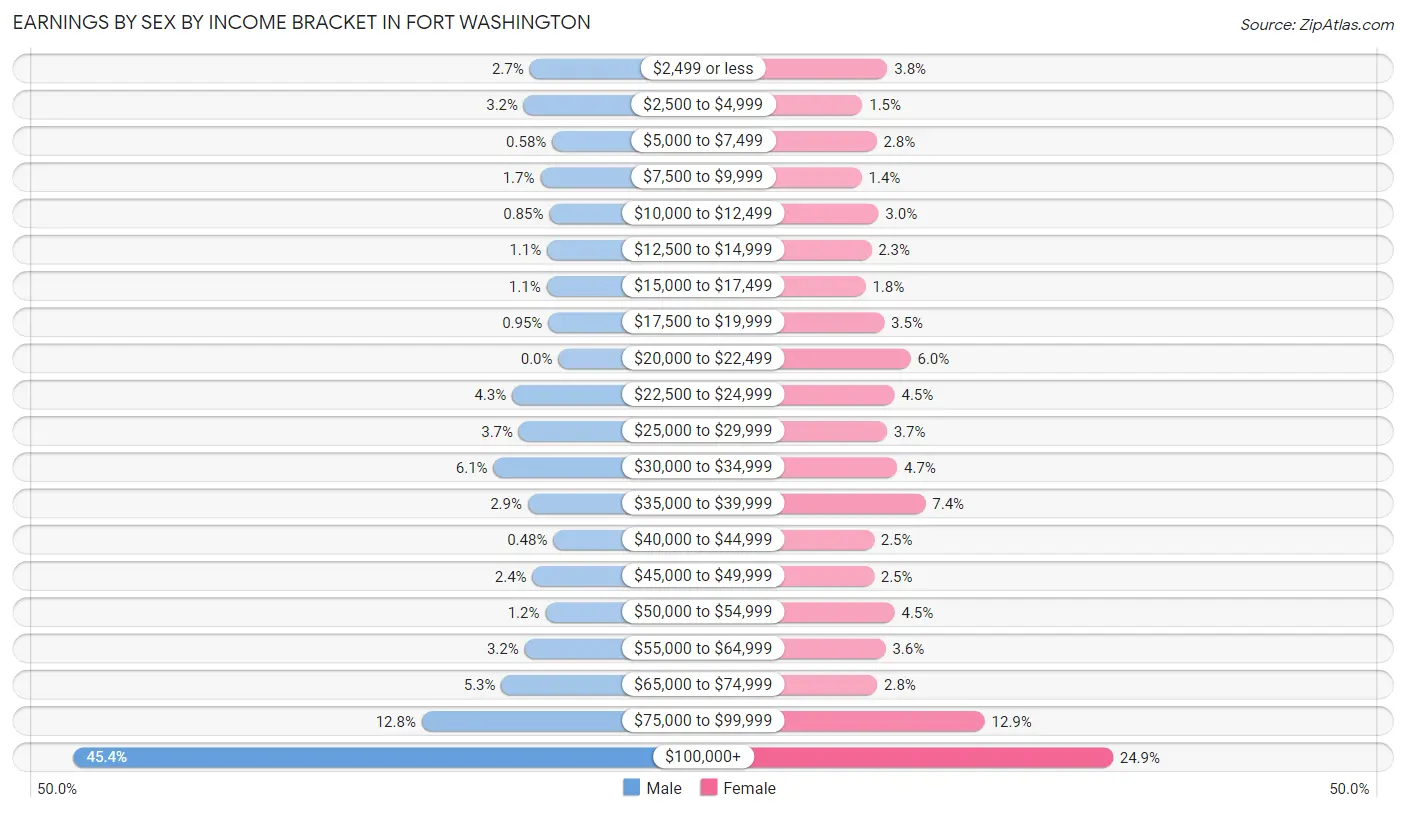
Earnings by Sex by Income Bracket in Fort Washington
The most common earnings brackets in Fort Washington are $100,000+ for men (858 | 45.4%) and $100,000+ for women (413 | 24.9%).
| Income | Male | Female |
| $2,499 or less | 51 (2.7%) | 63 (3.8%) |
| $2,500 to $4,999 | 61 (3.2%) | 24 (1.5%) |
| $5,000 to $7,499 | 11 (0.6%) | 46 (2.8%) |
| $7,500 to $9,999 | 32 (1.7%) | 23 (1.4%) |
| $10,000 to $12,499 | 16 (0.9%) | 49 (3.0%) |
| $12,500 to $14,999 | 20 (1.1%) | 38 (2.3%) |
| $15,000 to $17,499 | 21 (1.1%) | 29 (1.8%) |
| $17,500 to $19,999 | 18 (0.9%) | 58 (3.5%) |
| $20,000 to $22,499 | 0 (0.0%) | 99 (6.0%) |
| $22,500 to $24,999 | 82 (4.3%) | 74 (4.5%) |
| $25,000 to $29,999 | 70 (3.7%) | 62 (3.7%) |
| $30,000 to $34,999 | 115 (6.1%) | 78 (4.7%) |
| $35,000 to $39,999 | 54 (2.9%) | 122 (7.4%) |
| $40,000 to $44,999 | 9 (0.5%) | 42 (2.5%) |
| $45,000 to $49,999 | 46 (2.4%) | 42 (2.5%) |
| $50,000 to $54,999 | 23 (1.2%) | 74 (4.5%) |
| $55,000 to $64,999 | 60 (3.2%) | 60 (3.6%) |
| $65,000 to $74,999 | 101 (5.3%) | 47 (2.8%) |
| $75,000 to $99,999 | 242 (12.8%) | 214 (12.9%) |
| $100,000+ | 858 (45.4%) | 413 (24.9%) |
| Total | 1,890 (100.0%) | 1,657 (100.0%) |
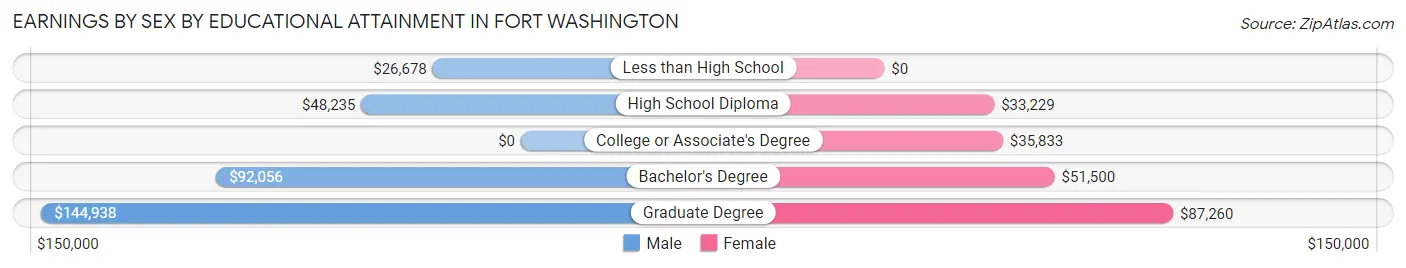
Earnings by Sex by Educational Attainment in Fort Washington
Average earnings in Fort Washington are $95,855 for men and $56,125 for women, a difference of 41.4%. Men with an educational attainment of graduate degree enjoy the highest average annual earnings of $144,938, while those with less than high school education earn the least with $26,678. Women with an educational attainment of graduate degree earn the most with the average annual earnings of $87,260, while those with high school diploma education have the smallest earnings of $33,229.
| Educational Attainment | Male Income | Female Income |
| Less than High School | $26,678 | $0 |
| High School Diploma | $48,235 | $33,229 |
| College or Associate's Degree | - | - |
| Bachelor's Degree | $92,056 | $51,500 |
| Graduate Degree | $144,938 | $87,260 |
| Total | $95,855 | $56,125 |
Family Income in Fort Washington
Family Income Brackets in Fort Washington
According to the Fort Washington family income data, there are 716 families falling into the $200,000+ income range, which is the most common income bracket and makes up 41.9% of all families.
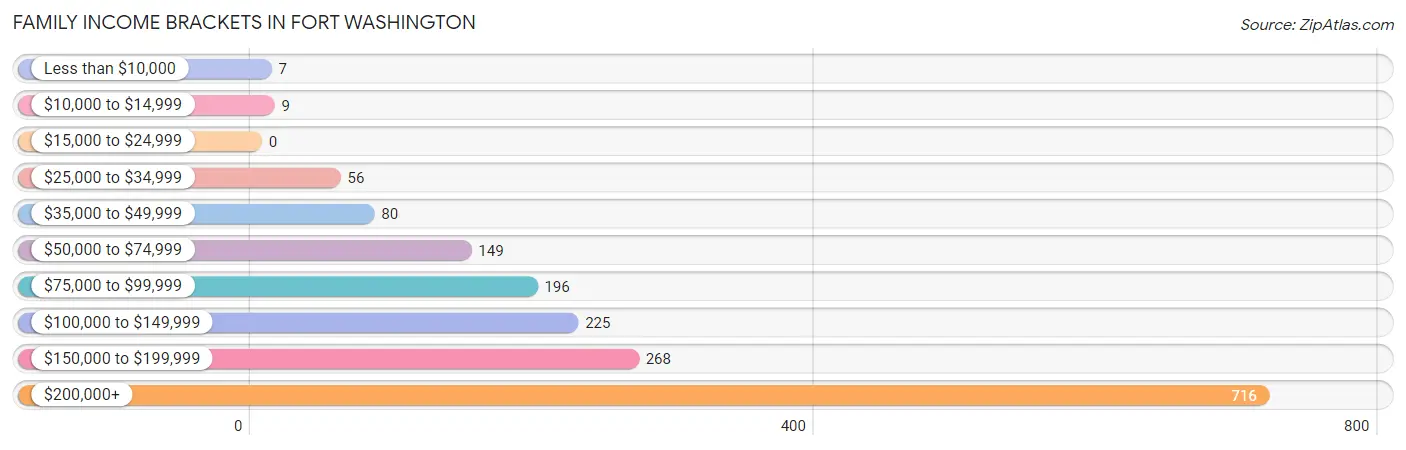
| Income Bracket | # Families | % Families |
| Less than $10,000 | 7 | 0.4% |
| $10,000 to $14,999 | 9 | 0.5% |
| $15,000 to $24,999 | 0 | 0.0% |
| $25,000 to $34,999 | 56 | 3.3% |
| $35,000 to $49,999 | 80 | 4.7% |
| $50,000 to $74,999 | 149 | 8.7% |
| $75,000 to $99,999 | 196 | 11.5% |
| $100,000 to $149,999 | 225 | 13.2% |
| $150,000 to $199,999 | 268 | 15.7% |
| $200,000+ | 716 | 41.9% |
Family Income by Famaliy Size in Fort Washington
3-person families (363 | 21.2%) account for the highest median family income in Fort Washington with $225,839 per family, while 3-person families (363 | 21.2%) have the highest median income of $75,280 per family member.
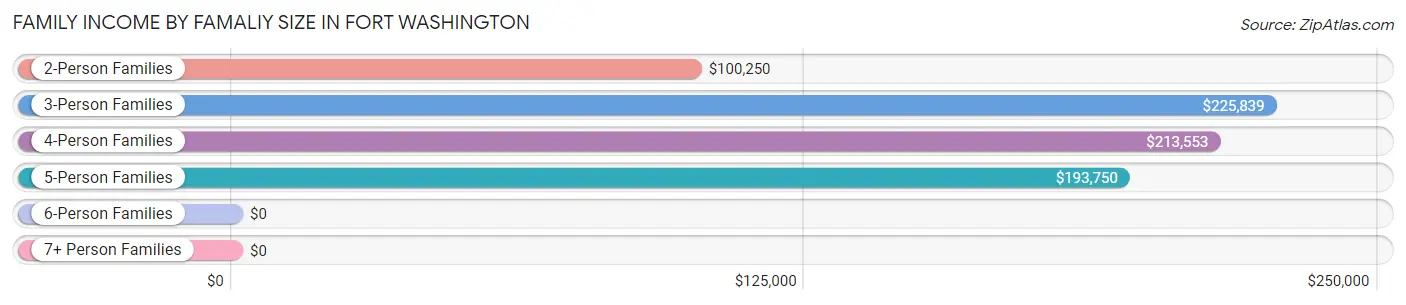
| Income Bracket | # Families | Median Income |
| 2-Person Families | 740 (43.3%) | $100,250 |
| 3-Person Families | 363 (21.2%) | $225,839 |
| 4-Person Families | 408 (23.9%) | $213,553 |
| 5-Person Families | 180 (10.5%) | $193,750 |
| 6-Person Families | 10 (0.6%) | $0 |
| 7+ Person Families | 7 (0.4%) | $0 |
| Total | 1,708 (100.0%) | $181,333 |
Family Income by Number of Earners in Fort Washington
The median family income in Fort Washington is $181,333, with families comprising 3+ earners (273) having the highest median family income of $227,089, while families with no earners (210) have the lowest median family income of $81,413, accounting for 16.0% and 12.3% of families, respectively.
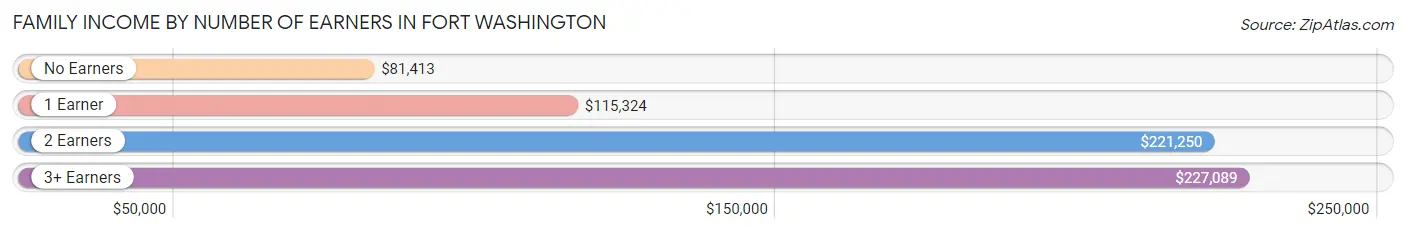
| Number of Earners | # Families | Median Income |
| No Earners | 210 (12.3%) | $81,413 |
| 1 Earner | 405 (23.7%) | $115,324 |
| 2 Earners | 820 (48.0%) | $221,250 |
| 3+ Earners | 273 (16.0%) | $227,089 |
| Total | 1,708 (100.0%) | $181,333 |
Household Income in Fort Washington
Household Income Brackets in Fort Washington
With 758 households falling in the category, the $200,000+ income range is the most frequent in Fort Washington, accounting for 33.6% of all households. In contrast, only 27 households (1.2%) fall into the $10,000 to $14,999 income bracket, making it the least populous group.
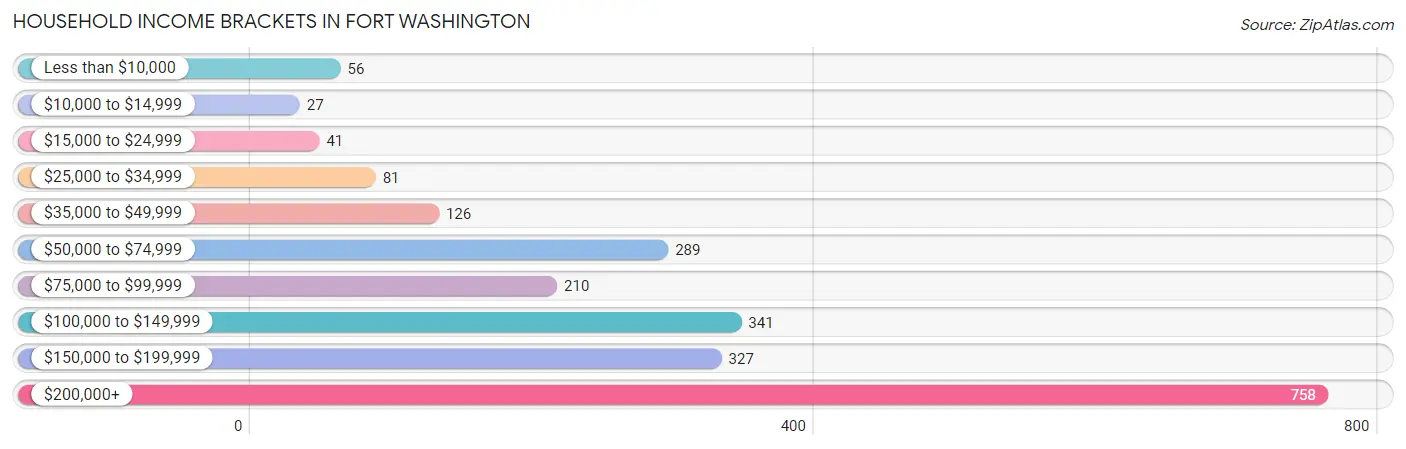
| Income Bracket | # Households | % Households |
| Less than $10,000 | 56 | 2.5% |
| $10,000 to $14,999 | 27 | 1.2% |
| $15,000 to $24,999 | 41 | 1.8% |
| $25,000 to $34,999 | 81 | 3.6% |
| $35,000 to $49,999 | 126 | 5.6% |
| $50,000 to $74,999 | 289 | 12.8% |
| $75,000 to $99,999 | 210 | 9.3% |
| $100,000 to $149,999 | 341 | 15.1% |
| $150,000 to $199,999 | 327 | 14.5% |
| $200,000+ | 758 | 33.6% |
Household Income by Householder Age in Fort Washington
The median household income in Fort Washington is $140,455, with the highest median household income of $195,857 found in the 45 to 64 years age bracket for the primary householder. A total of 870 households (38.6%) fall into this category. Meanwhile, the 15 to 24 years age bracket for the primary householder has the lowest median household income of $0, with 20 households (0.9%) in this group.
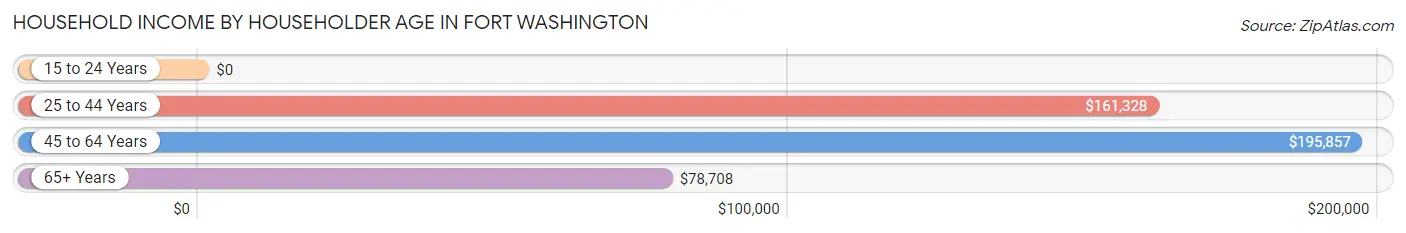
| Income Bracket | # Households | Median Income |
| 15 to 24 Years | 20 (0.9%) | $0 |
| 25 to 44 Years | 571 (25.3%) | $161,328 |
| 45 to 64 Years | 870 (38.6%) | $195,857 |
| 65+ Years | 795 (35.2%) | $78,708 |
| Total | 2,256 (100.0%) | $140,455 |
Poverty in Fort Washington
Income Below Poverty by Sex and Age in Fort Washington
With 1.9% poverty level for males and 3.0% for females among the residents of Fort Washington, 75 year old and over males and 75 year old and over females are the most vulnerable to poverty, with 36 males (11.2%) and 33 females (10.1%) in their respective age groups living below the poverty level.
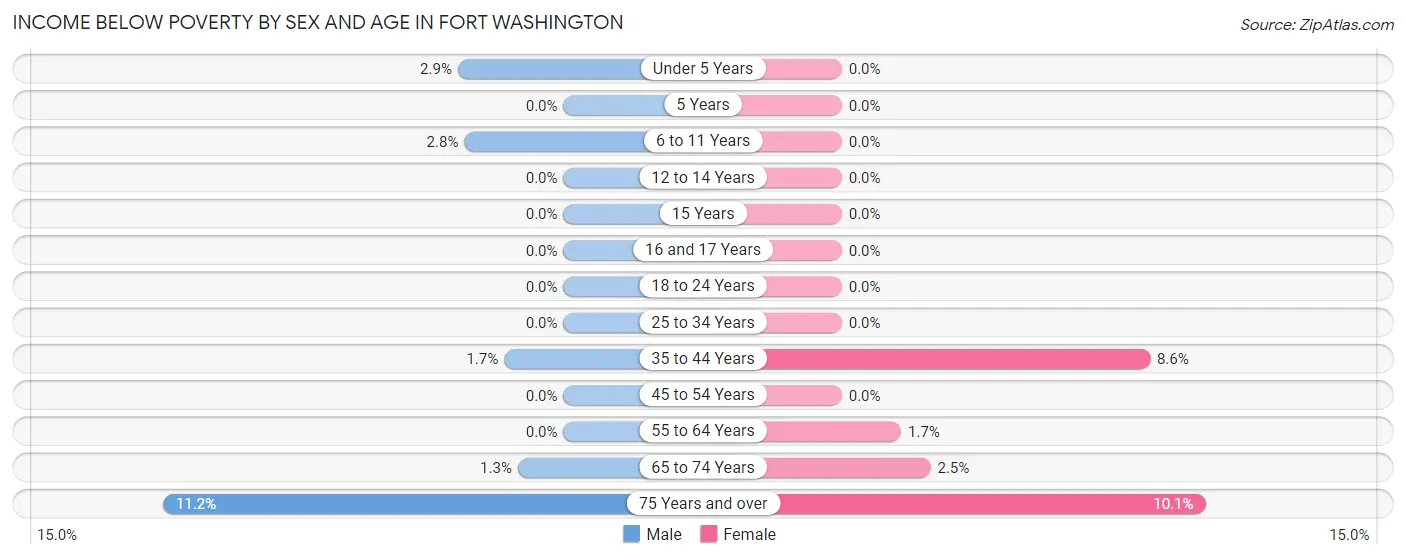
| Age Bracket | Male | Female |
| Under 5 Years | 6 (2.9%) | 0 (0.0%) |
| 5 Years | 0 (0.0%) | 0 (0.0%) |
| 6 to 11 Years | 6 (2.8%) | 0 (0.0%) |
| 12 to 14 Years | 0 (0.0%) | 0 (0.0%) |
| 15 Years | 0 (0.0%) | 0 (0.0%) |
| 16 and 17 Years | 0 (0.0%) | 0 (0.0%) |
| 18 to 24 Years | 0 (0.0%) | 0 (0.0%) |
| 25 to 34 Years | 0 (0.0%) | 0 (0.0%) |
| 35 to 44 Years | 6 (1.7%) | 44 (8.6%) |
| 45 to 54 Years | 0 (0.0%) | 0 (0.0%) |
| 55 to 64 Years | 0 (0.0%) | 9 (1.7%) |
| 65 to 74 Years | 4 (1.3%) | 10 (2.5%) |
| 75 Years and over | 36 (11.2%) | 33 (10.1%) |
| Total | 58 (1.9%) | 96 (3.0%) |
Income Above Poverty by Sex and Age in Fort Washington
According to the poverty statistics in Fort Washington, males aged 12 to 14 years and females aged under 5 years are the age groups that are most secure financially, with 100.0% of males and 100.0% of females in these age groups living above the poverty line.
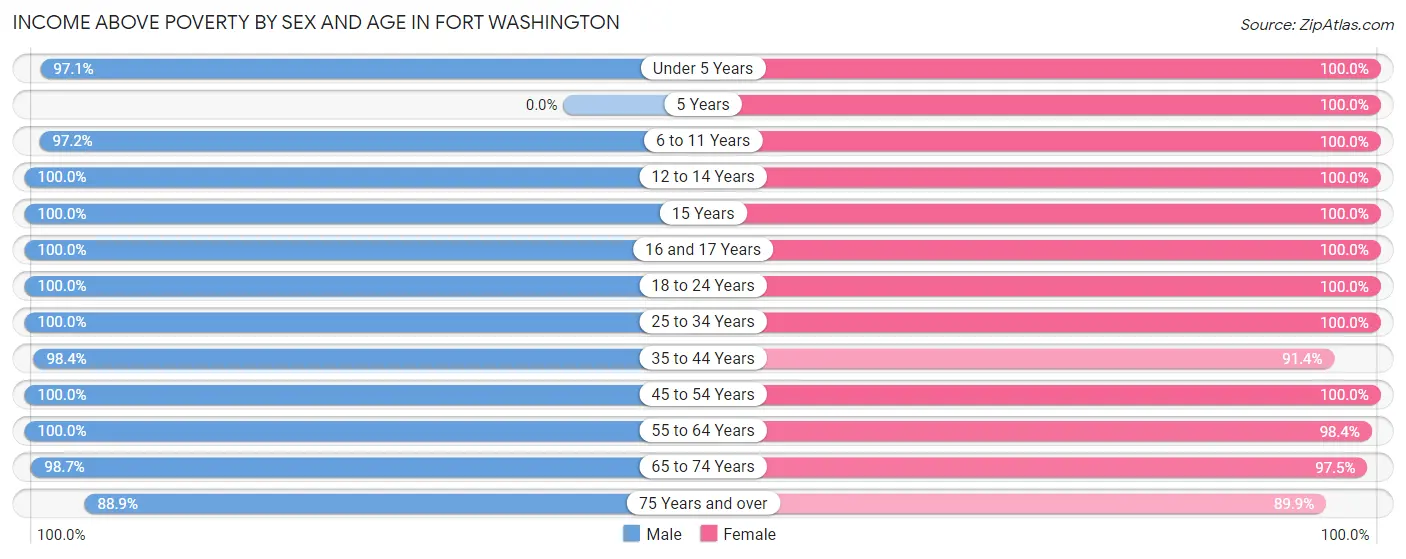
| Age Bracket | Male | Female |
| Under 5 Years | 198 (97.1%) | 142 (100.0%) |
| 5 Years | 0 (0.0%) | 72 (100.0%) |
| 6 to 11 Years | 211 (97.2%) | 217 (100.0%) |
| 12 to 14 Years | 158 (100.0%) | 165 (100.0%) |
| 15 Years | 35 (100.0%) | 56 (100.0%) |
| 16 and 17 Years | 65 (100.0%) | 71 (100.0%) |
| 18 to 24 Years | 182 (100.0%) | 257 (100.0%) |
| 25 to 34 Years | 353 (100.0%) | 172 (100.0%) |
| 35 to 44 Years | 357 (98.4%) | 469 (91.4%) |
| 45 to 54 Years | 374 (100.0%) | 222 (100.0%) |
| 55 to 64 Years | 474 (100.0%) | 536 (98.4%) |
| 65 to 74 Years | 312 (98.7%) | 395 (97.5%) |
| 75 Years and over | 287 (88.8%) | 293 (89.9%) |
| Total | 3,006 (98.1%) | 3,067 (97.0%) |
Income Below Poverty Among Married-Couple Families in Fort Washington
The poverty statistics for married-couple families in Fort Washington show that 1.1% or 15 of the total 1,407 families live below the poverty line. Families with 1 or 2 children have the highest poverty rate of 1.3%, comprising of 6 families. On the other hand, families with 3 or 4 children have the lowest poverty rate of 0.0%, which includes 0 families.
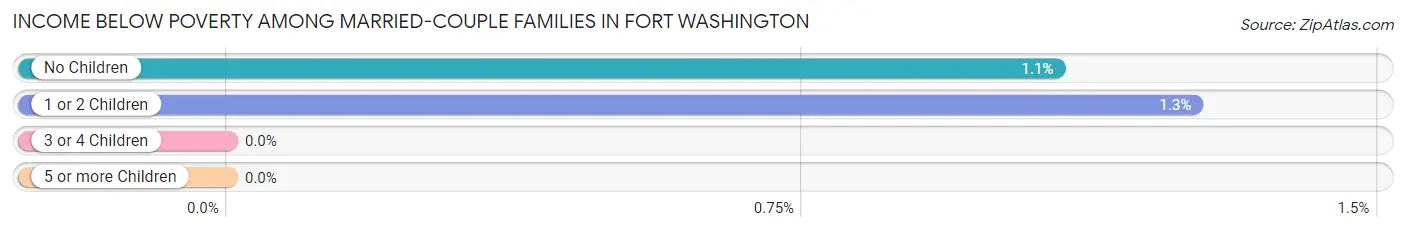
| Children | Above Poverty | Below Poverty |
| No Children | 821 (98.9%) | 9 (1.1%) |
| 1 or 2 Children | 470 (98.7%) | 6 (1.3%) |
| 3 or 4 Children | 94 (100.0%) | 0 (0.0%) |
| 5 or more Children | 7 (100.0%) | 0 (0.0%) |
| Total | 1,392 (98.9%) | 15 (1.1%) |
Income Below Poverty Among Single-Parent Households in Fort Washington
| Children | Single Father | Single Mother |
| No Children | 0 (0.0%) | 0 (0.0%) |
| 1 or 2 Children | 0 (0.0%) | 0 (0.0%) |
| 3 or 4 Children | 0 (0.0%) | 0 (0.0%) |
| 5 or more Children | 0 (0.0%) | 0 (0.0%) |
| Total | 0 (0.0%) | 0 (0.0%) |
Income Below Poverty Among Married-Couple vs Single-Parent Households in Fort Washington
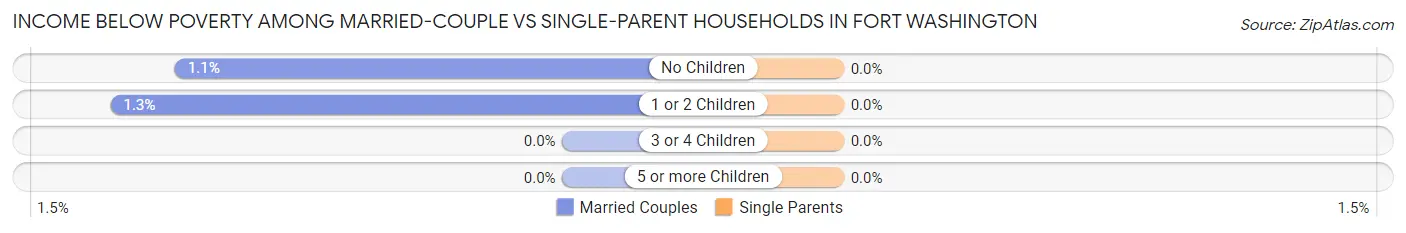
| Children | Married-Couple Families | Single-Parent Households |
| No Children | 9 (1.1%) | 0 (0.0%) |
| 1 or 2 Children | 6 (1.3%) | 0 (0.0%) |
| 3 or 4 Children | 0 (0.0%) | 0 (0.0%) |
| 5 or more Children | 0 (0.0%) | 0 (0.0%) |
| Total | 15 (1.1%) | 0 (0.0%) |
Race in Fort Washington
The most populous races in Fort Washington are White / Caucasian (5,289 | 83.8%), Two or more Races (521 | 8.3%), and Asian (417 | 6.6%).
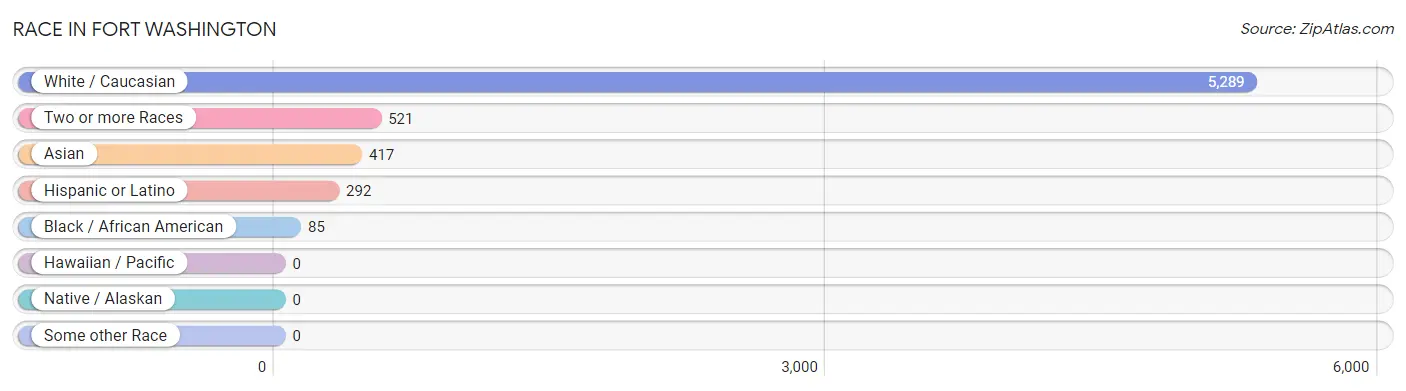
| Race | # Population | % Population |
| Asian | 417 | 6.6% |
| Black / African American | 85 | 1.3% |
| Hawaiian / Pacific | 0 | 0.0% |
| Hispanic or Latino | 292 | 4.6% |
| Native / Alaskan | 0 | 0.0% |
| White / Caucasian | 5,289 | 83.8% |
| Two or more Races | 521 | 8.3% |
| Some other Race | 0 | 0.0% |
| Total | 6,312 | 100.0% |
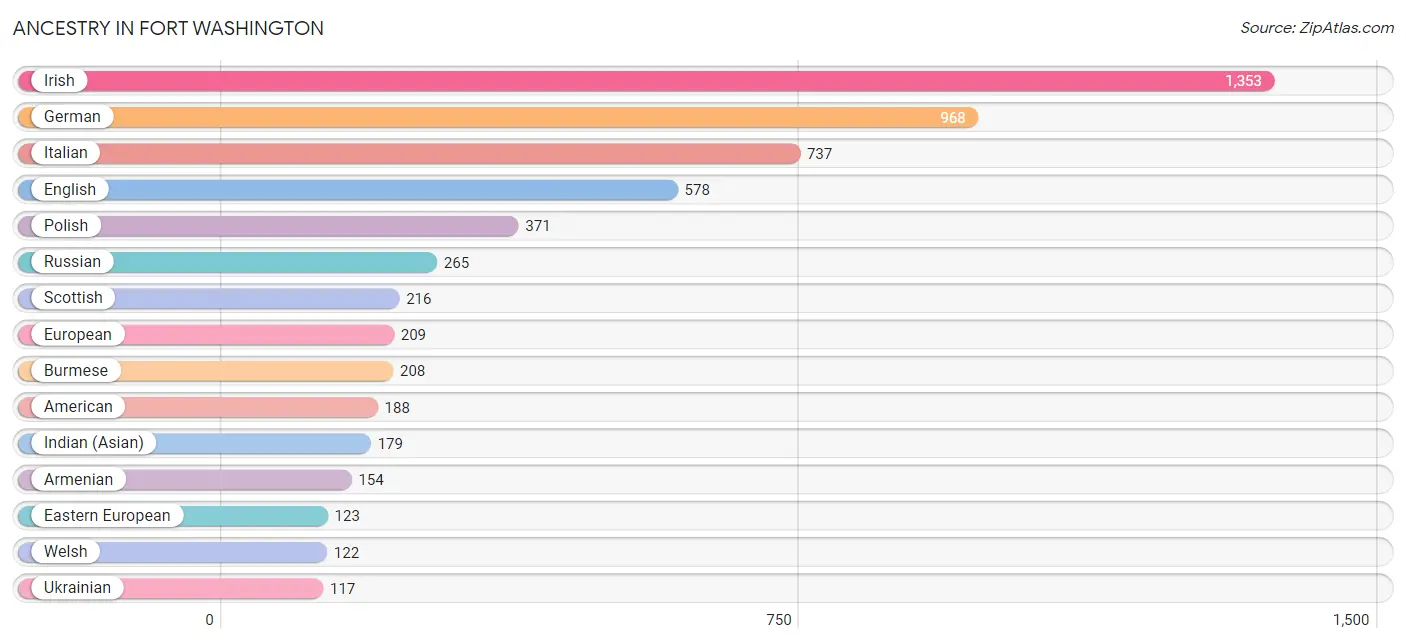
Ancestry in Fort Washington
The most populous ancestries reported in Fort Washington are Irish (1,353 | 21.4%), German (968 | 15.3%), Italian (737 | 11.7%), English (578 | 9.2%), and Polish (371 | 5.9%), together accounting for 63.5% of all Fort Washington residents.
| Ancestry | # Population | % Population |
| African | 9 | 0.1% |
| American | 188 | 3.0% |
| Arab | 24 | 0.4% |
| Armenian | 154 | 2.4% |
| Austrian | 27 | 0.4% |
| Belgian | 7 | 0.1% |
| Bhutanese | 56 | 0.9% |
| British | 9 | 0.1% |
| Burmese | 208 | 3.3% |
| Canadian | 9 | 0.1% |
| Cherokee | 71 | 1.1% |
| Chilean | 18 | 0.3% |
| Croatian | 48 | 0.8% |
| Cuban | 33 | 0.5% |
| Czech | 92 | 1.5% |
| Dominican | 70 | 1.1% |
| Dutch | 71 | 1.1% |
| Eastern European | 123 | 1.9% |
| English | 578 | 9.2% |
| Ethiopian | 29 | 0.5% |
| European | 209 | 3.3% |
| Filipino | 42 | 0.7% |
| Finnish | 14 | 0.2% |
| French | 10 | 0.2% |
| French Canadian | 10 | 0.2% |
| German | 968 | 15.3% |
| Greek | 46 | 0.7% |
| Hungarian | 24 | 0.4% |
| Indian (Asian) | 179 | 2.8% |
| Irish | 1,353 | 21.4% |
| Italian | 737 | 11.7% |
| Jamaican | 7 | 0.1% |
| Korean | 11 | 0.2% |
| Latvian | 9 | 0.1% |
| Lithuanian | 74 | 1.2% |
| Mexican | 72 | 1.1% |
| Nigerian | 14 | 0.2% |
| Northern European | 26 | 0.4% |
| Norwegian | 18 | 0.3% |
| Pennsylvania German | 10 | 0.2% |
| Peruvian | 8 | 0.1% |
| Polish | 371 | 5.9% |
| Puerto Rican | 18 | 0.3% |
| Russian | 265 | 4.2% |
| Scandinavian | 11 | 0.2% |
| Scotch-Irish | 23 | 0.4% |
| Scottish | 216 | 3.4% |
| South American | 78 | 1.2% |
| Spanish | 21 | 0.3% |
| Subsaharan African | 52 | 0.8% |
| Swedish | 106 | 1.7% |
| Swiss | 7 | 0.1% |
| Thai | 51 | 0.8% |
| Ukrainian | 117 | 1.8% |
| Venezuelan | 52 | 0.8% |
| Welsh | 122 | 1.9% | View All 56 Rows |
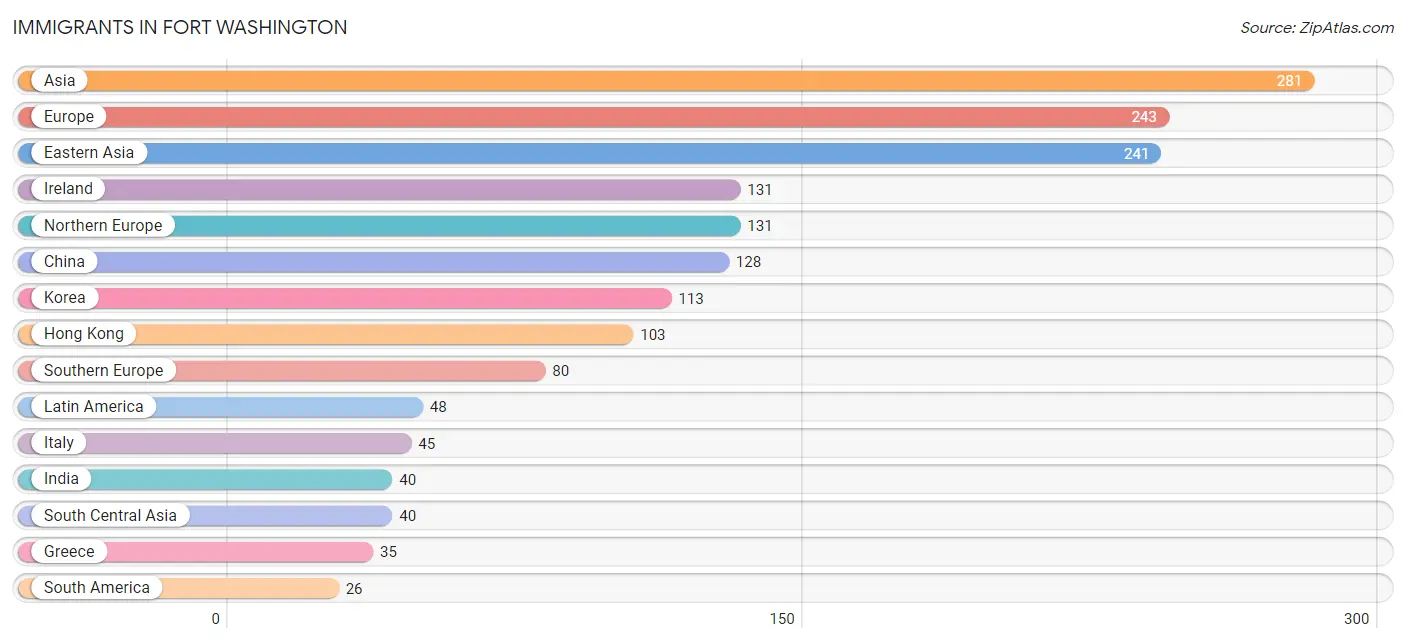
Immigrants in Fort Washington
The most numerous immigrant groups reported in Fort Washington came from Asia (281 | 4.4%), Europe (243 | 3.8%), Eastern Asia (241 | 3.8%), Ireland (131 | 2.1%), and Northern Europe (131 | 2.1%), together accounting for 16.3% of all Fort Washington residents.
| Immigration Origin | # Population | % Population |
| Africa | 7 | 0.1% |
| Asia | 281 | 4.4% |
| Belgium | 7 | 0.1% |
| Canada | 9 | 0.1% |
| Caribbean | 22 | 0.4% |
| China | 128 | 2.0% |
| Dominican Republic | 15 | 0.2% |
| Eastern Africa | 7 | 0.1% |
| Eastern Asia | 241 | 3.8% |
| Eastern Europe | 8 | 0.1% |
| Ethiopia | 7 | 0.1% |
| Europe | 243 | 3.8% |
| Germany | 17 | 0.3% |
| Greece | 35 | 0.5% |
| Hong Kong | 103 | 1.6% |
| India | 40 | 0.6% |
| Ireland | 131 | 2.1% |
| Italy | 45 | 0.7% |
| Jamaica | 7 | 0.1% |
| Korea | 113 | 1.8% |
| Latin America | 48 | 0.8% |
| Northern Europe | 131 | 2.1% |
| Peru | 8 | 0.1% |
| South America | 26 | 0.4% |
| South Central Asia | 40 | 0.6% |
| Southern Europe | 80 | 1.3% |
| Ukraine | 8 | 0.1% |
| Venezuela | 18 | 0.3% |
| Western Europe | 24 | 0.4% | View All 29 Rows |
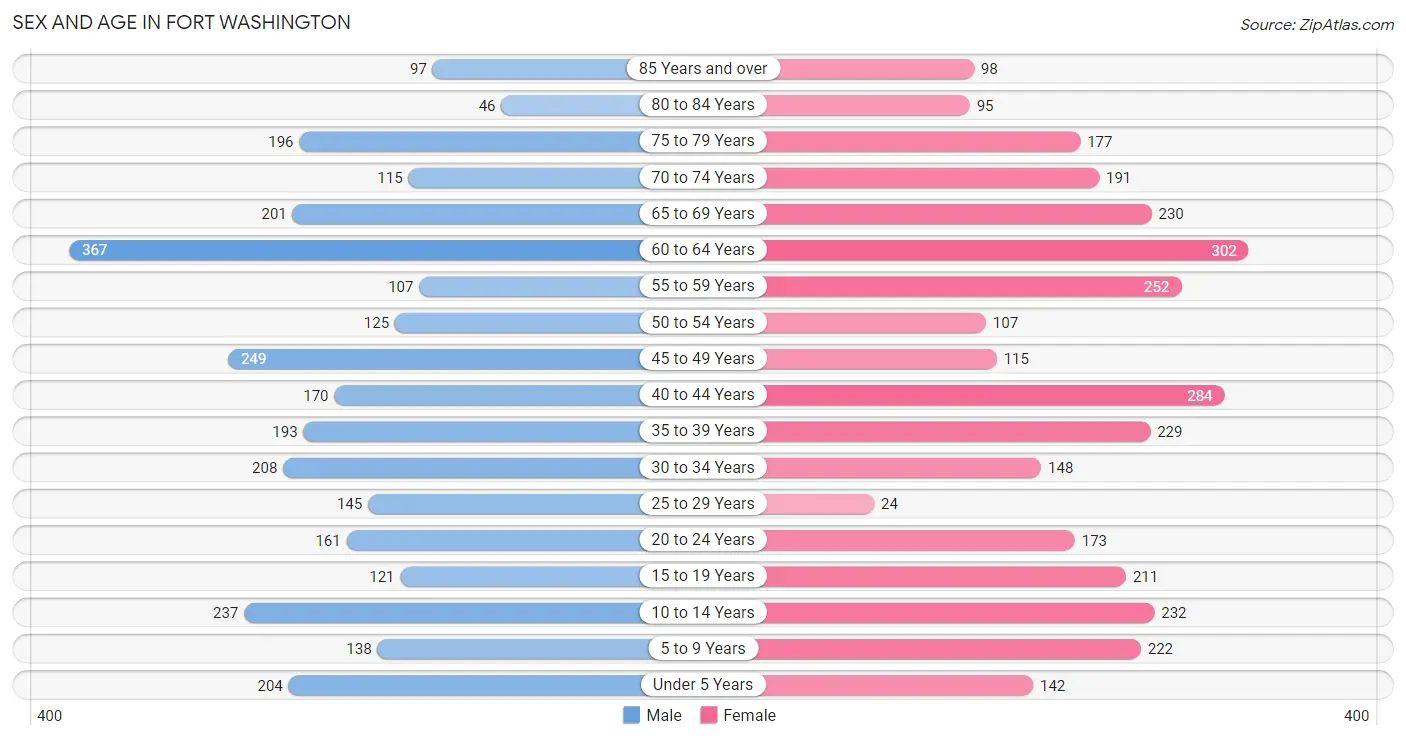
Sex and Age in Fort Washington
Sex and Age in Fort Washington
The most populous age groups in Fort Washington are 60 to 64 Years (367 | 11.9%) for men and 60 to 64 Years (302 | 9.3%) for women.
| Age Bracket | Male | Female |
| Under 5 Years | 204 (6.6%) | 142 (4.4%) |
| 5 to 9 Years | 138 (4.5%) | 222 (6.9%) |
| 10 to 14 Years | 237 (7.7%) | 232 (7.2%) |
| 15 to 19 Years | 121 (3.9%) | 211 (6.5%) |
| 20 to 24 Years | 161 (5.2%) | 173 (5.3%) |
| 25 to 29 Years | 145 (4.7%) | 24 (0.7%) |
| 30 to 34 Years | 208 (6.8%) | 148 (4.6%) |
| 35 to 39 Years | 193 (6.3%) | 229 (7.1%) |
| 40 to 44 Years | 170 (5.5%) | 284 (8.8%) |
| 45 to 49 Years | 249 (8.1%) | 115 (3.6%) |
| 50 to 54 Years | 125 (4.1%) | 107 (3.3%) |
| 55 to 59 Years | 107 (3.5%) | 252 (7.8%) |
| 60 to 64 Years | 367 (11.9%) | 302 (9.3%) |
| 65 to 69 Years | 201 (6.5%) | 230 (7.1%) |
| 70 to 74 Years | 115 (3.7%) | 191 (5.9%) |
| 75 to 79 Years | 196 (6.4%) | 177 (5.5%) |
| 80 to 84 Years | 46 (1.5%) | 95 (2.9%) |
| 85 Years and over | 97 (3.2%) | 98 (3.0%) |
| Total | 3,080 (100.0%) | 3,232 (100.0%) |
Families and Households in Fort Washington
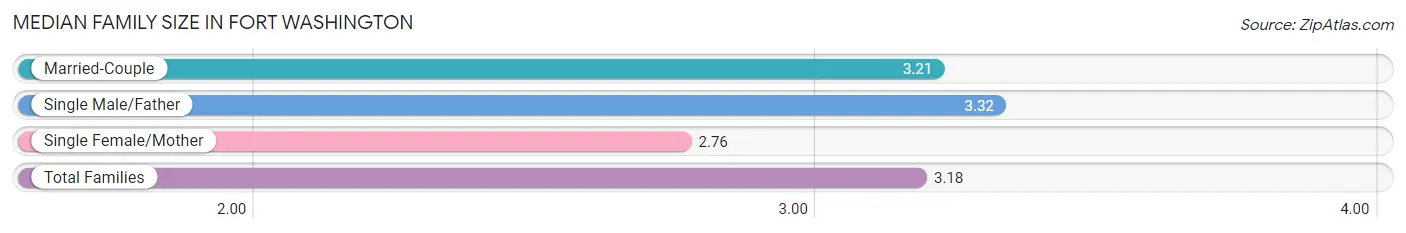
Median Family Size in Fort Washington
The median family size in Fort Washington is 3.18 persons per family, with single male/father families (141 | 8.3%) accounting for the largest median family size of 3.32 persons per family. On the other hand, single female/mother families (160 | 9.4%) represent the smallest median family size with 2.76 persons per family.
| Family Type | # Families | Family Size |
| Married-Couple | 1,407 (82.4%) | 3.21 |
| Single Male/Father | 141 (8.3%) | 3.32 |
| Single Female/Mother | 160 (9.4%) | 2.76 |
| Total Families | 1,708 (100.0%) | 3.18 |
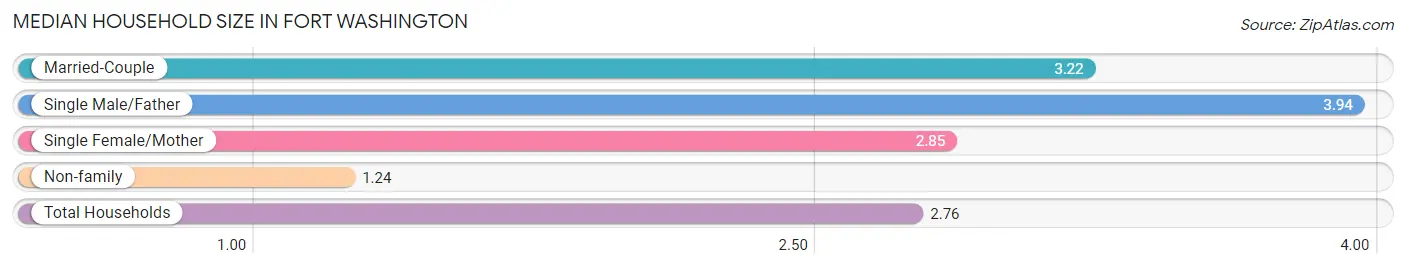
Median Household Size in Fort Washington
The median household size in Fort Washington is 2.76 persons per household, with single male/father households (141 | 6.2%) accounting for the largest median household size of 3.94 persons per household. non-family households (548 | 24.3%) represent the smallest median household size with 1.24 persons per household.
| Household Type | # Households | Household Size |
| Married-Couple | 1,407 (62.4%) | 3.22 |
| Single Male/Father | 141 (6.2%) | 3.94 |
| Single Female/Mother | 160 (7.1%) | 2.85 |
| Non-family | 548 (24.3%) | 1.24 |
| Total Households | 2,256 (100.0%) | 2.76 |
Household Size by Marriage Status in Fort Washington
Out of a total of 2,256 households in Fort Washington, 1,708 (75.7%) are family households, while 548 (24.3%) are nonfamily households. The most numerous type of family households are 2-person households, comprising 689, and the most common type of nonfamily households are 1-person households, comprising 430.
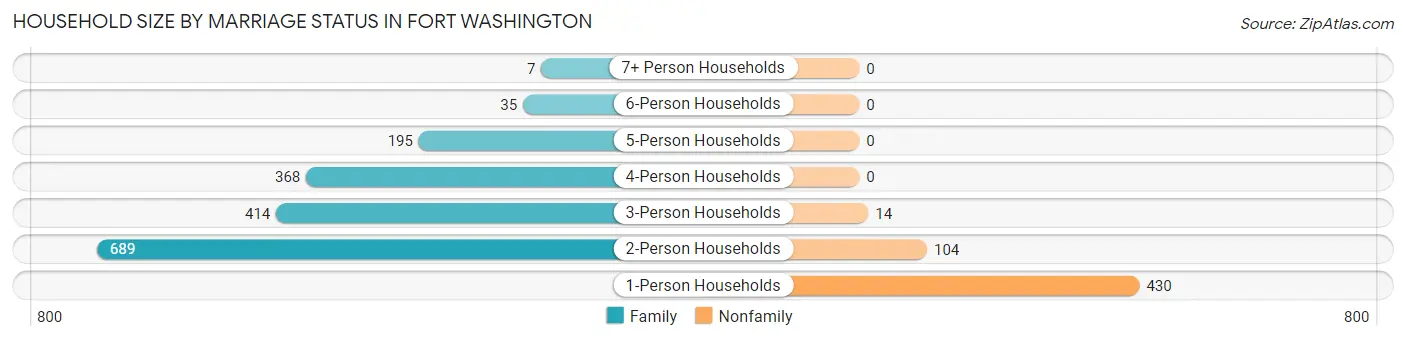
| Household Size | Family Households | Nonfamily Households |
| 1-Person Households | - | 430 (19.1%) |
| 2-Person Households | 689 (30.5%) | 104 (4.6%) |
| 3-Person Households | 414 (18.3%) | 14 (0.6%) |
| 4-Person Households | 368 (16.3%) | 0 (0.0%) |
| 5-Person Households | 195 (8.6%) | 0 (0.0%) |
| 6-Person Households | 35 (1.5%) | 0 (0.0%) |
| 7+ Person Households | 7 (0.3%) | 0 (0.0%) |
| Total | 1,708 (75.7%) | 548 (24.3%) |
Female Fertility in Fort Washington
Fertility by Age in Fort Washington
Average fertility rate in Fort Washington is 50.0 births per 1,000 women. Women in the age bracket of 20 to 34 years have the highest fertility rate with 110.0 births per 1,000 women. Women in the age bracket of 20 to 34 years acount for 63.3% of all women with births.
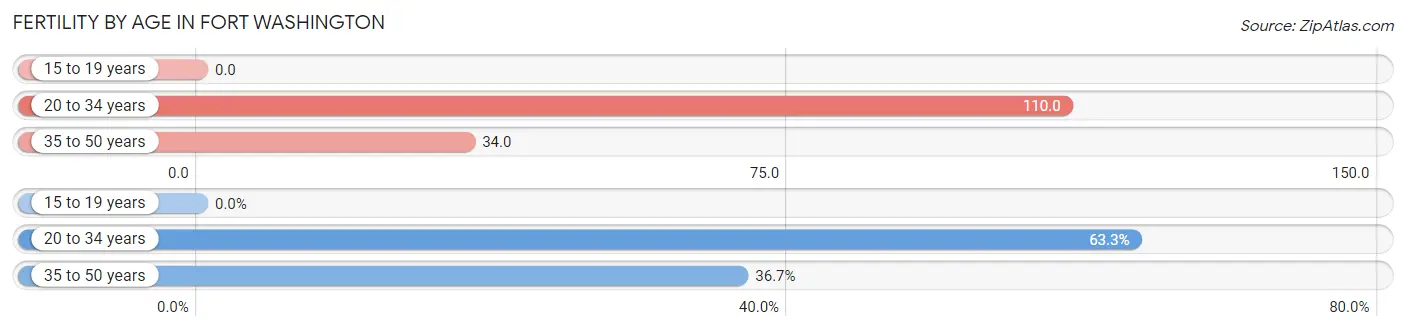
| Age Bracket | Women with Births | Births / 1,000 Women |
| 15 to 19 years | 0 (0.0%) | 0.0 |
| 20 to 34 years | 38 (63.3%) | 110.0 |
| 35 to 50 years | 22 (36.7%) | 34.0 |
| Total | 60 (100.0%) | 50.0 |
Fertility by Age by Marriage Status in Fort Washington
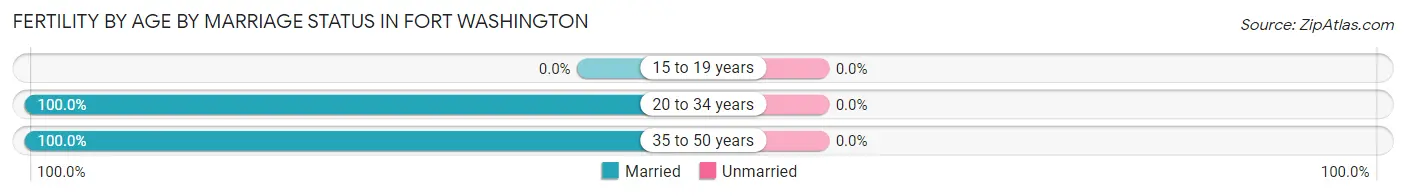
| Age Bracket | Married | Unmarried |
| 15 to 19 years | 0 (0.0%) | 0 (0.0%) |
| 20 to 34 years | 38 (100.0%) | 0 (0.0%) |
| 35 to 50 years | 22 (100.0%) | 0 (0.0%) |
| Total | 60 (100.0%) | 0 (0.0%) |
Fertility by Education in Fort Washington
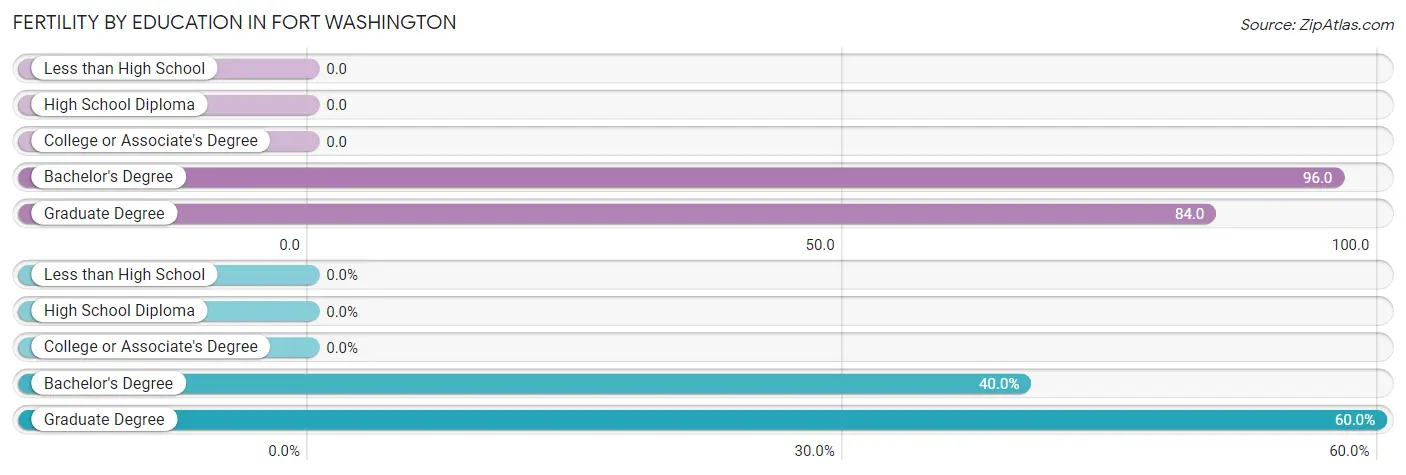
| Educational Attainment | Women with Births | Births / 1,000 Women |
| Less than High School | 0 (0.0%) | 0.0 |
| High School Diploma | 0 (0.0%) | 0.0 |
| College or Associate's Degree | 0 (0.0%) | 0.0 |
| Bachelor's Degree | 24 (40.0%) | 96.0 |
| Graduate Degree | 36 (60.0%) | 84.0 |
| Total | 60 (100.0%) | 50.0 |
Fertility by Education by Marriage Status in Fort Washington
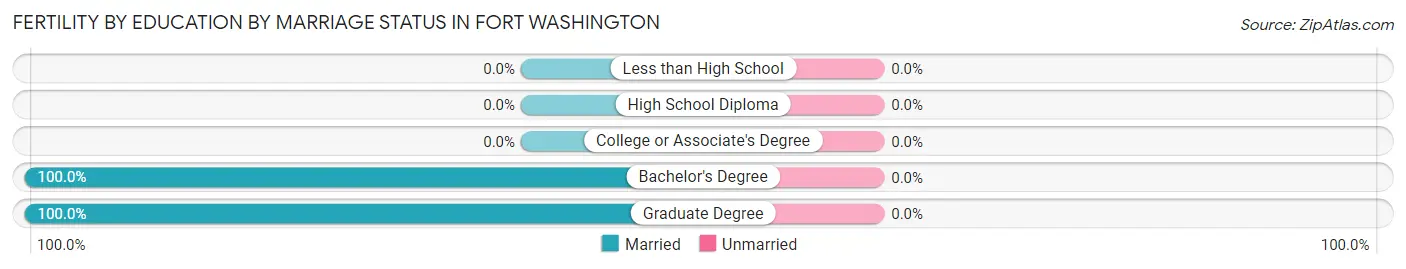
| Educational Attainment | Married | Unmarried |
| Less than High School | 0 (0.0%) | 0 (0.0%) |
| High School Diploma | 0 (0.0%) | 0 (0.0%) |
| College or Associate's Degree | 0 (0.0%) | 0 (0.0%) |
| Bachelor's Degree | 24 (100.0%) | 0 (0.0%) |
| Graduate Degree | 36 (100.0%) | 0 (0.0%) |
| Total | 60 (100.0%) | 0 (0.0%) |
Employment Characteristics in Fort Washington
Employment by Class of Employer in Fort Washington
Among the 3,249 employed individuals in Fort Washington, private company employees (2,136 | 65.7%), local government employees (368 | 11.3%), and not-for-profit organizations (357 | 11.0%) make up the most common classes of employment.
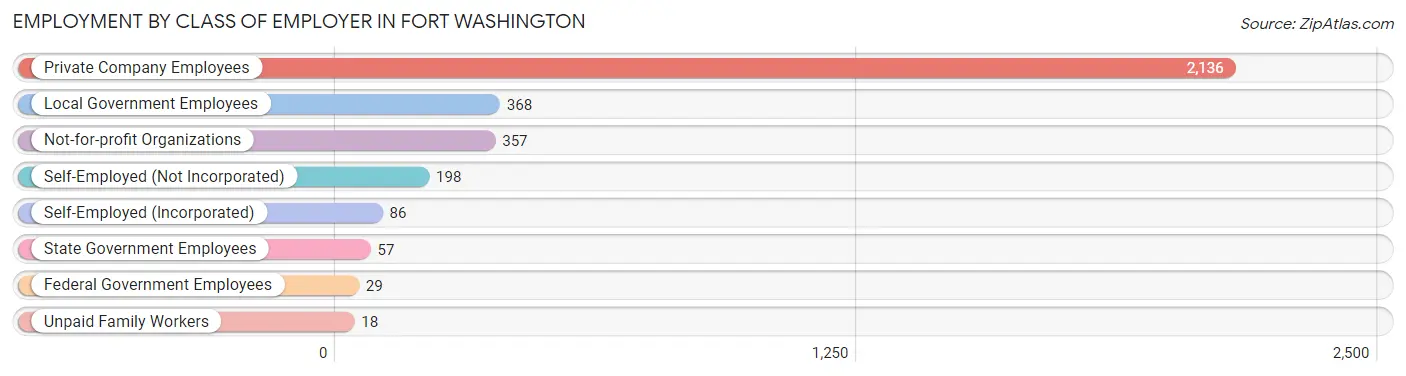
| Employer Class | # Employees | % Employees |
| Private Company Employees | 2,136 | 65.7% |
| Self-Employed (Incorporated) | 86 | 2.6% |
| Self-Employed (Not Incorporated) | 198 | 6.1% |
| Not-for-profit Organizations | 357 | 11.0% |
| Local Government Employees | 368 | 11.3% |
| State Government Employees | 57 | 1.8% |
| Federal Government Employees | 29 | 0.9% |
| Unpaid Family Workers | 18 | 0.5% |
| Total | 3,249 | 100.0% |
Employment Status by Age in Fort Washington
According to the labor force statistics for Fort Washington, out of the total population over 16 years of age (5,046), 67.6% or 3,411 individuals are in the labor force, with 3.1% or 106 of them unemployed. The age group with the highest labor force participation rate is 30 to 34 years, with 97.5% or 347 individuals in the labor force. Within the labor force, the 16 to 19 years age range has the highest percentage of unemployed individuals, with 15.9% or 10 of them being unemployed.
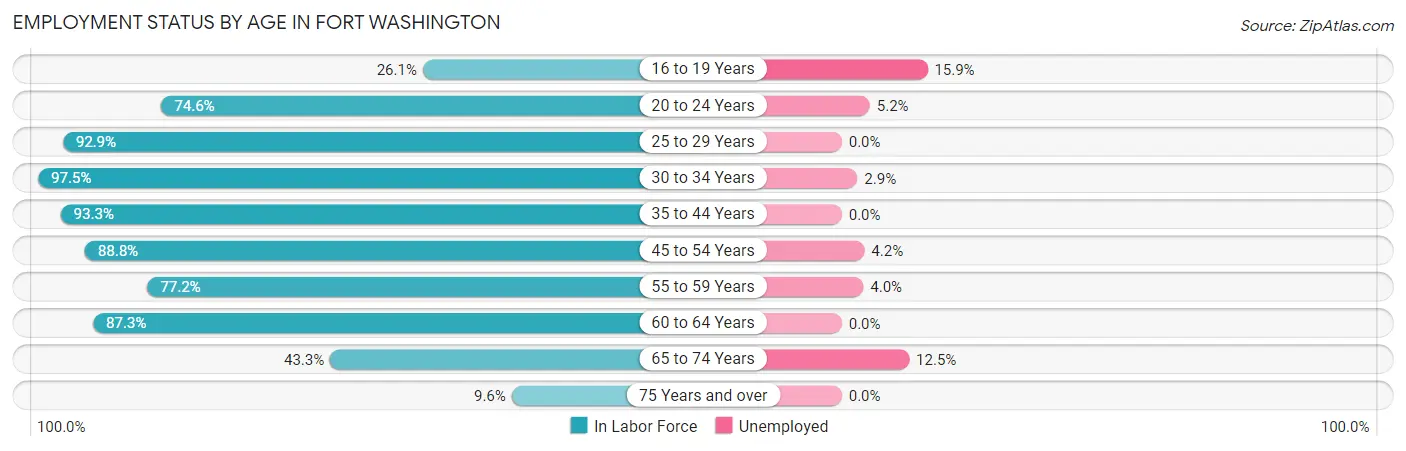
| Age Bracket | In Labor Force | Unemployed |
| 16 to 19 Years | 63 (26.1%) | 10 (15.9%) |
| 20 to 24 Years | 249 (74.6%) | 13 (5.2%) |
| 25 to 29 Years | 157 (92.9%) | 0 (0.0%) |
| 30 to 34 Years | 347 (97.5%) | 10 (2.9%) |
| 35 to 44 Years | 817 (93.3%) | 0 (0.0%) |
| 45 to 54 Years | 529 (88.8%) | 22 (4.2%) |
| 55 to 59 Years | 277 (77.2%) | 11 (4.0%) |
| 60 to 64 Years | 584 (87.3%) | 0 (0.0%) |
| 65 to 74 Years | 319 (43.3%) | 40 (12.5%) |
| 75 Years and over | 68 (9.6%) | 0 (0.0%) |
| Total | 3,411 (67.6%) | 106 (3.1%) |
Employment Status by Educational Attainment in Fort Washington
According to labor force statistics for Fort Washington, 89.6% of individuals (2,710) out of the total population between 25 and 64 years of age (3,025) are in the labor force, with 1.6% or 43 of them being unemployed. The group with the highest labor force participation rate are those with the educational attainment of bachelor's degree or higher, with 91.6% or 1,857 individuals in the labor force. Within the labor force, individuals with high school diploma education have the highest percentage of unemployment, with 3.4% or 11 of them being unemployed.
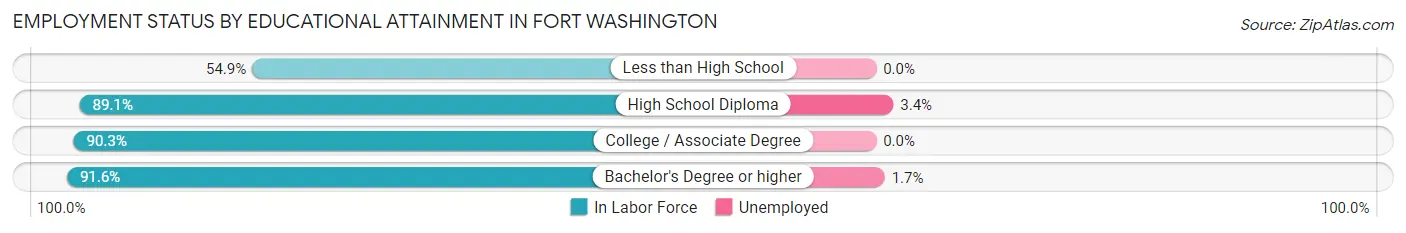
| Educational Attainment | In Labor Force | Unemployed |
| Less than High School | 67 (54.9%) | 0 (0.0%) |
| High School Diploma | 319 (89.1%) | 12 (3.4%) |
| College / Associate Degree | 468 (90.3%) | 0 (0.0%) |
| Bachelor's Degree or higher | 1,857 (91.6%) | 34 (1.7%) |
| Total | 2,710 (89.6%) | 48 (1.6%) |
Employment Occupations by Sex in Fort Washington
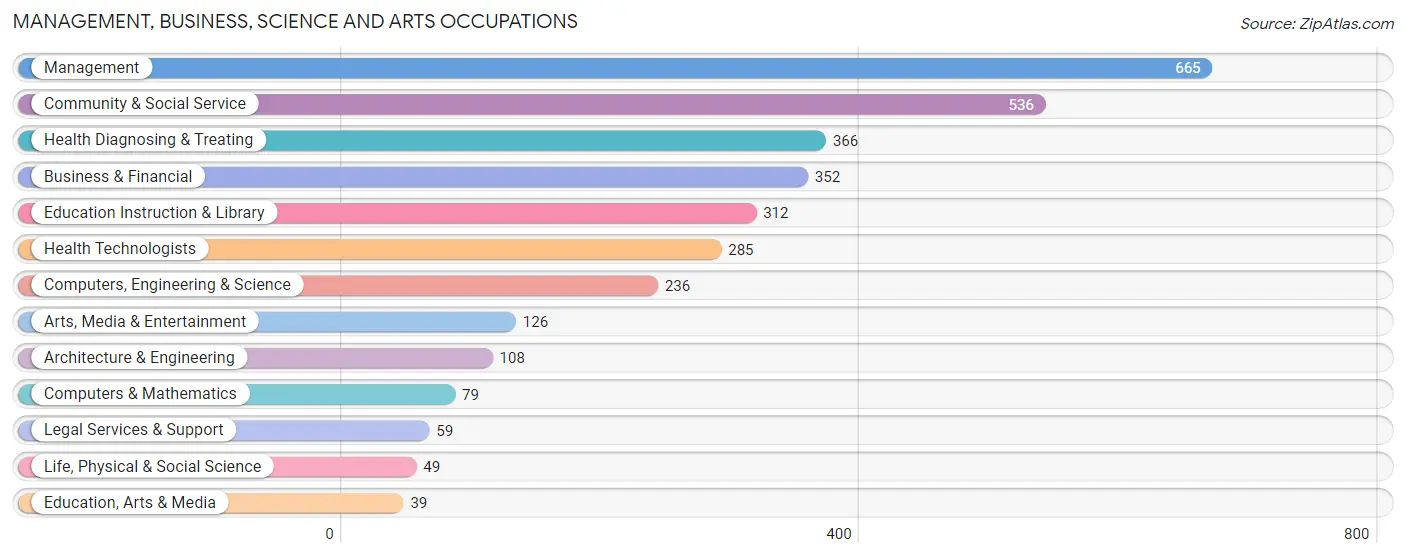
Management, Business, Science and Arts Occupations
The most common Management, Business, Science and Arts occupations in Fort Washington are Management (665 | 20.1%), Community & Social Service (536 | 16.2%), Health Diagnosing & Treating (366 | 11.1%), Business & Financial (352 | 10.6%), and Education Instruction & Library (312 | 9.4%).
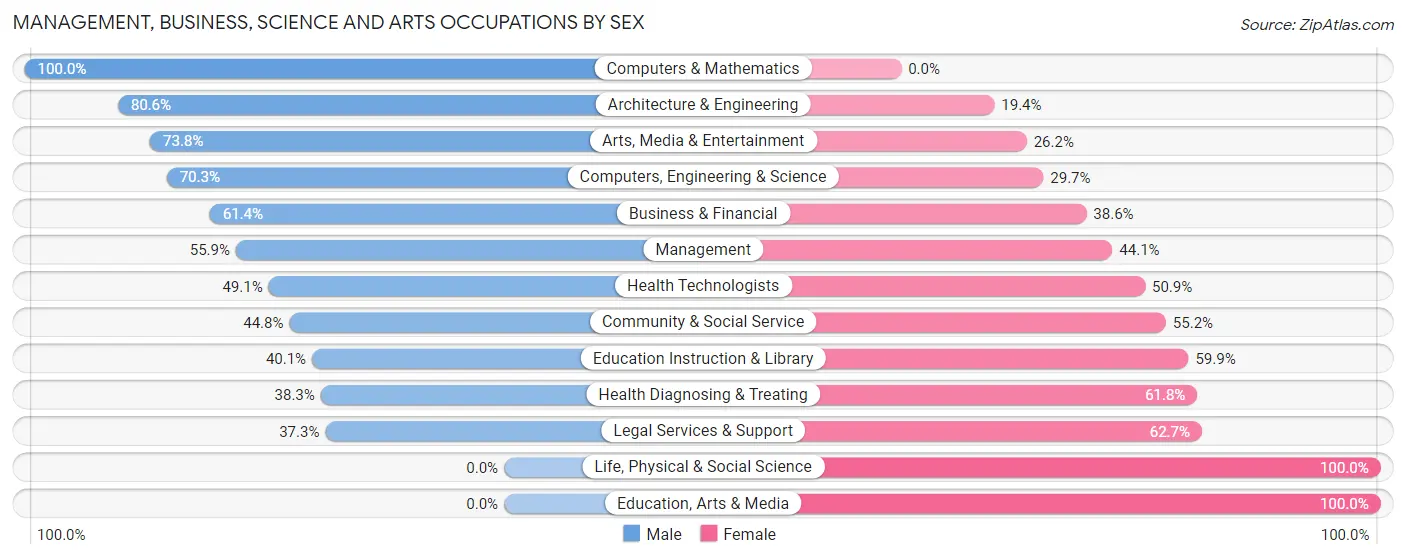
Management, Business, Science and Arts Occupations by Sex
Within the Management, Business, Science and Arts occupations in Fort Washington, the most male-oriented occupations are Computers & Mathematics (100.0%), Architecture & Engineering (80.6%), and Arts, Media & Entertainment (73.8%), while the most female-oriented occupations are Life, Physical & Social Science (100.0%), Education, Arts & Media (100.0%), and Legal Services & Support (62.7%).
| Occupation | Male | Female |
| Management | 372 (55.9%) | 293 (44.1%) |
| Business & Financial | 216 (61.4%) | 136 (38.6%) |
| Computers, Engineering & Science | 166 (70.3%) | 70 (29.7%) |
| Computers & Mathematics | 79 (100.0%) | 0 (0.0%) |
| Architecture & Engineering | 87 (80.6%) | 21 (19.4%) |
| Life, Physical & Social Science | 0 (0.0%) | 49 (100.0%) |
| Community & Social Service | 240 (44.8%) | 296 (55.2%) |
| Education, Arts & Media | 0 (0.0%) | 39 (100.0%) |
| Legal Services & Support | 22 (37.3%) | 37 (62.7%) |
| Education Instruction & Library | 125 (40.1%) | 187 (59.9%) |
| Arts, Media & Entertainment | 93 (73.8%) | 33 (26.2%) |
| Health Diagnosing & Treating | 140 (38.3%) | 226 (61.8%) |
| Health Technologists | 140 (49.1%) | 145 (50.9%) |
| Total (Category) | 1,134 (52.6%) | 1,021 (47.4%) |
| Total (Overall) | 1,791 (54.2%) | 1,513 (45.8%) |
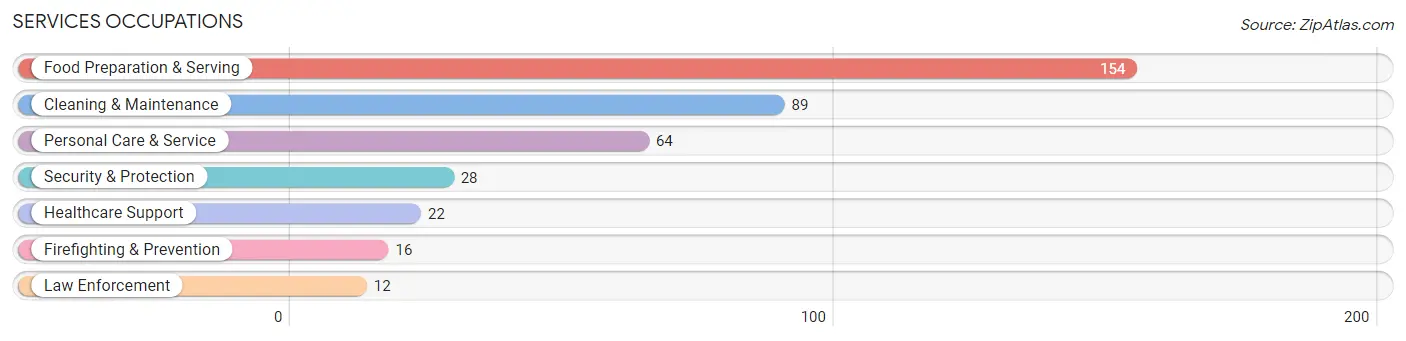
Services Occupations
The most common Services occupations in Fort Washington are Food Preparation & Serving (154 | 4.7%), Cleaning & Maintenance (89 | 2.7%), Personal Care & Service (64 | 1.9%), Security & Protection (28 | 0.9%), and Healthcare Support (22 | 0.7%).
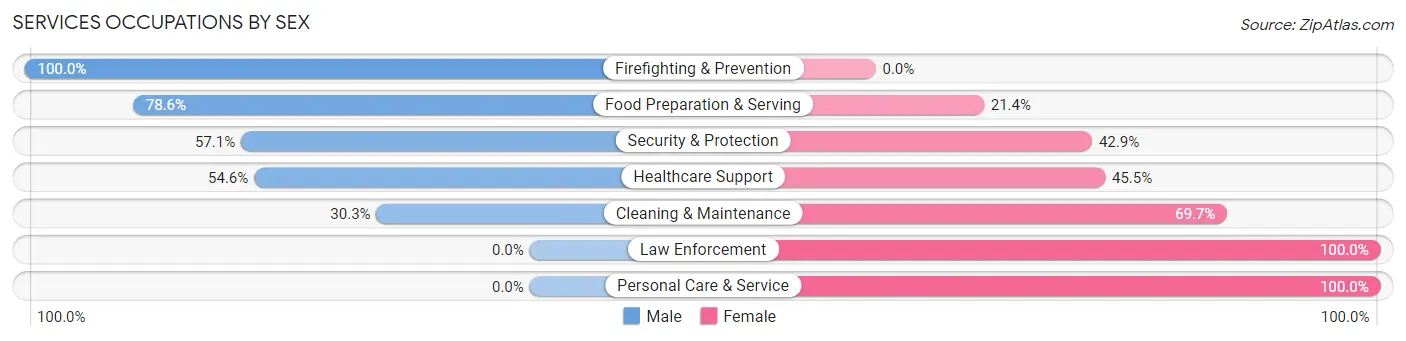
Services Occupations by Sex
Within the Services occupations in Fort Washington, the most male-oriented occupations are Firefighting & Prevention (100.0%), Food Preparation & Serving (78.6%), and Security & Protection (57.1%), while the most female-oriented occupations are Law Enforcement (100.0%), Personal Care & Service (100.0%), and Cleaning & Maintenance (69.7%).
| Occupation | Male | Female |
| Healthcare Support | 12 (54.5%) | 10 (45.5%) |
| Security & Protection | 16 (57.1%) | 12 (42.9%) |
| Firefighting & Prevention | 16 (100.0%) | 0 (0.0%) |
| Law Enforcement | 0 (0.0%) | 12 (100.0%) |
| Food Preparation & Serving | 121 (78.6%) | 33 (21.4%) |
| Cleaning & Maintenance | 27 (30.3%) | 62 (69.7%) |
| Personal Care & Service | 0 (0.0%) | 64 (100.0%) |
| Total (Category) | 176 (49.3%) | 181 (50.7%) |
| Total (Overall) | 1,791 (54.2%) | 1,513 (45.8%) |
Sales and Office Occupations
The most common Sales and Office occupations in Fort Washington are Office & Administration (347 | 10.5%), and Sales & Related (161 | 4.9%).
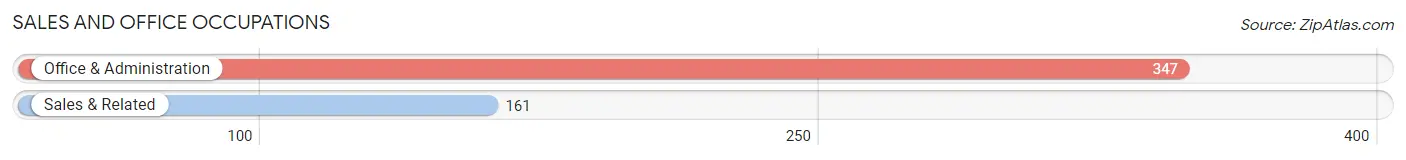
Sales and Office Occupations by Sex
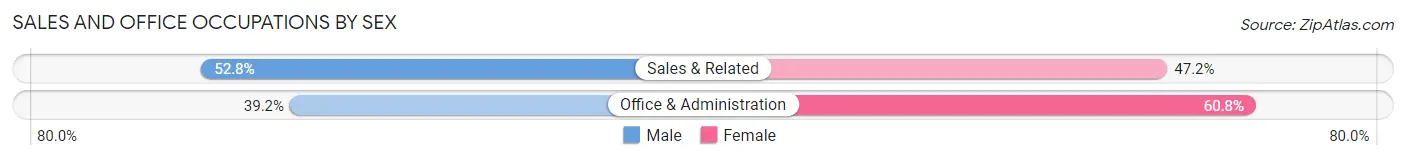
| Occupation | Male | Female |
| Sales & Related | 85 (52.8%) | 76 (47.2%) |
| Office & Administration | 136 (39.2%) | 211 (60.8%) |
| Total (Category) | 221 (43.5%) | 287 (56.5%) |
| Total (Overall) | 1,791 (54.2%) | 1,513 (45.8%) |
Natural Resources, Construction and Maintenance Occupations
The most common Natural Resources, Construction and Maintenance occupations in Fort Washington are Construction & Extraction (115 | 3.5%), and Installation, Maintenance & Repair (35 | 1.1%).
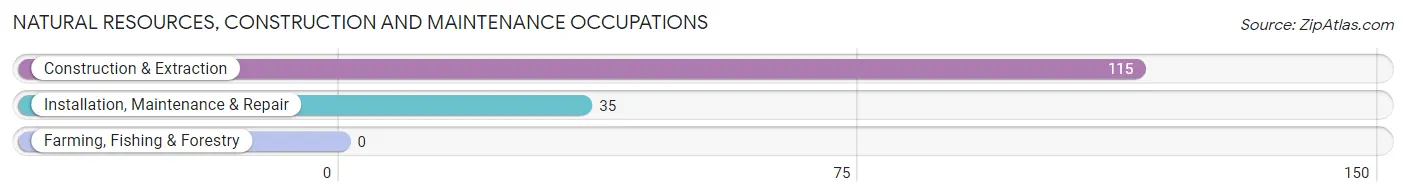
Natural Resources, Construction and Maintenance Occupations by Sex
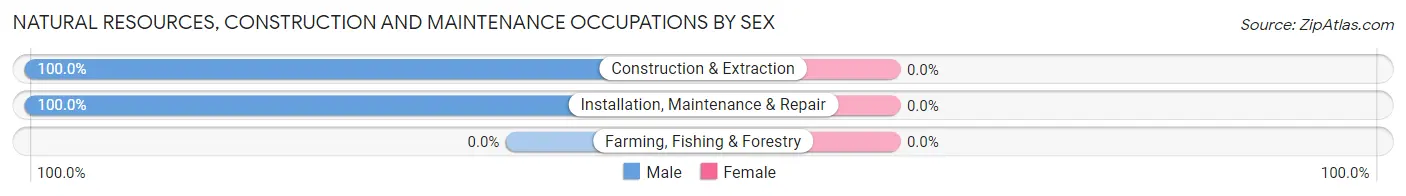
| Occupation | Male | Female |
| Farming, Fishing & Forestry | 0 (0.0%) | 0 (0.0%) |
| Construction & Extraction | 115 (100.0%) | 0 (0.0%) |
| Installation, Maintenance & Repair | 35 (100.0%) | 0 (0.0%) |
| Total (Category) | 150 (100.0%) | 0 (0.0%) |
| Total (Overall) | 1,791 (54.2%) | 1,513 (45.8%) |
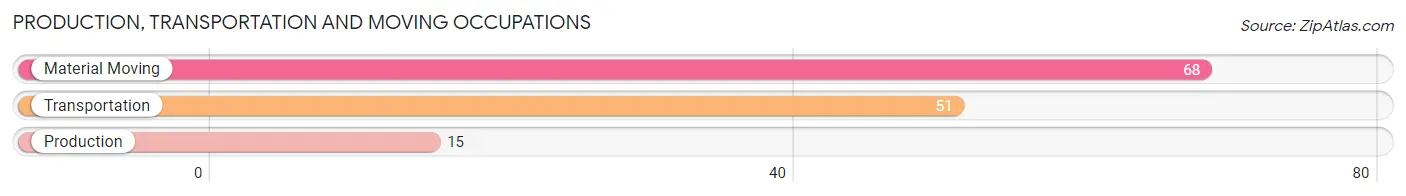
Production, Transportation and Moving Occupations
The most common Production, Transportation and Moving occupations in Fort Washington are Material Moving (68 | 2.1%), Transportation (51 | 1.5%), and Production (15 | 0.4%).
Production, Transportation and Moving Occupations by Sex
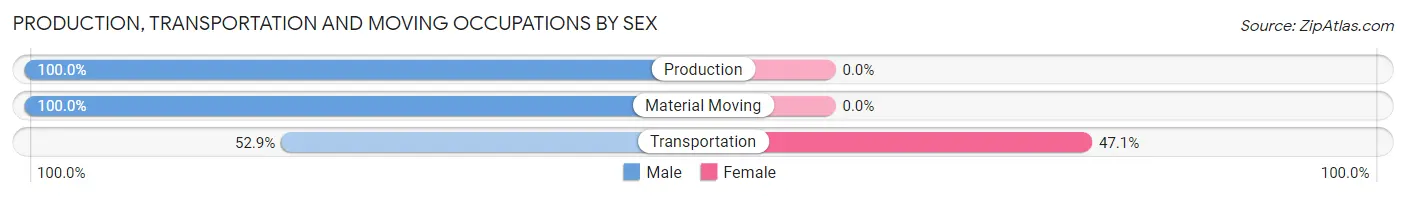
| Occupation | Male | Female |
| Production | 15 (100.0%) | 0 (0.0%) |
| Transportation | 27 (52.9%) | 24 (47.1%) |
| Material Moving | 68 (100.0%) | 0 (0.0%) |
| Total (Category) | 110 (82.1%) | 24 (17.9%) |
| Total (Overall) | 1,791 (54.2%) | 1,513 (45.8%) |
Employment Industries by Sex in Fort Washington
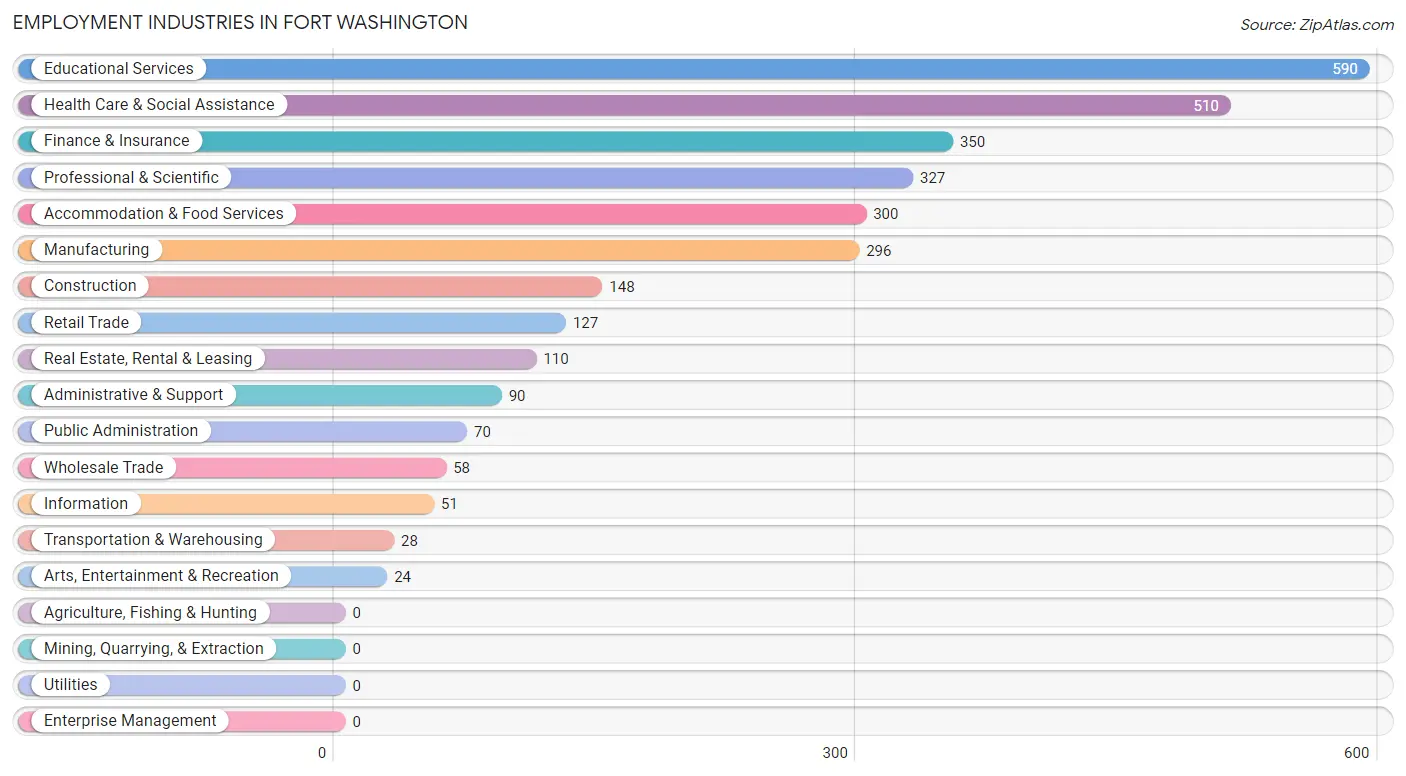
Employment Industries in Fort Washington
The major employment industries in Fort Washington include Educational Services (590 | 17.9%), Health Care & Social Assistance (510 | 15.4%), Finance & Insurance (350 | 10.6%), Professional & Scientific (327 | 9.9%), and Accommodation & Food Services (300 | 9.1%).
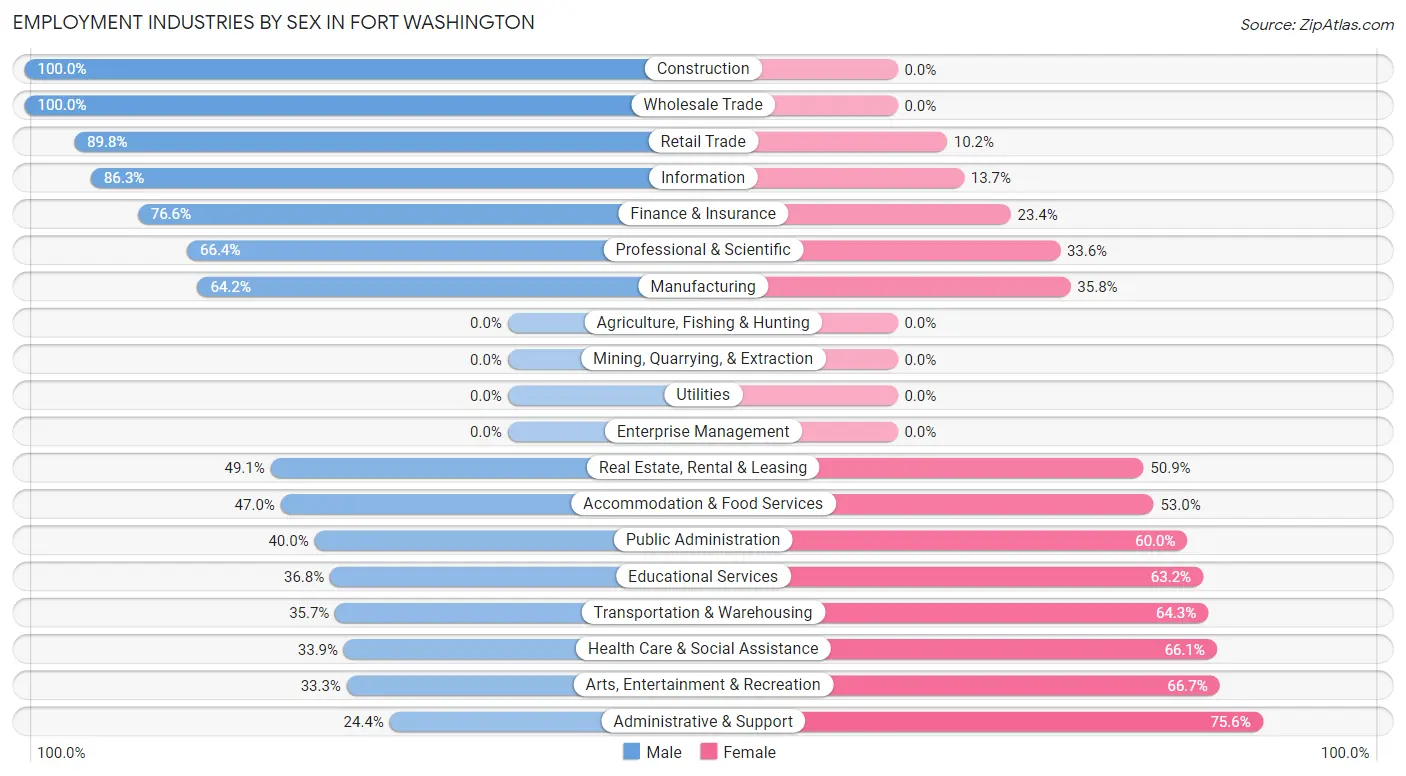
Employment Industries by Sex in Fort Washington
The Fort Washington industries that see more men than women are Construction (100.0%), Wholesale Trade (100.0%), and Retail Trade (89.8%), whereas the industries that tend to have a higher number of women are Administrative & Support (75.6%), Arts, Entertainment & Recreation (66.7%), and Health Care & Social Assistance (66.1%).
| Industry | Male | Female |
| Agriculture, Fishing & Hunting | 0 (0.0%) | 0 (0.0%) |
| Mining, Quarrying, & Extraction | 0 (0.0%) | 0 (0.0%) |
| Construction | 148 (100.0%) | 0 (0.0%) |
| Manufacturing | 190 (64.2%) | 106 (35.8%) |
| Wholesale Trade | 58 (100.0%) | 0 (0.0%) |
| Retail Trade | 114 (89.8%) | 13 (10.2%) |
| Transportation & Warehousing | 10 (35.7%) | 18 (64.3%) |
| Utilities | 0 (0.0%) | 0 (0.0%) |
| Information | 44 (86.3%) | 7 (13.7%) |
| Finance & Insurance | 268 (76.6%) | 82 (23.4%) |
| Real Estate, Rental & Leasing | 54 (49.1%) | 56 (50.9%) |
| Professional & Scientific | 217 (66.4%) | 110 (33.6%) |
| Enterprise Management | 0 (0.0%) | 0 (0.0%) |
| Administrative & Support | 22 (24.4%) | 68 (75.6%) |
| Educational Services | 217 (36.8%) | 373 (63.2%) |
| Health Care & Social Assistance | 173 (33.9%) | 337 (66.1%) |
| Arts, Entertainment & Recreation | 8 (33.3%) | 16 (66.7%) |
| Accommodation & Food Services | 141 (47.0%) | 159 (53.0%) |
| Public Administration | 28 (40.0%) | 42 (60.0%) |
| Total | 1,791 (54.2%) | 1,513 (45.8%) |
Education in Fort Washington
School Enrollment in Fort Washington
The most common levels of schooling among the 1,406 students in Fort Washington are middle school (436 | 31.0%), high school (305 | 21.7%), and elementary school (287 | 20.4%).
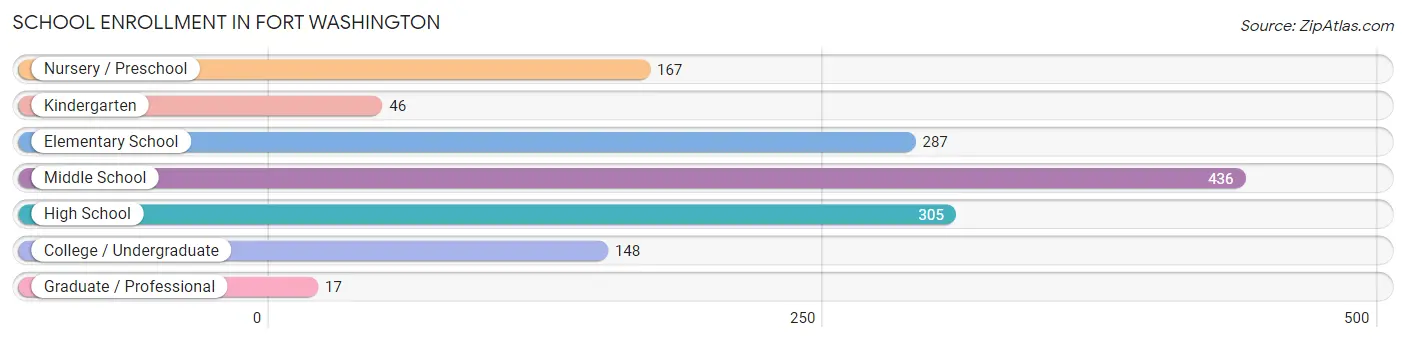
| School Level | # Students | % Students |
| Nursery / Preschool | 167 | 11.9% |
| Kindergarten | 46 | 3.3% |
| Elementary School | 287 | 20.4% |
| Middle School | 436 | 31.0% |
| High School | 305 | 21.7% |
| College / Undergraduate | 148 | 10.5% |
| Graduate / Professional | 17 | 1.2% |
| Total | 1,406 | 100.0% |
School Enrollment by Age by Funding Source in Fort Washington
Out of a total of 1,406 students who are enrolled in schools in Fort Washington, 422 (30.0%) attend a private institution, while the remaining 984 (70.0%) are enrolled in public schools. The age group of 3 to 4 year olds has the highest likelihood of being enrolled in private schools, with 115 (68.9% in the age bracket) enrolled. Conversely, the age group of 15 to 17 year olds has the lowest likelihood of being enrolled in a private school, with 203 (89.4% in the age bracket) attending a public institution.
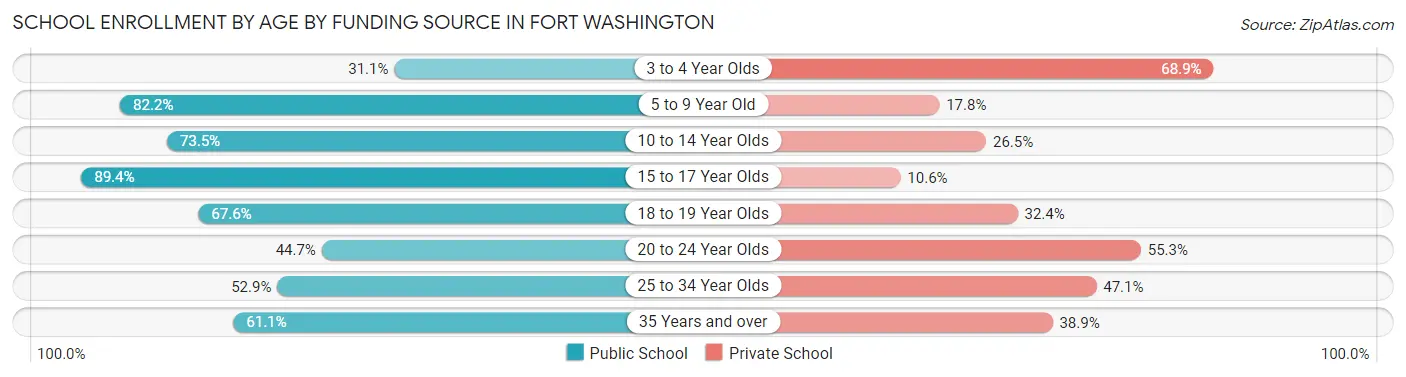
| Age Bracket | Public School | Private School |
| 3 to 4 Year Olds | 52 (31.1%) | 115 (68.9%) |
| 5 to 9 Year Old | 254 (82.2%) | 55 (17.8%) |
| 10 to 14 Year Olds | 338 (73.5%) | 122 (26.5%) |
| 15 to 17 Year Olds | 203 (89.4%) | 24 (10.6%) |
| 18 to 19 Year Olds | 71 (67.6%) | 34 (32.4%) |
| 20 to 24 Year Olds | 46 (44.7%) | 57 (55.3%) |
| 25 to 34 Year Olds | 9 (52.9%) | 8 (47.1%) |
| 35 Years and over | 11 (61.1%) | 7 (38.9%) |
| Total | 984 (70.0%) | 422 (30.0%) |
Educational Attainment by Field of Study in Fort Washington
Business (543 | 18.8%), education (396 | 13.7%), bio, nature & agricultural (316 | 10.9%), engineering (248 | 8.6%), and science & technology (239 | 8.3%) are the most common fields of study among 2,896 individuals in Fort Washington who have obtained a bachelor's degree or higher.
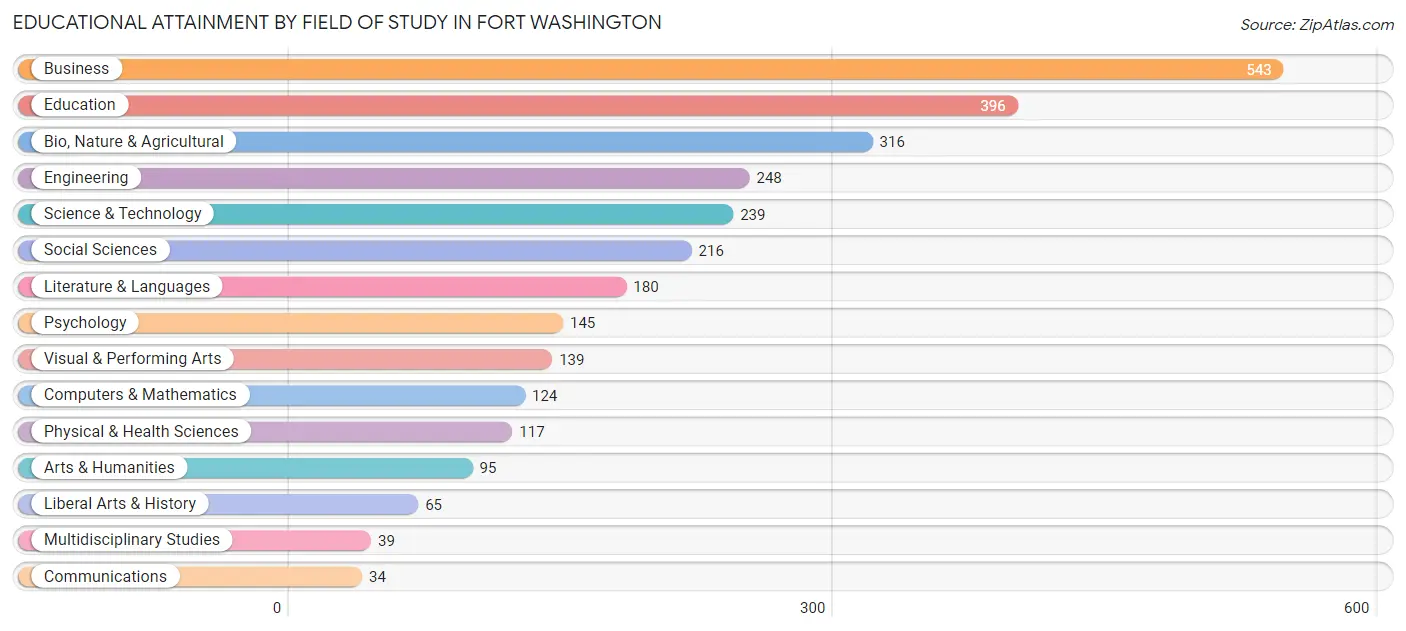
| Field of Study | # Graduates | % Graduates |
| Computers & Mathematics | 124 | 4.3% |
| Bio, Nature & Agricultural | 316 | 10.9% |
| Physical & Health Sciences | 117 | 4.0% |
| Psychology | 145 | 5.0% |
| Social Sciences | 216 | 7.5% |
| Engineering | 248 | 8.6% |
| Multidisciplinary Studies | 39 | 1.3% |
| Science & Technology | 239 | 8.3% |
| Business | 543 | 18.8% |
| Education | 396 | 13.7% |
| Literature & Languages | 180 | 6.2% |
| Liberal Arts & History | 65 | 2.2% |
| Visual & Performing Arts | 139 | 4.8% |
| Communications | 34 | 1.2% |
| Arts & Humanities | 95 | 3.3% |
| Total | 2,896 | 100.0% |
Transportation & Commute in Fort Washington
Vehicle Availability by Sex in Fort Washington
The most prevalent vehicle ownership categories in Fort Washington are males with 2 vehicles (1,026, accounting for 57.5%) and females with 2 vehicles (867, making up 70.0%).
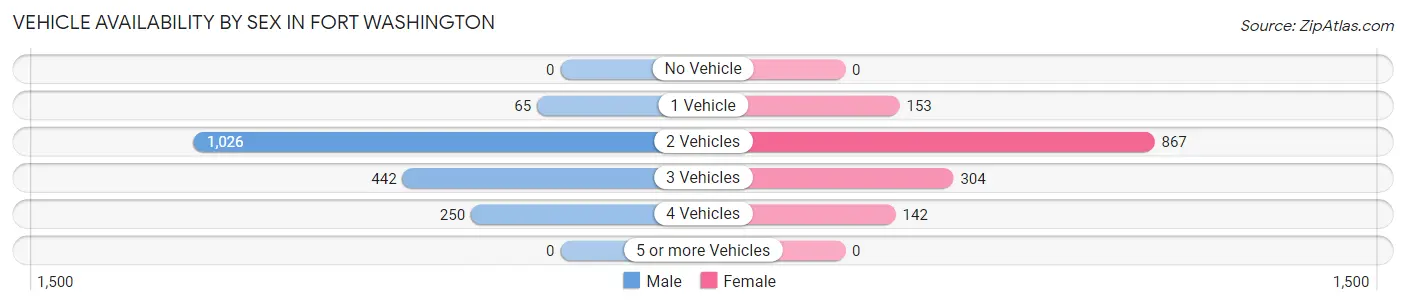
| Vehicles Available | Male | Female |
| No Vehicle | 0 (0.0%) | 0 (0.0%) |
| 1 Vehicle | 65 (3.6%) | 153 (10.4%) |
| 2 Vehicles | 1,026 (57.5%) | 867 (59.1%) |
| 3 Vehicles | 442 (24.8%) | 304 (20.7%) |
| 4 Vehicles | 250 (14.0%) | 142 (9.7%) |
| 5 or more Vehicles | 0 (0.0%) | 0 (0.0%) |
| Total | 1,783 (100.0%) | 1,466 (100.0%) |
Commute Time in Fort Washington
The most frequently occuring commute durations in Fort Washington are 45 to 59 minutes (434 commuters, 17.2%), 25 to 29 minutes (278 commuters, 11.0%), and 15 to 19 minutes (269 commuters, 10.6%).
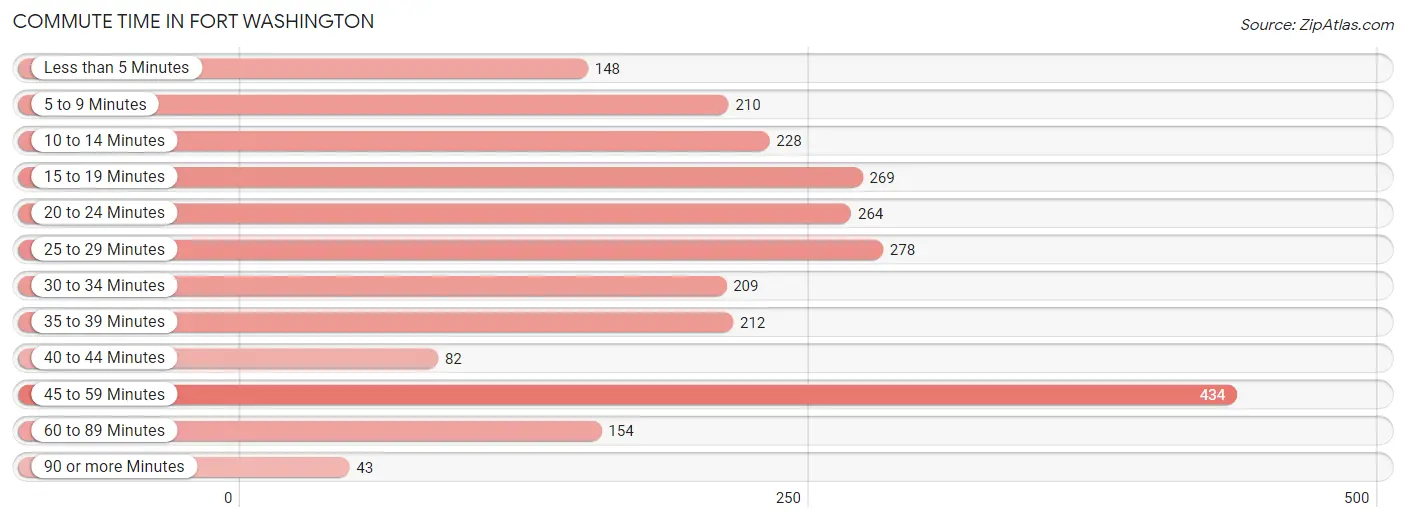
| Commute Time | # Commuters | % Commuters |
| Less than 5 Minutes | 148 | 5.9% |
| 5 to 9 Minutes | 210 | 8.3% |
| 10 to 14 Minutes | 228 | 9.0% |
| 15 to 19 Minutes | 269 | 10.6% |
| 20 to 24 Minutes | 264 | 10.4% |
| 25 to 29 Minutes | 278 | 11.0% |
| 30 to 34 Minutes | 209 | 8.3% |
| 35 to 39 Minutes | 212 | 8.4% |
| 40 to 44 Minutes | 82 | 3.2% |
| 45 to 59 Minutes | 434 | 17.2% |
| 60 to 89 Minutes | 154 | 6.1% |
| 90 or more Minutes | 43 | 1.7% |
Commute Time by Sex in Fort Washington
The most common commute times in Fort Washington are 45 to 59 minutes (317 commuters, 23.9%) for males and 20 to 24 minutes (160 commuters, 13.3%) for females.
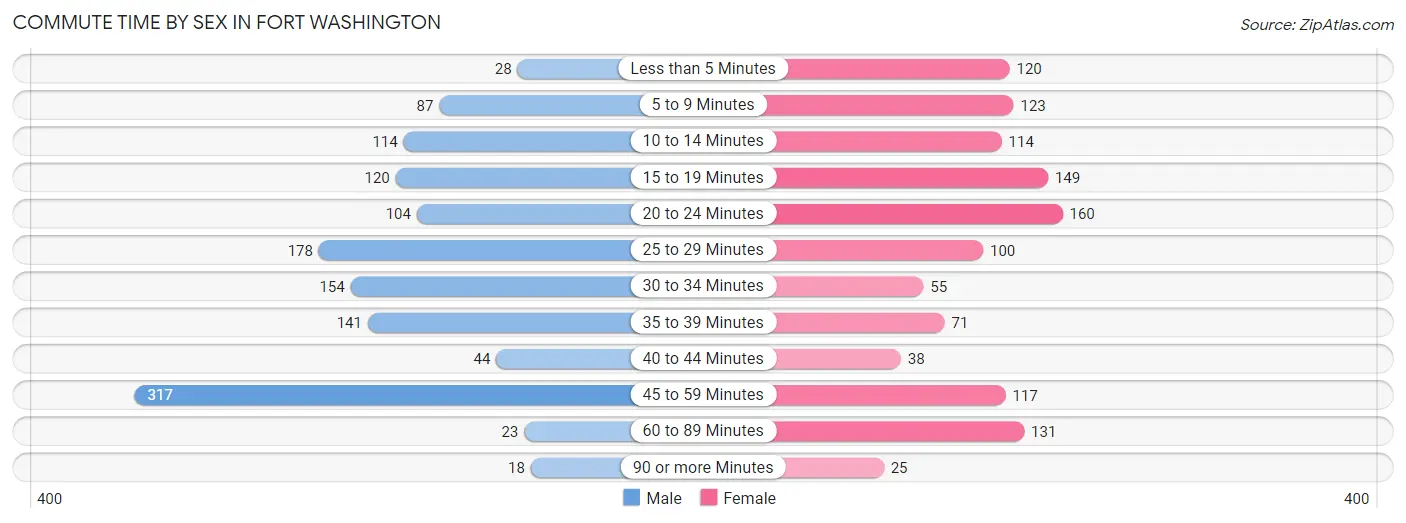
| Commute Time | Male | Female |
| Less than 5 Minutes | 28 (2.1%) | 120 (10.0%) |
| 5 to 9 Minutes | 87 (6.6%) | 123 (10.2%) |
| 10 to 14 Minutes | 114 (8.6%) | 114 (9.5%) |
| 15 to 19 Minutes | 120 (9.0%) | 149 (12.4%) |
| 20 to 24 Minutes | 104 (7.8%) | 160 (13.3%) |
| 25 to 29 Minutes | 178 (13.4%) | 100 (8.3%) |
| 30 to 34 Minutes | 154 (11.6%) | 55 (4.6%) |
| 35 to 39 Minutes | 141 (10.6%) | 71 (5.9%) |
| 40 to 44 Minutes | 44 (3.3%) | 38 (3.2%) |
| 45 to 59 Minutes | 317 (23.9%) | 117 (9.7%) |
| 60 to 89 Minutes | 23 (1.7%) | 131 (10.9%) |
| 90 or more Minutes | 18 (1.4%) | 25 (2.1%) |
Time of Departure to Work by Sex in Fort Washington
The most frequent times of departure to work in Fort Washington are 7:30 AM to 7:59 AM (250, 18.8%) for males and 7:00 AM to 7:29 AM (254, 21.1%) for females.
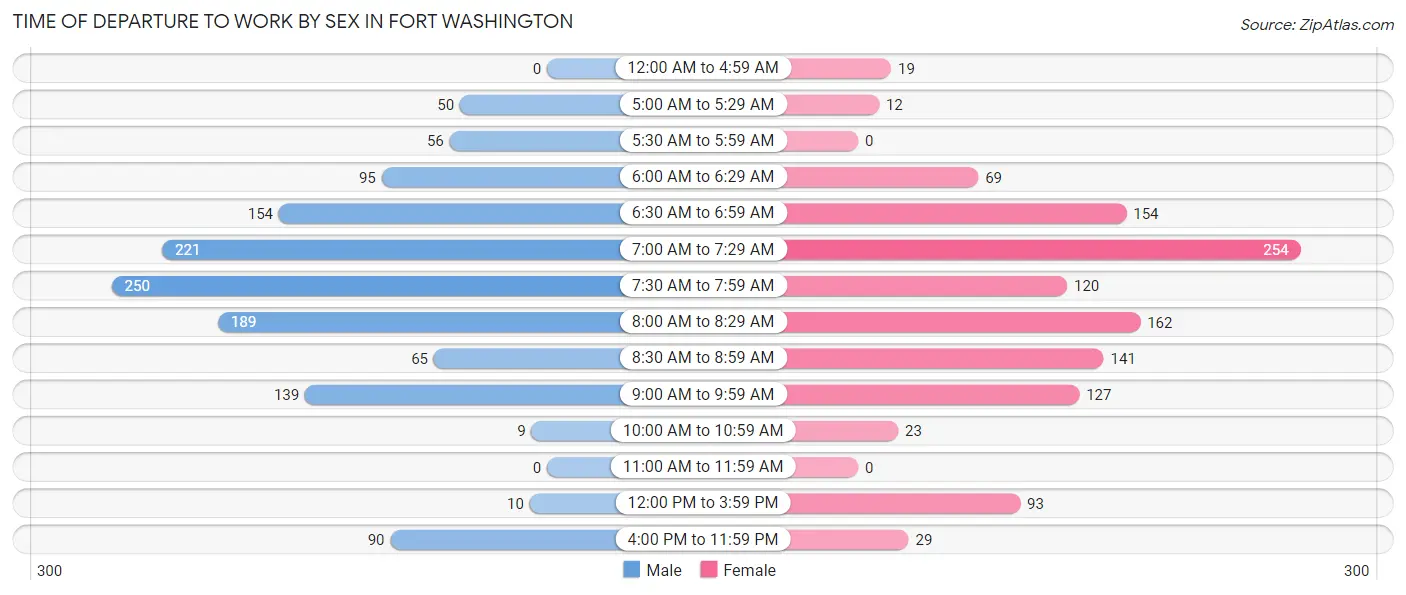
| Time of Departure | Male | Female |
| 12:00 AM to 4:59 AM | 0 (0.0%) | 19 (1.6%) |
| 5:00 AM to 5:29 AM | 50 (3.8%) | 12 (1.0%) |
| 5:30 AM to 5:59 AM | 56 (4.2%) | 0 (0.0%) |
| 6:00 AM to 6:29 AM | 95 (7.1%) | 69 (5.7%) |
| 6:30 AM to 6:59 AM | 154 (11.6%) | 154 (12.8%) |
| 7:00 AM to 7:29 AM | 221 (16.6%) | 254 (21.1%) |
| 7:30 AM to 7:59 AM | 250 (18.8%) | 120 (10.0%) |
| 8:00 AM to 8:29 AM | 189 (14.2%) | 162 (13.5%) |
| 8:30 AM to 8:59 AM | 65 (4.9%) | 141 (11.7%) |
| 9:00 AM to 9:59 AM | 139 (10.5%) | 127 (10.6%) |
| 10:00 AM to 10:59 AM | 9 (0.7%) | 23 (1.9%) |
| 11:00 AM to 11:59 AM | 0 (0.0%) | 0 (0.0%) |
| 12:00 PM to 3:59 PM | 10 (0.7%) | 93 (7.7%) |
| 4:00 PM to 11:59 PM | 90 (6.8%) | 29 (2.4%) |
| Total | 1,328 (100.0%) | 1,203 (100.0%) |
Housing Occupancy in Fort Washington
Occupancy by Ownership in Fort Washington
Of the total 2,256 dwellings in Fort Washington, owner-occupied units account for 1,800 (79.8%), while renter-occupied units make up 456 (20.2%).
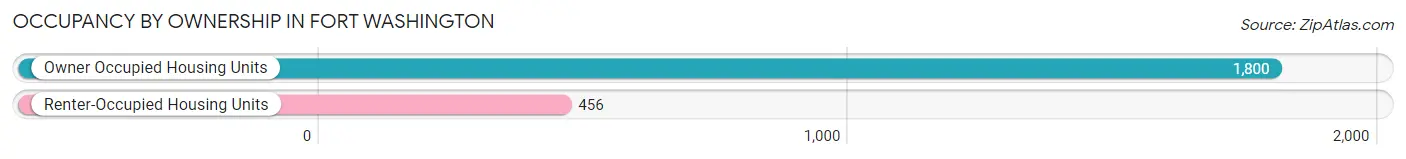
| Occupancy | # Housing Units | % Housing Units |
| Owner Occupied Housing Units | 1,800 | 79.8% |
| Renter-Occupied Housing Units | 456 | 20.2% |
| Total Occupied Housing Units | 2,256 | 100.0% |
Occupancy by Household Size in Fort Washington
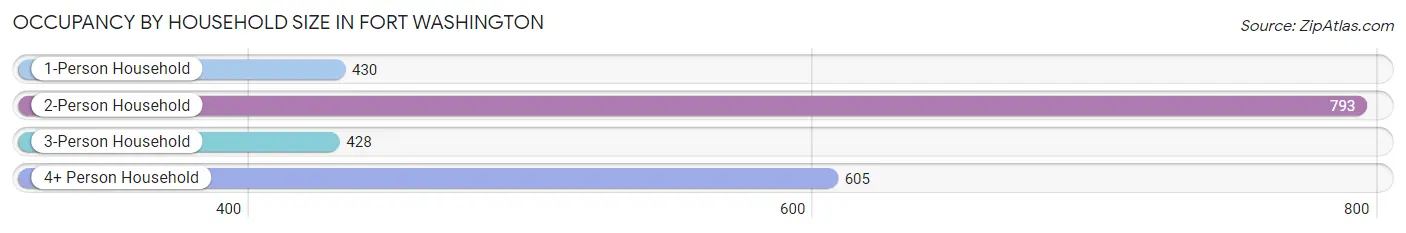
| Household Size | # Housing Units | % Housing Units |
| 1-Person Household | 430 | 19.1% |
| 2-Person Household | 793 | 35.1% |
| 3-Person Household | 428 | 19.0% |
| 4+ Person Household | 605 | 26.8% |
| Total Housing Units | 2,256 | 100.0% |
Occupancy by Ownership by Household Size in Fort Washington
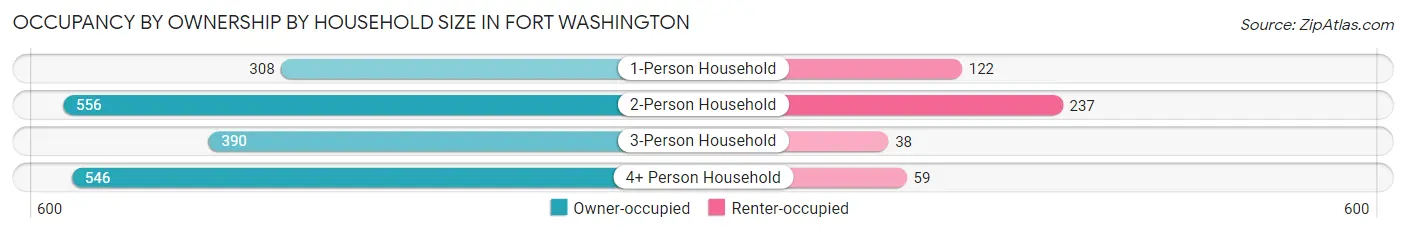
| Household Size | Owner-occupied | Renter-occupied |
| 1-Person Household | 308 (71.6%) | 122 (28.4%) |
| 2-Person Household | 556 (70.1%) | 237 (29.9%) |
| 3-Person Household | 390 (91.1%) | 38 (8.9%) |
| 4+ Person Household | 546 (90.2%) | 59 (9.8%) |
| Total Housing Units | 1,800 (79.8%) | 456 (20.2%) |
Occupancy by Educational Attainment in Fort Washington
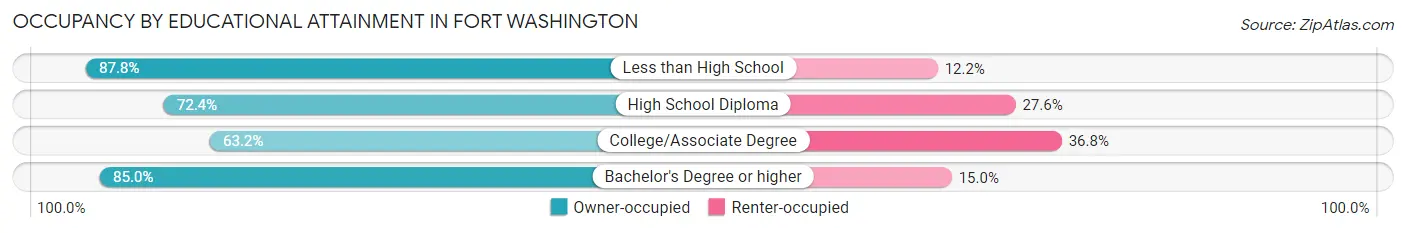
| Household Size | Owner-occupied | Renter-occupied |
| Less than High School | 72 (87.8%) | 10 (12.2%) |
| High School Diploma | 207 (72.4%) | 79 (27.6%) |
| College/Associate Degree | 244 (63.2%) | 142 (36.8%) |
| Bachelor's Degree or higher | 1,277 (85.0%) | 225 (15.0%) |
Occupancy by Age of Householder in Fort Washington
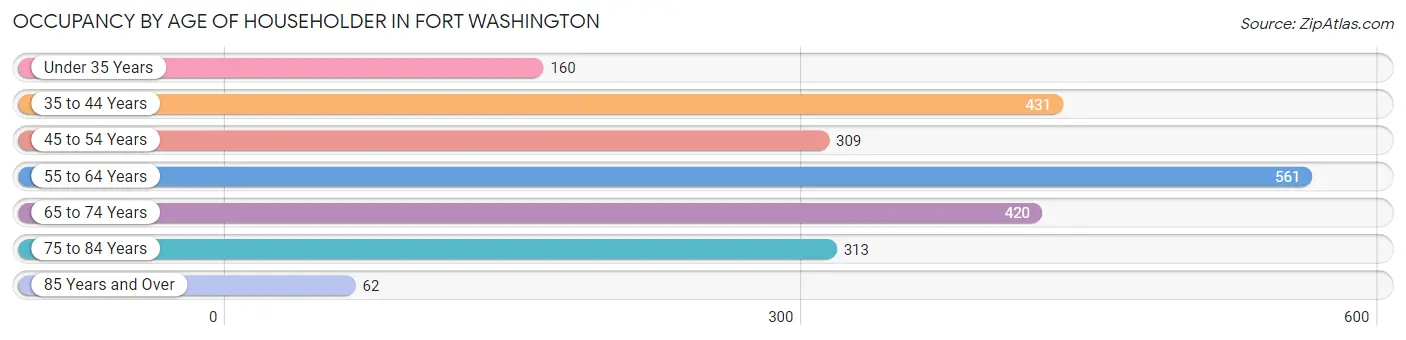
| Age Bracket | # Households | % Households |
| Under 35 Years | 160 | 7.1% |
| 35 to 44 Years | 431 | 19.1% |
| 45 to 54 Years | 309 | 13.7% |
| 55 to 64 Years | 561 | 24.9% |
| 65 to 74 Years | 420 | 18.6% |
| 75 to 84 Years | 313 | 13.9% |
| 85 Years and Over | 62 | 2.8% |
| Total | 2,256 | 100.0% |
Housing Finances in Fort Washington
Median Income by Occupancy in Fort Washington
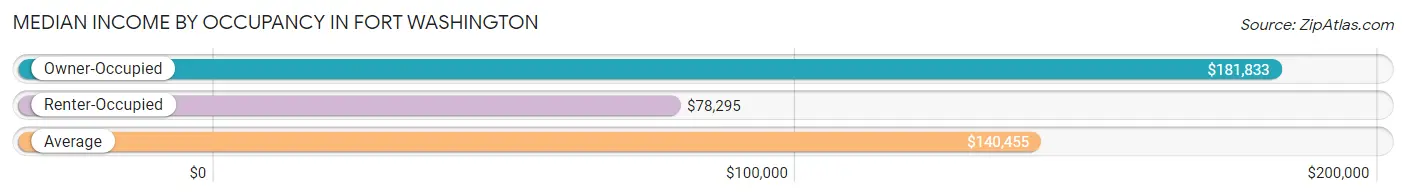
| Occupancy Type | # Households | Median Income |
| Owner-Occupied | 1,800 (79.8%) | $181,833 |
| Renter-Occupied | 456 (20.2%) | $78,295 |
| Average | 2,256 (100.0%) | $140,455 |
Occupancy by Householder Income Bracket in Fort Washington
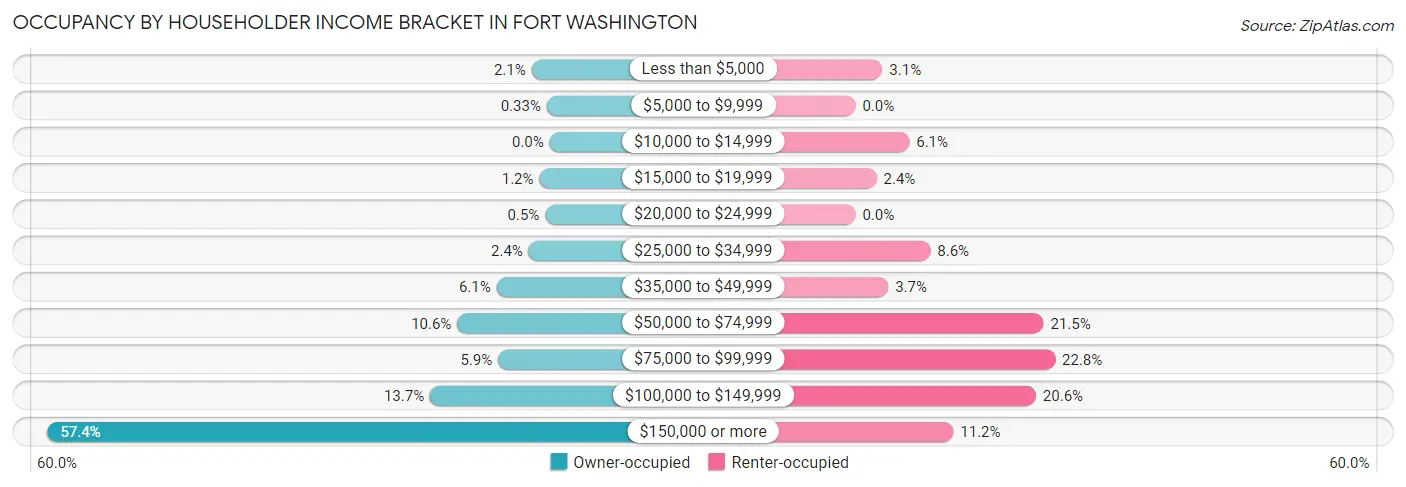
| Income Bracket | Owner-occupied | Renter-occupied |
| Less than $5,000 | 37 (2.1%) | 14 (3.1%) |
| $5,000 to $9,999 | 6 (0.3%) | 0 (0.0%) |
| $10,000 to $14,999 | 0 (0.0%) | 28 (6.1%) |
| $15,000 to $19,999 | 21 (1.2%) | 11 (2.4%) |
| $20,000 to $24,999 | 9 (0.5%) | 0 (0.0%) |
| $25,000 to $34,999 | 43 (2.4%) | 39 (8.6%) |
| $35,000 to $49,999 | 109 (6.1%) | 17 (3.7%) |
| $50,000 to $74,999 | 190 (10.6%) | 98 (21.5%) |
| $75,000 to $99,999 | 106 (5.9%) | 104 (22.8%) |
| $100,000 to $149,999 | 246 (13.7%) | 94 (20.6%) |
| $150,000 or more | 1,033 (57.4%) | 51 (11.2%) |
| Total | 1,800 (100.0%) | 456 (100.0%) |
Monthly Housing Cost Tiers in Fort Washington
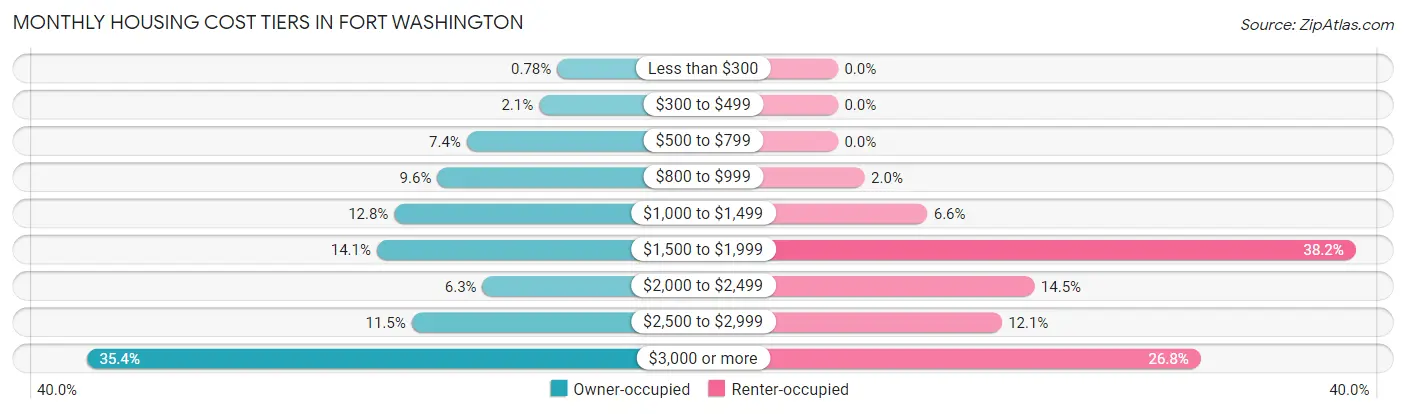
| Monthly Cost | Owner-occupied | Renter-occupied |
| Less than $300 | 14 (0.8%) | 0 (0.0%) |
| $300 to $499 | 38 (2.1%) | 0 (0.0%) |
| $500 to $799 | 134 (7.4%) | 0 (0.0%) |
| $800 to $999 | 173 (9.6%) | 9 (2.0%) |
| $1,000 to $1,499 | 230 (12.8%) | 30 (6.6%) |
| $1,500 to $1,999 | 253 (14.1%) | 174 (38.2%) |
| $2,000 to $2,499 | 113 (6.3%) | 66 (14.5%) |
| $2,500 to $2,999 | 207 (11.5%) | 55 (12.1%) |
| $3,000 or more | 638 (35.4%) | 122 (26.8%) |
| Total | 1,800 (100.0%) | 456 (100.0%) |
Physical Housing Characteristics in Fort Washington
Housing Structures in Fort Washington
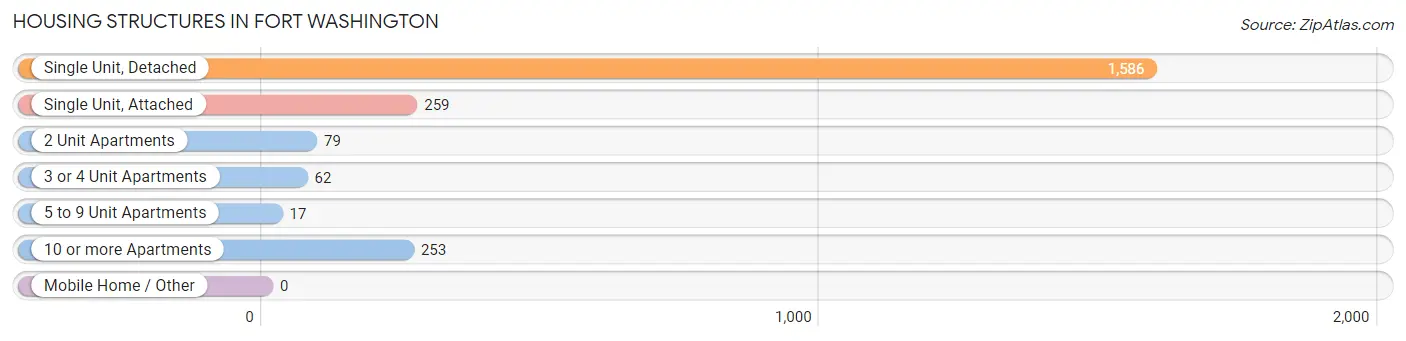
| Structure Type | # Housing Units | % Housing Units |
| Single Unit, Detached | 1,586 | 70.3% |
| Single Unit, Attached | 259 | 11.5% |
| 2 Unit Apartments | 79 | 3.5% |
| 3 or 4 Unit Apartments | 62 | 2.8% |
| 5 to 9 Unit Apartments | 17 | 0.7% |
| 10 or more Apartments | 253 | 11.2% |
| Mobile Home / Other | 0 | 0.0% |
| Total | 2,256 | 100.0% |
Housing Structures by Occupancy in Fort Washington
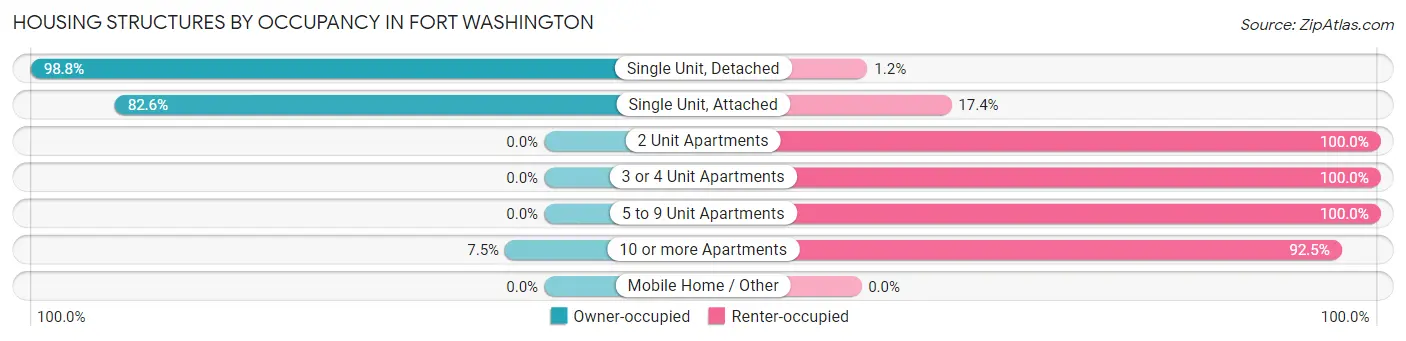
| Structure Type | Owner-occupied | Renter-occupied |
| Single Unit, Detached | 1,567 (98.8%) | 19 (1.2%) |
| Single Unit, Attached | 214 (82.6%) | 45 (17.4%) |
| 2 Unit Apartments | 0 (0.0%) | 79 (100.0%) |
| 3 or 4 Unit Apartments | 0 (0.0%) | 62 (100.0%) |
| 5 to 9 Unit Apartments | 0 (0.0%) | 17 (100.0%) |
| 10 or more Apartments | 19 (7.5%) | 234 (92.5%) |
| Mobile Home / Other | 0 (0.0%) | 0 (0.0%) |
| Total | 1,800 (79.8%) | 456 (20.2%) |
Housing Structures by Number of Rooms in Fort Washington
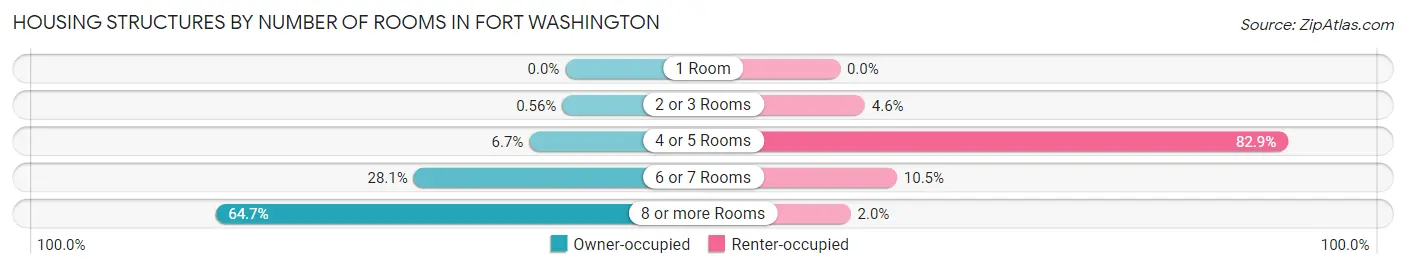
| Number of Rooms | Owner-occupied | Renter-occupied |
| 1 Room | 0 (0.0%) | 0 (0.0%) |
| 2 or 3 Rooms | 10 (0.6%) | 21 (4.6%) |
| 4 or 5 Rooms | 120 (6.7%) | 378 (82.9%) |
| 6 or 7 Rooms | 505 (28.1%) | 48 (10.5%) |
| 8 or more Rooms | 1,165 (64.7%) | 9 (2.0%) |
| Total | 1,800 (100.0%) | 456 (100.0%) |
Housing Structure by Heating Type in Fort Washington
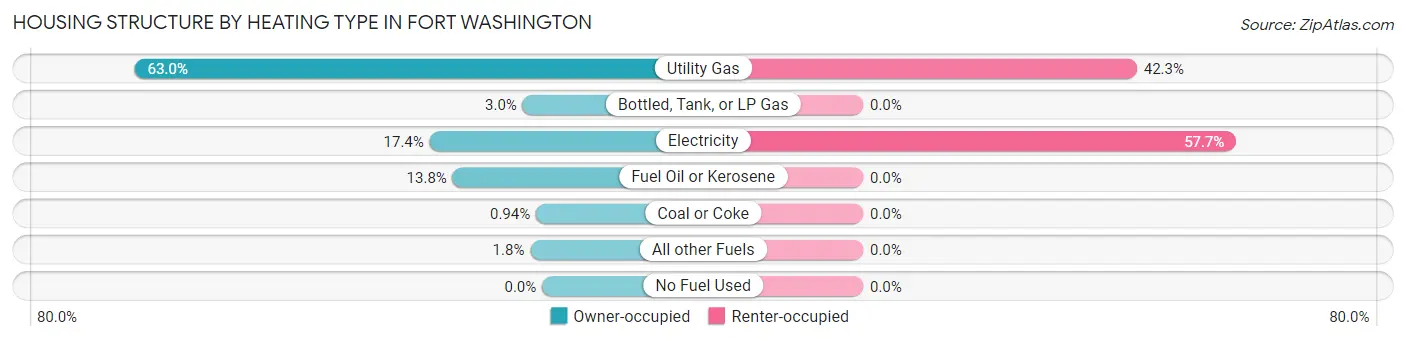
| Heating Type | Owner-occupied | Renter-occupied |
| Utility Gas | 1,134 (63.0%) | 193 (42.3%) |
| Bottled, Tank, or LP Gas | 54 (3.0%) | 0 (0.0%) |
| Electricity | 313 (17.4%) | 263 (57.7%) |
| Fuel Oil or Kerosene | 249 (13.8%) | 0 (0.0%) |
| Coal or Coke | 17 (0.9%) | 0 (0.0%) |
| All other Fuels | 33 (1.8%) | 0 (0.0%) |
| No Fuel Used | 0 (0.0%) | 0 (0.0%) |
| Total | 1,800 (100.0%) | 456 (100.0%) |
Household Vehicle Usage in Fort Washington
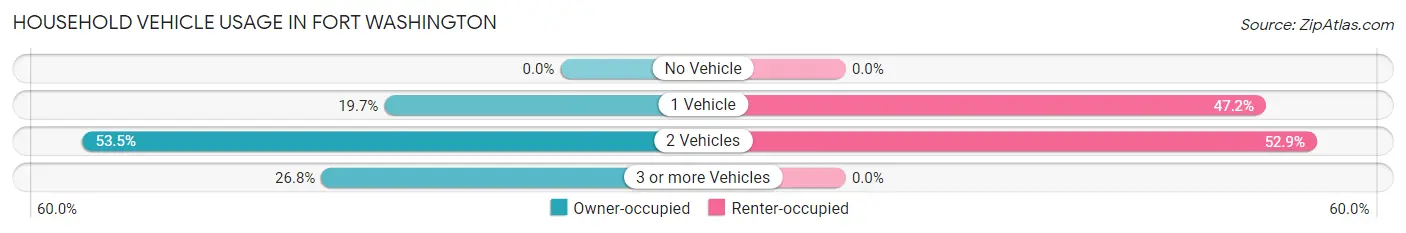
| Vehicles per Household | Owner-occupied | Renter-occupied |
| No Vehicle | 0 (0.0%) | 0 (0.0%) |
| 1 Vehicle | 355 (19.7%) | 215 (47.1%) |
| 2 Vehicles | 963 (53.5%) | 241 (52.8%) |
| 3 or more Vehicles | 482 (26.8%) | 0 (0.0%) |
| Total | 1,800 (100.0%) | 456 (100.0%) |
Real Estate & Mortgages in Fort Washington
Real Estate and Mortgage Overview in Fort Washington
| Characteristic | Without Mortgage | With Mortgage |
| Housing Units | 678 | 1,122 |
| Median Property Value | $470,400 | $562,600 |
| Median Household Income | $137,000 | $702 |
| Monthly Housing Costs | $1,010 | $638 |
| Real Estate Taxes | $7,541 | $0 |
Property Value by Mortgage Status in Fort Washington
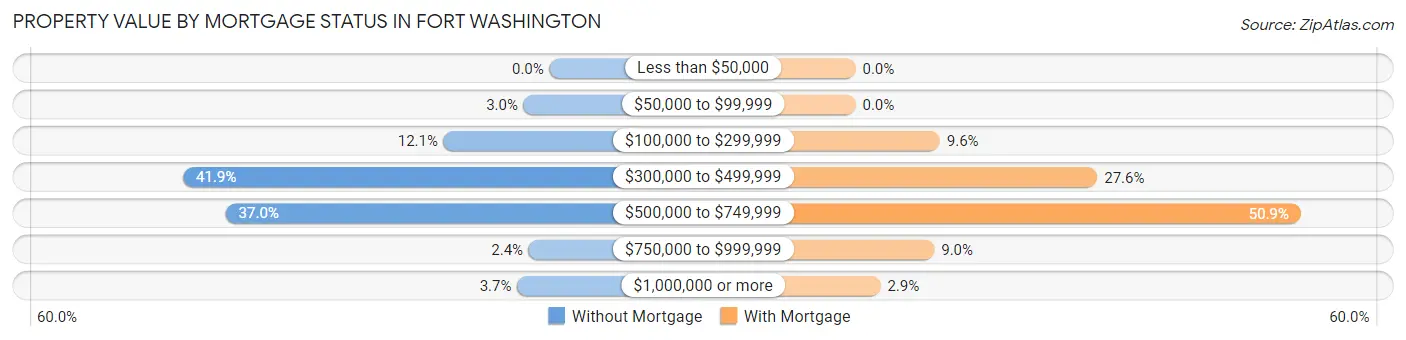
| Property Value | Without Mortgage | With Mortgage |
| Less than $50,000 | 0 (0.0%) | 0 (0.0%) |
| $50,000 to $99,999 | 20 (2.9%) | 0 (0.0%) |
| $100,000 to $299,999 | 82 (12.1%) | 108 (9.6%) |
| $300,000 to $499,999 | 284 (41.9%) | 310 (27.6%) |
| $500,000 to $749,999 | 251 (37.0%) | 571 (50.9%) |
| $750,000 to $999,999 | 16 (2.4%) | 101 (9.0%) |
| $1,000,000 or more | 25 (3.7%) | 32 (2.9%) |
| Total | 678 (100.0%) | 1,122 (100.0%) |
Household Income by Mortgage Status in Fort Washington
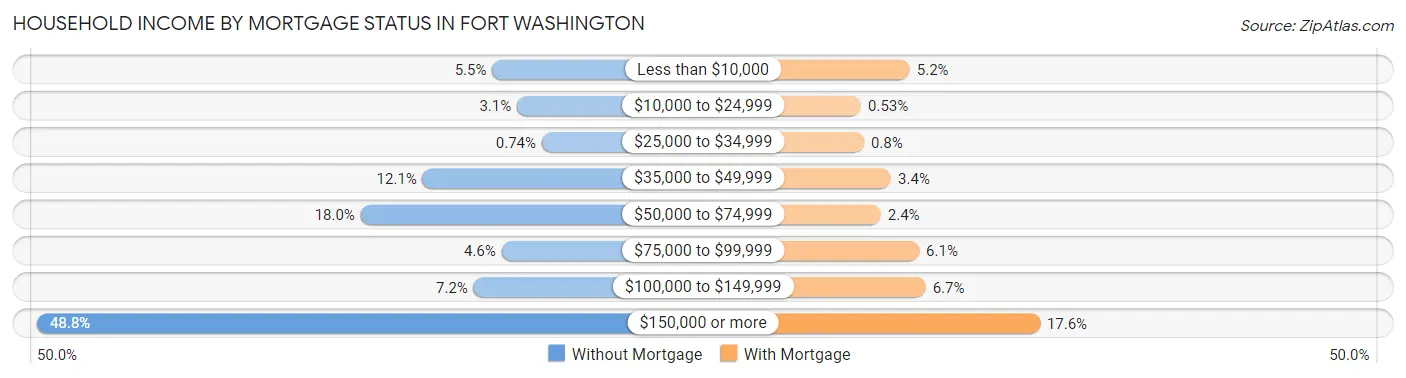
| Household Income | Without Mortgage | With Mortgage |
| Less than $10,000 | 37 (5.5%) | 58 (5.2%) |
| $10,000 to $24,999 | 21 (3.1%) | 6 (0.5%) |
| $25,000 to $34,999 | 5 (0.7%) | 9 (0.8%) |
| $35,000 to $49,999 | 82 (12.1%) | 38 (3.4%) |
| $50,000 to $74,999 | 122 (18.0%) | 27 (2.4%) |
| $75,000 to $99,999 | 31 (4.6%) | 68 (6.1%) |
| $100,000 to $149,999 | 49 (7.2%) | 75 (6.7%) |
| $150,000 or more | 331 (48.8%) | 197 (17.6%) |
| Total | 678 (100.0%) | 1,122 (100.0%) |
Property Value to Household Income Ratio in Fort Washington
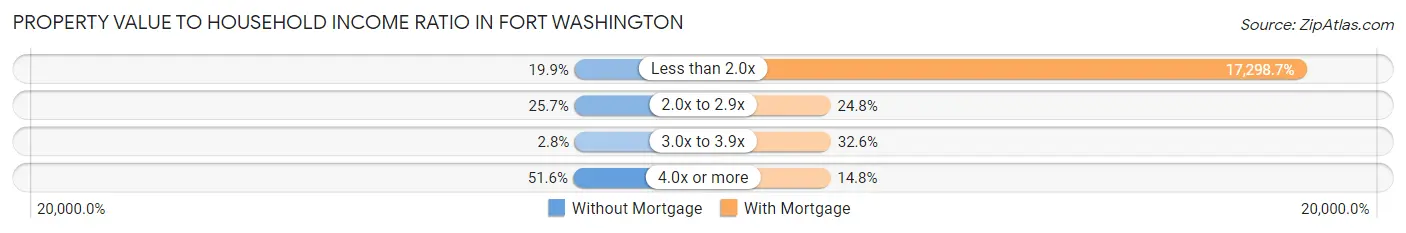
| Value-to-Income Ratio | Without Mortgage | With Mortgage |
| Less than 2.0x | 135 (19.9%) | 194,091 (17,298.7%) |
| 2.0x to 2.9x | 174 (25.7%) | 278 (24.8%) |
| 3.0x to 3.9x | 19 (2.8%) | 366 (32.6%) |
| 4.0x or more | 350 (51.6%) | 166 (14.8%) |
| Total | 678 (100.0%) | 1,122 (100.0%) |
Real Estate Taxes by Mortgage Status in Fort Washington
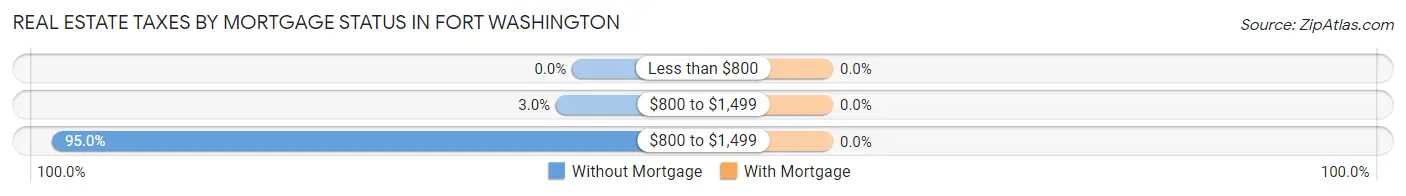
| Property Taxes | Without Mortgage | With Mortgage |
| Less than $800 | 0 (0.0%) | 0 (0.0%) |
| $800 to $1,499 | 20 (2.9%) | 0 (0.0%) |
| $800 to $1,499 | 644 (95.0%) | 0 (0.0%) |
| Total | 678 (100.0%) | 1,122 (100.0%) |
Health & Disability in Fort Washington
Health Insurance Coverage by Age in Fort Washington
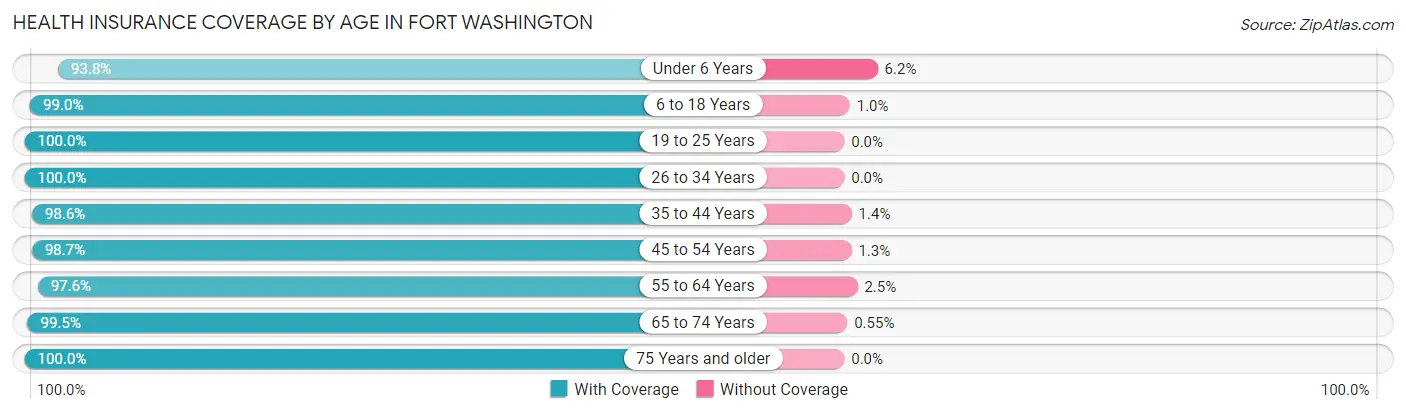
| Age Bracket | With Coverage | Without Coverage |
| Under 6 Years | 392 (93.8%) | 26 (6.2%) |
| 6 to 18 Years | 1,064 (99.0%) | 11 (1.0%) |
| 19 to 25 Years | 348 (100.0%) | 0 (0.0%) |
| 26 to 34 Years | 525 (100.0%) | 0 (0.0%) |
| 35 to 44 Years | 864 (98.6%) | 12 (1.4%) |
| 45 to 54 Years | 588 (98.7%) | 8 (1.3%) |
| 55 to 64 Years | 994 (97.6%) | 25 (2.5%) |
| 65 to 74 Years | 717 (99.5%) | 4 (0.5%) |
| 75 Years and older | 649 (100.0%) | 0 (0.0%) |
| Total | 6,141 (98.6%) | 86 (1.4%) |
Health Insurance Coverage by Citizenship Status in Fort Washington
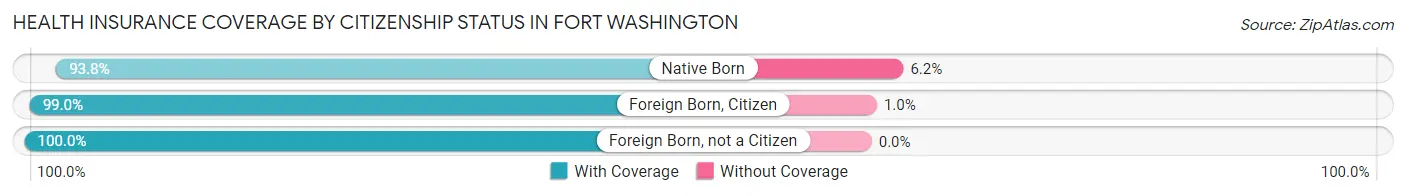
| Citizenship Status | With Coverage | Without Coverage |
| Native Born | 392 (93.8%) | 26 (6.2%) |
| Foreign Born, Citizen | 1,064 (99.0%) | 11 (1.0%) |
| Foreign Born, not a Citizen | 348 (100.0%) | 0 (0.0%) |
Health Insurance Coverage by Household Income in Fort Washington
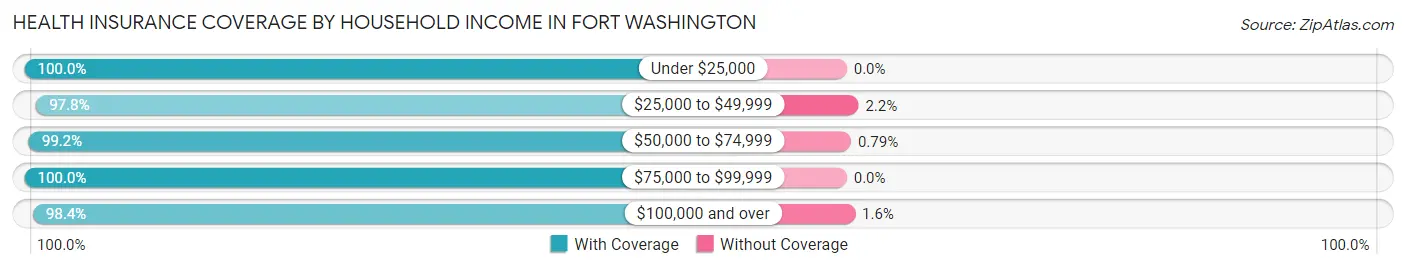
| Household Income | With Coverage | Without Coverage |
| Under $25,000 | 154 (100.0%) | 0 (0.0%) |
| $25,000 to $49,999 | 357 (97.8%) | 8 (2.2%) |
| $50,000 to $74,999 | 501 (99.2%) | 4 (0.8%) |
| $75,000 to $99,999 | 472 (100.0%) | 0 (0.0%) |
| $100,000 and over | 4,656 (98.4%) | 74 (1.6%) |
Public vs Private Health Insurance Coverage by Age in Fort Washington
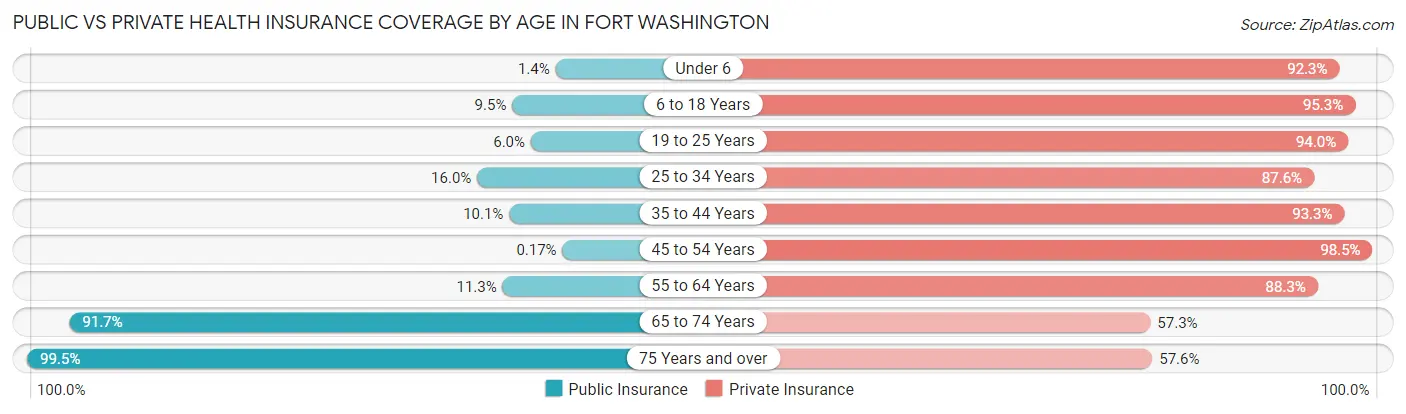
| Age Bracket | Public Insurance | Private Insurance |
| Under 6 | 6 (1.4%) | 386 (92.3%) |
| 6 to 18 Years | 102 (9.5%) | 1,024 (95.3%) |
| 19 to 25 Years | 21 (6.0%) | 327 (94.0%) |
| 25 to 34 Years | 84 (16.0%) | 460 (87.6%) |
| 35 to 44 Years | 88 (10.1%) | 817 (93.3%) |
| 45 to 54 Years | 1 (0.2%) | 587 (98.5%) |
| 55 to 64 Years | 115 (11.3%) | 900 (88.3%) |
| 65 to 74 Years | 661 (91.7%) | 413 (57.3%) |
| 75 Years and over | 646 (99.5%) | 374 (57.6%) |
| Total | 1,724 (27.7%) | 5,288 (84.9%) |
Disability Status by Sex by Age in Fort Washington
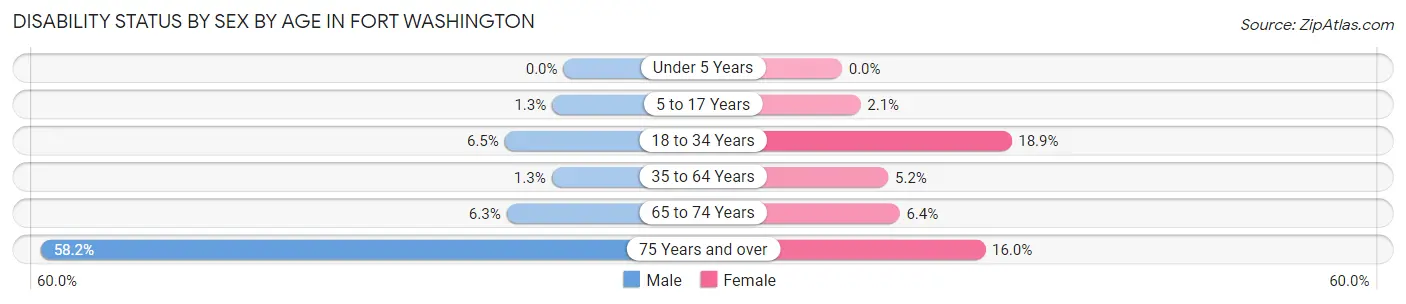
| Age Bracket | Male | Female |
| Under 5 Years | 0 (0.0%) | 0 (0.0%) |
| 5 to 17 Years | 6 (1.3%) | 12 (2.1%) |
| 18 to 34 Years | 35 (6.5%) | 81 (18.9%) |
| 35 to 64 Years | 16 (1.3%) | 66 (5.2%) |
| 65 to 74 Years | 20 (6.3%) | 26 (6.4%) |
| 75 Years and over | 188 (58.2%) | 52 (16.0%) |
Disability Class by Sex by Age in Fort Washington
Disability Class: Hearing Difficulty
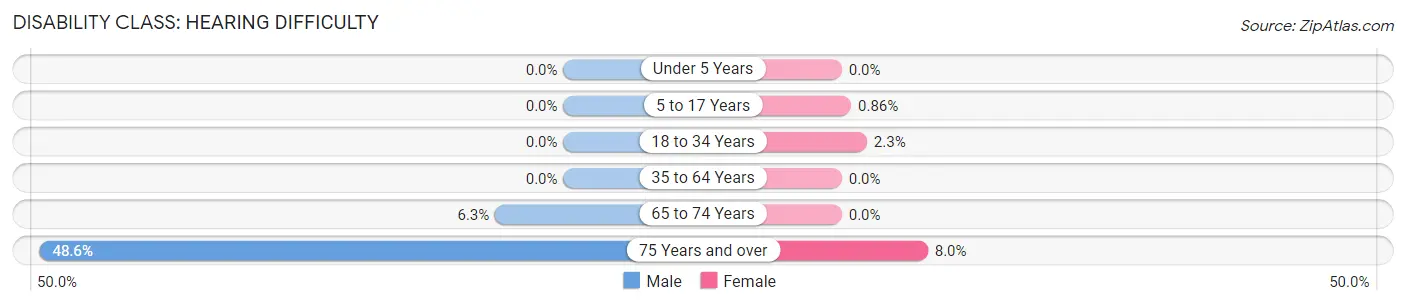
| Age Bracket | Male | Female |
| Under 5 Years | 0 (0.0%) | 0 (0.0%) |
| 5 to 17 Years | 0 (0.0%) | 5 (0.9%) |
| 18 to 34 Years | 0 (0.0%) | 10 (2.3%) |
| 35 to 64 Years | 0 (0.0%) | 0 (0.0%) |
| 65 to 74 Years | 20 (6.3%) | 0 (0.0%) |
| 75 Years and over | 157 (48.6%) | 26 (8.0%) |
Disability Class: Vision Difficulty
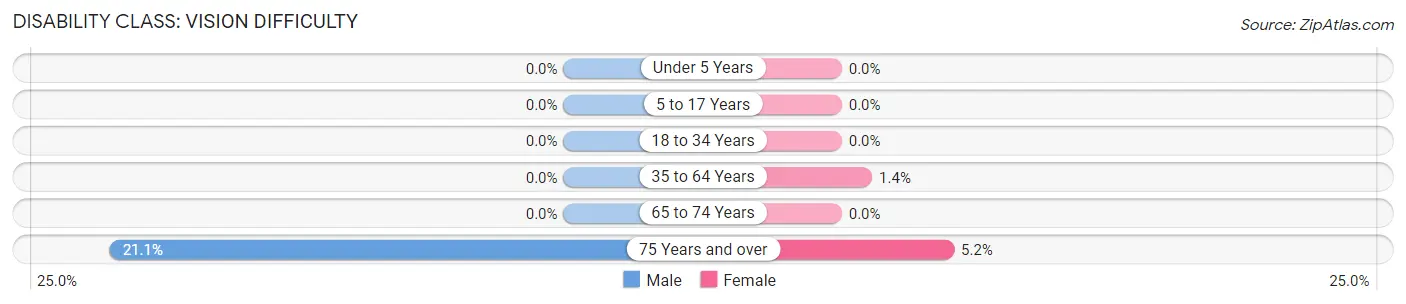
| Age Bracket | Male | Female |
| Under 5 Years | 0 (0.0%) | 0 (0.0%) |
| 5 to 17 Years | 0 (0.0%) | 0 (0.0%) |
| 18 to 34 Years | 0 (0.0%) | 0 (0.0%) |
| 35 to 64 Years | 0 (0.0%) | 18 (1.4%) |
| 65 to 74 Years | 0 (0.0%) | 0 (0.0%) |
| 75 Years and over | 68 (21.0%) | 17 (5.2%) |
Disability Class: Cognitive Difficulty
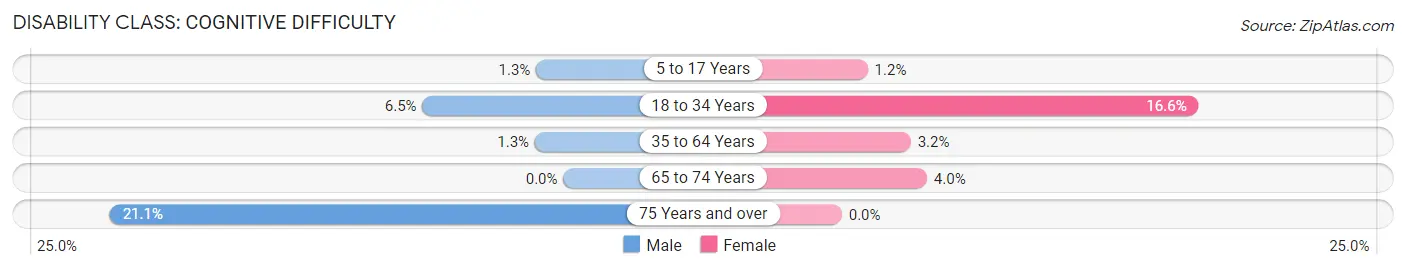
| Age Bracket | Male | Female |
| 5 to 17 Years | 6 (1.3%) | 7 (1.2%) |
| 18 to 34 Years | 35 (6.5%) | 71 (16.6%) |
| 35 to 64 Years | 16 (1.3%) | 41 (3.2%) |
| 65 to 74 Years | 0 (0.0%) | 16 (4.0%) |
| 75 Years and over | 68 (21.0%) | 0 (0.0%) |
Disability Class: Ambulatory Difficulty
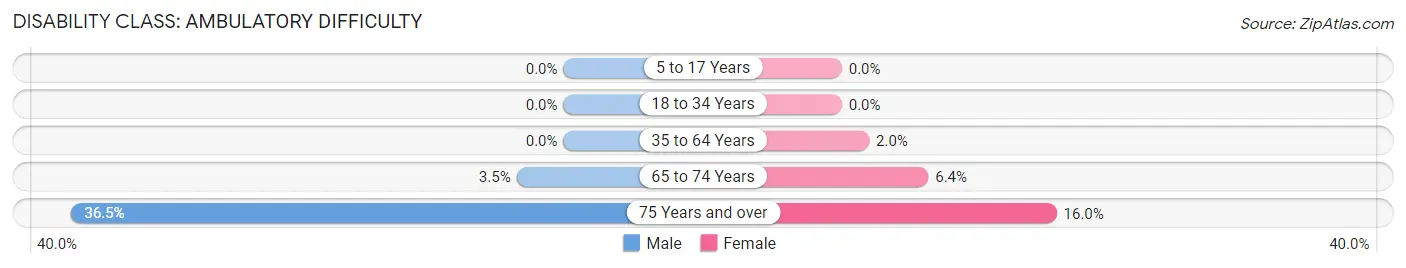
| Age Bracket | Male | Female |
| 5 to 17 Years | 0 (0.0%) | 0 (0.0%) |
| 18 to 34 Years | 0 (0.0%) | 0 (0.0%) |
| 35 to 64 Years | 0 (0.0%) | 26 (2.0%) |
| 65 to 74 Years | 11 (3.5%) | 26 (6.4%) |
| 75 Years and over | 118 (36.5%) | 52 (16.0%) |
Disability Class: Self-Care Difficulty
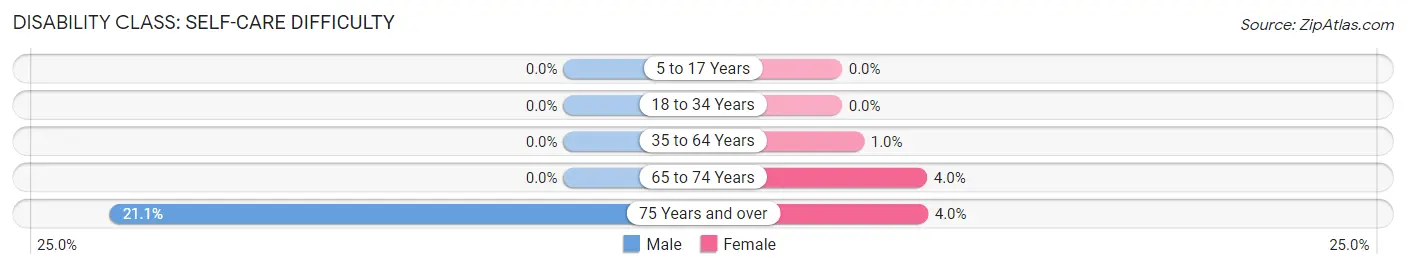
| Age Bracket | Male | Female |
| 5 to 17 Years | 0 (0.0%) | 0 (0.0%) |
| 18 to 34 Years | 0 (0.0%) | 0 (0.0%) |
| 35 to 64 Years | 0 (0.0%) | 13 (1.0%) |
| 65 to 74 Years | 0 (0.0%) | 16 (4.0%) |
| 75 Years and over | 68 (21.0%) | 13 (4.0%) |
Technology Access in Fort Washington
Computing Device Access in Fort Washington
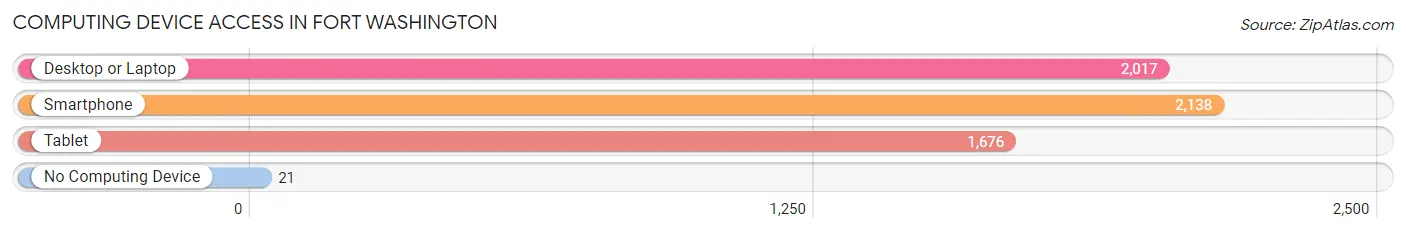
| Device Type | # Households | % Households |
| Desktop or Laptop | 2,017 | 89.4% |
| Smartphone | 2,138 | 94.8% |
| Tablet | 1,676 | 74.3% |
| No Computing Device | 21 | 0.9% |
| Total | 2,256 | 100.0% |
Internet Access in Fort Washington
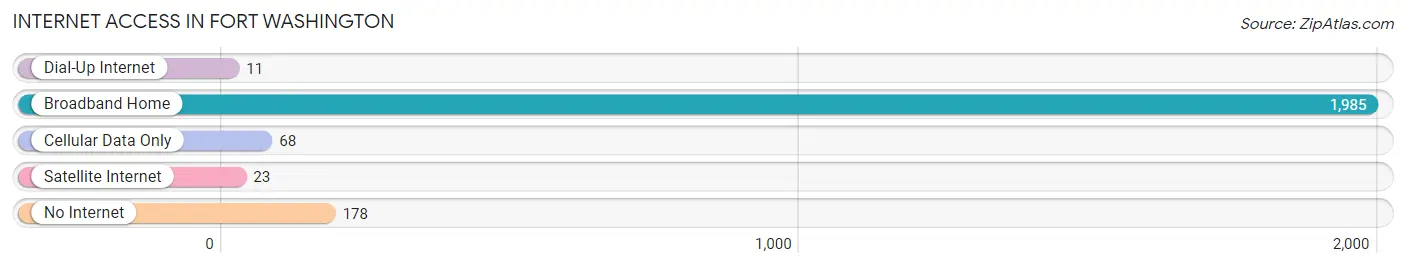
| Internet Type | # Households | % Households |
| Dial-Up Internet | 11 | 0.5% |
| Broadband Home | 1,985 | 88.0% |
| Cellular Data Only | 68 | 3.0% |
| Satellite Internet | 23 | 1.0% |
| No Internet | 178 | 7.9% |
| Total | 2,256 | 100.0% |
Fort Washington Summary
Founded in 1697, Fort Washington is a small community located in Montgomery County, Pennsylvania. It is situated approximately 20 miles northwest of Philadelphia and is part of the Philadelphia metropolitan area. The community is home to a population of approximately 5,500 people and is known for its rich history and beautiful scenery.
History
Fort Washington was originally part of the land grant given to William Penn by King Charles II of England in 1681. The area was first settled in 1697 by a group of Quakers led by William Levering. The settlement was named after the nearby fort, which was built in 1777 during the Revolutionary War. The fort was used to protect the area from British forces and was eventually abandoned in 1778.
In 1854, the area was incorporated as a borough and was named Fort Washington. The community grew steadily over the next few decades and by the early 1900s, it had become a popular summer resort destination. The area was known for its beautiful scenery and was home to several resorts, including the Fort Washington Inn and the Fort Washington Hotel.
Geography
Fort Washington is located in southeastern Pennsylvania, approximately 20 miles northwest of Philadelphia. It is situated in Montgomery County and is part of the Philadelphia metropolitan area. The community is bordered by Upper Dublin Township to the north, Whitemarsh Township to the east, Upper Merion Township to the south, and Horsham Township to the west.
The area is characterized by rolling hills and valleys, with the highest point being the summit of Fort Hill, which is located in the northern part of the borough. The area is also home to several creeks, including the Wissahickon Creek, which flows through the borough.
Economy
Fort Washington is home to a diverse economy, with a variety of businesses and industries located in the area. The largest employers in the borough are the Fort Washington Medical Center, the Montgomery County government, and the Upper Dublin School District. Other major employers include the Fort Washington Office Park, the Fort Washington Business Park, and the Fort Washington Executive Park.
The borough is also home to several retail establishments, including the Fort Washington Shopping Center, the Fort Washington Plaza, and the Fort Washington Town Center. In addition, the area is home to several restaurants, bars, and other entertainment venues.
Demographics
As of the 2010 census, the population of Fort Washington was 5,521. The racial makeup of the borough was 87.3% White, 5.3% African American, 0.3% Native American, 4.2% Asian, and 2.9% from other races. The median household income was $76,945, and the median family income was $90,917.
The population of Fort Washington is well-educated, with 92.3% of the population over the age of 25 having a high school diploma or higher. In addition, 33.3% of the population has a bachelor’s degree or higher. The median age of the population is 43.7 years.
Conclusion
Fort Washington is a small community located in Montgomery County, Pennsylvania. It is situated approximately 20 miles northwest of Philadelphia and is part of the Philadelphia metropolitan area. The community is home to a population of approximately 5,500 people and is known for its rich history and beautiful scenery. The area is home to a diverse economy, with a variety of businesses and industries located in the area. The population of Fort Washington is well-educated, with 92.3% of the population over the age of 25 having a high school diploma or higher. In addition, 33.3% of the population has a bachelor’s degree or higher. The median age of the population is 43.7 years.
Common Questions
What is Per Capita Income in Fort Washington?
Per Capita income in Fort Washington is $68,369.
What is the Median Family Income in Fort Washington?
Median Family Income in Fort Washington is $181,333.
What is the Median Household income in Fort Washington?
Median Household Income in Fort Washington is $140,455.
What is Income or Wage Gap in Fort Washington?
Income or Wage Gap in Fort Washington is 44.1%.
Women in Fort Washington earn 55.9 cents for every dollar earned by a man.
What is Inequality or Gini Index in Fort Washington?
Inequality or Gini Index in Fort Washington is 0.46.
What is the Total Population of Fort Washington?
Total Population of Fort Washington is 6,312.
What is the Total Male Population of Fort Washington?
Total Male Population of Fort Washington is 3,080.
What is the Total Female Population of Fort Washington?
Total Female Population of Fort Washington is 3,232.
What is the Ratio of Males per 100 Females in Fort Washington?
There are 95.30 Males per 100 Females in Fort Washington.
What is the Ratio of Females per 100 Males in Fort Washington?
There are 104.94 Females per 100 Males in Fort Washington.
What is the Median Population Age in Fort Washington?
Median Population Age in Fort Washington is 43.4 Years.
What is the Average Family Size in Fort Washington
Average Family Size in Fort Washington is 3.2 People.
What is the Average Household Size in Fort Washington
Average Household Size in Fort Washington is 2.8 People.
How Large is the Labor Force in Fort Washington?
There are 3,411 People in the Labor Forcein in Fort Washington.
What is the Percentage of People in the Labor Force in Fort Washington?
67.6% of People are in the Labor Force in Fort Washington.
What is the Unemployment Rate in Fort Washington?
Unemployment Rate in Fort Washington is 3.1%.