Murrysville, PA Map & Demographics
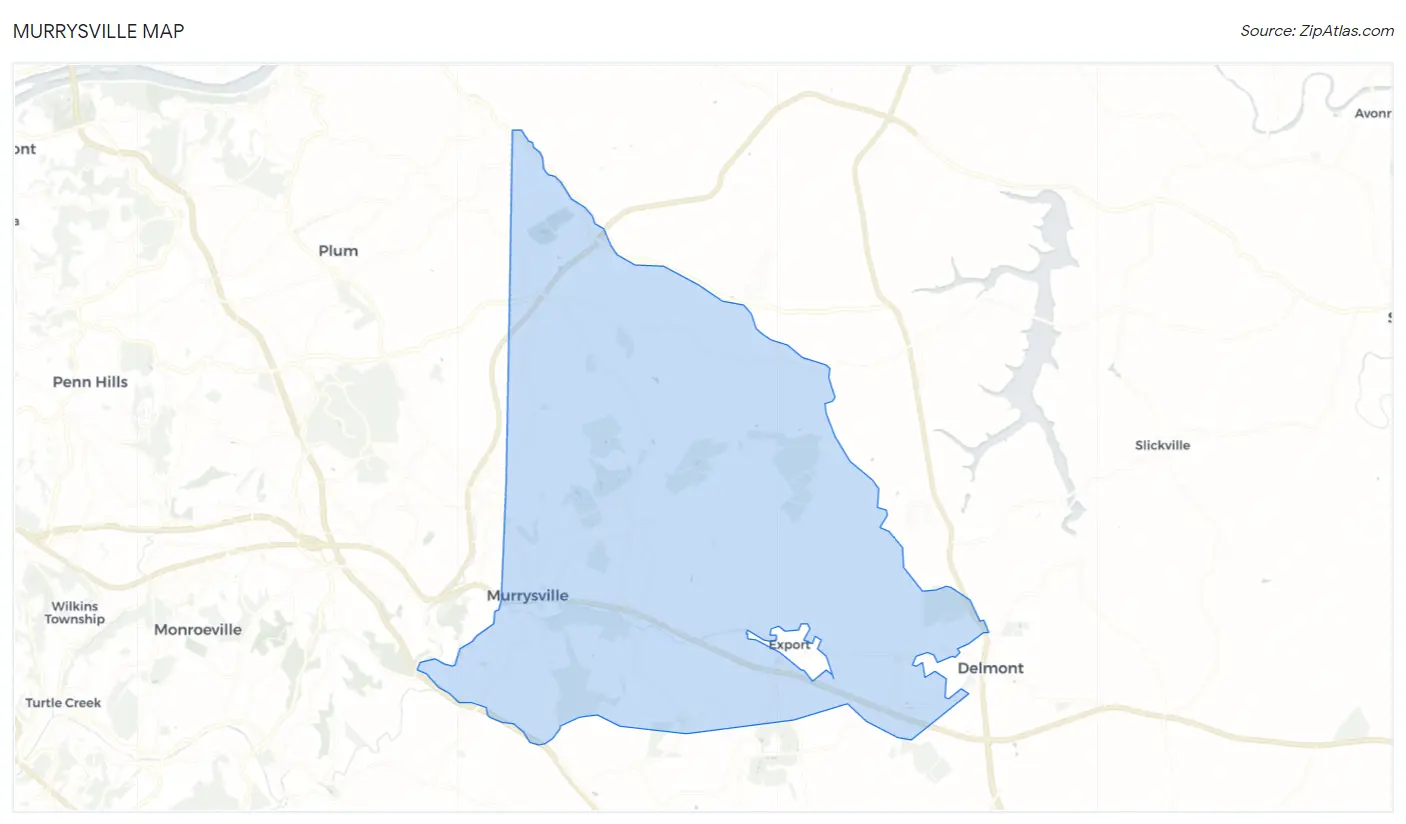
Murrysville Map
Murrysville Overview
$62,242
PER CAPITA INCOME
$144,625
AVG FAMILY INCOME
$117,067
AVG HOUSEHOLD INCOME
50.4%
WAGE / INCOME GAP [ % ]
49.6¢/ $1
WAGE / INCOME GAP [ $ ]
0.44
INEQUALITY / GINI INDEX
20,820
TOTAL POPULATION
10,433
MALE POPULATION
10,387
FEMALE POPULATION
100.44
MALES / 100 FEMALES
99.56
FEMALES / 100 MALES
50.1
MEDIAN AGE
2.9
AVG FAMILY SIZE
2.5
AVG HOUSEHOLD SIZE
10,487
LABOR FORCE [ PEOPLE ]
61.0%
PERCENT IN LABOR FORCE
3.5%
UNEMPLOYMENT RATE
Murrysville Zip Codes
Income in Murrysville
Income Overview in Murrysville
Per Capita Income in Murrysville is $62,242, while median incomes of families and households are $144,625 and $117,067 respectively.
| Characteristic | Number | Measure |
| Per Capita Income | 20,820 | $62,242 |
| Median Family Income | 6,171 | $144,625 |
| Mean Family Income | 6,171 | $178,703 |
| Median Household Income | 8,182 | $117,067 |
| Mean Household Income | 8,182 | $156,922 |
| Income Deficit | 6,171 | $0 |
| Wage / Income Gap (%) | 20,820 | 50.43% |
| Wage / Income Gap ($) | 20,820 | 49.57¢ per $1 |
| Gini / Inequality Index | 20,820 | 0.44 |
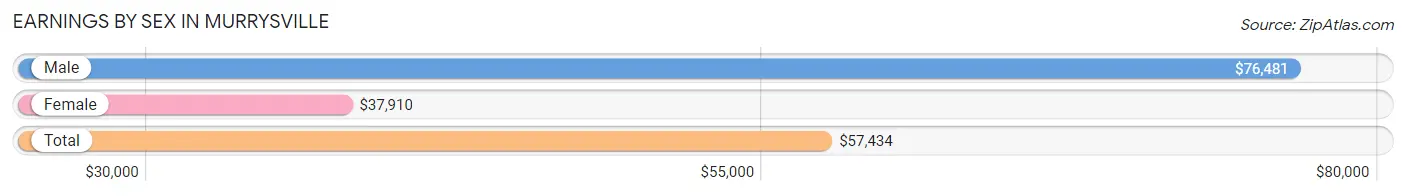
Earnings by Sex in Murrysville
Average Earnings in Murrysville are $57,434, $76,481 for men and $37,910 for women, a difference of 50.4%.
| Sex | Number | Average Earnings |
| Male | 5,908 (52.8%) | $76,481 |
| Female | 5,289 (47.2%) | $37,910 |
| Total | 11,197 (100.0%) | $57,434 |
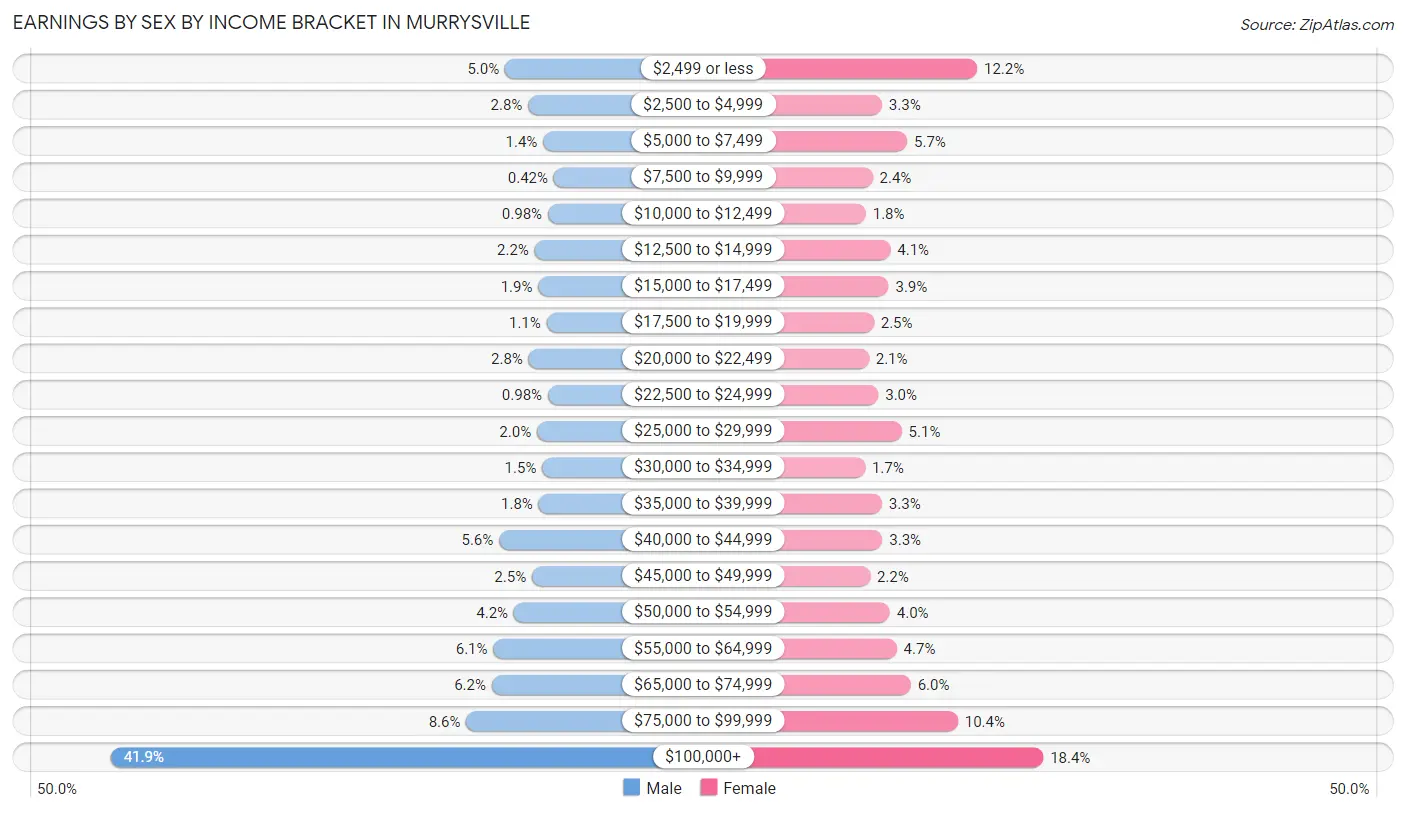
Earnings by Sex by Income Bracket in Murrysville
The most common earnings brackets in Murrysville are $100,000+ for men (2,477 | 41.9%) and $100,000+ for women (973 | 18.4%).
| Income | Male | Female |
| $2,499 or less | 295 (5.0%) | 645 (12.2%) |
| $2,500 to $4,999 | 167 (2.8%) | 174 (3.3%) |
| $5,000 to $7,499 | 84 (1.4%) | 299 (5.7%) |
| $7,500 to $9,999 | 25 (0.4%) | 128 (2.4%) |
| $10,000 to $12,499 | 58 (1.0%) | 94 (1.8%) |
| $12,500 to $14,999 | 131 (2.2%) | 216 (4.1%) |
| $15,000 to $17,499 | 111 (1.9%) | 207 (3.9%) |
| $17,500 to $19,999 | 65 (1.1%) | 134 (2.5%) |
| $20,000 to $22,499 | 164 (2.8%) | 109 (2.1%) |
| $22,500 to $24,999 | 58 (1.0%) | 156 (2.9%) |
| $25,000 to $29,999 | 118 (2.0%) | 272 (5.1%) |
| $30,000 to $34,999 | 89 (1.5%) | 90 (1.7%) |
| $35,000 to $39,999 | 109 (1.8%) | 174 (3.3%) |
| $40,000 to $44,999 | 328 (5.6%) | 176 (3.3%) |
| $45,000 to $49,999 | 146 (2.5%) | 115 (2.2%) |
| $50,000 to $54,999 | 246 (4.2%) | 213 (4.0%) |
| $55,000 to $64,999 | 360 (6.1%) | 247 (4.7%) |
| $65,000 to $74,999 | 368 (6.2%) | 317 (6.0%) |
| $75,000 to $99,999 | 509 (8.6%) | 550 (10.4%) |
| $100,000+ | 2,477 (41.9%) | 973 (18.4%) |
| Total | 5,908 (100.0%) | 5,289 (100.0%) |
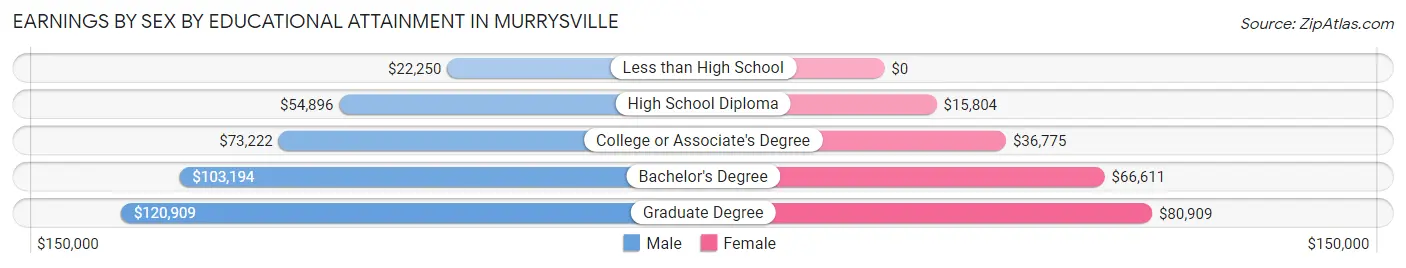
Earnings by Sex by Educational Attainment in Murrysville
Average earnings in Murrysville are $83,947 for men and $50,260 for women, a difference of 40.1%. Men with an educational attainment of graduate degree enjoy the highest average annual earnings of $120,909, while those with less than high school education earn the least with $22,250. Women with an educational attainment of graduate degree earn the most with the average annual earnings of $80,909, while those with high school diploma education have the smallest earnings of $15,804.
| Educational Attainment | Male Income | Female Income |
| Less than High School | $22,250 | $0 |
| High School Diploma | $54,896 | $15,804 |
| College or Associate's Degree | $73,222 | $36,775 |
| Bachelor's Degree | $103,194 | $66,611 |
| Graduate Degree | $120,909 | $80,909 |
| Total | $83,947 | $50,260 |
Family Income in Murrysville
Family Income Brackets in Murrysville
According to the Murrysville family income data, there are 2,024 families falling into the $200,000+ income range, which is the most common income bracket and makes up 32.8% of all families. Conversely, the $10,000 to $14,999 income bracket is the least frequent group with only 12 families (0.2%) belonging to this category.
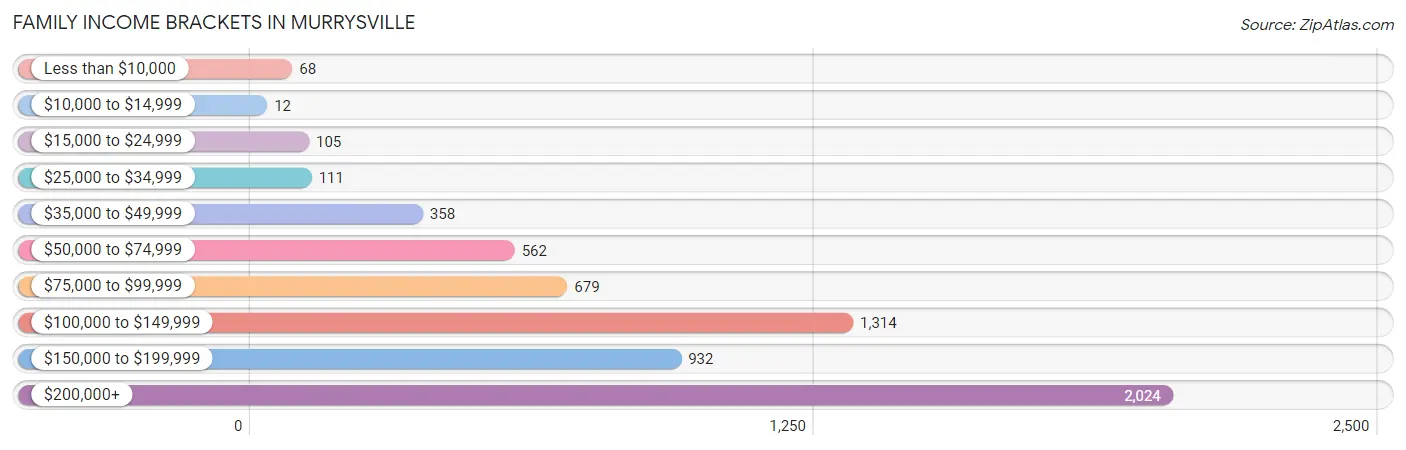
| Income Bracket | # Families | % Families |
| Less than $10,000 | 68 | 1.1% |
| $10,000 to $14,999 | 12 | 0.2% |
| $15,000 to $24,999 | 105 | 1.7% |
| $25,000 to $34,999 | 111 | 1.8% |
| $35,000 to $49,999 | 358 | 5.8% |
| $50,000 to $74,999 | 562 | 9.1% |
| $75,000 to $99,999 | 679 | 11.0% |
| $100,000 to $149,999 | 1,314 | 21.3% |
| $150,000 to $199,999 | 932 | 15.1% |
| $200,000+ | 2,024 | 32.8% |
Family Income by Famaliy Size in Murrysville
6-person families (171 | 2.8%) account for the highest median family income in Murrysville with $250,001 per family, while 3-person families (1,062 | 17.2%) have the highest median income of $58,548 per family member.
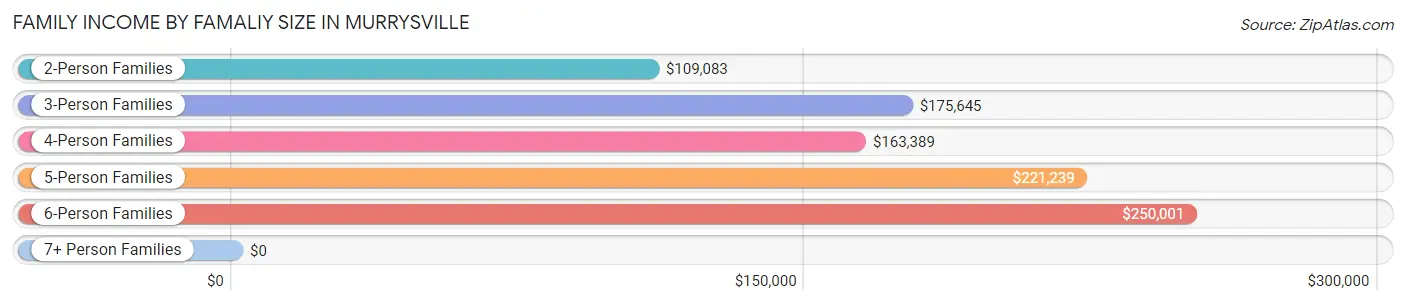
| Income Bracket | # Families | Median Income |
| 2-Person Families | 3,296 (53.4%) | $109,083 |
| 3-Person Families | 1,062 (17.2%) | $175,645 |
| 4-Person Families | 1,014 (16.4%) | $163,389 |
| 5-Person Families | 623 (10.1%) | $221,239 |
| 6-Person Families | 171 (2.8%) | $250,001 |
| 7+ Person Families | 5 (0.1%) | $0 |
| Total | 6,171 (100.0%) | $144,625 |
Family Income by Number of Earners in Murrysville
The median family income in Murrysville is $144,625, with families comprising 3+ earners (919) having the highest median family income of $223,656, while families with no earners (930) have the lowest median family income of $87,344, accounting for 14.9% and 15.1% of families, respectively.
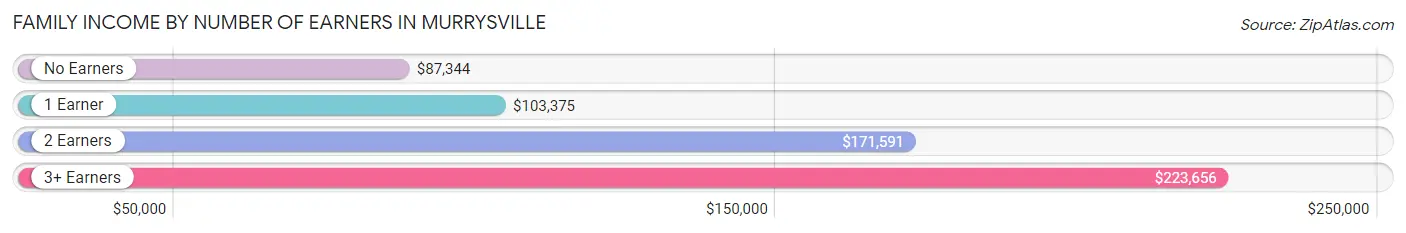
| Number of Earners | # Families | Median Income |
| No Earners | 930 (15.1%) | $87,344 |
| 1 Earner | 1,906 (30.9%) | $103,375 |
| 2 Earners | 2,416 (39.2%) | $171,591 |
| 3+ Earners | 919 (14.9%) | $223,656 |
| Total | 6,171 (100.0%) | $144,625 |
Household Income in Murrysville
Household Income Brackets in Murrysville
With 2,176 households falling in the category, the $200,000+ income range is the most frequent in Murrysville, accounting for 26.6% of all households. In contrast, only 49 households (0.6%) fall into the $10,000 to $14,999 income bracket, making it the least populous group.
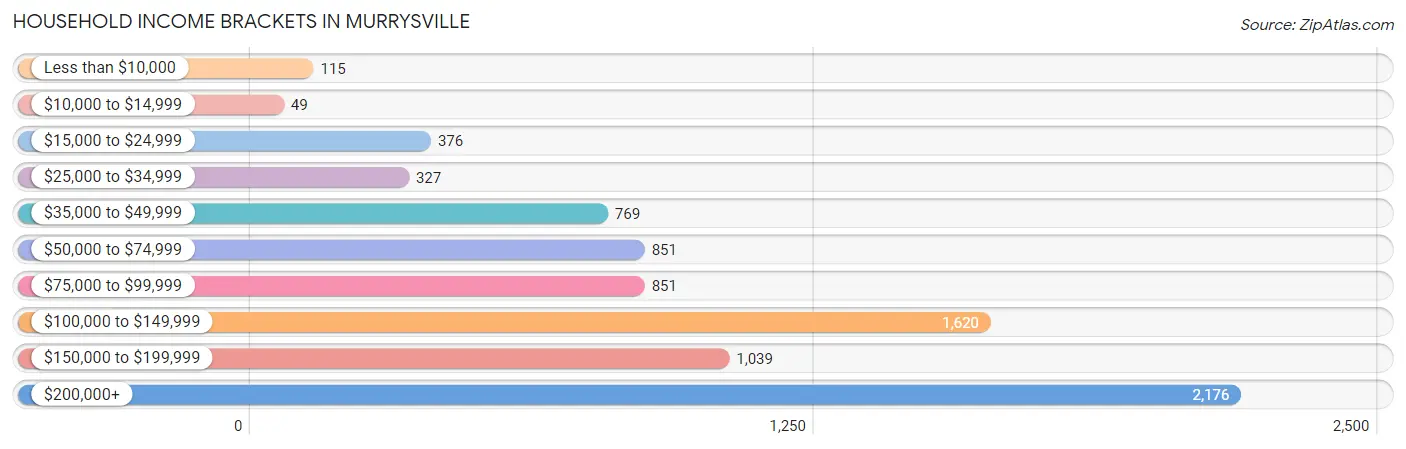
| Income Bracket | # Households | % Households |
| Less than $10,000 | 115 | 1.4% |
| $10,000 to $14,999 | 49 | 0.6% |
| $15,000 to $24,999 | 376 | 4.6% |
| $25,000 to $34,999 | 327 | 4.0% |
| $35,000 to $49,999 | 769 | 9.4% |
| $50,000 to $74,999 | 851 | 10.4% |
| $75,000 to $99,999 | 851 | 10.4% |
| $100,000 to $149,999 | 1,620 | 19.8% |
| $150,000 to $199,999 | 1,039 | 12.7% |
| $200,000+ | 2,176 | 26.6% |
Household Income by Householder Age in Murrysville
The median household income in Murrysville is $117,067, with the highest median household income of $157,167 found in the 45 to 64 years age bracket for the primary householder. A total of 3,084 households (37.7%) fall into this category. Meanwhile, the 15 to 24 years age bracket for the primary householder has the lowest median household income of $0, with 36 households (0.4%) in this group.
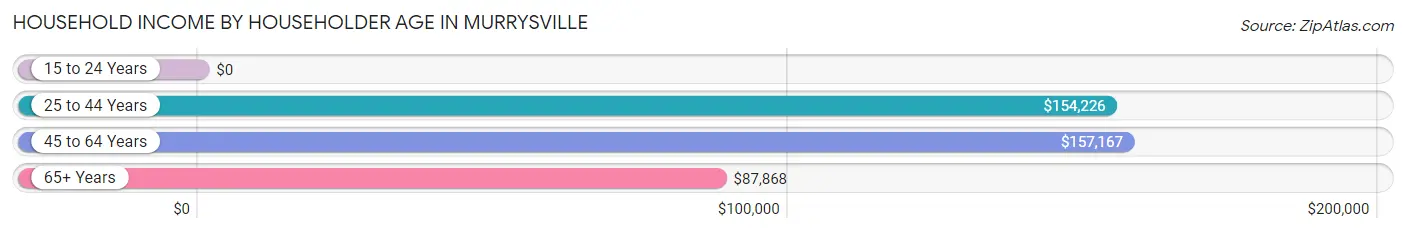
| Income Bracket | # Households | Median Income |
| 15 to 24 Years | 36 (0.4%) | $0 |
| 25 to 44 Years | 1,700 (20.8%) | $154,226 |
| 45 to 64 Years | 3,084 (37.7%) | $157,167 |
| 65+ Years | 3,362 (41.1%) | $87,868 |
| Total | 8,182 (100.0%) | $117,067 |
Poverty in Murrysville
Income Below Poverty by Sex and Age in Murrysville
With 2.9% poverty level for males and 4.2% for females among the residents of Murrysville, 15 year old males and 15 year old females are the most vulnerable to poverty, with 34 males (17.8%) and 36 females (12.7%) in their respective age groups living below the poverty level.
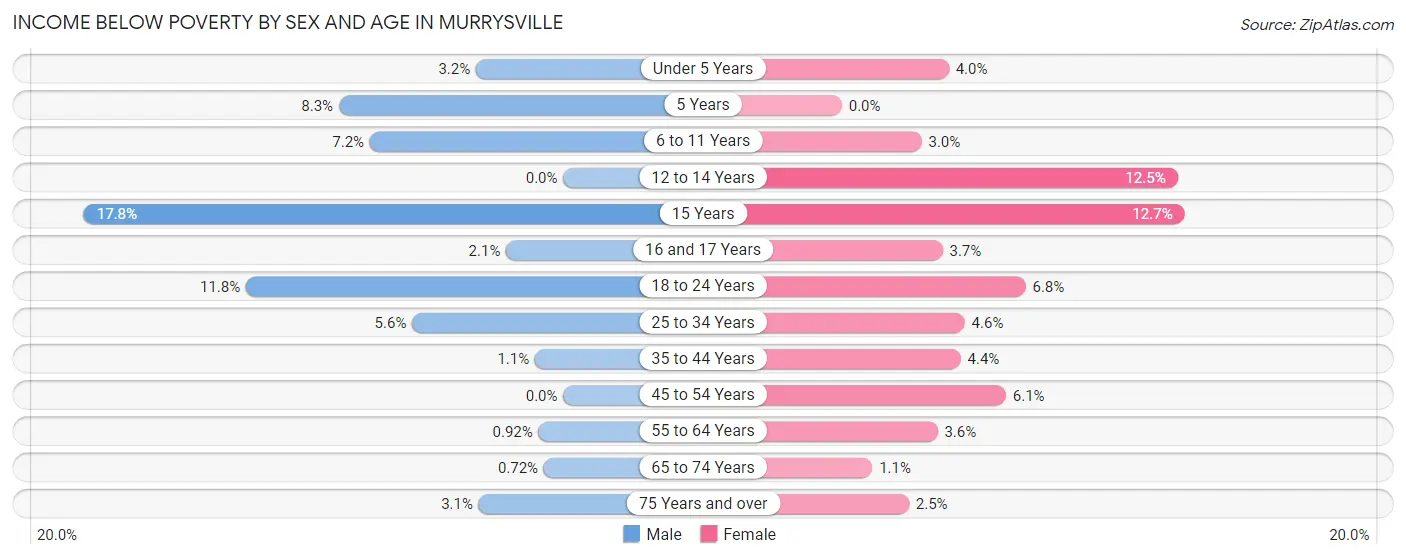
| Age Bracket | Male | Female |
| Under 5 Years | 14 (3.2%) | 14 (4.0%) |
| 5 Years | 15 (8.3%) | 0 (0.0%) |
| 6 to 11 Years | 58 (7.2%) | 16 (3.0%) |
| 12 to 14 Years | 0 (0.0%) | 37 (12.5%) |
| 15 Years | 34 (17.8%) | 36 (12.7%) |
| 16 and 17 Years | 6 (2.1%) | 12 (3.7%) |
| 18 to 24 Years | 53 (11.8%) | 41 (6.8%) |
| 25 to 34 Years | 45 (5.6%) | 28 (4.6%) |
| 35 to 44 Years | 13 (1.1%) | 56 (4.4%) |
| 45 to 54 Years | 0 (0.0%) | 73 (6.1%) |
| 55 to 64 Years | 13 (0.9%) | 64 (3.5%) |
| 65 to 74 Years | 13 (0.7%) | 18 (1.1%) |
| 75 Years and over | 33 (3.1%) | 34 (2.5%) |
| Total | 297 (2.9%) | 429 (4.2%) |
Income Above Poverty by Sex and Age in Murrysville
According to the poverty statistics in Murrysville, males aged 12 to 14 years and females aged 5 years are the age groups that are most secure financially, with 100.0% of males and 100.0% of females in these age groups living above the poverty line.
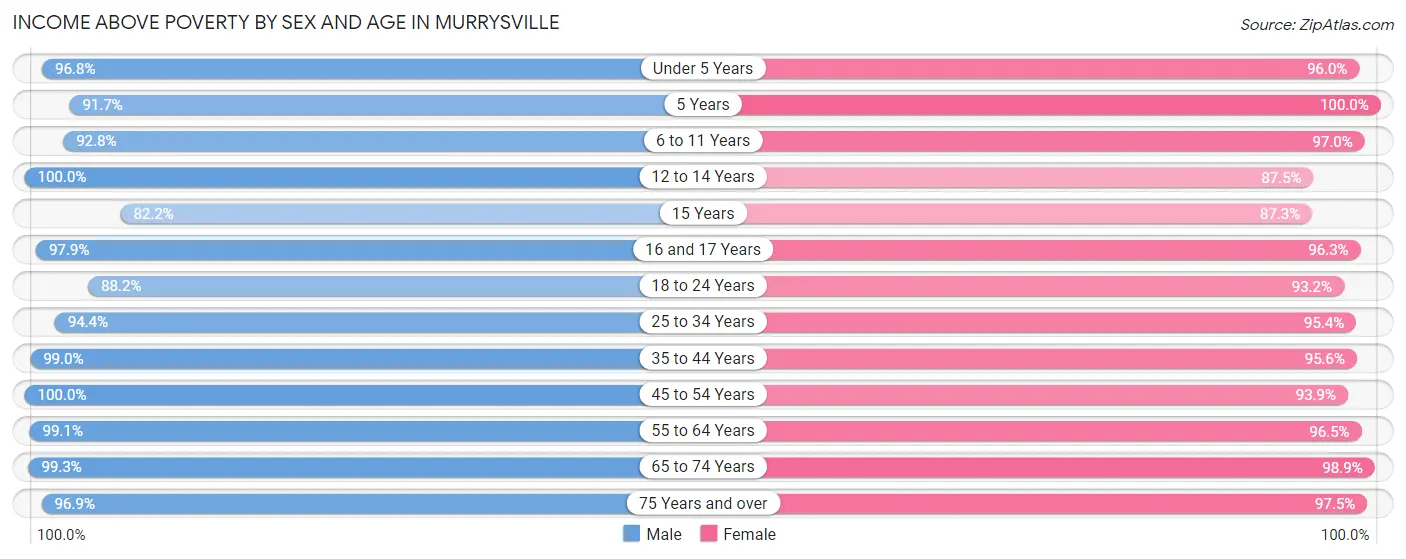
| Age Bracket | Male | Female |
| Under 5 Years | 418 (96.8%) | 339 (96.0%) |
| 5 Years | 165 (91.7%) | 61 (100.0%) |
| 6 to 11 Years | 750 (92.8%) | 524 (97.0%) |
| 12 to 14 Years | 476 (100.0%) | 260 (87.5%) |
| 15 Years | 157 (82.2%) | 247 (87.3%) |
| 16 and 17 Years | 277 (97.9%) | 309 (96.3%) |
| 18 to 24 Years | 397 (88.2%) | 560 (93.2%) |
| 25 to 34 Years | 757 (94.4%) | 586 (95.4%) |
| 35 to 44 Years | 1,220 (99.0%) | 1,215 (95.6%) |
| 45 to 54 Years | 1,254 (100.0%) | 1,126 (93.9%) |
| 55 to 64 Years | 1,406 (99.1%) | 1,739 (96.5%) |
| 65 to 74 Years | 1,791 (99.3%) | 1,575 (98.9%) |
| 75 Years and over | 1,017 (96.9%) | 1,331 (97.5%) |
| Total | 10,085 (97.1%) | 9,872 (95.8%) |
Income Below Poverty Among Married-Couple Families in Murrysville
The poverty statistics for married-couple families in Murrysville show that 0.4% or 22 of the total 5,559 families live below the poverty line. Families with 1 or 2 children have the highest poverty rate of 1.1%, comprising of 16 families. On the other hand, families with 3 or 4 children have the lowest poverty rate of 0.0%, which includes 0 families.
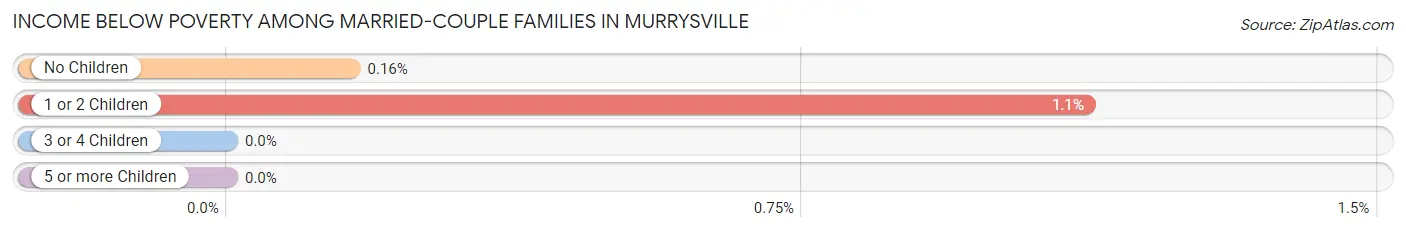
| Children | Above Poverty | Below Poverty |
| No Children | 3,659 (99.8%) | 6 (0.2%) |
| 1 or 2 Children | 1,415 (98.9%) | 16 (1.1%) |
| 3 or 4 Children | 458 (100.0%) | 0 (0.0%) |
| 5 or more Children | 5 (100.0%) | 0 (0.0%) |
| Total | 5,537 (99.6%) | 22 (0.4%) |
Income Below Poverty Among Single-Parent Households in Murrysville
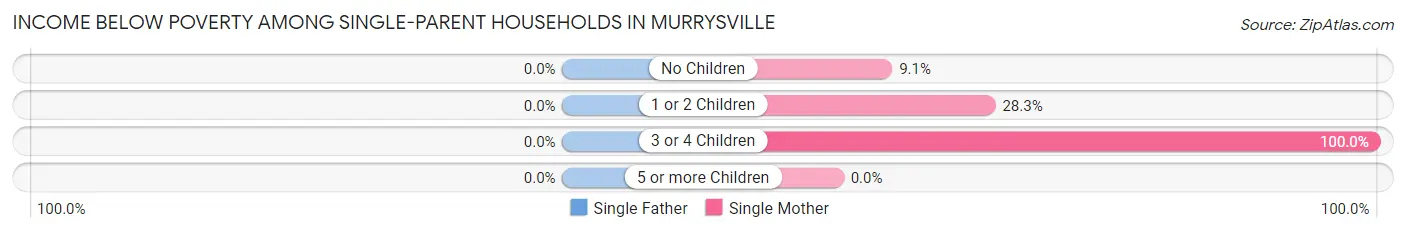
| Children | Single Father | Single Mother |
| No Children | 0 (0.0%) | 18 (9.0%) |
| 1 or 2 Children | 0 (0.0%) | 56 (28.3%) |
| 3 or 4 Children | 0 (0.0%) | 37 (100.0%) |
| 5 or more Children | 0 (0.0%) | 0 (0.0%) |
| Total | 0 (0.0%) | 111 (25.6%) |
Income Below Poverty Among Married-Couple vs Single-Parent Households in Murrysville
The poverty data for Murrysville shows that 22 of the married-couple family households (0.4%) and 111 of the single-parent households (18.1%) are living below the poverty level. Within the married-couple family households, those with 1 or 2 children have the highest poverty rate, with 16 households (1.1%) falling below the poverty line. Among the single-parent households, those with 3 or 4 children have the highest poverty rate, with 37 household (42.5%) living below poverty.
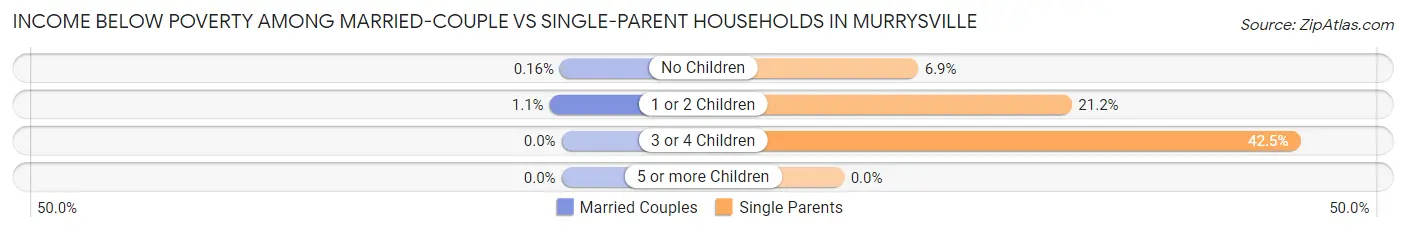
| Children | Married-Couple Families | Single-Parent Households |
| No Children | 6 (0.2%) | 18 (6.9%) |
| 1 or 2 Children | 16 (1.1%) | 56 (21.2%) |
| 3 or 4 Children | 0 (0.0%) | 37 (42.5%) |
| 5 or more Children | 0 (0.0%) | 0 (0.0%) |
| Total | 22 (0.4%) | 111 (18.1%) |
Race in Murrysville
The most populous races in Murrysville are White / Caucasian (19,024 | 91.4%), Asian (809 | 3.9%), and Two or more Races (652 | 3.1%).
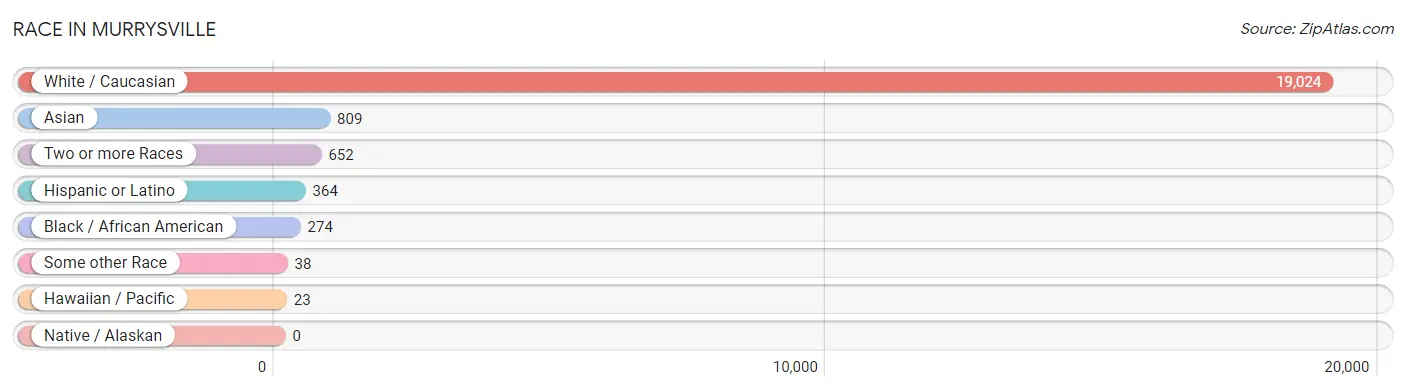
| Race | # Population | % Population |
| Asian | 809 | 3.9% |
| Black / African American | 274 | 1.3% |
| Hawaiian / Pacific | 23 | 0.1% |
| Hispanic or Latino | 364 | 1.8% |
| Native / Alaskan | 0 | 0.0% |
| White / Caucasian | 19,024 | 91.4% |
| Two or more Races | 652 | 3.1% |
| Some other Race | 38 | 0.2% |
| Total | 20,820 | 100.0% |
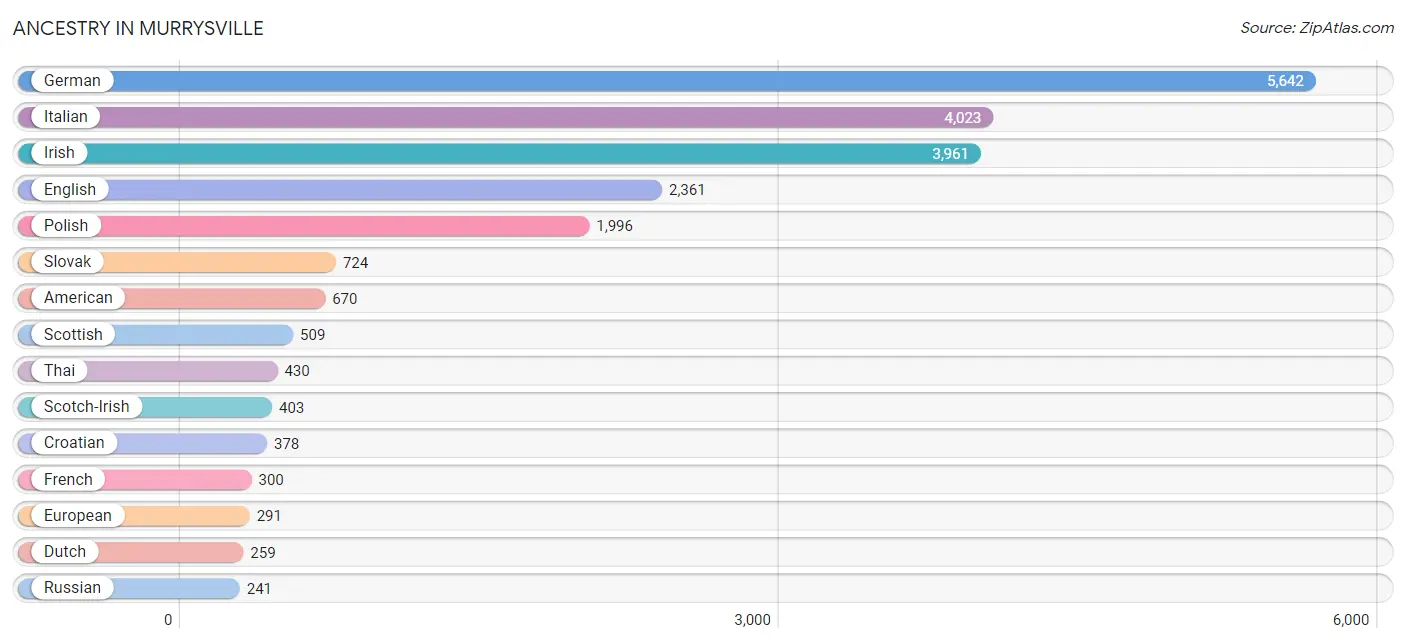
Ancestry in Murrysville
The most populous ancestries reported in Murrysville are German (5,642 | 27.1%), Italian (4,023 | 19.3%), Irish (3,961 | 19.0%), English (2,361 | 11.3%), and Polish (1,996 | 9.6%), together accounting for 86.4% of all Murrysville residents.
| Ancestry | # Population | % Population |
| African | 22 | 0.1% |
| American | 670 | 3.2% |
| Arab | 30 | 0.1% |
| Argentinean | 9 | 0.0% |
| Austrian | 108 | 0.5% |
| Belgian | 11 | 0.1% |
| Bhutanese | 88 | 0.4% |
| Blackfeet | 6 | 0.0% |
| British | 134 | 0.6% |
| Burmese | 109 | 0.5% |
| Canadian | 37 | 0.2% |
| Central American | 63 | 0.3% |
| Cherokee | 85 | 0.4% |
| Colombian | 10 | 0.1% |
| Croatian | 378 | 1.8% |
| Cuban | 42 | 0.2% |
| Czech | 117 | 0.6% |
| Czechoslovakian | 15 | 0.1% |
| Danish | 50 | 0.2% |
| Dutch | 259 | 1.2% |
| Eastern European | 191 | 0.9% |
| Egyptian | 1 | 0.0% |
| English | 2,361 | 11.3% |
| European | 291 | 1.4% |
| Finnish | 29 | 0.1% |
| French | 300 | 1.4% |
| French Canadian | 163 | 0.8% |
| German | 5,642 | 27.1% |
| Ghanaian | 49 | 0.2% |
| Greek | 82 | 0.4% |
| Guatemalan | 55 | 0.3% |
| Hungarian | 212 | 1.0% |
| Indian (Asian) | 208 | 1.0% |
| Irish | 3,961 | 19.0% |
| Italian | 4,023 | 19.3% |
| Jamaican | 4 | 0.0% |
| Korean | 65 | 0.3% |
| Laotian | 5 | 0.0% |
| Latvian | 10 | 0.1% |
| Lebanese | 8 | 0.0% |
| Lithuanian | 192 | 0.9% |
| Maltese | 36 | 0.2% |
| Mexican | 164 | 0.8% |
| Native Hawaiian | 69 | 0.3% |
| Nicaraguan | 8 | 0.0% |
| Northern European | 66 | 0.3% |
| Norwegian | 127 | 0.6% |
| Pakistani | 43 | 0.2% |
| Pennsylvania German | 39 | 0.2% |
| Polish | 1,996 | 9.6% |
| Portuguese | 3 | 0.0% |
| Puerto Rican | 57 | 0.3% |
| Romanian | 49 | 0.2% |
| Russian | 241 | 1.2% |
| Samoan | 23 | 0.1% |
| Scandinavian | 6 | 0.0% |
| Scotch-Irish | 403 | 1.9% |
| Scottish | 509 | 2.4% |
| Serbian | 91 | 0.4% |
| Slavic | 72 | 0.4% |
| Slovak | 724 | 3.5% |
| Slovene | 137 | 0.7% |
| South American | 19 | 0.1% |
| Spanish | 15 | 0.1% |
| Subsaharan African | 95 | 0.5% |
| Swedish | 239 | 1.1% |
| Swiss | 64 | 0.3% |
| Syrian | 21 | 0.1% |
| Thai | 430 | 2.1% |
| Turkish | 64 | 0.3% |
| Ukrainian | 101 | 0.5% |
| Welsh | 171 | 0.8% |
| Yugoslavian | 16 | 0.1% | View All 73 Rows |
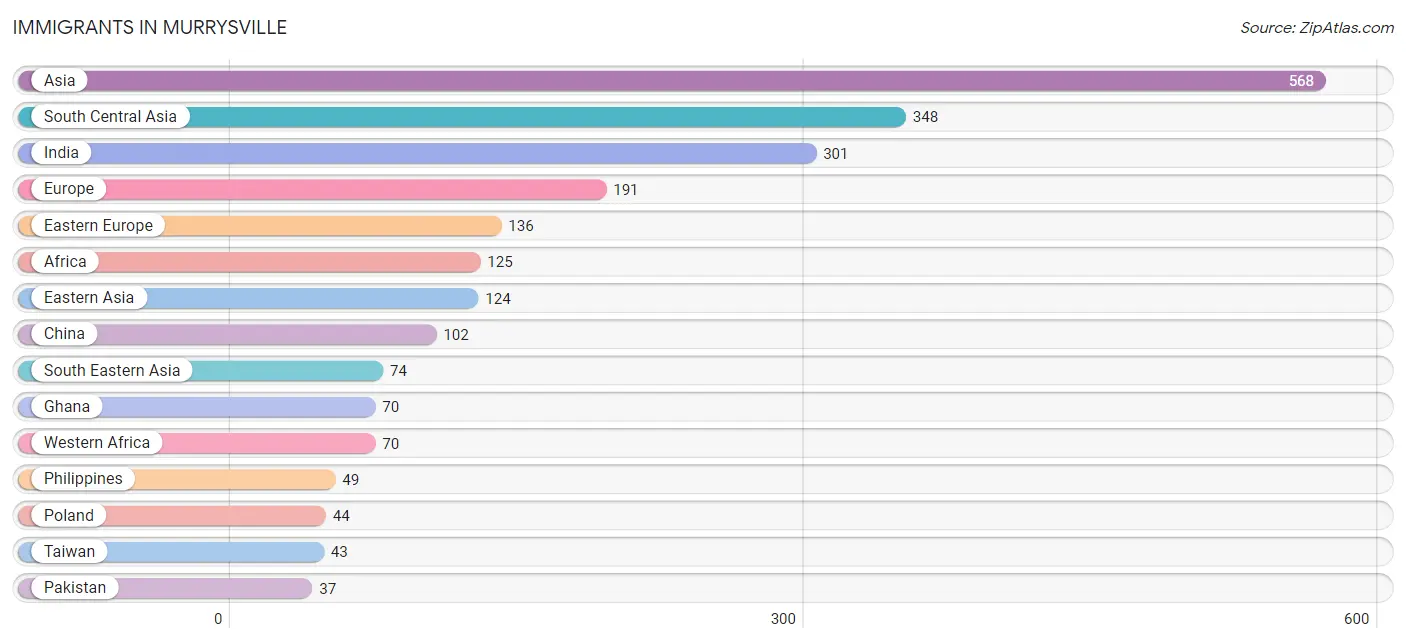
Immigrants in Murrysville
The most numerous immigrant groups reported in Murrysville came from Asia (568 | 2.7%), South Central Asia (348 | 1.7%), India (301 | 1.5%), Europe (191 | 0.9%), and Eastern Europe (136 | 0.6%), together accounting for 7.4% of all Murrysville residents.
| Immigration Origin | # Population | % Population |
| Africa | 125 | 0.6% |
| Argentina | 9 | 0.0% |
| Asia | 568 | 2.7% |
| Canada | 34 | 0.2% |
| Central America | 16 | 0.1% |
| China | 102 | 0.5% |
| Colombia | 10 | 0.1% |
| Czechoslovakia | 36 | 0.2% |
| Denmark | 11 | 0.1% |
| Eastern Africa | 30 | 0.1% |
| Eastern Asia | 124 | 0.6% |
| Eastern Europe | 136 | 0.6% |
| Egypt | 1 | 0.0% |
| Europe | 191 | 0.9% |
| Ghana | 70 | 0.3% |
| Guatemala | 8 | 0.0% |
| India | 301 | 1.5% |
| Indonesia | 5 | 0.0% |
| Italy | 7 | 0.0% |
| Japan | 9 | 0.0% |
| Kazakhstan | 10 | 0.1% |
| Korea | 13 | 0.1% |
| Latin America | 35 | 0.2% |
| Latvia | 10 | 0.1% |
| Netherlands | 14 | 0.1% |
| Nicaragua | 8 | 0.0% |
| Northern Africa | 1 | 0.0% |
| Northern Europe | 34 | 0.2% |
| Norway | 5 | 0.0% |
| Pakistan | 37 | 0.2% |
| Philippines | 49 | 0.2% |
| Poland | 44 | 0.2% |
| Romania | 29 | 0.1% |
| Russia | 17 | 0.1% |
| South Africa | 24 | 0.1% |
| South America | 19 | 0.1% |
| South Central Asia | 348 | 1.7% |
| South Eastern Asia | 74 | 0.4% |
| Southern Europe | 7 | 0.0% |
| Taiwan | 43 | 0.2% |
| Thailand | 20 | 0.1% |
| Turkey | 22 | 0.1% |
| Western Africa | 70 | 0.3% |
| Western Asia | 22 | 0.1% |
| Western Europe | 14 | 0.1% | View All 45 Rows |
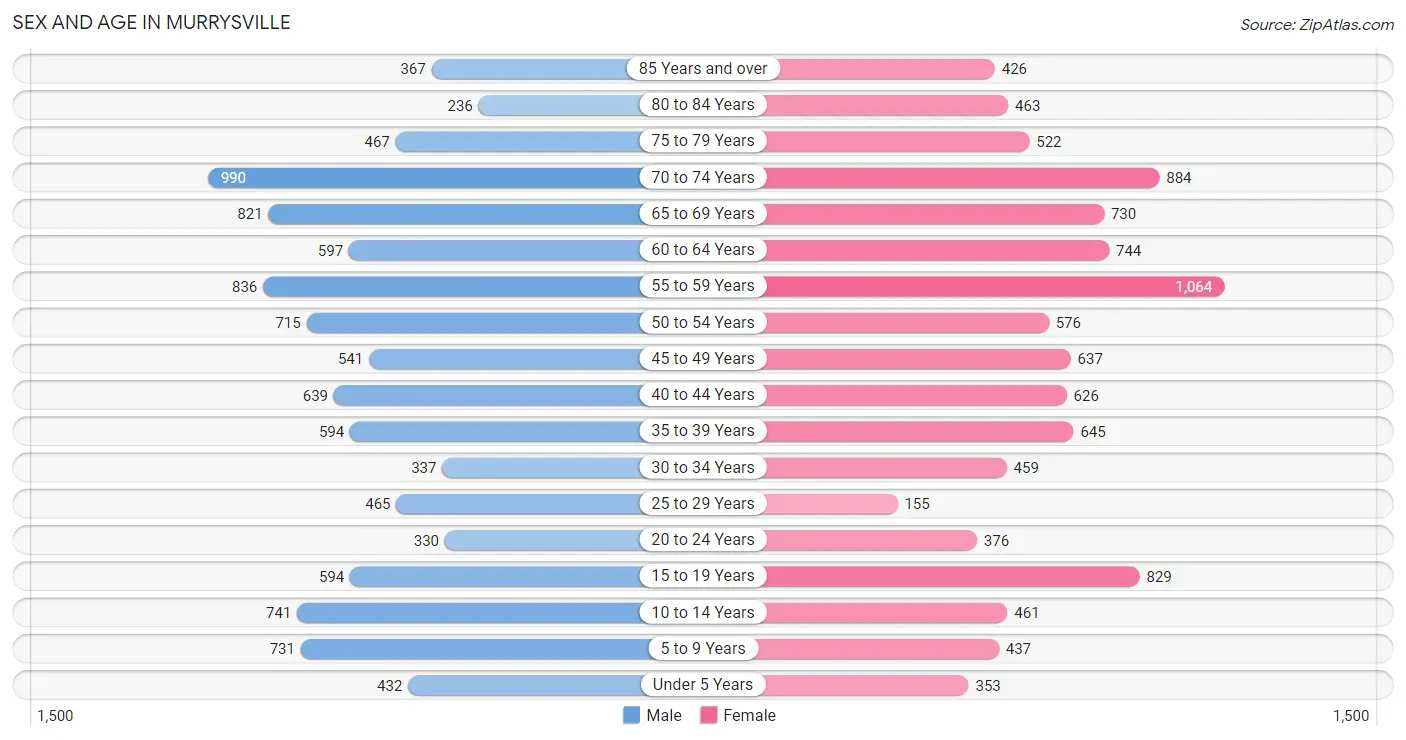
Sex and Age in Murrysville
Sex and Age in Murrysville
The most populous age groups in Murrysville are 70 to 74 Years (990 | 9.5%) for men and 55 to 59 Years (1,064 | 10.2%) for women.
| Age Bracket | Male | Female |
| Under 5 Years | 432 (4.1%) | 353 (3.4%) |
| 5 to 9 Years | 731 (7.0%) | 437 (4.2%) |
| 10 to 14 Years | 741 (7.1%) | 461 (4.4%) |
| 15 to 19 Years | 594 (5.7%) | 829 (8.0%) |
| 20 to 24 Years | 330 (3.2%) | 376 (3.6%) |
| 25 to 29 Years | 465 (4.5%) | 155 (1.5%) |
| 30 to 34 Years | 337 (3.2%) | 459 (4.4%) |
| 35 to 39 Years | 594 (5.7%) | 645 (6.2%) |
| 40 to 44 Years | 639 (6.1%) | 626 (6.0%) |
| 45 to 49 Years | 541 (5.2%) | 637 (6.1%) |
| 50 to 54 Years | 715 (6.9%) | 576 (5.6%) |
| 55 to 59 Years | 836 (8.0%) | 1,064 (10.2%) |
| 60 to 64 Years | 597 (5.7%) | 744 (7.2%) |
| 65 to 69 Years | 821 (7.9%) | 730 (7.0%) |
| 70 to 74 Years | 990 (9.5%) | 884 (8.5%) |
| 75 to 79 Years | 467 (4.5%) | 522 (5.0%) |
| 80 to 84 Years | 236 (2.3%) | 463 (4.5%) |
| 85 Years and over | 367 (3.5%) | 426 (4.1%) |
| Total | 10,433 (100.0%) | 10,387 (100.0%) |
Families and Households in Murrysville
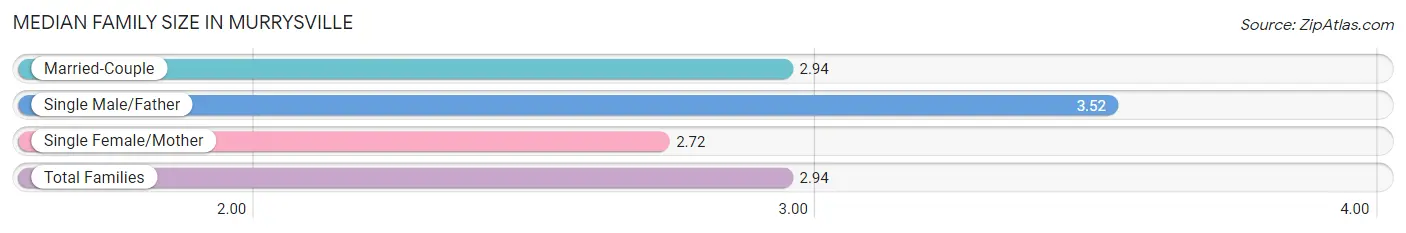
Median Family Size in Murrysville
The median family size in Murrysville is 2.94 persons per family, with single male/father families (178 | 2.9%) accounting for the largest median family size of 3.52 persons per family. On the other hand, single female/mother families (434 | 7.0%) represent the smallest median family size with 2.72 persons per family.
| Family Type | # Families | Family Size |
| Married-Couple | 5,559 (90.1%) | 2.94 |
| Single Male/Father | 178 (2.9%) | 3.52 |
| Single Female/Mother | 434 (7.0%) | 2.72 |
| Total Families | 6,171 (100.0%) | 2.94 |
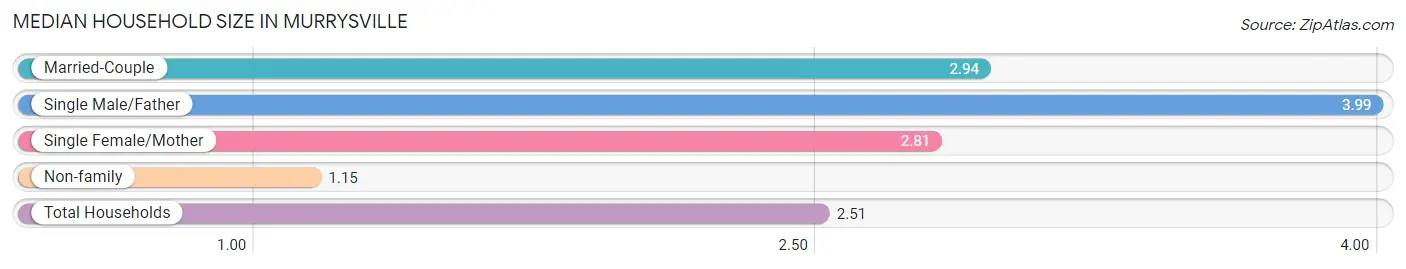
Median Household Size in Murrysville
The median household size in Murrysville is 2.51 persons per household, with single male/father households (178 | 2.2%) accounting for the largest median household size of 3.99 persons per household. non-family households (2,011 | 24.6%) represent the smallest median household size with 1.15 persons per household.
| Household Type | # Households | Household Size |
| Married-Couple | 5,559 (67.9%) | 2.94 |
| Single Male/Father | 178 (2.2%) | 3.99 |
| Single Female/Mother | 434 (5.3%) | 2.81 |
| Non-family | 2,011 (24.6%) | 1.15 |
| Total Households | 8,182 (100.0%) | 2.51 |
Household Size by Marriage Status in Murrysville
Out of a total of 8,182 households in Murrysville, 6,171 (75.4%) are family households, while 2,011 (24.6%) are nonfamily households. The most numerous type of family households are 2-person households, comprising 3,257, and the most common type of nonfamily households are 1-person households, comprising 1,735.
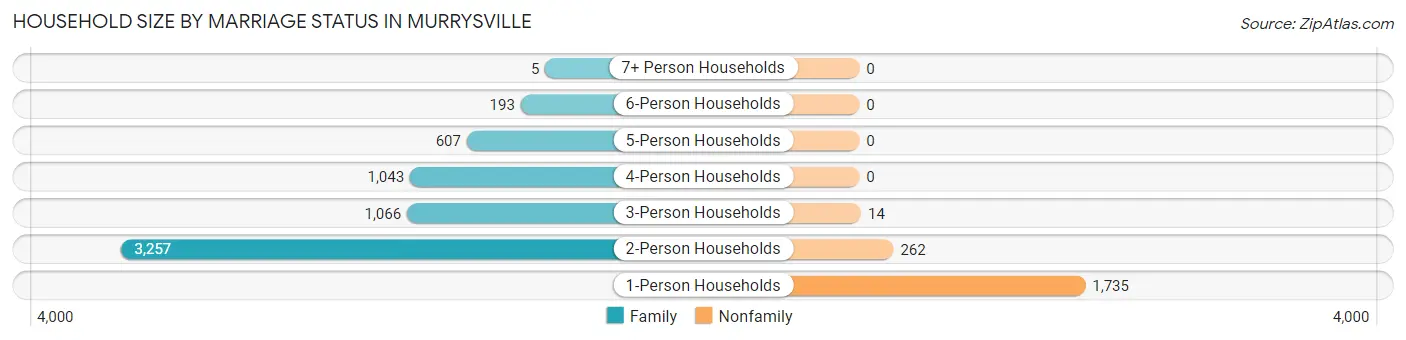
| Household Size | Family Households | Nonfamily Households |
| 1-Person Households | - | 1,735 (21.2%) |
| 2-Person Households | 3,257 (39.8%) | 262 (3.2%) |
| 3-Person Households | 1,066 (13.0%) | 14 (0.2%) |
| 4-Person Households | 1,043 (12.8%) | 0 (0.0%) |
| 5-Person Households | 607 (7.4%) | 0 (0.0%) |
| 6-Person Households | 193 (2.4%) | 0 (0.0%) |
| 7+ Person Households | 5 (0.1%) | 0 (0.0%) |
| Total | 6,171 (75.4%) | 2,011 (24.6%) |
Female Fertility in Murrysville
Fertility by Age in Murrysville
Average fertility rate in Murrysville is 23.0 births per 1,000 women. Women in the age bracket of 20 to 34 years have the highest fertility rate with 40.0 births per 1,000 women. Women in the age bracket of 35 to 50 years acount for 55.1% of all women with births.
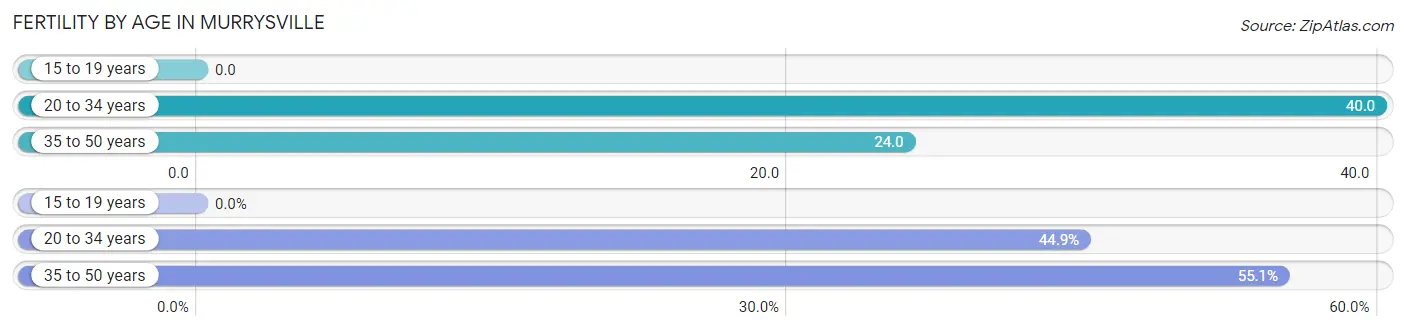
| Age Bracket | Women with Births | Births / 1,000 Women |
| 15 to 19 years | 0 (0.0%) | 0.0 |
| 20 to 34 years | 40 (44.9%) | 40.0 |
| 35 to 50 years | 49 (55.1%) | 24.0 |
| Total | 89 (100.0%) | 23.0 |
Fertility by Age by Marriage Status in Murrysville
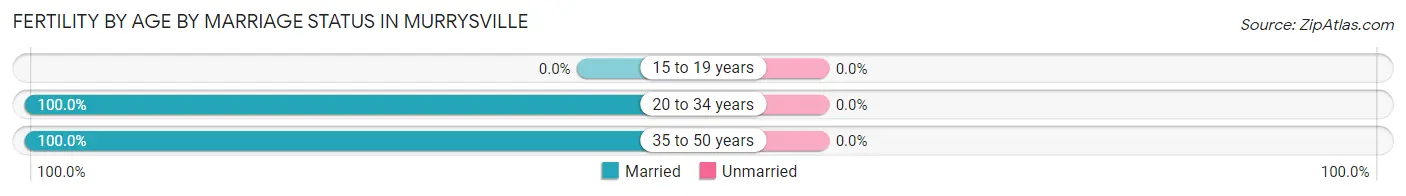
| Age Bracket | Married | Unmarried |
| 15 to 19 years | 0 (0.0%) | 0 (0.0%) |
| 20 to 34 years | 40 (100.0%) | 0 (0.0%) |
| 35 to 50 years | 49 (100.0%) | 0 (0.0%) |
| Total | 89 (100.0%) | 0 (0.0%) |
Fertility by Education in Murrysville
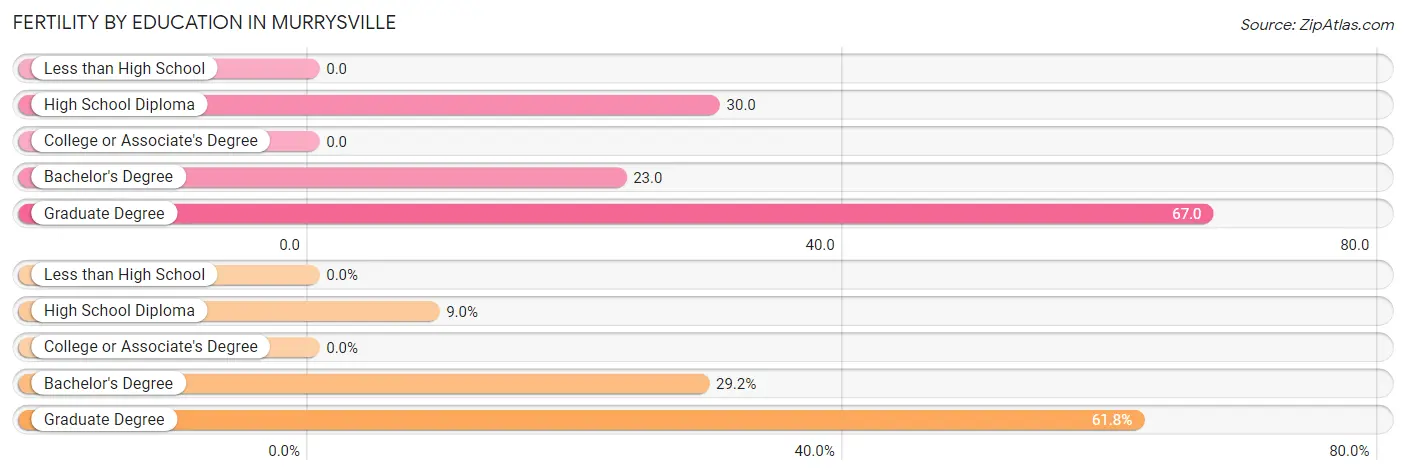
| Educational Attainment | Women with Births | Births / 1,000 Women |
| Less than High School | 0 (0.0%) | 0.0 |
| High School Diploma | 8 (9.0%) | 30.0 |
| College or Associate's Degree | 0 (0.0%) | 0.0 |
| Bachelor's Degree | 26 (29.2%) | 23.0 |
| Graduate Degree | 55 (61.8%) | 67.0 |
| Total | 89 (100.0%) | 23.0 |
Fertility by Education by Marriage Status in Murrysville
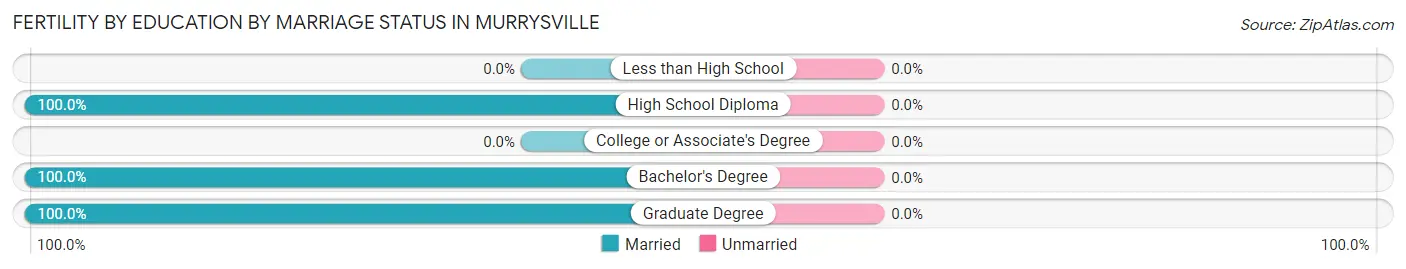
| Educational Attainment | Married | Unmarried |
| Less than High School | 0 (0.0%) | 0 (0.0%) |
| High School Diploma | 8 (100.0%) | 0 (0.0%) |
| College or Associate's Degree | 0 (0.0%) | 0 (0.0%) |
| Bachelor's Degree | 26 (100.0%) | 0 (0.0%) |
| Graduate Degree | 55 (100.0%) | 0 (0.0%) |
| Total | 89 (100.0%) | 0 (0.0%) |
Employment Characteristics in Murrysville
Employment by Class of Employer in Murrysville
Among the 10,013 employed individuals in Murrysville, private company employees (6,533 | 65.2%), not-for-profit organizations (1,090 | 10.9%), and self-employed (not incorporated) (903 | 9.0%) make up the most common classes of employment.
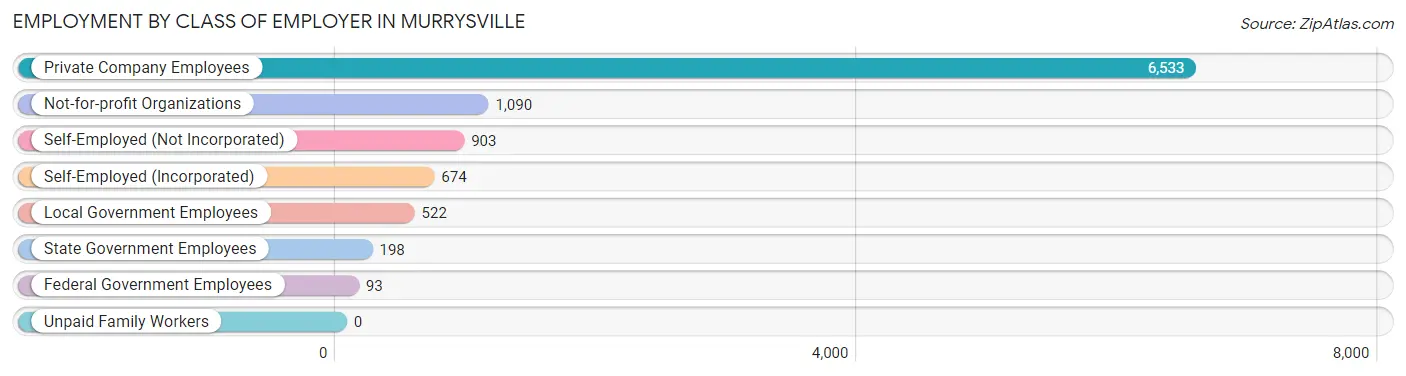
| Employer Class | # Employees | % Employees |
| Private Company Employees | 6,533 | 65.2% |
| Self-Employed (Incorporated) | 674 | 6.7% |
| Self-Employed (Not Incorporated) | 903 | 9.0% |
| Not-for-profit Organizations | 1,090 | 10.9% |
| Local Government Employees | 522 | 5.2% |
| State Government Employees | 198 | 2.0% |
| Federal Government Employees | 93 | 0.9% |
| Unpaid Family Workers | 0 | 0.0% |
| Total | 10,013 | 100.0% |
Employment Status by Age in Murrysville
According to the labor force statistics for Murrysville, out of the total population over 16 years of age (17,191), 61.0% or 10,487 individuals are in the labor force, with 3.5% or 367 of them unemployed. The age group with the highest labor force participation rate is 25 to 29 years, with 93.7% or 581 individuals in the labor force. Within the labor force, the 20 to 24 years age range has the highest percentage of unemployed individuals, with 7.9% or 36 of them being unemployed.
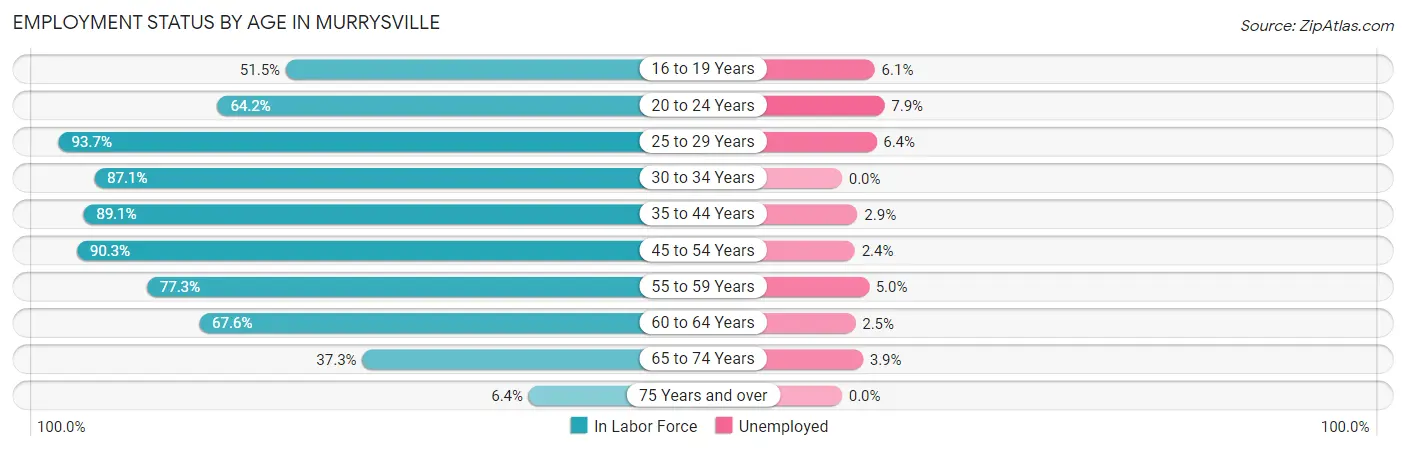
| Age Bracket | In Labor Force | Unemployed |
| 16 to 19 Years | 489 (51.5%) | 30 (6.1%) |
| 20 to 24 Years | 453 (64.2%) | 36 (7.9%) |
| 25 to 29 Years | 581 (93.7%) | 37 (6.4%) |
| 30 to 34 Years | 693 (87.1%) | 0 (0.0%) |
| 35 to 44 Years | 2,231 (89.1%) | 65 (2.9%) |
| 45 to 54 Years | 2,230 (90.3%) | 54 (2.4%) |
| 55 to 59 Years | 1,469 (77.3%) | 73 (5.0%) |
| 60 to 64 Years | 907 (67.6%) | 23 (2.5%) |
| 65 to 74 Years | 1,278 (37.3%) | 50 (3.9%) |
| 75 Years and over | 159 (6.4%) | 0 (0.0%) |
| Total | 10,487 (61.0%) | 367 (3.5%) |
Employment Status by Educational Attainment in Murrysville
According to labor force statistics for Murrysville, 84.2% of individuals (8,108) out of the total population between 25 and 64 years of age (9,630) are in the labor force, with 3.1% or 251 of them being unemployed. The group with the highest labor force participation rate are those with the educational attainment of bachelor's degree or higher, with 90.1% or 5,289 individuals in the labor force. Within the labor force, individuals with bachelor's degree or higher education have the highest percentage of unemployment, with 3.6% or 190 of them being unemployed.
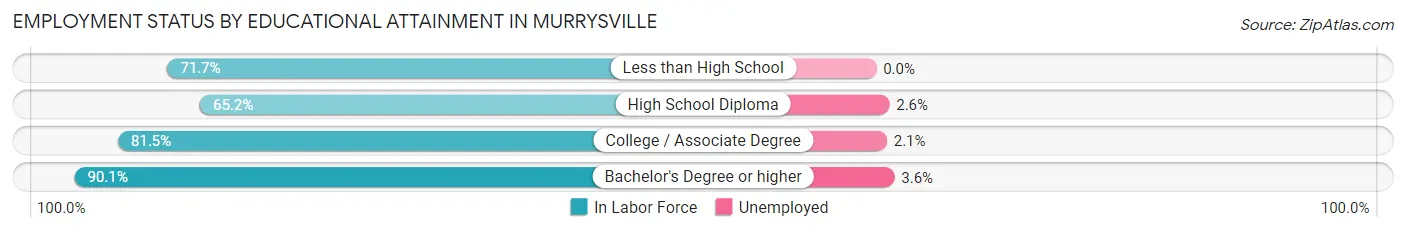
| Educational Attainment | In Labor Force | Unemployed |
| Less than High School | 76 (71.7%) | 0 (0.0%) |
| High School Diploma | 930 (65.2%) | 37 (2.6%) |
| College / Associate Degree | 1,815 (81.5%) | 47 (2.1%) |
| Bachelor's Degree or higher | 5,289 (90.1%) | 211 (3.6%) |
| Total | 8,108 (84.2%) | 299 (3.1%) |
Employment Occupations by Sex in Murrysville
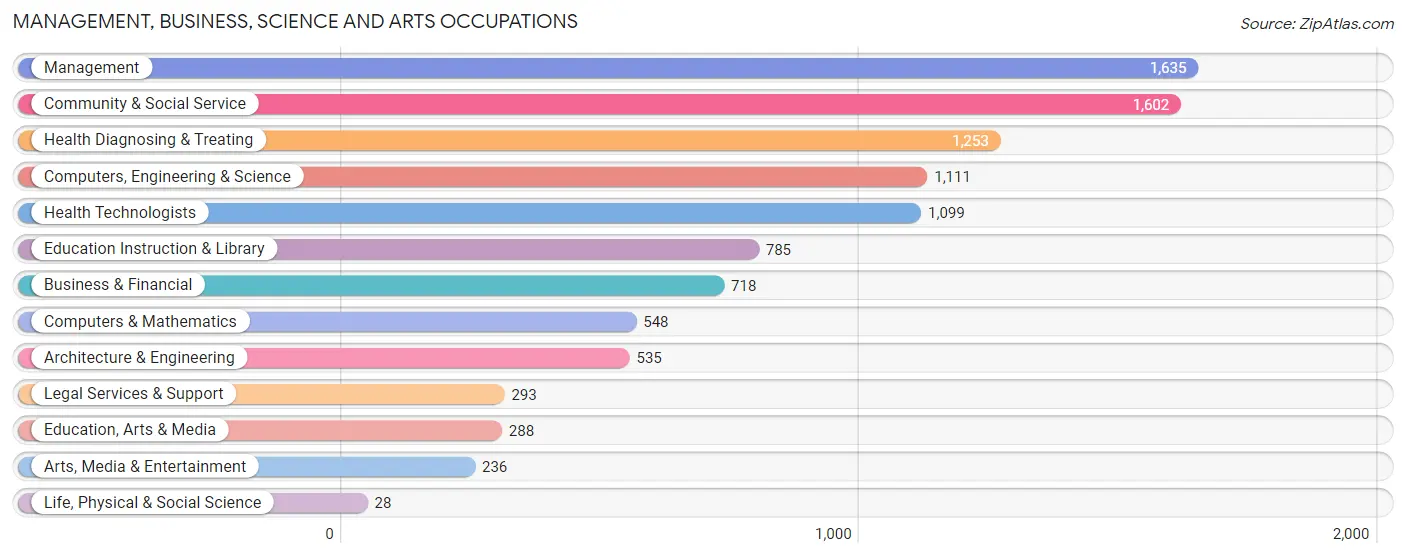
Management, Business, Science and Arts Occupations
The most common Management, Business, Science and Arts occupations in Murrysville are Management (1,635 | 16.2%), Community & Social Service (1,602 | 15.8%), Health Diagnosing & Treating (1,253 | 12.4%), Computers, Engineering & Science (1,111 | 11.0%), and Health Technologists (1,099 | 10.8%).
Management, Business, Science and Arts Occupations by Sex
Within the Management, Business, Science and Arts occupations in Murrysville, the most male-oriented occupations are Life, Physical & Social Science (100.0%), Architecture & Engineering (93.1%), and Computers, Engineering & Science (85.1%), while the most female-oriented occupations are Arts, Media & Entertainment (82.2%), Education Instruction & Library (73.6%), and Community & Social Service (61.7%).
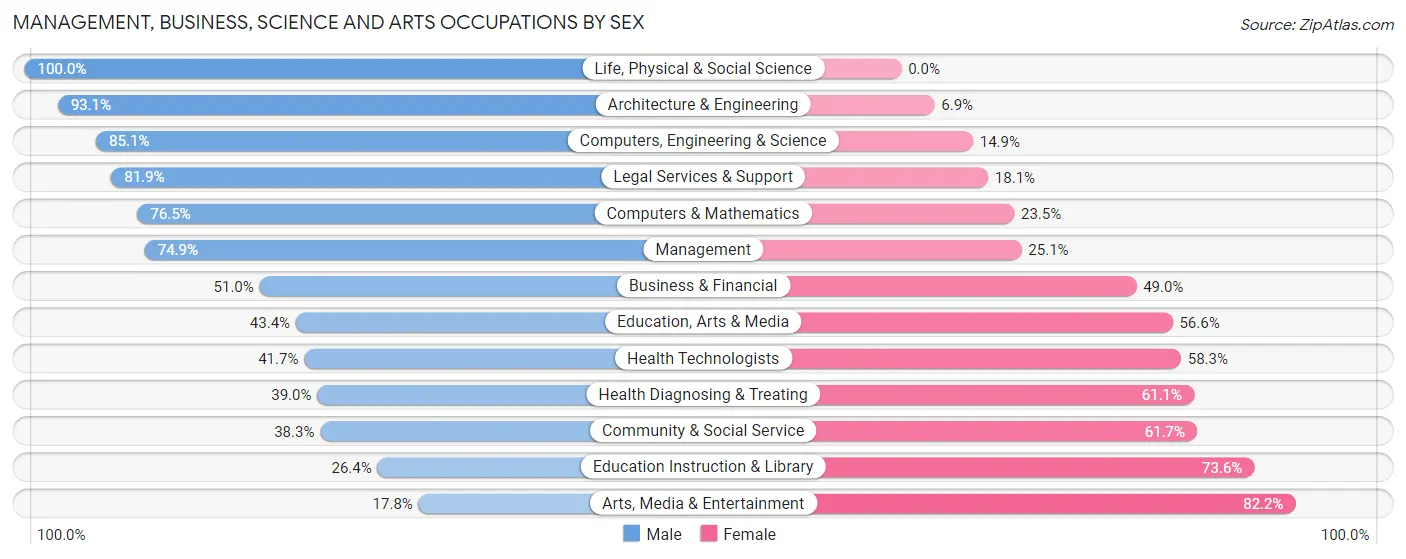
| Occupation | Male | Female |
| Management | 1,225 (74.9%) | 410 (25.1%) |
| Business & Financial | 366 (51.0%) | 352 (49.0%) |
| Computers, Engineering & Science | 945 (85.1%) | 166 (14.9%) |
| Computers & Mathematics | 419 (76.5%) | 129 (23.5%) |
| Architecture & Engineering | 498 (93.1%) | 37 (6.9%) |
| Life, Physical & Social Science | 28 (100.0%) | 0 (0.0%) |
| Community & Social Service | 614 (38.3%) | 988 (61.7%) |
| Education, Arts & Media | 125 (43.4%) | 163 (56.6%) |
| Legal Services & Support | 240 (81.9%) | 53 (18.1%) |
| Education Instruction & Library | 207 (26.4%) | 578 (73.6%) |
| Arts, Media & Entertainment | 42 (17.8%) | 194 (82.2%) |
| Health Diagnosing & Treating | 488 (39.0%) | 765 (61.1%) |
| Health Technologists | 458 (41.7%) | 641 (58.3%) |
| Total (Category) | 3,638 (57.6%) | 2,681 (42.4%) |
| Total (Overall) | 5,434 (53.7%) | 4,691 (46.3%) |
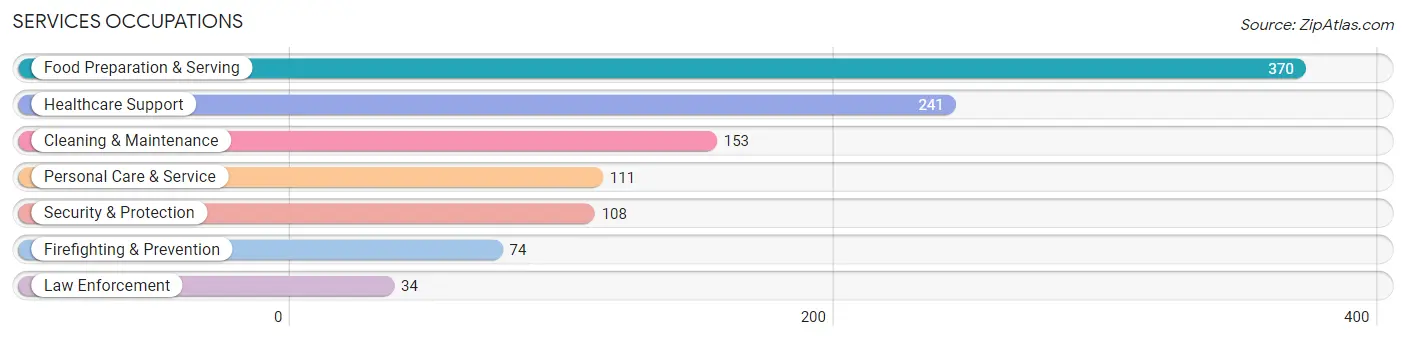
Services Occupations
The most common Services occupations in Murrysville are Food Preparation & Serving (370 | 3.6%), Healthcare Support (241 | 2.4%), Cleaning & Maintenance (153 | 1.5%), Personal Care & Service (111 | 1.1%), and Security & Protection (108 | 1.1%).
Services Occupations by Sex
Within the Services occupations in Murrysville, the most male-oriented occupations are Law Enforcement (100.0%), Cleaning & Maintenance (58.2%), and Security & Protection (46.3%), while the most female-oriented occupations are Healthcare Support (92.9%), Personal Care & Service (86.5%), and Firefighting & Prevention (78.4%).
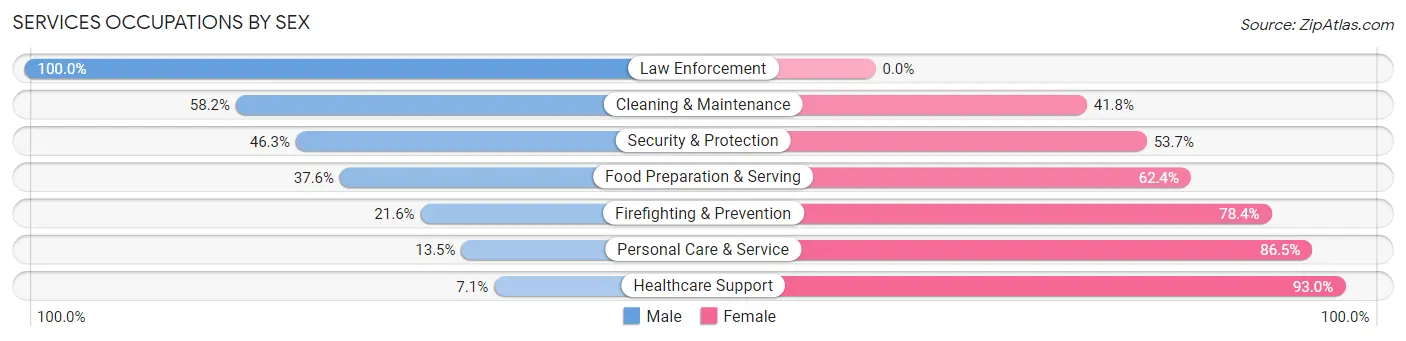
| Occupation | Male | Female |
| Healthcare Support | 17 (7.0%) | 224 (92.9%) |
| Security & Protection | 50 (46.3%) | 58 (53.7%) |
| Firefighting & Prevention | 16 (21.6%) | 58 (78.4%) |
| Law Enforcement | 34 (100.0%) | 0 (0.0%) |
| Food Preparation & Serving | 139 (37.6%) | 231 (62.4%) |
| Cleaning & Maintenance | 89 (58.2%) | 64 (41.8%) |
| Personal Care & Service | 15 (13.5%) | 96 (86.5%) |
| Total (Category) | 310 (31.5%) | 673 (68.5%) |
| Total (Overall) | 5,434 (53.7%) | 4,691 (46.3%) |
Sales and Office Occupations
The most common Sales and Office occupations in Murrysville are Sales & Related (1,130 | 11.2%), and Office & Administration (743 | 7.3%).

Sales and Office Occupations by Sex

| Occupation | Male | Female |
| Sales & Related | 626 (55.4%) | 504 (44.6%) |
| Office & Administration | 140 (18.8%) | 603 (81.2%) |
| Total (Category) | 766 (40.9%) | 1,107 (59.1%) |
| Total (Overall) | 5,434 (53.7%) | 4,691 (46.3%) |
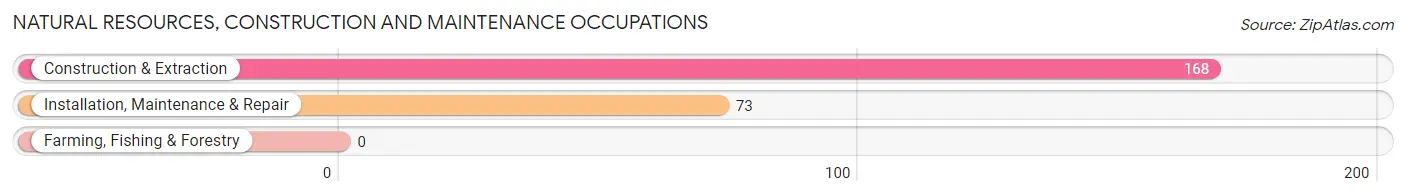
Natural Resources, Construction and Maintenance Occupations
The most common Natural Resources, Construction and Maintenance occupations in Murrysville are Construction & Extraction (168 | 1.7%), and Installation, Maintenance & Repair (73 | 0.7%).
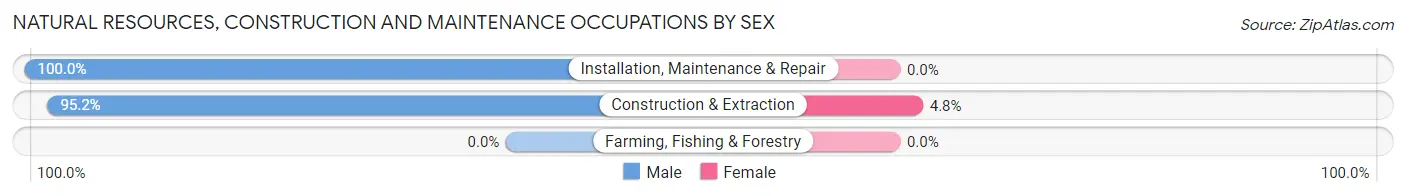
Natural Resources, Construction and Maintenance Occupations by Sex
| Occupation | Male | Female |
| Farming, Fishing & Forestry | 0 (0.0%) | 0 (0.0%) |
| Construction & Extraction | 160 (95.2%) | 8 (4.8%) |
| Installation, Maintenance & Repair | 73 (100.0%) | 0 (0.0%) |
| Total (Category) | 233 (96.7%) | 8 (3.3%) |
| Total (Overall) | 5,434 (53.7%) | 4,691 (46.3%) |
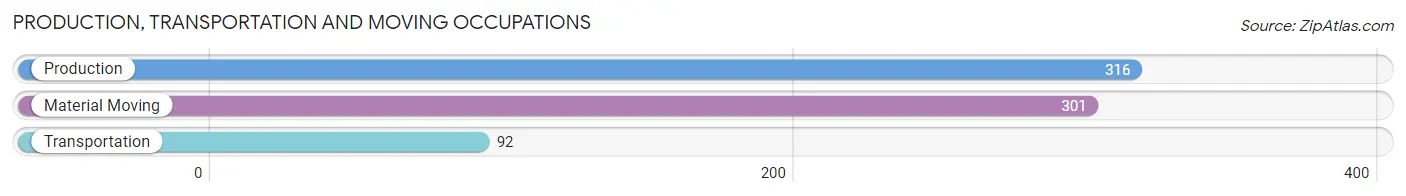
Production, Transportation and Moving Occupations
The most common Production, Transportation and Moving occupations in Murrysville are Production (316 | 3.1%), Material Moving (301 | 3.0%), and Transportation (92 | 0.9%).
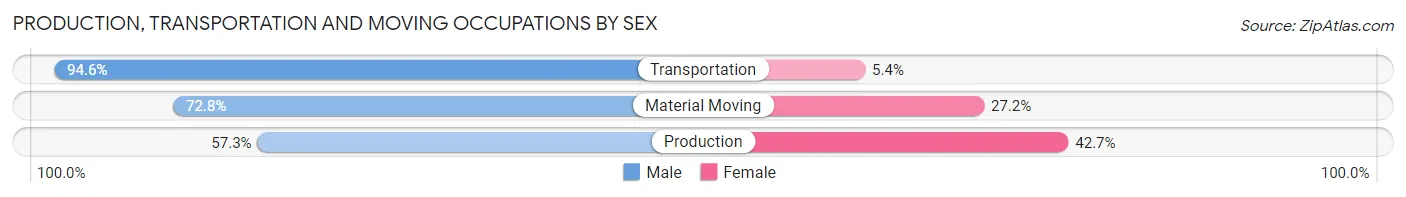
Production, Transportation and Moving Occupations by Sex
| Occupation | Male | Female |
| Production | 181 (57.3%) | 135 (42.7%) |
| Transportation | 87 (94.6%) | 5 (5.4%) |
| Material Moving | 219 (72.8%) | 82 (27.2%) |
| Total (Category) | 487 (68.7%) | 222 (31.3%) |
| Total (Overall) | 5,434 (53.7%) | 4,691 (46.3%) |
Employment Industries by Sex in Murrysville
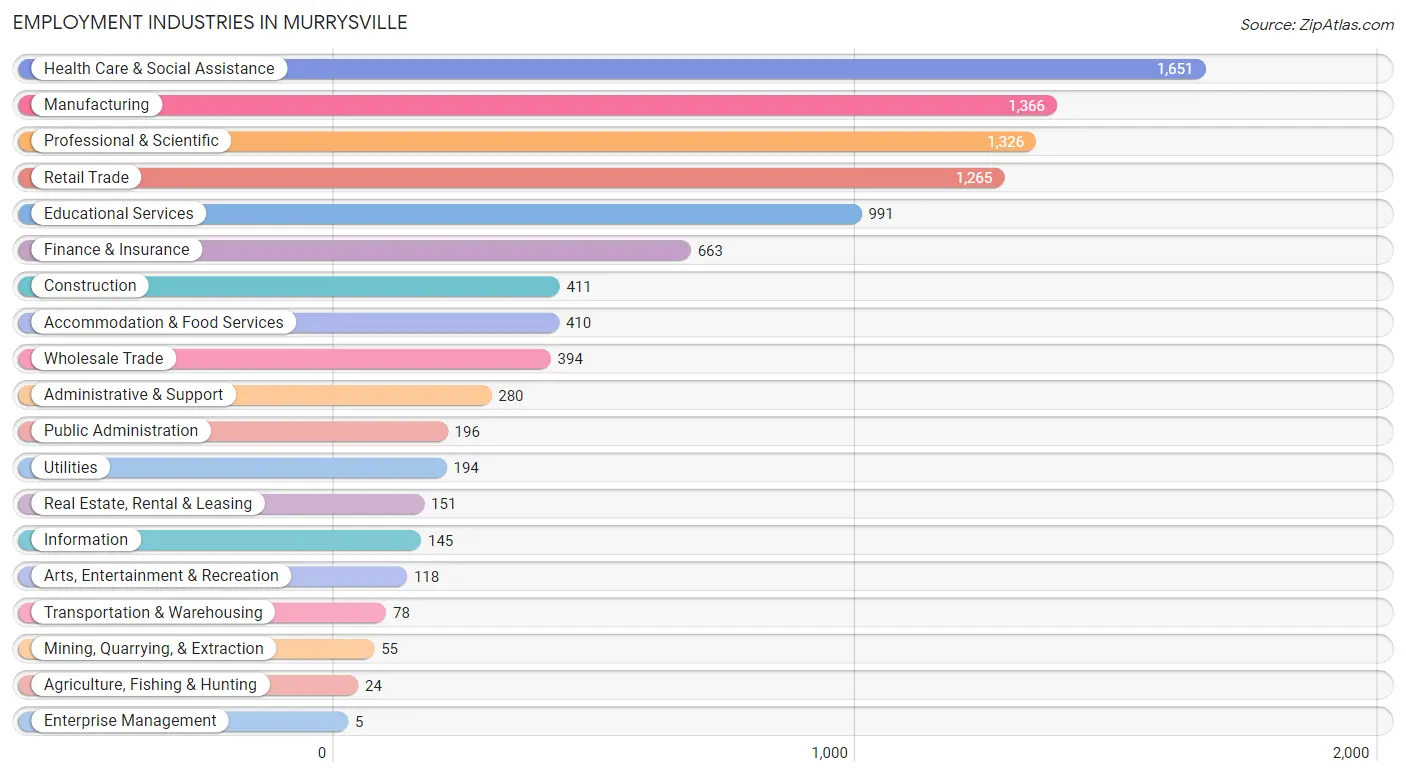
Employment Industries in Murrysville
The major employment industries in Murrysville include Health Care & Social Assistance (1,651 | 16.3%), Manufacturing (1,366 | 13.5%), Professional & Scientific (1,326 | 13.1%), Retail Trade (1,265 | 12.5%), and Educational Services (991 | 9.8%).
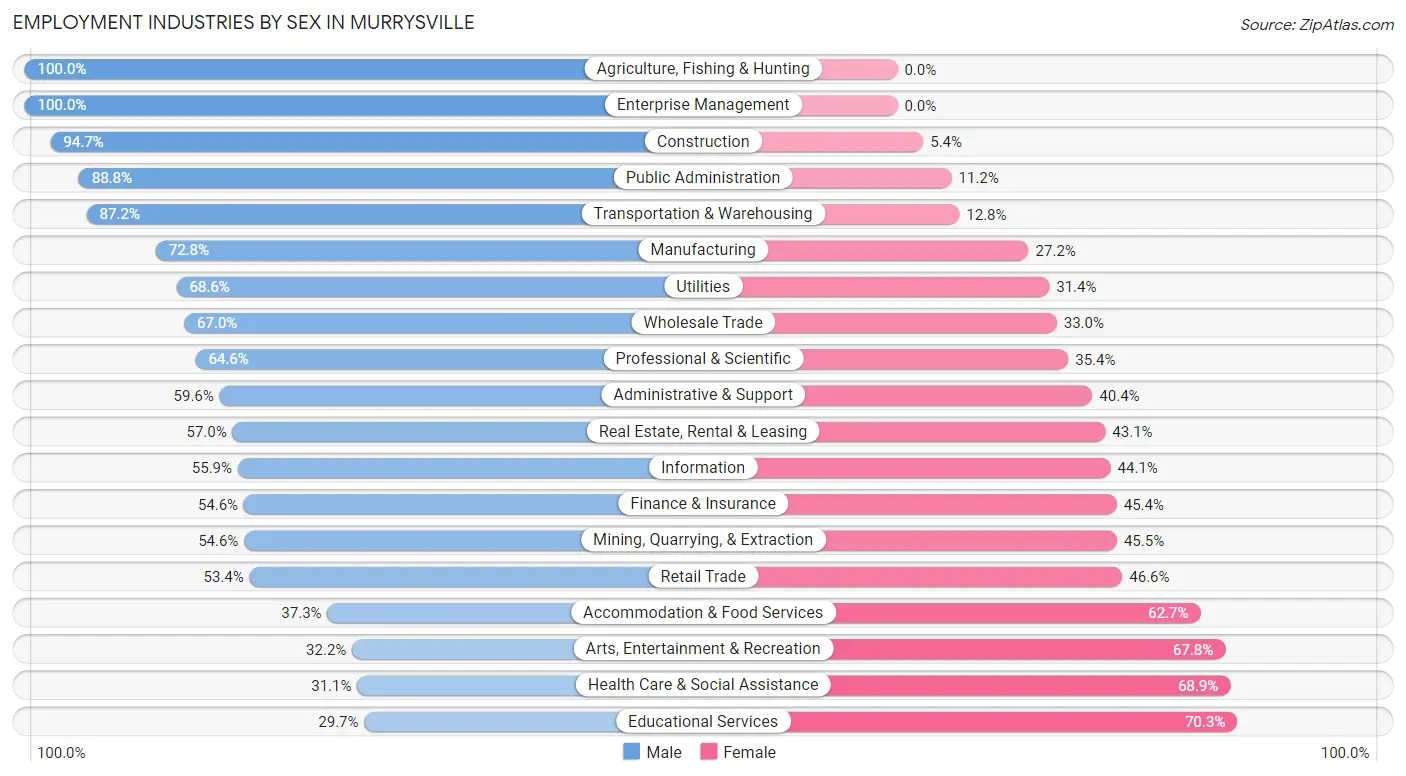
Employment Industries by Sex in Murrysville
The Murrysville industries that see more men than women are Agriculture, Fishing & Hunting (100.0%), Enterprise Management (100.0%), and Construction (94.7%), whereas the industries that tend to have a higher number of women are Educational Services (70.3%), Health Care & Social Assistance (68.9%), and Arts, Entertainment & Recreation (67.8%).
| Industry | Male | Female |
| Agriculture, Fishing & Hunting | 24 (100.0%) | 0 (0.0%) |
| Mining, Quarrying, & Extraction | 30 (54.5%) | 25 (45.5%) |
| Construction | 389 (94.7%) | 22 (5.3%) |
| Manufacturing | 995 (72.8%) | 371 (27.2%) |
| Wholesale Trade | 264 (67.0%) | 130 (33.0%) |
| Retail Trade | 676 (53.4%) | 589 (46.6%) |
| Transportation & Warehousing | 68 (87.2%) | 10 (12.8%) |
| Utilities | 133 (68.6%) | 61 (31.4%) |
| Information | 81 (55.9%) | 64 (44.1%) |
| Finance & Insurance | 362 (54.6%) | 301 (45.4%) |
| Real Estate, Rental & Leasing | 86 (57.0%) | 65 (43.0%) |
| Professional & Scientific | 857 (64.6%) | 469 (35.4%) |
| Enterprise Management | 5 (100.0%) | 0 (0.0%) |
| Administrative & Support | 167 (59.6%) | 113 (40.4%) |
| Educational Services | 294 (29.7%) | 697 (70.3%) |
| Health Care & Social Assistance | 514 (31.1%) | 1,137 (68.9%) |
| Arts, Entertainment & Recreation | 38 (32.2%) | 80 (67.8%) |
| Accommodation & Food Services | 153 (37.3%) | 257 (62.7%) |
| Public Administration | 174 (88.8%) | 22 (11.2%) |
| Total | 5,434 (53.7%) | 4,691 (46.3%) |
Education in Murrysville
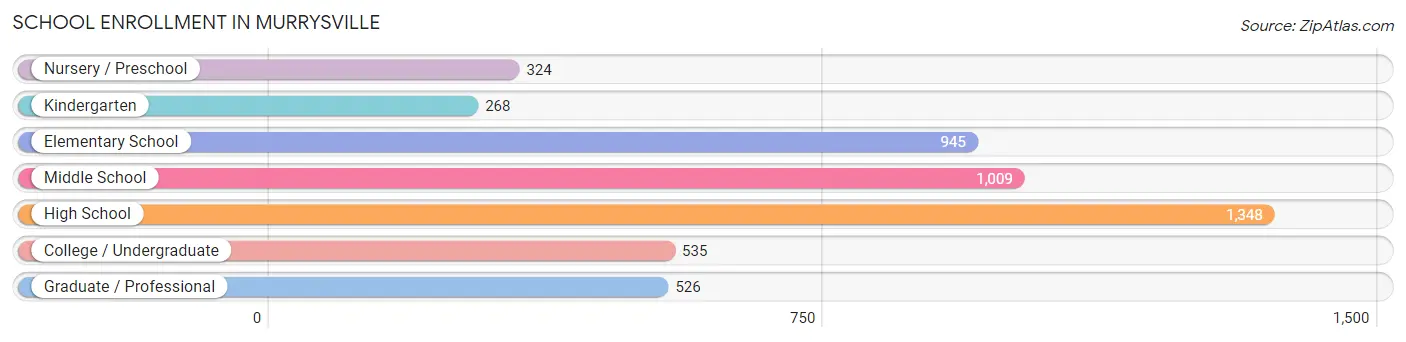
School Enrollment in Murrysville
The most common levels of schooling among the 4,955 students in Murrysville are high school (1,348 | 27.2%), middle school (1,009 | 20.4%), and elementary school (945 | 19.1%).
| School Level | # Students | % Students |
| Nursery / Preschool | 324 | 6.5% |
| Kindergarten | 268 | 5.4% |
| Elementary School | 945 | 19.1% |
| Middle School | 1,009 | 20.4% |
| High School | 1,348 | 27.2% |
| College / Undergraduate | 535 | 10.8% |
| Graduate / Professional | 526 | 10.6% |
| Total | 4,955 | 100.0% |
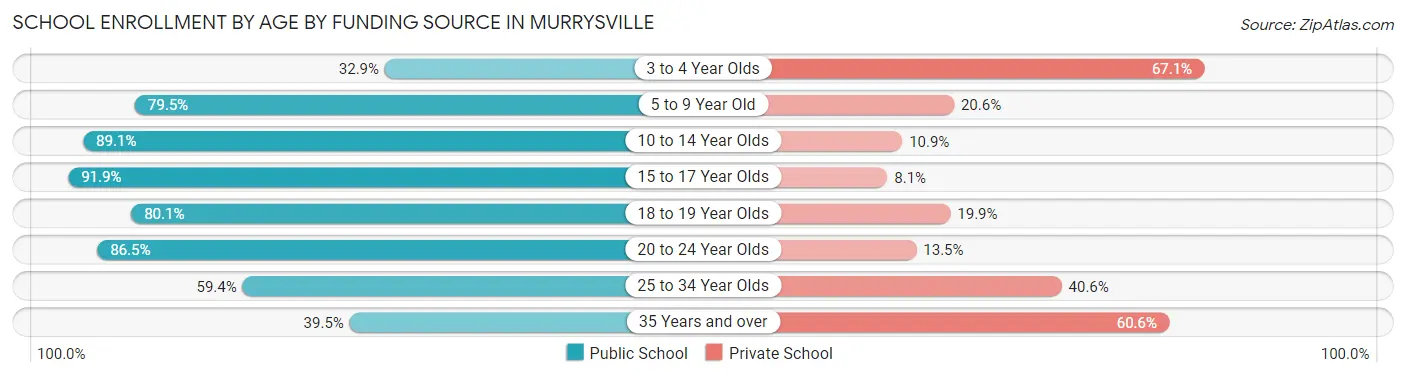
School Enrollment by Age by Funding Source in Murrysville
Out of a total of 4,955 students who are enrolled in schools in Murrysville, 1,021 (20.6%) attend a private institution, while the remaining 3,934 (79.4%) are enrolled in public schools. The age group of 3 to 4 year olds has the highest likelihood of being enrolled in private schools, with 155 (67.1% in the age bracket) enrolled. Conversely, the age group of 15 to 17 year olds has the lowest likelihood of being enrolled in a private school, with 972 (91.9% in the age bracket) attending a public institution.
| Age Bracket | Public School | Private School |
| 3 to 4 Year Olds | 76 (32.9%) | 155 (67.1%) |
| 5 to 9 Year Old | 928 (79.4%) | 240 (20.5%) |
| 10 to 14 Year Olds | 1,071 (89.1%) | 131 (10.9%) |
| 15 to 17 Year Olds | 972 (91.9%) | 86 (8.1%) |
| 18 to 19 Year Olds | 254 (80.1%) | 63 (19.9%) |
| 20 to 24 Year Olds | 415 (86.5%) | 65 (13.5%) |
| 25 to 34 Year Olds | 60 (59.4%) | 41 (40.6%) |
| 35 Years and over | 157 (39.5%) | 241 (60.6%) |
| Total | 3,934 (79.4%) | 1,021 (20.6%) |
Educational Attainment by Field of Study in Murrysville
Business (1,668 | 17.9%), engineering (1,524 | 16.3%), education (1,189 | 12.7%), science & technology (1,160 | 12.4%), and computers & mathematics (768 | 8.2%) are the most common fields of study among 9,334 individuals in Murrysville who have obtained a bachelor's degree or higher.
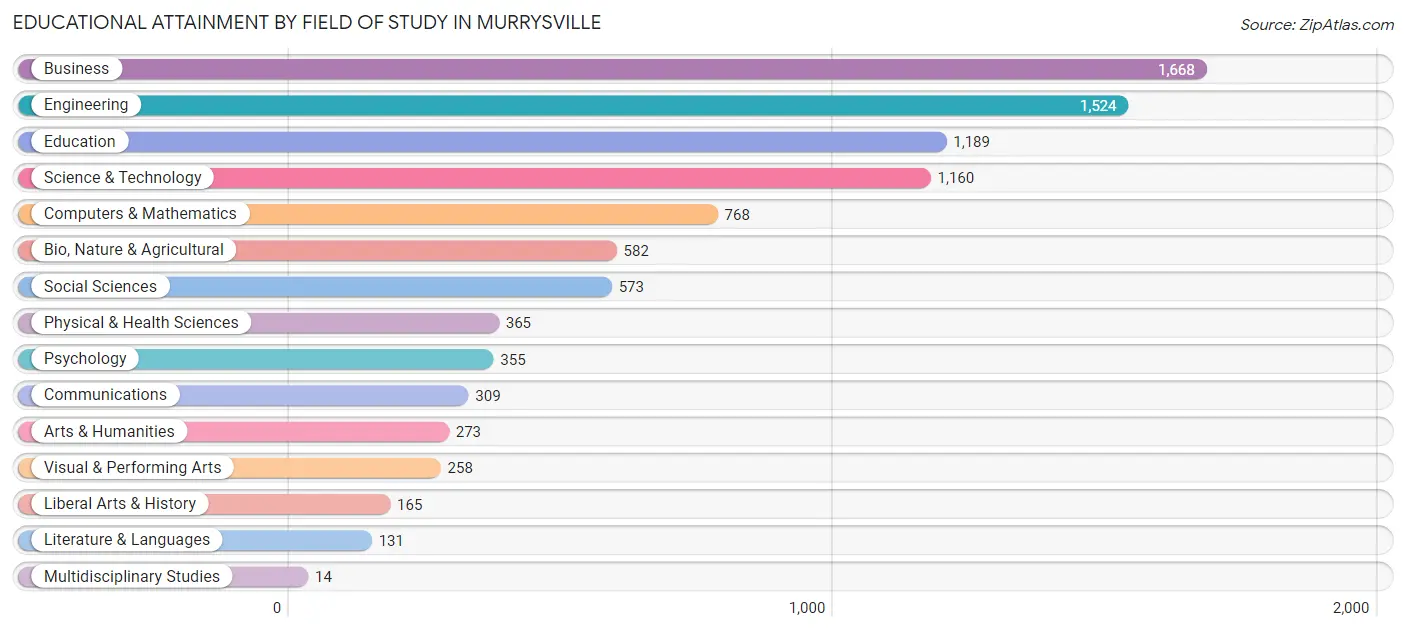
| Field of Study | # Graduates | % Graduates |
| Computers & Mathematics | 768 | 8.2% |
| Bio, Nature & Agricultural | 582 | 6.2% |
| Physical & Health Sciences | 365 | 3.9% |
| Psychology | 355 | 3.8% |
| Social Sciences | 573 | 6.1% |
| Engineering | 1,524 | 16.3% |
| Multidisciplinary Studies | 14 | 0.2% |
| Science & Technology | 1,160 | 12.4% |
| Business | 1,668 | 17.9% |
| Education | 1,189 | 12.7% |
| Literature & Languages | 131 | 1.4% |
| Liberal Arts & History | 165 | 1.8% |
| Visual & Performing Arts | 258 | 2.8% |
| Communications | 309 | 3.3% |
| Arts & Humanities | 273 | 2.9% |
| Total | 9,334 | 100.0% |
Transportation & Commute in Murrysville
Vehicle Availability by Sex in Murrysville
The most prevalent vehicle ownership categories in Murrysville are males with 2 vehicles (2,804, accounting for 52.0%) and females with 2 vehicles (2,253, making up 61.4%).
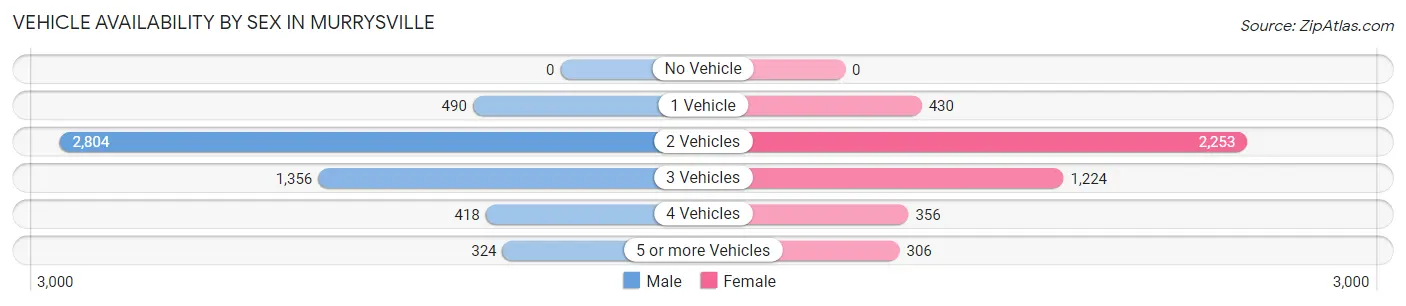
| Vehicles Available | Male | Female |
| No Vehicle | 0 (0.0%) | 0 (0.0%) |
| 1 Vehicle | 490 (9.1%) | 430 (9.4%) |
| 2 Vehicles | 2,804 (52.0%) | 2,253 (49.3%) |
| 3 Vehicles | 1,356 (25.2%) | 1,224 (26.8%) |
| 4 Vehicles | 418 (7.7%) | 356 (7.8%) |
| 5 or more Vehicles | 324 (6.0%) | 306 (6.7%) |
| Total | 5,392 (100.0%) | 4,569 (100.0%) |
Commute Time in Murrysville
The most frequently occuring commute durations in Murrysville are 15 to 19 minutes (1,208 commuters, 16.6%), 30 to 34 minutes (1,084 commuters, 14.8%), and 20 to 24 minutes (884 commuters, 12.1%).
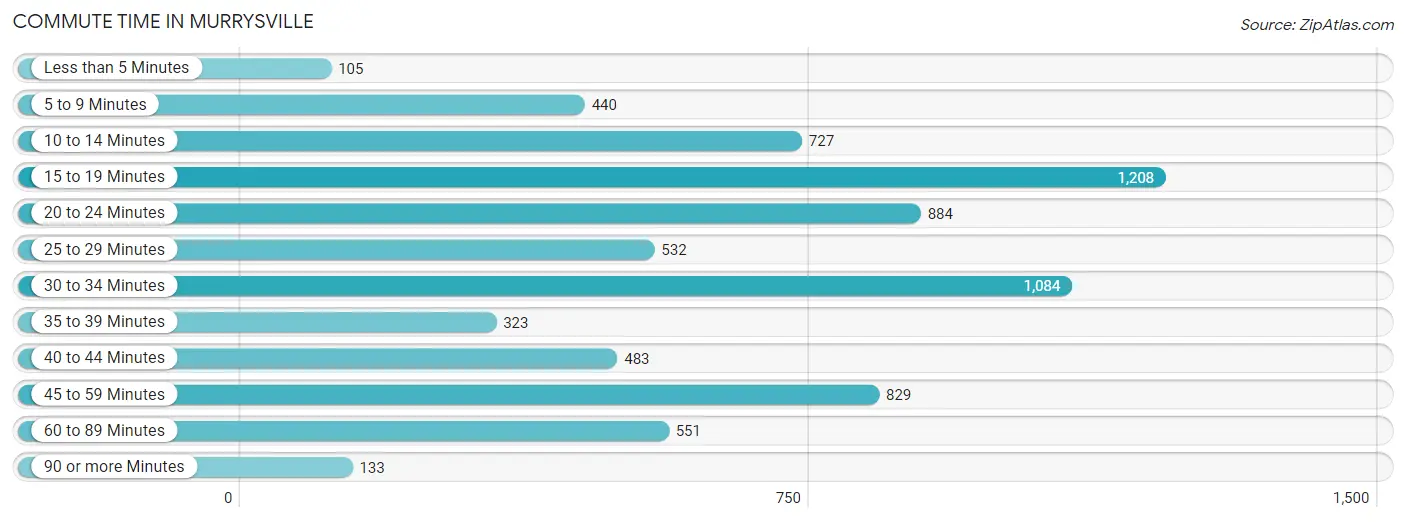
| Commute Time | # Commuters | % Commuters |
| Less than 5 Minutes | 105 | 1.4% |
| 5 to 9 Minutes | 440 | 6.0% |
| 10 to 14 Minutes | 727 | 10.0% |
| 15 to 19 Minutes | 1,208 | 16.6% |
| 20 to 24 Minutes | 884 | 12.1% |
| 25 to 29 Minutes | 532 | 7.3% |
| 30 to 34 Minutes | 1,084 | 14.8% |
| 35 to 39 Minutes | 323 | 4.4% |
| 40 to 44 Minutes | 483 | 6.6% |
| 45 to 59 Minutes | 829 | 11.4% |
| 60 to 89 Minutes | 551 | 7.5% |
| 90 or more Minutes | 133 | 1.8% |
Commute Time by Sex in Murrysville
The most common commute times in Murrysville are 30 to 34 minutes (733 commuters, 18.6%) for males and 20 to 24 minutes (522 commuters, 15.5%) for females.

| Commute Time | Male | Female |
| Less than 5 Minutes | 78 (2.0%) | 27 (0.8%) |
| 5 to 9 Minutes | 111 (2.8%) | 329 (9.8%) |
| 10 to 14 Minutes | 307 (7.8%) | 420 (12.5%) |
| 15 to 19 Minutes | 714 (18.1%) | 494 (14.7%) |
| 20 to 24 Minutes | 362 (9.2%) | 522 (15.5%) |
| 25 to 29 Minutes | 307 (7.8%) | 225 (6.7%) |
| 30 to 34 Minutes | 733 (18.6%) | 351 (10.4%) |
| 35 to 39 Minutes | 248 (6.3%) | 75 (2.2%) |
| 40 to 44 Minutes | 311 (7.9%) | 172 (5.1%) |
| 45 to 59 Minutes | 418 (10.6%) | 411 (12.2%) |
| 60 to 89 Minutes | 328 (8.3%) | 223 (6.6%) |
| 90 or more Minutes | 19 (0.5%) | 114 (3.4%) |
Time of Departure to Work by Sex in Murrysville
The most frequent times of departure to work in Murrysville are 7:00 AM to 7:29 AM (882, 22.4%) for males and 7:00 AM to 7:29 AM (546, 16.2%) for females.
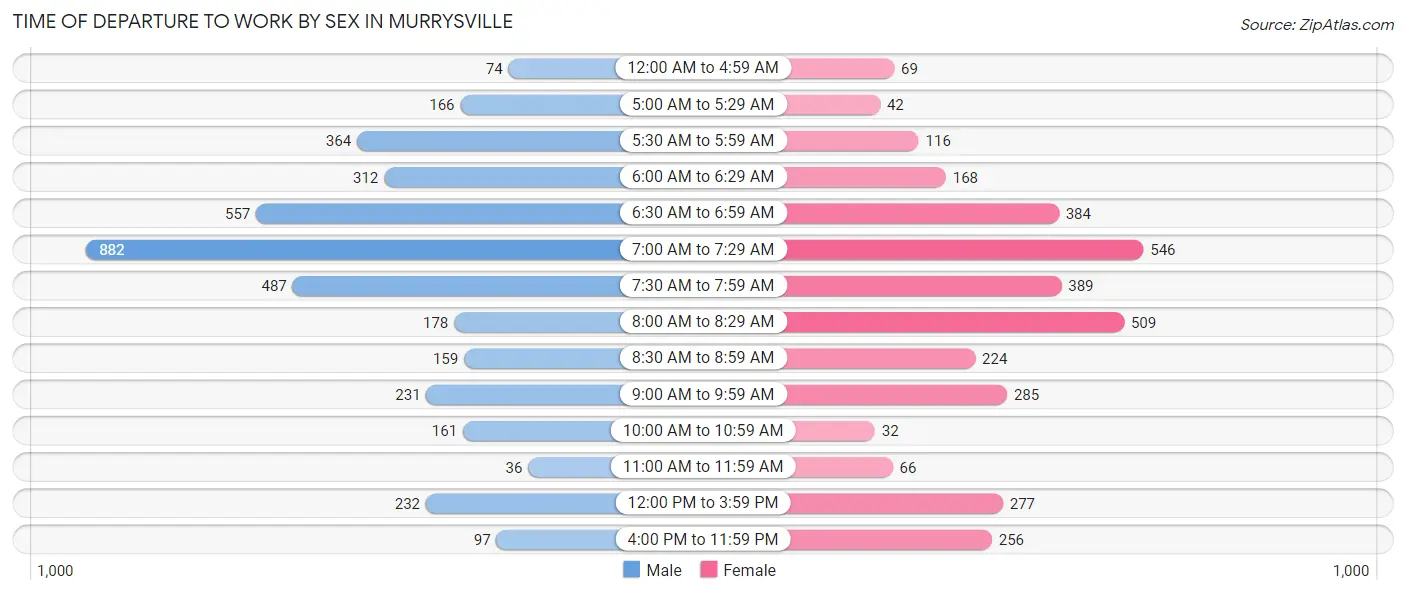
| Time of Departure | Male | Female |
| 12:00 AM to 4:59 AM | 74 (1.9%) | 69 (2.1%) |
| 5:00 AM to 5:29 AM | 166 (4.2%) | 42 (1.3%) |
| 5:30 AM to 5:59 AM | 364 (9.2%) | 116 (3.5%) |
| 6:00 AM to 6:29 AM | 312 (7.9%) | 168 (5.0%) |
| 6:30 AM to 6:59 AM | 557 (14.1%) | 384 (11.4%) |
| 7:00 AM to 7:29 AM | 882 (22.4%) | 546 (16.2%) |
| 7:30 AM to 7:59 AM | 487 (12.4%) | 389 (11.6%) |
| 8:00 AM to 8:29 AM | 178 (4.5%) | 509 (15.1%) |
| 8:30 AM to 8:59 AM | 159 (4.0%) | 224 (6.7%) |
| 9:00 AM to 9:59 AM | 231 (5.9%) | 285 (8.5%) |
| 10:00 AM to 10:59 AM | 161 (4.1%) | 32 (0.9%) |
| 11:00 AM to 11:59 AM | 36 (0.9%) | 66 (2.0%) |
| 12:00 PM to 3:59 PM | 232 (5.9%) | 277 (8.2%) |
| 4:00 PM to 11:59 PM | 97 (2.5%) | 256 (7.6%) |
| Total | 3,936 (100.0%) | 3,363 (100.0%) |
Housing Occupancy in Murrysville
Occupancy by Ownership in Murrysville
Of the total 8,182 dwellings in Murrysville, owner-occupied units account for 7,358 (89.9%), while renter-occupied units make up 824 (10.1%).
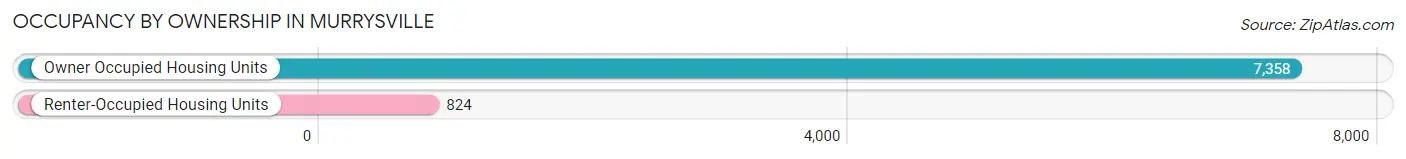
| Occupancy | # Housing Units | % Housing Units |
| Owner Occupied Housing Units | 7,358 | 89.9% |
| Renter-Occupied Housing Units | 824 | 10.1% |
| Total Occupied Housing Units | 8,182 | 100.0% |
Occupancy by Household Size in Murrysville
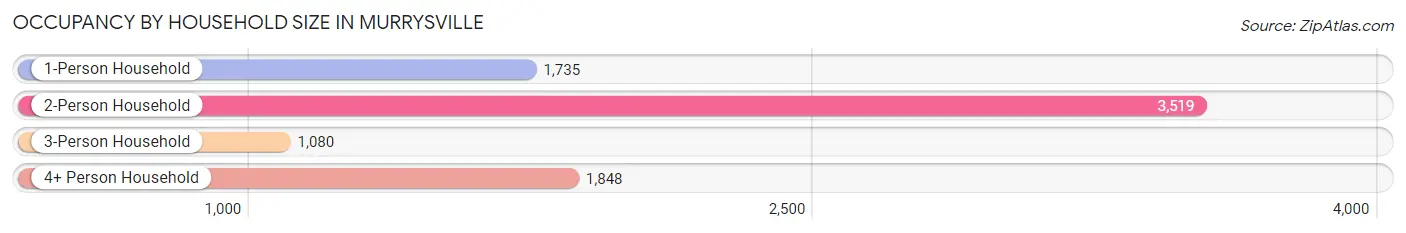
| Household Size | # Housing Units | % Housing Units |
| 1-Person Household | 1,735 | 21.2% |
| 2-Person Household | 3,519 | 43.0% |
| 3-Person Household | 1,080 | 13.2% |
| 4+ Person Household | 1,848 | 22.6% |
| Total Housing Units | 8,182 | 100.0% |
Occupancy by Ownership by Household Size in Murrysville
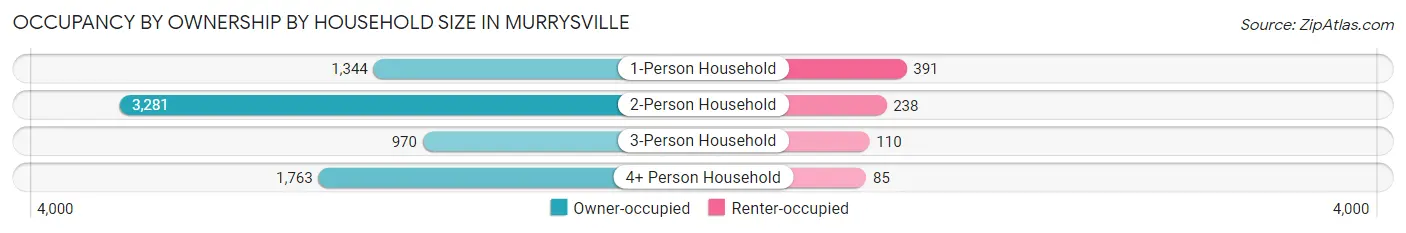
| Household Size | Owner-occupied | Renter-occupied |
| 1-Person Household | 1,344 (77.5%) | 391 (22.5%) |
| 2-Person Household | 3,281 (93.2%) | 238 (6.8%) |
| 3-Person Household | 970 (89.8%) | 110 (10.2%) |
| 4+ Person Household | 1,763 (95.4%) | 85 (4.6%) |
| Total Housing Units | 7,358 (89.9%) | 824 (10.1%) |
Occupancy by Educational Attainment in Murrysville
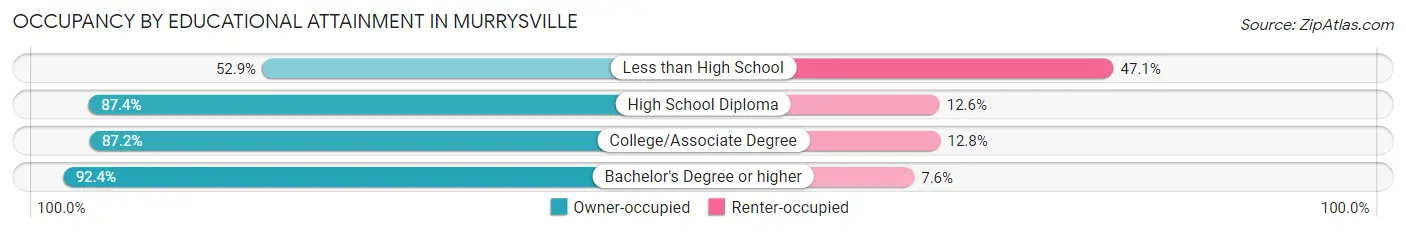
| Household Size | Owner-occupied | Renter-occupied |
| Less than High School | 63 (52.9%) | 56 (47.1%) |
| High School Diploma | 1,170 (87.4%) | 169 (12.6%) |
| College/Associate Degree | 1,517 (87.2%) | 222 (12.8%) |
| Bachelor's Degree or higher | 4,608 (92.4%) | 377 (7.6%) |
Occupancy by Age of Householder in Murrysville
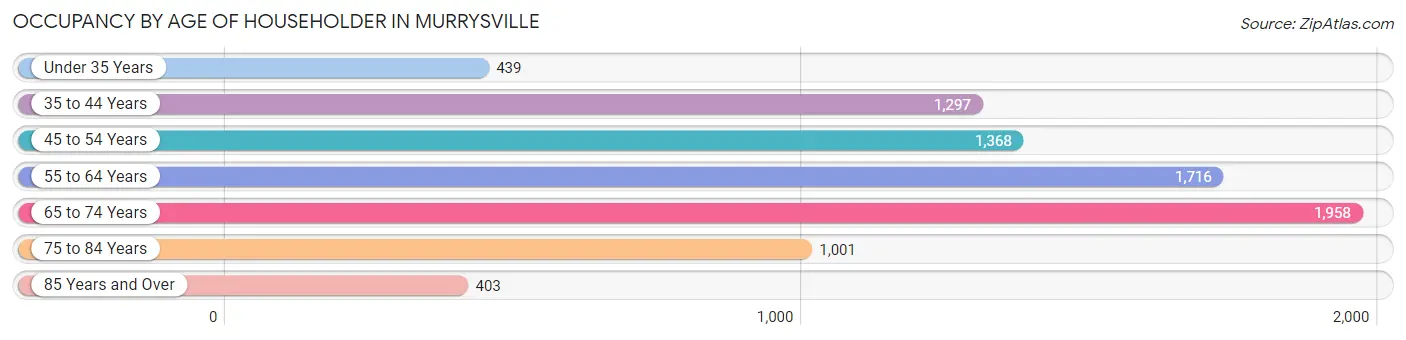
| Age Bracket | # Households | % Households |
| Under 35 Years | 439 | 5.4% |
| 35 to 44 Years | 1,297 | 15.9% |
| 45 to 54 Years | 1,368 | 16.7% |
| 55 to 64 Years | 1,716 | 21.0% |
| 65 to 74 Years | 1,958 | 23.9% |
| 75 to 84 Years | 1,001 | 12.2% |
| 85 Years and Over | 403 | 4.9% |
| Total | 8,182 | 100.0% |
Housing Finances in Murrysville
Median Income by Occupancy in Murrysville
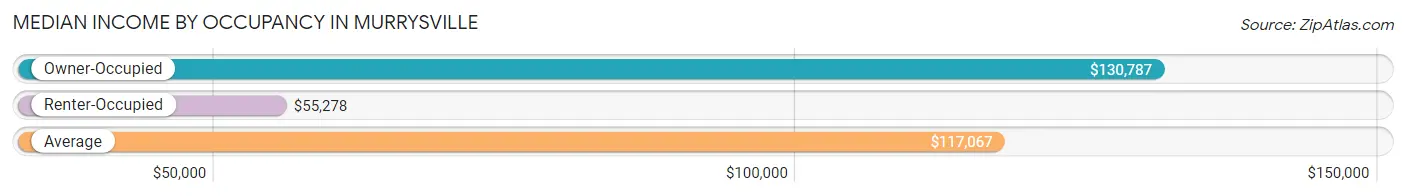
| Occupancy Type | # Households | Median Income |
| Owner-Occupied | 7,358 (89.9%) | $130,787 |
| Renter-Occupied | 824 (10.1%) | $55,278 |
| Average | 8,182 (100.0%) | $117,067 |
Occupancy by Householder Income Bracket in Murrysville
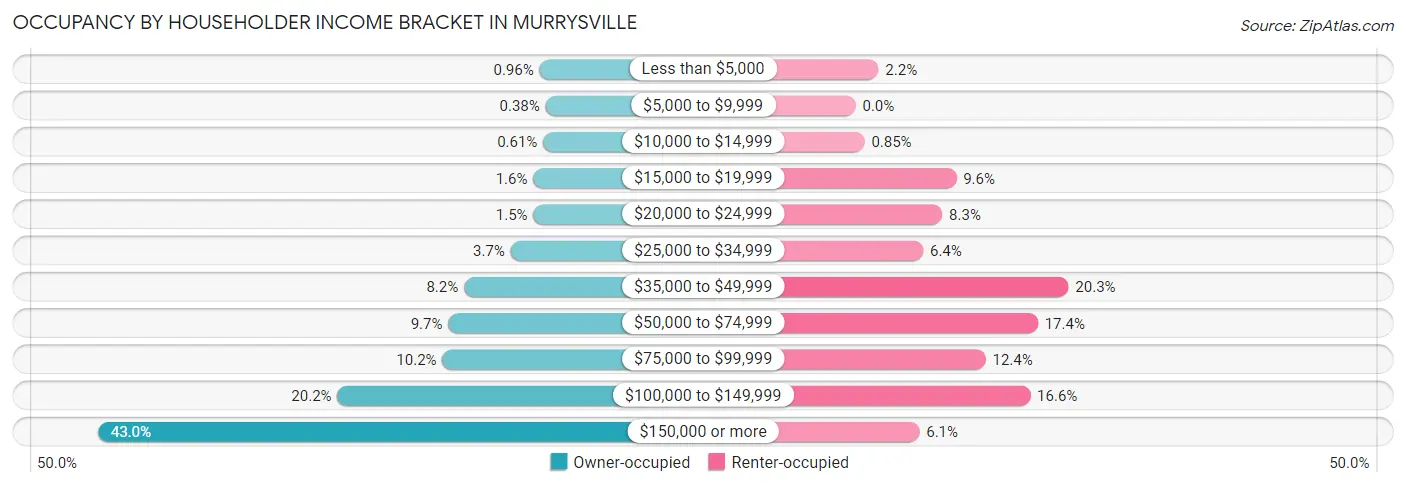
| Income Bracket | Owner-occupied | Renter-occupied |
| Less than $5,000 | 71 (1.0%) | 18 (2.2%) |
| $5,000 to $9,999 | 28 (0.4%) | 0 (0.0%) |
| $10,000 to $14,999 | 45 (0.6%) | 7 (0.9%) |
| $15,000 to $19,999 | 114 (1.5%) | 79 (9.6%) |
| $20,000 to $24,999 | 113 (1.5%) | 68 (8.3%) |
| $25,000 to $34,999 | 273 (3.7%) | 53 (6.4%) |
| $35,000 to $49,999 | 600 (8.2%) | 167 (20.3%) |
| $50,000 to $74,999 | 710 (9.7%) | 143 (17.3%) |
| $75,000 to $99,999 | 751 (10.2%) | 102 (12.4%) |
| $100,000 to $149,999 | 1,487 (20.2%) | 137 (16.6%) |
| $150,000 or more | 3,166 (43.0%) | 50 (6.1%) |
| Total | 7,358 (100.0%) | 824 (100.0%) |
Monthly Housing Cost Tiers in Murrysville
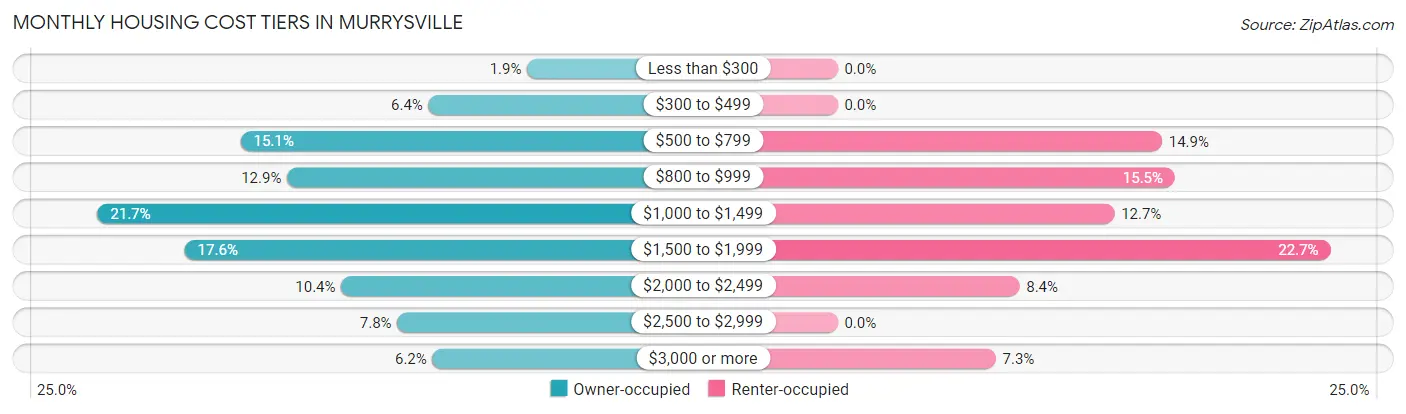
| Monthly Cost | Owner-occupied | Renter-occupied |
| Less than $300 | 137 (1.9%) | 0 (0.0%) |
| $300 to $499 | 471 (6.4%) | 0 (0.0%) |
| $500 to $799 | 1,108 (15.1%) | 123 (14.9%) |
| $800 to $999 | 950 (12.9%) | 128 (15.5%) |
| $1,000 to $1,499 | 1,593 (21.6%) | 105 (12.7%) |
| $1,500 to $1,999 | 1,297 (17.6%) | 187 (22.7%) |
| $2,000 to $2,499 | 767 (10.4%) | 69 (8.4%) |
| $2,500 to $2,999 | 577 (7.8%) | 0 (0.0%) |
| $3,000 or more | 458 (6.2%) | 60 (7.3%) |
| Total | 7,358 (100.0%) | 824 (100.0%) |
Physical Housing Characteristics in Murrysville
Housing Structures in Murrysville
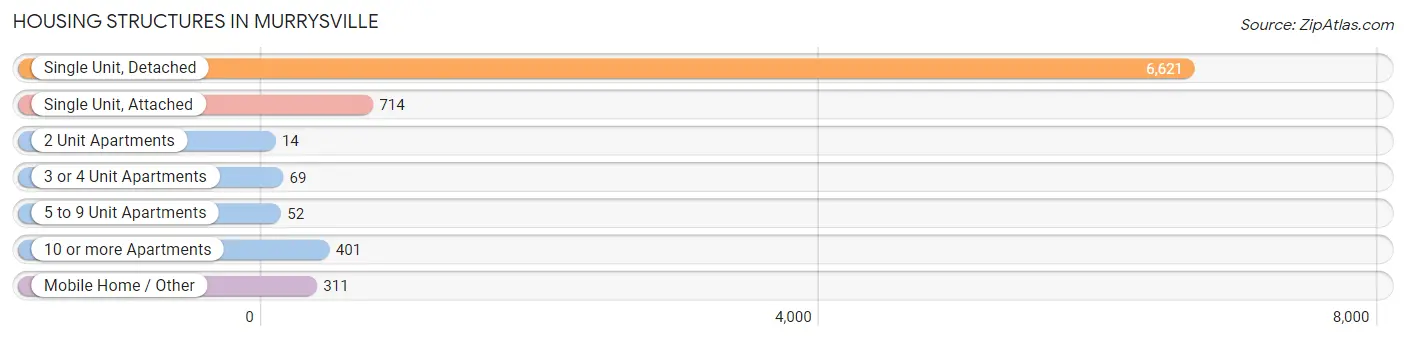
| Structure Type | # Housing Units | % Housing Units |
| Single Unit, Detached | 6,621 | 80.9% |
| Single Unit, Attached | 714 | 8.7% |
| 2 Unit Apartments | 14 | 0.2% |
| 3 or 4 Unit Apartments | 69 | 0.8% |
| 5 to 9 Unit Apartments | 52 | 0.6% |
| 10 or more Apartments | 401 | 4.9% |
| Mobile Home / Other | 311 | 3.8% |
| Total | 8,182 | 100.0% |
Housing Structures by Occupancy in Murrysville
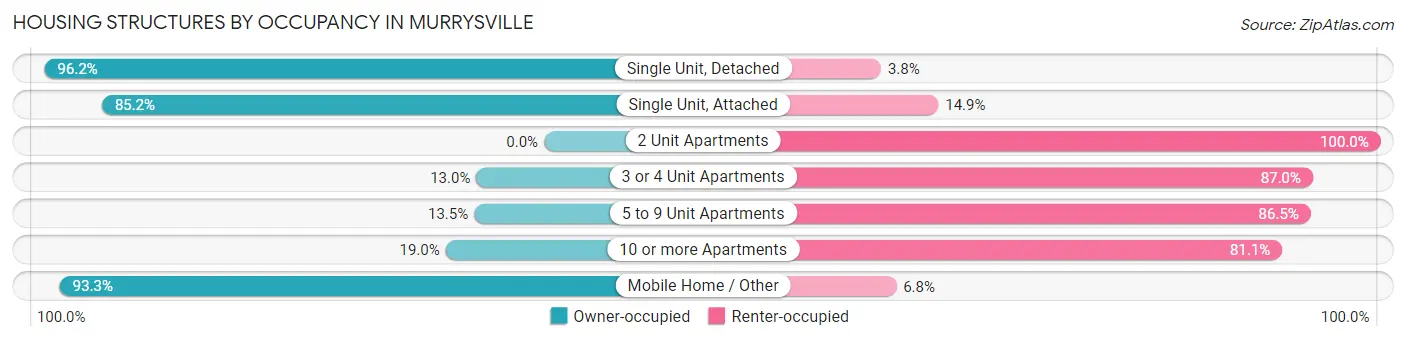
| Structure Type | Owner-occupied | Renter-occupied |
| Single Unit, Detached | 6,368 (96.2%) | 253 (3.8%) |
| Single Unit, Attached | 608 (85.2%) | 106 (14.8%) |
| 2 Unit Apartments | 0 (0.0%) | 14 (100.0%) |
| 3 or 4 Unit Apartments | 9 (13.0%) | 60 (87.0%) |
| 5 to 9 Unit Apartments | 7 (13.5%) | 45 (86.5%) |
| 10 or more Apartments | 76 (19.0%) | 325 (81.0%) |
| Mobile Home / Other | 290 (93.2%) | 21 (6.8%) |
| Total | 7,358 (89.9%) | 824 (10.1%) |
Housing Structures by Number of Rooms in Murrysville
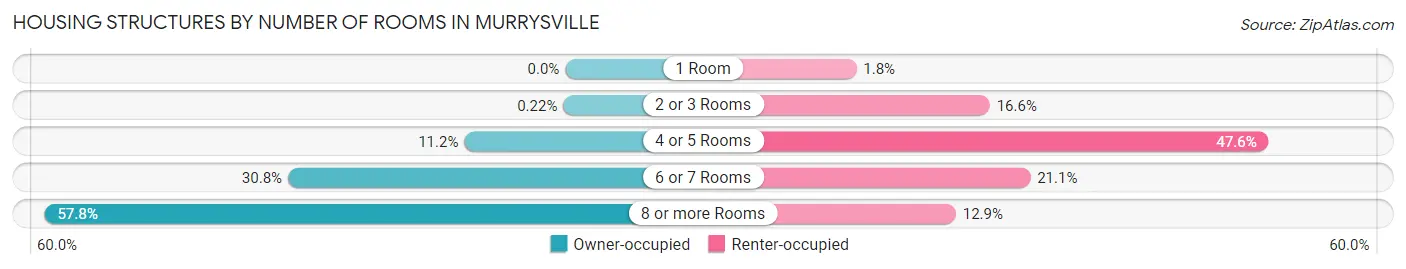
| Number of Rooms | Owner-occupied | Renter-occupied |
| 1 Room | 0 (0.0%) | 15 (1.8%) |
| 2 or 3 Rooms | 16 (0.2%) | 137 (16.6%) |
| 4 or 5 Rooms | 825 (11.2%) | 392 (47.6%) |
| 6 or 7 Rooms | 2,265 (30.8%) | 174 (21.1%) |
| 8 or more Rooms | 4,252 (57.8%) | 106 (12.9%) |
| Total | 7,358 (100.0%) | 824 (100.0%) |
Housing Structure by Heating Type in Murrysville
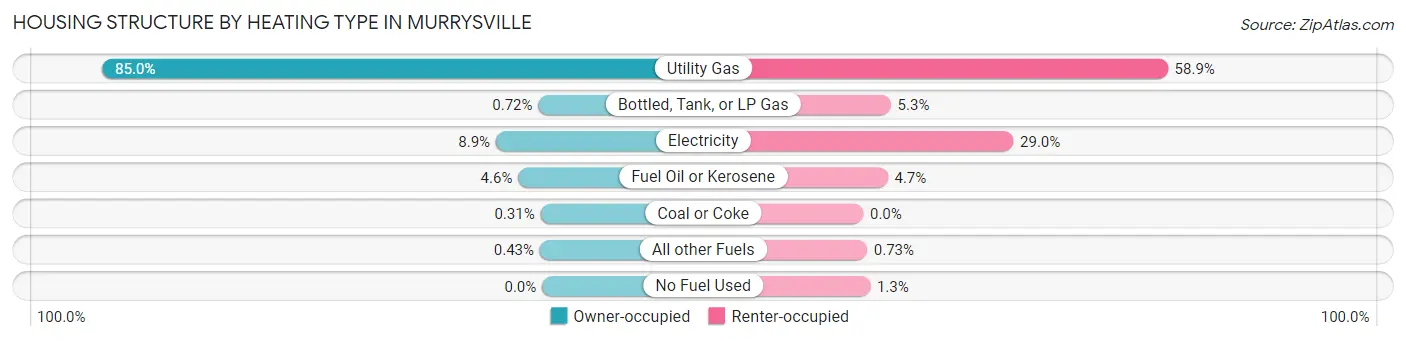
| Heating Type | Owner-occupied | Renter-occupied |
| Utility Gas | 6,255 (85.0%) | 485 (58.9%) |
| Bottled, Tank, or LP Gas | 53 (0.7%) | 44 (5.3%) |
| Electricity | 656 (8.9%) | 239 (29.0%) |
| Fuel Oil or Kerosene | 339 (4.6%) | 39 (4.7%) |
| Coal or Coke | 23 (0.3%) | 0 (0.0%) |
| All other Fuels | 32 (0.4%) | 6 (0.7%) |
| No Fuel Used | 0 (0.0%) | 11 (1.3%) |
| Total | 7,358 (100.0%) | 824 (100.0%) |
Household Vehicle Usage in Murrysville
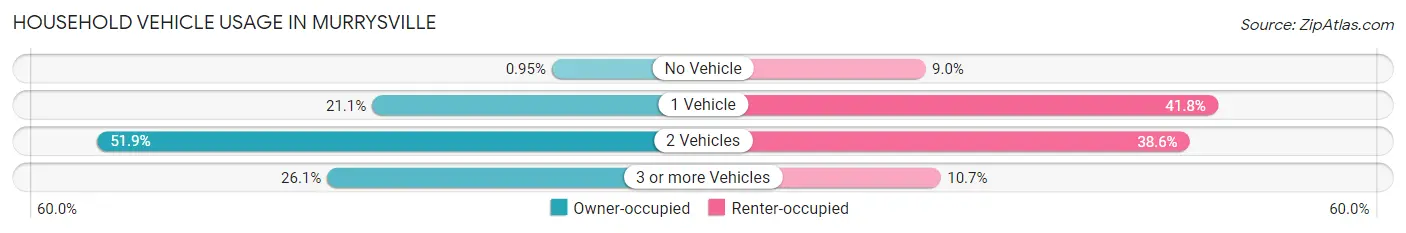
| Vehicles per Household | Owner-occupied | Renter-occupied |
| No Vehicle | 70 (0.9%) | 74 (9.0%) |
| 1 Vehicle | 1,551 (21.1%) | 344 (41.7%) |
| 2 Vehicles | 3,816 (51.9%) | 318 (38.6%) |
| 3 or more Vehicles | 1,921 (26.1%) | 88 (10.7%) |
| Total | 7,358 (100.0%) | 824 (100.0%) |
Real Estate & Mortgages in Murrysville
Real Estate and Mortgage Overview in Murrysville
| Characteristic | Without Mortgage | With Mortgage |
| Housing Units | 3,412 | 3,946 |
| Median Property Value | $289,600 | $301,800 |
| Median Household Income | $105,761 | $1,934 |
| Monthly Housing Costs | $822 | $458 |
| Real Estate Taxes | $4,820 | $20 |
Property Value by Mortgage Status in Murrysville
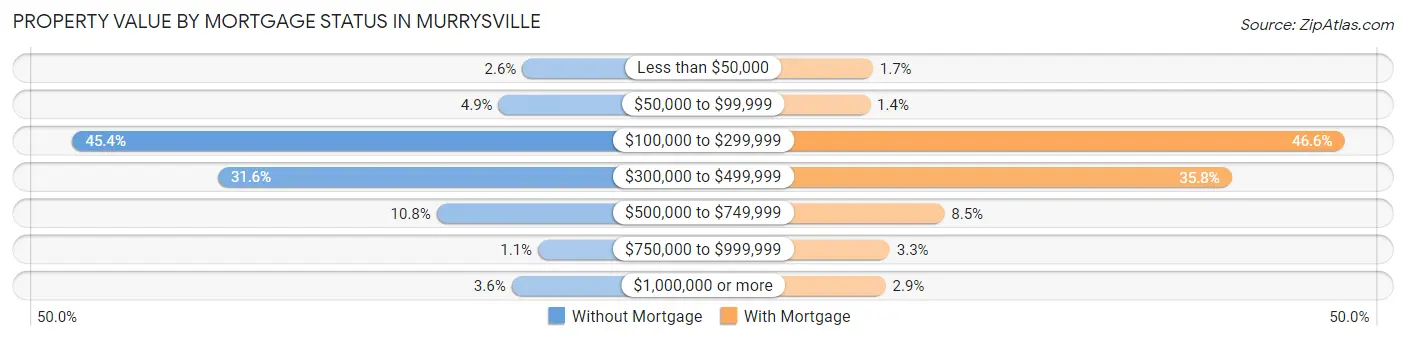
| Property Value | Without Mortgage | With Mortgage |
| Less than $50,000 | 89 (2.6%) | 65 (1.7%) |
| $50,000 to $99,999 | 166 (4.9%) | 55 (1.4%) |
| $100,000 to $299,999 | 1,550 (45.4%) | 1,837 (46.6%) |
| $300,000 to $499,999 | 1,078 (31.6%) | 1,413 (35.8%) |
| $500,000 to $749,999 | 367 (10.8%) | 334 (8.5%) |
| $750,000 to $999,999 | 38 (1.1%) | 129 (3.3%) |
| $1,000,000 or more | 124 (3.6%) | 113 (2.9%) |
| Total | 3,412 (100.0%) | 3,946 (100.0%) |
Household Income by Mortgage Status in Murrysville
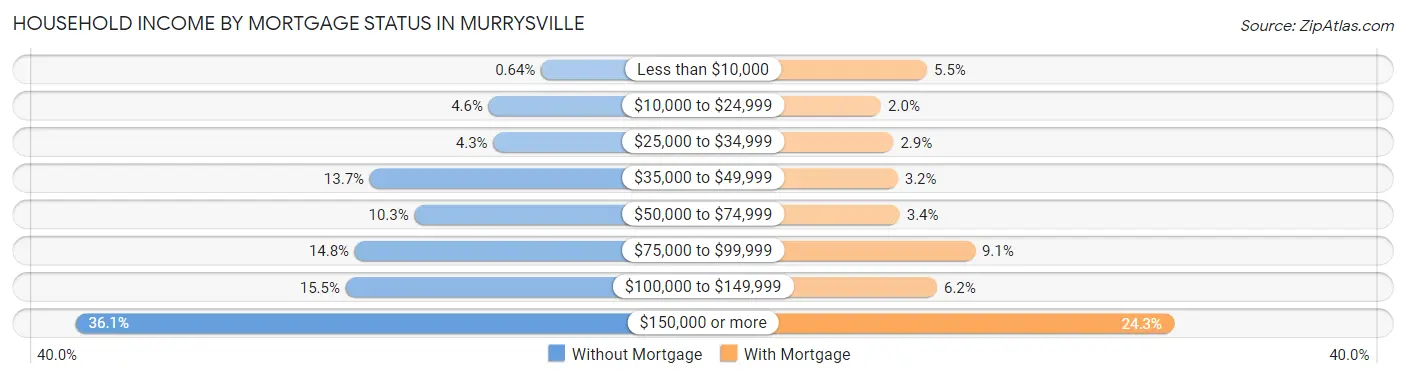
| Household Income | Without Mortgage | With Mortgage |
| Less than $10,000 | 22 (0.6%) | 215 (5.4%) |
| $10,000 to $24,999 | 158 (4.6%) | 77 (1.9%) |
| $25,000 to $34,999 | 146 (4.3%) | 114 (2.9%) |
| $35,000 to $49,999 | 467 (13.7%) | 127 (3.2%) |
| $50,000 to $74,999 | 351 (10.3%) | 133 (3.4%) |
| $75,000 to $99,999 | 506 (14.8%) | 359 (9.1%) |
| $100,000 to $149,999 | 530 (15.5%) | 245 (6.2%) |
| $150,000 or more | 1,232 (36.1%) | 957 (24.2%) |
| Total | 3,412 (100.0%) | 3,946 (100.0%) |
Property Value to Household Income Ratio in Murrysville
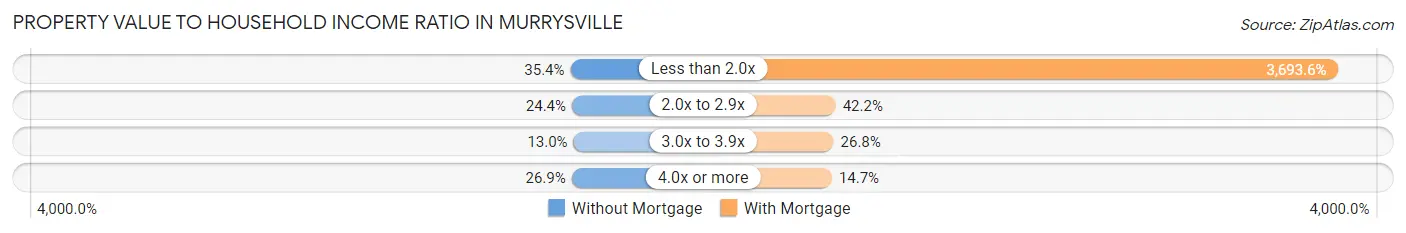
| Value-to-Income Ratio | Without Mortgage | With Mortgage |
| Less than 2.0x | 1,207 (35.4%) | 145,750 (3,693.6%) |
| 2.0x to 2.9x | 833 (24.4%) | 1,664 (42.2%) |
| 3.0x to 3.9x | 444 (13.0%) | 1,059 (26.8%) |
| 4.0x or more | 917 (26.9%) | 578 (14.6%) |
| Total | 3,412 (100.0%) | 3,946 (100.0%) |
Real Estate Taxes by Mortgage Status in Murrysville
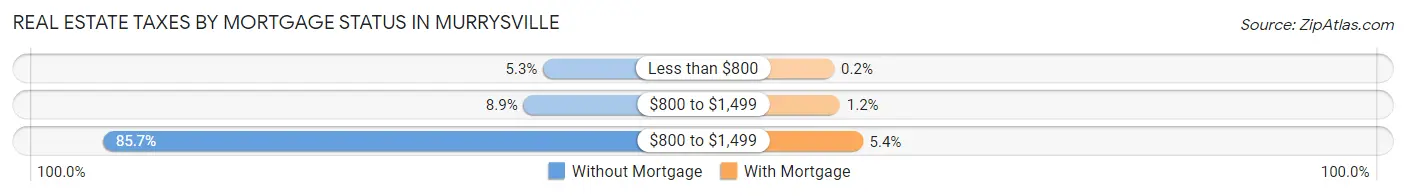
| Property Taxes | Without Mortgage | With Mortgage |
| Less than $800 | 180 (5.3%) | 8 (0.2%) |
| $800 to $1,499 | 303 (8.9%) | 49 (1.2%) |
| $800 to $1,499 | 2,924 (85.7%) | 213 (5.4%) |
| Total | 3,412 (100.0%) | 3,946 (100.0%) |
Health & Disability in Murrysville
Health Insurance Coverage by Age in Murrysville
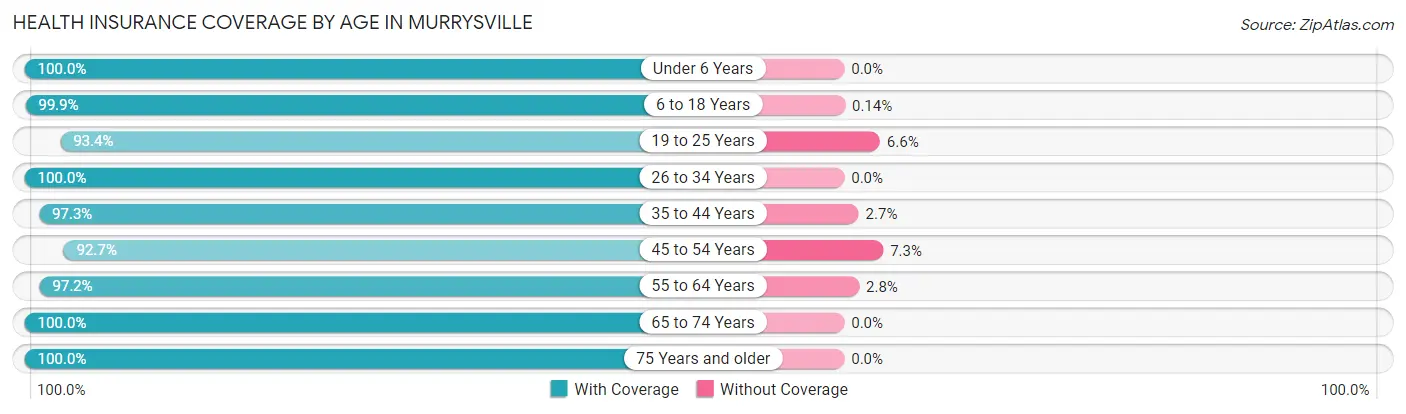
| Age Bracket | With Coverage | Without Coverage |
| Under 6 Years | 1,026 (100.0%) | 0 (0.0%) |
| 6 to 18 Years | 3,476 (99.9%) | 5 (0.1%) |
| 19 to 25 Years | 829 (93.4%) | 59 (6.6%) |
| 26 to 34 Years | 1,305 (100.0%) | 0 (0.0%) |
| 35 to 44 Years | 2,437 (97.3%) | 67 (2.7%) |
| 45 to 54 Years | 2,275 (92.7%) | 178 (7.3%) |
| 55 to 64 Years | 3,133 (97.2%) | 89 (2.8%) |
| 65 to 74 Years | 3,397 (100.0%) | 0 (0.0%) |
| 75 Years and older | 2,415 (100.0%) | 0 (0.0%) |
| Total | 20,293 (98.1%) | 398 (1.9%) |
Health Insurance Coverage by Citizenship Status in Murrysville
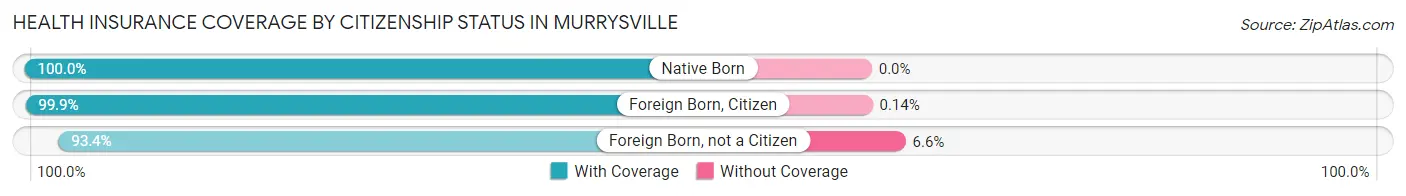
| Citizenship Status | With Coverage | Without Coverage |
| Native Born | 1,026 (100.0%) | 0 (0.0%) |
| Foreign Born, Citizen | 3,476 (99.9%) | 5 (0.1%) |
| Foreign Born, not a Citizen | 829 (93.4%) | 59 (6.6%) |
Health Insurance Coverage by Household Income in Murrysville
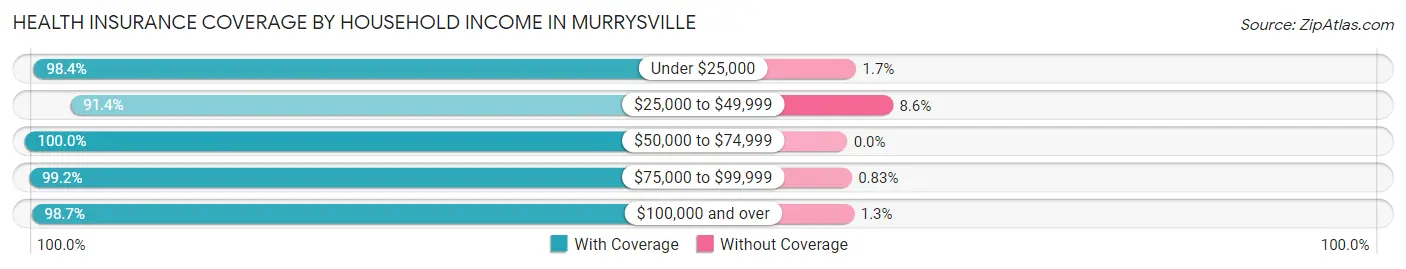
| Household Income | With Coverage | Without Coverage |
| Under $25,000 | 832 (98.4%) | 14 (1.7%) |
| $25,000 to $49,999 | 1,645 (91.4%) | 154 (8.6%) |
| $50,000 to $74,999 | 1,551 (100.0%) | 0 (0.0%) |
| $75,000 to $99,999 | 1,667 (99.2%) | 14 (0.8%) |
| $100,000 and over | 14,495 (98.7%) | 192 (1.3%) |
Public vs Private Health Insurance Coverage by Age in Murrysville
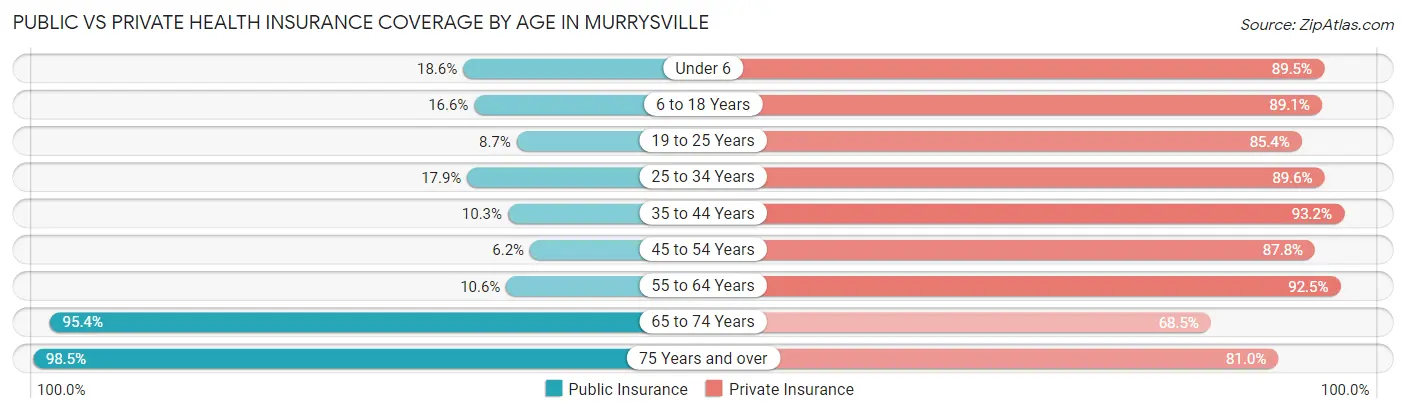
| Age Bracket | Public Insurance | Private Insurance |
| Under 6 | 191 (18.6%) | 918 (89.5%) |
| 6 to 18 Years | 576 (16.6%) | 3,100 (89.0%) |
| 19 to 25 Years | 77 (8.7%) | 758 (85.4%) |
| 25 to 34 Years | 233 (17.8%) | 1,169 (89.6%) |
| 35 to 44 Years | 258 (10.3%) | 2,333 (93.2%) |
| 45 to 54 Years | 152 (6.2%) | 2,154 (87.8%) |
| 55 to 64 Years | 342 (10.6%) | 2,981 (92.5%) |
| 65 to 74 Years | 3,239 (95.4%) | 2,326 (68.5%) |
| 75 Years and over | 2,378 (98.5%) | 1,956 (81.0%) |
| Total | 7,446 (36.0%) | 17,695 (85.5%) |
Disability Status by Sex by Age in Murrysville
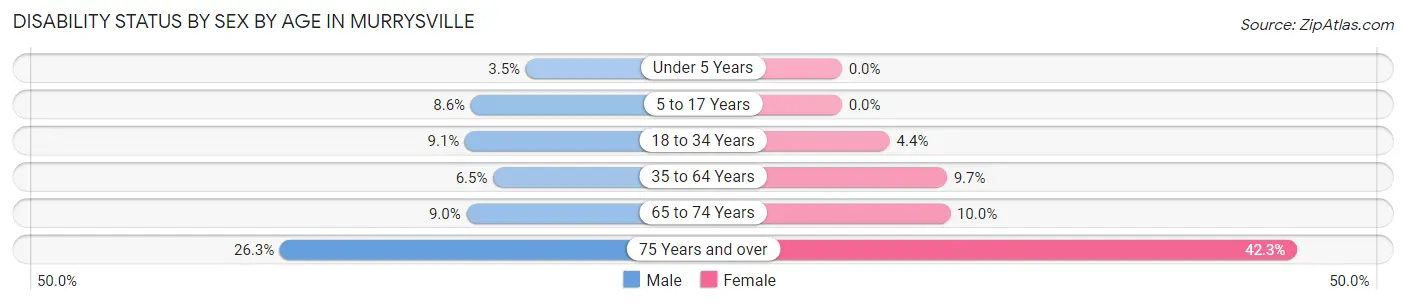
| Age Bracket | Male | Female |
| Under 5 Years | 15 (3.5%) | 0 (0.0%) |
| 5 to 17 Years | 167 (8.6%) | 0 (0.0%) |
| 18 to 34 Years | 114 (9.1%) | 54 (4.4%) |
| 35 to 64 Years | 254 (6.5%) | 416 (9.7%) |
| 65 to 74 Years | 162 (9.0%) | 160 (10.0%) |
| 75 Years and over | 276 (26.3%) | 577 (42.3%) |
Disability Class by Sex by Age in Murrysville
Disability Class: Hearing Difficulty
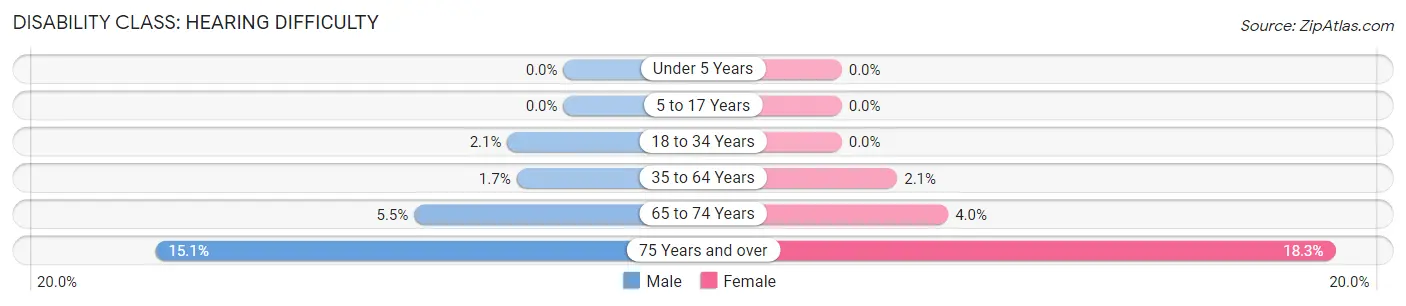
| Age Bracket | Male | Female |
| Under 5 Years | 0 (0.0%) | 0 (0.0%) |
| 5 to 17 Years | 0 (0.0%) | 0 (0.0%) |
| 18 to 34 Years | 26 (2.1%) | 0 (0.0%) |
| 35 to 64 Years | 68 (1.7%) | 88 (2.1%) |
| 65 to 74 Years | 100 (5.5%) | 63 (4.0%) |
| 75 Years and over | 159 (15.1%) | 250 (18.3%) |
Disability Class: Vision Difficulty
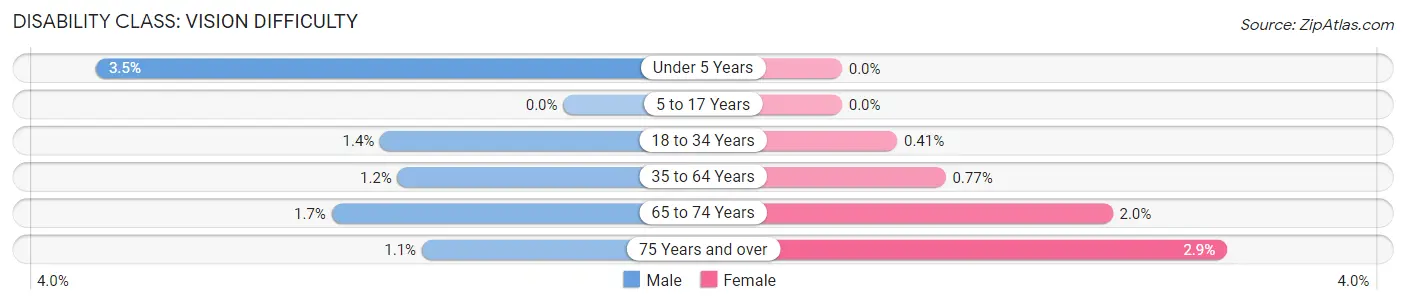
| Age Bracket | Male | Female |
| Under 5 Years | 15 (3.5%) | 0 (0.0%) |
| 5 to 17 Years | 0 (0.0%) | 0 (0.0%) |
| 18 to 34 Years | 17 (1.4%) | 5 (0.4%) |
| 35 to 64 Years | 48 (1.2%) | 33 (0.8%) |
| 65 to 74 Years | 31 (1.7%) | 32 (2.0%) |
| 75 Years and over | 11 (1.1%) | 39 (2.9%) |
Disability Class: Cognitive Difficulty
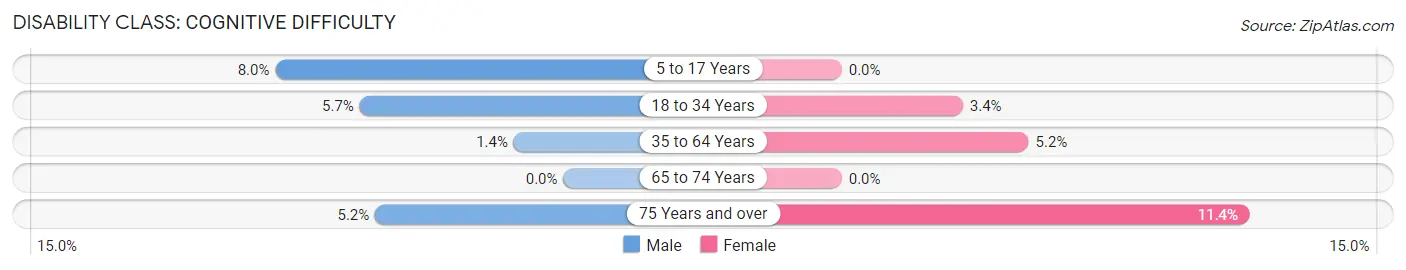
| Age Bracket | Male | Female |
| 5 to 17 Years | 156 (8.0%) | 0 (0.0%) |
| 18 to 34 Years | 71 (5.7%) | 41 (3.4%) |
| 35 to 64 Years | 54 (1.4%) | 222 (5.2%) |
| 65 to 74 Years | 0 (0.0%) | 0 (0.0%) |
| 75 Years and over | 55 (5.2%) | 155 (11.4%) |
Disability Class: Ambulatory Difficulty
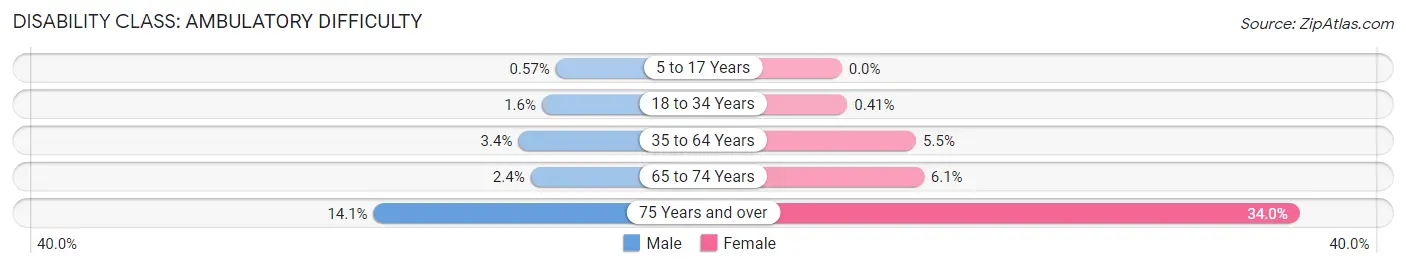
| Age Bracket | Male | Female |
| 5 to 17 Years | 11 (0.6%) | 0 (0.0%) |
| 18 to 34 Years | 20 (1.6%) | 5 (0.4%) |
| 35 to 64 Years | 131 (3.4%) | 236 (5.5%) |
| 65 to 74 Years | 44 (2.4%) | 97 (6.1%) |
| 75 Years and over | 148 (14.1%) | 464 (34.0%) |
Disability Class: Self-Care Difficulty
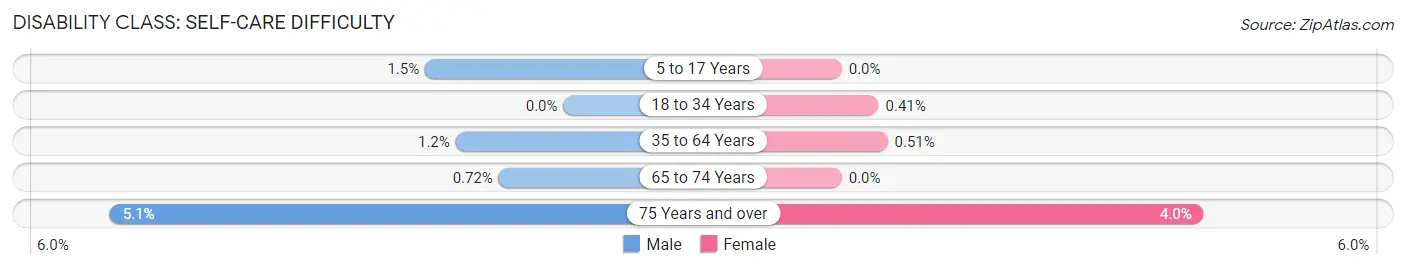
| Age Bracket | Male | Female |
| 5 to 17 Years | 30 (1.5%) | 0 (0.0%) |
| 18 to 34 Years | 0 (0.0%) | 5 (0.4%) |
| 35 to 64 Years | 47 (1.2%) | 22 (0.5%) |
| 65 to 74 Years | 13 (0.7%) | 0 (0.0%) |
| 75 Years and over | 53 (5.1%) | 55 (4.0%) |
Technology Access in Murrysville
Computing Device Access in Murrysville
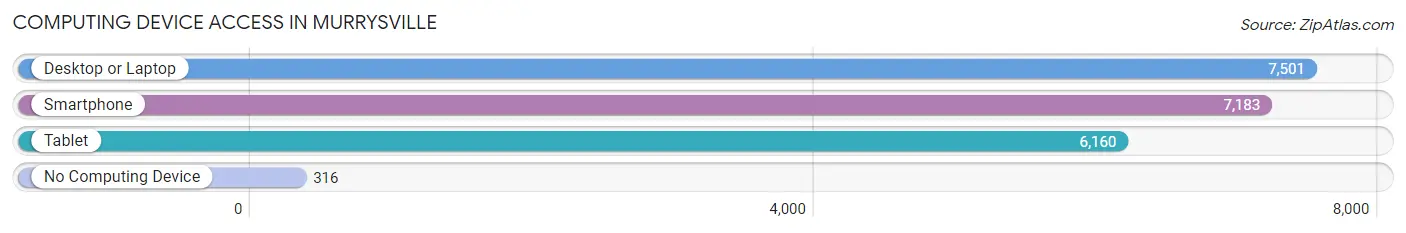
| Device Type | # Households | % Households |
| Desktop or Laptop | 7,501 | 91.7% |
| Smartphone | 7,183 | 87.8% |
| Tablet | 6,160 | 75.3% |
| No Computing Device | 316 | 3.9% |
| Total | 8,182 | 100.0% |
Internet Access in Murrysville
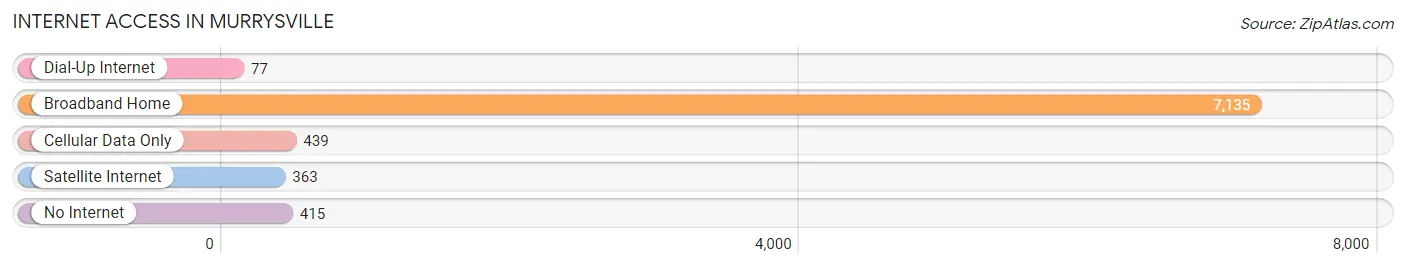
| Internet Type | # Households | % Households |
| Dial-Up Internet | 77 | 0.9% |
| Broadband Home | 7,135 | 87.2% |
| Cellular Data Only | 439 | 5.4% |
| Satellite Internet | 363 | 4.4% |
| No Internet | 415 | 5.1% |
| Total | 8,182 | 100.0% |
Murrysville Summary
Murrysville is a small town located in Westmoreland County, Pennsylvania. It is situated about 20 miles east of Pittsburgh and is part of the Pittsburgh metropolitan area. The town has a population of approximately 20,000 people and is known for its rural charm and small-town atmosphere.
History
Murrysville was founded in 1788 by John and William Murry, two brothers who had emigrated from Scotland. The town was originally known as Murrysville Crossroads, and was a small farming community. In 1845, the town was officially incorporated as Murrysville.
In the late 19th century, Murrysville began to experience rapid growth due to the development of the railroad. The railroad allowed for the transportation of goods and people to and from the town, and this led to an increase in population and economic activity.
In the early 20th century, Murrysville experienced a period of industrialization. Several factories were built in the town, including a steel mill, a glass factory, and a brickyard. This period of industrialization led to an increase in population and economic activity.
Geography
Murrysville is located in Westmoreland County, Pennsylvania. It is situated about 20 miles east of Pittsburgh and is part of the Pittsburgh metropolitan area. The town is located in the Allegheny Plateau region of Pennsylvania, and is surrounded by rolling hills and forests. The town is situated on the banks of the Loyalhanna Creek, which flows through the town.
The climate in Murrysville is classified as humid continental, with hot summers and cold winters. The average annual temperature is around 50 degrees Fahrenheit, and the average annual precipitation is around 40 inches.
Economy
Murrysville’s economy is largely based on the service industry. The town is home to several restaurants, retail stores, and other businesses. The town is also home to several manufacturing companies, including a steel mill, a glass factory, and a brickyard.
The town is also home to several educational institutions, including Franklin Regional High School, Murrysville Community Library, and the Murrysville Area Historical Society.
Demographics
As of the 2010 census, the population of Murrysville was 20,079. The racial makeup of the town was 94.3% White, 2.3% African American, 0.2% Native American, 1.2% Asian, 0.1% Pacific Islander, 0.7% from other races, and 1.4% from two or more races. Hispanic or Latino of any race were 2.2% of the population.
The median household income in Murrysville was $63,945, and the median family income was $76,945. The per capita income was $30,945. About 4.2% of families and 5.7% of the population were below the poverty line.
Common Questions
What is Per Capita Income in Murrysville?
Per Capita income in Murrysville is $62,242.
What is the Median Family Income in Murrysville?
Median Family Income in Murrysville is $144,625.
What is the Median Household income in Murrysville?
Median Household Income in Murrysville is $117,067.
What is Income or Wage Gap in Murrysville?
Income or Wage Gap in Murrysville is 50.4%.
Women in Murrysville earn 49.6 cents for every dollar earned by a man.
What is Inequality or Gini Index in Murrysville?
Inequality or Gini Index in Murrysville is 0.44.
What is the Total Population of Murrysville?
Total Population of Murrysville is 20,820.
What is the Total Male Population of Murrysville?
Total Male Population of Murrysville is 10,433.
What is the Total Female Population of Murrysville?
Total Female Population of Murrysville is 10,387.
What is the Ratio of Males per 100 Females in Murrysville?
There are 100.44 Males per 100 Females in Murrysville.
What is the Ratio of Females per 100 Males in Murrysville?
There are 99.56 Females per 100 Males in Murrysville.
What is the Median Population Age in Murrysville?
Median Population Age in Murrysville is 50.1 Years.
What is the Average Family Size in Murrysville
Average Family Size in Murrysville is 2.9 People.
What is the Average Household Size in Murrysville
Average Household Size in Murrysville is 2.5 People.
How Large is the Labor Force in Murrysville?
There are 10,487 People in the Labor Forcein in Murrysville.
What is the Percentage of People in the Labor Force in Murrysville?
61.0% of People are in the Labor Force in Murrysville.
What is the Unemployment Rate in Murrysville?
Unemployment Rate in Murrysville is 3.5%.