Gettysburg borough, PA Map & Demographics
Gettysburg borough Overview
$29,948
PER CAPITA INCOME
$81,845
AVG FAMILY INCOME
$50,736
AVG HOUSEHOLD INCOME
26.3%
WAGE / INCOME GAP [ % ]
73.7¢/ $1
WAGE / INCOME GAP [ $ ]
$8,562
FAMILY INCOME DEFICIT
0.49
INEQUALITY / GINI INDEX
7,709
TOTAL POPULATION
3,868
MALE POPULATION
3,841
FEMALE POPULATION
100.70
MALES / 100 FEMALES
99.30
FEMALES / 100 MALES
22.4
MEDIAN AGE
3.0
AVG FAMILY SIZE
2.1
AVG HOUSEHOLD SIZE
4,103
LABOR FORCE [ PEOPLE ]
58.4%
PERCENT IN LABOR FORCE
6.9%
UNEMPLOYMENT RATE
Income in Gettysburg borough
Income Overview in Gettysburg borough
Per Capita Income in Gettysburg borough is $29,948, while median incomes of families and households are $81,845 and $50,736 respectively.
| Characteristic | Number | Measure |
| Per Capita Income | 7,709 | $29,948 |
| Median Family Income | 1,117 | $81,845 |
| Mean Family Income | 1,117 | $114,583 |
| Median Household Income | 2,303 | $50,736 |
| Mean Household Income | 2,303 | $77,408 |
| Income Deficit | 1,117 | $8,562 |
| Wage / Income Gap (%) | 7,709 | 26.30% |
| Wage / Income Gap ($) | 7,709 | 73.70¢ per $1 |
| Gini / Inequality Index | 7,709 | 0.49 |
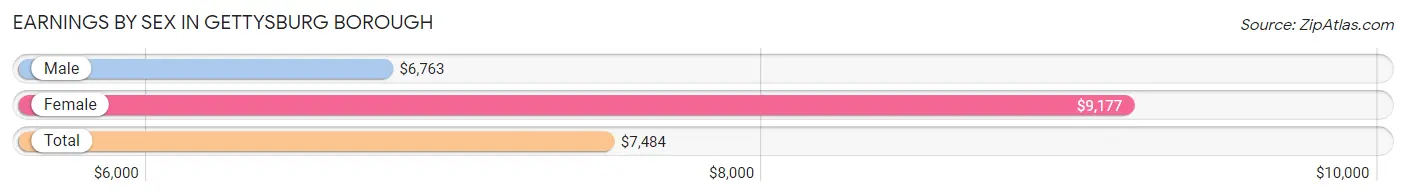
Earnings by Sex in Gettysburg borough
Average Earnings in Gettysburg borough are $7,484, $6,763 for men and $9,177 for women, a difference of 26.3%.
| Sex | Number | Average Earnings |
| Male | 2,814 (52.3%) | $6,763 |
| Female | 2,563 (47.7%) | $9,177 |
| Total | 5,377 (100.0%) | $7,484 |
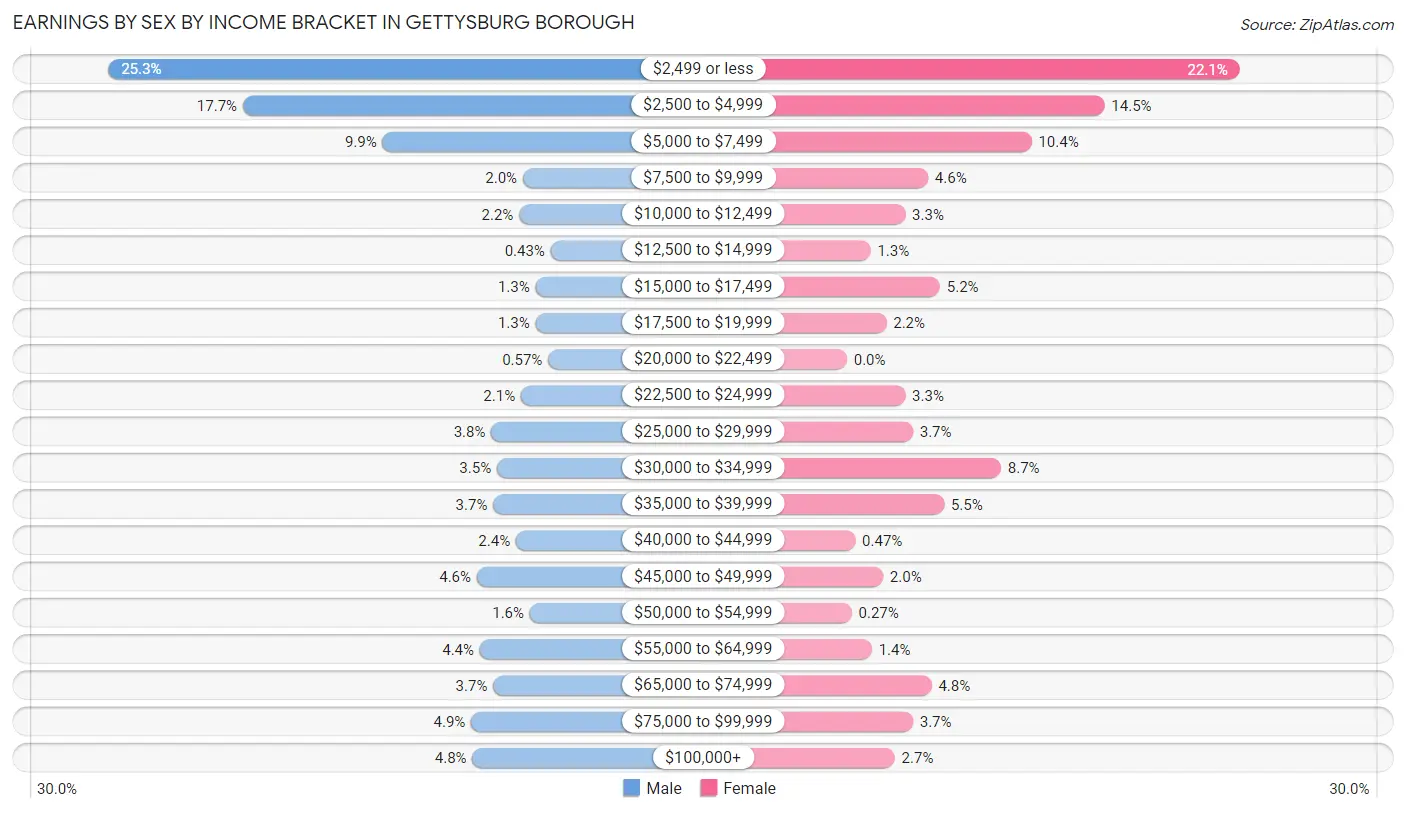
Earnings by Sex by Income Bracket in Gettysburg borough
The most common earnings brackets in Gettysburg borough are $2,499 or less for men (712 | 25.3%) and $2,499 or less for women (566 | 22.1%).
| Income | Male | Female |
| $2,499 or less | 712 (25.3%) | 566 (22.1%) |
| $2,500 to $4,999 | 499 (17.7%) | 371 (14.5%) |
| $5,000 to $7,499 | 278 (9.9%) | 266 (10.4%) |
| $7,500 to $9,999 | 56 (2.0%) | 117 (4.6%) |
| $10,000 to $12,499 | 62 (2.2%) | 84 (3.3%) |
| $12,500 to $14,999 | 12 (0.4%) | 34 (1.3%) |
| $15,000 to $17,499 | 36 (1.3%) | 134 (5.2%) |
| $17,500 to $19,999 | 36 (1.3%) | 57 (2.2%) |
| $20,000 to $22,499 | 16 (0.6%) | 0 (0.0%) |
| $22,500 to $24,999 | 59 (2.1%) | 84 (3.3%) |
| $25,000 to $29,999 | 106 (3.8%) | 95 (3.7%) |
| $30,000 to $34,999 | 97 (3.5%) | 222 (8.7%) |
| $35,000 to $39,999 | 103 (3.7%) | 140 (5.5%) |
| $40,000 to $44,999 | 67 (2.4%) | 12 (0.5%) |
| $45,000 to $49,999 | 129 (4.6%) | 52 (2.0%) |
| $50,000 to $54,999 | 45 (1.6%) | 7 (0.3%) |
| $55,000 to $64,999 | 124 (4.4%) | 36 (1.4%) |
| $65,000 to $74,999 | 103 (3.7%) | 122 (4.8%) |
| $75,000 to $99,999 | 138 (4.9%) | 95 (3.7%) |
| $100,000+ | 136 (4.8%) | 69 (2.7%) |
| Total | 2,814 (100.0%) | 2,563 (100.0%) |
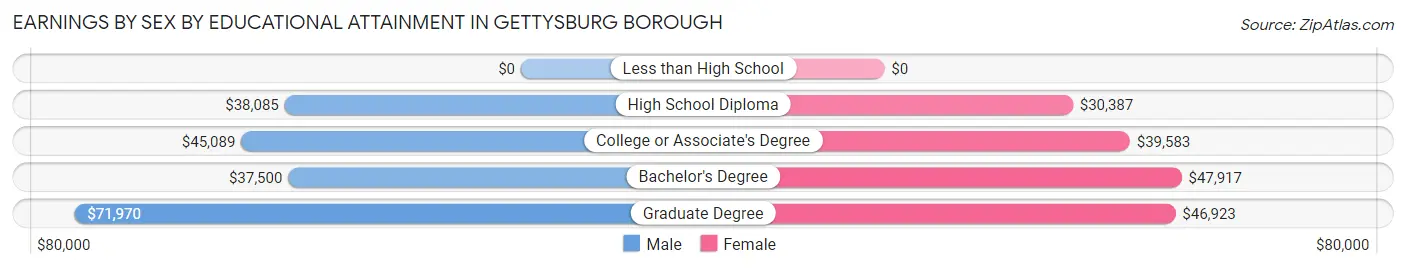
Earnings by Sex by Educational Attainment in Gettysburg borough
Average earnings in Gettysburg borough are $45,378 for men and $31,751 for women, a difference of 30.0%. Men with an educational attainment of graduate degree enjoy the highest average annual earnings of $71,970, while those with bachelor's degree education earn the least with $37,500. Women with an educational attainment of bachelor's degree earn the most with the average annual earnings of $47,917, while those with high school diploma education have the smallest earnings of $30,387.
| Educational Attainment | Male Income | Female Income |
| Less than High School | - | - |
| High School Diploma | $38,085 | $30,387 |
| College or Associate's Degree | $45,089 | $39,583 |
| Bachelor's Degree | $37,500 | $47,917 |
| Graduate Degree | $71,970 | $46,923 |
| Total | $45,378 | $31,751 |
Family Income in Gettysburg borough
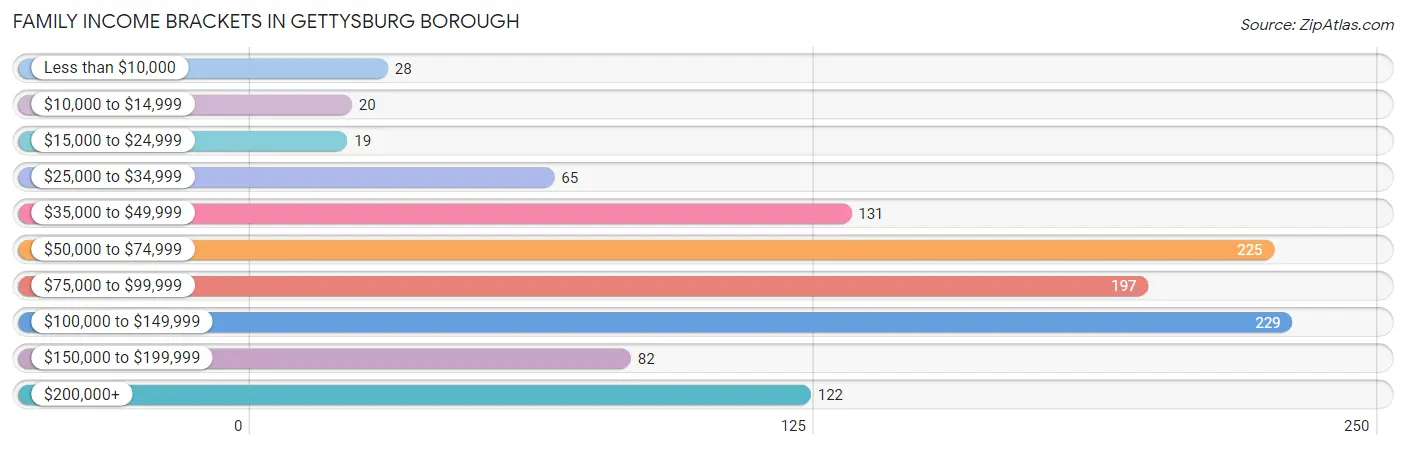
Family Income Brackets in Gettysburg borough
According to the Gettysburg borough family income data, there are 229 families falling into the $100,000 to $149,999 income range, which is the most common income bracket and makes up 20.5% of all families. Conversely, the $15,000 to $24,999 income bracket is the least frequent group with only 19 families (1.7%) belonging to this category.
| Income Bracket | # Families | % Families |
| Less than $10,000 | 28 | 2.5% |
| $10,000 to $14,999 | 20 | 1.8% |
| $15,000 to $24,999 | 19 | 1.7% |
| $25,000 to $34,999 | 65 | 5.8% |
| $35,000 to $49,999 | 131 | 11.7% |
| $50,000 to $74,999 | 225 | 20.1% |
| $75,000 to $99,999 | 197 | 17.6% |
| $100,000 to $149,999 | 229 | 20.5% |
| $150,000 to $199,999 | 82 | 7.3% |
| $200,000+ | 122 | 10.9% |
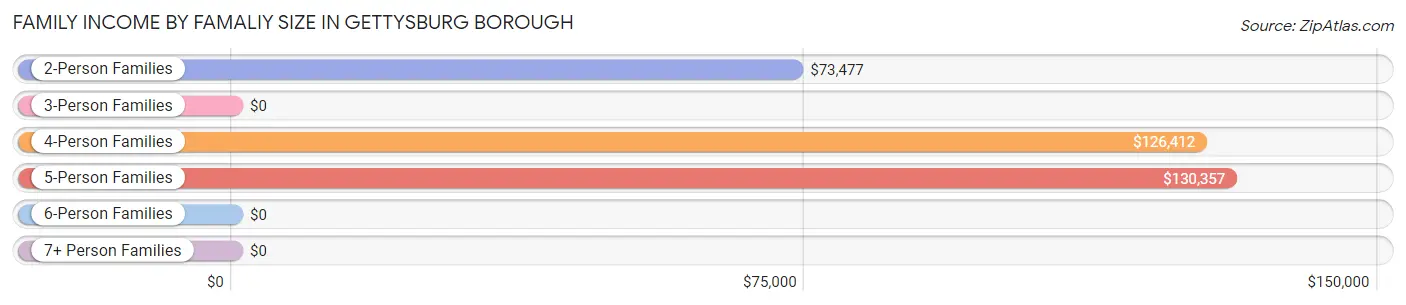
Family Income by Famaliy Size in Gettysburg borough
5-person families (52 | 4.7%) account for the highest median family income in Gettysburg borough with $130,357 per family, while 2-person families (567 | 50.8%) have the highest median income of $36,738 per family member.
| Income Bracket | # Families | Median Income |
| 2-Person Families | 567 (50.8%) | $73,477 |
| 3-Person Families | 243 (21.7%) | $0 |
| 4-Person Families | 227 (20.3%) | $126,412 |
| 5-Person Families | 52 (4.7%) | $130,357 |
| 6-Person Families | 28 (2.5%) | $0 |
| 7+ Person Families | 0 (0.0%) | $0 |
| Total | 1,117 (100.0%) | $81,845 |
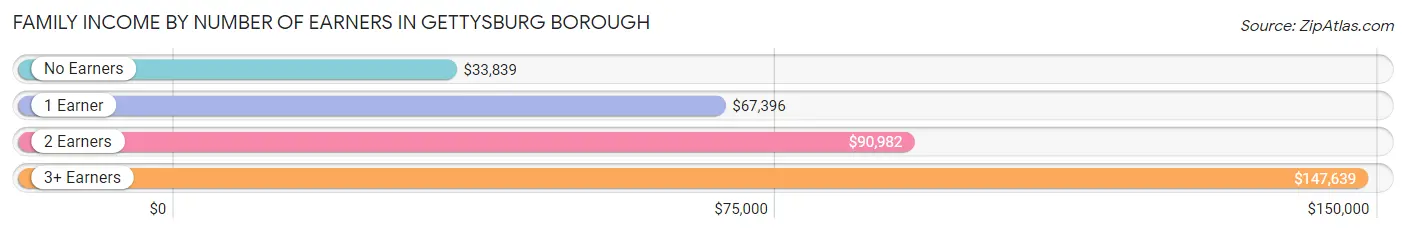
Family Income by Number of Earners in Gettysburg borough
The median family income in Gettysburg borough is $81,845, with families comprising 3+ earners (165) having the highest median family income of $147,639, while families with no earners (71) have the lowest median family income of $33,839, accounting for 14.8% and 6.4% of families, respectively.
| Number of Earners | # Families | Median Income |
| No Earners | 71 (6.4%) | $33,839 |
| 1 Earner | 418 (37.4%) | $67,396 |
| 2 Earners | 463 (41.4%) | $90,982 |
| 3+ Earners | 165 (14.8%) | $147,639 |
| Total | 1,117 (100.0%) | $81,845 |
Household Income in Gettysburg borough
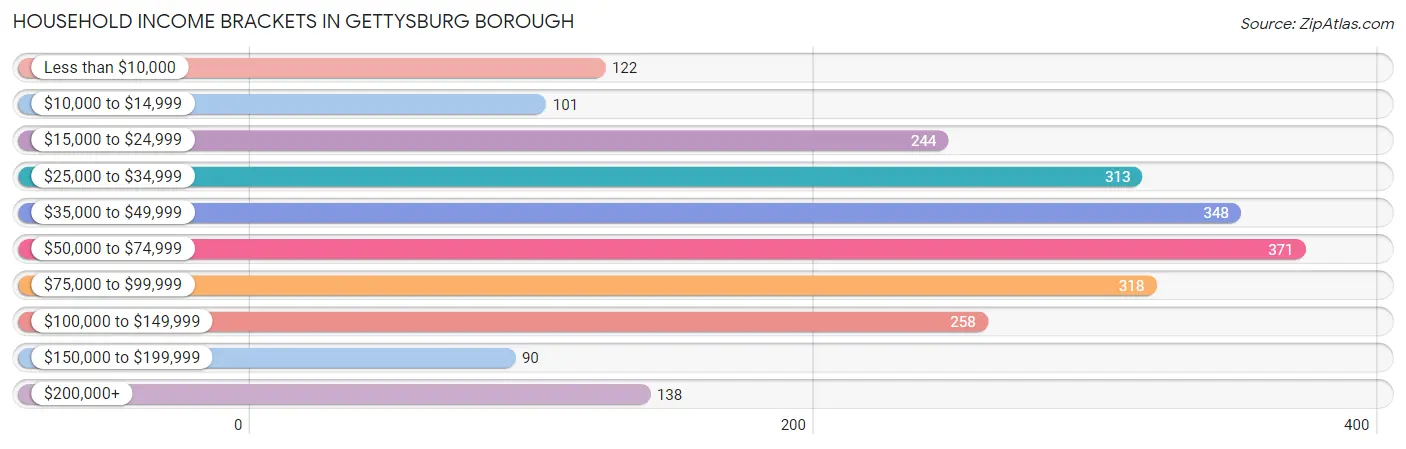
Household Income Brackets in Gettysburg borough
With 371 households falling in the category, the $50,000 to $74,999 income range is the most frequent in Gettysburg borough, accounting for 16.1% of all households. In contrast, only 90 households (3.9%) fall into the $150,000 to $199,999 income bracket, making it the least populous group.
| Income Bracket | # Households | % Households |
| Less than $10,000 | 122 | 5.3% |
| $10,000 to $14,999 | 101 | 4.4% |
| $15,000 to $24,999 | 244 | 10.6% |
| $25,000 to $34,999 | 313 | 13.6% |
| $35,000 to $49,999 | 348 | 15.1% |
| $50,000 to $74,999 | 371 | 16.1% |
| $75,000 to $99,999 | 318 | 13.8% |
| $100,000 to $149,999 | 258 | 11.2% |
| $150,000 to $199,999 | 90 | 3.9% |
| $200,000+ | 138 | 6.0% |
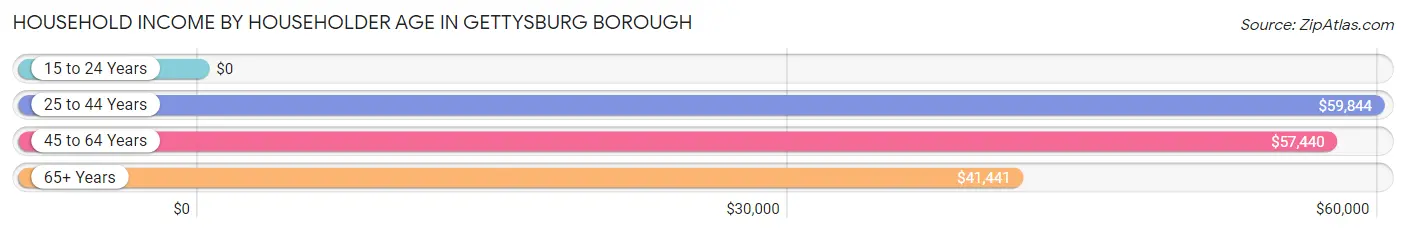
Household Income by Householder Age in Gettysburg borough
The median household income in Gettysburg borough is $50,736, with the highest median household income of $59,844 found in the 25 to 44 years age bracket for the primary householder. A total of 775 households (33.7%) fall into this category. Meanwhile, the 15 to 24 years age bracket for the primary householder has the lowest median household income of $0, with 98 households (4.3%) in this group.
| Income Bracket | # Households | Median Income |
| 15 to 24 Years | 98 (4.3%) | $0 |
| 25 to 44 Years | 775 (33.7%) | $59,844 |
| 45 to 64 Years | 747 (32.4%) | $57,440 |
| 65+ Years | 683 (29.7%) | $41,441 |
| Total | 2,303 (100.0%) | $50,736 |
Poverty in Gettysburg borough
Income Below Poverty by Sex and Age in Gettysburg borough
With 8.7% poverty level for males and 16.2% for females among the residents of Gettysburg borough, 15 year old males and 5 year old females are the most vulnerable to poverty, with 16 males (100.0%) and 6 females (100.0%) in their respective age groups living below the poverty level.
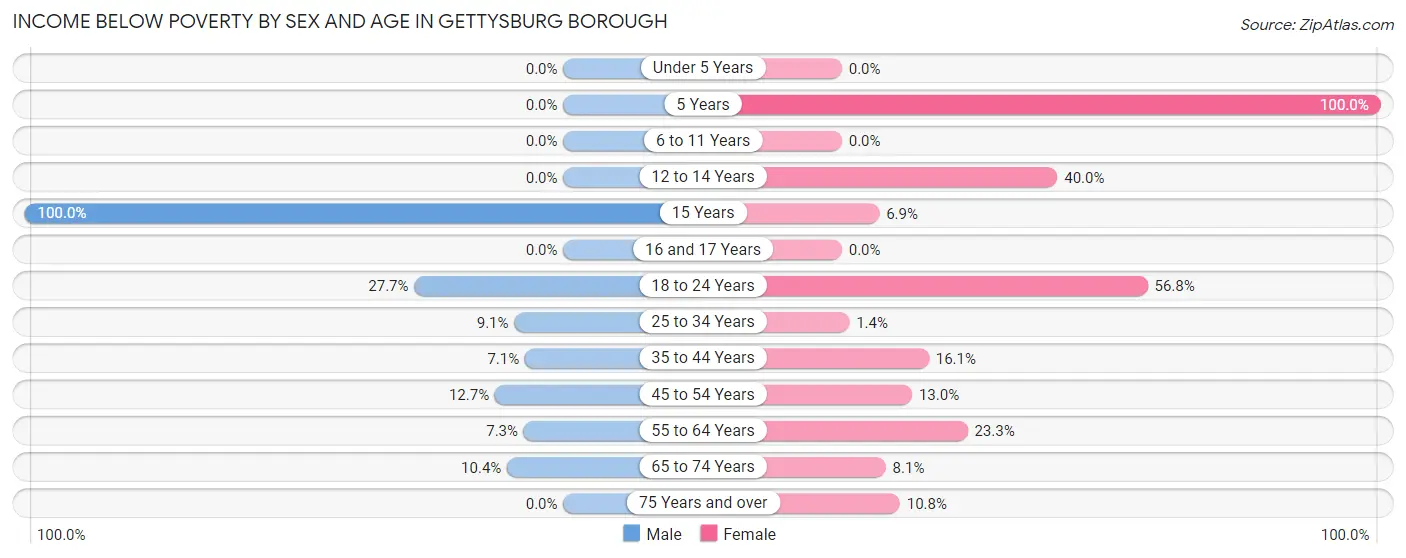
| Age Bracket | Male | Female |
| Under 5 Years | 0 (0.0%) | 0 (0.0%) |
| 5 Years | 0 (0.0%) | 6 (100.0%) |
| 6 to 11 Years | 0 (0.0%) | 0 (0.0%) |
| 12 to 14 Years | 0 (0.0%) | 12 (40.0%) |
| 15 Years | 16 (100.0%) | 5 (6.9%) |
| 16 and 17 Years | 0 (0.0%) | 0 (0.0%) |
| 18 to 24 Years | 39 (27.7%) | 185 (56.8%) |
| 25 to 34 Years | 32 (9.1%) | 6 (1.4%) |
| 35 to 44 Years | 30 (7.1%) | 61 (16.1%) |
| 45 to 54 Years | 33 (12.7%) | 43 (13.0%) |
| 55 to 64 Years | 22 (7.3%) | 56 (23.3%) |
| 65 to 74 Years | 24 (10.4%) | 25 (8.1%) |
| 75 Years and over | 0 (0.0%) | 24 (10.8%) |
| Total | 196 (8.7%) | 423 (16.2%) |
Income Above Poverty by Sex and Age in Gettysburg borough
According to the poverty statistics in Gettysburg borough, males aged under 5 years and females aged under 5 years are the age groups that are most secure financially, with 100.0% of males and 100.0% of females in these age groups living above the poverty line.
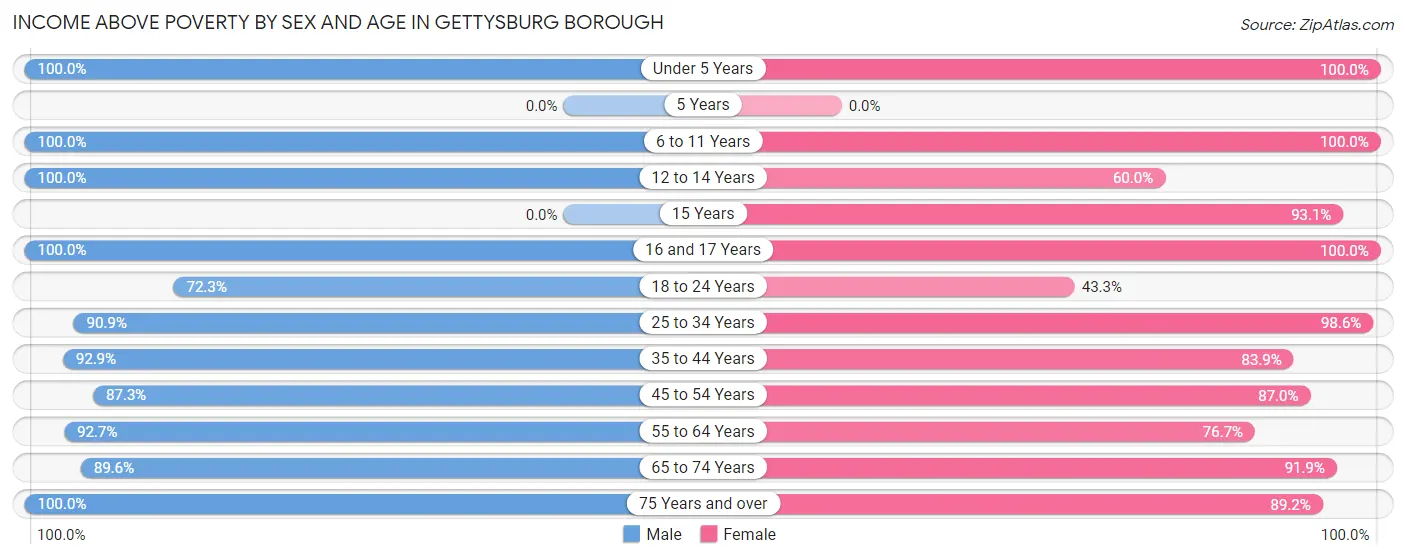
| Age Bracket | Male | Female |
| Under 5 Years | 118 (100.0%) | 108 (100.0%) |
| 5 Years | 0 (0.0%) | 0 (0.0%) |
| 6 to 11 Years | 142 (100.0%) | 81 (100.0%) |
| 12 to 14 Years | 96 (100.0%) | 18 (60.0%) |
| 15 Years | 0 (0.0%) | 67 (93.1%) |
| 16 and 17 Years | 35 (100.0%) | 69 (100.0%) |
| 18 to 24 Years | 102 (72.3%) | 141 (43.2%) |
| 25 to 34 Years | 320 (90.9%) | 429 (98.6%) |
| 35 to 44 Years | 392 (92.9%) | 317 (83.9%) |
| 45 to 54 Years | 227 (87.3%) | 287 (87.0%) |
| 55 to 64 Years | 278 (92.7%) | 184 (76.7%) |
| 65 to 74 Years | 206 (89.6%) | 282 (91.9%) |
| 75 Years and over | 145 (100.0%) | 199 (89.2%) |
| Total | 2,061 (91.3%) | 2,182 (83.8%) |
Income Below Poverty Among Married-Couple Families in Gettysburg borough
The poverty statistics for married-couple families in Gettysburg borough show that 3.3% or 25 of the total 760 families live below the poverty line. Families with no children have the highest poverty rate of 4.4%, comprising of 22 families. On the other hand, families with 3 or 4 children have the lowest poverty rate of 0.0%, which includes 0 families.
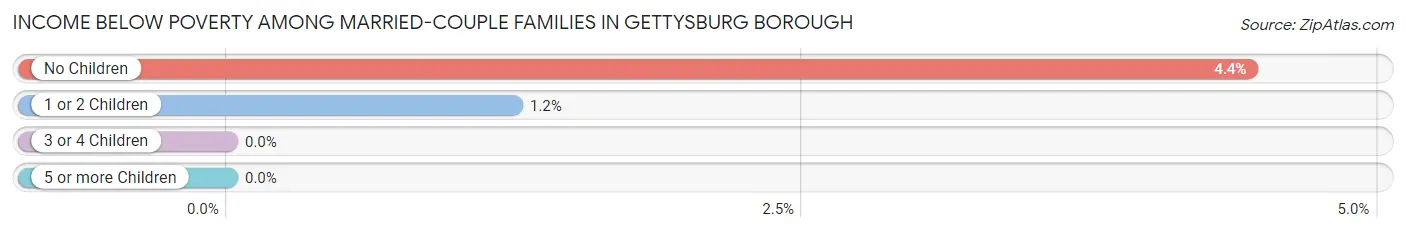
| Children | Above Poverty | Below Poverty |
| No Children | 474 (95.6%) | 22 (4.4%) |
| 1 or 2 Children | 239 (98.8%) | 3 (1.2%) |
| 3 or 4 Children | 22 (100.0%) | 0 (0.0%) |
| 5 or more Children | 0 (0.0%) | 0 (0.0%) |
| Total | 735 (96.7%) | 25 (3.3%) |
Income Below Poverty Among Single-Parent Households in Gettysburg borough
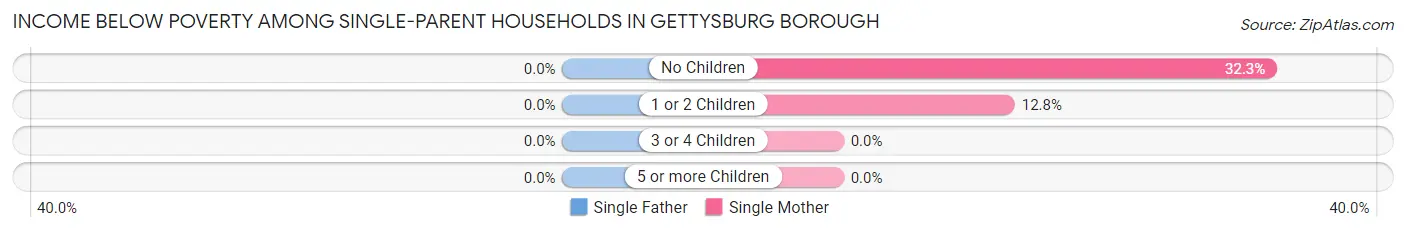
| Children | Single Father | Single Mother |
| No Children | 0 (0.0%) | 31 (32.3%) |
| 1 or 2 Children | 0 (0.0%) | 13 (12.8%) |
| 3 or 4 Children | 0 (0.0%) | 0 (0.0%) |
| 5 or more Children | 0 (0.0%) | 0 (0.0%) |
| Total | 0 (0.0%) | 44 (20.7%) |
Income Below Poverty Among Married-Couple vs Single-Parent Households in Gettysburg borough
The poverty data for Gettysburg borough shows that 25 of the married-couple family households (3.3%) and 44 of the single-parent households (12.3%) are living below the poverty level. Within the married-couple family households, those with no children have the highest poverty rate, with 22 households (4.4%) falling below the poverty line. Among the single-parent households, those with no children have the highest poverty rate, with 31 household (13.9%) living below poverty.
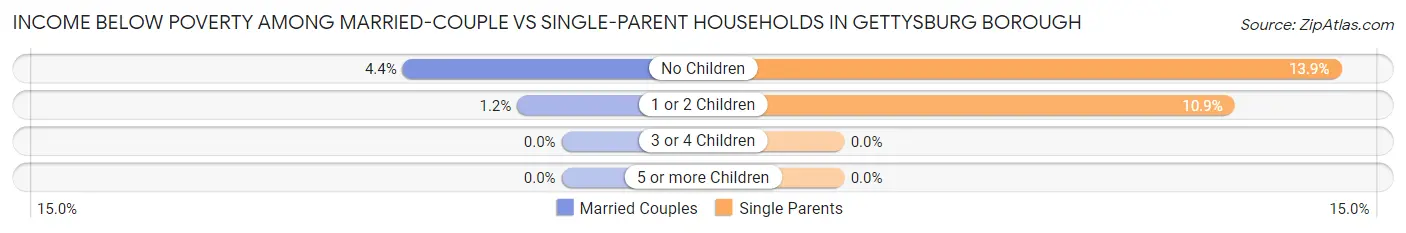
| Children | Married-Couple Families | Single-Parent Households |
| No Children | 22 (4.4%) | 31 (13.9%) |
| 1 or 2 Children | 3 (1.2%) | 13 (10.9%) |
| 3 or 4 Children | 0 (0.0%) | 0 (0.0%) |
| 5 or more Children | 0 (0.0%) | 0 (0.0%) |
| Total | 25 (3.3%) | 44 (12.3%) |
Race in Gettysburg borough
The most populous races in Gettysburg borough are White / Caucasian (6,248 | 81.0%), Hispanic or Latino (1,257 | 16.3%), and Two or more Races (488 | 6.3%).
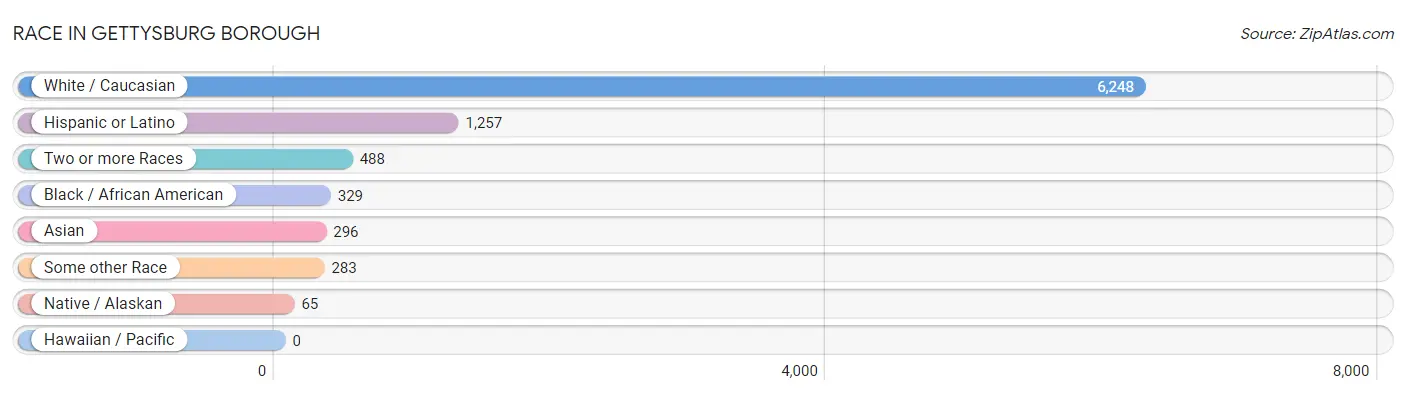
| Race | # Population | % Population |
| Asian | 296 | 3.8% |
| Black / African American | 329 | 4.3% |
| Hawaiian / Pacific | 0 | 0.0% |
| Hispanic or Latino | 1,257 | 16.3% |
| Native / Alaskan | 65 | 0.8% |
| White / Caucasian | 6,248 | 81.0% |
| Two or more Races | 488 | 6.3% |
| Some other Race | 283 | 3.7% |
| Total | 7,709 | 100.0% |
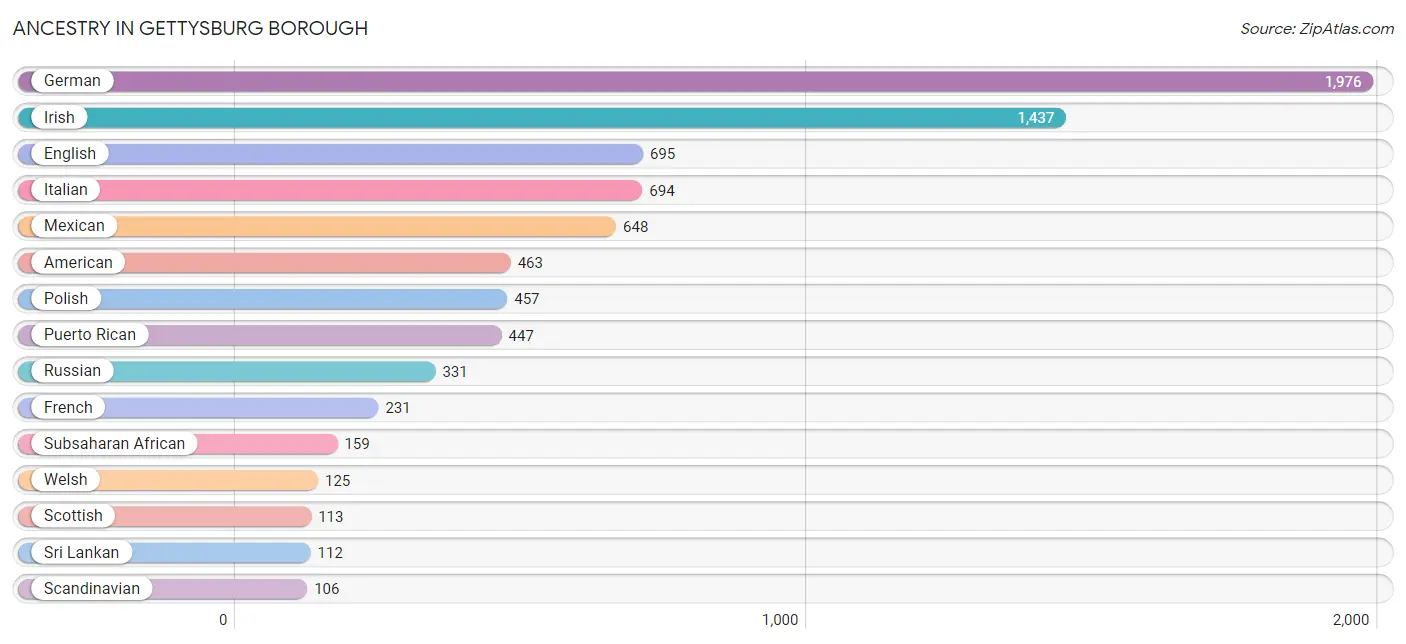
Ancestry in Gettysburg borough
The most populous ancestries reported in Gettysburg borough are German (1,976 | 25.6%), Irish (1,437 | 18.6%), English (695 | 9.0%), Italian (694 | 9.0%), and Mexican (648 | 8.4%), together accounting for 70.7% of all Gettysburg borough residents.
| Ancestry | # Population | % Population |
| African | 82 | 1.1% |
| American | 463 | 6.0% |
| Arab | 9 | 0.1% |
| Argentinean | 30 | 0.4% |
| Australian | 16 | 0.2% |
| Austrian | 6 | 0.1% |
| Belizean | 7 | 0.1% |
| British | 78 | 1.0% |
| Burmese | 29 | 0.4% |
| Canadian | 53 | 0.7% |
| Central American | 17 | 0.2% |
| Colombian | 15 | 0.2% |
| Comanche | 9 | 0.1% |
| Croatian | 46 | 0.6% |
| Cuban | 12 | 0.2% |
| Czech | 14 | 0.2% |
| Czechoslovakian | 22 | 0.3% |
| Danish | 12 | 0.2% |
| Dominican | 49 | 0.6% |
| Dutch | 77 | 1.0% |
| Eastern European | 19 | 0.3% |
| Egyptian | 9 | 0.1% |
| English | 695 | 9.0% |
| European | 51 | 0.7% |
| Finnish | 56 | 0.7% |
| French | 231 | 3.0% |
| German | 1,976 | 25.6% |
| Greek | 80 | 1.0% |
| Guatemalan | 14 | 0.2% |
| Haitian | 20 | 0.3% |
| Hungarian | 50 | 0.6% |
| Indian (Asian) | 81 | 1.1% |
| Iranian | 25 | 0.3% |
| Irish | 1,437 | 18.6% |
| Iroquois | 4 | 0.1% |
| Israeli | 7 | 0.1% |
| Italian | 694 | 9.0% |
| Jamaican | 7 | 0.1% |
| Korean | 23 | 0.3% |
| Mexican | 648 | 8.4% |
| Nigerian | 27 | 0.4% |
| Northern European | 17 | 0.2% |
| Norwegian | 88 | 1.1% |
| Pakistani | 4 | 0.1% |
| Pennsylvania German | 6 | 0.1% |
| Peruvian | 7 | 0.1% |
| Polish | 457 | 5.9% |
| Portuguese | 66 | 0.9% |
| Puerto Rican | 447 | 5.8% |
| Romanian | 21 | 0.3% |
| Russian | 331 | 4.3% |
| Salvadoran | 3 | 0.0% |
| Scandinavian | 106 | 1.4% |
| Scotch-Irish | 103 | 1.3% |
| Scottish | 113 | 1.5% |
| Serbian | 18 | 0.2% |
| Sioux | 7 | 0.1% |
| Slavic | 12 | 0.2% |
| Slovak | 9 | 0.1% |
| South African | 17 | 0.2% |
| South American | 52 | 0.7% |
| Spaniard | 5 | 0.1% |
| Spanish | 23 | 0.3% |
| Spanish American Indian | 33 | 0.4% |
| Sri Lankan | 112 | 1.5% |
| Subsaharan African | 159 | 2.1% |
| Swedish | 39 | 0.5% |
| Swiss | 75 | 1.0% |
| Thai | 49 | 0.6% |
| Trinidadian and Tobagonian | 9 | 0.1% |
| Turkish | 3 | 0.0% |
| Ukrainian | 70 | 0.9% |
| Welsh | 125 | 1.6% |
| West Indian | 9 | 0.1% | View All 74 Rows |
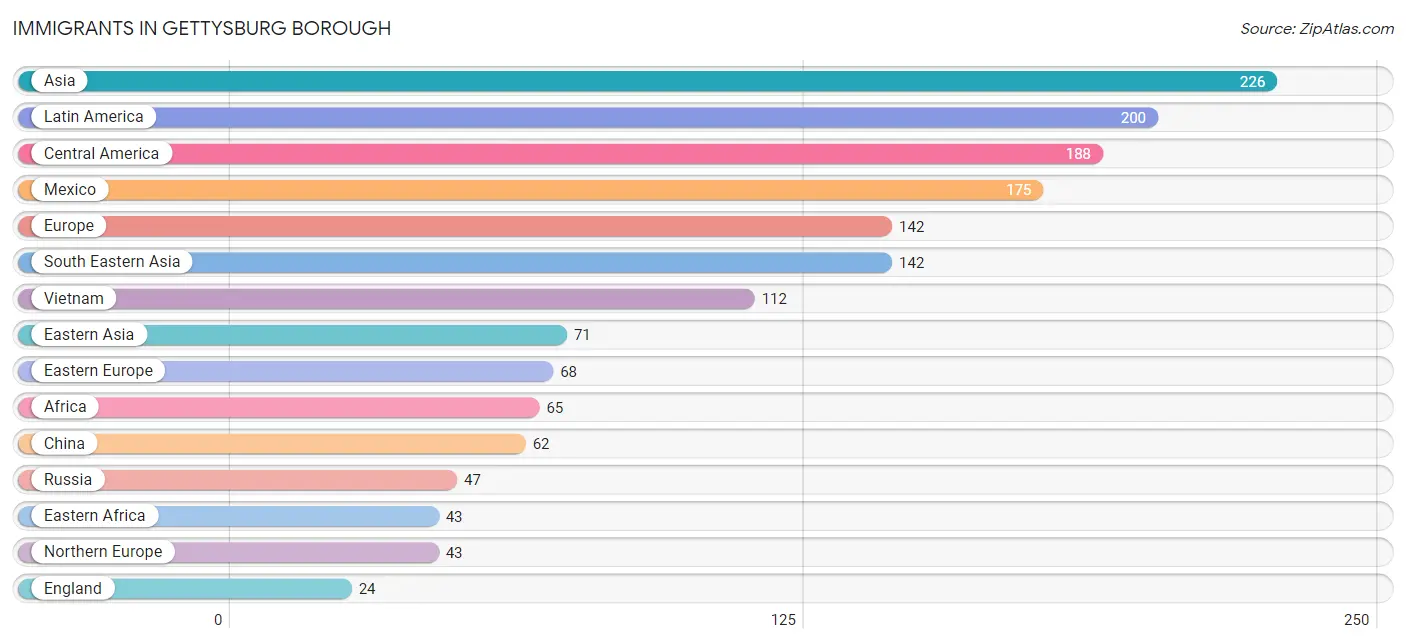
Immigrants in Gettysburg borough
The most numerous immigrant groups reported in Gettysburg borough came from Asia (226 | 2.9%), Latin America (200 | 2.6%), Central America (188 | 2.4%), Mexico (175 | 2.3%), and Europe (142 | 1.8%), together accounting for 12.1% of all Gettysburg borough residents.
| Immigration Origin | # Population | % Population |
| Africa | 65 | 0.8% |
| Asia | 226 | 2.9% |
| Australia | 10 | 0.1% |
| Brazil | 11 | 0.1% |
| Caribbean | 1 | 0.0% |
| Central America | 188 | 2.4% |
| China | 62 | 0.8% |
| Cuba | 1 | 0.0% |
| Eastern Africa | 43 | 0.6% |
| Eastern Asia | 71 | 0.9% |
| Eastern Europe | 68 | 0.9% |
| El Salvador | 13 | 0.2% |
| England | 24 | 0.3% |
| Europe | 142 | 1.8% |
| France | 15 | 0.2% |
| Germany | 6 | 0.1% |
| India | 13 | 0.2% |
| Italy | 5 | 0.1% |
| Kenya | 18 | 0.2% |
| Korea | 9 | 0.1% |
| Latin America | 200 | 2.6% |
| Mexico | 175 | 2.3% |
| Northern Europe | 43 | 0.6% |
| Oceania | 10 | 0.1% |
| Poland | 15 | 0.2% |
| Russia | 47 | 0.6% |
| South Africa | 22 | 0.3% |
| South America | 11 | 0.1% |
| South Central Asia | 13 | 0.2% |
| South Eastern Asia | 142 | 1.8% |
| Southern Europe | 10 | 0.1% |
| Spain | 5 | 0.1% |
| Ukraine | 6 | 0.1% |
| Vietnam | 112 | 1.5% |
| Western Europe | 21 | 0.3% | View All 35 Rows |
Sex and Age in Gettysburg borough
Sex and Age in Gettysburg borough
The most populous age groups in Gettysburg borough are 15 to 19 Years (1,109 | 28.7%) for men and 20 to 24 Years (871 | 22.7%) for women.
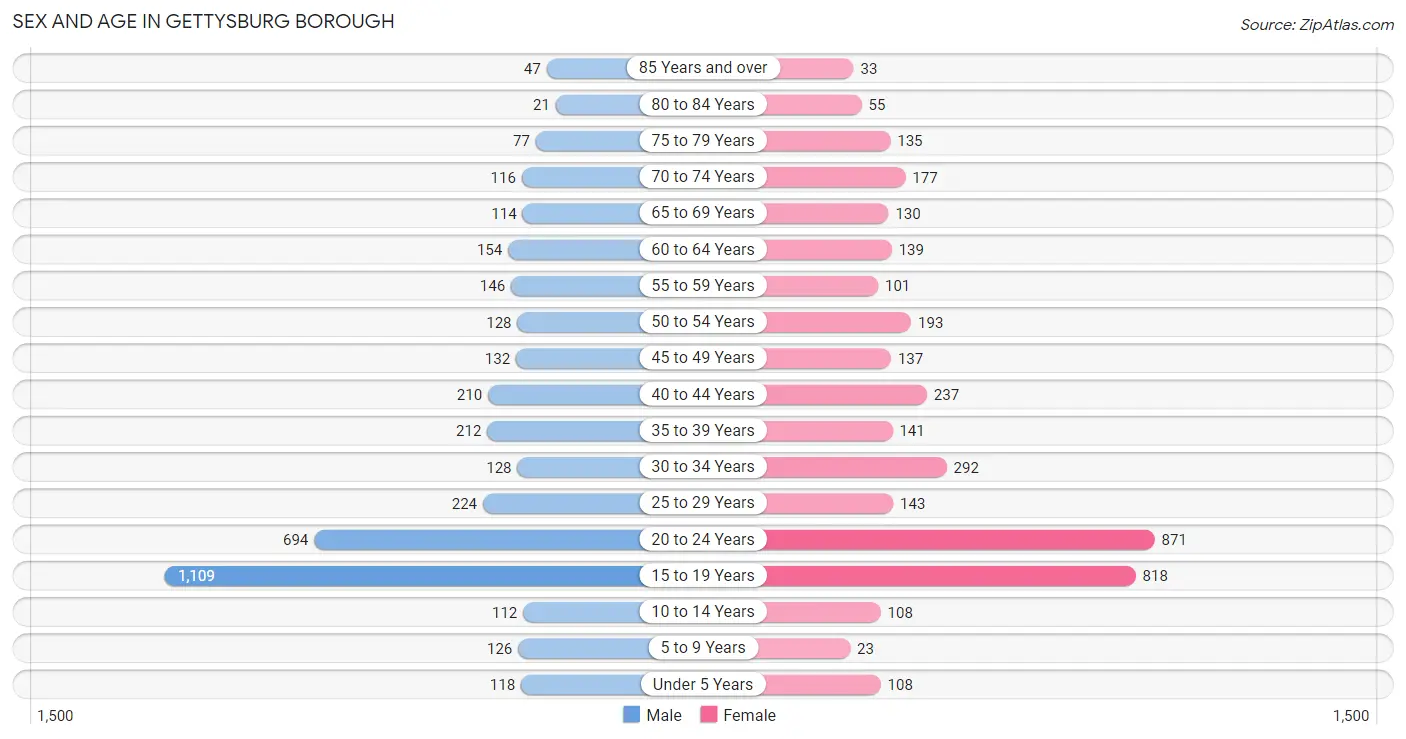
| Age Bracket | Male | Female |
| Under 5 Years | 118 (3.0%) | 108 (2.8%) |
| 5 to 9 Years | 126 (3.3%) | 23 (0.6%) |
| 10 to 14 Years | 112 (2.9%) | 108 (2.8%) |
| 15 to 19 Years | 1,109 (28.7%) | 818 (21.3%) |
| 20 to 24 Years | 694 (17.9%) | 871 (22.7%) |
| 25 to 29 Years | 224 (5.8%) | 143 (3.7%) |
| 30 to 34 Years | 128 (3.3%) | 292 (7.6%) |
| 35 to 39 Years | 212 (5.5%) | 141 (3.7%) |
| 40 to 44 Years | 210 (5.4%) | 237 (6.2%) |
| 45 to 49 Years | 132 (3.4%) | 137 (3.6%) |
| 50 to 54 Years | 128 (3.3%) | 193 (5.0%) |
| 55 to 59 Years | 146 (3.8%) | 101 (2.6%) |
| 60 to 64 Years | 154 (4.0%) | 139 (3.6%) |
| 65 to 69 Years | 114 (2.9%) | 130 (3.4%) |
| 70 to 74 Years | 116 (3.0%) | 177 (4.6%) |
| 75 to 79 Years | 77 (2.0%) | 135 (3.5%) |
| 80 to 84 Years | 21 (0.5%) | 55 (1.4%) |
| 85 Years and over | 47 (1.2%) | 33 (0.9%) |
| Total | 3,868 (100.0%) | 3,841 (100.0%) |
Families and Households in Gettysburg borough
Median Family Size in Gettysburg borough
The median family size in Gettysburg borough is 2.99 persons per family, with married-couple families (760 | 68.0%) accounting for the largest median family size of 3.18 persons per family. On the other hand, single male/father families (144 | 12.9%) represent the smallest median family size with 2.40 persons per family.
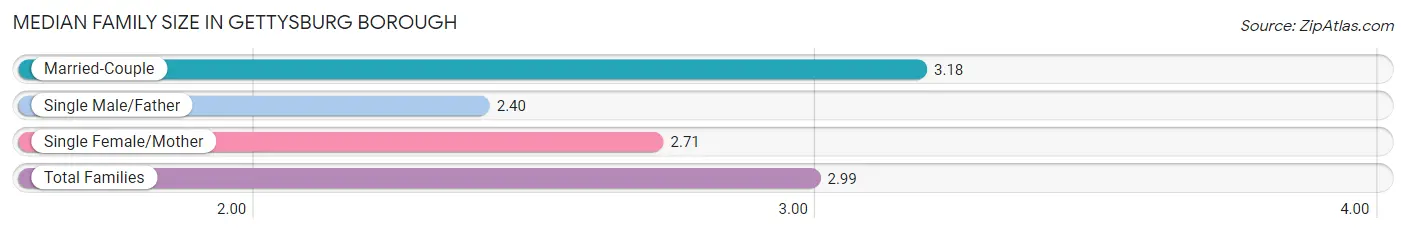
| Family Type | # Families | Family Size |
| Married-Couple | 760 (68.0%) | 3.18 |
| Single Male/Father | 144 (12.9%) | 2.40 |
| Single Female/Mother | 213 (19.1%) | 2.71 |
| Total Families | 1,117 (100.0%) | 2.99 |
Median Household Size in Gettysburg borough
The median household size in Gettysburg borough is 2.10 persons per household, with married-couple households (760 | 33.0%) accounting for the largest median household size of 3.18 persons per household. non-family households (1,186 | 51.5%) represent the smallest median household size with 1.22 persons per household.
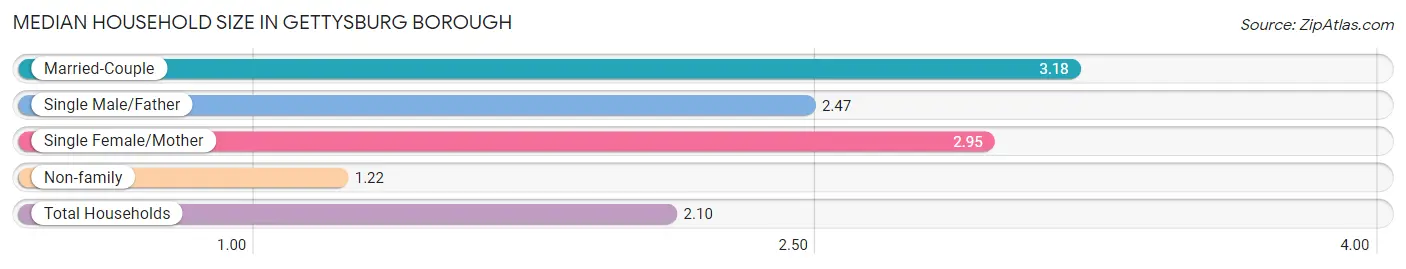
| Household Type | # Households | Household Size |
| Married-Couple | 760 (33.0%) | 3.18 |
| Single Male/Father | 144 (6.2%) | 2.47 |
| Single Female/Mother | 213 (9.2%) | 2.95 |
| Non-family | 1,186 (51.5%) | 1.22 |
| Total Households | 2,303 (100.0%) | 2.10 |
Household Size by Marriage Status in Gettysburg borough
Out of a total of 2,303 households in Gettysburg borough, 1,117 (48.5%) are family households, while 1,186 (51.5%) are nonfamily households. The most numerous type of family households are 2-person households, comprising 558, and the most common type of nonfamily households are 1-person households, comprising 1,084.
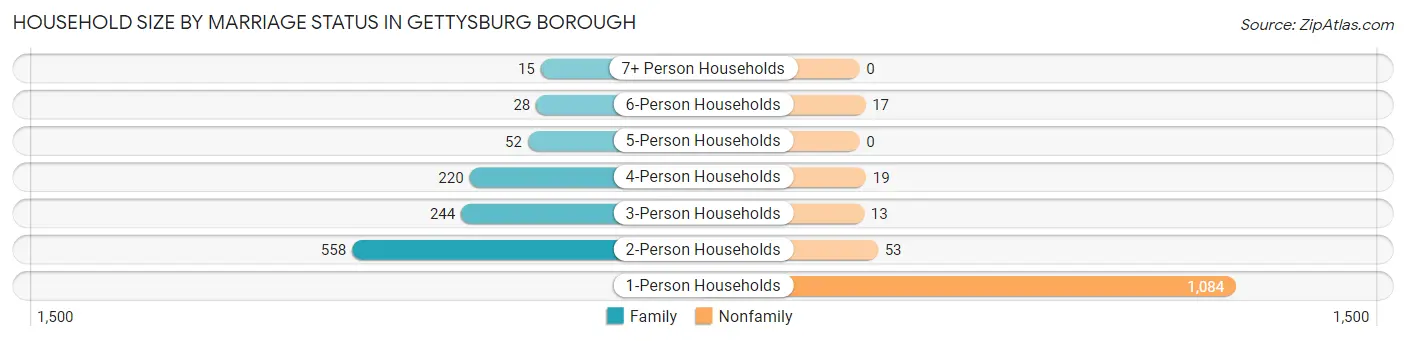
| Household Size | Family Households | Nonfamily Households |
| 1-Person Households | - | 1,084 (47.1%) |
| 2-Person Households | 558 (24.2%) | 53 (2.3%) |
| 3-Person Households | 244 (10.6%) | 13 (0.6%) |
| 4-Person Households | 220 (9.6%) | 19 (0.8%) |
| 5-Person Households | 52 (2.3%) | 0 (0.0%) |
| 6-Person Households | 28 (1.2%) | 17 (0.7%) |
| 7+ Person Households | 15 (0.6%) | 0 (0.0%) |
| Total | 1,117 (48.5%) | 1,186 (51.5%) |
Female Fertility in Gettysburg borough
Fertility by Age in Gettysburg borough
Average fertility rate in Gettysburg borough is 12.0 births per 1,000 women. Women in the age bracket of 35 to 50 years have the highest fertility rate with 21.0 births per 1,000 women. Women in the age bracket of 20 to 34 years acount for 66.7% of all women with births.
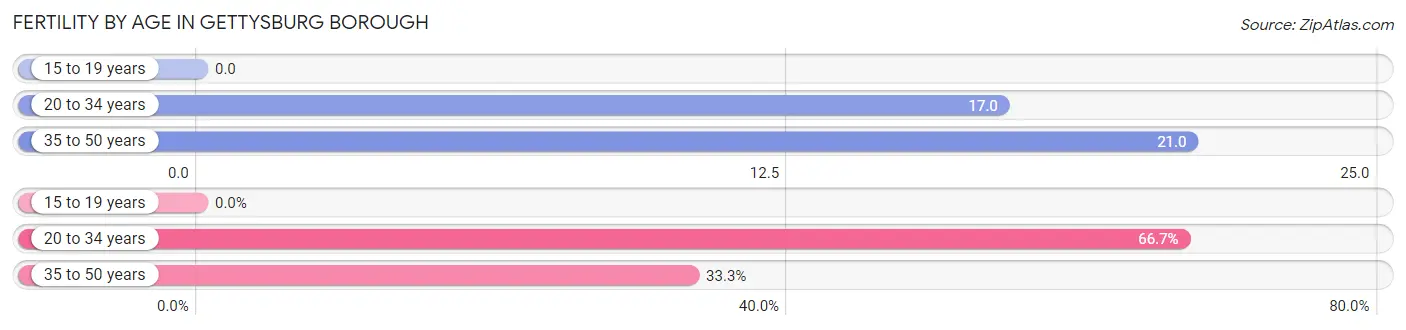
| Age Bracket | Women with Births | Births / 1,000 Women |
| 15 to 19 years | 0 (0.0%) | 0.0 |
| 20 to 34 years | 22 (66.7%) | 17.0 |
| 35 to 50 years | 11 (33.3%) | 21.0 |
| Total | 33 (100.0%) | 12.0 |
Fertility by Age by Marriage Status in Gettysburg borough
93.9% of women with births (33) in Gettysburg borough are married. The highest percentage of unmarried women with births falls into 20 to 34 years age bracket with 9.1% of them unmarried at the time of birth, while the lowest percentage of unmarried women with births belong to 35 to 50 years age bracket with 0.0% of them unmarried.
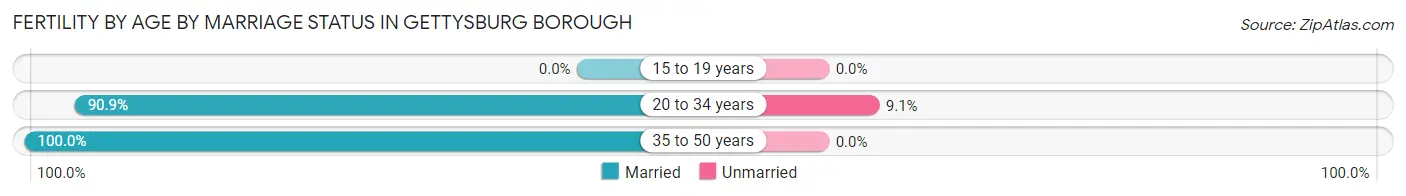
| Age Bracket | Married | Unmarried |
| 15 to 19 years | 0 (0.0%) | 0 (0.0%) |
| 20 to 34 years | 20 (90.9%) | 2 (9.1%) |
| 35 to 50 years | 11 (100.0%) | 0 (0.0%) |
| Total | 31 (93.9%) | 2 (6.1%) |
Fertility by Education in Gettysburg borough
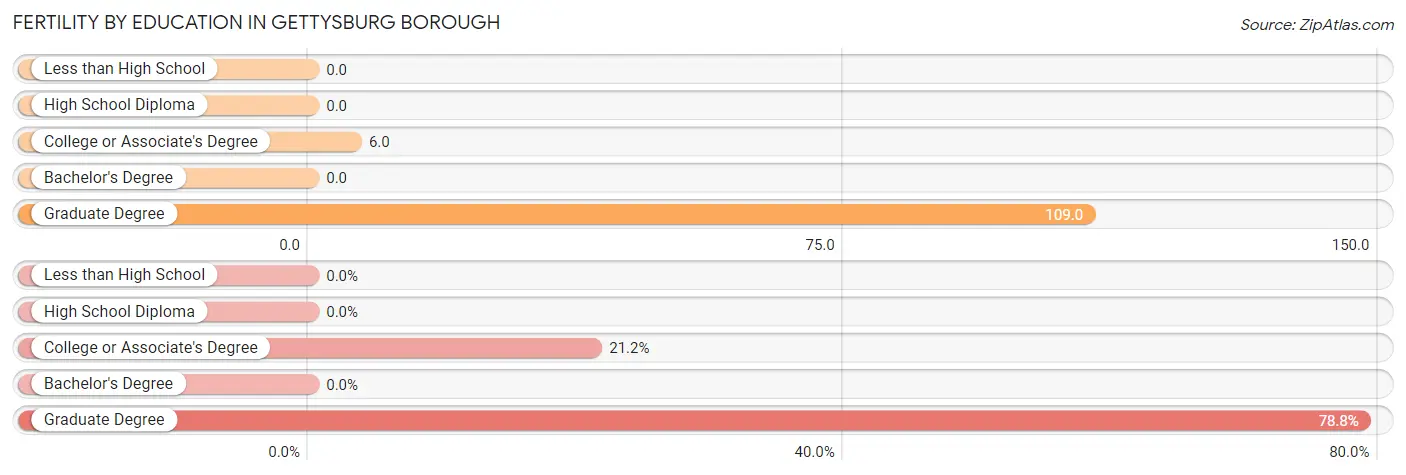
| Educational Attainment | Women with Births | Births / 1,000 Women |
| Less than High School | 0 (0.0%) | 0.0 |
| High School Diploma | 0 (0.0%) | 0.0 |
| College or Associate's Degree | 7 (21.2%) | 6.0 |
| Bachelor's Degree | 0 (0.0%) | 0.0 |
| Graduate Degree | 26 (78.8%) | 109.0 |
| Total | 33 (100.0%) | 12.0 |
Fertility by Education by Marriage Status in Gettysburg borough
6.1% of women with births in Gettysburg borough are unmarried. Women with the educational attainment of graduate degree are most likely to be married with 100.0% of them married at childbirth, while women with the educational attainment of college or associate's degree are least likely to be married with 28.6% of them unmarried at childbirth.
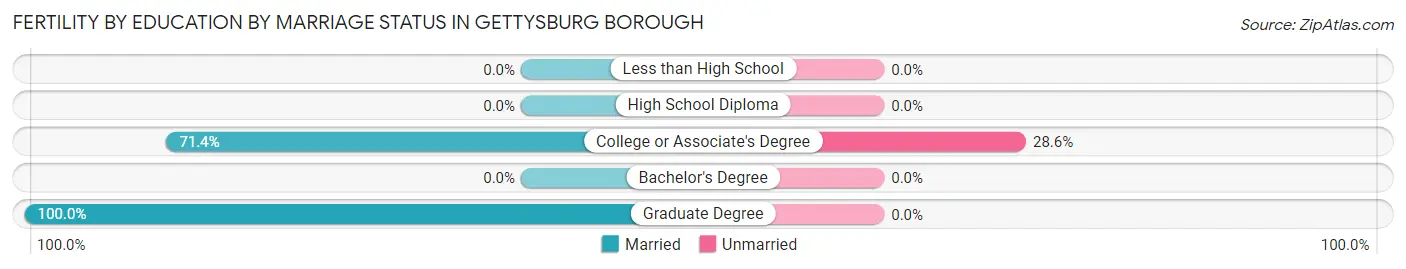
| Educational Attainment | Married | Unmarried |
| Less than High School | 0 (0.0%) | 0 (0.0%) |
| High School Diploma | 0 (0.0%) | 0 (0.0%) |
| College or Associate's Degree | 5 (71.4%) | 2 (28.6%) |
| Bachelor's Degree | 0 (0.0%) | 0 (0.0%) |
| Graduate Degree | 26 (100.0%) | 0 (0.0%) |
| Total | 31 (93.9%) | 2 (6.1%) |
Employment Characteristics in Gettysburg borough
Employment by Class of Employer in Gettysburg borough
Among the 3,450 employed individuals in Gettysburg borough, private company employees (2,458 | 71.3%), not-for-profit organizations (529 | 15.3%), and local government employees (187 | 5.4%) make up the most common classes of employment.
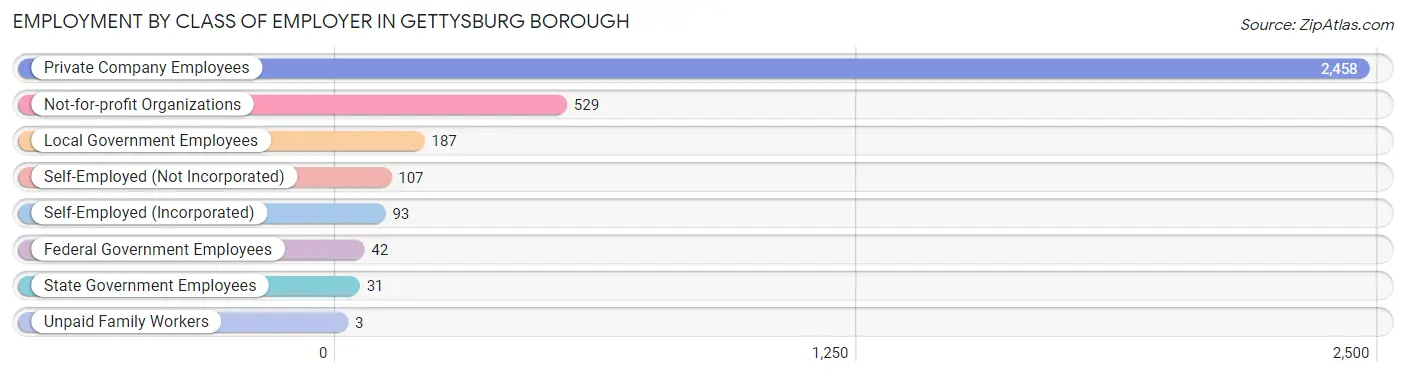
| Employer Class | # Employees | % Employees |
| Private Company Employees | 2,458 | 71.3% |
| Self-Employed (Incorporated) | 93 | 2.7% |
| Self-Employed (Not Incorporated) | 107 | 3.1% |
| Not-for-profit Organizations | 529 | 15.3% |
| Local Government Employees | 187 | 5.4% |
| State Government Employees | 31 | 0.9% |
| Federal Government Employees | 42 | 1.2% |
| Unpaid Family Workers | 3 | 0.1% |
| Total | 3,450 | 100.0% |
Employment Status by Age in Gettysburg borough
According to the labor force statistics for Gettysburg borough, out of the total population over 16 years of age (7,026), 58.4% or 4,103 individuals are in the labor force, with 6.9% or 283 of them unemployed. The age group with the highest labor force participation rate is 25 to 29 years, with 92.1% or 338 individuals in the labor force. Within the labor force, the 30 to 34 years age range has the highest percentage of unemployed individuals, with 14.1% or 51 of them being unemployed.
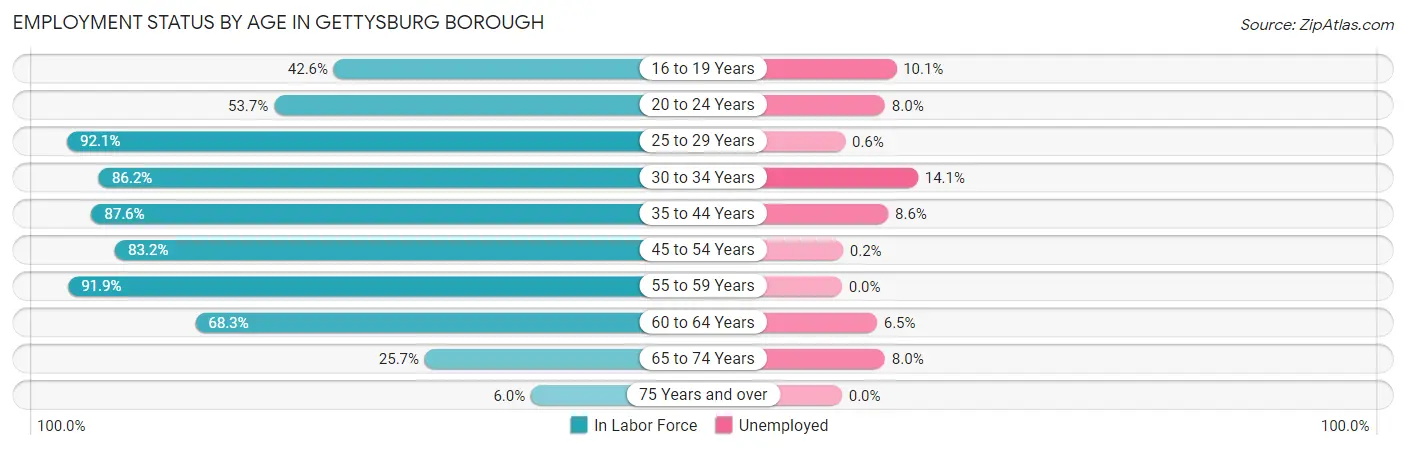
| Age Bracket | In Labor Force | Unemployed |
| 16 to 19 Years | 783 (42.6%) | 79 (10.1%) |
| 20 to 24 Years | 840 (53.7%) | 67 (8.0%) |
| 25 to 29 Years | 338 (92.1%) | 2 (0.6%) |
| 30 to 34 Years | 362 (86.2%) | 51 (14.1%) |
| 35 to 44 Years | 701 (87.6%) | 60 (8.6%) |
| 45 to 54 Years | 491 (83.2%) | 1 (0.2%) |
| 55 to 59 Years | 227 (91.9%) | 0 (0.0%) |
| 60 to 64 Years | 200 (68.3%) | 13 (6.5%) |
| 65 to 74 Years | 138 (25.7%) | 11 (8.0%) |
| 75 Years and over | 22 (6.0%) | 0 (0.0%) |
| Total | 4,103 (58.4%) | 283 (6.9%) |
Employment Status by Educational Attainment in Gettysburg borough
According to labor force statistics for Gettysburg borough, 85.4% of individuals (2,320) out of the total population between 25 and 64 years of age (2,717) are in the labor force, with 5.5% or 128 of them being unemployed. The group with the highest labor force participation rate are those with the educational attainment of college / associate degree, with 95.2% or 481 individuals in the labor force. Within the labor force, individuals with less than high school education have the highest percentage of unemployment, with 32.5% or 51 of them being unemployed.
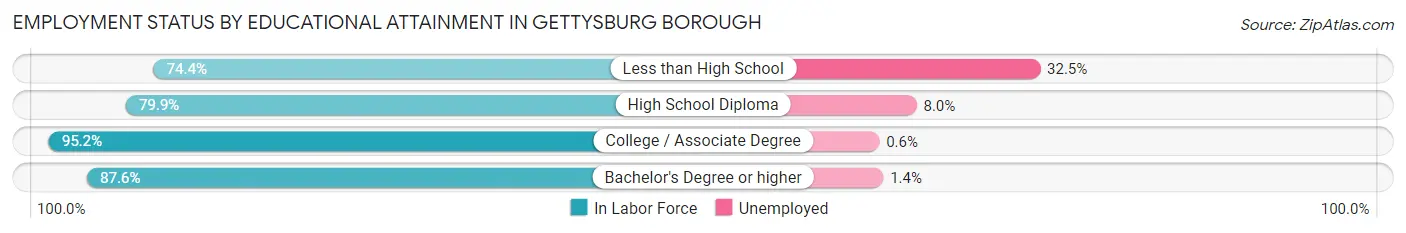
| Educational Attainment | In Labor Force | Unemployed |
| Less than High School | 157 (74.4%) | 69 (32.5%) |
| High School Diploma | 748 (79.9%) | 75 (8.0%) |
| College / Associate Degree | 481 (95.2%) | 3 (0.6%) |
| Bachelor's Degree or higher | 933 (87.6%) | 15 (1.4%) |
| Total | 2,320 (85.4%) | 149 (5.5%) |
Employment Occupations by Sex in Gettysburg borough
Management, Business, Science and Arts Occupations
The most common Management, Business, Science and Arts occupations in Gettysburg borough are Community & Social Service (681 | 17.8%), Education Instruction & Library (535 | 14.0%), Management (327 | 8.6%), Computers, Engineering & Science (116 | 3.0%), and Business & Financial (79 | 2.1%).
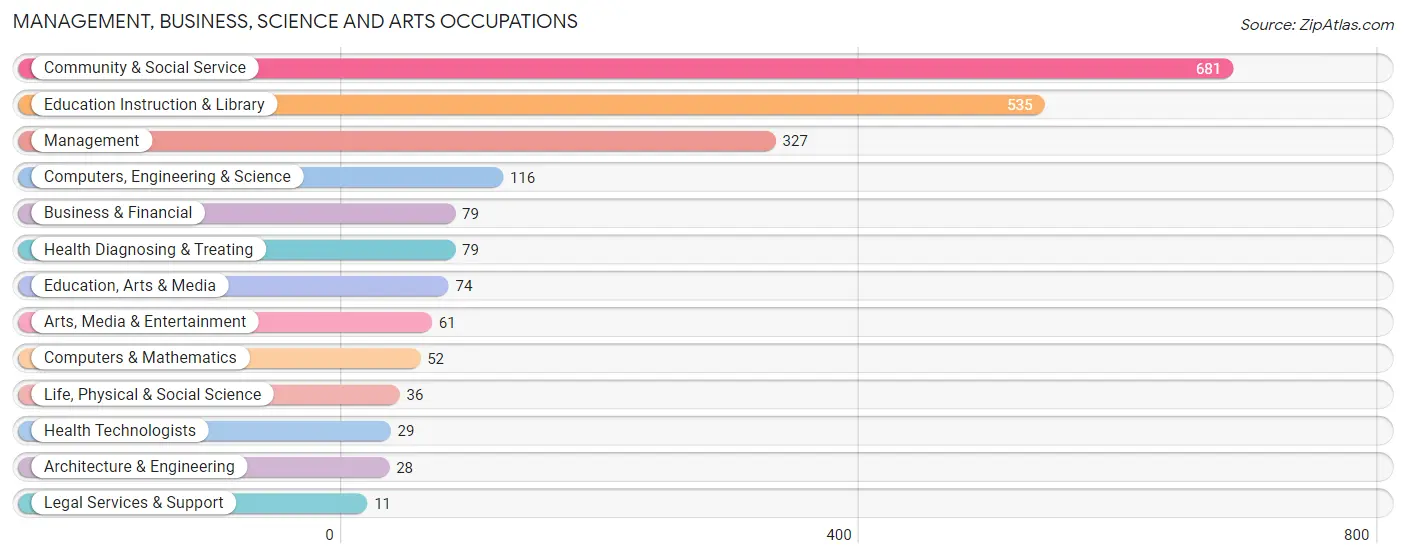
Management, Business, Science and Arts Occupations by Sex
Within the Management, Business, Science and Arts occupations in Gettysburg borough, the most male-oriented occupations are Legal Services & Support (100.0%), Computers & Mathematics (92.3%), and Education, Arts & Media (73.0%), while the most female-oriented occupations are Health Technologists (100.0%), Health Diagnosing & Treating (88.6%), and Life, Physical & Social Science (80.6%).
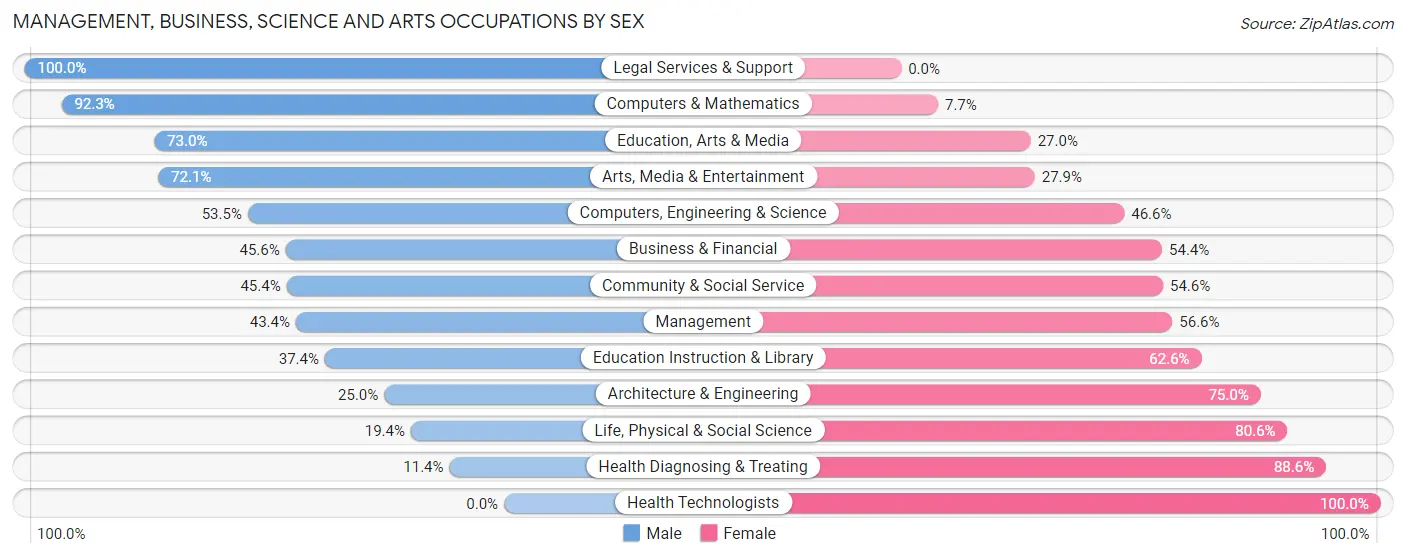
| Occupation | Male | Female |
| Management | 142 (43.4%) | 185 (56.6%) |
| Business & Financial | 36 (45.6%) | 43 (54.4%) |
| Computers, Engineering & Science | 62 (53.4%) | 54 (46.6%) |
| Computers & Mathematics | 48 (92.3%) | 4 (7.7%) |
| Architecture & Engineering | 7 (25.0%) | 21 (75.0%) |
| Life, Physical & Social Science | 7 (19.4%) | 29 (80.6%) |
| Community & Social Service | 309 (45.4%) | 372 (54.6%) |
| Education, Arts & Media | 54 (73.0%) | 20 (27.0%) |
| Legal Services & Support | 11 (100.0%) | 0 (0.0%) |
| Education Instruction & Library | 200 (37.4%) | 335 (62.6%) |
| Arts, Media & Entertainment | 44 (72.1%) | 17 (27.9%) |
| Health Diagnosing & Treating | 9 (11.4%) | 70 (88.6%) |
| Health Technologists | 0 (0.0%) | 29 (100.0%) |
| Total (Category) | 558 (43.5%) | 724 (56.5%) |
| Total (Overall) | 1,842 (48.2%) | 1,977 (51.8%) |
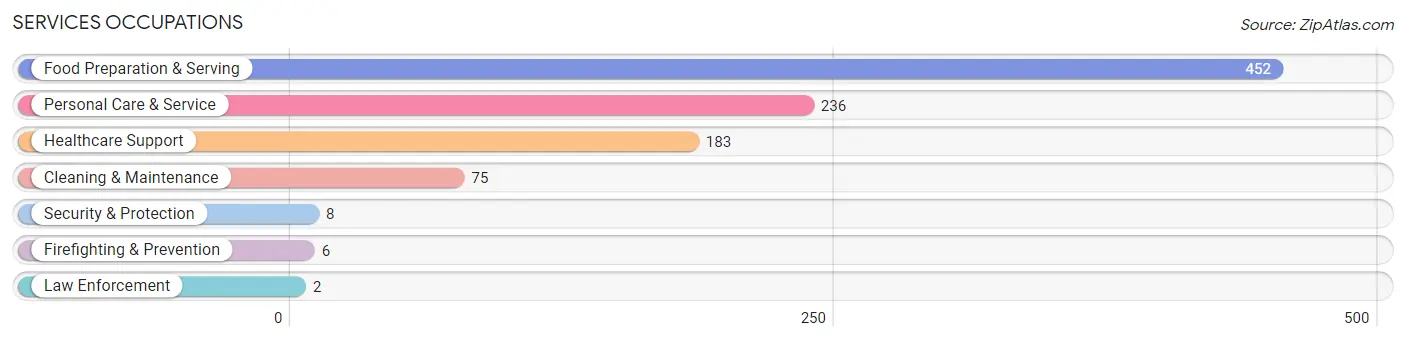
Services Occupations
The most common Services occupations in Gettysburg borough are Food Preparation & Serving (452 | 11.8%), Personal Care & Service (236 | 6.2%), Healthcare Support (183 | 4.8%), Cleaning & Maintenance (75 | 2.0%), and Security & Protection (8 | 0.2%).
Services Occupations by Sex
Within the Services occupations in Gettysburg borough, the most male-oriented occupations are Law Enforcement (100.0%), Cleaning & Maintenance (68.0%), and Food Preparation & Serving (45.4%), while the most female-oriented occupations are Firefighting & Prevention (100.0%), Healthcare Support (96.7%), and Security & Protection (75.0%).
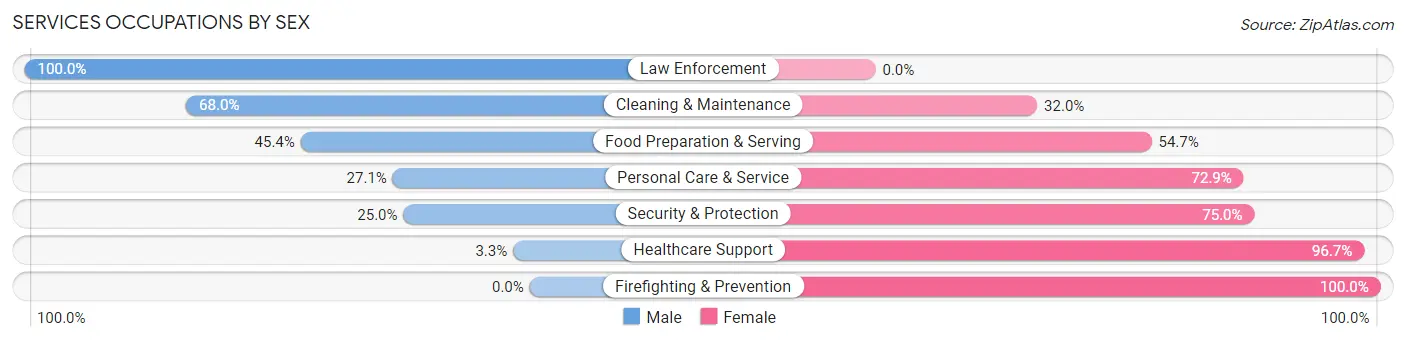
| Occupation | Male | Female |
| Healthcare Support | 6 (3.3%) | 177 (96.7%) |
| Security & Protection | 2 (25.0%) | 6 (75.0%) |
| Firefighting & Prevention | 0 (0.0%) | 6 (100.0%) |
| Law Enforcement | 2 (100.0%) | 0 (0.0%) |
| Food Preparation & Serving | 205 (45.4%) | 247 (54.6%) |
| Cleaning & Maintenance | 51 (68.0%) | 24 (32.0%) |
| Personal Care & Service | 64 (27.1%) | 172 (72.9%) |
| Total (Category) | 328 (34.4%) | 626 (65.6%) |
| Total (Overall) | 1,842 (48.2%) | 1,977 (51.8%) |
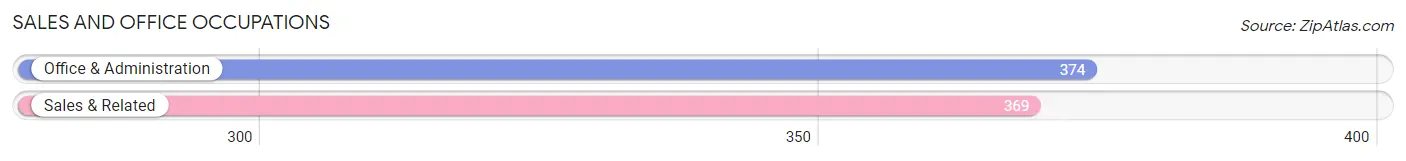
Sales and Office Occupations
The most common Sales and Office occupations in Gettysburg borough are Office & Administration (374 | 9.8%), and Sales & Related (369 | 9.7%).
Sales and Office Occupations by Sex
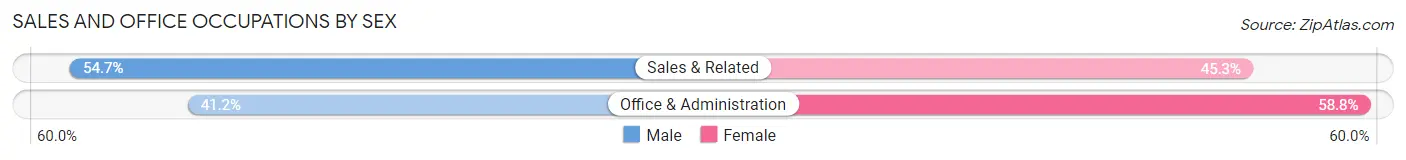
| Occupation | Male | Female |
| Sales & Related | 202 (54.7%) | 167 (45.3%) |
| Office & Administration | 154 (41.2%) | 220 (58.8%) |
| Total (Category) | 356 (47.9%) | 387 (52.1%) |
| Total (Overall) | 1,842 (48.2%) | 1,977 (51.8%) |
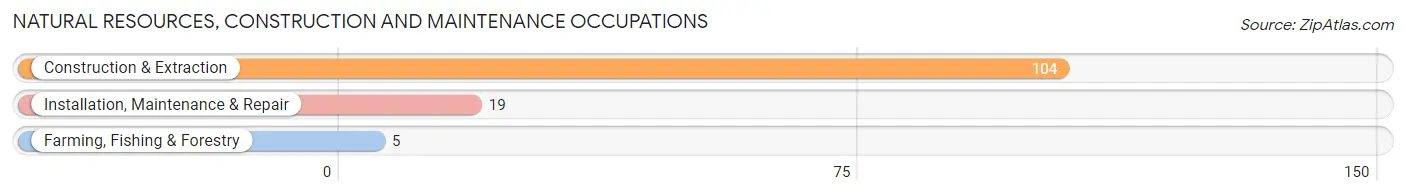
Natural Resources, Construction and Maintenance Occupations
The most common Natural Resources, Construction and Maintenance occupations in Gettysburg borough are Construction & Extraction (104 | 2.7%), Installation, Maintenance & Repair (19 | 0.5%), and Farming, Fishing & Forestry (5 | 0.1%).
Natural Resources, Construction and Maintenance Occupations by Sex
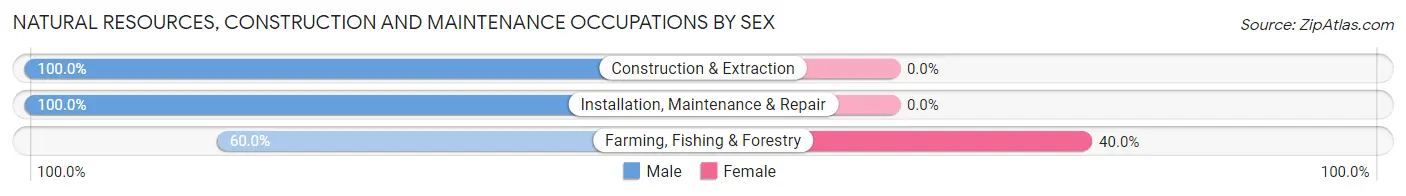
| Occupation | Male | Female |
| Farming, Fishing & Forestry | 3 (60.0%) | 2 (40.0%) |
| Construction & Extraction | 104 (100.0%) | 0 (0.0%) |
| Installation, Maintenance & Repair | 19 (100.0%) | 0 (0.0%) |
| Total (Category) | 126 (98.4%) | 2 (1.6%) |
| Total (Overall) | 1,842 (48.2%) | 1,977 (51.8%) |
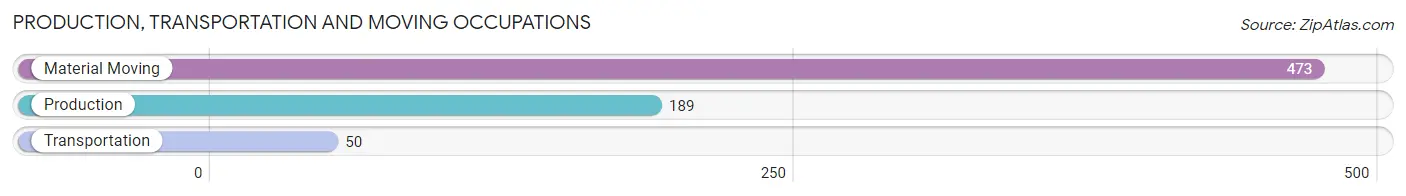
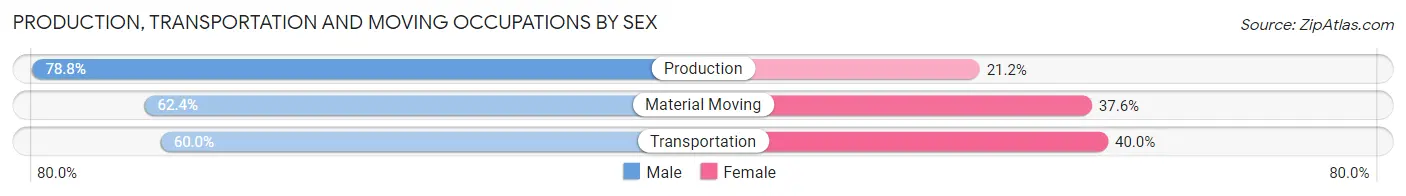
Production, Transportation and Moving Occupations
The most common Production, Transportation and Moving occupations in Gettysburg borough are Material Moving (473 | 12.4%), Production (189 | 5.0%), and Transportation (50 | 1.3%).
Production, Transportation and Moving Occupations by Sex
| Occupation | Male | Female |
| Production | 149 (78.8%) | 40 (21.2%) |
| Transportation | 30 (60.0%) | 20 (40.0%) |
| Material Moving | 295 (62.4%) | 178 (37.6%) |
| Total (Category) | 474 (66.6%) | 238 (33.4%) |
| Total (Overall) | 1,842 (48.2%) | 1,977 (51.8%) |
Employment Industries by Sex in Gettysburg borough
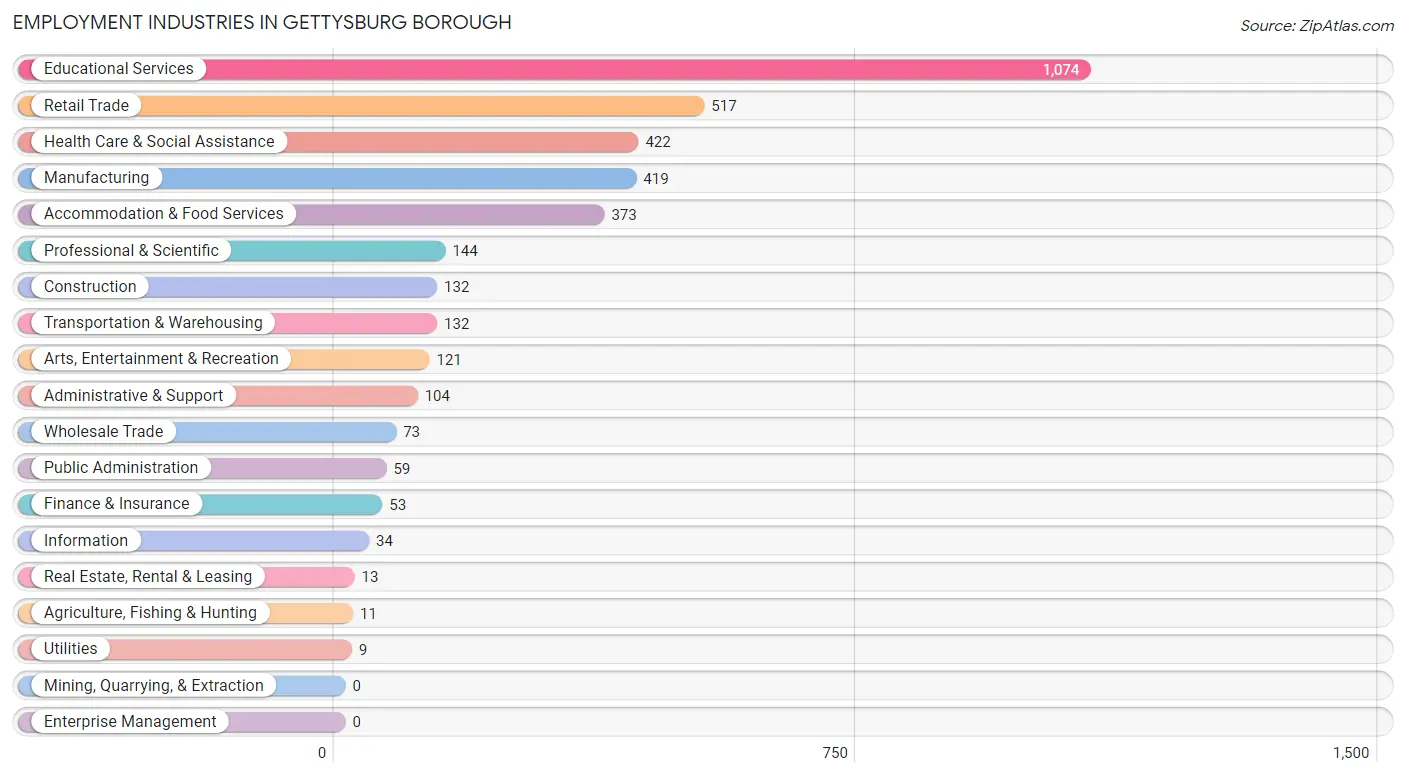
Employment Industries in Gettysburg borough
The major employment industries in Gettysburg borough include Educational Services (1,074 | 28.1%), Retail Trade (517 | 13.5%), Health Care & Social Assistance (422 | 11.1%), Manufacturing (419 | 11.0%), and Accommodation & Food Services (373 | 9.8%).
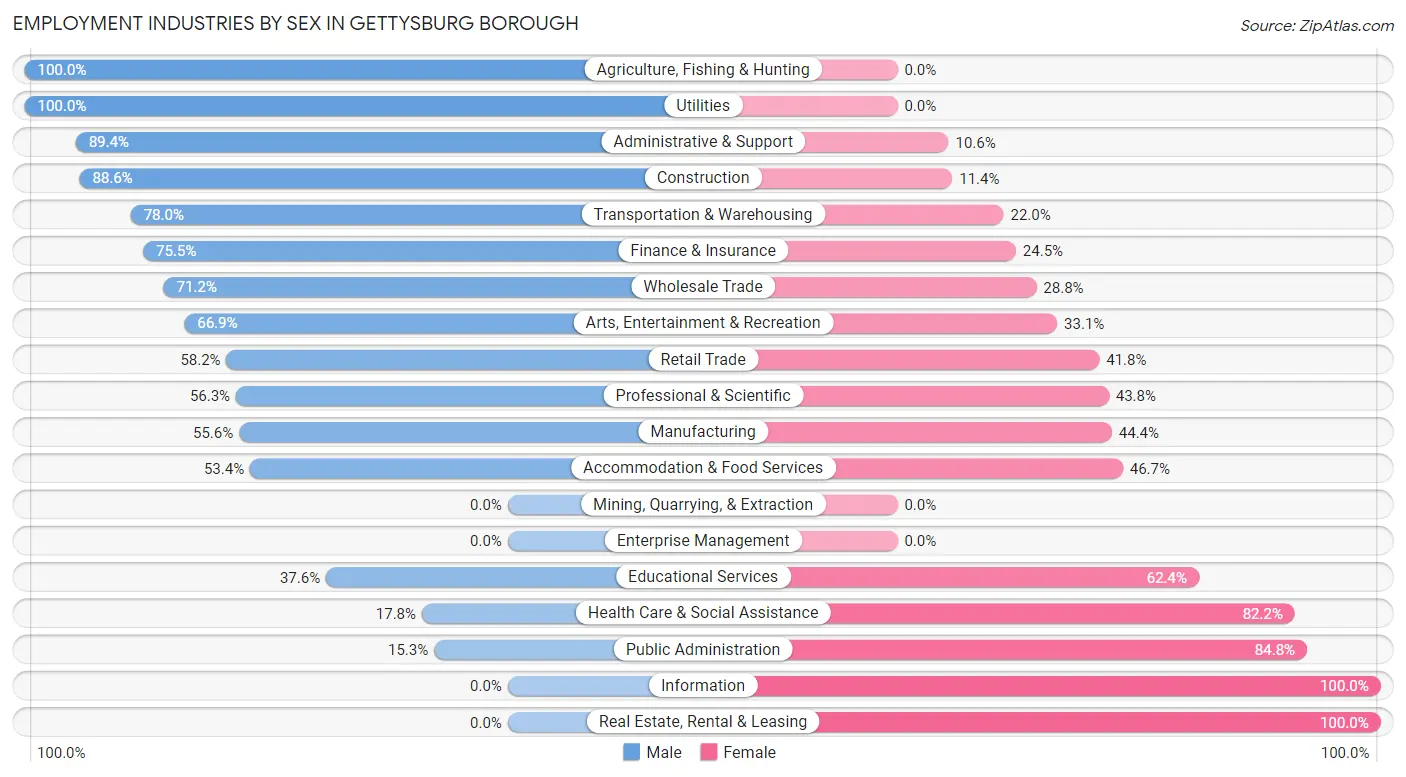
Employment Industries by Sex in Gettysburg borough
The Gettysburg borough industries that see more men than women are Agriculture, Fishing & Hunting (100.0%), Utilities (100.0%), and Administrative & Support (89.4%), whereas the industries that tend to have a higher number of women are Information (100.0%), Real Estate, Rental & Leasing (100.0%), and Public Administration (84.8%).
| Industry | Male | Female |
| Agriculture, Fishing & Hunting | 11 (100.0%) | 0 (0.0%) |
| Mining, Quarrying, & Extraction | 0 (0.0%) | 0 (0.0%) |
| Construction | 117 (88.6%) | 15 (11.4%) |
| Manufacturing | 233 (55.6%) | 186 (44.4%) |
| Wholesale Trade | 52 (71.2%) | 21 (28.8%) |
| Retail Trade | 301 (58.2%) | 216 (41.8%) |
| Transportation & Warehousing | 103 (78.0%) | 29 (22.0%) |
| Utilities | 9 (100.0%) | 0 (0.0%) |
| Information | 0 (0.0%) | 34 (100.0%) |
| Finance & Insurance | 40 (75.5%) | 13 (24.5%) |
| Real Estate, Rental & Leasing | 0 (0.0%) | 13 (100.0%) |
| Professional & Scientific | 81 (56.2%) | 63 (43.8%) |
| Enterprise Management | 0 (0.0%) | 0 (0.0%) |
| Administrative & Support | 93 (89.4%) | 11 (10.6%) |
| Educational Services | 404 (37.6%) | 670 (62.4%) |
| Health Care & Social Assistance | 75 (17.8%) | 347 (82.2%) |
| Arts, Entertainment & Recreation | 81 (66.9%) | 40 (33.1%) |
| Accommodation & Food Services | 199 (53.3%) | 174 (46.7%) |
| Public Administration | 9 (15.2%) | 50 (84.8%) |
| Total | 1,842 (48.2%) | 1,977 (51.8%) |
Education in Gettysburg borough
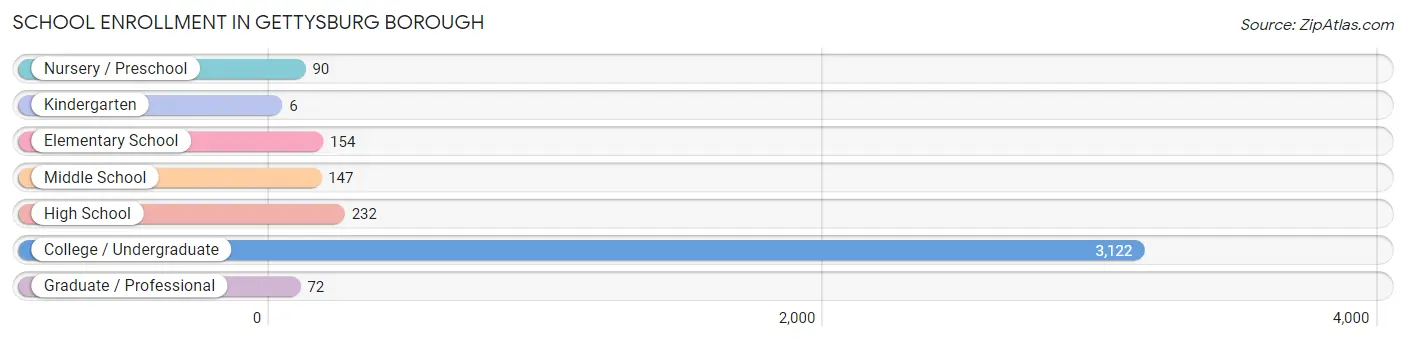
School Enrollment in Gettysburg borough
The most common levels of schooling among the 3,823 students in Gettysburg borough are college / undergraduate (3,122 | 81.7%), high school (232 | 6.1%), and elementary school (154 | 4.0%).
| School Level | # Students | % Students |
| Nursery / Preschool | 90 | 2.4% |
| Kindergarten | 6 | 0.2% |
| Elementary School | 154 | 4.0% |
| Middle School | 147 | 3.8% |
| High School | 232 | 6.1% |
| College / Undergraduate | 3,122 | 81.7% |
| Graduate / Professional | 72 | 1.9% |
| Total | 3,823 | 100.0% |
School Enrollment by Age by Funding Source in Gettysburg borough
Out of a total of 3,823 students who are enrolled in schools in Gettysburg borough, 2,978 (77.9%) attend a private institution, while the remaining 845 (22.1%) are enrolled in public schools. The age group of 20 to 24 year olds has the highest likelihood of being enrolled in private schools, with 1,422 (98.5% in the age bracket) enrolled. Conversely, the age group of 5 to 9 year old has the lowest likelihood of being enrolled in a private school, with 149 (100.0% in the age bracket) attending a public institution.
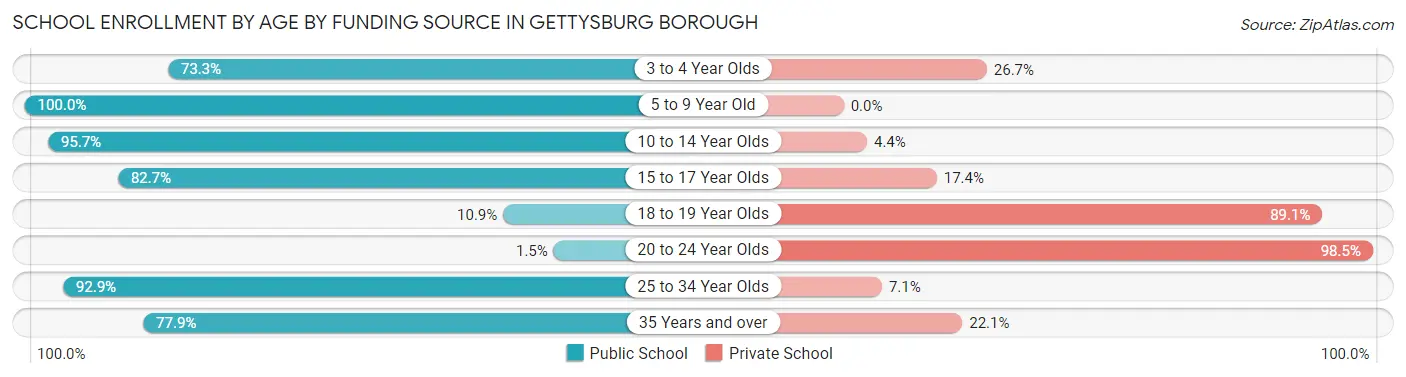
| Age Bracket | Public School | Private School |
| 3 to 4 Year Olds | 66 (73.3%) | 24 (26.7%) |
| 5 to 9 Year Old | 149 (100.0%) | 0 (0.0%) |
| 10 to 14 Year Olds | 176 (95.7%) | 8 (4.3%) |
| 15 to 17 Year Olds | 162 (82.7%) | 34 (17.3%) |
| 18 to 19 Year Olds | 179 (10.9%) | 1,468 (89.1%) |
| 20 to 24 Year Olds | 21 (1.5%) | 1,422 (98.5%) |
| 25 to 34 Year Olds | 26 (92.9%) | 2 (7.1%) |
| 35 Years and over | 67 (77.9%) | 19 (22.1%) |
| Total | 845 (22.1%) | 2,978 (77.9%) |
Educational Attainment by Field of Study in Gettysburg borough
Education (260 | 15.1%), social sciences (241 | 14.0%), business (222 | 12.9%), liberal arts & history (194 | 11.3%), and literature & languages (161 | 9.3%) are the most common fields of study among 1,724 individuals in Gettysburg borough who have obtained a bachelor's degree or higher.
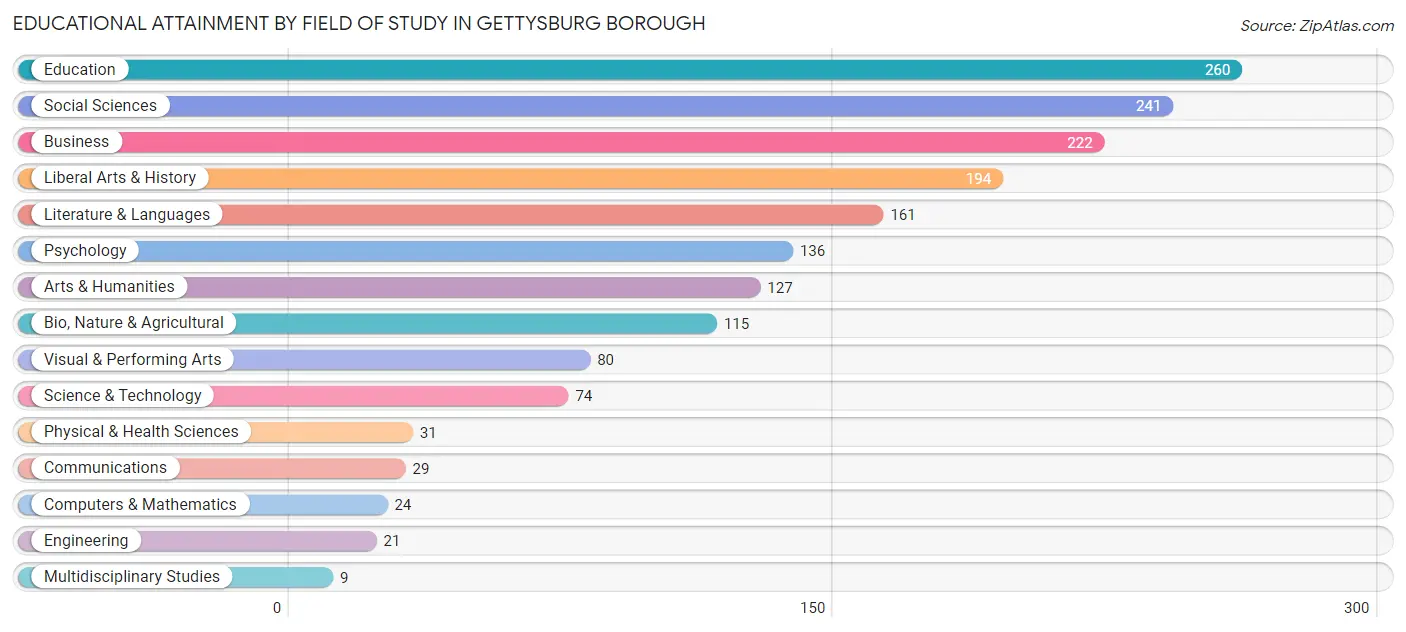
| Field of Study | # Graduates | % Graduates |
| Computers & Mathematics | 24 | 1.4% |
| Bio, Nature & Agricultural | 115 | 6.7% |
| Physical & Health Sciences | 31 | 1.8% |
| Psychology | 136 | 7.9% |
| Social Sciences | 241 | 14.0% |
| Engineering | 21 | 1.2% |
| Multidisciplinary Studies | 9 | 0.5% |
| Science & Technology | 74 | 4.3% |
| Business | 222 | 12.9% |
| Education | 260 | 15.1% |
| Literature & Languages | 161 | 9.3% |
| Liberal Arts & History | 194 | 11.3% |
| Visual & Performing Arts | 80 | 4.6% |
| Communications | 29 | 1.7% |
| Arts & Humanities | 127 | 7.4% |
| Total | 1,724 | 100.0% |
Transportation & Commute in Gettysburg borough
Vehicle Availability by Sex in Gettysburg borough
The most prevalent vehicle ownership categories in Gettysburg borough are males with 2 vehicles (624, accounting for 46.7%) and females with 2 vehicles (574, making up 50.6%).
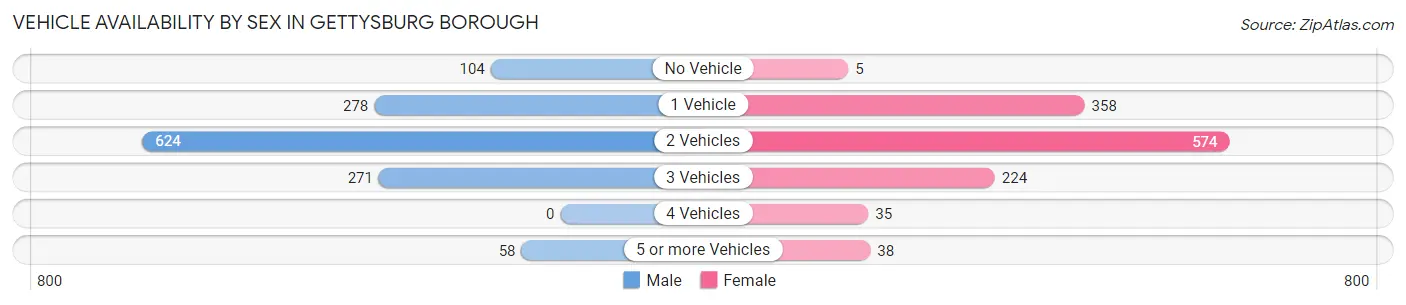
| Vehicles Available | Male | Female |
| No Vehicle | 104 (7.8%) | 5 (0.4%) |
| 1 Vehicle | 278 (20.8%) | 358 (29.0%) |
| 2 Vehicles | 624 (46.7%) | 574 (46.5%) |
| 3 Vehicles | 271 (20.3%) | 224 (18.1%) |
| 4 Vehicles | 0 (0.0%) | 35 (2.8%) |
| 5 or more Vehicles | 58 (4.3%) | 38 (3.1%) |
| Total | 1,335 (100.0%) | 1,234 (100.0%) |
Commute Time in Gettysburg borough
The most frequently occuring commute durations in Gettysburg borough are 5 to 9 minutes (926 commuters, 29.2%), 10 to 14 minutes (739 commuters, 23.3%), and less than 5 minutes (378 commuters, 11.9%).
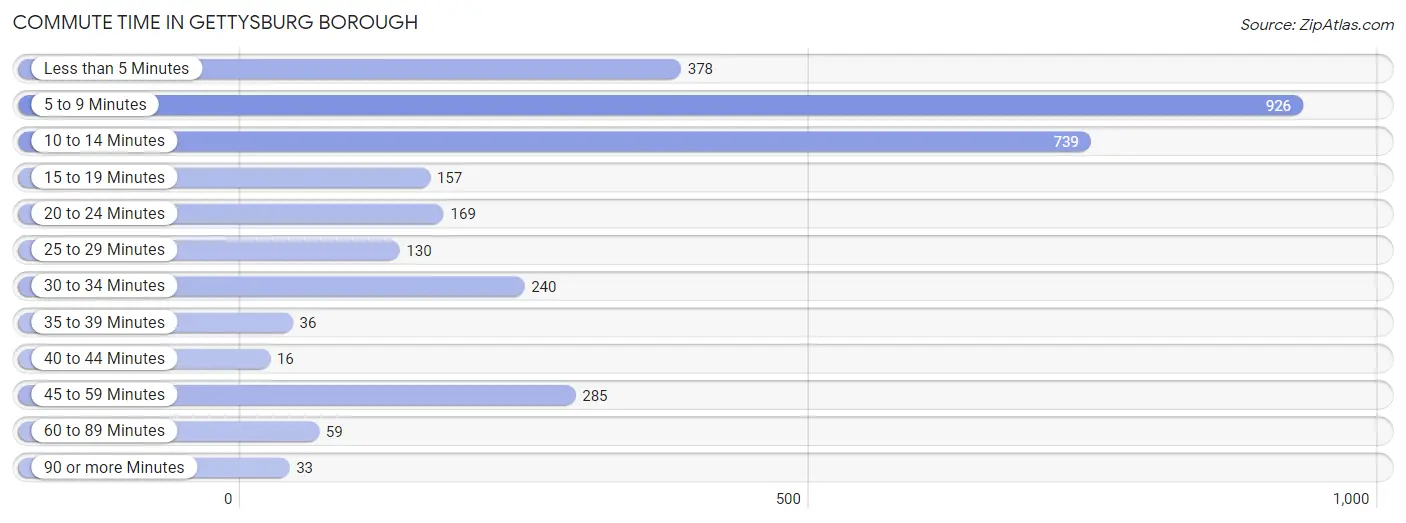
| Commute Time | # Commuters | % Commuters |
| Less than 5 Minutes | 378 | 11.9% |
| 5 to 9 Minutes | 926 | 29.2% |
| 10 to 14 Minutes | 739 | 23.3% |
| 15 to 19 Minutes | 157 | 5.0% |
| 20 to 24 Minutes | 169 | 5.3% |
| 25 to 29 Minutes | 130 | 4.1% |
| 30 to 34 Minutes | 240 | 7.6% |
| 35 to 39 Minutes | 36 | 1.1% |
| 40 to 44 Minutes | 16 | 0.5% |
| 45 to 59 Minutes | 285 | 9.0% |
| 60 to 89 Minutes | 59 | 1.9% |
| 90 or more Minutes | 33 | 1.0% |
Commute Time by Sex in Gettysburg borough
The most common commute times in Gettysburg borough are 5 to 9 minutes (490 commuters, 32.7%) for males and 10 to 14 minutes (511 commuters, 30.6%) for females.
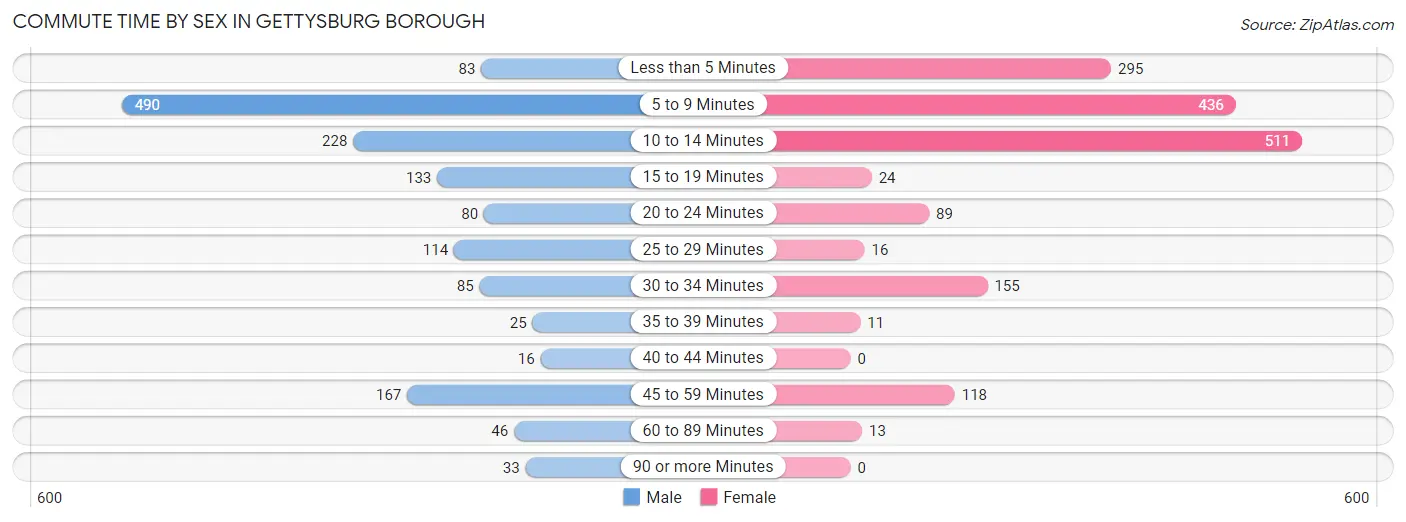
| Commute Time | Male | Female |
| Less than 5 Minutes | 83 (5.5%) | 295 (17.7%) |
| 5 to 9 Minutes | 490 (32.7%) | 436 (26.1%) |
| 10 to 14 Minutes | 228 (15.2%) | 511 (30.6%) |
| 15 to 19 Minutes | 133 (8.9%) | 24 (1.4%) |
| 20 to 24 Minutes | 80 (5.3%) | 89 (5.3%) |
| 25 to 29 Minutes | 114 (7.6%) | 16 (1.0%) |
| 30 to 34 Minutes | 85 (5.7%) | 155 (9.3%) |
| 35 to 39 Minutes | 25 (1.7%) | 11 (0.7%) |
| 40 to 44 Minutes | 16 (1.1%) | 0 (0.0%) |
| 45 to 59 Minutes | 167 (11.1%) | 118 (7.1%) |
| 60 to 89 Minutes | 46 (3.1%) | 13 (0.8%) |
| 90 or more Minutes | 33 (2.2%) | 0 (0.0%) |
Time of Departure to Work by Sex in Gettysburg borough
The most frequent times of departure to work in Gettysburg borough are 7:30 AM to 7:59 AM (240, 16.0%) for males and 12:00 PM to 3:59 PM (552, 33.1%) for females.
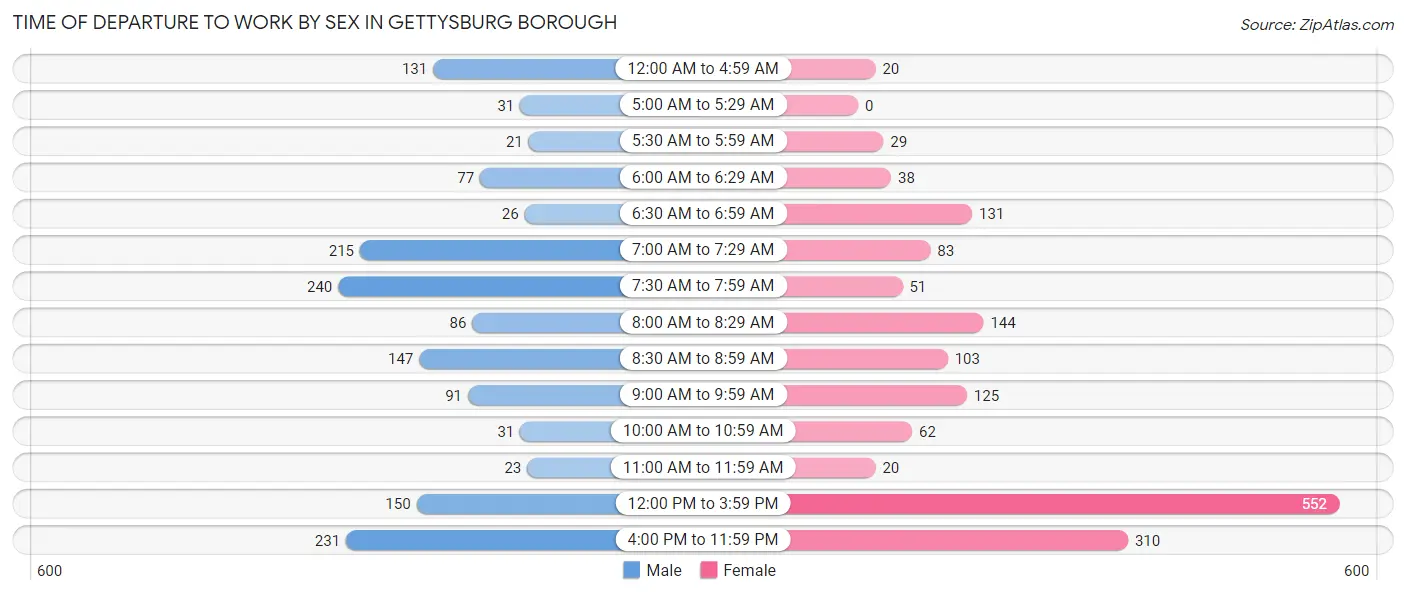
| Time of Departure | Male | Female |
| 12:00 AM to 4:59 AM | 131 (8.7%) | 20 (1.2%) |
| 5:00 AM to 5:29 AM | 31 (2.1%) | 0 (0.0%) |
| 5:30 AM to 5:59 AM | 21 (1.4%) | 29 (1.7%) |
| 6:00 AM to 6:29 AM | 77 (5.1%) | 38 (2.3%) |
| 6:30 AM to 6:59 AM | 26 (1.7%) | 131 (7.9%) |
| 7:00 AM to 7:29 AM | 215 (14.3%) | 83 (5.0%) |
| 7:30 AM to 7:59 AM | 240 (16.0%) | 51 (3.1%) |
| 8:00 AM to 8:29 AM | 86 (5.7%) | 144 (8.6%) |
| 8:30 AM to 8:59 AM | 147 (9.8%) | 103 (6.2%) |
| 9:00 AM to 9:59 AM | 91 (6.1%) | 125 (7.5%) |
| 10:00 AM to 10:59 AM | 31 (2.1%) | 62 (3.7%) |
| 11:00 AM to 11:59 AM | 23 (1.5%) | 20 (1.2%) |
| 12:00 PM to 3:59 PM | 150 (10.0%) | 552 (33.1%) |
| 4:00 PM to 11:59 PM | 231 (15.4%) | 310 (18.6%) |
| Total | 1,500 (100.0%) | 1,668 (100.0%) |
Housing Occupancy in Gettysburg borough
Occupancy by Ownership in Gettysburg borough
Of the total 2,303 dwellings in Gettysburg borough, owner-occupied units account for 1,007 (43.7%), while renter-occupied units make up 1,296 (56.3%).
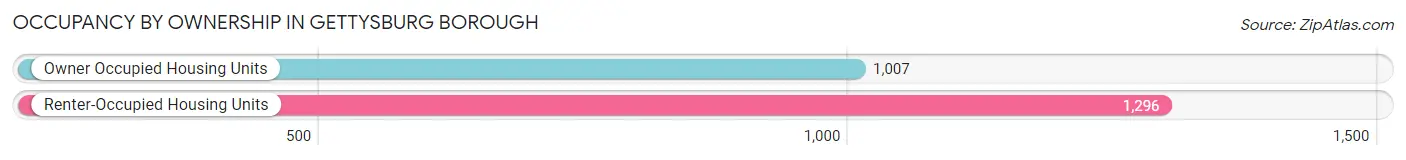
| Occupancy | # Housing Units | % Housing Units |
| Owner Occupied Housing Units | 1,007 | 43.7% |
| Renter-Occupied Housing Units | 1,296 | 56.3% |
| Total Occupied Housing Units | 2,303 | 100.0% |
Occupancy by Household Size in Gettysburg borough
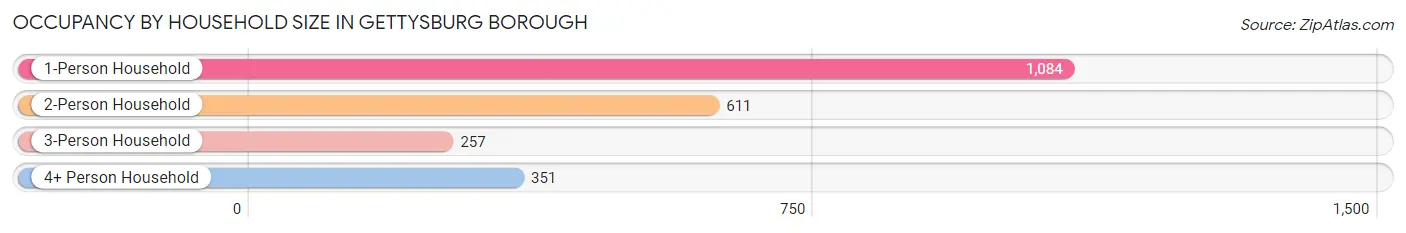
| Household Size | # Housing Units | % Housing Units |
| 1-Person Household | 1,084 | 47.1% |
| 2-Person Household | 611 | 26.5% |
| 3-Person Household | 257 | 11.2% |
| 4+ Person Household | 351 | 15.2% |
| Total Housing Units | 2,303 | 100.0% |
Occupancy by Ownership by Household Size in Gettysburg borough
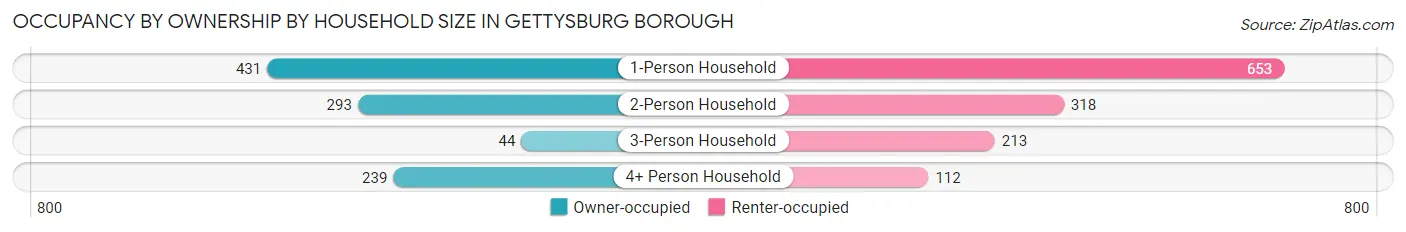
| Household Size | Owner-occupied | Renter-occupied |
| 1-Person Household | 431 (39.8%) | 653 (60.2%) |
| 2-Person Household | 293 (47.9%) | 318 (52.0%) |
| 3-Person Household | 44 (17.1%) | 213 (82.9%) |
| 4+ Person Household | 239 (68.1%) | 112 (31.9%) |
| Total Housing Units | 1,007 (43.7%) | 1,296 (56.3%) |
Occupancy by Educational Attainment in Gettysburg borough
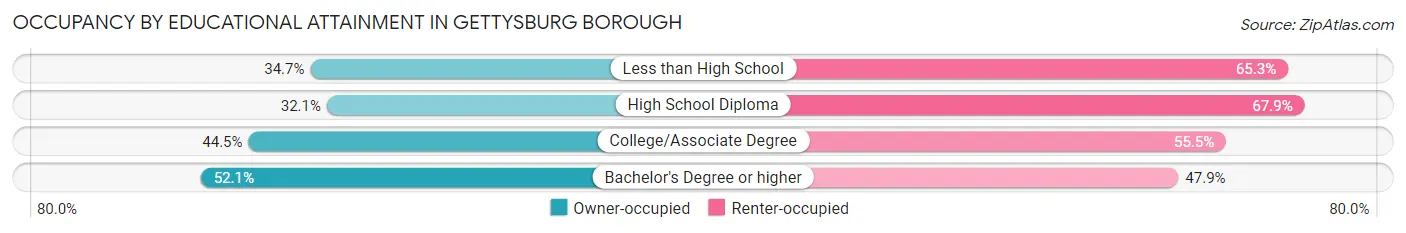
| Household Size | Owner-occupied | Renter-occupied |
| Less than High School | 51 (34.7%) | 96 (65.3%) |
| High School Diploma | 203 (32.1%) | 430 (67.9%) |
| College/Associate Degree | 235 (44.5%) | 293 (55.5%) |
| Bachelor's Degree or higher | 518 (52.1%) | 477 (47.9%) |
Occupancy by Age of Householder in Gettysburg borough
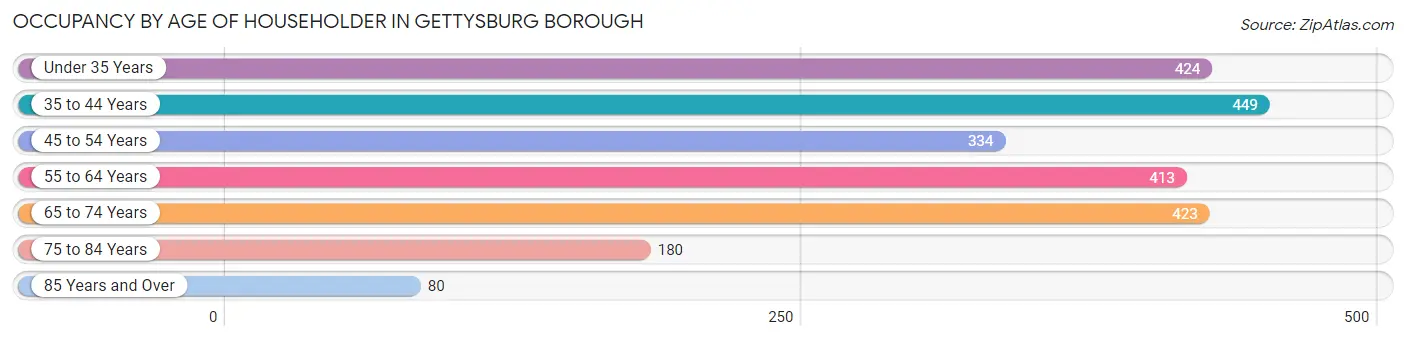
| Age Bracket | # Households | % Households |
| Under 35 Years | 424 | 18.4% |
| 35 to 44 Years | 449 | 19.5% |
| 45 to 54 Years | 334 | 14.5% |
| 55 to 64 Years | 413 | 17.9% |
| 65 to 74 Years | 423 | 18.4% |
| 75 to 84 Years | 180 | 7.8% |
| 85 Years and Over | 80 | 3.5% |
| Total | 2,303 | 100.0% |
Housing Finances in Gettysburg borough
Median Income by Occupancy in Gettysburg borough
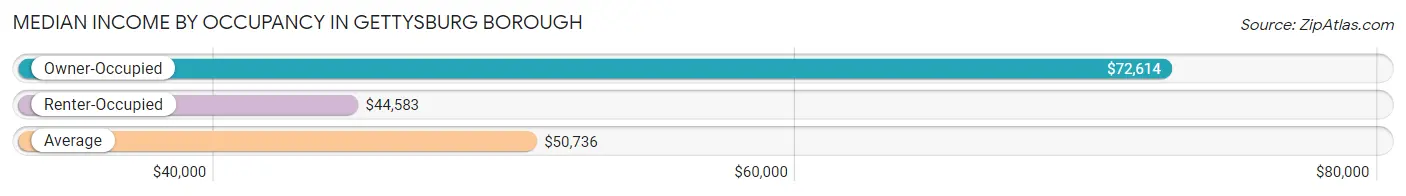
| Occupancy Type | # Households | Median Income |
| Owner-Occupied | 1,007 (43.7%) | $72,614 |
| Renter-Occupied | 1,296 (56.3%) | $44,583 |
| Average | 2,303 (100.0%) | $50,736 |
Occupancy by Householder Income Bracket in Gettysburg borough
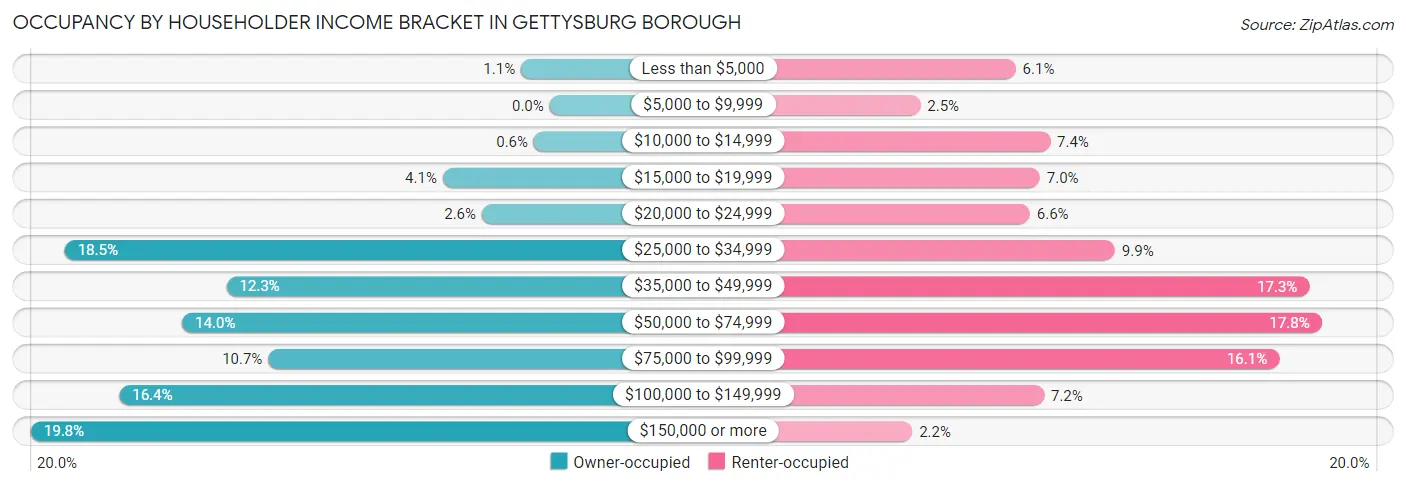
| Income Bracket | Owner-occupied | Renter-occupied |
| Less than $5,000 | 11 (1.1%) | 79 (6.1%) |
| $5,000 to $9,999 | 0 (0.0%) | 32 (2.5%) |
| $10,000 to $14,999 | 6 (0.6%) | 96 (7.4%) |
| $15,000 to $19,999 | 41 (4.1%) | 91 (7.0%) |
| $20,000 to $24,999 | 26 (2.6%) | 86 (6.6%) |
| $25,000 to $34,999 | 186 (18.5%) | 128 (9.9%) |
| $35,000 to $49,999 | 124 (12.3%) | 224 (17.3%) |
| $50,000 to $74,999 | 141 (14.0%) | 230 (17.7%) |
| $75,000 to $99,999 | 108 (10.7%) | 209 (16.1%) |
| $100,000 to $149,999 | 165 (16.4%) | 93 (7.2%) |
| $150,000 or more | 199 (19.8%) | 28 (2.2%) |
| Total | 1,007 (100.0%) | 1,296 (100.0%) |
Monthly Housing Cost Tiers in Gettysburg borough
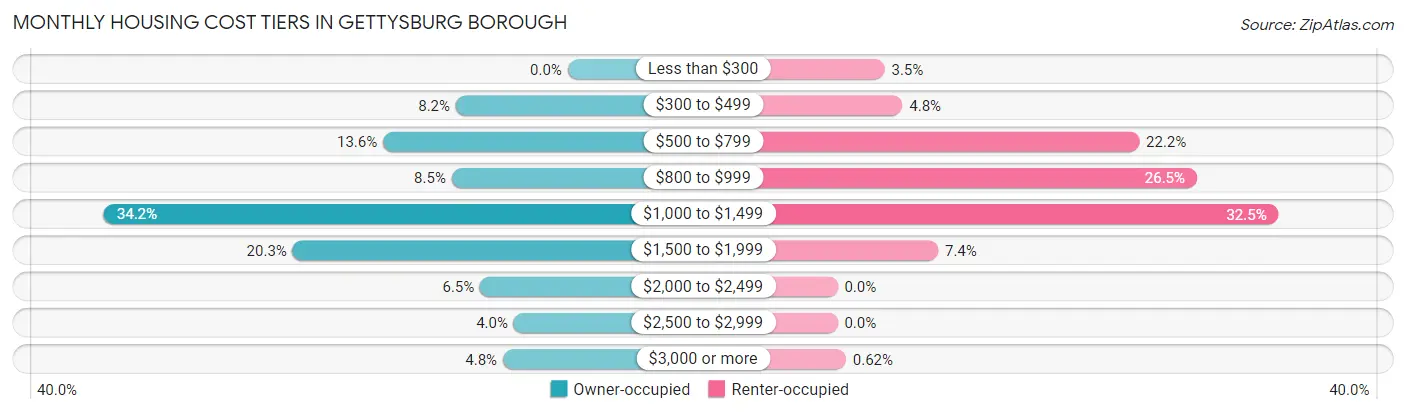
| Monthly Cost | Owner-occupied | Renter-occupied |
| Less than $300 | 0 (0.0%) | 45 (3.5%) |
| $300 to $499 | 83 (8.2%) | 62 (4.8%) |
| $500 to $799 | 137 (13.6%) | 288 (22.2%) |
| $800 to $999 | 86 (8.5%) | 343 (26.5%) |
| $1,000 to $1,499 | 344 (34.2%) | 421 (32.5%) |
| $1,500 to $1,999 | 204 (20.3%) | 96 (7.4%) |
| $2,000 to $2,499 | 65 (6.5%) | 0 (0.0%) |
| $2,500 to $2,999 | 40 (4.0%) | 0 (0.0%) |
| $3,000 or more | 48 (4.8%) | 8 (0.6%) |
| Total | 1,007 (100.0%) | 1,296 (100.0%) |
Physical Housing Characteristics in Gettysburg borough
Housing Structures in Gettysburg borough
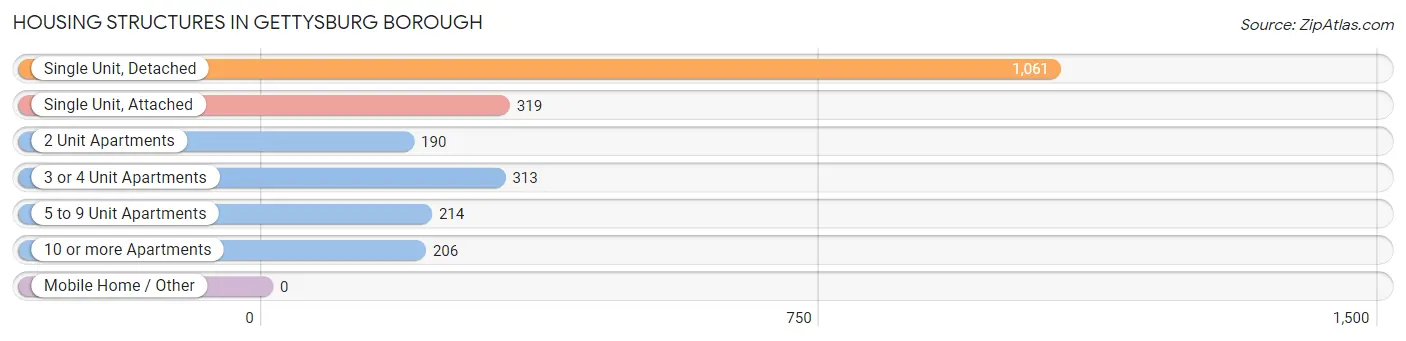
| Structure Type | # Housing Units | % Housing Units |
| Single Unit, Detached | 1,061 | 46.1% |
| Single Unit, Attached | 319 | 13.9% |
| 2 Unit Apartments | 190 | 8.3% |
| 3 or 4 Unit Apartments | 313 | 13.6% |
| 5 to 9 Unit Apartments | 214 | 9.3% |
| 10 or more Apartments | 206 | 8.9% |
| Mobile Home / Other | 0 | 0.0% |
| Total | 2,303 | 100.0% |
Housing Structures by Occupancy in Gettysburg borough
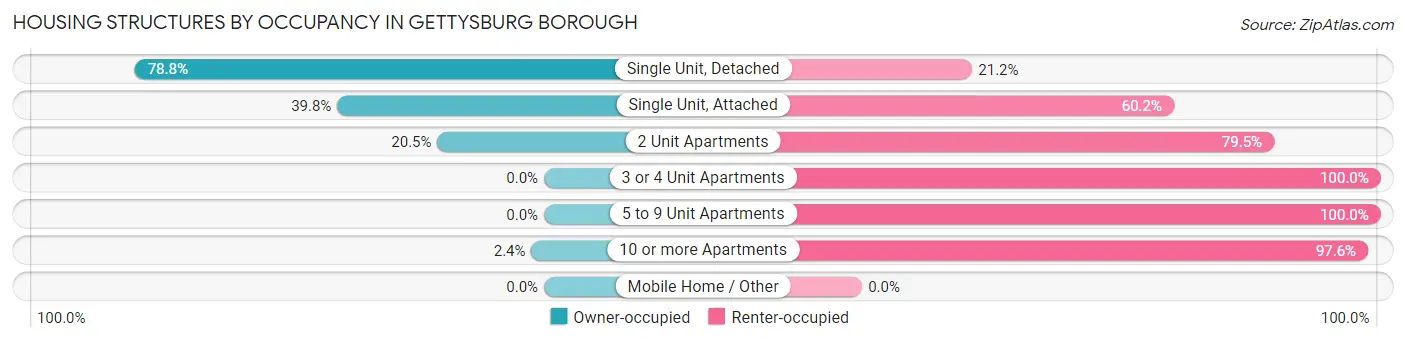
| Structure Type | Owner-occupied | Renter-occupied |
| Single Unit, Detached | 836 (78.8%) | 225 (21.2%) |
| Single Unit, Attached | 127 (39.8%) | 192 (60.2%) |
| 2 Unit Apartments | 39 (20.5%) | 151 (79.5%) |
| 3 or 4 Unit Apartments | 0 (0.0%) | 313 (100.0%) |
| 5 to 9 Unit Apartments | 0 (0.0%) | 214 (100.0%) |
| 10 or more Apartments | 5 (2.4%) | 201 (97.6%) |
| Mobile Home / Other | 0 (0.0%) | 0 (0.0%) |
| Total | 1,007 (43.7%) | 1,296 (56.3%) |
Housing Structures by Number of Rooms in Gettysburg borough
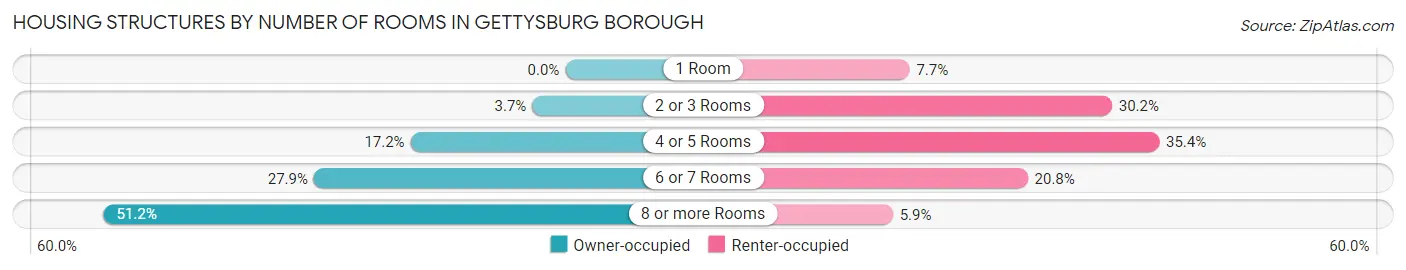
| Number of Rooms | Owner-occupied | Renter-occupied |
| 1 Room | 0 (0.0%) | 100 (7.7%) |
| 2 or 3 Rooms | 37 (3.7%) | 391 (30.2%) |
| 4 or 5 Rooms | 173 (17.2%) | 459 (35.4%) |
| 6 or 7 Rooms | 281 (27.9%) | 270 (20.8%) |
| 8 or more Rooms | 516 (51.2%) | 76 (5.9%) |
| Total | 1,007 (100.0%) | 1,296 (100.0%) |
Housing Structure by Heating Type in Gettysburg borough
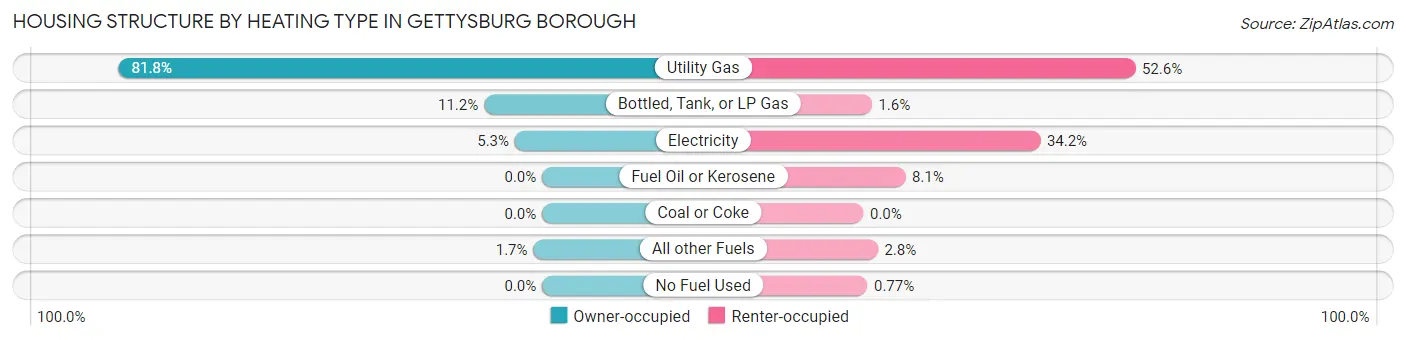
| Heating Type | Owner-occupied | Renter-occupied |
| Utility Gas | 824 (81.8%) | 681 (52.5%) |
| Bottled, Tank, or LP Gas | 113 (11.2%) | 21 (1.6%) |
| Electricity | 53 (5.3%) | 443 (34.2%) |
| Fuel Oil or Kerosene | 0 (0.0%) | 105 (8.1%) |
| Coal or Coke | 0 (0.0%) | 0 (0.0%) |
| All other Fuels | 17 (1.7%) | 36 (2.8%) |
| No Fuel Used | 0 (0.0%) | 10 (0.8%) |
| Total | 1,007 (100.0%) | 1,296 (100.0%) |
Household Vehicle Usage in Gettysburg borough
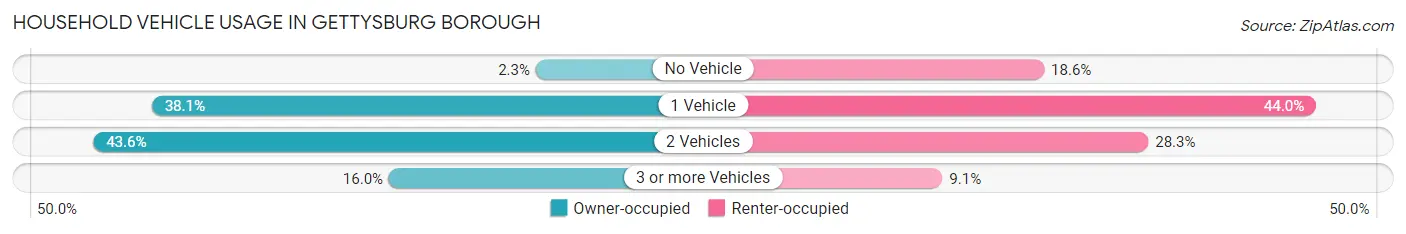
| Vehicles per Household | Owner-occupied | Renter-occupied |
| No Vehicle | 23 (2.3%) | 241 (18.6%) |
| 1 Vehicle | 384 (38.1%) | 570 (44.0%) |
| 2 Vehicles | 439 (43.6%) | 367 (28.3%) |
| 3 or more Vehicles | 161 (16.0%) | 118 (9.1%) |
| Total | 1,007 (100.0%) | 1,296 (100.0%) |
Real Estate & Mortgages in Gettysburg borough
Real Estate and Mortgage Overview in Gettysburg borough
| Characteristic | Without Mortgage | With Mortgage |
| Housing Units | 343 | 664 |
| Median Property Value | $241,300 | $241,600 |
| Median Household Income | $70,250 | $118 |
| Monthly Housing Costs | $678 | $48 |
| Real Estate Taxes | $3,795 | $101 |
Property Value by Mortgage Status in Gettysburg borough
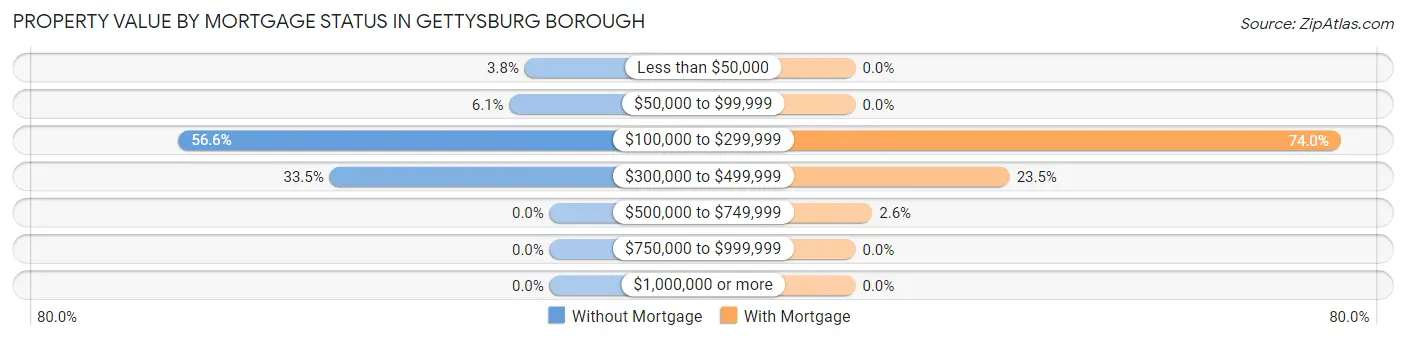
| Property Value | Without Mortgage | With Mortgage |
| Less than $50,000 | 13 (3.8%) | 0 (0.0%) |
| $50,000 to $99,999 | 21 (6.1%) | 0 (0.0%) |
| $100,000 to $299,999 | 194 (56.6%) | 491 (74.0%) |
| $300,000 to $499,999 | 115 (33.5%) | 156 (23.5%) |
| $500,000 to $749,999 | 0 (0.0%) | 17 (2.6%) |
| $750,000 to $999,999 | 0 (0.0%) | 0 (0.0%) |
| $1,000,000 or more | 0 (0.0%) | 0 (0.0%) |
| Total | 343 (100.0%) | 664 (100.0%) |
Household Income by Mortgage Status in Gettysburg borough
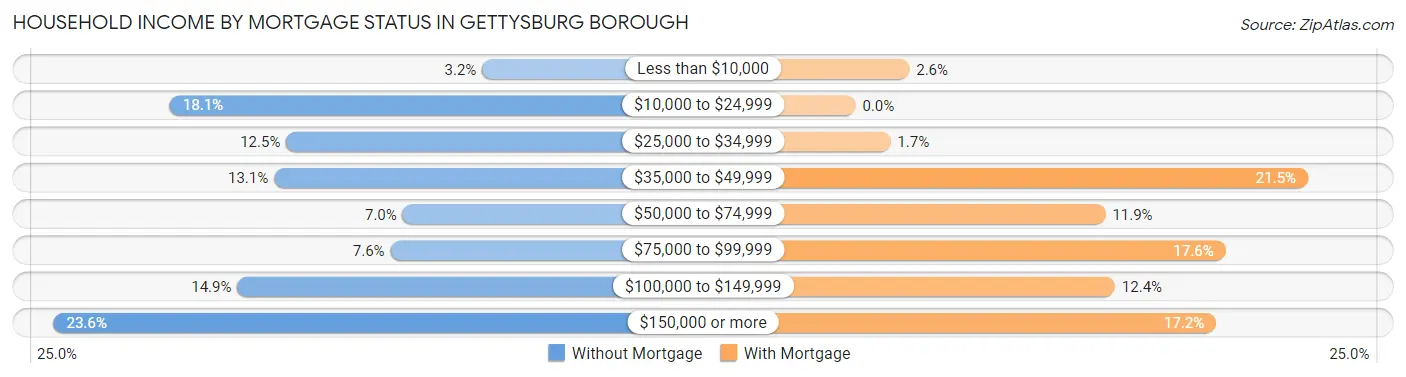
| Household Income | Without Mortgage | With Mortgage |
| Less than $10,000 | 11 (3.2%) | 17 (2.6%) |
| $10,000 to $24,999 | 62 (18.1%) | 0 (0.0%) |
| $25,000 to $34,999 | 43 (12.5%) | 11 (1.7%) |
| $35,000 to $49,999 | 45 (13.1%) | 143 (21.5%) |
| $50,000 to $74,999 | 24 (7.0%) | 79 (11.9%) |
| $75,000 to $99,999 | 26 (7.6%) | 117 (17.6%) |
| $100,000 to $149,999 | 51 (14.9%) | 82 (12.3%) |
| $150,000 or more | 81 (23.6%) | 114 (17.2%) |
| Total | 343 (100.0%) | 664 (100.0%) |
Property Value to Household Income Ratio in Gettysburg borough
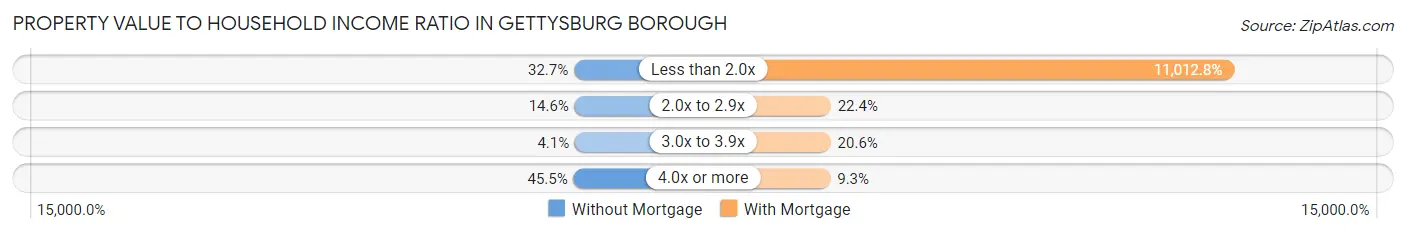
| Value-to-Income Ratio | Without Mortgage | With Mortgage |
| Less than 2.0x | 112 (32.7%) | 73,125 (11,012.8%) |
| 2.0x to 2.9x | 50 (14.6%) | 149 (22.4%) |
| 3.0x to 3.9x | 14 (4.1%) | 137 (20.6%) |
| 4.0x or more | 156 (45.5%) | 62 (9.3%) |
| Total | 343 (100.0%) | 664 (100.0%) |
Real Estate Taxes by Mortgage Status in Gettysburg borough
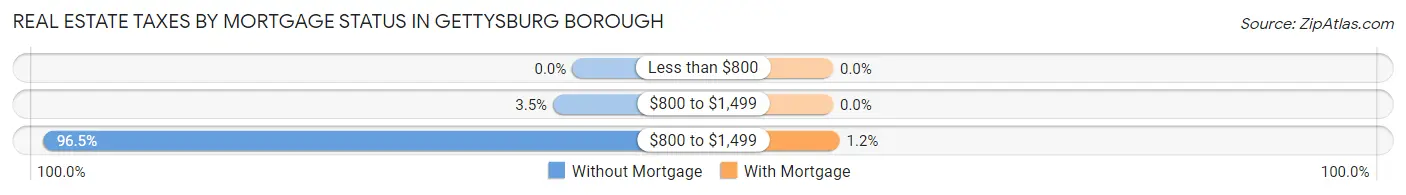
| Property Taxes | Without Mortgage | With Mortgage |
| Less than $800 | 0 (0.0%) | 0 (0.0%) |
| $800 to $1,499 | 12 (3.5%) | 0 (0.0%) |
| $800 to $1,499 | 331 (96.5%) | 8 (1.2%) |
| Total | 343 (100.0%) | 664 (100.0%) |
Health & Disability in Gettysburg borough
Health Insurance Coverage by Age in Gettysburg borough
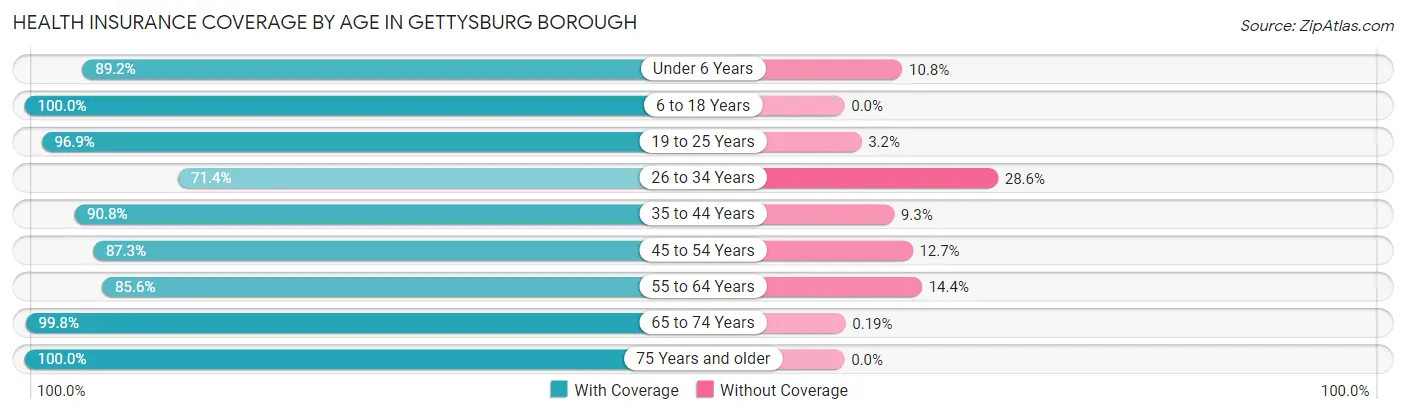
| Age Bracket | With Coverage | Without Coverage |
| Under 6 Years | 207 (89.2%) | 25 (10.8%) |
| 6 to 18 Years | 1,489 (100.0%) | 0 (0.0%) |
| 19 to 25 Years | 2,333 (96.9%) | 76 (3.2%) |
| 26 to 34 Years | 531 (71.4%) | 213 (28.6%) |
| 35 to 44 Years | 726 (90.7%) | 74 (9.2%) |
| 45 to 54 Years | 515 (87.3%) | 75 (12.7%) |
| 55 to 64 Years | 462 (85.6%) | 78 (14.4%) |
| 65 to 74 Years | 536 (99.8%) | 1 (0.2%) |
| 75 Years and older | 368 (100.0%) | 0 (0.0%) |
| Total | 7,167 (93.0%) | 542 (7.0%) |
Health Insurance Coverage by Citizenship Status in Gettysburg borough
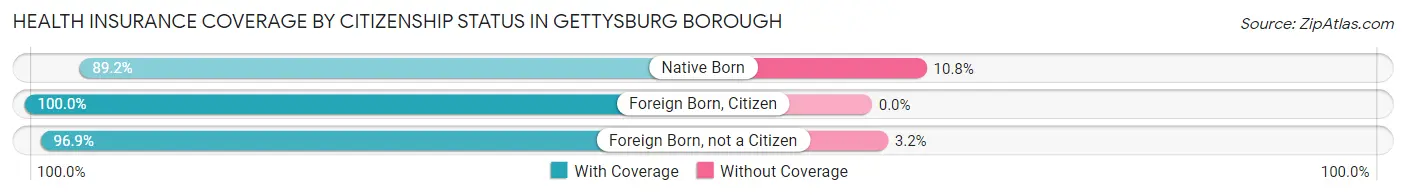
| Citizenship Status | With Coverage | Without Coverage |
| Native Born | 207 (89.2%) | 25 (10.8%) |
| Foreign Born, Citizen | 1,489 (100.0%) | 0 (0.0%) |
| Foreign Born, not a Citizen | 2,333 (96.9%) | 76 (3.2%) |
Health Insurance Coverage by Household Income in Gettysburg borough
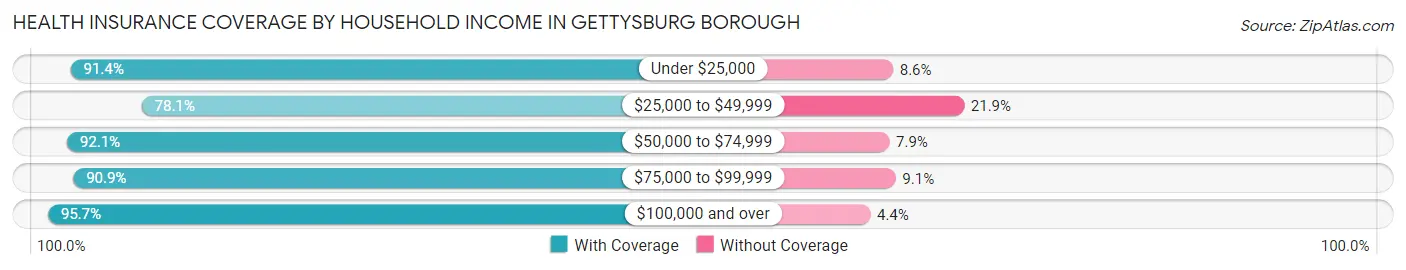
| Household Income | With Coverage | Without Coverage |
| Under $25,000 | 604 (91.4%) | 57 (8.6%) |
| $25,000 to $49,999 | 833 (78.1%) | 234 (21.9%) |
| $50,000 to $74,999 | 731 (92.1%) | 63 (7.9%) |
| $75,000 to $99,999 | 688 (90.9%) | 69 (9.1%) |
| $100,000 and over | 1,494 (95.7%) | 68 (4.3%) |
Public vs Private Health Insurance Coverage by Age in Gettysburg borough
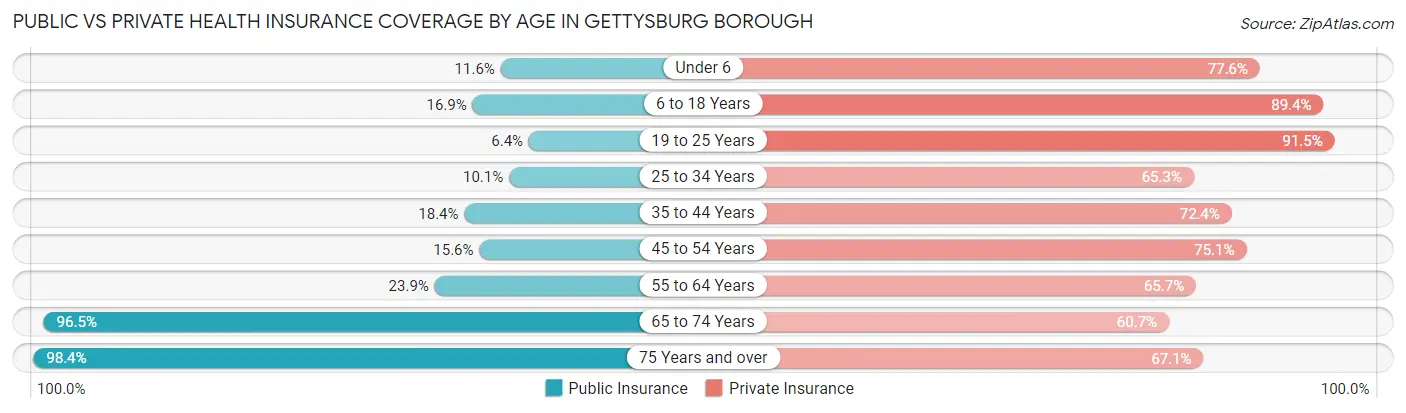
| Age Bracket | Public Insurance | Private Insurance |
| Under 6 | 27 (11.6%) | 180 (77.6%) |
| 6 to 18 Years | 251 (16.9%) | 1,331 (89.4%) |
| 19 to 25 Years | 154 (6.4%) | 2,203 (91.4%) |
| 25 to 34 Years | 75 (10.1%) | 486 (65.3%) |
| 35 to 44 Years | 147 (18.4%) | 579 (72.4%) |
| 45 to 54 Years | 92 (15.6%) | 443 (75.1%) |
| 55 to 64 Years | 129 (23.9%) | 355 (65.7%) |
| 65 to 74 Years | 518 (96.5%) | 326 (60.7%) |
| 75 Years and over | 362 (98.4%) | 247 (67.1%) |
| Total | 1,755 (22.8%) | 6,150 (79.8%) |
Disability Status by Sex by Age in Gettysburg borough
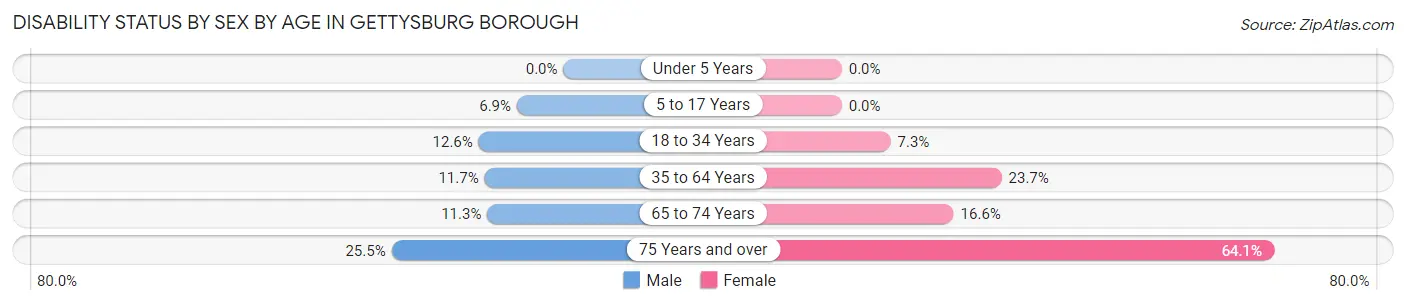
| Age Bracket | Male | Female |
| Under 5 Years | 0 (0.0%) | 0 (0.0%) |
| 5 to 17 Years | 22 (6.9%) | 0 (0.0%) |
| 18 to 34 Years | 261 (12.6%) | 143 (7.2%) |
| 35 to 64 Years | 115 (11.7%) | 225 (23.7%) |
| 65 to 74 Years | 26 (11.3%) | 51 (16.6%) |
| 75 Years and over | 37 (25.5%) | 143 (64.1%) |
Disability Class by Sex by Age in Gettysburg borough
Disability Class: Hearing Difficulty
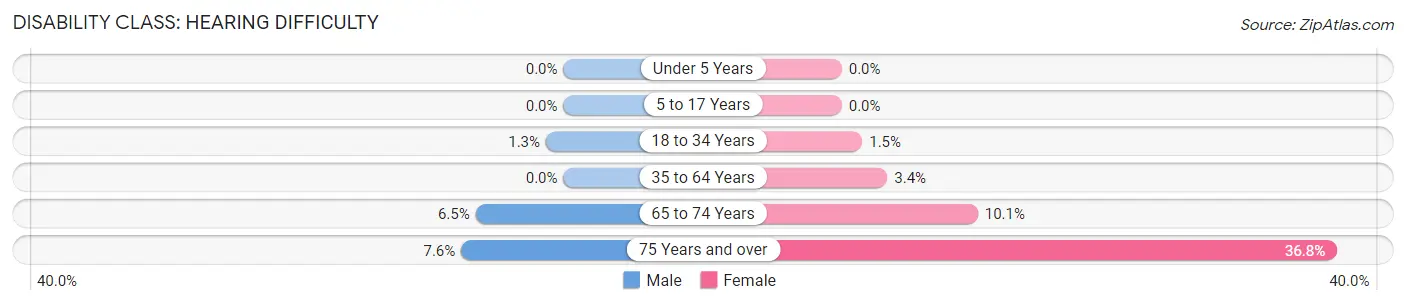
| Age Bracket | Male | Female |
| Under 5 Years | 0 (0.0%) | 0 (0.0%) |
| 5 to 17 Years | 0 (0.0%) | 0 (0.0%) |
| 18 to 34 Years | 27 (1.3%) | 30 (1.5%) |
| 35 to 64 Years | 0 (0.0%) | 32 (3.4%) |
| 65 to 74 Years | 15 (6.5%) | 31 (10.1%) |
| 75 Years and over | 11 (7.6%) | 82 (36.8%) |
Disability Class: Vision Difficulty
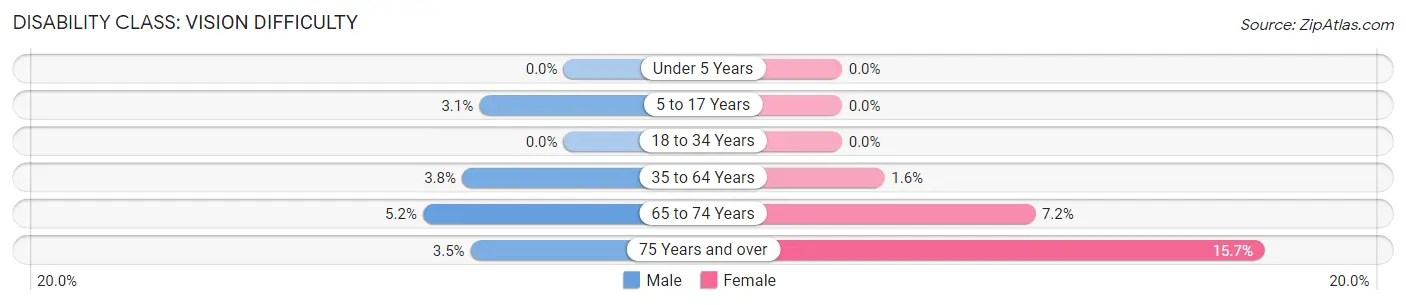
| Age Bracket | Male | Female |
| Under 5 Years | 0 (0.0%) | 0 (0.0%) |
| 5 to 17 Years | 10 (3.1%) | 0 (0.0%) |
| 18 to 34 Years | 0 (0.0%) | 0 (0.0%) |
| 35 to 64 Years | 37 (3.8%) | 15 (1.6%) |
| 65 to 74 Years | 12 (5.2%) | 22 (7.2%) |
| 75 Years and over | 5 (3.5%) | 35 (15.7%) |
Disability Class: Cognitive Difficulty
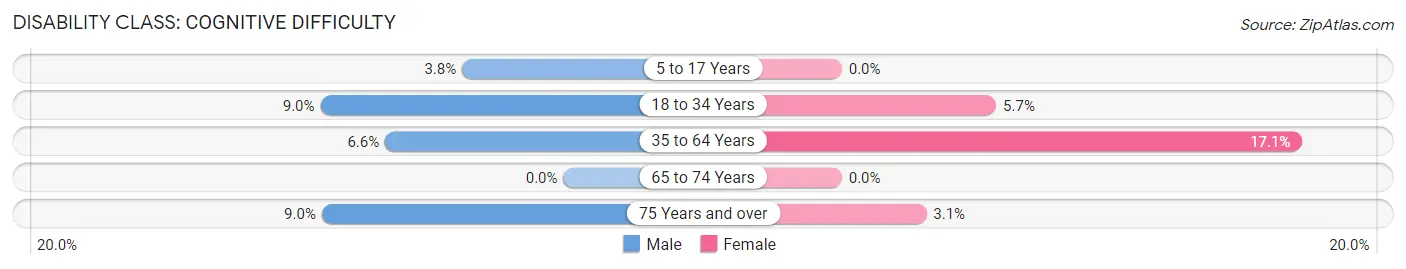
| Age Bracket | Male | Female |
| 5 to 17 Years | 12 (3.8%) | 0 (0.0%) |
| 18 to 34 Years | 187 (9.0%) | 113 (5.7%) |
| 35 to 64 Years | 65 (6.6%) | 162 (17.1%) |
| 65 to 74 Years | 0 (0.0%) | 0 (0.0%) |
| 75 Years and over | 13 (9.0%) | 7 (3.1%) |
Disability Class: Ambulatory Difficulty
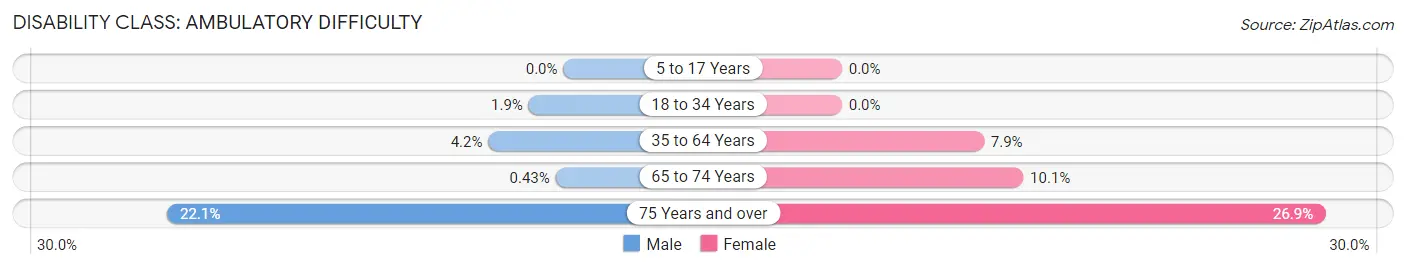
| Age Bracket | Male | Female |
| 5 to 17 Years | 0 (0.0%) | 0 (0.0%) |
| 18 to 34 Years | 40 (1.9%) | 0 (0.0%) |
| 35 to 64 Years | 41 (4.2%) | 75 (7.9%) |
| 65 to 74 Years | 1 (0.4%) | 31 (10.1%) |
| 75 Years and over | 32 (22.1%) | 60 (26.9%) |
Disability Class: Self-Care Difficulty
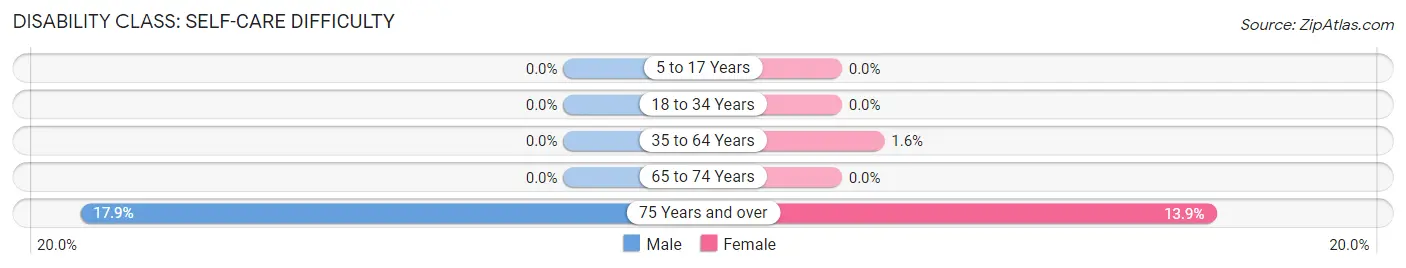
| Age Bracket | Male | Female |
| 5 to 17 Years | 0 (0.0%) | 0 (0.0%) |
| 18 to 34 Years | 0 (0.0%) | 0 (0.0%) |
| 35 to 64 Years | 0 (0.0%) | 15 (1.6%) |
| 65 to 74 Years | 0 (0.0%) | 0 (0.0%) |
| 75 Years and over | 26 (17.9%) | 31 (13.9%) |
Technology Access in Gettysburg borough
Computing Device Access in Gettysburg borough
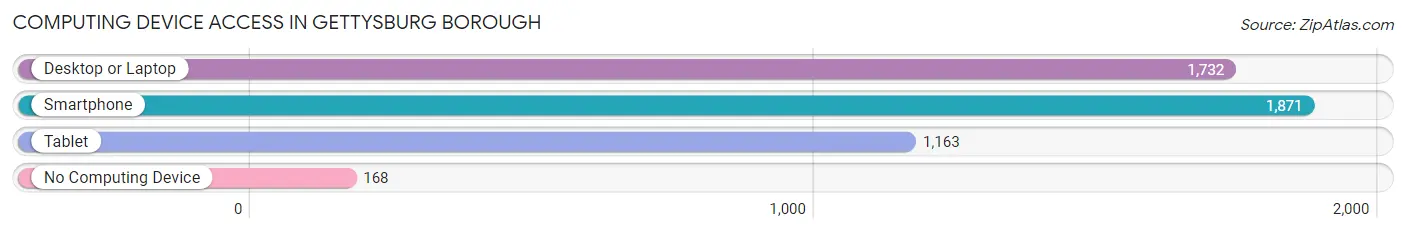
| Device Type | # Households | % Households |
| Desktop or Laptop | 1,732 | 75.2% |
| Smartphone | 1,871 | 81.2% |
| Tablet | 1,163 | 50.5% |
| No Computing Device | 168 | 7.3% |
| Total | 2,303 | 100.0% |
Internet Access in Gettysburg borough
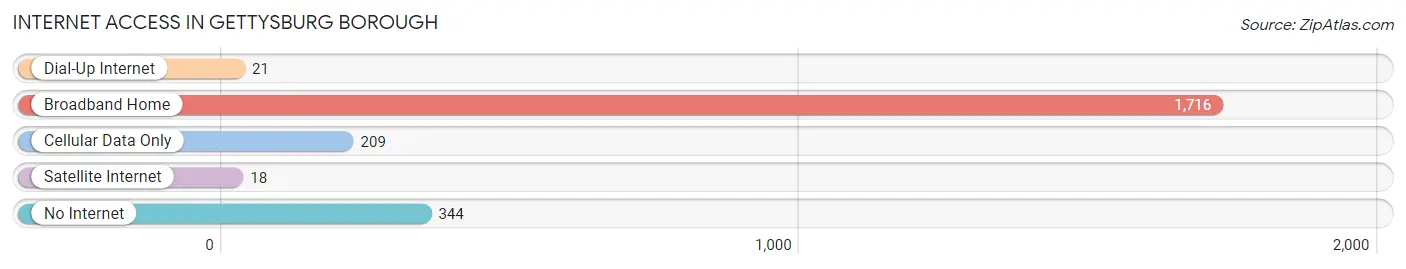
| Internet Type | # Households | % Households |
| Dial-Up Internet | 21 | 0.9% |
| Broadband Home | 1,716 | 74.5% |
| Cellular Data Only | 209 | 9.1% |
| Satellite Internet | 18 | 0.8% |
| No Internet | 344 | 14.9% |
| Total | 2,303 | 100.0% |
Gettysburg borough Summary
Introduction
Gettysburg Borough is a borough in Adams County, Pennsylvania, United States. It is located approximately 25 miles southwest of Harrisburg and is the county seat of Adams County. The borough is home to the Gettysburg National Military Park, the site of the Battle of Gettysburg during the American Civil War. The population of the borough was 7,620 at the 2010 census.
History
The area around Gettysburg was first settled in 1730 by Scots-Irish immigrants. The town was founded in 1761 by James Gettys, a local tavern owner. The town was named after him and was incorporated as a borough in 1806.
During the American Civil War, Gettysburg was the site of the Battle of Gettysburg, one of the most important battles of the war. The battle was fought from July 1-3, 1863 and resulted in a Union victory. The battle was also the turning point of the war, as it marked the end of Confederate General Robert E. Lee's invasion of the North.
The Gettysburg Address, a speech given by President Abraham Lincoln at the dedication of the Soldiers' National Cemetery in Gettysburg, is one of the most famous speeches in American history.
Geography
Gettysburg is located at 39°48'N 77°14'W (39.80, -77.23). According to the United States Census Bureau, the borough has a total area of 2.2 square miles (5.7 km2), all of it land.
The borough is located in the Cumberland Valley, a valley in south-central Pennsylvania. The borough is surrounded by Cumberland Township to the north, Straban Township to the east, Mount Joy Township to the south, and Franklin Township to the west.
Economy
The economy of Gettysburg is largely based on tourism. The borough is home to the Gettysburg National Military Park, which attracts thousands of visitors each year. The park is a major source of revenue for the borough, as it generates income from entrance fees, souvenir sales, and other activities.
The borough is also home to several other tourist attractions, including the Gettysburg Museum of History, the Gettysburg Battlefield Museum, and the Gettysburg Heritage Center. These attractions also generate revenue for the borough.
In addition to tourism, Gettysburg is home to several businesses, including a variety of restaurants, retail stores, and professional services. The borough is also home to several manufacturing companies, including a furniture manufacturer and a printing company.
Demographics
As of the 2010 census, the borough had a population of 7,620. The racial makeup of the borough was 94.2% White, 2.3% African American, 0.3% Native American, 0.7% Asian, 0.1% Pacific Islander, 0.9% from other races, and 1.5% from two or more races. Hispanic or Latino of any race were 2.7% of the population.
The median income for a household in the borough was $45,938, and the median income for a family was $54,844. The per capita income for the borough was $22,945. About 6.2% of families and 8.7% of the population were below the poverty line, including 11.2% of those under age 18 and 6.2% of those age 65 or over.
Conclusion
Gettysburg Borough is a borough in Adams County, Pennsylvania. It is home to the Gettysburg National Military Park, the site of the Battle of Gettysburg during the American Civil War. The borough has a population of 7,620 and is largely dependent on tourism for its economy. The borough is also home to several businesses, including restaurants, retail stores, and professional services. The median income for a household in the borough is $45,938 and the per capita income is $22,945.
Common Questions
What is Per Capita Income in Gettysburg borough?
Per Capita income in Gettysburg borough is $29,948.
What is the Median Family Income in Gettysburg borough?
Median Family Income in Gettysburg borough is $81,845.
What is the Median Household income in Gettysburg borough?
Median Household Income in Gettysburg borough is $50,736.
What is Income or Wage Gap in Gettysburg borough?
Income or Wage Gap in Gettysburg borough is 26.3%.
Women in Gettysburg borough earn 73.7 cents for every dollar earned by a man.
What is Family Income Deficit in Gettysburg borough?
Family Income Deficit in Gettysburg borough is $8,562.
Families that are below poverty line in Gettysburg borough earn $8,562 less on average than the poverty threshold level.
What is Inequality or Gini Index in Gettysburg borough?
Inequality or Gini Index in Gettysburg borough is 0.49.
What is the Total Population of Gettysburg borough?
Total Population of Gettysburg borough is 7,709.
What is the Total Male Population of Gettysburg borough?
Total Male Population of Gettysburg borough is 3,868.
What is the Total Female Population of Gettysburg borough?
Total Female Population of Gettysburg borough is 3,841.
What is the Ratio of Males per 100 Females in Gettysburg borough?
There are 100.70 Males per 100 Females in Gettysburg borough.
What is the Ratio of Females per 100 Males in Gettysburg borough?
There are 99.30 Females per 100 Males in Gettysburg borough.
What is the Median Population Age in Gettysburg borough?
Median Population Age in Gettysburg borough is 22.4 Years.
What is the Average Family Size in Gettysburg borough
Average Family Size in Gettysburg borough is 3.0 People.
What is the Average Household Size in Gettysburg borough
Average Household Size in Gettysburg borough is 2.1 People.
How Large is the Labor Force in Gettysburg borough?
There are 4,103 People in the Labor Forcein in Gettysburg borough.
What is the Percentage of People in the Labor Force in Gettysburg borough?
58.4% of People are in the Labor Force in Gettysburg borough.
What is the Unemployment Rate in Gettysburg borough?
Unemployment Rate in Gettysburg borough is 6.9%.