Blue Bell, PA Map & Demographics
Blue Bell Map
Blue Bell Overview
$86,576
PER CAPITA INCOME
$230,417
AVG FAMILY INCOME
$152,417
AVG HOUSEHOLD INCOME
46.4%
WAGE / INCOME GAP [ % ]
53.6¢/ $1
WAGE / INCOME GAP [ $ ]
0.46
INEQUALITY / GINI INDEX
6,428
TOTAL POPULATION
3,346
MALE POPULATION
3,082
FEMALE POPULATION
108.57
MALES / 100 FEMALES
92.11
FEMALES / 100 MALES
44.4
MEDIAN AGE
3.2
AVG FAMILY SIZE
2.6
AVG HOUSEHOLD SIZE
3,234
LABOR FORCE [ PEOPLE ]
64.7%
PERCENT IN LABOR FORCE
6.6%
UNEMPLOYMENT RATE
Blue Bell Zip Codes
Income in Blue Bell
Income Overview in Blue Bell
Per Capita Income in Blue Bell is $86,576, while median incomes of families and households are $230,417 and $152,417 respectively.
| Characteristic | Number | Measure |
| Per Capita Income | 6,428 | $86,576 |
| Median Family Income | 1,683 | $230,417 |
| Mean Family Income | 1,683 | $276,797 |
| Median Household Income | 2,453 | $152,417 |
| Mean Household Income | 2,453 | $224,357 |
| Income Deficit | 1,683 | $0 |
| Wage / Income Gap (%) | 6,428 | 46.44% |
| Wage / Income Gap ($) | 6,428 | 53.56¢ per $1 |
| Gini / Inequality Index | 6,428 | 0.46 |
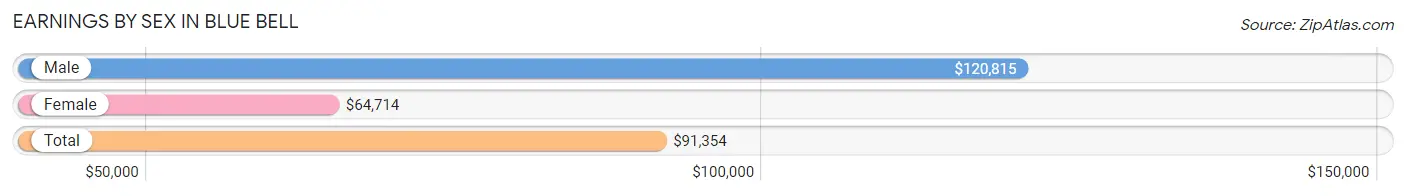
Earnings by Sex in Blue Bell
Average Earnings in Blue Bell are $91,354, $120,815 for men and $64,714 for women, a difference of 46.4%.
| Sex | Number | Average Earnings |
| Male | 1,957 (58.2%) | $120,815 |
| Female | 1,403 (41.8%) | $64,714 |
| Total | 3,360 (100.0%) | $91,354 |
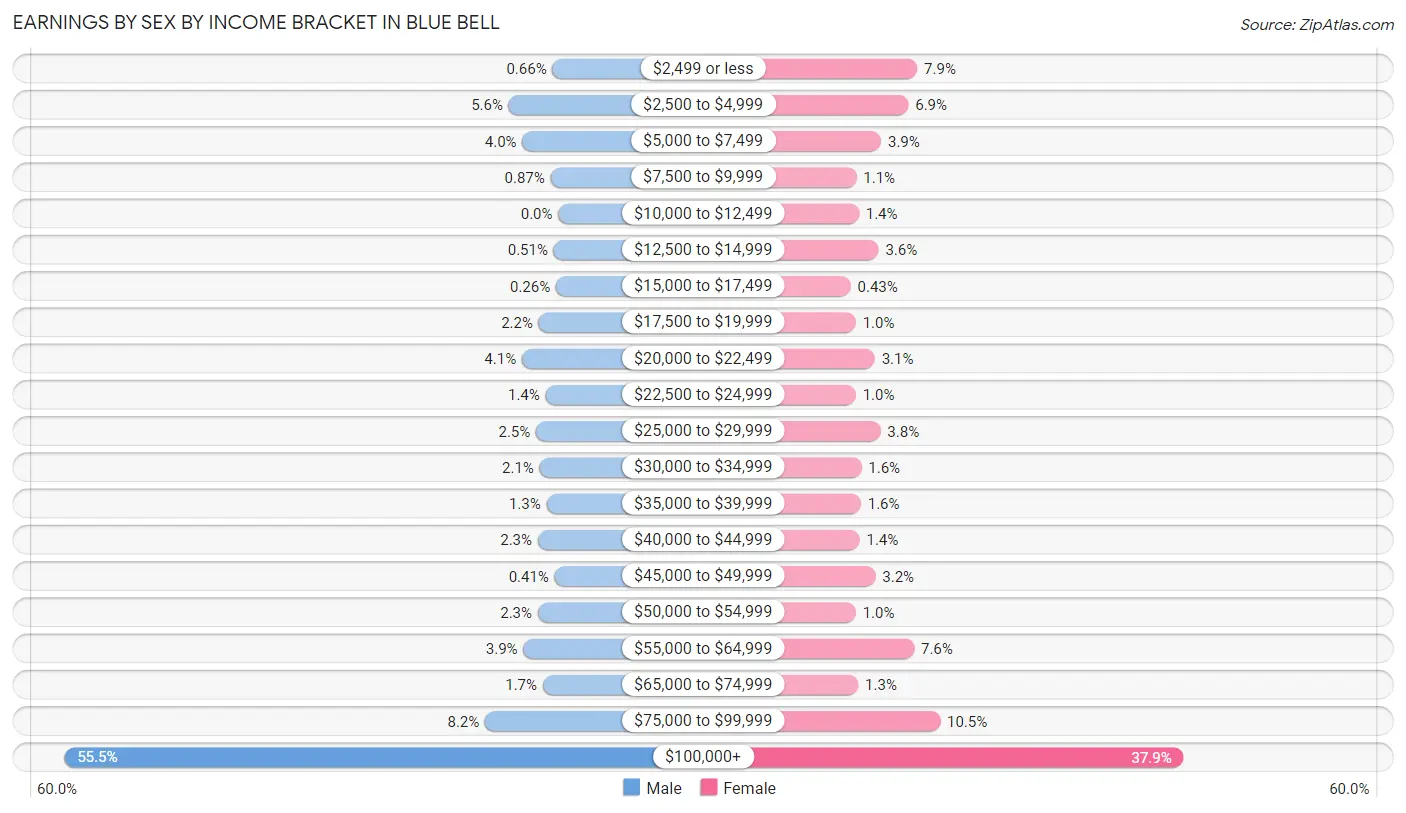
Earnings by Sex by Income Bracket in Blue Bell
The most common earnings brackets in Blue Bell are $100,000+ for men (1,087 | 55.5%) and $100,000+ for women (531 | 37.9%).
| Income | Male | Female |
| $2,499 or less | 13 (0.7%) | 111 (7.9%) |
| $2,500 to $4,999 | 109 (5.6%) | 97 (6.9%) |
| $5,000 to $7,499 | 79 (4.0%) | 54 (3.8%) |
| $7,500 to $9,999 | 17 (0.9%) | 15 (1.1%) |
| $10,000 to $12,499 | 0 (0.0%) | 19 (1.3%) |
| $12,500 to $14,999 | 10 (0.5%) | 50 (3.6%) |
| $15,000 to $17,499 | 5 (0.3%) | 6 (0.4%) |
| $17,500 to $19,999 | 43 (2.2%) | 14 (1.0%) |
| $20,000 to $22,499 | 80 (4.1%) | 44 (3.1%) |
| $22,500 to $24,999 | 28 (1.4%) | 14 (1.0%) |
| $25,000 to $29,999 | 49 (2.5%) | 53 (3.8%) |
| $30,000 to $34,999 | 41 (2.1%) | 23 (1.6%) |
| $35,000 to $39,999 | 26 (1.3%) | 22 (1.6%) |
| $40,000 to $44,999 | 45 (2.3%) | 20 (1.4%) |
| $45,000 to $49,999 | 8 (0.4%) | 45 (3.2%) |
| $50,000 to $54,999 | 45 (2.3%) | 14 (1.0%) |
| $55,000 to $64,999 | 77 (3.9%) | 106 (7.6%) |
| $65,000 to $74,999 | 34 (1.7%) | 18 (1.3%) |
| $75,000 to $99,999 | 161 (8.2%) | 147 (10.5%) |
| $100,000+ | 1,087 (55.5%) | 531 (37.9%) |
| Total | 1,957 (100.0%) | 1,403 (100.0%) |
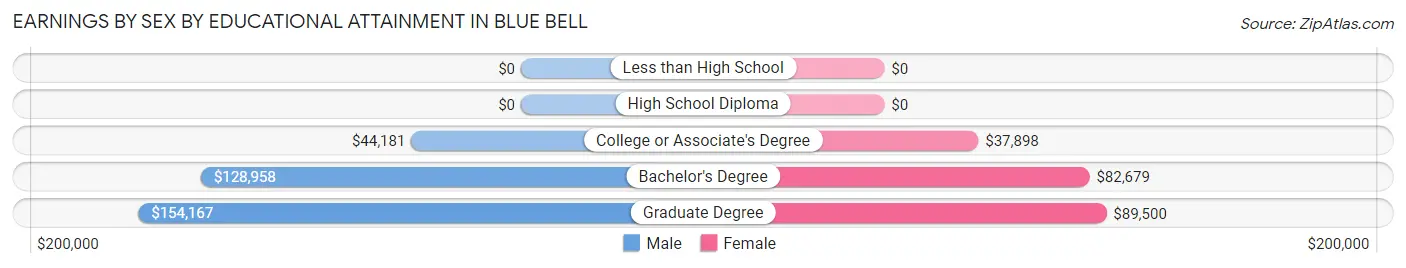
Earnings by Sex by Educational Attainment in Blue Bell
Average earnings in Blue Bell are $128,906 for men and $76,667 for women, a difference of 40.5%. Men with an educational attainment of graduate degree enjoy the highest average annual earnings of $154,167, while those with college or associate's degree education earn the least with $44,181. Women with an educational attainment of graduate degree earn the most with the average annual earnings of $89,500, while those with college or associate's degree education have the smallest earnings of $37,898.
| Educational Attainment | Male Income | Female Income |
| Less than High School | - | - |
| High School Diploma | - | - |
| College or Associate's Degree | $44,181 | $37,898 |
| Bachelor's Degree | $128,958 | $82,679 |
| Graduate Degree | $154,167 | $89,500 |
| Total | $128,906 | $76,667 |
Family Income in Blue Bell
Family Income Brackets in Blue Bell
According to the Blue Bell family income data, there are 985 families falling into the $200,000+ income range, which is the most common income bracket and makes up 58.5% of all families.
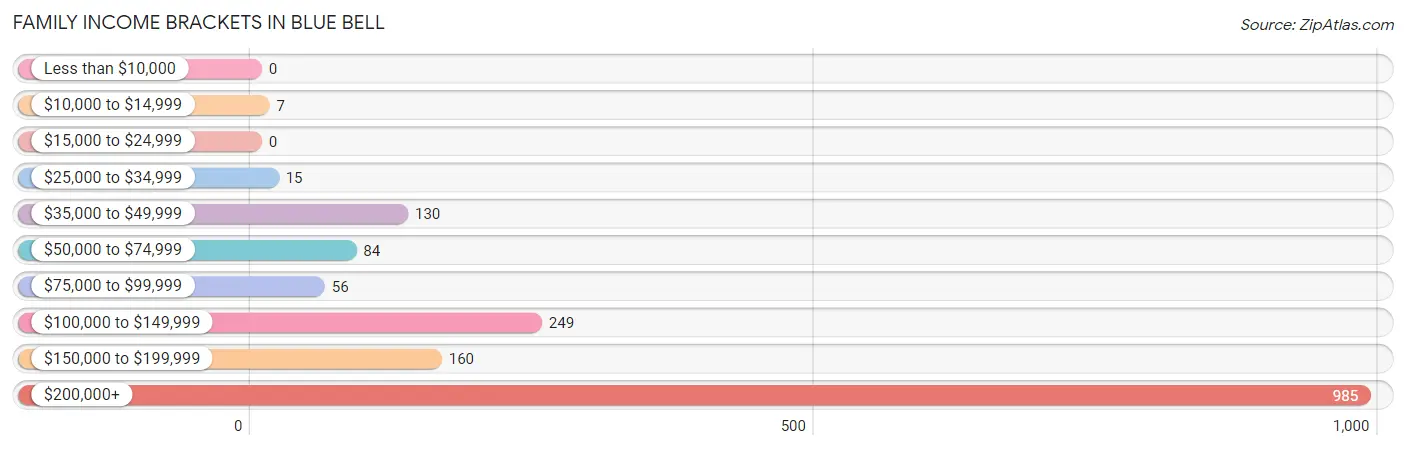
| Income Bracket | # Families | % Families |
| Less than $10,000 | 0 | 0.0% |
| $10,000 to $14,999 | 7 | 0.4% |
| $15,000 to $24,999 | 0 | 0.0% |
| $25,000 to $34,999 | 15 | 0.9% |
| $35,000 to $49,999 | 130 | 7.7% |
| $50,000 to $74,999 | 84 | 5.0% |
| $75,000 to $99,999 | 56 | 3.3% |
| $100,000 to $149,999 | 249 | 14.8% |
| $150,000 to $199,999 | 160 | 9.5% |
| $200,000+ | 985 | 58.5% |
Family Income by Famaliy Size in Blue Bell
4-person families (420 | 25.0%) account for the highest median family income in Blue Bell with $250,001 per family, while 2-person families (675 | 40.1%) have the highest median income of $84,883 per family member.
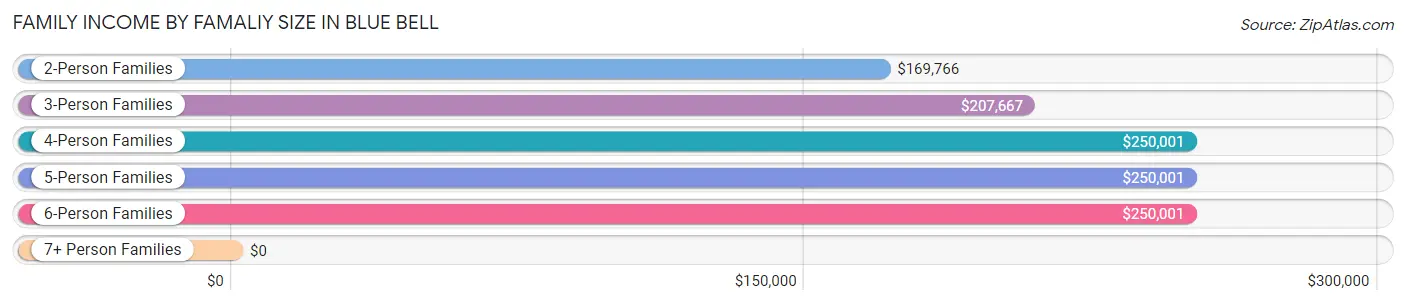
| Income Bracket | # Families | Median Income |
| 2-Person Families | 675 (40.1%) | $169,766 |
| 3-Person Families | 370 (22.0%) | $207,667 |
| 4-Person Families | 420 (25.0%) | $250,001 |
| 5-Person Families | 146 (8.7%) | $250,001 |
| 6-Person Families | 56 (3.3%) | $250,001 |
| 7+ Person Families | 16 (0.9%) | $0 |
| Total | 1,683 (100.0%) | $230,417 |
Family Income by Number of Earners in Blue Bell
The median family income in Blue Bell is $230,417, with families comprising 2 earners (797) having the highest median family income of $250,001, while families with no earners (282) have the lowest median family income of $111,000, accounting for 47.4% and 16.8% of families, respectively.
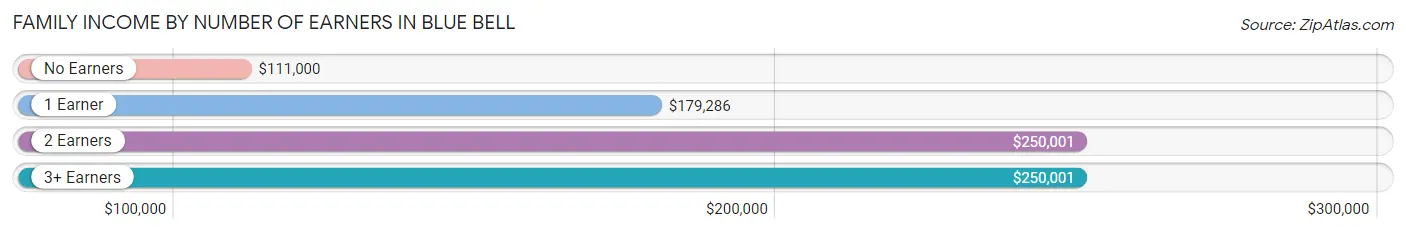
| Number of Earners | # Families | Median Income |
| No Earners | 282 (16.8%) | $111,000 |
| 1 Earner | 414 (24.6%) | $179,286 |
| 2 Earners | 797 (47.4%) | $250,001 |
| 3+ Earners | 190 (11.3%) | $250,001 |
| Total | 1,683 (100.0%) | $230,417 |
Household Income in Blue Bell
Household Income Brackets in Blue Bell
With 1,060 households falling in the category, the $200,000+ income range is the most frequent in Blue Bell, accounting for 43.2% of all households. In contrast, only 17 households (0.7%) fall into the $10,000 to $14,999 income bracket, making it the least populous group.
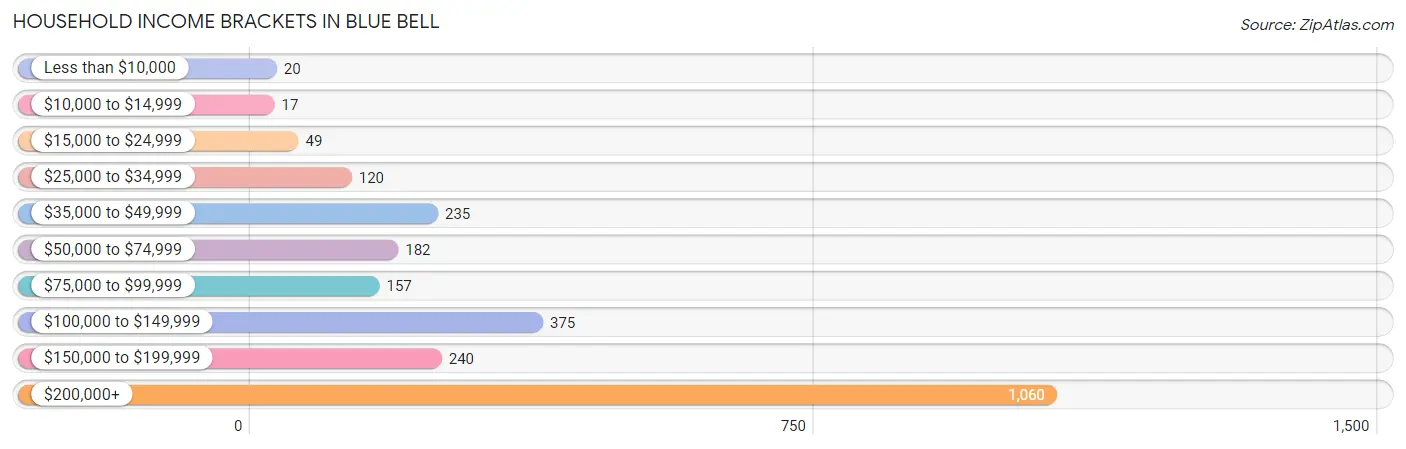
| Income Bracket | # Households | % Households |
| Less than $10,000 | 20 | 0.8% |
| $10,000 to $14,999 | 17 | 0.7% |
| $15,000 to $24,999 | 49 | 2.0% |
| $25,000 to $34,999 | 120 | 4.9% |
| $35,000 to $49,999 | 235 | 9.6% |
| $50,000 to $74,999 | 182 | 7.4% |
| $75,000 to $99,999 | 157 | 6.4% |
| $100,000 to $149,999 | 375 | 15.3% |
| $150,000 to $199,999 | 240 | 9.8% |
| $200,000+ | 1,060 | 43.2% |
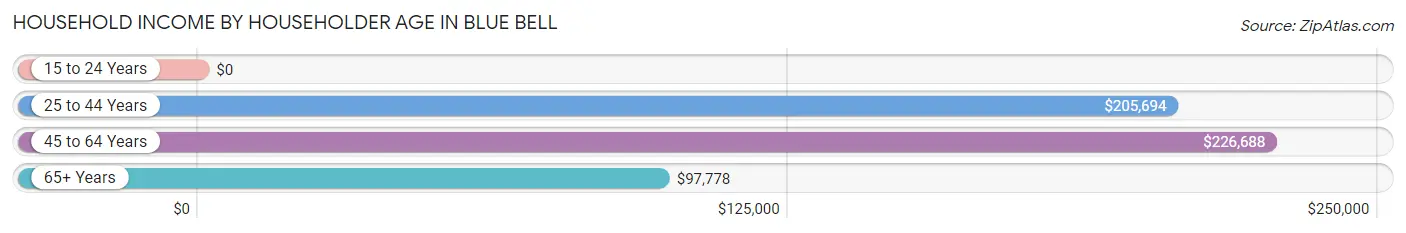
Household Income by Householder Age in Blue Bell
The median household income in Blue Bell is $152,417, with the highest median household income of $226,688 found in the 45 to 64 years age bracket for the primary householder. A total of 1,067 households (43.5%) fall into this category.
| Income Bracket | # Households | Median Income |
| 15 to 24 Years | 0 (0.0%) | $0 |
| 25 to 44 Years | 562 (22.9%) | $205,694 |
| 45 to 64 Years | 1,067 (43.5%) | $226,688 |
| 65+ Years | 824 (33.6%) | $97,778 |
| Total | 2,453 (100.0%) | $152,417 |
Poverty in Blue Bell
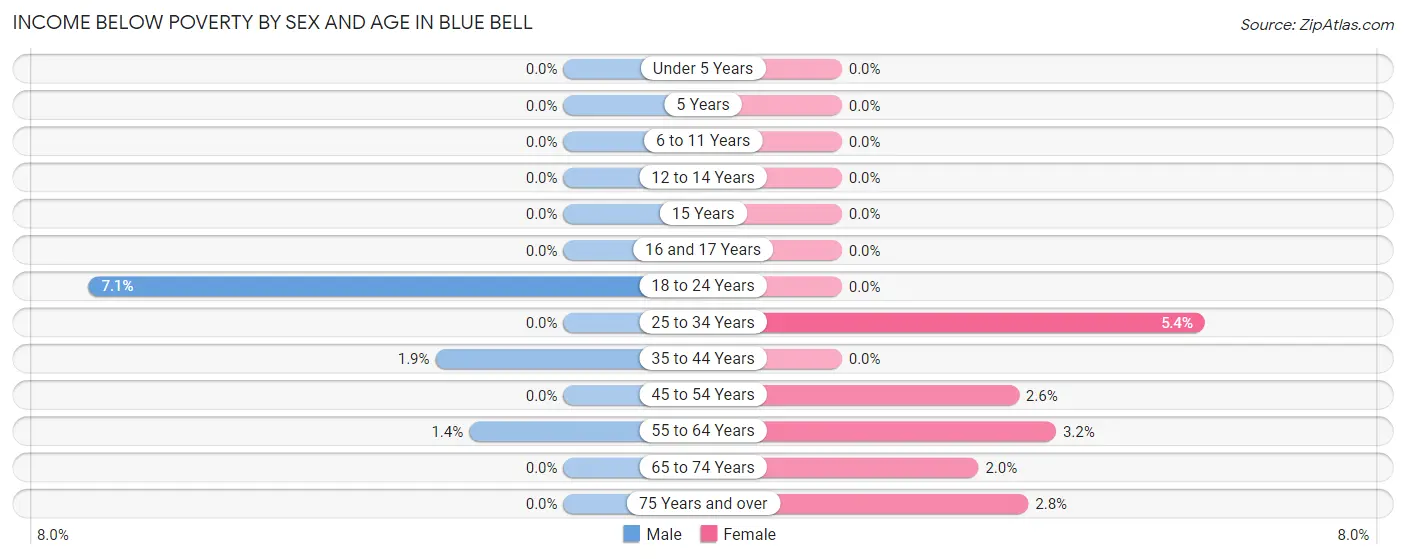
Income Below Poverty by Sex and Age in Blue Bell
With 0.9% poverty level for males and 1.9% for females among the residents of Blue Bell, 18 to 24 year old males and 25 to 34 year old females are the most vulnerable to poverty, with 16 males (7.0%) and 16 females (5.4%) in their respective age groups living below the poverty level.
| Age Bracket | Male | Female |
| Under 5 Years | 0 (0.0%) | 0 (0.0%) |
| 5 Years | 0 (0.0%) | 0 (0.0%) |
| 6 to 11 Years | 0 (0.0%) | 0 (0.0%) |
| 12 to 14 Years | 0 (0.0%) | 0 (0.0%) |
| 15 Years | 0 (0.0%) | 0 (0.0%) |
| 16 and 17 Years | 0 (0.0%) | 0 (0.0%) |
| 18 to 24 Years | 16 (7.0%) | 0 (0.0%) |
| 25 to 34 Years | 0 (0.0%) | 16 (5.4%) |
| 35 to 44 Years | 8 (1.9%) | 0 (0.0%) |
| 45 to 54 Years | 0 (0.0%) | 10 (2.6%) |
| 55 to 64 Years | 7 (1.4%) | 15 (3.2%) |
| 65 to 74 Years | 0 (0.0%) | 7 (2.0%) |
| 75 Years and over | 0 (0.0%) | 10 (2.8%) |
| Total | 31 (0.9%) | 58 (1.9%) |
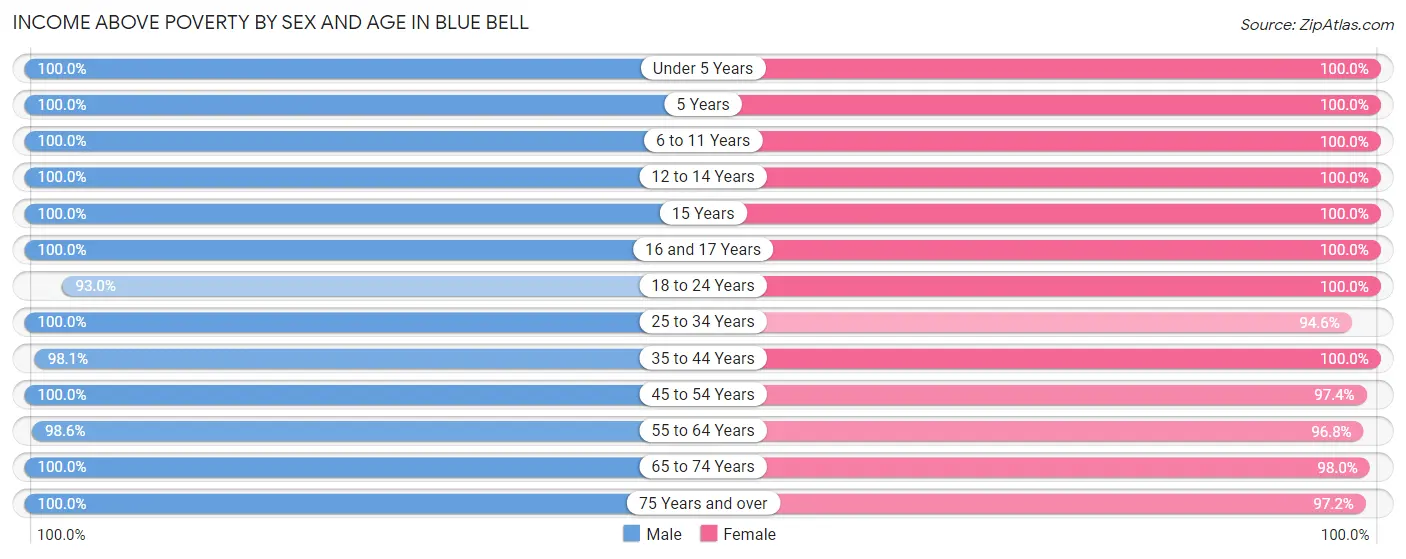
Income Above Poverty by Sex and Age in Blue Bell
According to the poverty statistics in Blue Bell, males aged under 5 years and females aged under 5 years are the age groups that are most secure financially, with 100.0% of males and 100.0% of females in these age groups living above the poverty line.
| Age Bracket | Male | Female |
| Under 5 Years | 177 (100.0%) | 178 (100.0%) |
| 5 Years | 123 (100.0%) | 21 (100.0%) |
| 6 to 11 Years | 222 (100.0%) | 376 (100.0%) |
| 12 to 14 Years | 169 (100.0%) | 83 (100.0%) |
| 15 Years | 17 (100.0%) | 32 (100.0%) |
| 16 and 17 Years | 82 (100.0%) | 32 (100.0%) |
| 18 to 24 Years | 211 (92.9%) | 108 (100.0%) |
| 25 to 34 Years | 263 (100.0%) | 281 (94.6%) |
| 35 to 44 Years | 413 (98.1%) | 397 (100.0%) |
| 45 to 54 Years | 508 (100.0%) | 370 (97.4%) |
| 55 to 64 Years | 492 (98.6%) | 457 (96.8%) |
| 65 to 74 Years | 367 (100.0%) | 338 (98.0%) |
| 75 Years and over | 210 (100.0%) | 351 (97.2%) |
| Total | 3,254 (99.1%) | 3,024 (98.1%) |
Income Below Poverty Among Married-Couple Families in Blue Bell
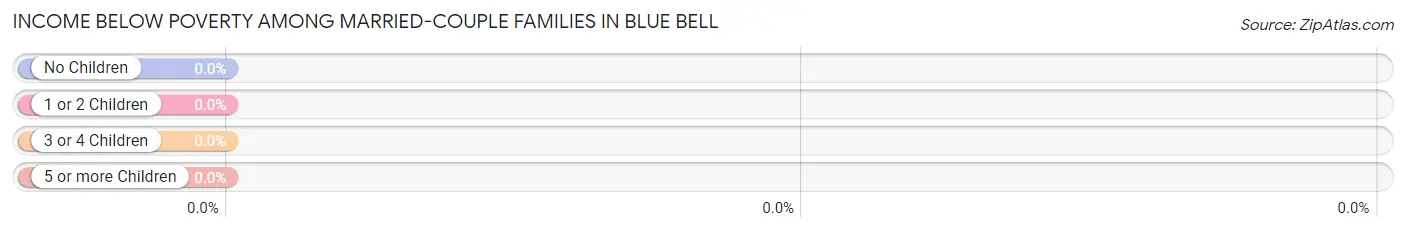
| Children | Above Poverty | Below Poverty |
| No Children | 807 (100.0%) | 0 (0.0%) |
| 1 or 2 Children | 563 (100.0%) | 0 (0.0%) |
| 3 or 4 Children | 154 (100.0%) | 0 (0.0%) |
| 5 or more Children | 16 (100.0%) | 0 (0.0%) |
| Total | 1,540 (100.0%) | 0 (0.0%) |
Income Below Poverty Among Single-Parent Households in Blue Bell
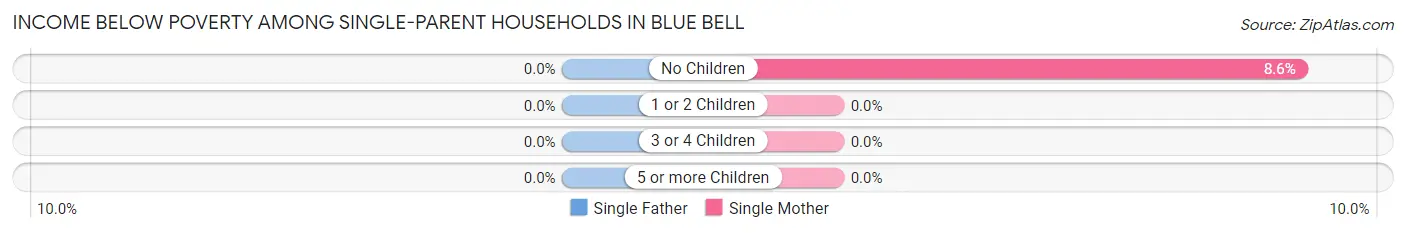
| Children | Single Father | Single Mother |
| No Children | 0 (0.0%) | 7 (8.6%) |
| 1 or 2 Children | 0 (0.0%) | 0 (0.0%) |
| 3 or 4 Children | 0 (0.0%) | 0 (0.0%) |
| 5 or more Children | 0 (0.0%) | 0 (0.0%) |
| Total | 0 (0.0%) | 7 (7.1%) |
Income Below Poverty Among Married-Couple vs Single-Parent Households in Blue Bell
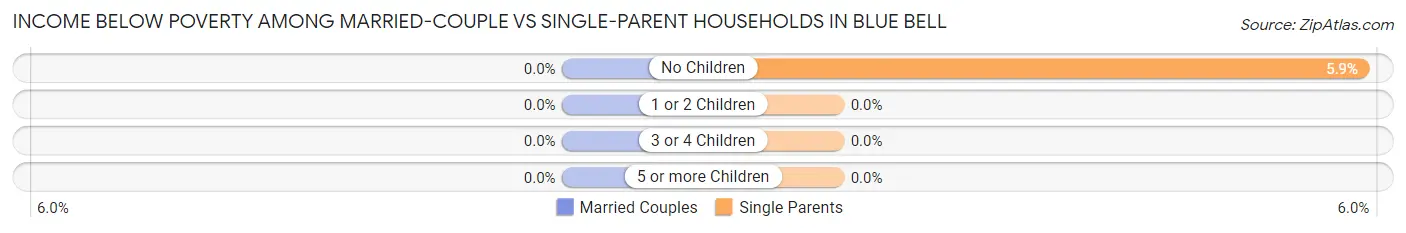
| Children | Married-Couple Families | Single-Parent Households |
| No Children | 0 (0.0%) | 7 (5.9%) |
| 1 or 2 Children | 0 (0.0%) | 0 (0.0%) |
| 3 or 4 Children | 0 (0.0%) | 0 (0.0%) |
| 5 or more Children | 0 (0.0%) | 0 (0.0%) |
| Total | 0 (0.0%) | 7 (4.9%) |
Race in Blue Bell
The most populous races in Blue Bell are White / Caucasian (5,700 | 88.7%), Asian (527 | 8.2%), and Hispanic or Latino (118 | 1.8%).
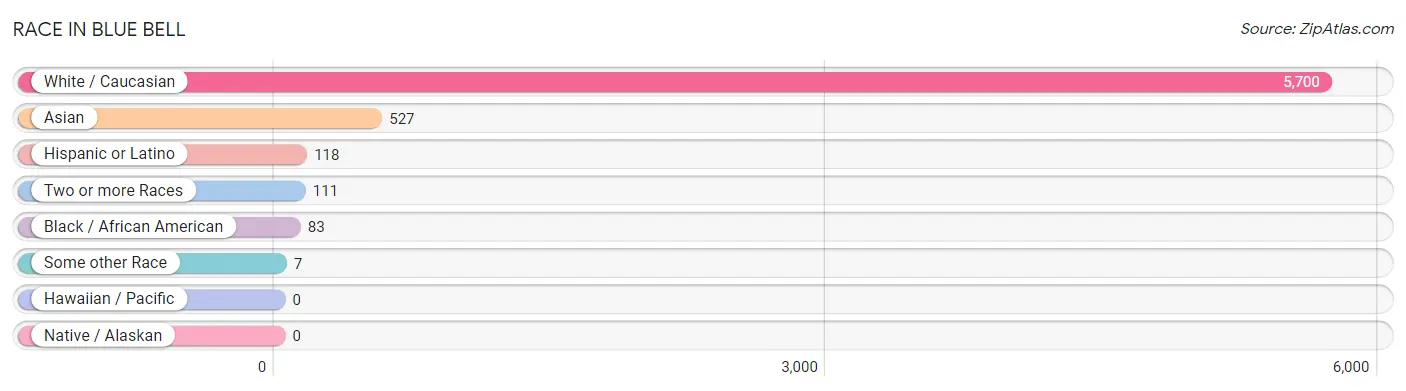
| Race | # Population | % Population |
| Asian | 527 | 8.2% |
| Black / African American | 83 | 1.3% |
| Hawaiian / Pacific | 0 | 0.0% |
| Hispanic or Latino | 118 | 1.8% |
| Native / Alaskan | 0 | 0.0% |
| White / Caucasian | 5,700 | 88.7% |
| Two or more Races | 111 | 1.7% |
| Some other Race | 7 | 0.1% |
| Total | 6,428 | 100.0% |
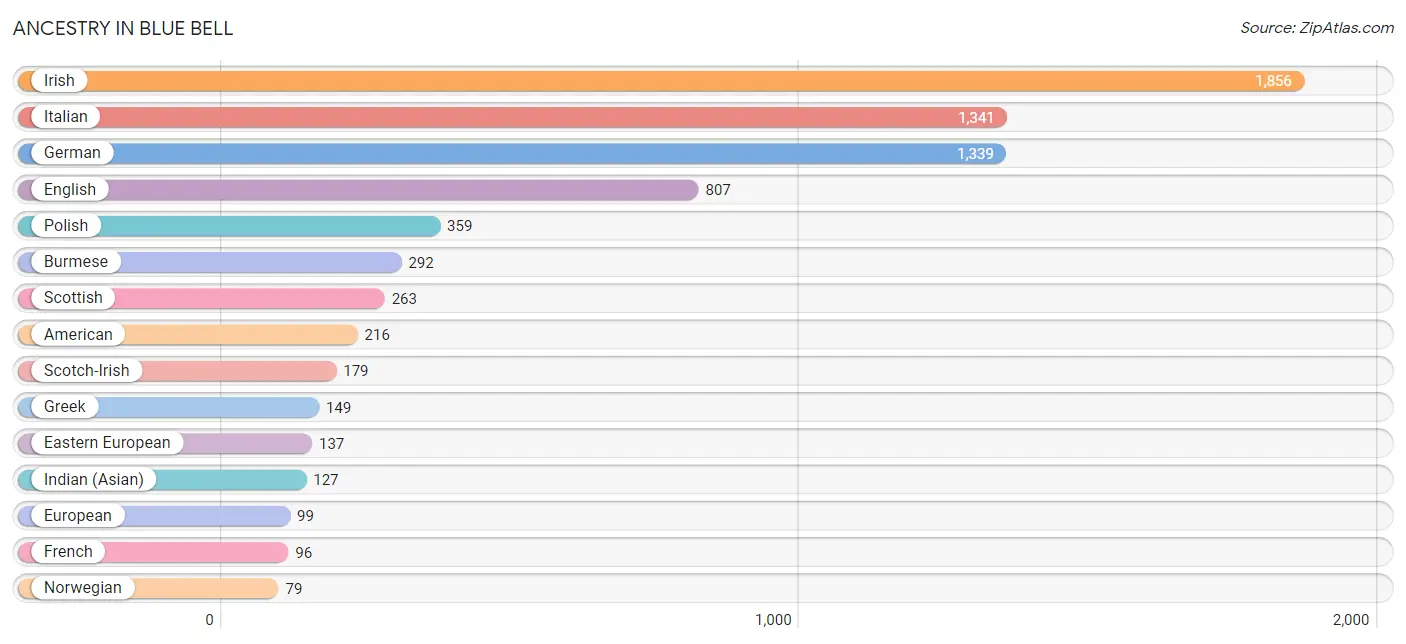
Ancestry in Blue Bell
The most populous ancestries reported in Blue Bell are Irish (1,856 | 28.9%), Italian (1,341 | 20.9%), German (1,339 | 20.8%), English (807 | 12.6%), and Polish (359 | 5.6%), together accounting for 88.7% of all Blue Bell residents.
| Ancestry | # Population | % Population |
| American | 216 | 3.4% |
| Arab | 15 | 0.2% |
| Armenian | 10 | 0.2% |
| Austrian | 68 | 1.1% |
| Belgian | 11 | 0.2% |
| Brazilian | 7 | 0.1% |
| British | 36 | 0.6% |
| Burmese | 292 | 4.5% |
| Czech | 57 | 0.9% |
| Czechoslovakian | 15 | 0.2% |
| Danish | 6 | 0.1% |
| Dutch | 66 | 1.0% |
| Eastern European | 137 | 2.1% |
| English | 807 | 12.6% |
| European | 99 | 1.5% |
| Filipino | 31 | 0.5% |
| French | 96 | 1.5% |
| French Canadian | 8 | 0.1% |
| German | 1,339 | 20.8% |
| Greek | 149 | 2.3% |
| Hungarian | 56 | 0.9% |
| Indian (Asian) | 127 | 2.0% |
| Irish | 1,856 | 28.9% |
| Israeli | 9 | 0.1% |
| Italian | 1,341 | 20.9% |
| Korean | 15 | 0.2% |
| Latvian | 9 | 0.1% |
| Lebanese | 6 | 0.1% |
| Lithuanian | 71 | 1.1% |
| Mexican | 24 | 0.4% |
| Northern European | 24 | 0.4% |
| Norwegian | 79 | 1.2% |
| Pennsylvania German | 42 | 0.6% |
| Polish | 359 | 5.6% |
| Portuguese | 10 | 0.2% |
| Puerto Rican | 48 | 0.7% |
| Russian | 78 | 1.2% |
| Scandinavian | 5 | 0.1% |
| Scotch-Irish | 179 | 2.8% |
| Scottish | 263 | 4.1% |
| Slovak | 33 | 0.5% |
| South American | 46 | 0.7% |
| Sri Lankan | 7 | 0.1% |
| Swedish | 12 | 0.2% |
| Swiss | 8 | 0.1% |
| Syrian | 9 | 0.1% |
| Thai | 63 | 1.0% |
| Ukrainian | 41 | 0.6% |
| Venezuelan | 46 | 0.7% |
| Welsh | 40 | 0.6% | View All 50 Rows |
Immigrants in Blue Bell
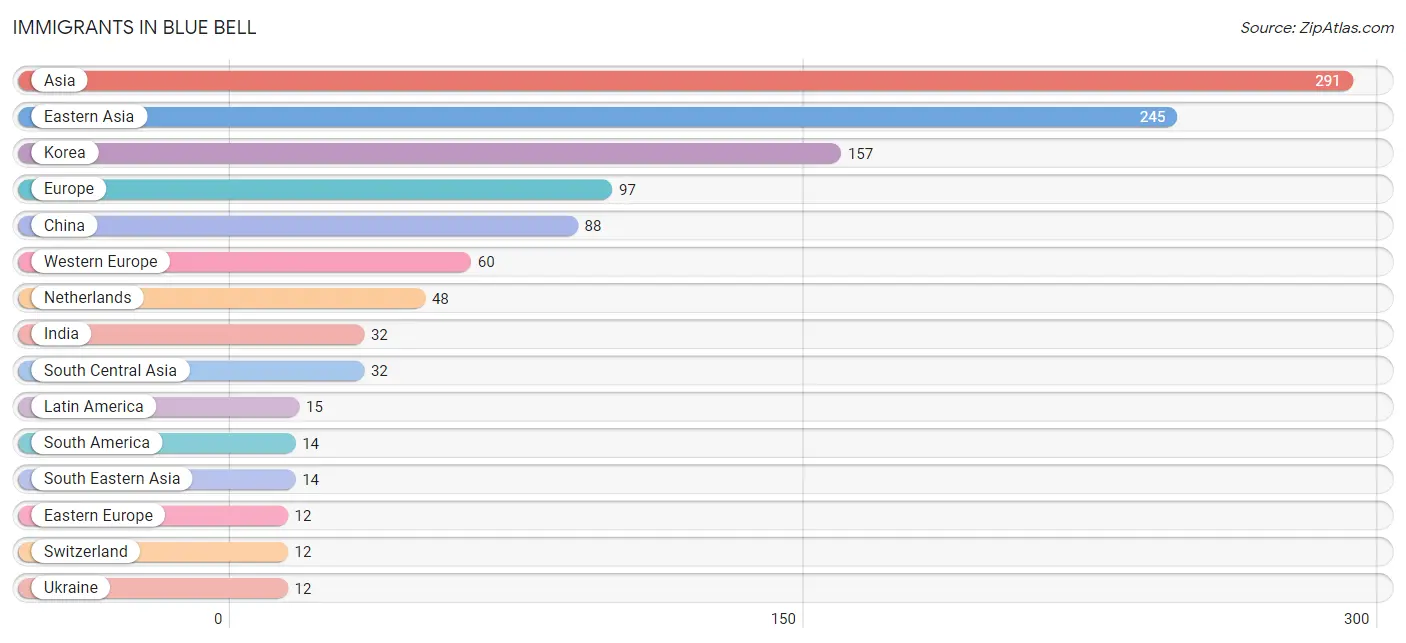
The most numerous immigrant groups reported in Blue Bell came from Asia (291 | 4.5%), Eastern Asia (245 | 3.8%), Korea (157 | 2.4%), Europe (97 | 1.5%), and China (88 | 1.4%), together accounting for 13.7% of all Blue Bell residents.
| Immigration Origin | # Population | % Population |
| Asia | 291 | 4.5% |
| Brazil | 7 | 0.1% |
| Canada | 7 | 0.1% |
| Central America | 1 | 0.0% |
| China | 88 | 1.4% |
| Eastern Asia | 245 | 3.8% |
| Eastern Europe | 12 | 0.2% |
| Europe | 97 | 1.5% |
| India | 32 | 0.5% |
| Ireland | 9 | 0.1% |
| Italy | 9 | 0.1% |
| Korea | 157 | 2.4% |
| Latin America | 15 | 0.2% |
| Mexico | 1 | 0.0% |
| Netherlands | 48 | 0.7% |
| Northern Europe | 9 | 0.1% |
| Oceania | 8 | 0.1% |
| Philippines | 7 | 0.1% |
| South America | 14 | 0.2% |
| South Central Asia | 32 | 0.5% |
| South Eastern Asia | 14 | 0.2% |
| Southern Europe | 9 | 0.1% |
| Switzerland | 12 | 0.2% |
| Taiwan | 8 | 0.1% |
| Ukraine | 12 | 0.2% |
| Vietnam | 7 | 0.1% |
| Western Europe | 60 | 0.9% | View All 27 Rows |
Sex and Age in Blue Bell
Sex and Age in Blue Bell
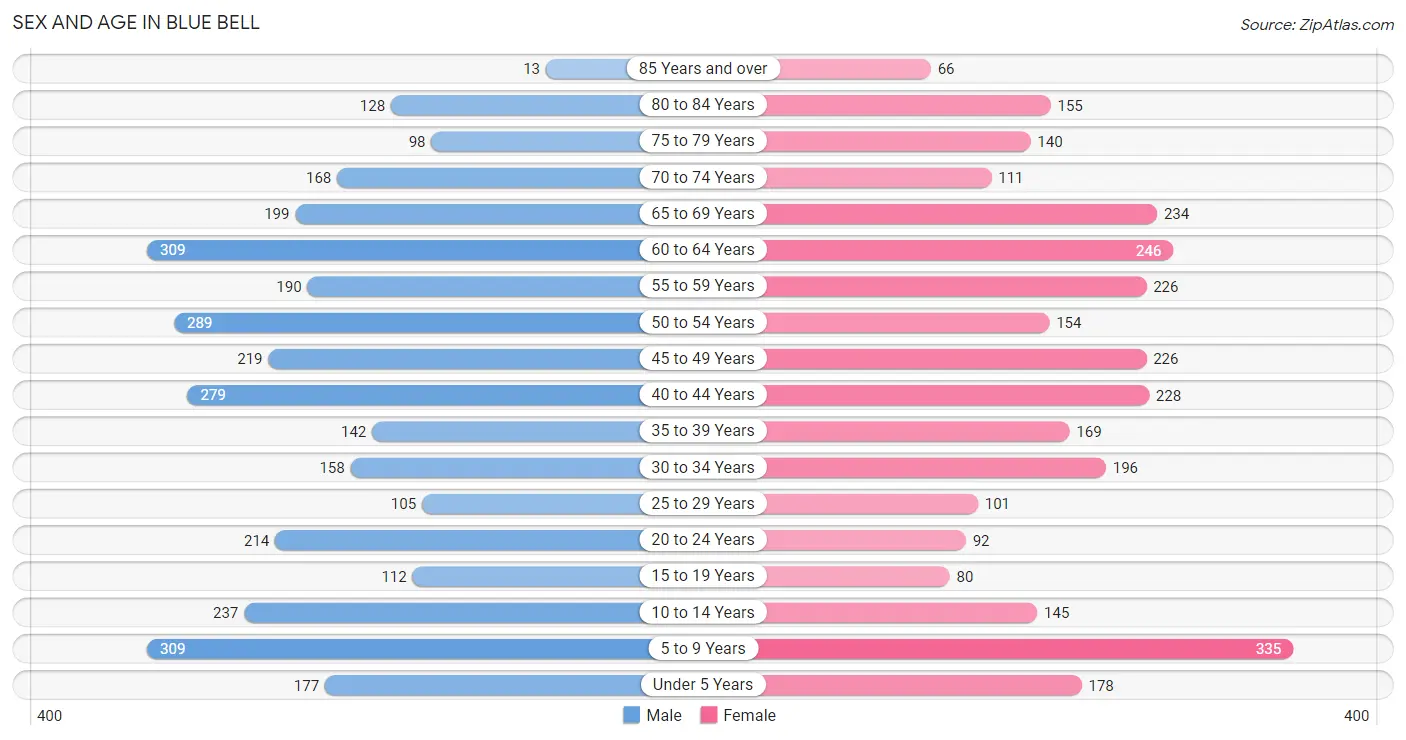
The most populous age groups in Blue Bell are 5 to 9 Years (309 | 9.2%) for men and 5 to 9 Years (335 | 10.9%) for women.
| Age Bracket | Male | Female |
| Under 5 Years | 177 (5.3%) | 178 (5.8%) |
| 5 to 9 Years | 309 (9.2%) | 335 (10.9%) |
| 10 to 14 Years | 237 (7.1%) | 145 (4.7%) |
| 15 to 19 Years | 112 (3.4%) | 80 (2.6%) |
| 20 to 24 Years | 214 (6.4%) | 92 (3.0%) |
| 25 to 29 Years | 105 (3.1%) | 101 (3.3%) |
| 30 to 34 Years | 158 (4.7%) | 196 (6.4%) |
| 35 to 39 Years | 142 (4.2%) | 169 (5.5%) |
| 40 to 44 Years | 279 (8.3%) | 228 (7.4%) |
| 45 to 49 Years | 219 (6.6%) | 226 (7.3%) |
| 50 to 54 Years | 289 (8.6%) | 154 (5.0%) |
| 55 to 59 Years | 190 (5.7%) | 226 (7.3%) |
| 60 to 64 Years | 309 (9.2%) | 246 (8.0%) |
| 65 to 69 Years | 199 (5.9%) | 234 (7.6%) |
| 70 to 74 Years | 168 (5.0%) | 111 (3.6%) |
| 75 to 79 Years | 98 (2.9%) | 140 (4.5%) |
| 80 to 84 Years | 128 (3.8%) | 155 (5.0%) |
| 85 Years and over | 13 (0.4%) | 66 (2.1%) |
| Total | 3,346 (100.0%) | 3,082 (100.0%) |
Families and Households in Blue Bell
Median Family Size in Blue Bell
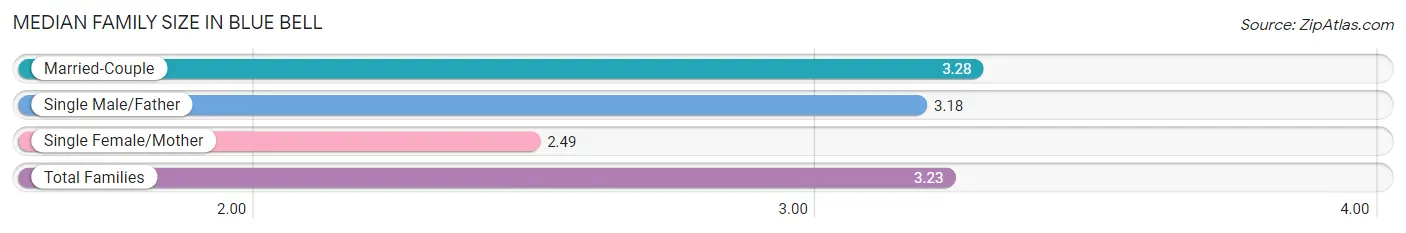
The median family size in Blue Bell is 3.23 persons per family, with married-couple families (1,540 | 91.5%) accounting for the largest median family size of 3.28 persons per family. On the other hand, single female/mother families (98 | 5.8%) represent the smallest median family size with 2.49 persons per family.
| Family Type | # Families | Family Size |
| Married-Couple | 1,540 (91.5%) | 3.28 |
| Single Male/Father | 45 (2.7%) | 3.18 |
| Single Female/Mother | 98 (5.8%) | 2.49 |
| Total Families | 1,683 (100.0%) | 3.23 |
Median Household Size in Blue Bell
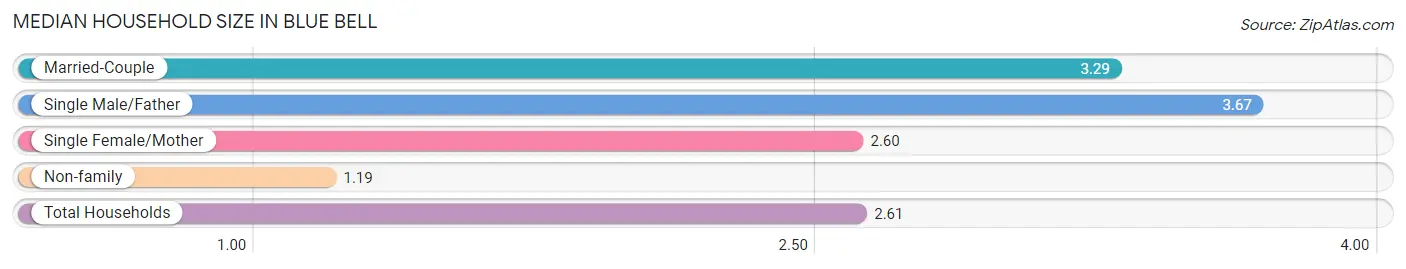
The median household size in Blue Bell is 2.61 persons per household, with single male/father households (45 | 1.8%) accounting for the largest median household size of 3.67 persons per household. non-family households (770 | 31.4%) represent the smallest median household size with 1.19 persons per household.
| Household Type | # Households | Household Size |
| Married-Couple | 1,540 (62.8%) | 3.29 |
| Single Male/Father | 45 (1.8%) | 3.67 |
| Single Female/Mother | 98 (4.0%) | 2.60 |
| Non-family | 770 (31.4%) | 1.19 |
| Total Households | 2,453 (100.0%) | 2.61 |
Household Size by Marriage Status in Blue Bell
Out of a total of 2,453 households in Blue Bell, 1,683 (68.6%) are family households, while 770 (31.4%) are nonfamily households. The most numerous type of family households are 2-person households, comprising 663, and the most common type of nonfamily households are 1-person households, comprising 638.
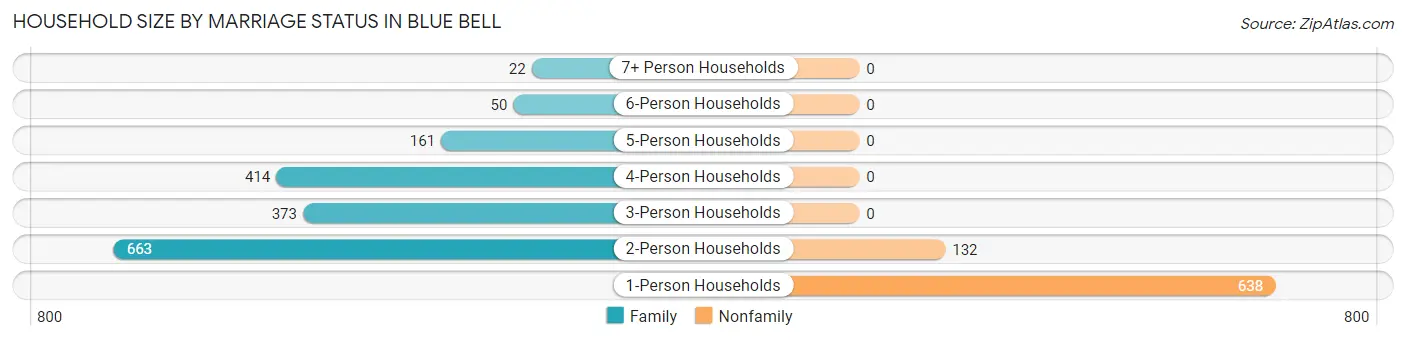
| Household Size | Family Households | Nonfamily Households |
| 1-Person Households | - | 638 (26.0%) |
| 2-Person Households | 663 (27.0%) | 132 (5.4%) |
| 3-Person Households | 373 (15.2%) | 0 (0.0%) |
| 4-Person Households | 414 (16.9%) | 0 (0.0%) |
| 5-Person Households | 161 (6.6%) | 0 (0.0%) |
| 6-Person Households | 50 (2.0%) | 0 (0.0%) |
| 7+ Person Households | 22 (0.9%) | 0 (0.0%) |
| Total | 1,683 (68.6%) | 770 (31.4%) |
Female Fertility in Blue Bell
Fertility by Age in Blue Bell
Average fertility rate in Blue Bell is 63.0 births per 1,000 women. Women in the age bracket of 20 to 34 years have the highest fertility rate with 69.0 births per 1,000 women. Women in the age bracket of 35 to 50 years acount for 61.4% of all women with births.
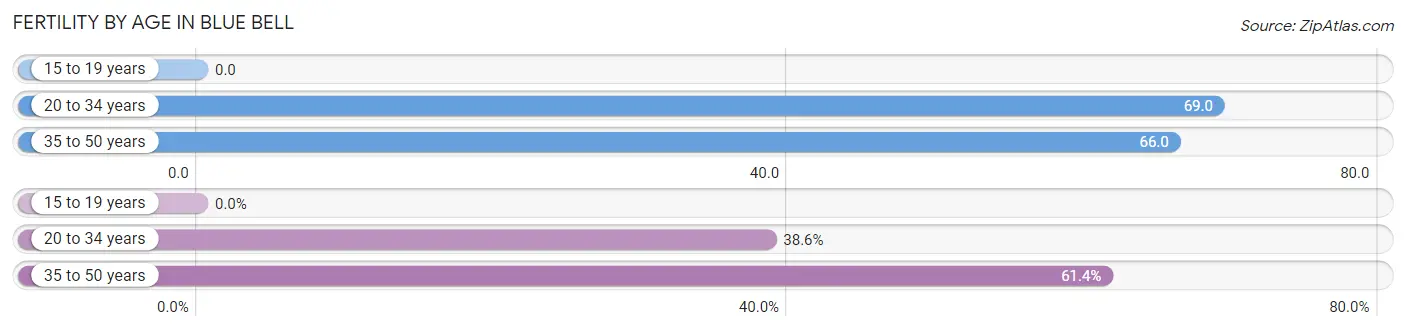
| Age Bracket | Women with Births | Births / 1,000 Women |
| 15 to 19 years | 0 (0.0%) | 0.0 |
| 20 to 34 years | 27 (38.6%) | 69.0 |
| 35 to 50 years | 43 (61.4%) | 66.0 |
| Total | 70 (100.0%) | 63.0 |
Fertility by Age by Marriage Status in Blue Bell
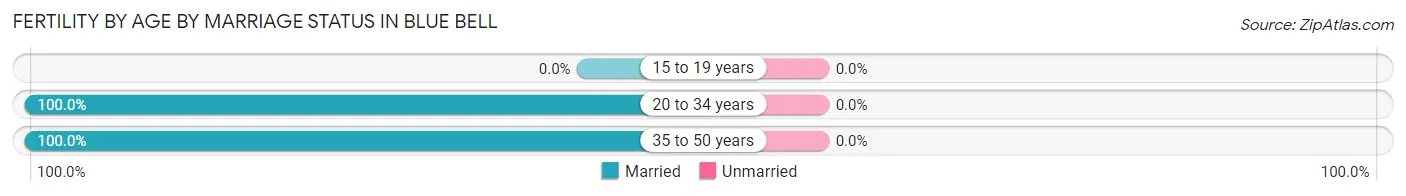
| Age Bracket | Married | Unmarried |
| 15 to 19 years | 0 (0.0%) | 0 (0.0%) |
| 20 to 34 years | 27 (100.0%) | 0 (0.0%) |
| 35 to 50 years | 43 (100.0%) | 0 (0.0%) |
| Total | 70 (100.0%) | 0 (0.0%) |
Fertility by Education in Blue Bell
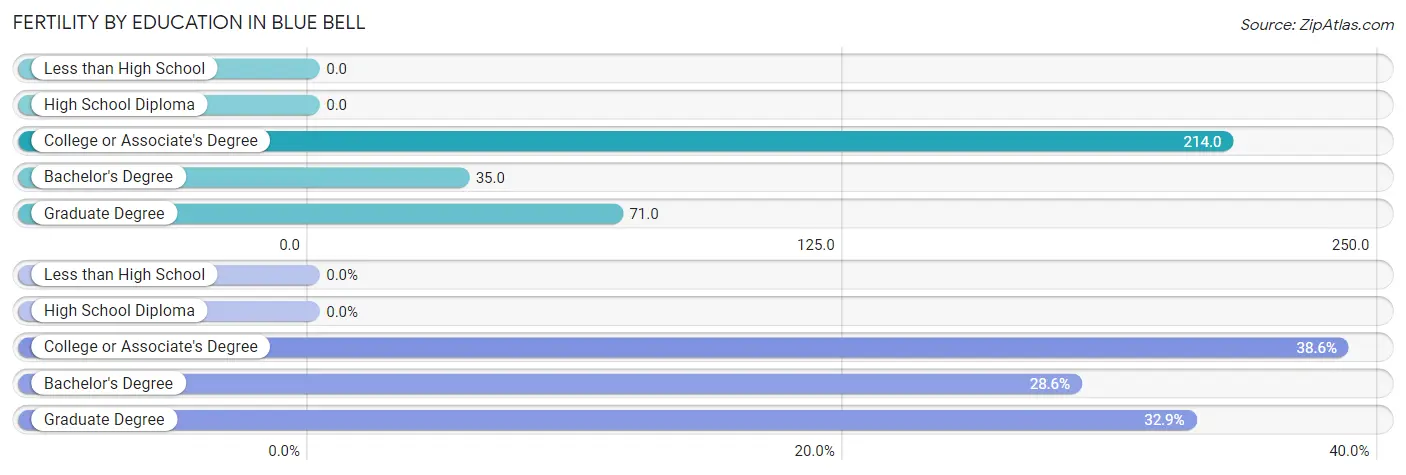
| Educational Attainment | Women with Births | Births / 1,000 Women |
| Less than High School | 0 (0.0%) | 0.0 |
| High School Diploma | 0 (0.0%) | 0.0 |
| College or Associate's Degree | 27 (38.6%) | 214.0 |
| Bachelor's Degree | 20 (28.6%) | 35.0 |
| Graduate Degree | 23 (32.9%) | 71.0 |
| Total | 70 (100.0%) | 63.0 |
Fertility by Education by Marriage Status in Blue Bell
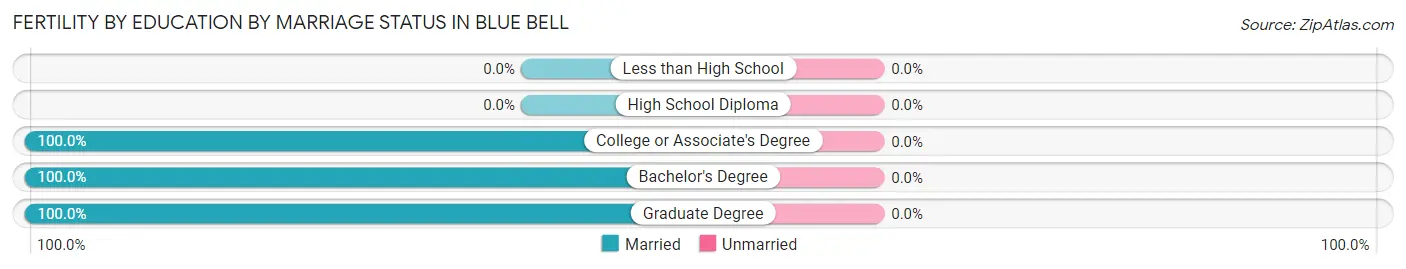
| Educational Attainment | Married | Unmarried |
| Less than High School | 0 (0.0%) | 0 (0.0%) |
| High School Diploma | 0 (0.0%) | 0 (0.0%) |
| College or Associate's Degree | 27 (100.0%) | 0 (0.0%) |
| Bachelor's Degree | 20 (100.0%) | 0 (0.0%) |
| Graduate Degree | 23 (100.0%) | 0 (0.0%) |
| Total | 70 (100.0%) | 0 (0.0%) |
Employment Characteristics in Blue Bell
Employment by Class of Employer in Blue Bell
Among the 2,982 employed individuals in Blue Bell, private company employees (2,068 | 69.4%), not-for-profit organizations (407 | 13.7%), and self-employed (not incorporated) (187 | 6.3%) make up the most common classes of employment.
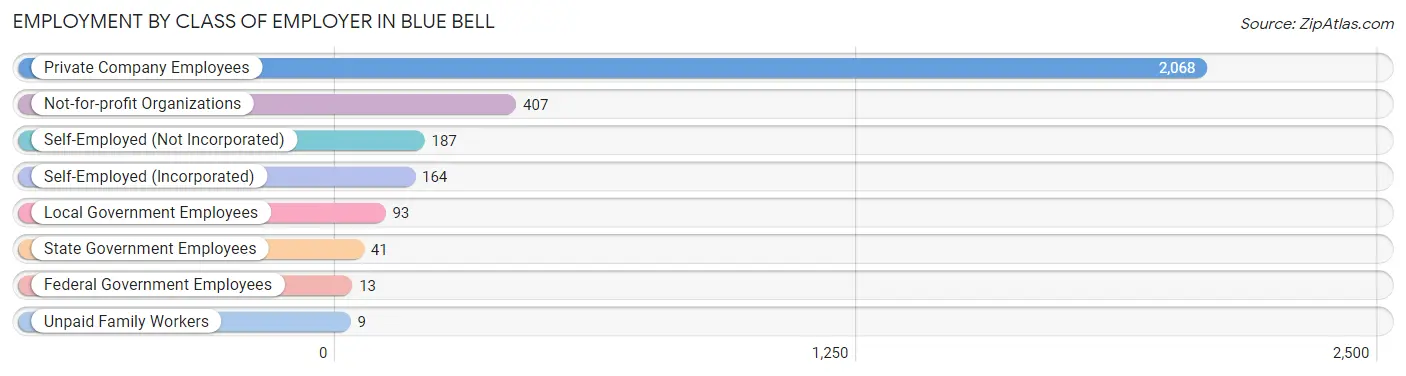
| Employer Class | # Employees | % Employees |
| Private Company Employees | 2,068 | 69.4% |
| Self-Employed (Incorporated) | 164 | 5.5% |
| Self-Employed (Not Incorporated) | 187 | 6.3% |
| Not-for-profit Organizations | 407 | 13.7% |
| Local Government Employees | 93 | 3.1% |
| State Government Employees | 41 | 1.4% |
| Federal Government Employees | 13 | 0.4% |
| Unpaid Family Workers | 9 | 0.3% |
| Total | 2,982 | 100.0% |
Employment Status by Age in Blue Bell
According to the labor force statistics for Blue Bell, out of the total population over 16 years of age (4,998), 64.7% or 3,234 individuals are in the labor force, with 6.6% or 213 of them unemployed. The age group with the highest labor force participation rate is 25 to 29 years, with 100.0% or 206 individuals in the labor force. Within the labor force, the 75 years and over age range has the highest percentage of unemployed individuals, with 45.1% or 32 of them being unemployed.
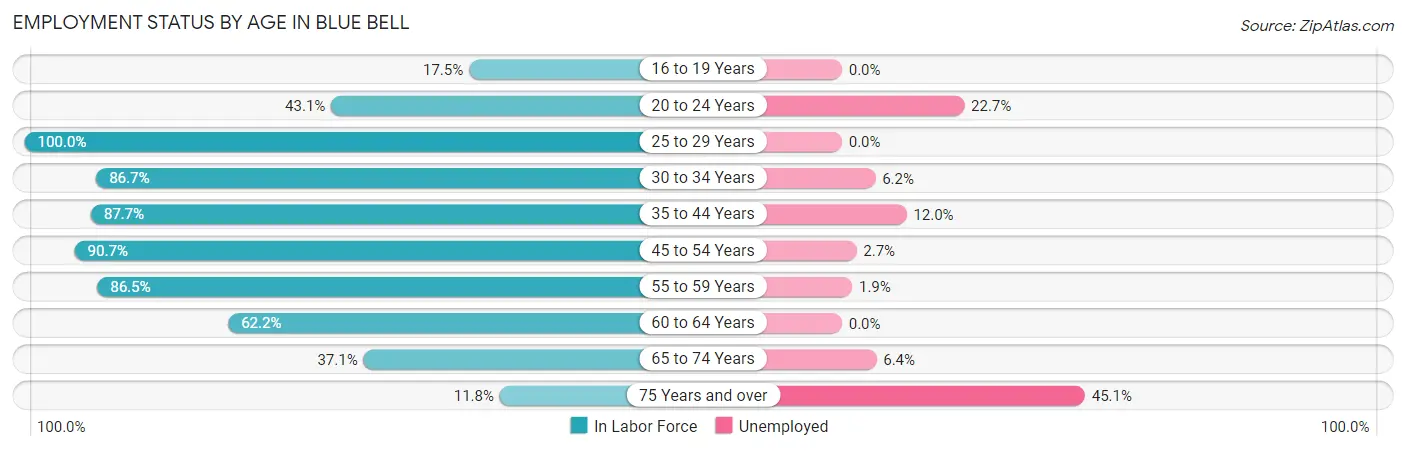
| Age Bracket | In Labor Force | Unemployed |
| 16 to 19 Years | 25 (17.5%) | 0 (0.0%) |
| 20 to 24 Years | 132 (43.1%) | 30 (22.7%) |
| 25 to 29 Years | 206 (100.0%) | 0 (0.0%) |
| 30 to 34 Years | 307 (86.7%) | 19 (6.2%) |
| 35 to 44 Years | 717 (87.7%) | 86 (12.0%) |
| 45 to 54 Years | 805 (90.7%) | 22 (2.7%) |
| 55 to 59 Years | 360 (86.5%) | 7 (1.9%) |
| 60 to 64 Years | 345 (62.2%) | 0 (0.0%) |
| 65 to 74 Years | 264 (37.1%) | 17 (6.4%) |
| 75 Years and over | 71 (11.8%) | 32 (45.1%) |
| Total | 3,234 (64.7%) | 213 (6.6%) |
Employment Status by Educational Attainment in Blue Bell
According to labor force statistics for Blue Bell, 84.6% of individuals (2,739) out of the total population between 25 and 64 years of age (3,237) are in the labor force, with 4.9% or 134 of them being unemployed. The group with the highest labor force participation rate are those with the educational attainment of less than high school, with 100.0% or 5 individuals in the labor force. Within the labor force, individuals with college / associate degree education have the highest percentage of unemployment, with 11.5% or 52 of them being unemployed.
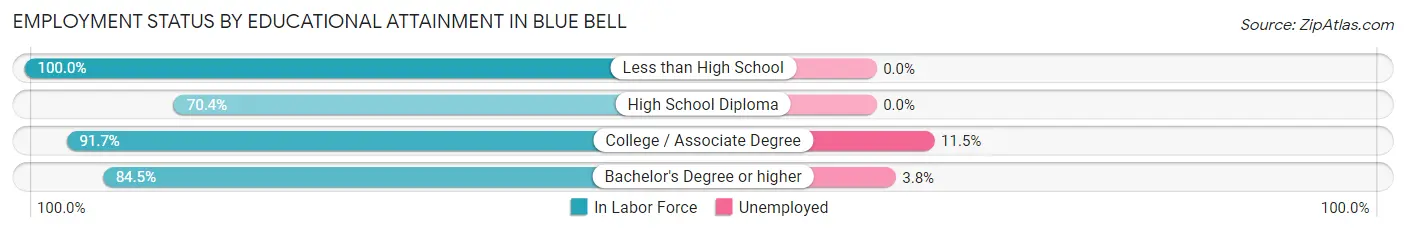
| Educational Attainment | In Labor Force | Unemployed |
| Less than High School | 5 (100.0%) | 0 (0.0%) |
| High School Diploma | 152 (70.4%) | 0 (0.0%) |
| College / Associate Degree | 453 (91.7%) | 57 (11.5%) |
| Bachelor's Degree or higher | 2,131 (84.5%) | 96 (3.8%) |
| Total | 2,739 (84.6%) | 159 (4.9%) |
Employment Occupations by Sex in Blue Bell
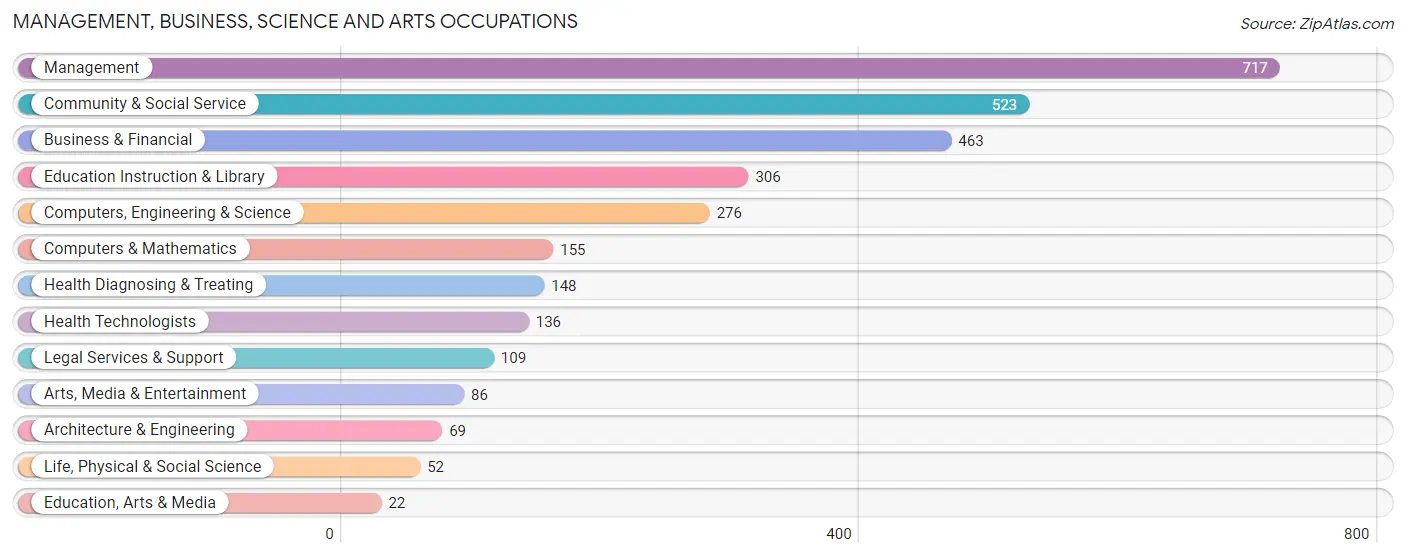
Management, Business, Science and Arts Occupations
The most common Management, Business, Science and Arts occupations in Blue Bell are Management (717 | 23.7%), Community & Social Service (523 | 17.3%), Business & Financial (463 | 15.3%), Education Instruction & Library (306 | 10.1%), and Computers, Engineering & Science (276 | 9.1%).
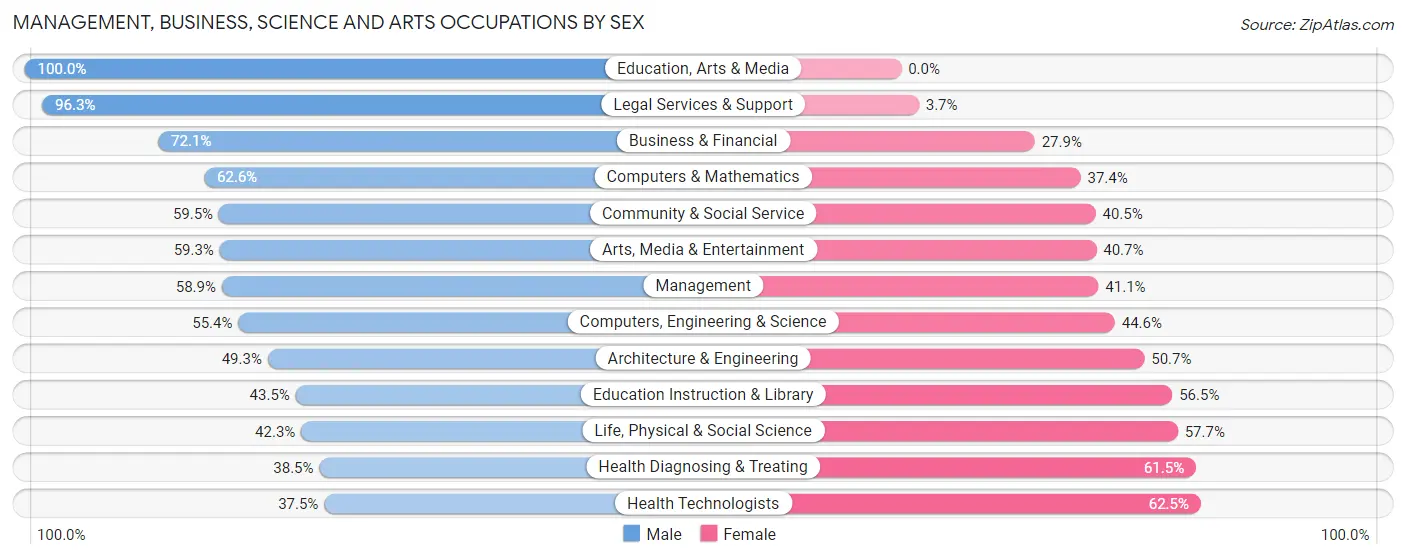
Management, Business, Science and Arts Occupations by Sex
Within the Management, Business, Science and Arts occupations in Blue Bell, the most male-oriented occupations are Education, Arts & Media (100.0%), Legal Services & Support (96.3%), and Business & Financial (72.1%), while the most female-oriented occupations are Health Technologists (62.5%), Health Diagnosing & Treating (61.5%), and Life, Physical & Social Science (57.7%).
| Occupation | Male | Female |
| Management | 422 (58.9%) | 295 (41.1%) |
| Business & Financial | 334 (72.1%) | 129 (27.9%) |
| Computers, Engineering & Science | 153 (55.4%) | 123 (44.6%) |
| Computers & Mathematics | 97 (62.6%) | 58 (37.4%) |
| Architecture & Engineering | 34 (49.3%) | 35 (50.7%) |
| Life, Physical & Social Science | 22 (42.3%) | 30 (57.7%) |
| Community & Social Service | 311 (59.5%) | 212 (40.5%) |
| Education, Arts & Media | 22 (100.0%) | 0 (0.0%) |
| Legal Services & Support | 105 (96.3%) | 4 (3.7%) |
| Education Instruction & Library | 133 (43.5%) | 173 (56.5%) |
| Arts, Media & Entertainment | 51 (59.3%) | 35 (40.7%) |
| Health Diagnosing & Treating | 57 (38.5%) | 91 (61.5%) |
| Health Technologists | 51 (37.5%) | 85 (62.5%) |
| Total (Category) | 1,277 (60.0%) | 850 (40.0%) |
| Total (Overall) | 1,762 (58.4%) | 1,257 (41.6%) |
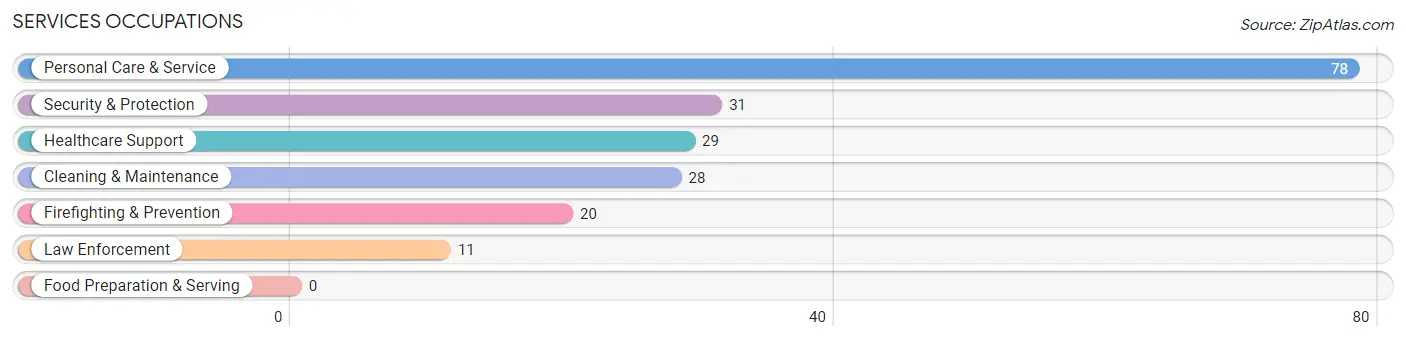
Services Occupations
The most common Services occupations in Blue Bell are Personal Care & Service (78 | 2.6%), Security & Protection (31 | 1.0%), Healthcare Support (29 | 1.0%), Cleaning & Maintenance (28 | 0.9%), and Firefighting & Prevention (20 | 0.7%).
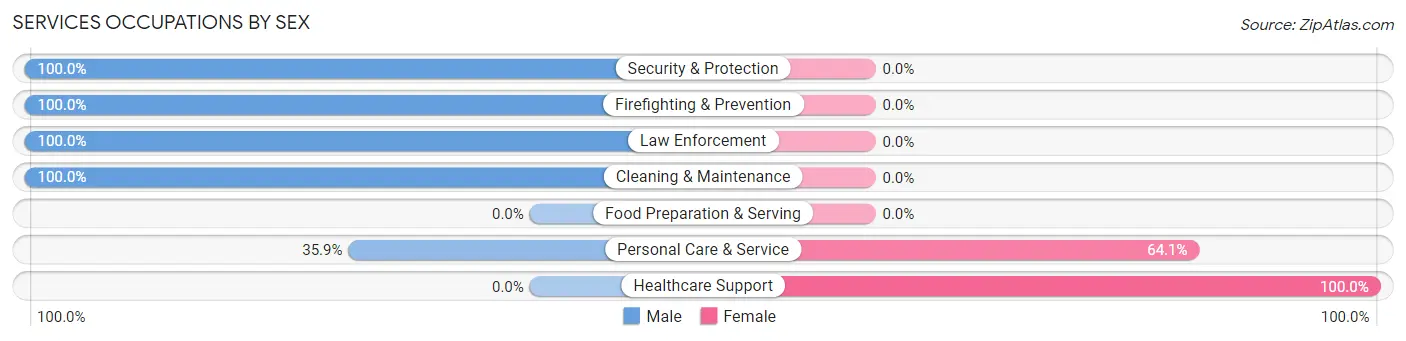
Services Occupations by Sex
Within the Services occupations in Blue Bell, the most male-oriented occupations are Security & Protection (100.0%), Firefighting & Prevention (100.0%), and Law Enforcement (100.0%), while the most female-oriented occupations are Healthcare Support (100.0%), and Personal Care & Service (64.1%).
| Occupation | Male | Female |
| Healthcare Support | 0 (0.0%) | 29 (100.0%) |
| Security & Protection | 31 (100.0%) | 0 (0.0%) |
| Firefighting & Prevention | 20 (100.0%) | 0 (0.0%) |
| Law Enforcement | 11 (100.0%) | 0 (0.0%) |
| Food Preparation & Serving | 0 (0.0%) | 0 (0.0%) |
| Cleaning & Maintenance | 28 (100.0%) | 0 (0.0%) |
| Personal Care & Service | 28 (35.9%) | 50 (64.1%) |
| Total (Category) | 87 (52.4%) | 79 (47.6%) |
| Total (Overall) | 1,762 (58.4%) | 1,257 (41.6%) |
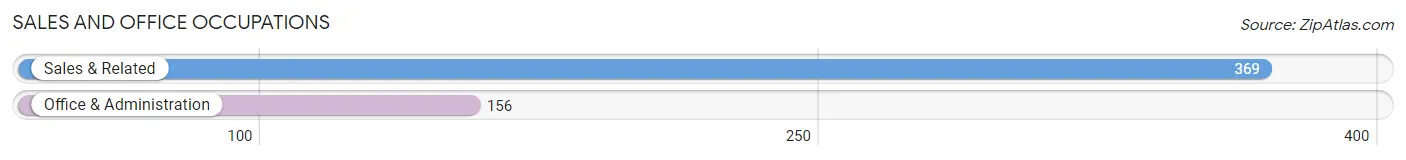
Sales and Office Occupations
The most common Sales and Office occupations in Blue Bell are Sales & Related (369 | 12.2%), and Office & Administration (156 | 5.2%).
Sales and Office Occupations by Sex
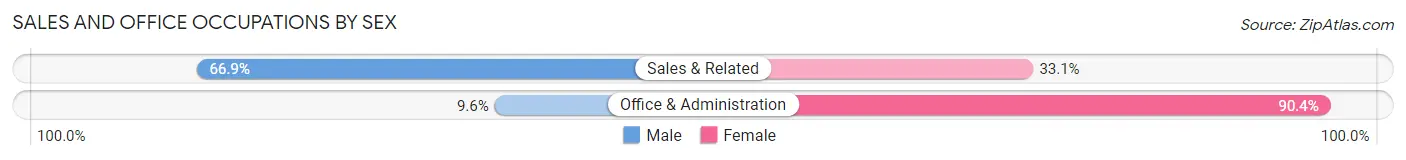
| Occupation | Male | Female |
| Sales & Related | 247 (66.9%) | 122 (33.1%) |
| Office & Administration | 15 (9.6%) | 141 (90.4%) |
| Total (Category) | 262 (49.9%) | 263 (50.1%) |
| Total (Overall) | 1,762 (58.4%) | 1,257 (41.6%) |
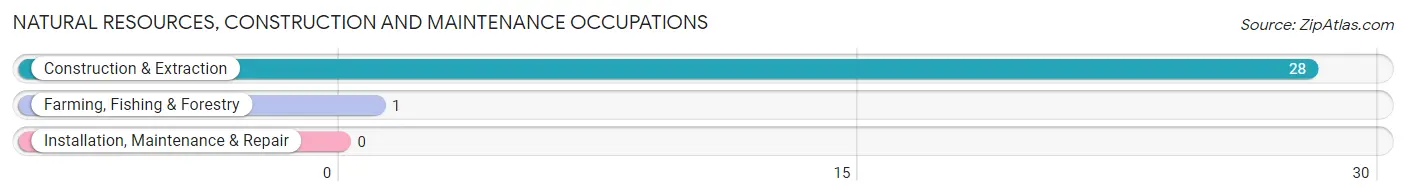
Natural Resources, Construction and Maintenance Occupations
The most common Natural Resources, Construction and Maintenance occupations in Blue Bell are Construction & Extraction (28 | 0.9%), and Farming, Fishing & Forestry (1 | 0.0%).
Natural Resources, Construction and Maintenance Occupations by Sex
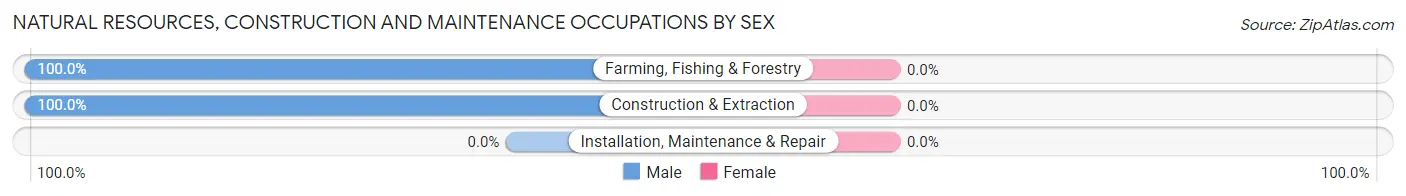
| Occupation | Male | Female |
| Farming, Fishing & Forestry | 1 (100.0%) | 0 (0.0%) |
| Construction & Extraction | 28 (100.0%) | 0 (0.0%) |
| Installation, Maintenance & Repair | 0 (0.0%) | 0 (0.0%) |
| Total (Category) | 29 (100.0%) | 0 (0.0%) |
| Total (Overall) | 1,762 (58.4%) | 1,257 (41.6%) |
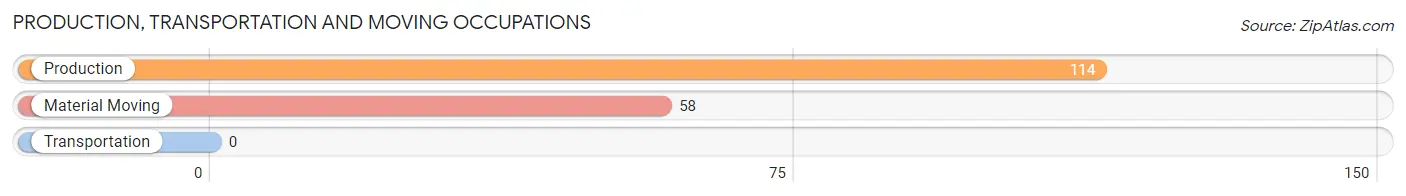
Production, Transportation and Moving Occupations
The most common Production, Transportation and Moving occupations in Blue Bell are Production (114 | 3.8%), and Material Moving (58 | 1.9%).
Production, Transportation and Moving Occupations by Sex
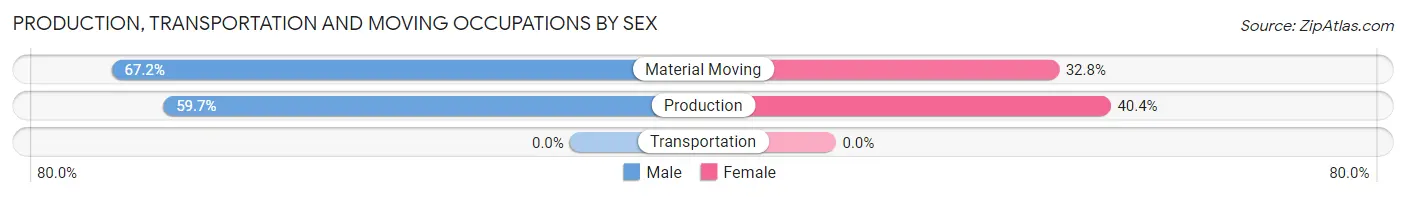
| Occupation | Male | Female |
| Production | 68 (59.7%) | 46 (40.4%) |
| Transportation | 0 (0.0%) | 0 (0.0%) |
| Material Moving | 39 (67.2%) | 19 (32.8%) |
| Total (Category) | 107 (62.2%) | 65 (37.8%) |
| Total (Overall) | 1,762 (58.4%) | 1,257 (41.6%) |
Employment Industries by Sex in Blue Bell
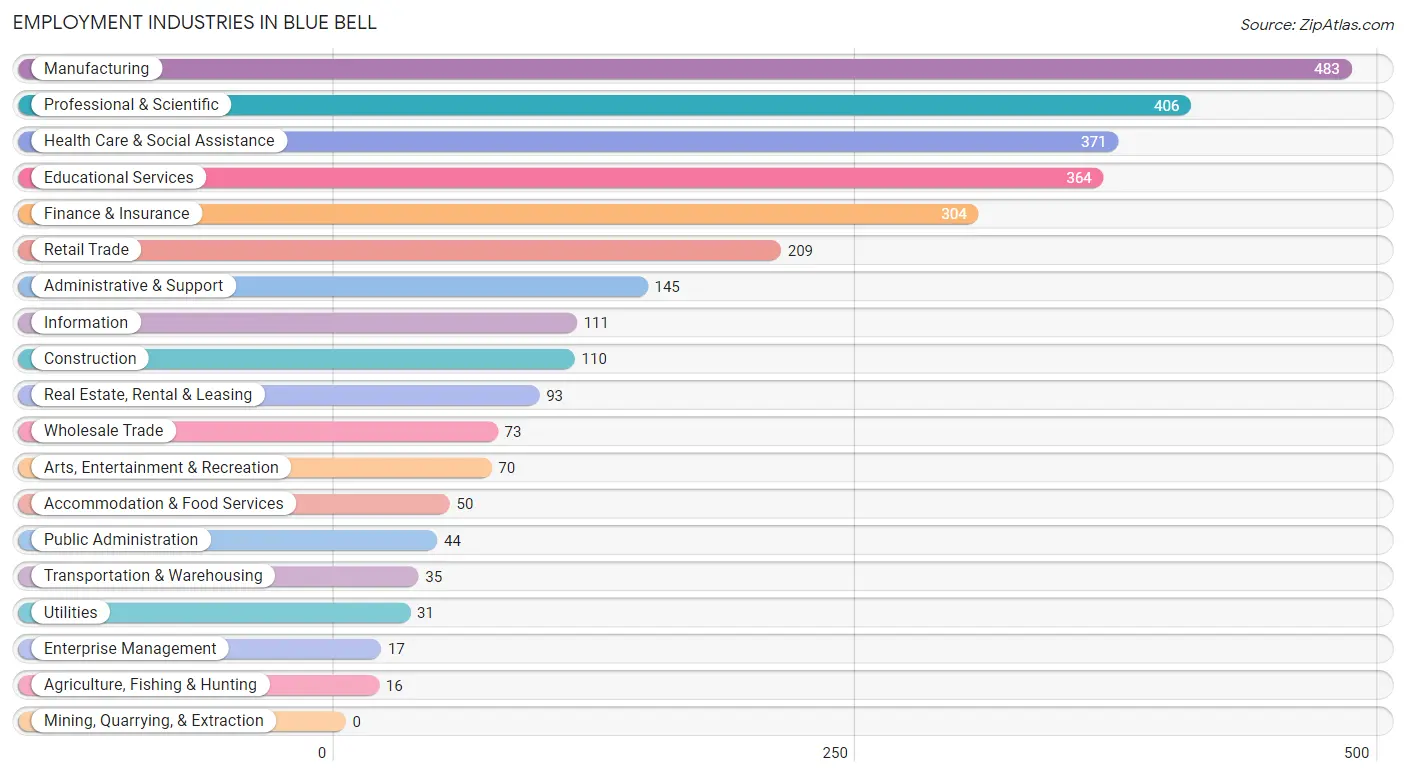
Employment Industries in Blue Bell
The major employment industries in Blue Bell include Manufacturing (483 | 16.0%), Professional & Scientific (406 | 13.5%), Health Care & Social Assistance (371 | 12.3%), Educational Services (364 | 12.1%), and Finance & Insurance (304 | 10.1%).
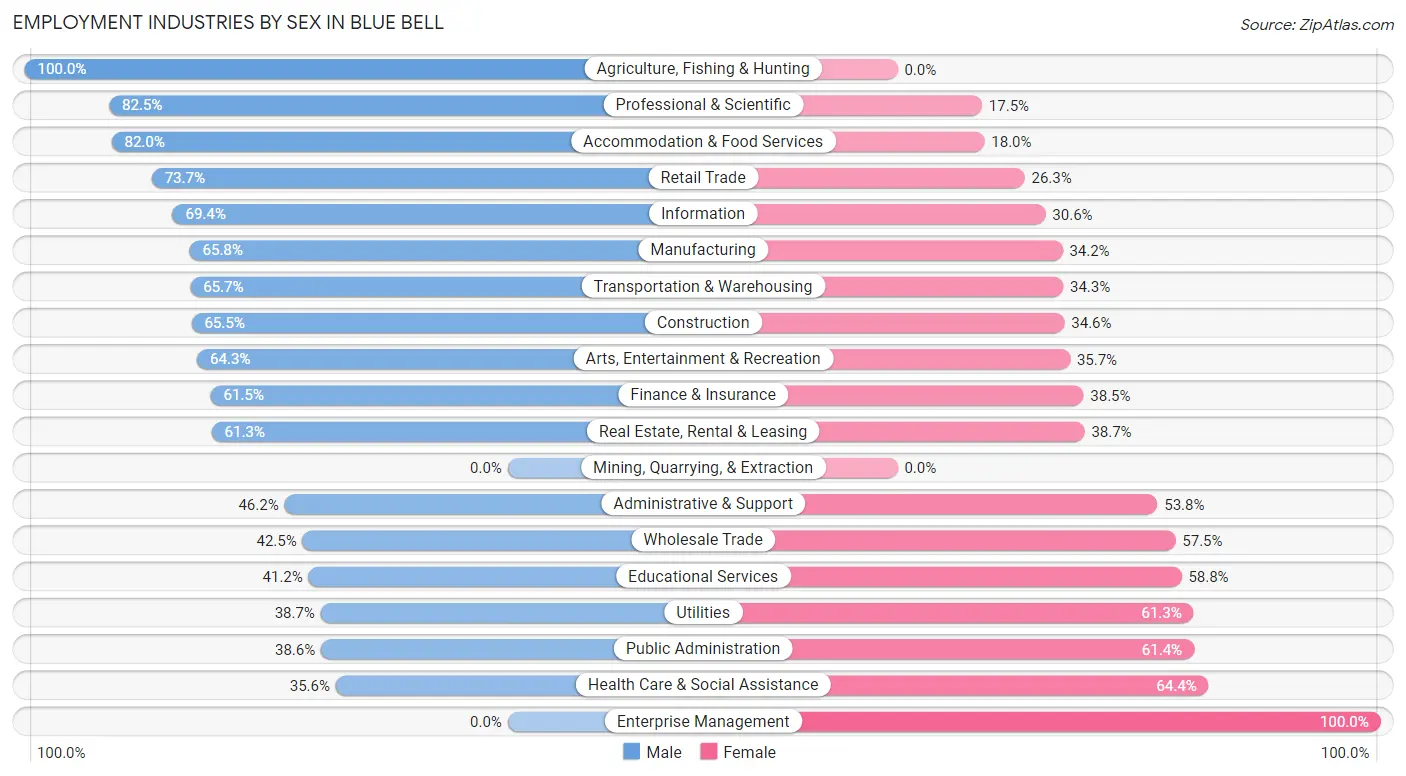
Employment Industries by Sex in Blue Bell
The Blue Bell industries that see more men than women are Agriculture, Fishing & Hunting (100.0%), Professional & Scientific (82.5%), and Accommodation & Food Services (82.0%), whereas the industries that tend to have a higher number of women are Enterprise Management (100.0%), Health Care & Social Assistance (64.4%), and Public Administration (61.4%).
| Industry | Male | Female |
| Agriculture, Fishing & Hunting | 16 (100.0%) | 0 (0.0%) |
| Mining, Quarrying, & Extraction | 0 (0.0%) | 0 (0.0%) |
| Construction | 72 (65.4%) | 38 (34.5%) |
| Manufacturing | 318 (65.8%) | 165 (34.2%) |
| Wholesale Trade | 31 (42.5%) | 42 (57.5%) |
| Retail Trade | 154 (73.7%) | 55 (26.3%) |
| Transportation & Warehousing | 23 (65.7%) | 12 (34.3%) |
| Utilities | 12 (38.7%) | 19 (61.3%) |
| Information | 77 (69.4%) | 34 (30.6%) |
| Finance & Insurance | 187 (61.5%) | 117 (38.5%) |
| Real Estate, Rental & Leasing | 57 (61.3%) | 36 (38.7%) |
| Professional & Scientific | 335 (82.5%) | 71 (17.5%) |
| Enterprise Management | 0 (0.0%) | 17 (100.0%) |
| Administrative & Support | 67 (46.2%) | 78 (53.8%) |
| Educational Services | 150 (41.2%) | 214 (58.8%) |
| Health Care & Social Assistance | 132 (35.6%) | 239 (64.4%) |
| Arts, Entertainment & Recreation | 45 (64.3%) | 25 (35.7%) |
| Accommodation & Food Services | 41 (82.0%) | 9 (18.0%) |
| Public Administration | 17 (38.6%) | 27 (61.4%) |
| Total | 1,762 (58.4%) | 1,257 (41.6%) |
Education in Blue Bell
School Enrollment in Blue Bell
The most common levels of schooling among the 1,599 students in Blue Bell are elementary school (347 | 21.7%), middle school (322 | 20.1%), and college / undergraduate (232 | 14.5%).
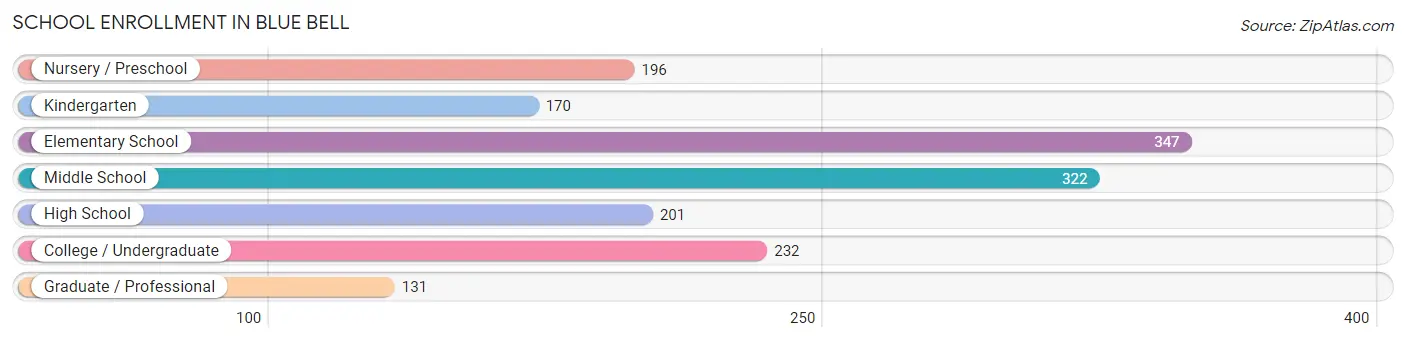
| School Level | # Students | % Students |
| Nursery / Preschool | 196 | 12.3% |
| Kindergarten | 170 | 10.6% |
| Elementary School | 347 | 21.7% |
| Middle School | 322 | 20.1% |
| High School | 201 | 12.6% |
| College / Undergraduate | 232 | 14.5% |
| Graduate / Professional | 131 | 8.2% |
| Total | 1,599 | 100.0% |
School Enrollment by Age by Funding Source in Blue Bell
Out of a total of 1,599 students who are enrolled in schools in Blue Bell, 841 (52.6%) attend a private institution, while the remaining 758 (47.4%) are enrolled in public schools. The age group of 25 to 34 year olds has the highest likelihood of being enrolled in private schools, with 50 (73.5% in the age bracket) enrolled. Conversely, the age group of 10 to 14 year olds has the lowest likelihood of being enrolled in a private school, with 239 (65.5% in the age bracket) attending a public institution.
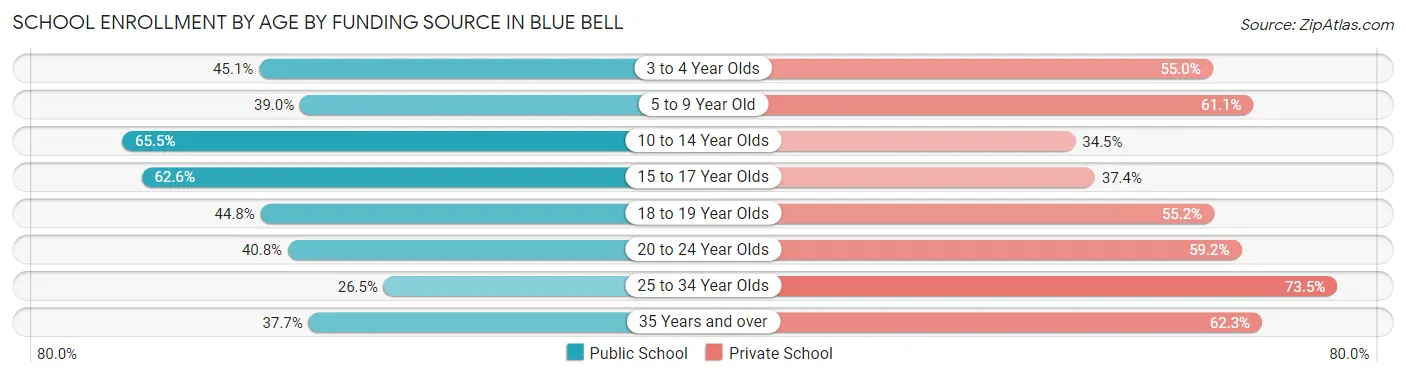
| Age Bracket | Public School | Private School |
| 3 to 4 Year Olds | 41 (45.1%) | 50 (54.9%) |
| 5 to 9 Year Old | 229 (39.0%) | 359 (61.1%) |
| 10 to 14 Year Olds | 239 (65.5%) | 126 (34.5%) |
| 15 to 17 Year Olds | 102 (62.6%) | 61 (37.4%) |
| 18 to 19 Year Olds | 13 (44.8%) | 16 (55.2%) |
| 20 to 24 Year Olds | 64 (40.8%) | 93 (59.2%) |
| 25 to 34 Year Olds | 18 (26.5%) | 50 (73.5%) |
| 35 Years and over | 52 (37.7%) | 86 (62.3%) |
| Total | 758 (47.4%) | 841 (52.6%) |
Educational Attainment by Field of Study in Blue Bell
Business (847 | 22.2%), education (521 | 13.7%), liberal arts & history (314 | 8.2%), social sciences (301 | 7.9%), and engineering (269 | 7.1%) are the most common fields of study among 3,810 individuals in Blue Bell who have obtained a bachelor's degree or higher.
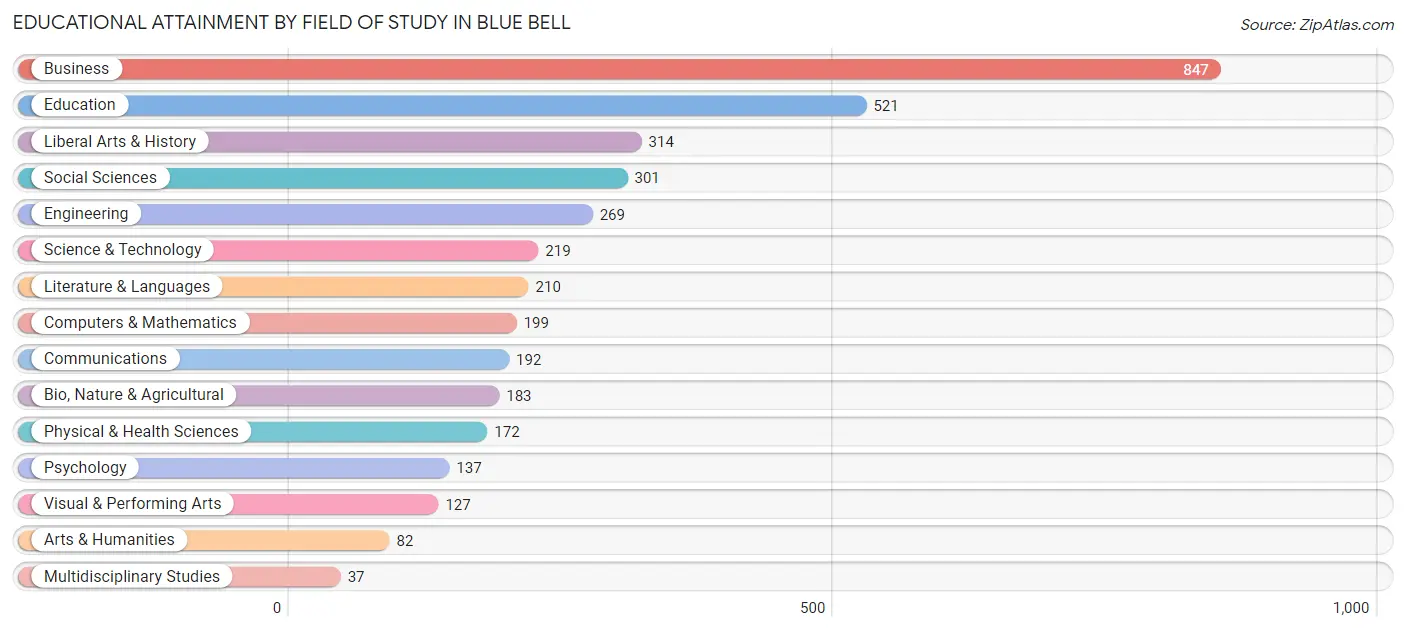
| Field of Study | # Graduates | % Graduates |
| Computers & Mathematics | 199 | 5.2% |
| Bio, Nature & Agricultural | 183 | 4.8% |
| Physical & Health Sciences | 172 | 4.5% |
| Psychology | 137 | 3.6% |
| Social Sciences | 301 | 7.9% |
| Engineering | 269 | 7.1% |
| Multidisciplinary Studies | 37 | 1.0% |
| Science & Technology | 219 | 5.8% |
| Business | 847 | 22.2% |
| Education | 521 | 13.7% |
| Literature & Languages | 210 | 5.5% |
| Liberal Arts & History | 314 | 8.2% |
| Visual & Performing Arts | 127 | 3.3% |
| Communications | 192 | 5.0% |
| Arts & Humanities | 82 | 2.1% |
| Total | 3,810 | 100.0% |
Transportation & Commute in Blue Bell
Vehicle Availability by Sex in Blue Bell
The most prevalent vehicle ownership categories in Blue Bell are males with 2 vehicles (817, accounting for 46.6%) and females with 2 vehicles (592, making up 66.7%).
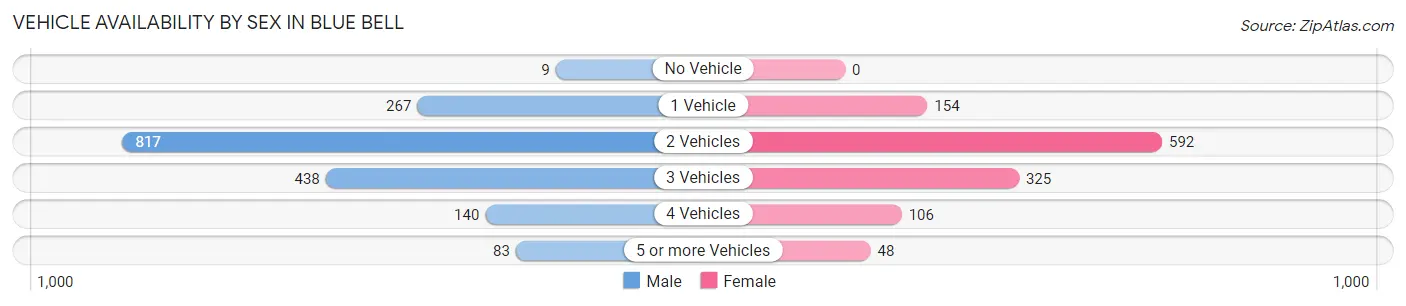
| Vehicles Available | Male | Female |
| No Vehicle | 9 (0.5%) | 0 (0.0%) |
| 1 Vehicle | 267 (15.2%) | 154 (12.6%) |
| 2 Vehicles | 817 (46.6%) | 592 (48.3%) |
| 3 Vehicles | 438 (25.0%) | 325 (26.5%) |
| 4 Vehicles | 140 (8.0%) | 106 (8.6%) |
| 5 or more Vehicles | 83 (4.7%) | 48 (3.9%) |
| Total | 1,754 (100.0%) | 1,225 (100.0%) |
Commute Time in Blue Bell
The most frequently occuring commute durations in Blue Bell are 30 to 34 minutes (323 commuters, 15.2%), 20 to 24 minutes (318 commuters, 15.0%), and 10 to 14 minutes (296 commuters, 14.0%).
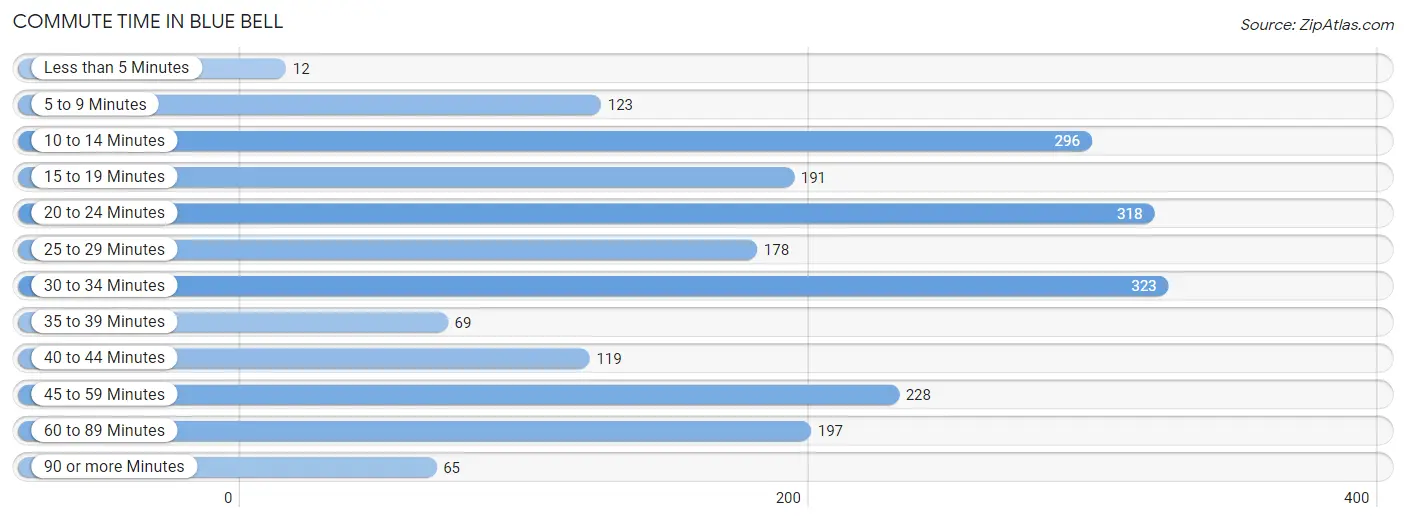
| Commute Time | # Commuters | % Commuters |
| Less than 5 Minutes | 12 | 0.6% |
| 5 to 9 Minutes | 123 | 5.8% |
| 10 to 14 Minutes | 296 | 14.0% |
| 15 to 19 Minutes | 191 | 9.0% |
| 20 to 24 Minutes | 318 | 15.0% |
| 25 to 29 Minutes | 178 | 8.4% |
| 30 to 34 Minutes | 323 | 15.2% |
| 35 to 39 Minutes | 69 | 3.3% |
| 40 to 44 Minutes | 119 | 5.6% |
| 45 to 59 Minutes | 228 | 10.8% |
| 60 to 89 Minutes | 197 | 9.3% |
| 90 or more Minutes | 65 | 3.1% |
Commute Time by Sex in Blue Bell
The most common commute times in Blue Bell are 30 to 34 minutes (215 commuters, 17.7%) for males and 10 to 14 minutes (172 commuters, 19.1%) for females.
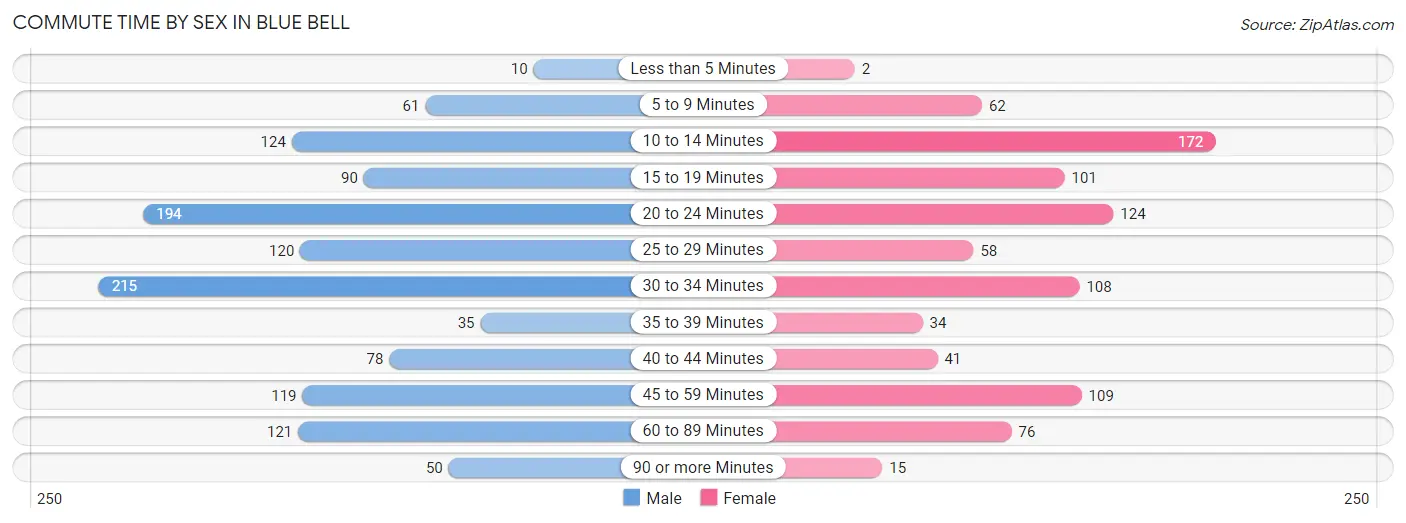
| Commute Time | Male | Female |
| Less than 5 Minutes | 10 (0.8%) | 2 (0.2%) |
| 5 to 9 Minutes | 61 (5.0%) | 62 (6.9%) |
| 10 to 14 Minutes | 124 (10.2%) | 172 (19.1%) |
| 15 to 19 Minutes | 90 (7.4%) | 101 (11.2%) |
| 20 to 24 Minutes | 194 (15.9%) | 124 (13.8%) |
| 25 to 29 Minutes | 120 (9.9%) | 58 (6.4%) |
| 30 to 34 Minutes | 215 (17.7%) | 108 (12.0%) |
| 35 to 39 Minutes | 35 (2.9%) | 34 (3.8%) |
| 40 to 44 Minutes | 78 (6.4%) | 41 (4.5%) |
| 45 to 59 Minutes | 119 (9.8%) | 109 (12.1%) |
| 60 to 89 Minutes | 121 (9.9%) | 76 (8.4%) |
| 90 or more Minutes | 50 (4.1%) | 15 (1.7%) |
Time of Departure to Work by Sex in Blue Bell
The most frequent times of departure to work in Blue Bell are 8:00 AM to 8:29 AM (257, 21.1%) for males and 8:00 AM to 8:29 AM (259, 28.7%) for females.
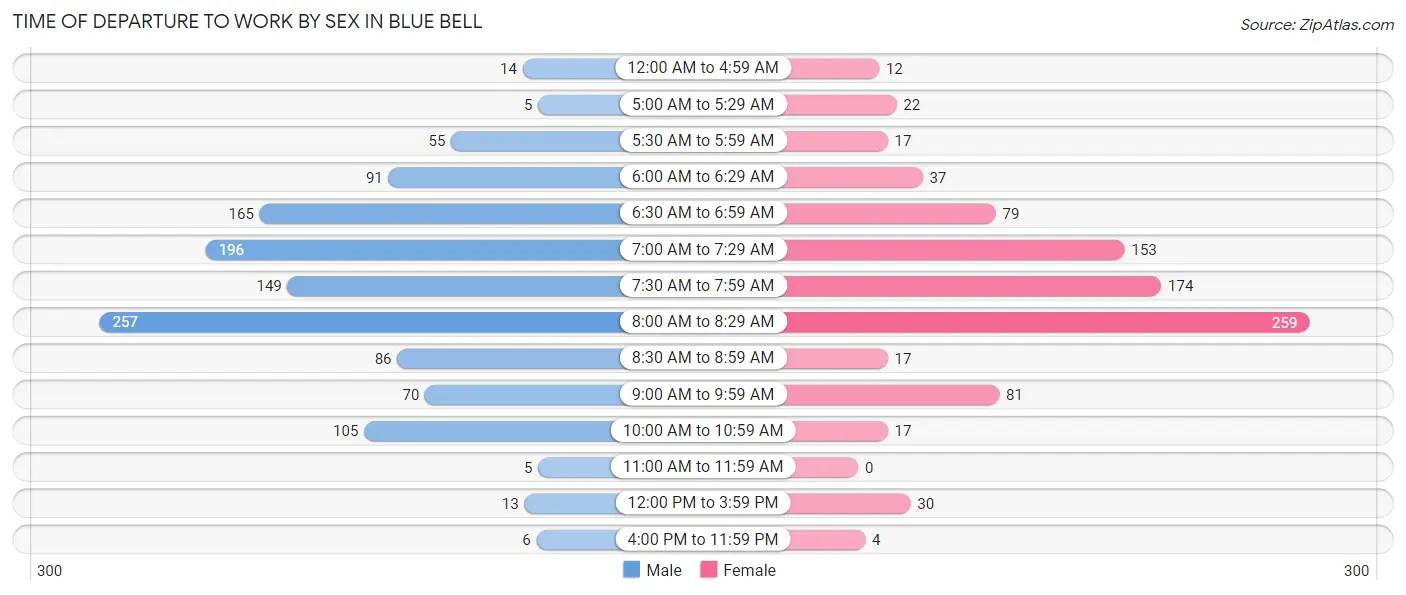
| Time of Departure | Male | Female |
| 12:00 AM to 4:59 AM | 14 (1.1%) | 12 (1.3%) |
| 5:00 AM to 5:29 AM | 5 (0.4%) | 22 (2.4%) |
| 5:30 AM to 5:59 AM | 55 (4.5%) | 17 (1.9%) |
| 6:00 AM to 6:29 AM | 91 (7.5%) | 37 (4.1%) |
| 6:30 AM to 6:59 AM | 165 (13.6%) | 79 (8.8%) |
| 7:00 AM to 7:29 AM | 196 (16.1%) | 153 (17.0%) |
| 7:30 AM to 7:59 AM | 149 (12.2%) | 174 (19.3%) |
| 8:00 AM to 8:29 AM | 257 (21.1%) | 259 (28.7%) |
| 8:30 AM to 8:59 AM | 86 (7.1%) | 17 (1.9%) |
| 9:00 AM to 9:59 AM | 70 (5.8%) | 81 (9.0%) |
| 10:00 AM to 10:59 AM | 105 (8.6%) | 17 (1.9%) |
| 11:00 AM to 11:59 AM | 5 (0.4%) | 0 (0.0%) |
| 12:00 PM to 3:59 PM | 13 (1.1%) | 30 (3.3%) |
| 4:00 PM to 11:59 PM | 6 (0.5%) | 4 (0.4%) |
| Total | 1,217 (100.0%) | 902 (100.0%) |
Housing Occupancy in Blue Bell
Occupancy by Ownership in Blue Bell
Of the total 2,453 dwellings in Blue Bell, owner-occupied units account for 2,206 (89.9%), while renter-occupied units make up 247 (10.1%).
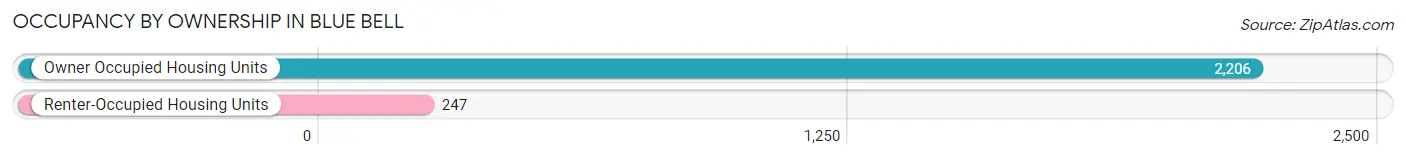
| Occupancy | # Housing Units | % Housing Units |
| Owner Occupied Housing Units | 2,206 | 89.9% |
| Renter-Occupied Housing Units | 247 | 10.1% |
| Total Occupied Housing Units | 2,453 | 100.0% |
Occupancy by Household Size in Blue Bell
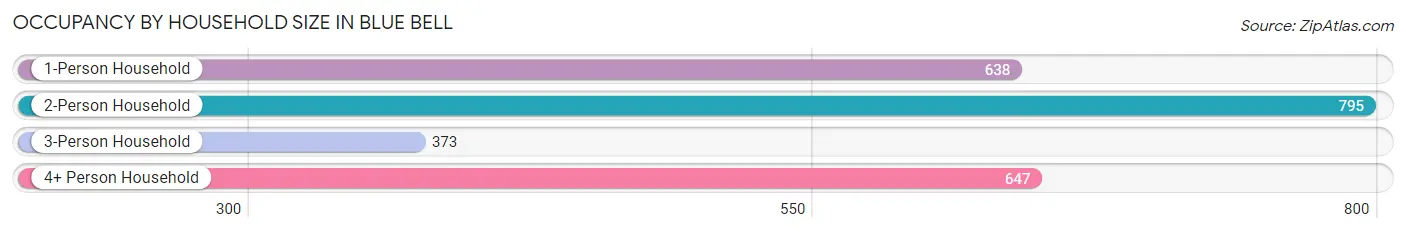
| Household Size | # Housing Units | % Housing Units |
| 1-Person Household | 638 | 26.0% |
| 2-Person Household | 795 | 32.4% |
| 3-Person Household | 373 | 15.2% |
| 4+ Person Household | 647 | 26.4% |
| Total Housing Units | 2,453 | 100.0% |
Occupancy by Ownership by Household Size in Blue Bell
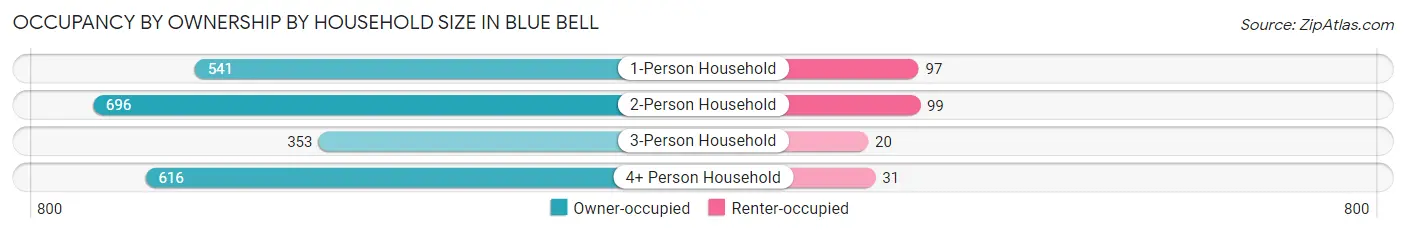
| Household Size | Owner-occupied | Renter-occupied |
| 1-Person Household | 541 (84.8%) | 97 (15.2%) |
| 2-Person Household | 696 (87.5%) | 99 (12.4%) |
| 3-Person Household | 353 (94.6%) | 20 (5.4%) |
| 4+ Person Household | 616 (95.2%) | 31 (4.8%) |
| Total Housing Units | 2,206 (89.9%) | 247 (10.1%) |
Occupancy by Educational Attainment in Blue Bell
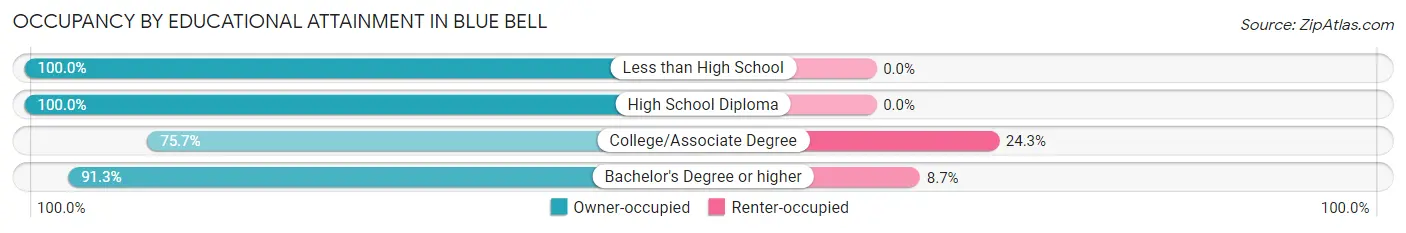
| Household Size | Owner-occupied | Renter-occupied |
| Less than High School | 5 (100.0%) | 0 (0.0%) |
| High School Diploma | 138 (100.0%) | 0 (0.0%) |
| College/Associate Degree | 227 (75.7%) | 73 (24.3%) |
| Bachelor's Degree or higher | 1,836 (91.3%) | 174 (8.7%) |
Occupancy by Age of Householder in Blue Bell
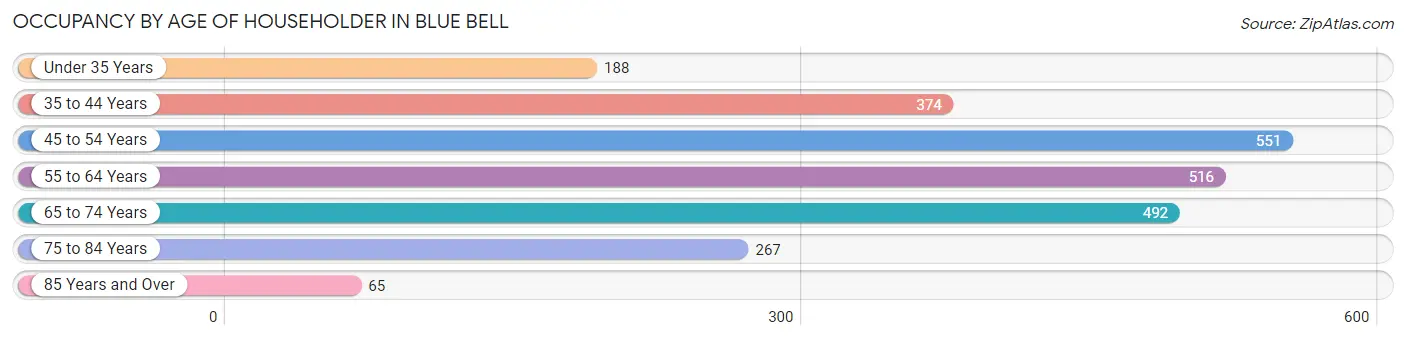
| Age Bracket | # Households | % Households |
| Under 35 Years | 188 | 7.7% |
| 35 to 44 Years | 374 | 15.2% |
| 45 to 54 Years | 551 | 22.5% |
| 55 to 64 Years | 516 | 21.0% |
| 65 to 74 Years | 492 | 20.1% |
| 75 to 84 Years | 267 | 10.9% |
| 85 Years and Over | 65 | 2.6% |
| Total | 2,453 | 100.0% |
Housing Finances in Blue Bell
Median Income by Occupancy in Blue Bell
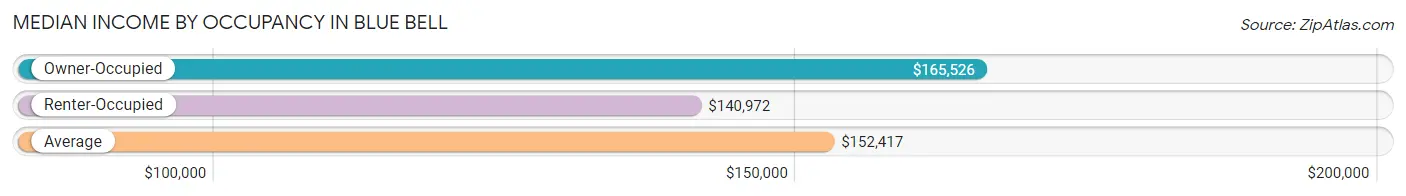
| Occupancy Type | # Households | Median Income |
| Owner-Occupied | 2,206 (89.9%) | $165,526 |
| Renter-Occupied | 247 (10.1%) | $140,972 |
| Average | 2,453 (100.0%) | $152,417 |
Occupancy by Householder Income Bracket in Blue Bell
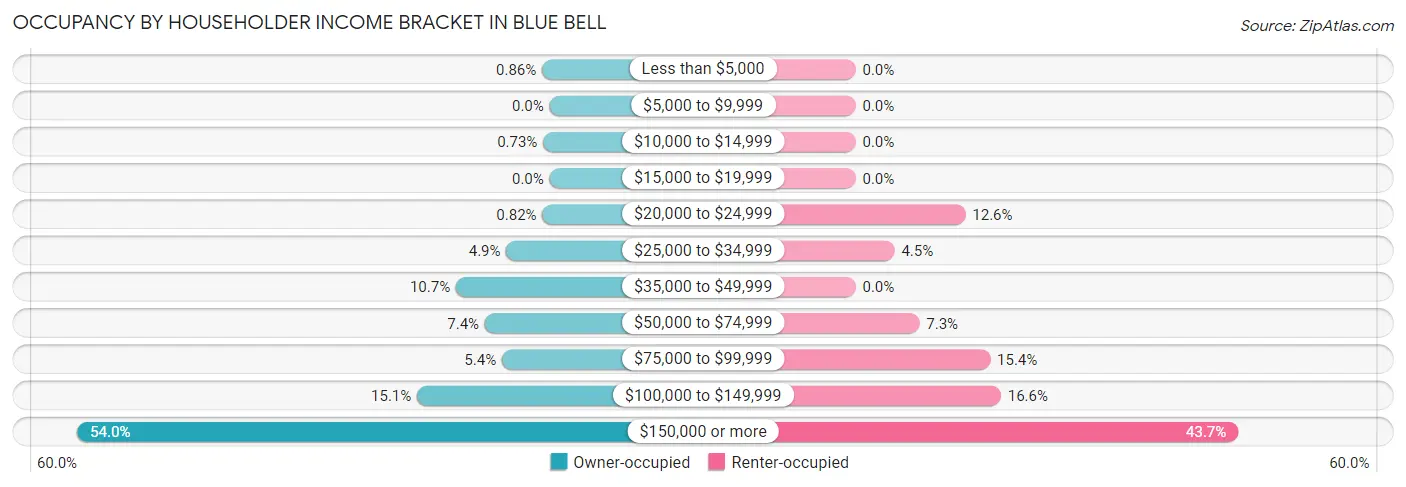
| Income Bracket | Owner-occupied | Renter-occupied |
| Less than $5,000 | 19 (0.9%) | 0 (0.0%) |
| $5,000 to $9,999 | 0 (0.0%) | 0 (0.0%) |
| $10,000 to $14,999 | 16 (0.7%) | 0 (0.0%) |
| $15,000 to $19,999 | 0 (0.0%) | 0 (0.0%) |
| $20,000 to $24,999 | 18 (0.8%) | 31 (12.6%) |
| $25,000 to $34,999 | 109 (4.9%) | 11 (4.4%) |
| $35,000 to $49,999 | 236 (10.7%) | 0 (0.0%) |
| $50,000 to $74,999 | 163 (7.4%) | 18 (7.3%) |
| $75,000 to $99,999 | 120 (5.4%) | 38 (15.4%) |
| $100,000 to $149,999 | 334 (15.1%) | 41 (16.6%) |
| $150,000 or more | 1,191 (54.0%) | 108 (43.7%) |
| Total | 2,206 (100.0%) | 247 (100.0%) |
Monthly Housing Cost Tiers in Blue Bell
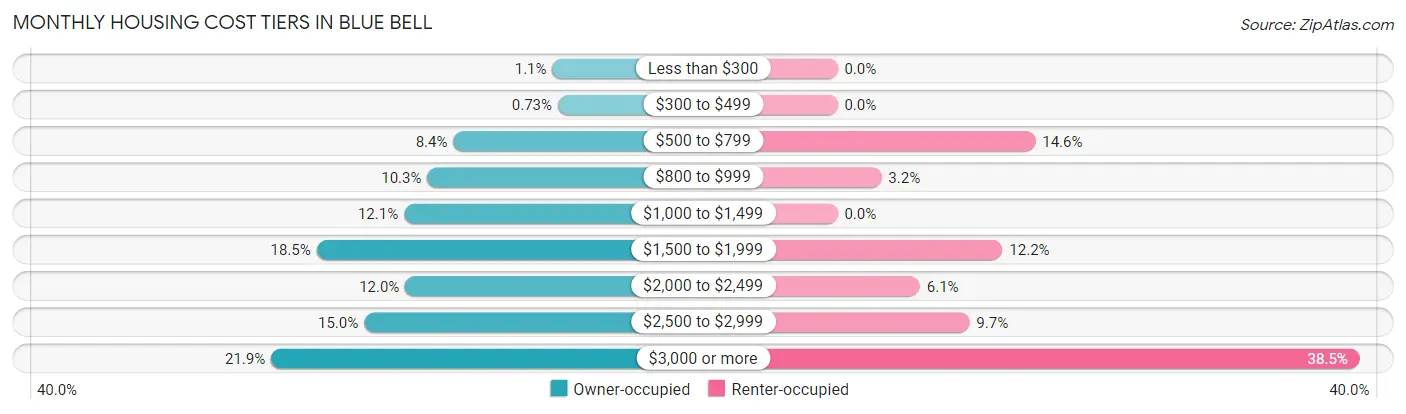
| Monthly Cost | Owner-occupied | Renter-occupied |
| Less than $300 | 25 (1.1%) | 0 (0.0%) |
| $300 to $499 | 16 (0.7%) | 0 (0.0%) |
| $500 to $799 | 186 (8.4%) | 36 (14.6%) |
| $800 to $999 | 228 (10.3%) | 8 (3.2%) |
| $1,000 to $1,499 | 266 (12.1%) | 0 (0.0%) |
| $1,500 to $1,999 | 408 (18.5%) | 30 (12.1%) |
| $2,000 to $2,499 | 264 (12.0%) | 15 (6.1%) |
| $2,500 to $2,999 | 331 (15.0%) | 24 (9.7%) |
| $3,000 or more | 482 (21.8%) | 95 (38.5%) |
| Total | 2,206 (100.0%) | 247 (100.0%) |
Physical Housing Characteristics in Blue Bell
Housing Structures in Blue Bell
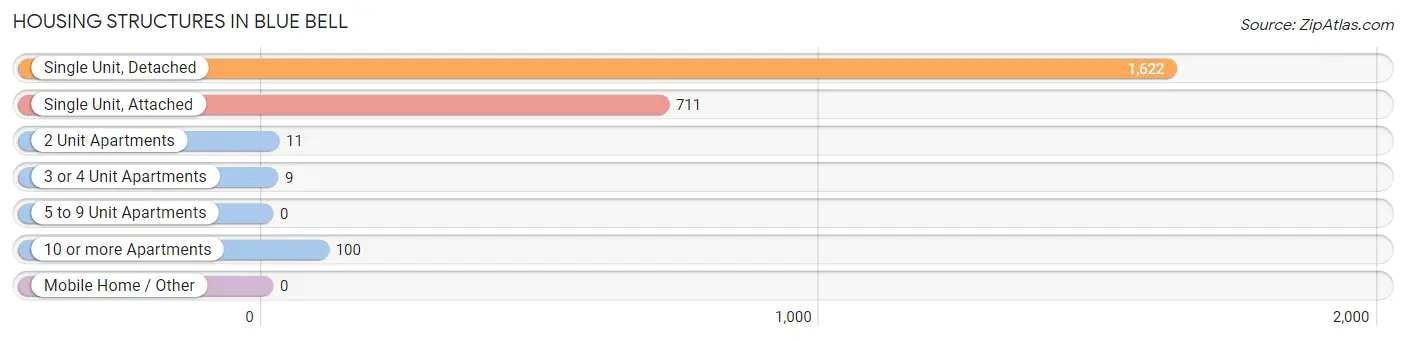
| Structure Type | # Housing Units | % Housing Units |
| Single Unit, Detached | 1,622 | 66.1% |
| Single Unit, Attached | 711 | 29.0% |
| 2 Unit Apartments | 11 | 0.4% |
| 3 or 4 Unit Apartments | 9 | 0.4% |
| 5 to 9 Unit Apartments | 0 | 0.0% |
| 10 or more Apartments | 100 | 4.1% |
| Mobile Home / Other | 0 | 0.0% |
| Total | 2,453 | 100.0% |
Housing Structures by Occupancy in Blue Bell
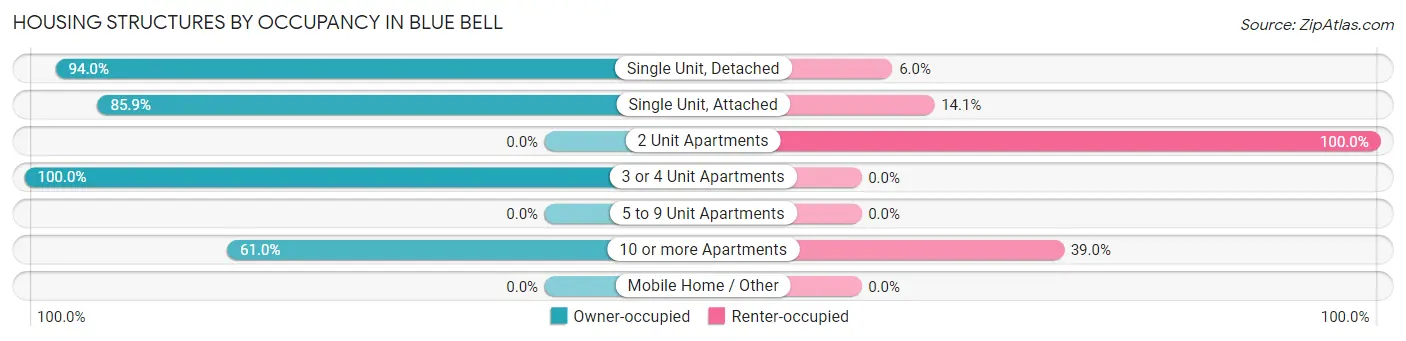
| Structure Type | Owner-occupied | Renter-occupied |
| Single Unit, Detached | 1,525 (94.0%) | 97 (6.0%) |
| Single Unit, Attached | 611 (85.9%) | 100 (14.1%) |
| 2 Unit Apartments | 0 (0.0%) | 11 (100.0%) |
| 3 or 4 Unit Apartments | 9 (100.0%) | 0 (0.0%) |
| 5 to 9 Unit Apartments | 0 (0.0%) | 0 (0.0%) |
| 10 or more Apartments | 61 (61.0%) | 39 (39.0%) |
| Mobile Home / Other | 0 (0.0%) | 0 (0.0%) |
| Total | 2,206 (89.9%) | 247 (10.1%) |
Housing Structures by Number of Rooms in Blue Bell
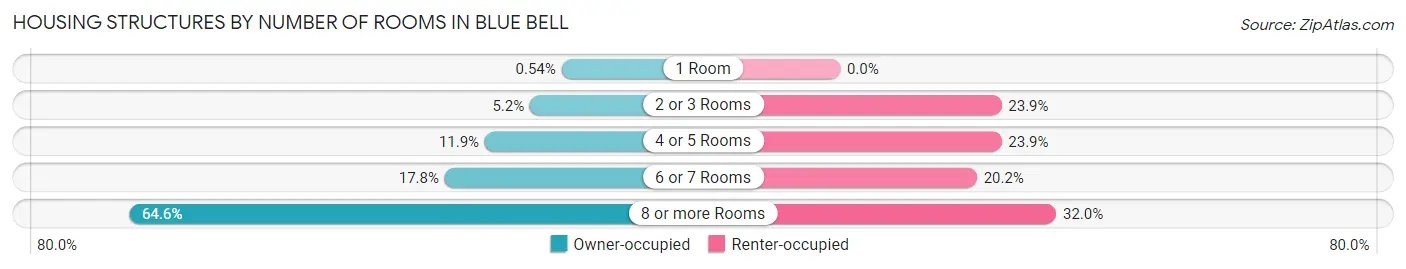
| Number of Rooms | Owner-occupied | Renter-occupied |
| 1 Room | 12 (0.5%) | 0 (0.0%) |
| 2 or 3 Rooms | 115 (5.2%) | 59 (23.9%) |
| 4 or 5 Rooms | 262 (11.9%) | 59 (23.9%) |
| 6 or 7 Rooms | 393 (17.8%) | 50 (20.2%) |
| 8 or more Rooms | 1,424 (64.5%) | 79 (32.0%) |
| Total | 2,206 (100.0%) | 247 (100.0%) |
Housing Structure by Heating Type in Blue Bell
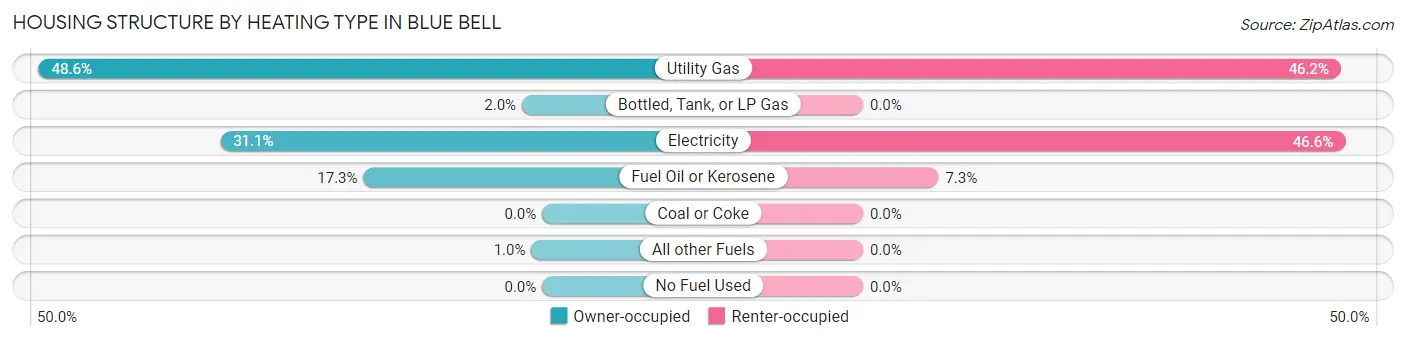
| Heating Type | Owner-occupied | Renter-occupied |
| Utility Gas | 1,073 (48.6%) | 114 (46.2%) |
| Bottled, Tank, or LP Gas | 43 (1.9%) | 0 (0.0%) |
| Electricity | 686 (31.1%) | 115 (46.6%) |
| Fuel Oil or Kerosene | 381 (17.3%) | 18 (7.3%) |
| Coal or Coke | 0 (0.0%) | 0 (0.0%) |
| All other Fuels | 23 (1.0%) | 0 (0.0%) |
| No Fuel Used | 0 (0.0%) | 0 (0.0%) |
| Total | 2,206 (100.0%) | 247 (100.0%) |
Household Vehicle Usage in Blue Bell
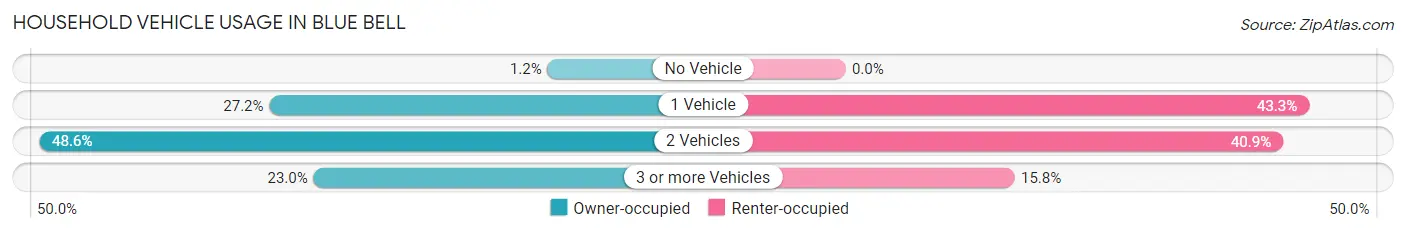
| Vehicles per Household | Owner-occupied | Renter-occupied |
| No Vehicle | 26 (1.2%) | 0 (0.0%) |
| 1 Vehicle | 599 (27.2%) | 107 (43.3%) |
| 2 Vehicles | 1,073 (48.6%) | 101 (40.9%) |
| 3 or more Vehicles | 508 (23.0%) | 39 (15.8%) |
| Total | 2,206 (100.0%) | 247 (100.0%) |
Real Estate & Mortgages in Blue Bell
Real Estate and Mortgage Overview in Blue Bell
| Characteristic | Without Mortgage | With Mortgage |
| Housing Units | 791 | 1,415 |
| Median Property Value | $555,200 | $509,600 |
| Median Household Income | $128,669 | $845 |
| Monthly Housing Costs | $972 | $482 |
| Real Estate Taxes | $6,107 | $0 |
Property Value by Mortgage Status in Blue Bell
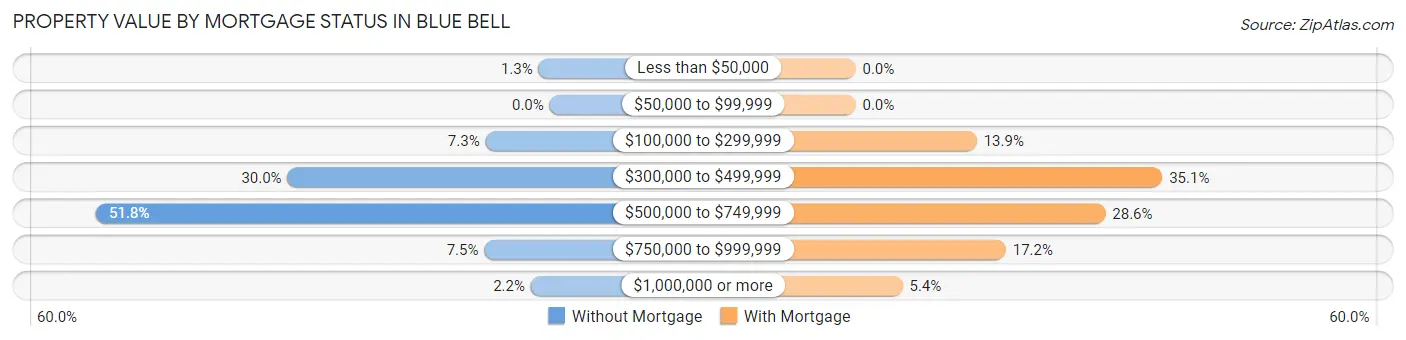
| Property Value | Without Mortgage | With Mortgage |
| Less than $50,000 | 10 (1.3%) | 0 (0.0%) |
| $50,000 to $99,999 | 0 (0.0%) | 0 (0.0%) |
| $100,000 to $299,999 | 58 (7.3%) | 196 (13.9%) |
| $300,000 to $499,999 | 237 (30.0%) | 496 (35.0%) |
| $500,000 to $749,999 | 410 (51.8%) | 404 (28.5%) |
| $750,000 to $999,999 | 59 (7.5%) | 243 (17.2%) |
| $1,000,000 or more | 17 (2.1%) | 76 (5.4%) |
| Total | 791 (100.0%) | 1,415 (100.0%) |
Household Income by Mortgage Status in Blue Bell
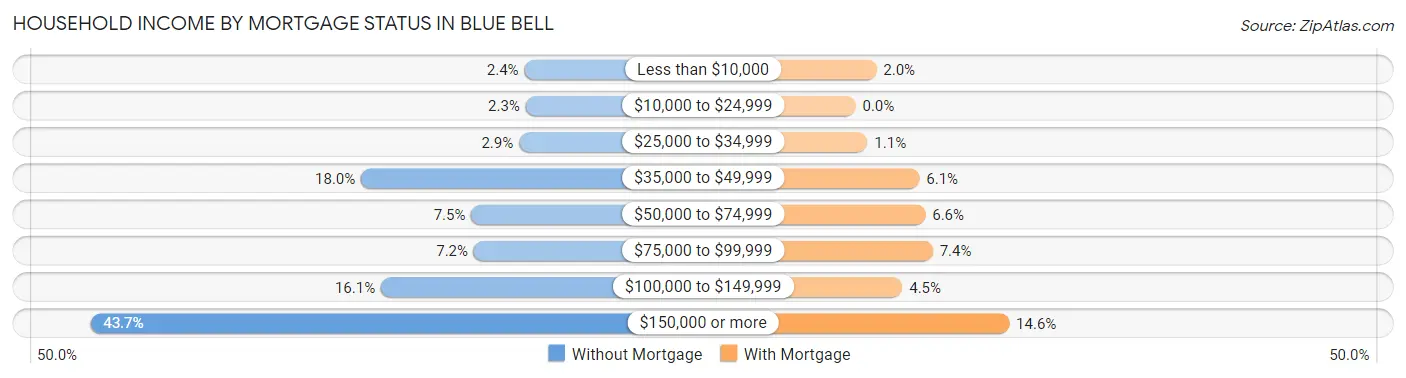
| Household Income | Without Mortgage | With Mortgage |
| Less than $10,000 | 19 (2.4%) | 28 (2.0%) |
| $10,000 to $24,999 | 18 (2.3%) | 0 (0.0%) |
| $25,000 to $34,999 | 23 (2.9%) | 16 (1.1%) |
| $35,000 to $49,999 | 142 (17.9%) | 86 (6.1%) |
| $50,000 to $74,999 | 59 (7.5%) | 94 (6.6%) |
| $75,000 to $99,999 | 57 (7.2%) | 104 (7.3%) |
| $100,000 to $149,999 | 127 (16.1%) | 63 (4.4%) |
| $150,000 or more | 346 (43.7%) | 207 (14.6%) |
| Total | 791 (100.0%) | 1,415 (100.0%) |
Property Value to Household Income Ratio in Blue Bell
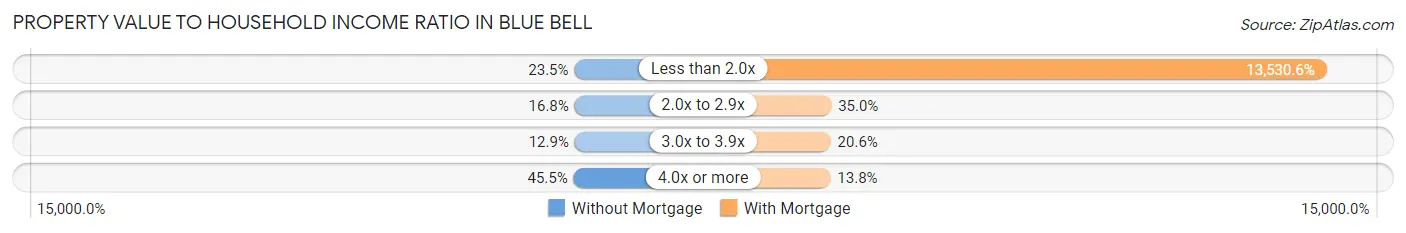
| Value-to-Income Ratio | Without Mortgage | With Mortgage |
| Less than 2.0x | 186 (23.5%) | 191,458 (13,530.6%) |
| 2.0x to 2.9x | 133 (16.8%) | 495 (35.0%) |
| 3.0x to 3.9x | 102 (12.9%) | 292 (20.6%) |
| 4.0x or more | 360 (45.5%) | 195 (13.8%) |
| Total | 791 (100.0%) | 1,415 (100.0%) |
Real Estate Taxes by Mortgage Status in Blue Bell
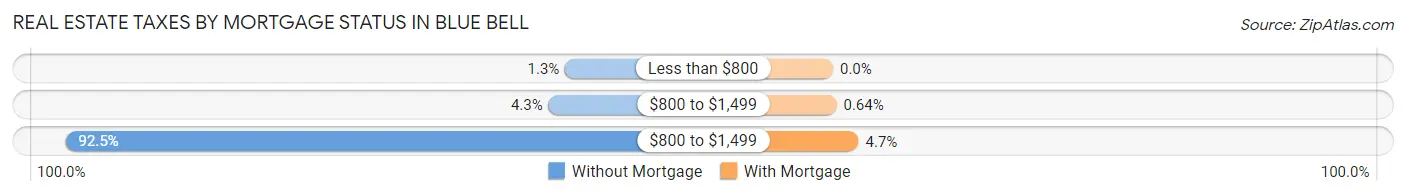
| Property Taxes | Without Mortgage | With Mortgage |
| Less than $800 | 10 (1.3%) | 0 (0.0%) |
| $800 to $1,499 | 34 (4.3%) | 9 (0.6%) |
| $800 to $1,499 | 732 (92.5%) | 66 (4.7%) |
| Total | 791 (100.0%) | 1,415 (100.0%) |
Health & Disability in Blue Bell
Health Insurance Coverage by Age in Blue Bell
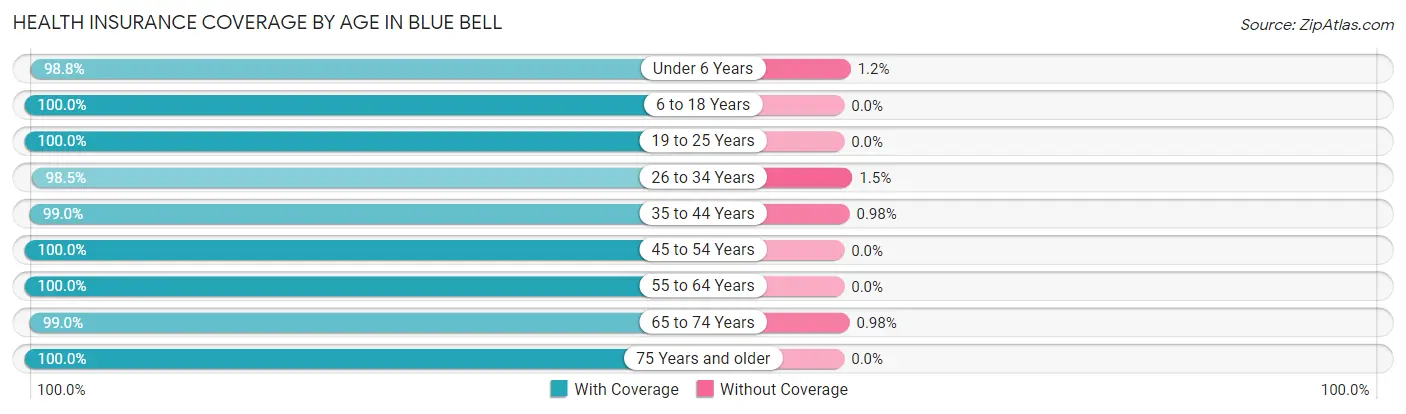
| Age Bracket | With Coverage | Without Coverage |
| Under 6 Years | 493 (98.8%) | 6 (1.2%) |
| 6 to 18 Years | 1,074 (100.0%) | 0 (0.0%) |
| 19 to 25 Years | 335 (100.0%) | 0 (0.0%) |
| 26 to 34 Years | 523 (98.5%) | 8 (1.5%) |
| 35 to 44 Years | 810 (99.0%) | 8 (1.0%) |
| 45 to 54 Years | 888 (100.0%) | 0 (0.0%) |
| 55 to 64 Years | 971 (100.0%) | 0 (0.0%) |
| 65 to 74 Years | 705 (99.0%) | 7 (1.0%) |
| 75 Years and older | 571 (100.0%) | 0 (0.0%) |
| Total | 6,370 (99.6%) | 29 (0.4%) |
Health Insurance Coverage by Citizenship Status in Blue Bell
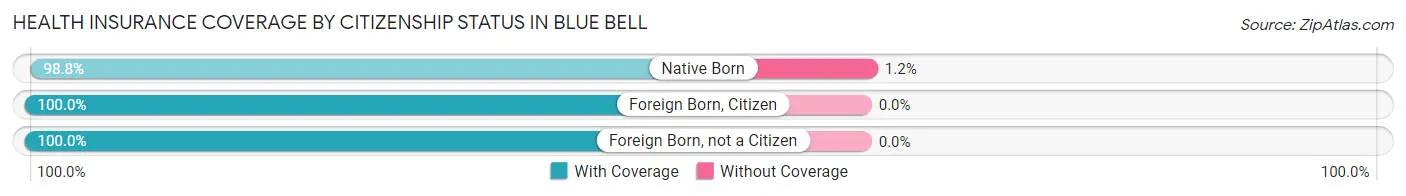
| Citizenship Status | With Coverage | Without Coverage |
| Native Born | 493 (98.8%) | 6 (1.2%) |
| Foreign Born, Citizen | 1,074 (100.0%) | 0 (0.0%) |
| Foreign Born, not a Citizen | 335 (100.0%) | 0 (0.0%) |
Health Insurance Coverage by Household Income in Blue Bell
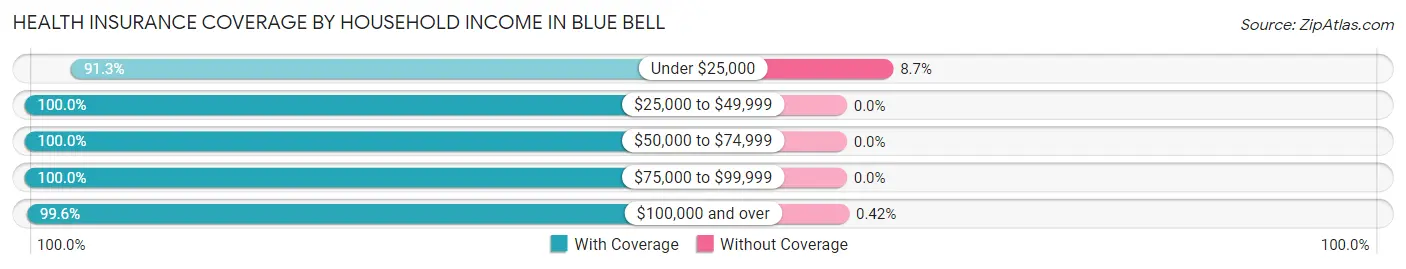
| Household Income | With Coverage | Without Coverage |
| Under $25,000 | 84 (91.3%) | 8 (8.7%) |
| $25,000 to $49,999 | 539 (100.0%) | 0 (0.0%) |
| $50,000 to $74,999 | 420 (100.0%) | 0 (0.0%) |
| $75,000 to $99,999 | 343 (100.0%) | 0 (0.0%) |
| $100,000 and over | 4,980 (99.6%) | 21 (0.4%) |
Public vs Private Health Insurance Coverage by Age in Blue Bell
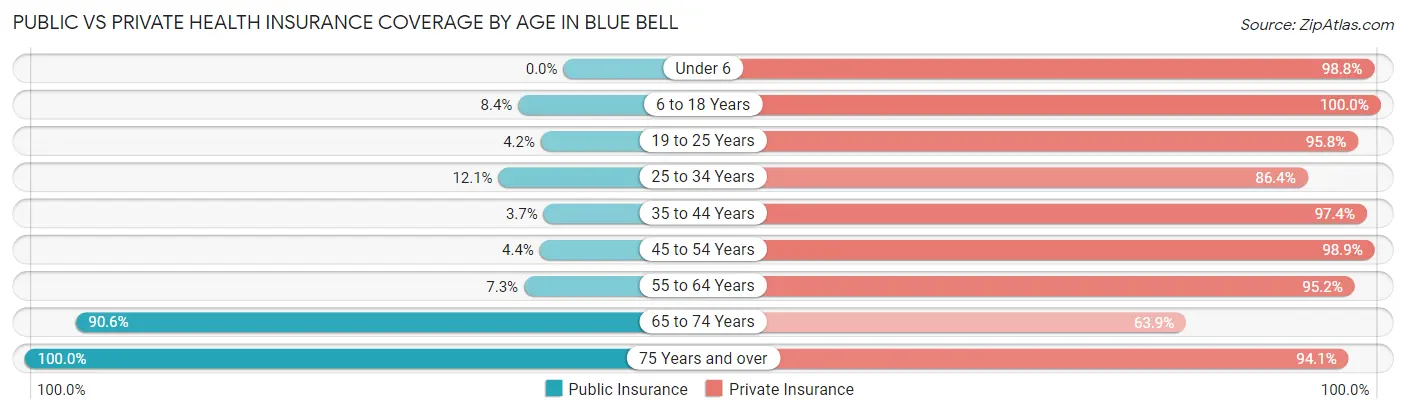
| Age Bracket | Public Insurance | Private Insurance |
| Under 6 | 0 (0.0%) | 493 (98.8%) |
| 6 to 18 Years | 90 (8.4%) | 1,074 (100.0%) |
| 19 to 25 Years | 14 (4.2%) | 321 (95.8%) |
| 25 to 34 Years | 64 (12.0%) | 459 (86.4%) |
| 35 to 44 Years | 30 (3.7%) | 797 (97.4%) |
| 45 to 54 Years | 39 (4.4%) | 878 (98.9%) |
| 55 to 64 Years | 71 (7.3%) | 924 (95.2%) |
| 65 to 74 Years | 645 (90.6%) | 455 (63.9%) |
| 75 Years and over | 571 (100.0%) | 537 (94.1%) |
| Total | 1,524 (23.8%) | 5,938 (92.8%) |
Disability Status by Sex by Age in Blue Bell
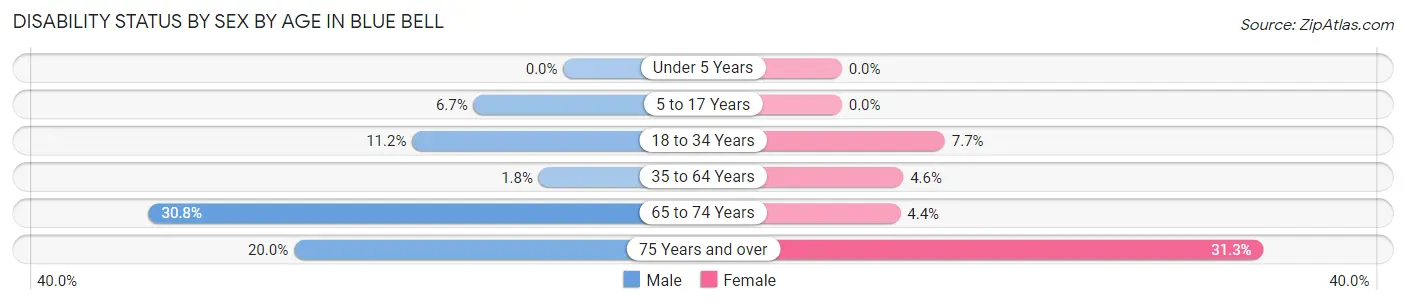
| Age Bracket | Male | Female |
| Under 5 Years | 0 (0.0%) | 0 (0.0%) |
| 5 to 17 Years | 43 (6.7%) | 0 (0.0%) |
| 18 to 34 Years | 55 (11.2%) | 31 (7.6%) |
| 35 to 64 Years | 26 (1.8%) | 57 (4.6%) |
| 65 to 74 Years | 113 (30.8%) | 15 (4.3%) |
| 75 Years and over | 42 (20.0%) | 113 (31.3%) |
Disability Class by Sex by Age in Blue Bell
Disability Class: Hearing Difficulty
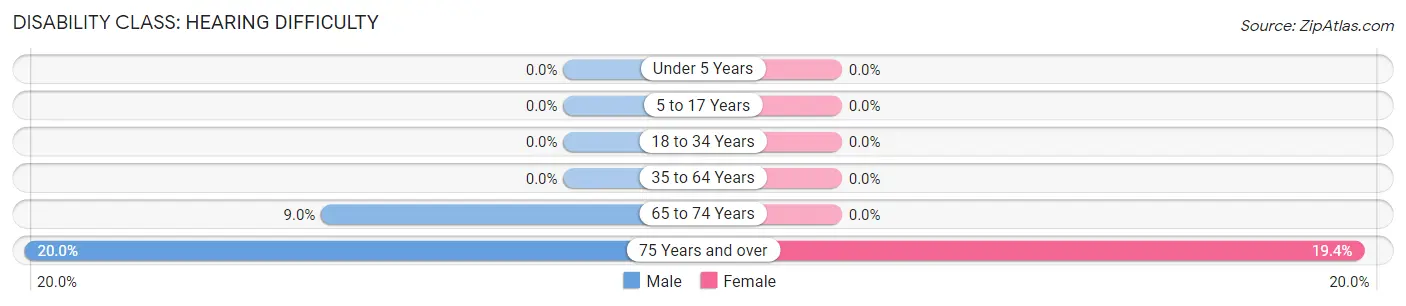
| Age Bracket | Male | Female |
| Under 5 Years | 0 (0.0%) | 0 (0.0%) |
| 5 to 17 Years | 0 (0.0%) | 0 (0.0%) |
| 18 to 34 Years | 0 (0.0%) | 0 (0.0%) |
| 35 to 64 Years | 0 (0.0%) | 0 (0.0%) |
| 65 to 74 Years | 33 (9.0%) | 0 (0.0%) |
| 75 Years and over | 42 (20.0%) | 70 (19.4%) |
Disability Class: Vision Difficulty
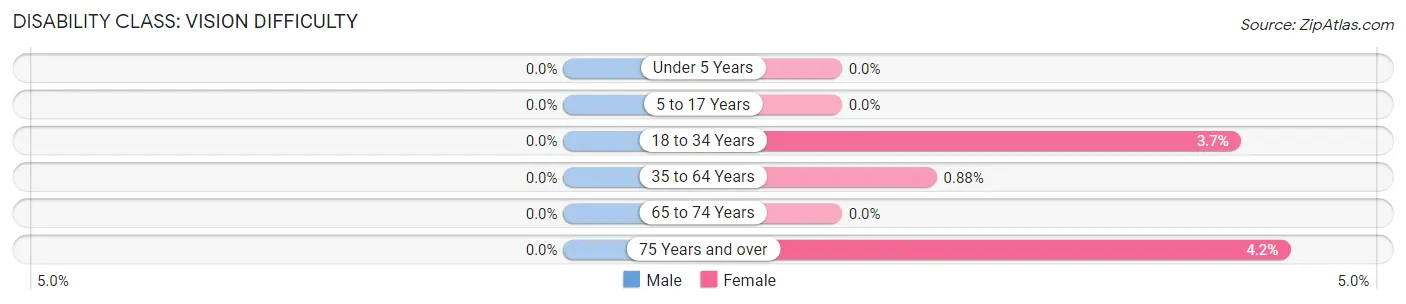
| Age Bracket | Male | Female |
| Under 5 Years | 0 (0.0%) | 0 (0.0%) |
| 5 to 17 Years | 0 (0.0%) | 0 (0.0%) |
| 18 to 34 Years | 0 (0.0%) | 15 (3.7%) |
| 35 to 64 Years | 0 (0.0%) | 11 (0.9%) |
| 65 to 74 Years | 0 (0.0%) | 0 (0.0%) |
| 75 Years and over | 0 (0.0%) | 15 (4.2%) |
Disability Class: Cognitive Difficulty
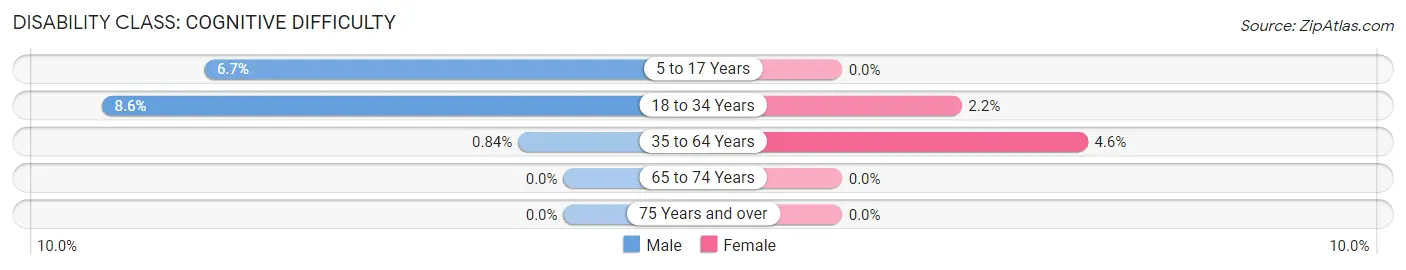
| Age Bracket | Male | Female |
| 5 to 17 Years | 43 (6.7%) | 0 (0.0%) |
| 18 to 34 Years | 42 (8.6%) | 9 (2.2%) |
| 35 to 64 Years | 12 (0.8%) | 57 (4.6%) |
| 65 to 74 Years | 0 (0.0%) | 0 (0.0%) |
| 75 Years and over | 0 (0.0%) | 0 (0.0%) |
Disability Class: Ambulatory Difficulty
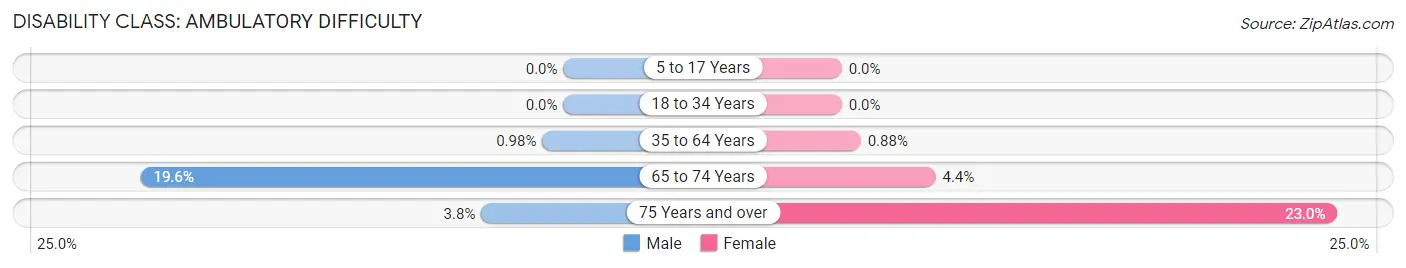
| Age Bracket | Male | Female |
| 5 to 17 Years | 0 (0.0%) | 0 (0.0%) |
| 18 to 34 Years | 0 (0.0%) | 0 (0.0%) |
| 35 to 64 Years | 14 (1.0%) | 11 (0.9%) |
| 65 to 74 Years | 72 (19.6%) | 15 (4.3%) |
| 75 Years and over | 8 (3.8%) | 83 (23.0%) |
Disability Class: Self-Care Difficulty
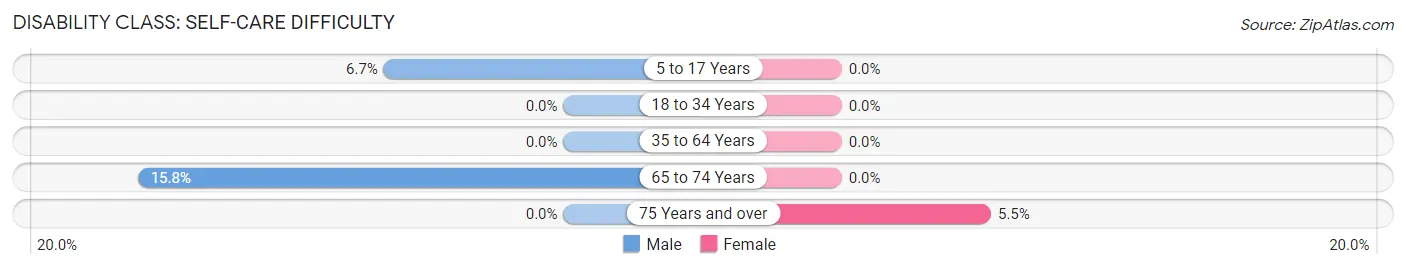
| Age Bracket | Male | Female |
| 5 to 17 Years | 43 (6.7%) | 0 (0.0%) |
| 18 to 34 Years | 0 (0.0%) | 0 (0.0%) |
| 35 to 64 Years | 0 (0.0%) | 0 (0.0%) |
| 65 to 74 Years | 58 (15.8%) | 0 (0.0%) |
| 75 Years and over | 0 (0.0%) | 20 (5.5%) |
Technology Access in Blue Bell
Computing Device Access in Blue Bell
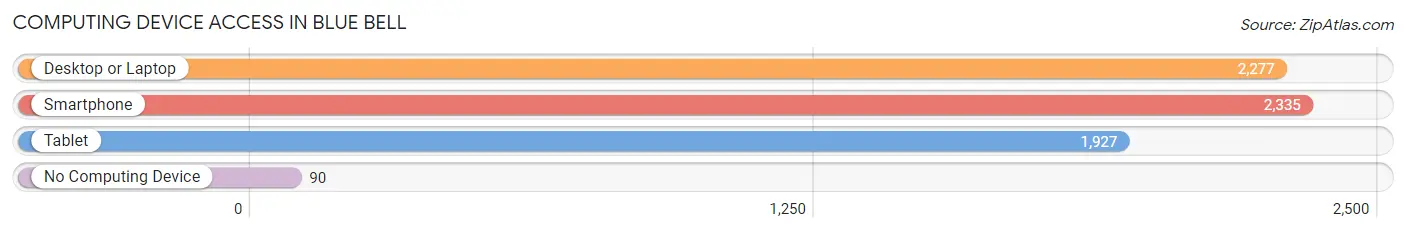
| Device Type | # Households | % Households |
| Desktop or Laptop | 2,277 | 92.8% |
| Smartphone | 2,335 | 95.2% |
| Tablet | 1,927 | 78.6% |
| No Computing Device | 90 | 3.7% |
| Total | 2,453 | 100.0% |
Internet Access in Blue Bell
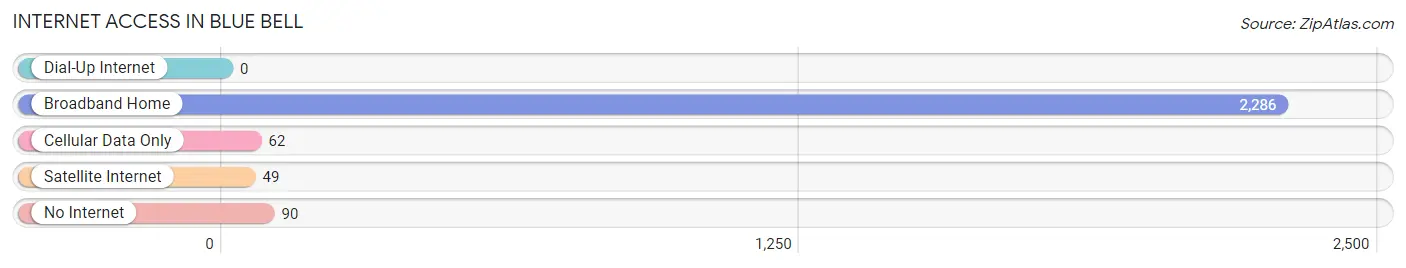
| Internet Type | # Households | % Households |
| Dial-Up Internet | 0 | 0.0% |
| Broadband Home | 2,286 | 93.2% |
| Cellular Data Only | 62 | 2.5% |
| Satellite Internet | 49 | 2.0% |
| No Internet | 90 | 3.7% |
| Total | 2,453 | 100.0% |
Blue Bell Summary
Bell, Pennsylvania is a small borough located in Montgomery County, Pennsylvania. It is located approximately 20 miles northwest of Philadelphia and is part of the Philadelphia metropolitan area. The population of Blue Bell was 5,541 at the 2010 census.
History
Blue Bell was originally part of Whitpain Township, which was established in 1701. The area was first settled in 1717 by a group of Welsh Quakers. The town was named after the bluebells that grew in the area. The first post office was established in 1837.
In 1867, the North Pennsylvania Railroad was built through the area, connecting Blue Bell to Philadelphia. This allowed for the growth of the town, as it became a popular stop for travelers. In 1873, the town was officially incorporated as a borough.
In the early 20th century, Blue Bell was a popular summer resort for wealthy Philadelphians. The town was home to several large estates, including the estate of William Penn, which is now the site of the Penn State University campus.
Geography
Blue Bell is located at 40°09'N 75°17'W (40.15, -75.28). According to the United States Census Bureau, the borough has a total area of 2.2 square miles (5.7 km2), all of it land.
Economy
Blue Bell is home to several large companies, including Unisys, Siemens, and GlaxoSmithKline. The town is also home to several small businesses, including restaurants, shops, and professional services.
Demographics
As of the 2010 census, there were 5,541 people, 2,072 households, and 1,541 families residing in the borough. The population density was 2,521.2 people per square mile (973.2/km2). There were 2,207 housing units at an average density of 1,000.3 per square mile (386.2/km2). The racial makeup of the borough was 87.2% White, 5.2% African American, 0.2% Native American, 4.7% Asian, 0.1% Pacific Islander, 0.7% from other races, and 1.9% from two or more races. Hispanic or Latino of any race were 2.7% of the population.
There were 2,072 households, out of which 33.2% had children under the age of 18 living with them, 63.2% were married couples living together, 7.2% had a female householder with no husband present, and 26.2% were non-families. 22.2% of all households were made up of individuals, and 10.2% had someone living alone who was 65 years of age or older. The average household size was 2.67 and the average family size was 3.15.
In the borough the population was spread out, with 24.7% under the age of 18, 5.2% from 18 to 24, 28.2% from 25 to 44, 27.2% from 45 to 64, and 14.7% who were 65 years of age or older. The median age was 40 years. For every 100 females, there were 93.3 males. For every 100 females age 18 and over, there were 90.2 males.
The median income for a household in the borough was $90,917, and the median income for a family was $103,917. Males had a median income of $71,250 versus $50,000 for females. The per capita income for the borough was $41,917. About 1.7% of families and 2.7% of the population were below the poverty line, including 2.7% of those under age 18 and 2.7% of those age 65 or over.
Common Questions
What is Per Capita Income in Blue Bell?
Per Capita income in Blue Bell is $86,576.
What is the Median Family Income in Blue Bell?
Median Family Income in Blue Bell is $230,417.
What is the Median Household income in Blue Bell?
Median Household Income in Blue Bell is $152,417.
What is Income or Wage Gap in Blue Bell?
Income or Wage Gap in Blue Bell is 46.4%.
Women in Blue Bell earn 53.6 cents for every dollar earned by a man.
What is Inequality or Gini Index in Blue Bell?
Inequality or Gini Index in Blue Bell is 0.46.
What is the Total Population of Blue Bell?
Total Population of Blue Bell is 6,428.
What is the Total Male Population of Blue Bell?
Total Male Population of Blue Bell is 3,346.
What is the Total Female Population of Blue Bell?
Total Female Population of Blue Bell is 3,082.
What is the Ratio of Males per 100 Females in Blue Bell?
There are 108.57 Males per 100 Females in Blue Bell.
What is the Ratio of Females per 100 Males in Blue Bell?
There are 92.11 Females per 100 Males in Blue Bell.
What is the Median Population Age in Blue Bell?
Median Population Age in Blue Bell is 44.4 Years.
What is the Average Family Size in Blue Bell
Average Family Size in Blue Bell is 3.2 People.
What is the Average Household Size in Blue Bell
Average Household Size in Blue Bell is 2.6 People.
How Large is the Labor Force in Blue Bell?
There are 3,234 People in the Labor Forcein in Blue Bell.
What is the Percentage of People in the Labor Force in Blue Bell?
64.7% of People are in the Labor Force in Blue Bell.
What is the Unemployment Rate in Blue Bell?
Unemployment Rate in Blue Bell is 6.6%.