Zip Codes with the Highest Percentage of Population Employed in Health Care & Social Assistance in Dayton, OH
RELATED REPORTS & OPTIONS
Health Care & Social Assistance
Dayton
Compare Zip Codes
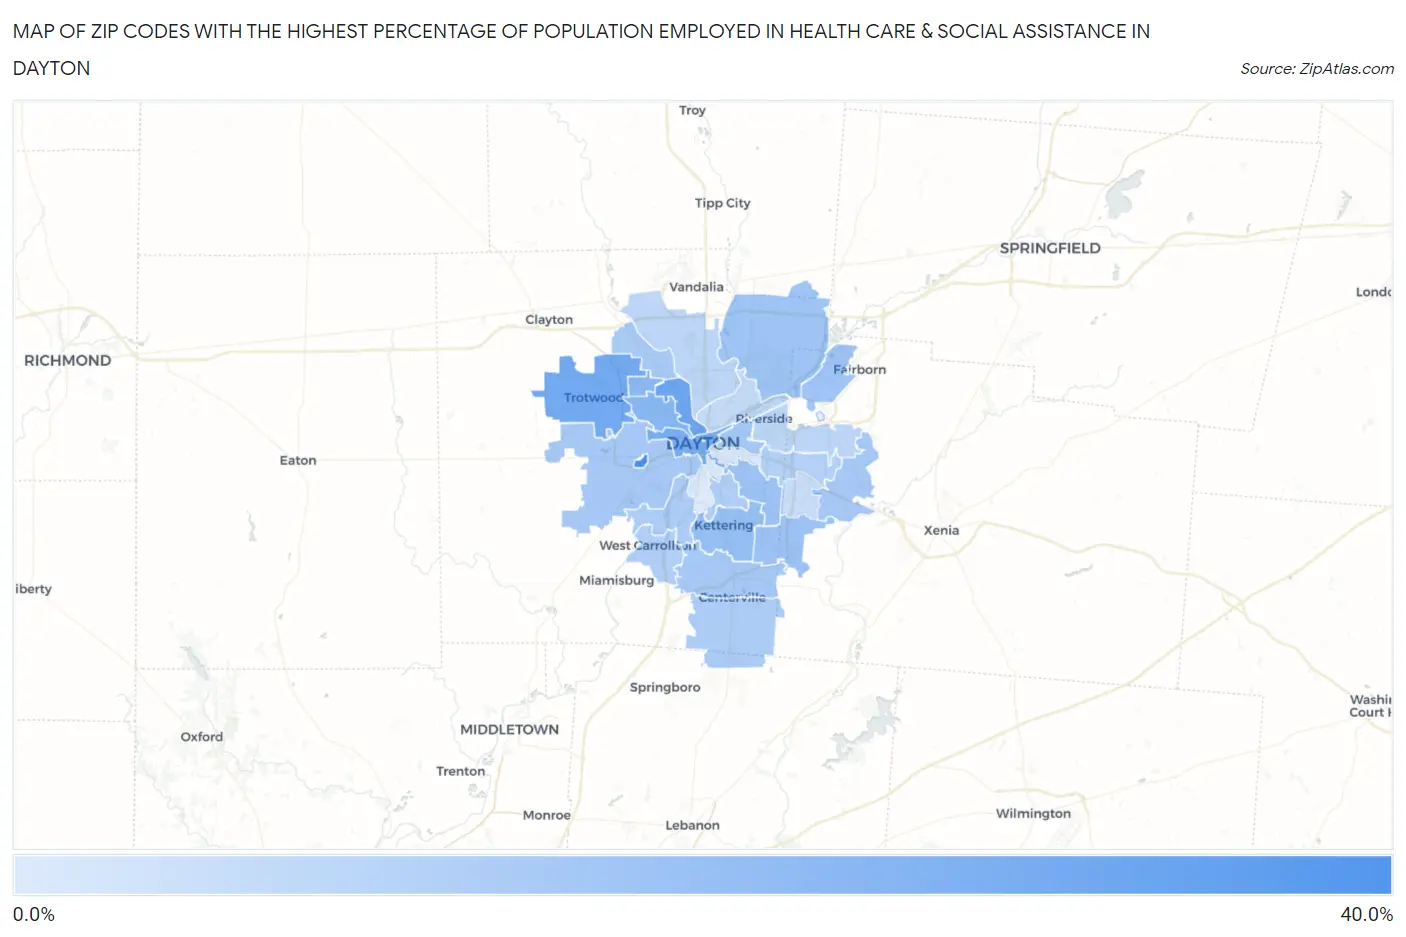
Map of Zip Codes with the Highest Percentage of Population Employed in Health Care & Social Assistance in Dayton
9.4%
31.2%
Zip Codes with the Highest Percentage of Population Employed in Health Care & Social Assistance in Dayton, OH
| Zip Code | % Employed | vs State | vs National | |
| 1. | 45428 | 31.2% | 15.7%(+15.6)#32 | 13.9%(+17.3)#825 |
| 2. | 45405 | 25.5% | 15.7%(+9.81)#67 | 13.9%(+11.5)#1,614 |
| 3. | 45426 | 24.4% | 15.7%(+8.76)#78 | 13.9%(+10.5)#1,875 |
| 4. | 45402 | 23.7% | 15.7%(+8.04)#85 | 13.9%(+9.78)#2,072 |
| 5. | 45406 | 21.4% | 15.7%(+5.72)#142 | 13.9%(+7.45)#3,123 |
| 6. | 45416 | 20.6% | 15.7%(+4.92)#171 | 13.9%(+6.66)#3,650 |
| 7. | 45429 | 19.2% | 15.7%(+3.52)#222 | 13.9%(+5.26)#4,797 |
| 8. | 45440 | 18.8% | 15.7%(+3.10)#248 | 13.9%(+4.83)#5,238 |
| 9. | 45420 | 18.7% | 15.7%(+2.98)#254 | 13.9%(+4.72)#5,362 |
| 10. | 45424 | 17.9% | 15.7%(+2.18)#306 | 13.9%(+3.92)#6,389 |
| 11. | 45433 | 17.8% | 15.7%(+2.13)#310 | 13.9%(+3.87)#6,459 |
| 12. | 45403 | 17.4% | 15.7%(+1.69)#357 | 13.9%(+3.42)#7,160 |
| 13. | 45459 | 17.0% | 15.7%(+1.34)#383 | 13.9%(+3.07)#7,711 |
| 14. | 45417 | 17.0% | 15.7%(+1.28)#388 | 13.9%(+3.02)#7,796 |
| 15. | 45434 | 16.9% | 15.7%(+1.18)#397 | 13.9%(+2.92)#7,955 |
| 16. | 45415 | 16.8% | 15.7%(+1.10)#404 | 13.9%(+2.83)#8,097 |
| 17. | 45439 | 16.0% | 15.7%(+0.324)#492 | 13.9%(+2.06)#9,506 |
| 18. | 45458 | 16.0% | 15.7%(+0.297)#496 | 13.9%(+2.03)#9,562 |
| 19. | 45419 | 15.8% | 15.7%(+0.086)#518 | 13.9%(+1.82)#10,005 |
| 20. | 45449 | 15.3% | 15.7%(-0.343)#554 | 13.9%(+1.39)#10,920 |
| 21. | 45469 | 15.3% | 15.7%(-0.417)#561 | 13.9%(+1.32)#11,072 |
| 22. | 45432 | 14.9% | 15.7%(-0.748)#602 | 13.9%(+0.988)#11,837 |
| 23. | 45414 | 13.7% | 15.7%(-2.02)#702 | 13.9%(-0.284)#14,906 |
| 24. | 45431 | 13.6% | 15.7%(-2.06)#712 | 13.9%(-0.328)#15,018 |
| 25. | 45404 | 12.8% | 15.7%(-2.92)#787 | 13.9%(-1.18)#17,208 |
| 26. | 45430 | 12.1% | 15.7%(-3.62)#835 | 13.9%(-1.88)#18,896 |
| 27. | 45410 | 9.9% | 15.7%(-5.76)#978 | 13.9%(-4.03)#23,613 |
| 28. | 45409 | 9.4% | 15.7%(-6.31)#1,003 | 13.9%(-4.57)#24,605 |
1
Common Questions
What are the Top 10 Zip Codes with the Highest Percentage of Population Employed in Health Care & Social Assistance in Dayton, OH?
Top 10 Zip Codes with the Highest Percentage of Population Employed in Health Care & Social Assistance in Dayton, OH are:
What zip code has the Highest Percentage of Population Employed in Health Care & Social Assistance in Dayton, OH?
45428 has the Highest Percentage of Population Employed in Health Care & Social Assistance in Dayton, OH with 31.2%.
What is the Percentage of Population Employed in Health Care & Social Assistance in Dayton, OH?
Percentage of Population Employed in Health Care & Social Assistance in Dayton is 16.8%.
What is the Percentage of Population Employed in Health Care & Social Assistance in Ohio?
Percentage of Population Employed in Health Care & Social Assistance in Ohio is 15.7%.
What is the Percentage of Population Employed in Health Care & Social Assistance in the United States?
Percentage of Population Employed in Health Care & Social Assistance in the United States is 13.9%.