Cheshire, OH Map & Demographics
Cheshire Map
Cheshire Overview
$45,346
PER CAPITA INCOME
$76,250
AVG FAMILY INCOME
$85,208
AVG HOUSEHOLD INCOME
59.0%
WAGE / INCOME GAP [ % ]
41.0¢/ $1
WAGE / INCOME GAP [ $ ]
0.49
INEQUALITY / GINI INDEX
114
TOTAL POPULATION
64
MALE POPULATION
50
FEMALE POPULATION
128.00
MALES / 100 FEMALES
78.12
FEMALES / 100 MALES
52.0
MEDIAN AGE
3.1
AVG FAMILY SIZE
2.5
AVG HOUSEHOLD SIZE
54
LABOR FORCE [ PEOPLE ]
60.7%
PERCENT IN LABOR FORCE
Cheshire Zip Codes
Cheshire Area Codes
Income in Cheshire
Income Overview in Cheshire
Per Capita Income in Cheshire is $45,346, while median incomes of families and households are $76,250 and $85,208 respectively.
| Characteristic | Number | Measure |
| Per Capita Income | 114 | $45,346 |
| Median Family Income | 30 | $76,250 |
| Mean Family Income | 30 | $92,530 |
| Median Household Income | 45 | $85,208 |
| Mean Household Income | 45 | $106,289 |
| Income Deficit | 30 | $0 |
| Wage / Income Gap (%) | 114 | 58.96% |
| Wage / Income Gap ($) | 114 | 41.04¢ per $1 |
| Gini / Inequality Index | 114 | 0.49 |
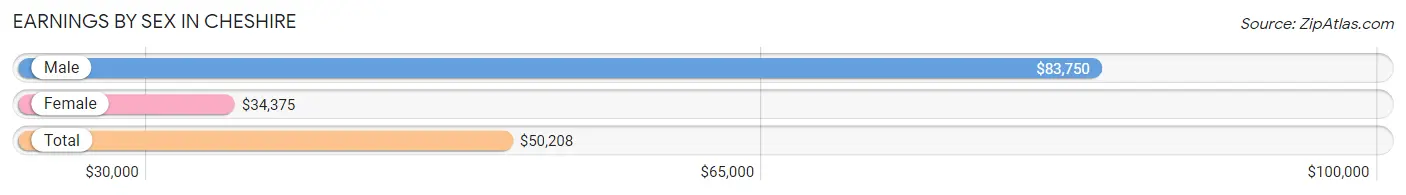
Earnings by Sex in Cheshire
Average Earnings in Cheshire are $50,208, $83,750 for men and $34,375 for women, a difference of 59.0%.
| Sex | Number | Average Earnings |
| Male | 26 (45.6%) | $83,750 |
| Female | 31 (54.4%) | $34,375 |
| Total | 57 (100.0%) | $50,208 |
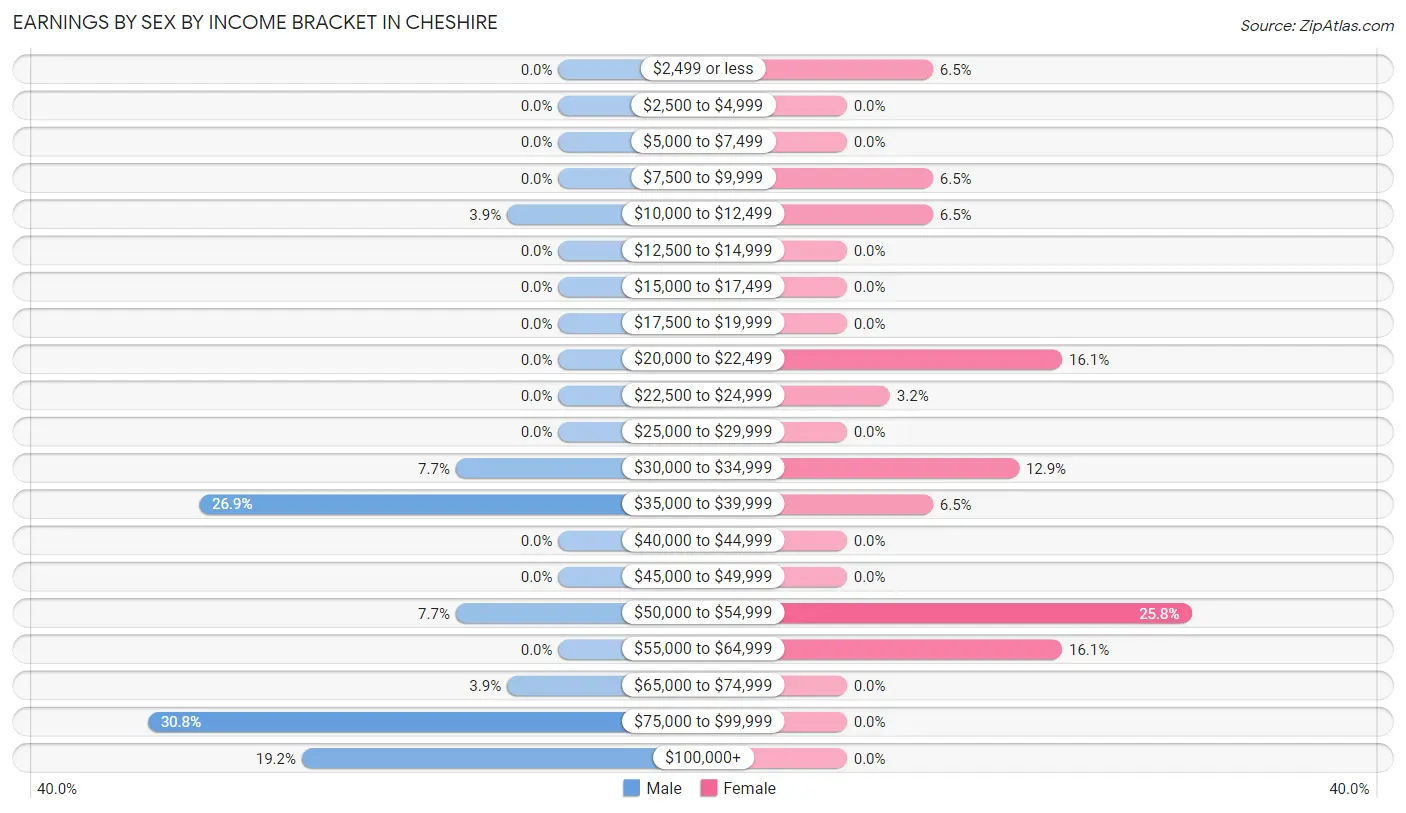
Earnings by Sex by Income Bracket in Cheshire
The most common earnings brackets in Cheshire are $75,000 to $99,999 for men (8 | 30.8%) and $50,000 to $54,999 for women (8 | 25.8%).
| Income | Male | Female |
| $2,499 or less | 0 (0.0%) | 2 (6.5%) |
| $2,500 to $4,999 | 0 (0.0%) | 0 (0.0%) |
| $5,000 to $7,499 | 0 (0.0%) | 0 (0.0%) |
| $7,500 to $9,999 | 0 (0.0%) | 2 (6.5%) |
| $10,000 to $12,499 | 1 (3.8%) | 2 (6.5%) |
| $12,500 to $14,999 | 0 (0.0%) | 0 (0.0%) |
| $15,000 to $17,499 | 0 (0.0%) | 0 (0.0%) |
| $17,500 to $19,999 | 0 (0.0%) | 0 (0.0%) |
| $20,000 to $22,499 | 0 (0.0%) | 5 (16.1%) |
| $22,500 to $24,999 | 0 (0.0%) | 1 (3.2%) |
| $25,000 to $29,999 | 0 (0.0%) | 0 (0.0%) |
| $30,000 to $34,999 | 2 (7.7%) | 4 (12.9%) |
| $35,000 to $39,999 | 7 (26.9%) | 2 (6.5%) |
| $40,000 to $44,999 | 0 (0.0%) | 0 (0.0%) |
| $45,000 to $49,999 | 0 (0.0%) | 0 (0.0%) |
| $50,000 to $54,999 | 2 (7.7%) | 8 (25.8%) |
| $55,000 to $64,999 | 0 (0.0%) | 5 (16.1%) |
| $65,000 to $74,999 | 1 (3.8%) | 0 (0.0%) |
| $75,000 to $99,999 | 8 (30.8%) | 0 (0.0%) |
| $100,000+ | 5 (19.2%) | 0 (0.0%) |
| Total | 26 (100.0%) | 31 (100.0%) |
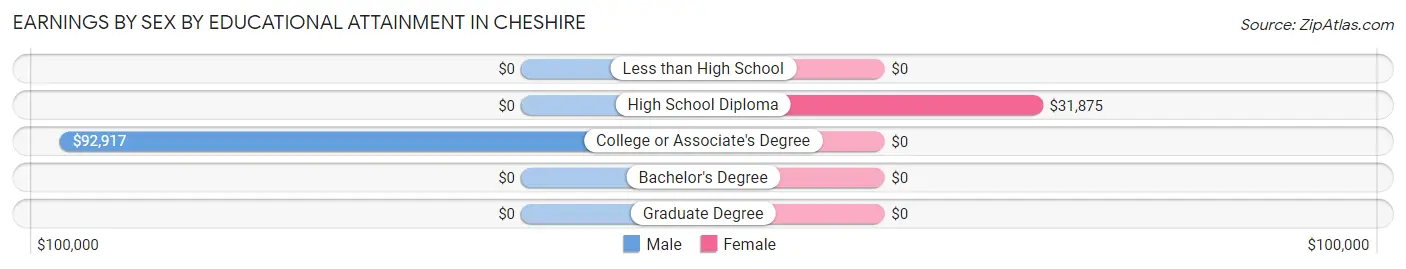
Earnings by Sex by Educational Attainment in Cheshire
Average earnings in Cheshire are $83,750 for men and $35,625 for women, a difference of 57.5%. Men with an educational attainment of college or associate's degree enjoy the highest average annual earnings of $92,917, while those with college or associate's degree education earn the least with $92,917. Women with an educational attainment of high school diploma earn the most with the average annual earnings of $31,875, while those with high school diploma education have the smallest earnings of $31,875.
| Educational Attainment | Male Income | Female Income |
| Less than High School | - | - |
| High School Diploma | - | - |
| College or Associate's Degree | $92,917 | $0 |
| Bachelor's Degree | - | - |
| Graduate Degree | - | - |
| Total | $83,750 | $35,625 |
Family Income in Cheshire
Family Income Brackets in Cheshire
According to the Cheshire family income data, there are 10 families falling into the $50,000 to $74,999 income range, which is the most common income bracket and makes up 33.3% of all families.
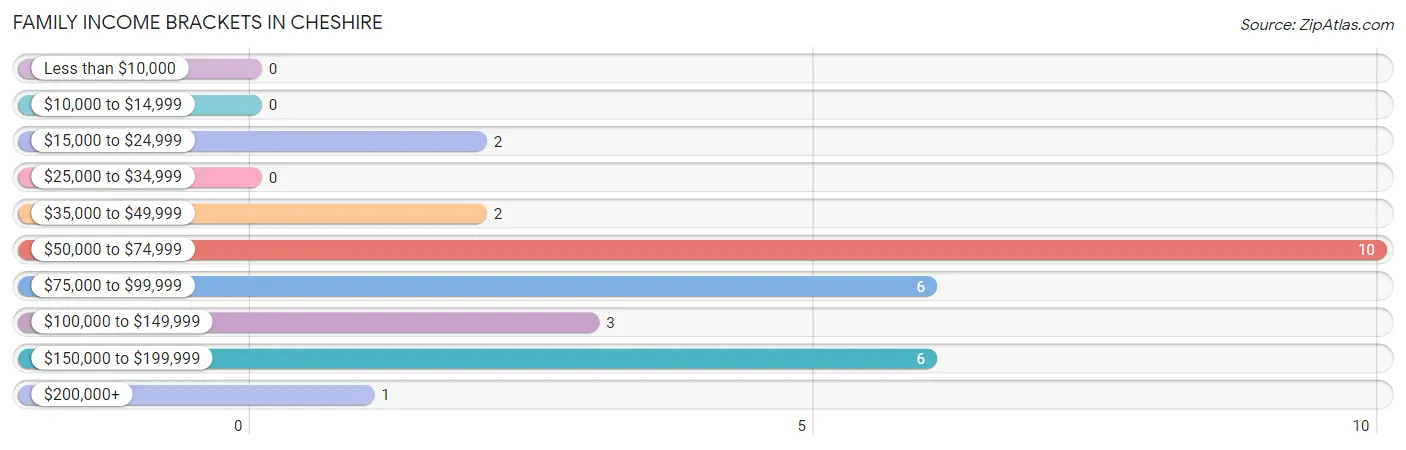
| Income Bracket | # Families | % Families |
| Less than $10,000 | 0 | 0.0% |
| $10,000 to $14,999 | 0 | 0.0% |
| $15,000 to $24,999 | 2 | 6.7% |
| $25,000 to $34,999 | 0 | 0.0% |
| $35,000 to $49,999 | 2 | 6.7% |
| $50,000 to $74,999 | 10 | 33.3% |
| $75,000 to $99,999 | 6 | 20.0% |
| $100,000 to $149,999 | 3 | 10.0% |
| $150,000 to $199,999 | 6 | 20.0% |
| $200,000+ | 1 | 3.3% |
Family Income by Famaliy Size in Cheshire
2-person families (20 | 66.7%) account for the highest median family income in Cheshire with $90,000 per family, while 2-person families (20 | 66.7%) have the highest median income of $45,000 per family member.
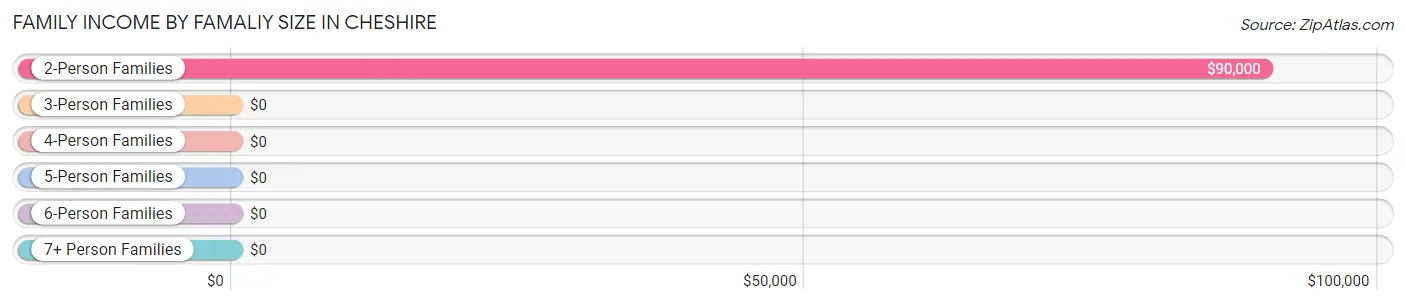
| Income Bracket | # Families | Median Income |
| 2-Person Families | 20 (66.7%) | $90,000 |
| 3-Person Families | 2 (6.7%) | $0 |
| 4-Person Families | 2 (6.7%) | $0 |
| 5-Person Families | 6 (20.0%) | $0 |
| 6-Person Families | 0 (0.0%) | $0 |
| 7+ Person Families | 0 (0.0%) | $0 |
| Total | 30 (100.0%) | $76,250 |
Family Income by Number of Earners in Cheshire
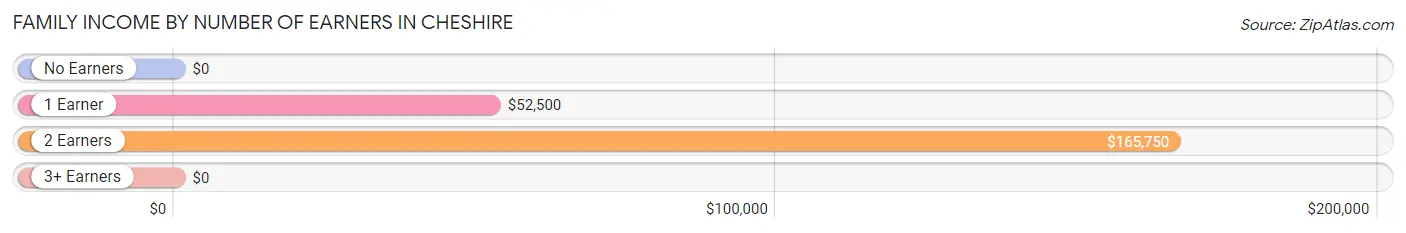
| Number of Earners | # Families | Median Income |
| No Earners | 1 (3.3%) | $0 |
| 1 Earner | 18 (60.0%) | $52,500 |
| 2 Earners | 11 (36.7%) | $165,750 |
| 3+ Earners | 0 (0.0%) | $0 |
| Total | 30 (100.0%) | $76,250 |
Household Income in Cheshire
Household Income Brackets in Cheshire
With 15 households falling in the category, the $75,000 to $99,999 income range is the most frequent in Cheshire, accounting for 33.3% of all households.
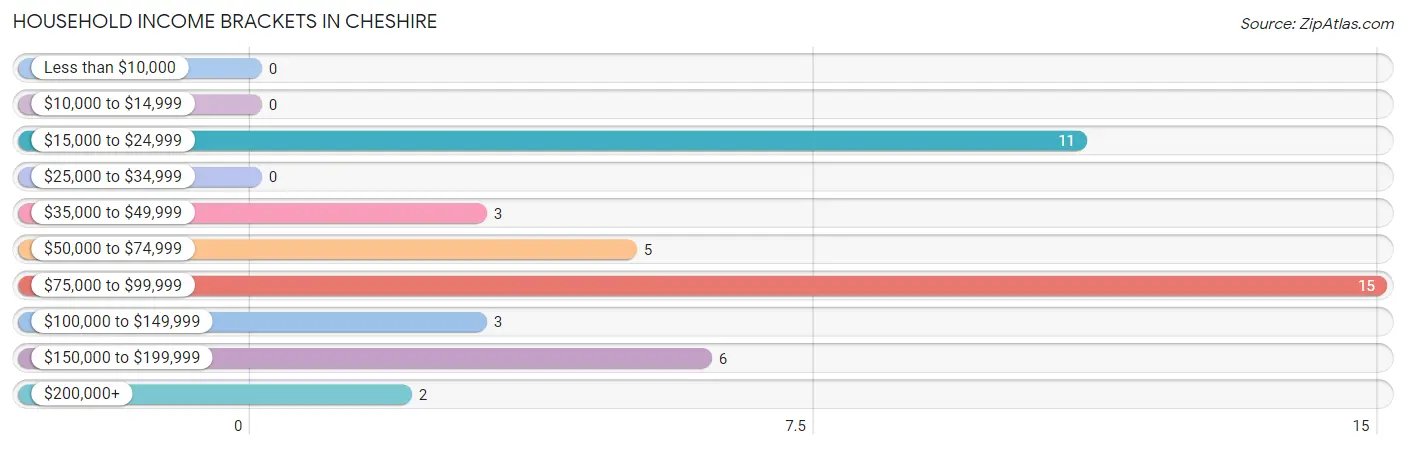
| Income Bracket | # Households | % Households |
| Less than $10,000 | 0 | 0.0% |
| $10,000 to $14,999 | 0 | 0.0% |
| $15,000 to $24,999 | 11 | 24.4% |
| $25,000 to $34,999 | 0 | 0.0% |
| $35,000 to $49,999 | 3 | 6.7% |
| $50,000 to $74,999 | 5 | 11.1% |
| $75,000 to $99,999 | 15 | 33.3% |
| $100,000 to $149,999 | 3 | 6.7% |
| $150,000 to $199,999 | 6 | 13.3% |
| $200,000+ | 2 | 4.4% |
Household Income by Householder Age in Cheshire
The median household income in Cheshire is $85,208, with the highest median household income of $89,375 found in the 45 to 64 years age bracket for the primary householder. A total of 27 households (60.0%) fall into this category.
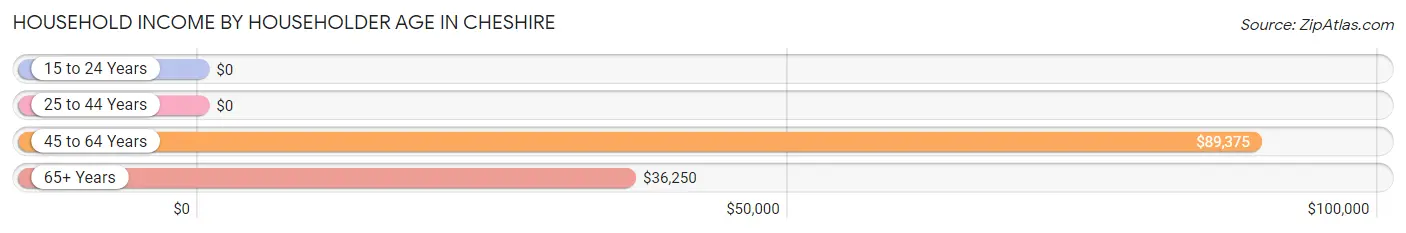
| Income Bracket | # Households | Median Income |
| 15 to 24 Years | 0 (0.0%) | $0 |
| 25 to 44 Years | 7 (15.6%) | $0 |
| 45 to 64 Years | 27 (60.0%) | $89,375 |
| 65+ Years | 11 (24.4%) | $36,250 |
| Total | 45 (100.0%) | $85,208 |
Poverty in Cheshire
Income Below Poverty by Sex and Age in Cheshire
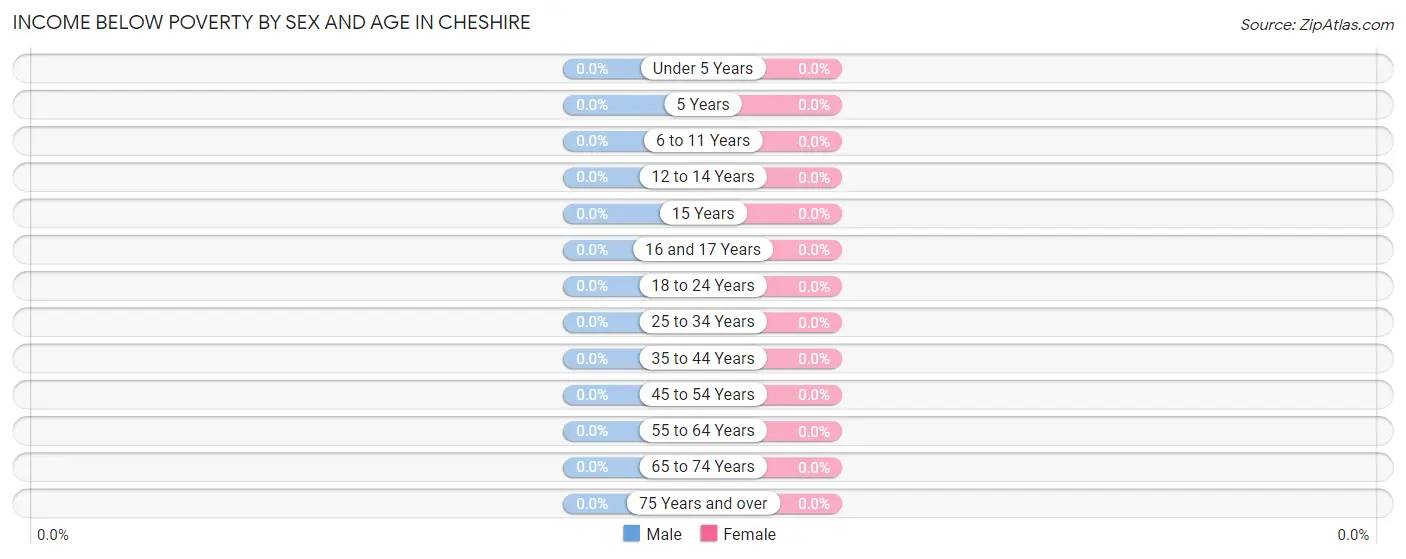
| Age Bracket | Male | Female |
| Under 5 Years | 0 (0.0%) | 0 (0.0%) |
| 5 Years | 0 (0.0%) | 0 (0.0%) |
| 6 to 11 Years | 0 (0.0%) | 0 (0.0%) |
| 12 to 14 Years | 0 (0.0%) | 0 (0.0%) |
| 15 Years | 0 (0.0%) | 0 (0.0%) |
| 16 and 17 Years | 0 (0.0%) | 0 (0.0%) |
| 18 to 24 Years | 0 (0.0%) | 0 (0.0%) |
| 25 to 34 Years | 0 (0.0%) | 0 (0.0%) |
| 35 to 44 Years | 0 (0.0%) | 0 (0.0%) |
| 45 to 54 Years | 0 (0.0%) | 0 (0.0%) |
| 55 to 64 Years | 0 (0.0%) | 0 (0.0%) |
| 65 to 74 Years | 0 (0.0%) | 0 (0.0%) |
| 75 Years and over | 0 (0.0%) | 0 (0.0%) |
| Total | 0 (0.0%) | 0 (0.0%) |
Income Above Poverty by Sex and Age in Cheshire
According to the poverty statistics in Cheshire, males aged under 5 years and females aged 6 to 11 years are the age groups that are most secure financially, with 100.0% of males and 100.0% of females in these age groups living above the poverty line.
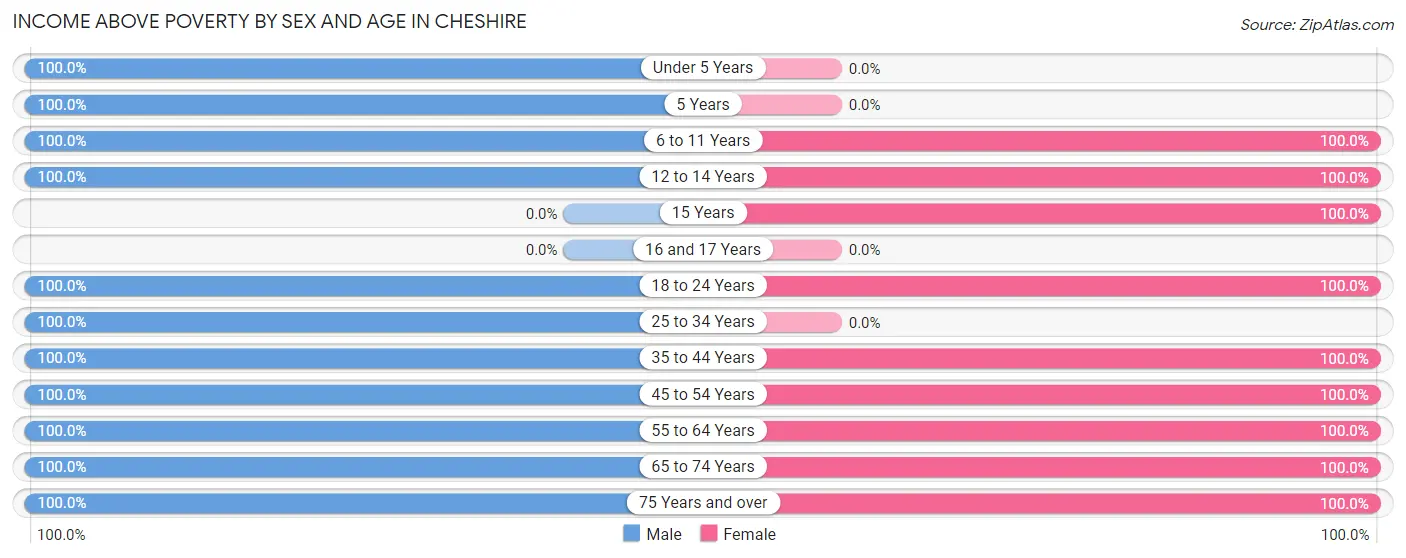
| Age Bracket | Male | Female |
| Under 5 Years | 4 (100.0%) | 0 (0.0%) |
| 5 Years | 7 (100.0%) | 0 (0.0%) |
| 6 to 11 Years | 4 (100.0%) | 1 (100.0%) |
| 12 to 14 Years | 2 (100.0%) | 1 (100.0%) |
| 15 Years | 0 (0.0%) | 6 (100.0%) |
| 16 and 17 Years | 0 (0.0%) | 0 (0.0%) |
| 18 to 24 Years | 6 (100.0%) | 2 (100.0%) |
| 25 to 34 Years | 5 (100.0%) | 0 (0.0%) |
| 35 to 44 Years | 4 (100.0%) | 8 (100.0%) |
| 45 to 54 Years | 8 (100.0%) | 16 (100.0%) |
| 55 to 64 Years | 17 (100.0%) | 10 (100.0%) |
| 65 to 74 Years | 5 (100.0%) | 5 (100.0%) |
| 75 Years and over | 2 (100.0%) | 1 (100.0%) |
| Total | 64 (100.0%) | 50 (100.0%) |
Income Below Poverty Among Married-Couple Families in Cheshire
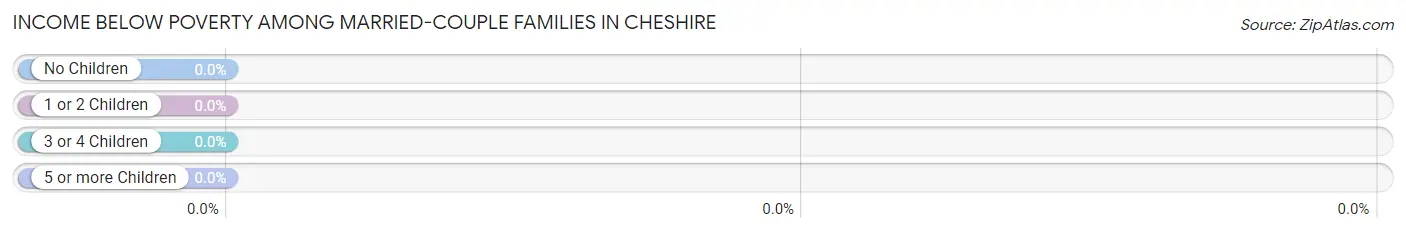
| Children | Above Poverty | Below Poverty |
| No Children | 15 (100.0%) | 0 (0.0%) |
| 1 or 2 Children | 4 (100.0%) | 0 (0.0%) |
| 3 or 4 Children | 0 (0.0%) | 0 (0.0%) |
| 5 or more Children | 0 (0.0%) | 0 (0.0%) |
| Total | 19 (100.0%) | 0 (0.0%) |
Income Below Poverty Among Single-Parent Households in Cheshire
| Children | Single Father | Single Mother |
| No Children | 0 (0.0%) | 0 (0.0%) |
| 1 or 2 Children | 0 (0.0%) | 0 (0.0%) |
| 3 or 4 Children | 0 (0.0%) | 0 (0.0%) |
| 5 or more Children | 0 (0.0%) | 0 (0.0%) |
| Total | 0 (0.0%) | 0 (0.0%) |
Income Below Poverty Among Married-Couple vs Single-Parent Households in Cheshire
| Children | Married-Couple Families | Single-Parent Households |
| No Children | 0 (0.0%) | 0 (0.0%) |
| 1 or 2 Children | 0 (0.0%) | 0 (0.0%) |
| 3 or 4 Children | 0 (0.0%) | 0 (0.0%) |
| 5 or more Children | 0 (0.0%) | 0 (0.0%) |
| Total | 0 (0.0%) | 0 (0.0%) |
Race in Cheshire
The most populous races in Cheshire are , and White / Caucasian (114 | 100.0%).
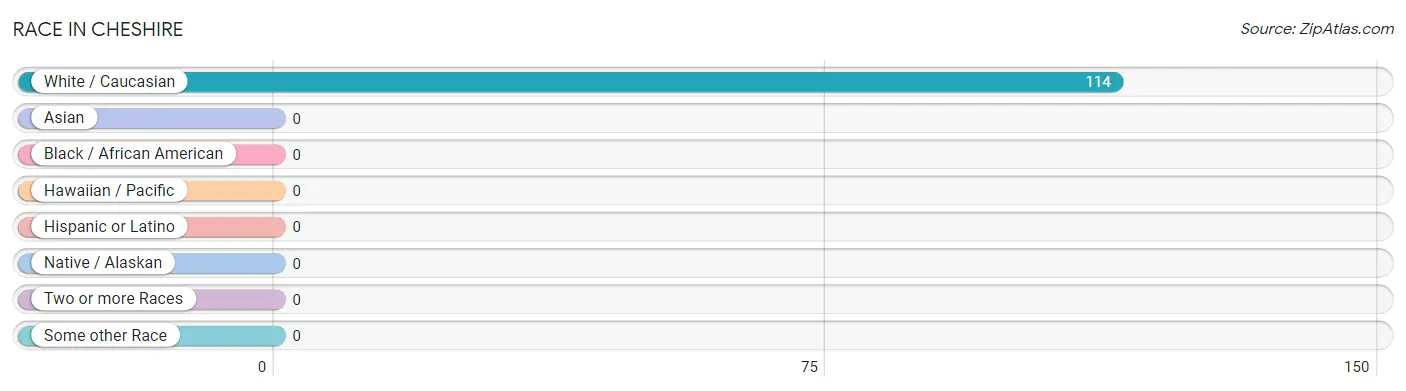
| Race | # Population | % Population |
| Asian | 0 | 0.0% |
| Black / African American | 0 | 0.0% |
| Hawaiian / Pacific | 0 | 0.0% |
| Hispanic or Latino | 0 | 0.0% |
| Native / Alaskan | 0 | 0.0% |
| White / Caucasian | 114 | 100.0% |
| Two or more Races | 0 | 0.0% |
| Some other Race | 0 | 0.0% |
| Total | 114 | 100.0% |
Ancestry in Cheshire
The most populous ancestries reported in Cheshire are American (23 | 20.2%), Irish (13 | 11.4%), German (10 | 8.8%), French Canadian (3 | 2.6%), and English (2 | 1.8%), together accounting for 44.7% of all Cheshire residents.
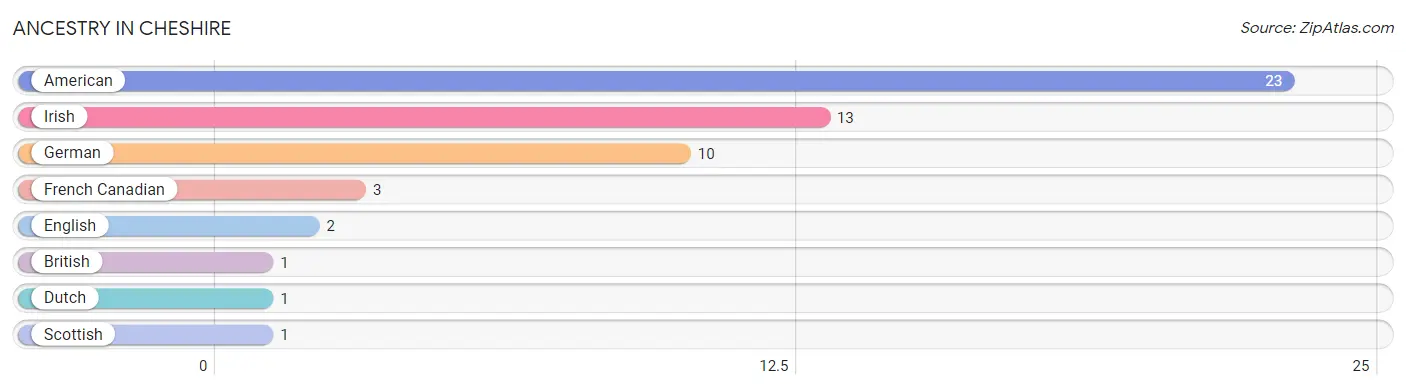
| Ancestry | # Population | % Population |
| American | 23 | 20.2% |
| British | 1 | 0.9% |
| Dutch | 1 | 0.9% |
| English | 2 | 1.8% |
| French Canadian | 3 | 2.6% |
| German | 10 | 8.8% |
| Irish | 13 | 11.4% |
| Scottish | 1 | 0.9% | View All 8 Rows |
Immigrants in Cheshire

| Immigration Origin | # Population | % Population | View All 0 Rows |
Sex and Age in Cheshire
Sex and Age in Cheshire
The most populous age groups in Cheshire are 5 to 9 Years (11 | 17.2%) for men and 50 to 54 Years (12 | 24.0%) for women.
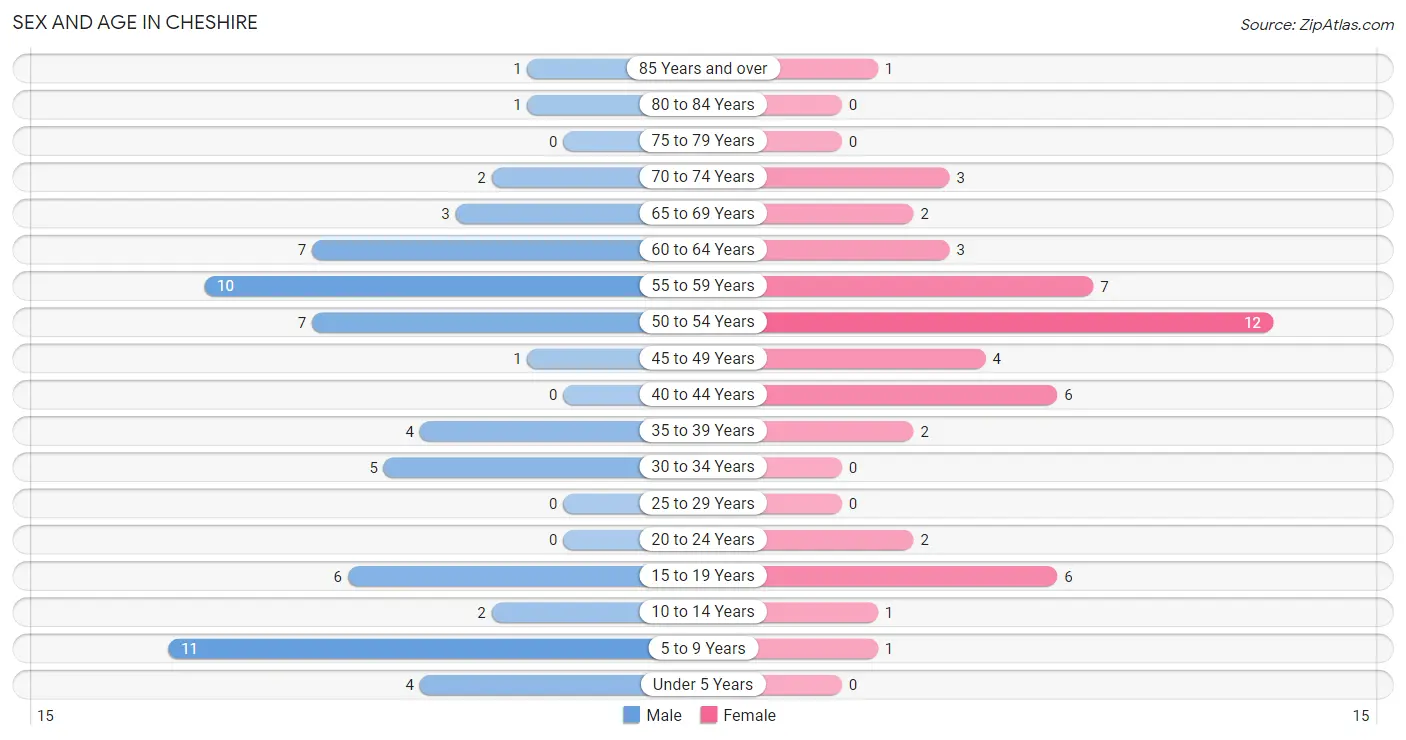
| Age Bracket | Male | Female |
| Under 5 Years | 4 (6.2%) | 0 (0.0%) |
| 5 to 9 Years | 11 (17.2%) | 1 (2.0%) |
| 10 to 14 Years | 2 (3.1%) | 1 (2.0%) |
| 15 to 19 Years | 6 (9.4%) | 6 (12.0%) |
| 20 to 24 Years | 0 (0.0%) | 2 (4.0%) |
| 25 to 29 Years | 0 (0.0%) | 0 (0.0%) |
| 30 to 34 Years | 5 (7.8%) | 0 (0.0%) |
| 35 to 39 Years | 4 (6.2%) | 2 (4.0%) |
| 40 to 44 Years | 0 (0.0%) | 6 (12.0%) |
| 45 to 49 Years | 1 (1.6%) | 4 (8.0%) |
| 50 to 54 Years | 7 (10.9%) | 12 (24.0%) |
| 55 to 59 Years | 10 (15.6%) | 7 (14.0%) |
| 60 to 64 Years | 7 (10.9%) | 3 (6.0%) |
| 65 to 69 Years | 3 (4.7%) | 2 (4.0%) |
| 70 to 74 Years | 2 (3.1%) | 3 (6.0%) |
| 75 to 79 Years | 0 (0.0%) | 0 (0.0%) |
| 80 to 84 Years | 1 (1.6%) | 0 (0.0%) |
| 85 Years and over | 1 (1.6%) | 1 (2.0%) |
| Total | 64 (100.0%) | 50 (100.0%) |
Families and Households in Cheshire
Median Family Size in Cheshire
The median family size in Cheshire is 3.07 persons per family, with single female/mother families (7 | 23.3%) accounting for the largest median family size of 4.57 persons per family. On the other hand, single male/father families (4 | 13.3%) represent the smallest median family size with 2.00 persons per family.
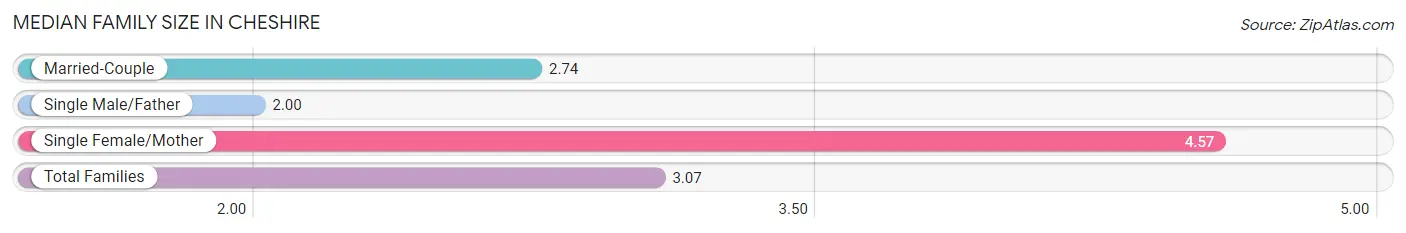
| Family Type | # Families | Family Size |
| Married-Couple | 19 (63.3%) | 2.74 |
| Single Male/Father | 4 (13.3%) | 2.00 |
| Single Female/Mother | 7 (23.3%) | 4.57 |
| Total Families | 30 (100.0%) | 3.07 |
Median Household Size in Cheshire
The median household size in Cheshire is 2.53 persons per household, with single female/mother households (7 | 15.6%) accounting for the largest median household size of 5.29 persons per household. non-family households (15 | 33.3%) represent the smallest median household size with 1.13 persons per household.
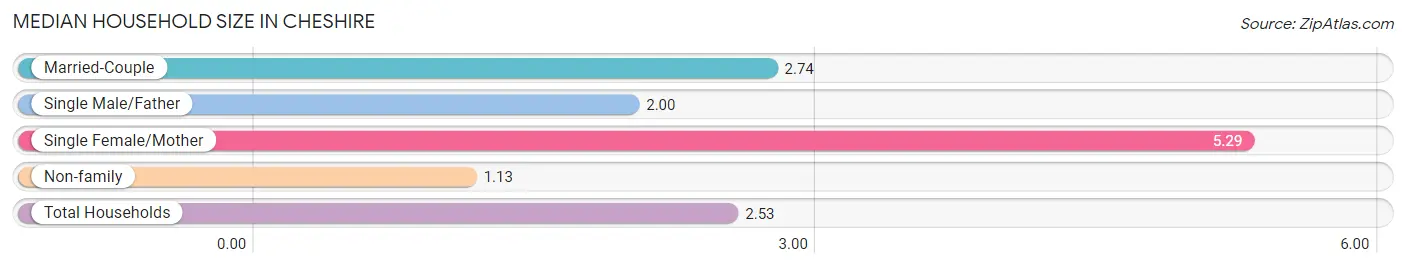
| Household Type | # Households | Household Size |
| Married-Couple | 19 (42.2%) | 2.74 |
| Single Male/Father | 4 (8.9%) | 2.00 |
| Single Female/Mother | 7 (15.6%) | 5.29 |
| Non-family | 15 (33.3%) | 1.13 |
| Total Households | 45 (100.0%) | 2.53 |
Household Size by Marriage Status in Cheshire
Out of a total of 45 households in Cheshire, 30 (66.7%) are family households, while 15 (33.3%) are nonfamily households. The most numerous type of family households are 2-person households, comprising 20, and the most common type of nonfamily households are 1-person households, comprising 14.
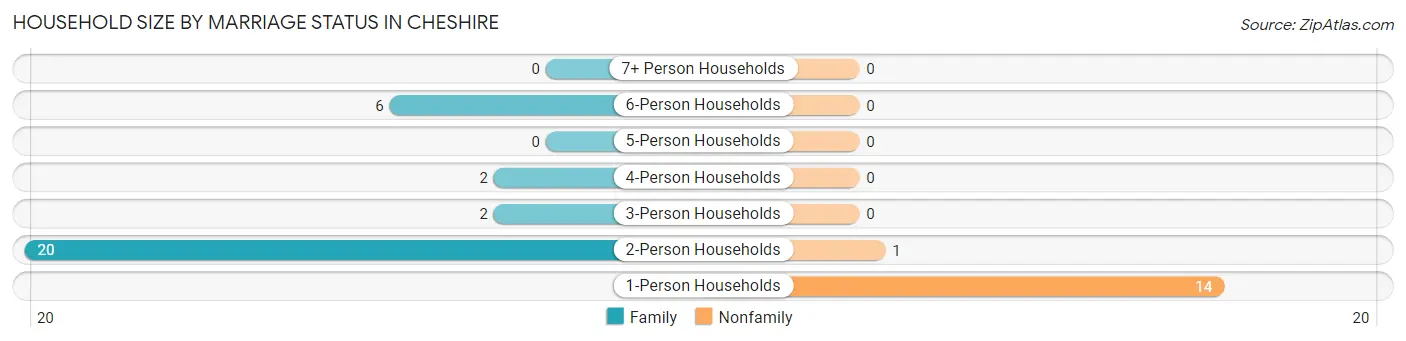
| Household Size | Family Households | Nonfamily Households |
| 1-Person Households | - | 14 (31.1%) |
| 2-Person Households | 20 (44.4%) | 1 (2.2%) |
| 3-Person Households | 2 (4.4%) | 0 (0.0%) |
| 4-Person Households | 2 (4.4%) | 0 (0.0%) |
| 5-Person Households | 0 (0.0%) | 0 (0.0%) |
| 6-Person Households | 6 (13.3%) | 0 (0.0%) |
| 7+ Person Households | 0 (0.0%) | 0 (0.0%) |
| Total | 30 (66.7%) | 15 (33.3%) |
Female Fertility in Cheshire
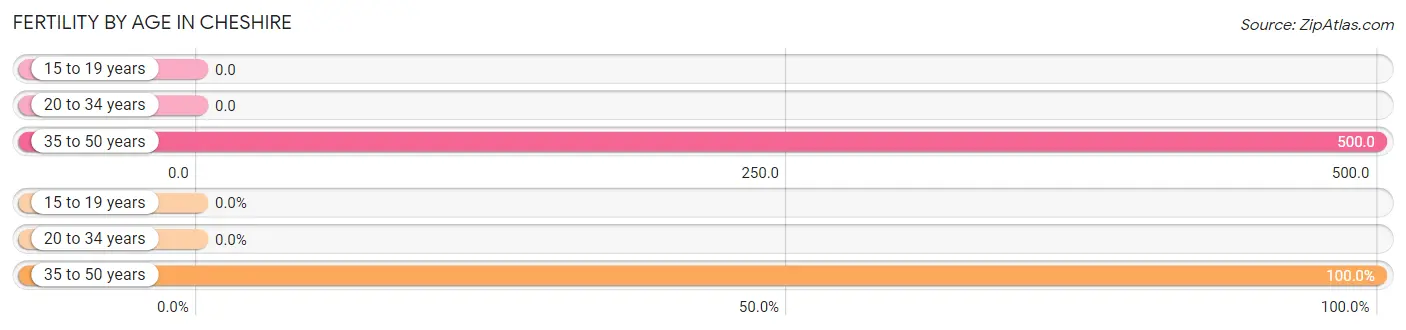
Fertility by Age in Cheshire
Average fertility rate in Cheshire is 300.0 births per 1,000 women. Women in the age bracket of 35 to 50 years have the highest fertility rate with 500.0 births per 1,000 women. Women in the age bracket of 35 to 50 years acount for 100.0% of all women with births.
| Age Bracket | Women with Births | Births / 1,000 Women |
| 15 to 19 years | 0 (0.0%) | 0.0 |
| 20 to 34 years | 0 (0.0%) | 0.0 |
| 35 to 50 years | 6 (100.0%) | 500.0 |
| Total | 6 (100.0%) | 300.0 |
Fertility by Age by Marriage Status in Cheshire
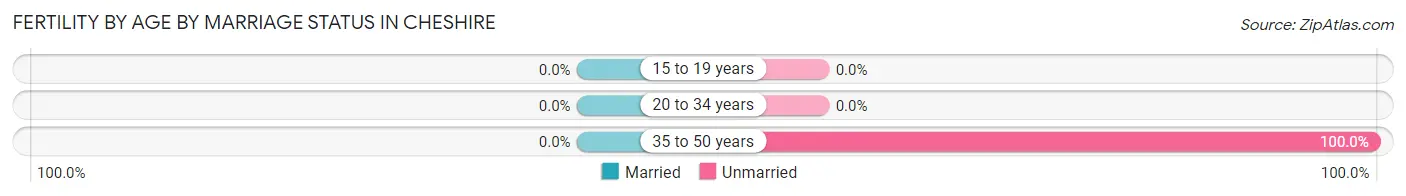
| Age Bracket | Married | Unmarried |
| 15 to 19 years | 0 (0.0%) | 0 (0.0%) |
| 20 to 34 years | 0 (0.0%) | 0 (0.0%) |
| 35 to 50 years | 0 (0.0%) | 6 (100.0%) |
| Total | 0 (0.0%) | 6 (100.0%) |
Fertility by Education in Cheshire
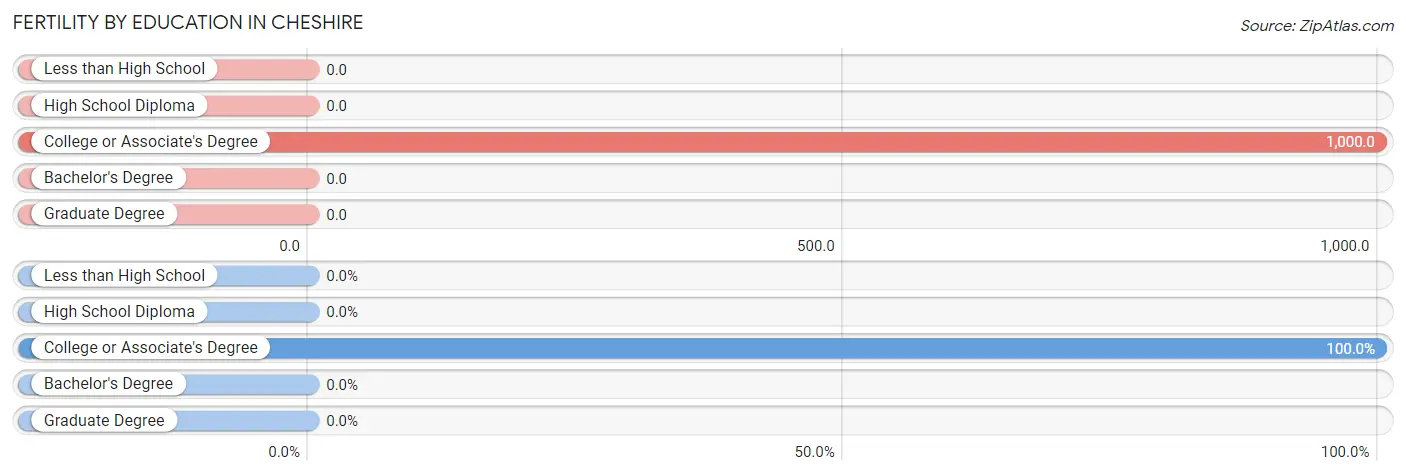
| Educational Attainment | Women with Births | Births / 1,000 Women |
| Less than High School | 0 (0.0%) | 0.0 |
| High School Diploma | 0 (0.0%) | 0.0 |
| College or Associate's Degree | 6 (100.0%) | 1,000.0 |
| Bachelor's Degree | 0 (0.0%) | 0.0 |
| Graduate Degree | 0 (0.0%) | 0.0 |
| Total | 6 (100.0%) | 300.0 |
Fertility by Education by Marriage Status in Cheshire
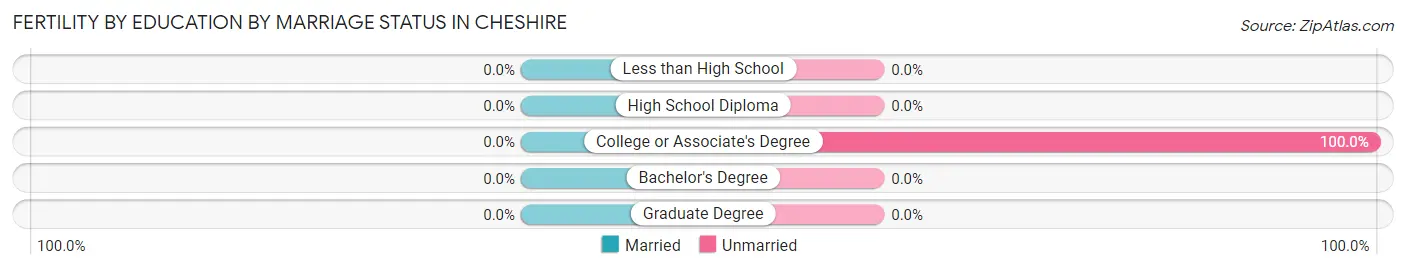
| Educational Attainment | Married | Unmarried |
| Less than High School | 0 (0.0%) | 0 (0.0%) |
| High School Diploma | 0 (0.0%) | 0 (0.0%) |
| College or Associate's Degree | 0 (0.0%) | 6 (100.0%) |
| Bachelor's Degree | 0 (0.0%) | 0 (0.0%) |
| Graduate Degree | 0 (0.0%) | 0 (0.0%) |
| Total | 0 (0.0%) | 6 (100.0%) |
Employment Characteristics in Cheshire
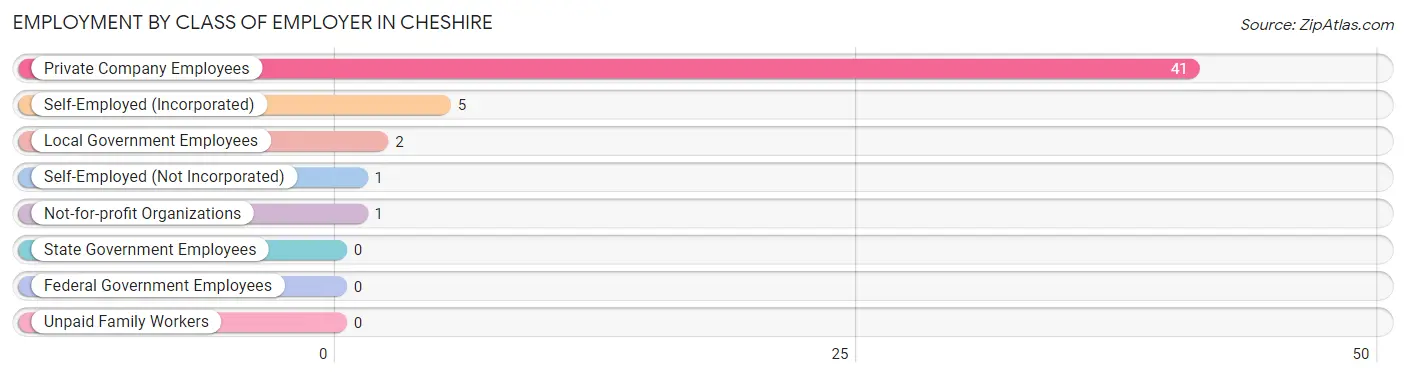
Employment by Class of Employer in Cheshire
Among the 50 employed individuals in Cheshire, private company employees (41 | 82.0%), self-employed (incorporated) (5 | 10.0%), and local government employees (2 | 4.0%) make up the most common classes of employment.
| Employer Class | # Employees | % Employees |
| Private Company Employees | 41 | 82.0% |
| Self-Employed (Incorporated) | 5 | 10.0% |
| Self-Employed (Not Incorporated) | 1 | 2.0% |
| Not-for-profit Organizations | 1 | 2.0% |
| Local Government Employees | 2 | 4.0% |
| State Government Employees | 0 | 0.0% |
| Federal Government Employees | 0 | 0.0% |
| Unpaid Family Workers | 0 | 0.0% |
| Total | 50 | 100.0% |
Employment Status by Age in Cheshire
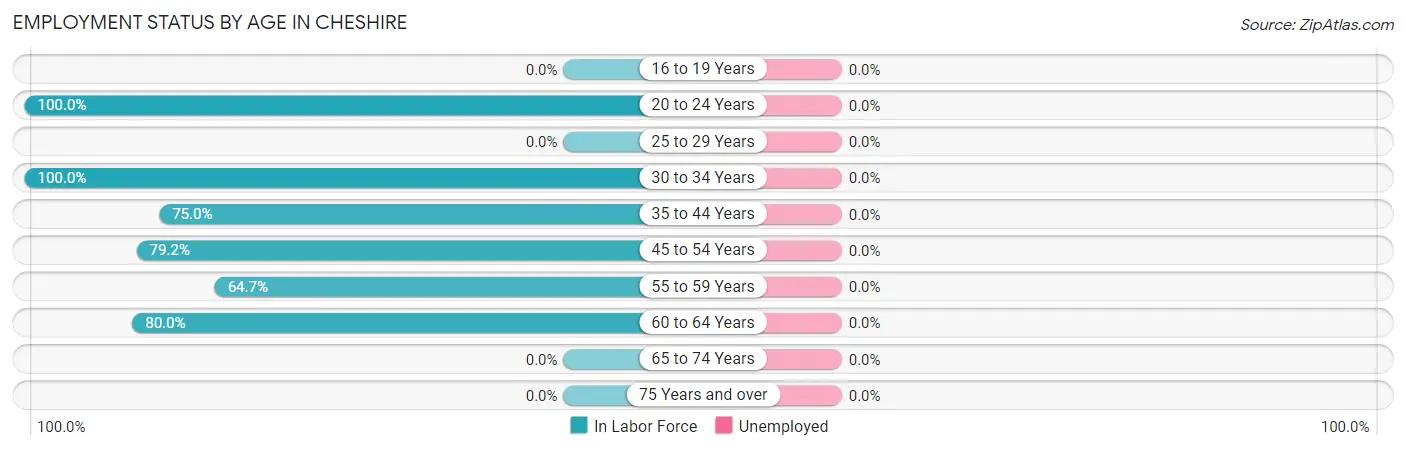
| Age Bracket | In Labor Force | Unemployed |
| 16 to 19 Years | 0 (0.0%) | 0 (0.0%) |
| 20 to 24 Years | 2 (100.0%) | 0 (0.0%) |
| 25 to 29 Years | 0 (0.0%) | 0 (0.0%) |
| 30 to 34 Years | 5 (100.0%) | 0 (0.0%) |
| 35 to 44 Years | 9 (75.0%) | 0 (0.0%) |
| 45 to 54 Years | 19 (79.2%) | 0 (0.0%) |
| 55 to 59 Years | 11 (64.7%) | 0 (0.0%) |
| 60 to 64 Years | 8 (80.0%) | 0 (0.0%) |
| 65 to 74 Years | 0 (0.0%) | 0 (0.0%) |
| 75 Years and over | 0 (0.0%) | 0 (0.0%) |
| Total | 54 (60.7%) | 0 (0.0%) |
Employment Status by Educational Attainment in Cheshire
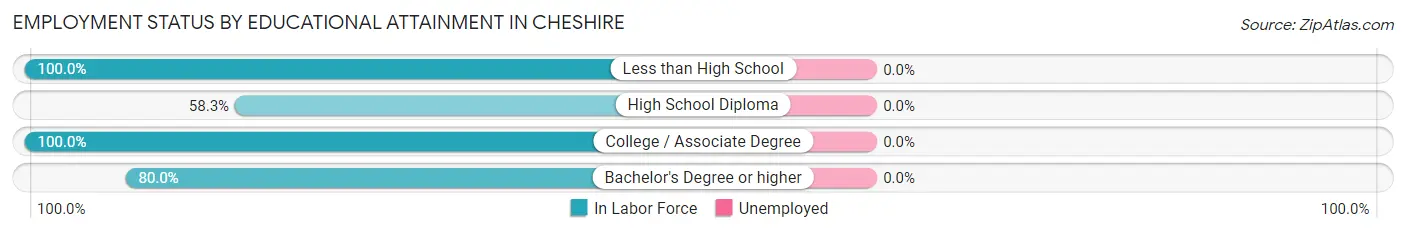
| Educational Attainment | In Labor Force | Unemployed |
| Less than High School | 7 (100.0%) | 0 (0.0%) |
| High School Diploma | 21 (58.3%) | 0 (0.0%) |
| College / Associate Degree | 20 (100.0%) | 0 (0.0%) |
| Bachelor's Degree or higher | 4 (80.0%) | 0 (0.0%) |
| Total | 52 (76.5%) | 0 (0.0%) |
Employment Occupations by Sex in Cheshire
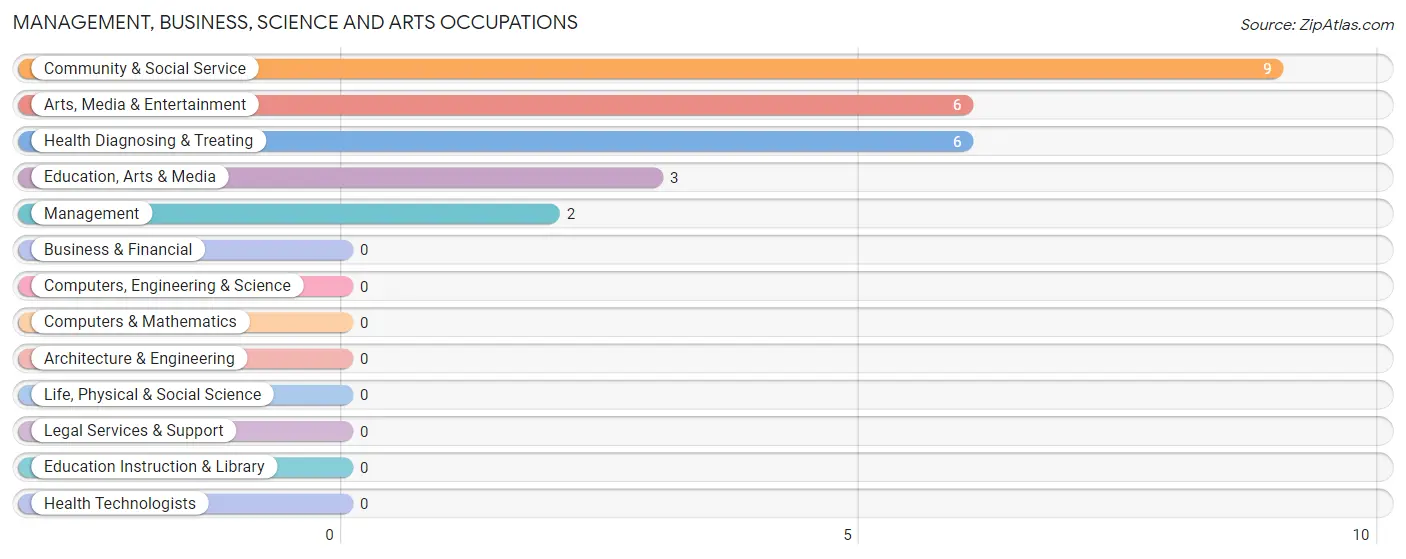
Management, Business, Science and Arts Occupations
The most common Management, Business, Science and Arts occupations in Cheshire are Community & Social Service (9 | 16.7%), Arts, Media & Entertainment (6 | 11.1%), Health Diagnosing & Treating (6 | 11.1%), Education, Arts & Media (3 | 5.6%), and Management (2 | 3.7%).
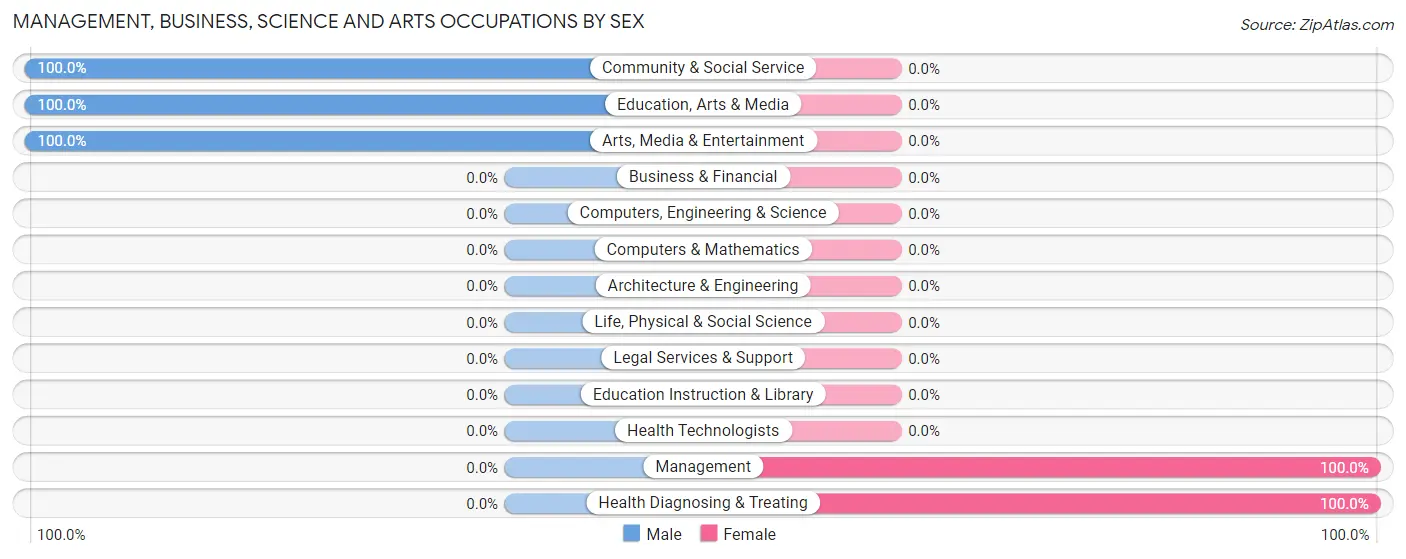
Management, Business, Science and Arts Occupations by Sex
Within the Management, Business, Science and Arts occupations in Cheshire, the most male-oriented occupations are Community & Social Service (100.0%), Education, Arts & Media (100.0%), and Arts, Media & Entertainment (100.0%), while the most female-oriented occupations are Management (100.0%), and Health Diagnosing & Treating (100.0%).
| Occupation | Male | Female |
| Management | 0 (0.0%) | 2 (100.0%) |
| Business & Financial | 0 (0.0%) | 0 (0.0%) |
| Computers, Engineering & Science | 0 (0.0%) | 0 (0.0%) |
| Computers & Mathematics | 0 (0.0%) | 0 (0.0%) |
| Architecture & Engineering | 0 (0.0%) | 0 (0.0%) |
| Life, Physical & Social Science | 0 (0.0%) | 0 (0.0%) |
| Community & Social Service | 9 (100.0%) | 0 (0.0%) |
| Education, Arts & Media | 3 (100.0%) | 0 (0.0%) |
| Legal Services & Support | 0 (0.0%) | 0 (0.0%) |
| Education Instruction & Library | 0 (0.0%) | 0 (0.0%) |
| Arts, Media & Entertainment | 6 (100.0%) | 0 (0.0%) |
| Health Diagnosing & Treating | 0 (0.0%) | 6 (100.0%) |
| Health Technologists | 0 (0.0%) | 0 (0.0%) |
| Total (Category) | 9 (52.9%) | 8 (47.1%) |
| Total (Overall) | 26 (48.1%) | 28 (51.8%) |
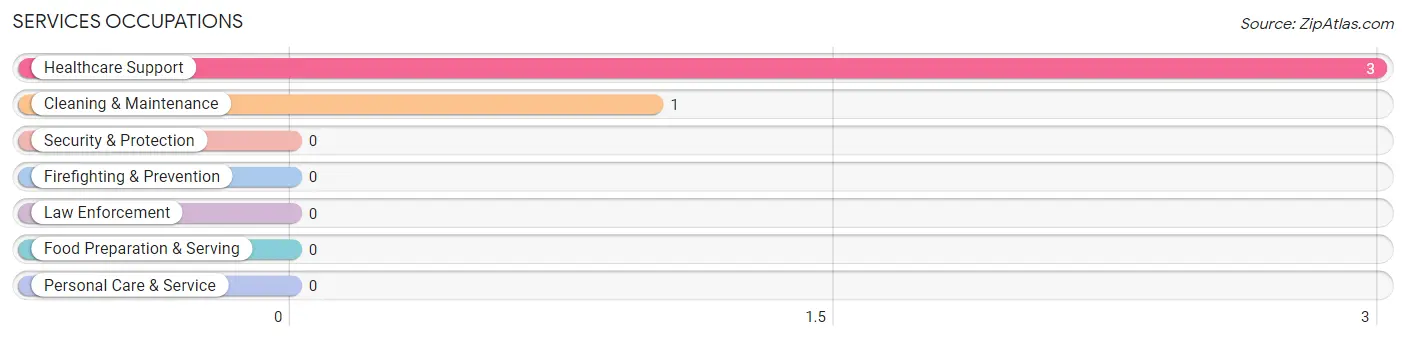
Services Occupations
The most common Services occupations in Cheshire are Healthcare Support (3 | 5.6%), and Cleaning & Maintenance (1 | 1.8%).
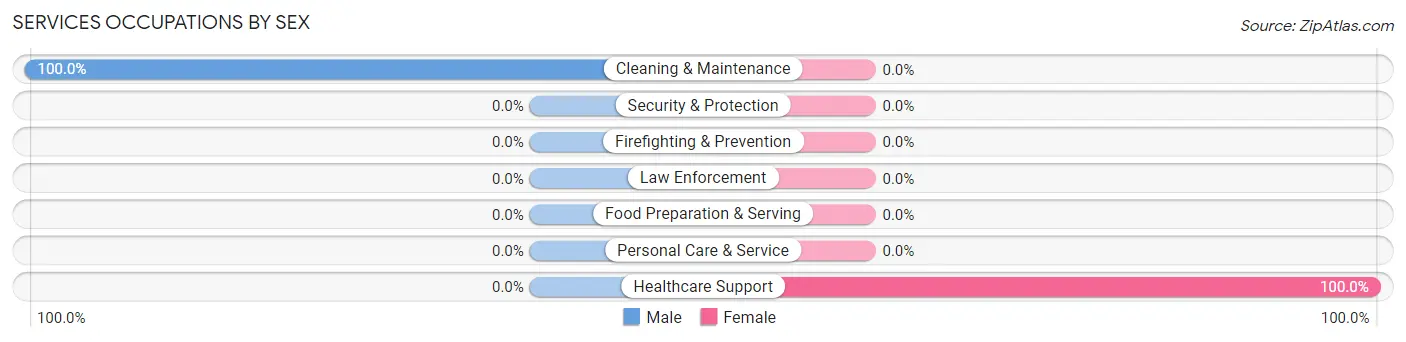
Services Occupations by Sex
| Occupation | Male | Female |
| Healthcare Support | 0 (0.0%) | 3 (100.0%) |
| Security & Protection | 0 (0.0%) | 0 (0.0%) |
| Firefighting & Prevention | 0 (0.0%) | 0 (0.0%) |
| Law Enforcement | 0 (0.0%) | 0 (0.0%) |
| Food Preparation & Serving | 0 (0.0%) | 0 (0.0%) |
| Cleaning & Maintenance | 1 (100.0%) | 0 (0.0%) |
| Personal Care & Service | 0 (0.0%) | 0 (0.0%) |
| Total (Category) | 1 (25.0%) | 3 (75.0%) |
| Total (Overall) | 26 (48.1%) | 28 (51.8%) |
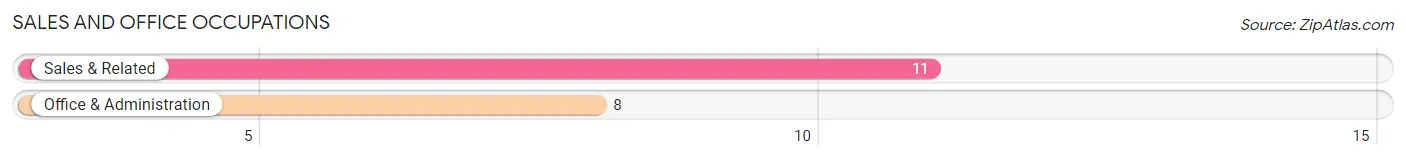
Sales and Office Occupations
The most common Sales and Office occupations in Cheshire are Sales & Related (11 | 20.4%), and Office & Administration (8 | 14.8%).
Sales and Office Occupations by Sex
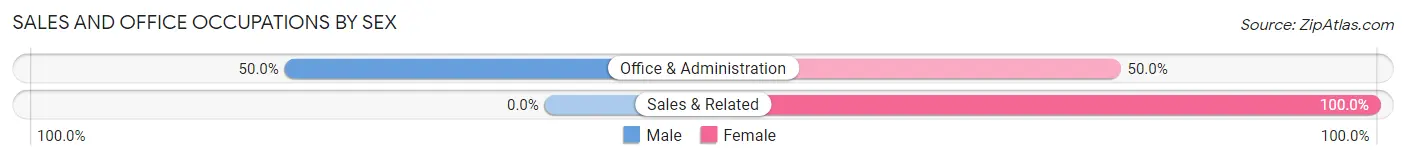
| Occupation | Male | Female |
| Sales & Related | 0 (0.0%) | 11 (100.0%) |
| Office & Administration | 4 (50.0%) | 4 (50.0%) |
| Total (Category) | 4 (21.0%) | 15 (78.9%) |
| Total (Overall) | 26 (48.1%) | 28 (51.8%) |
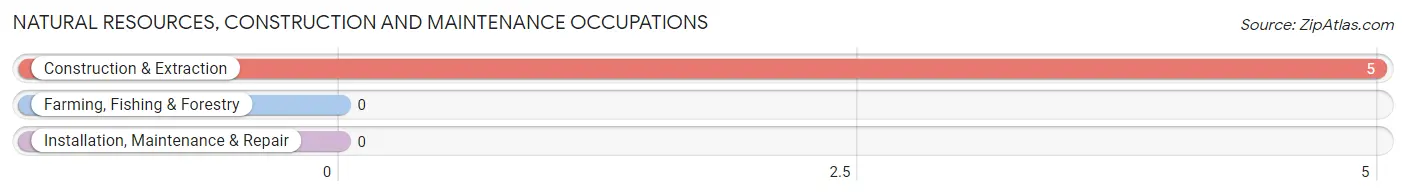
Natural Resources, Construction and Maintenance Occupations
The most common Natural Resources, Construction and Maintenance occupations in Cheshire are , and Construction & Extraction (5 | 9.3%).
Natural Resources, Construction and Maintenance Occupations by Sex
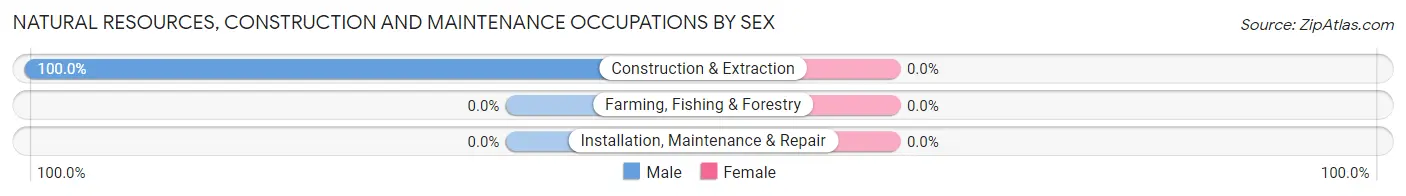
| Occupation | Male | Female |
| Farming, Fishing & Forestry | 0 (0.0%) | 0 (0.0%) |
| Construction & Extraction | 5 (100.0%) | 0 (0.0%) |
| Installation, Maintenance & Repair | 0 (0.0%) | 0 (0.0%) |
| Total (Category) | 5 (100.0%) | 0 (0.0%) |
| Total (Overall) | 26 (48.1%) | 28 (51.8%) |
Production, Transportation and Moving Occupations
The most common Production, Transportation and Moving occupations in Cheshire are Production (5 | 9.3%), Transportation (2 | 3.7%), and Material Moving (2 | 3.7%).
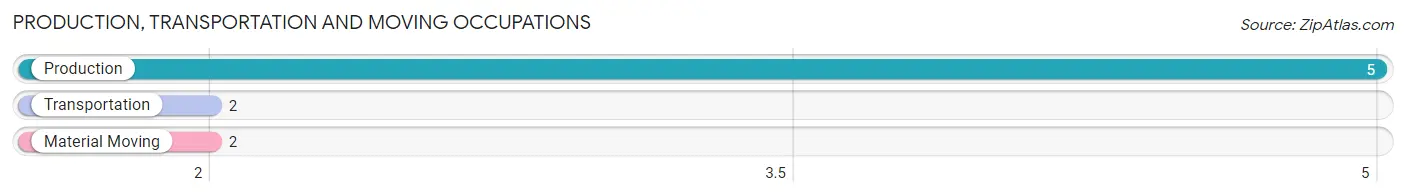
Production, Transportation and Moving Occupations by Sex
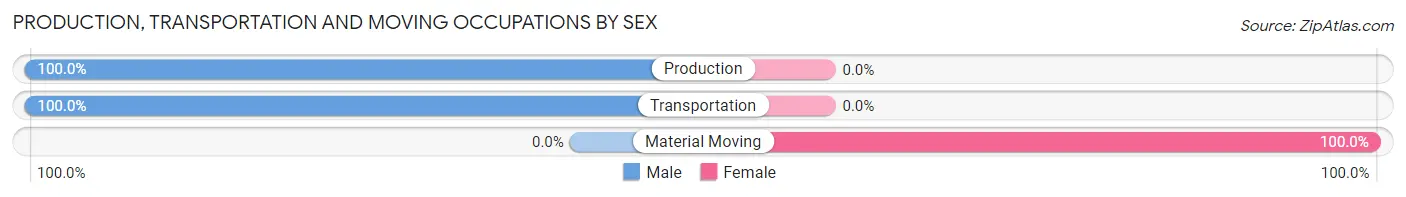
| Occupation | Male | Female |
| Production | 5 (100.0%) | 0 (0.0%) |
| Transportation | 2 (100.0%) | 0 (0.0%) |
| Material Moving | 0 (0.0%) | 2 (100.0%) |
| Total (Category) | 7 (77.8%) | 2 (22.2%) |
| Total (Overall) | 26 (48.1%) | 28 (51.8%) |
Employment Industries by Sex in Cheshire
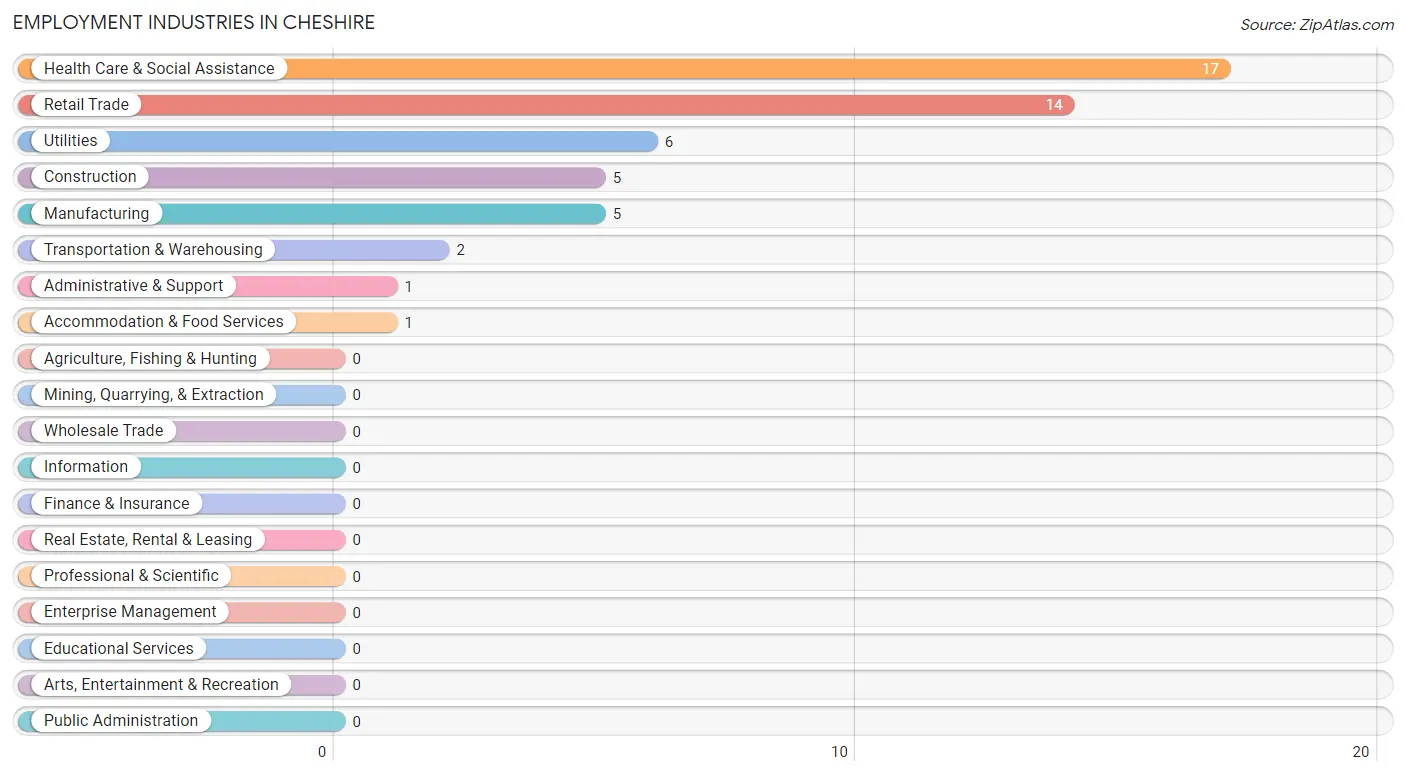
Employment Industries in Cheshire
The major employment industries in Cheshire include Health Care & Social Assistance (17 | 31.5%), Retail Trade (14 | 25.9%), Utilities (6 | 11.1%), Construction (5 | 9.3%), and Manufacturing (5 | 9.3%).
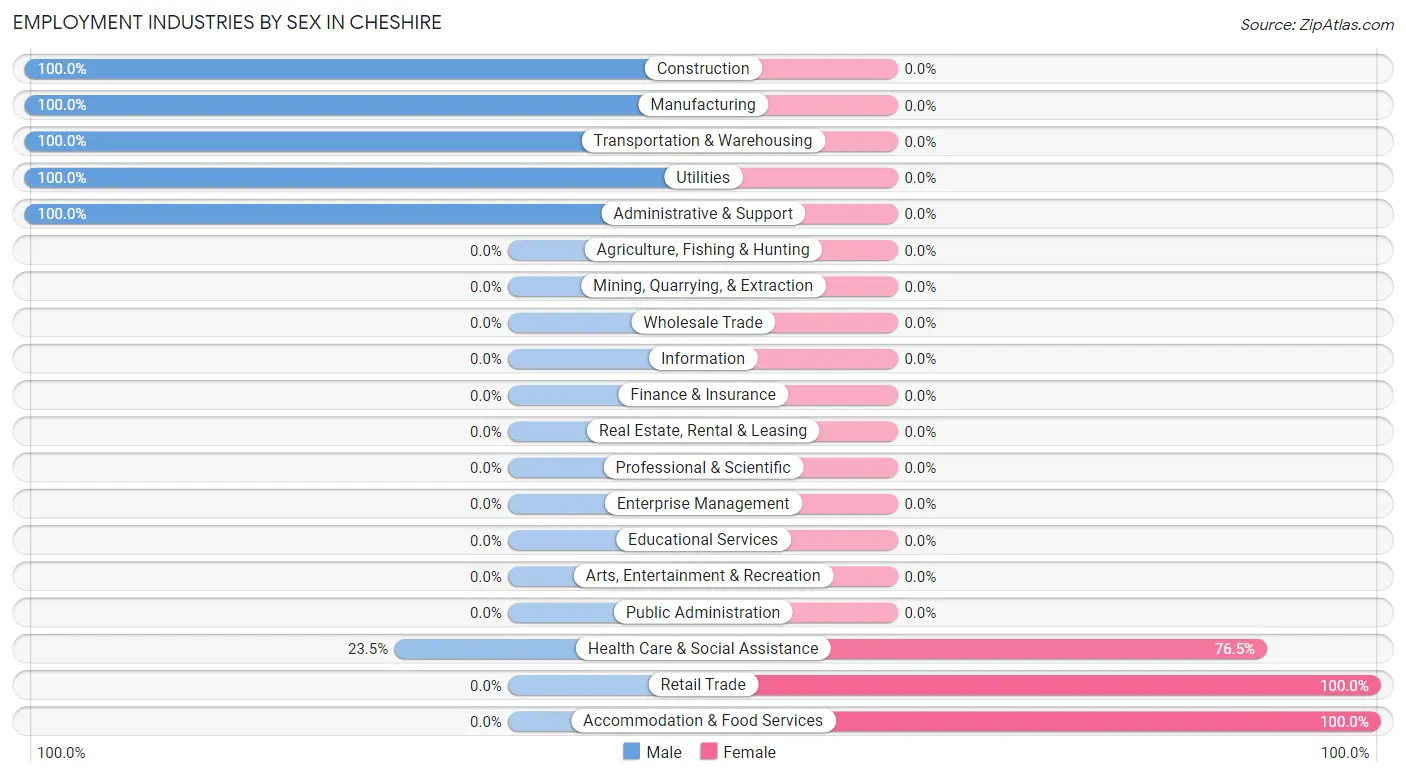
Employment Industries by Sex in Cheshire
The Cheshire industries that see more men than women are Construction (100.0%), Manufacturing (100.0%), and Transportation & Warehousing (100.0%), whereas the industries that tend to have a higher number of women are Retail Trade (100.0%), Accommodation & Food Services (100.0%), and Health Care & Social Assistance (76.5%).
| Industry | Male | Female |
| Agriculture, Fishing & Hunting | 0 (0.0%) | 0 (0.0%) |
| Mining, Quarrying, & Extraction | 0 (0.0%) | 0 (0.0%) |
| Construction | 5 (100.0%) | 0 (0.0%) |
| Manufacturing | 5 (100.0%) | 0 (0.0%) |
| Wholesale Trade | 0 (0.0%) | 0 (0.0%) |
| Retail Trade | 0 (0.0%) | 14 (100.0%) |
| Transportation & Warehousing | 2 (100.0%) | 0 (0.0%) |
| Utilities | 6 (100.0%) | 0 (0.0%) |
| Information | 0 (0.0%) | 0 (0.0%) |
| Finance & Insurance | 0 (0.0%) | 0 (0.0%) |
| Real Estate, Rental & Leasing | 0 (0.0%) | 0 (0.0%) |
| Professional & Scientific | 0 (0.0%) | 0 (0.0%) |
| Enterprise Management | 0 (0.0%) | 0 (0.0%) |
| Administrative & Support | 1 (100.0%) | 0 (0.0%) |
| Educational Services | 0 (0.0%) | 0 (0.0%) |
| Health Care & Social Assistance | 4 (23.5%) | 13 (76.5%) |
| Arts, Entertainment & Recreation | 0 (0.0%) | 0 (0.0%) |
| Accommodation & Food Services | 0 (0.0%) | 1 (100.0%) |
| Public Administration | 0 (0.0%) | 0 (0.0%) |
| Total | 26 (48.1%) | 28 (51.8%) |
Education in Cheshire
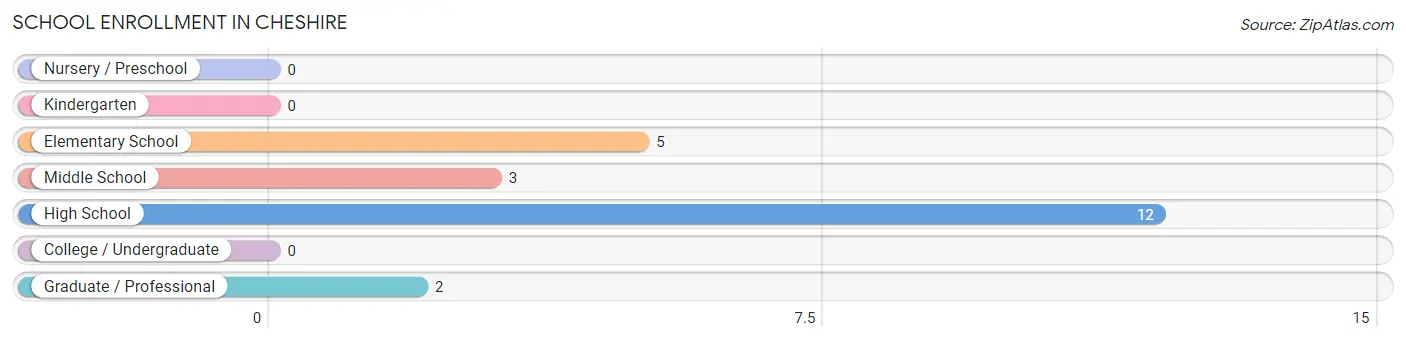
School Enrollment in Cheshire
The most common levels of schooling among the 22 students in Cheshire are high school (12 | 54.5%), elementary school (5 | 22.7%), and middle school (3 | 13.6%).
| School Level | # Students | % Students |
| Nursery / Preschool | 0 | 0.0% |
| Kindergarten | 0 | 0.0% |
| Elementary School | 5 | 22.7% |
| Middle School | 3 | 13.6% |
| High School | 12 | 54.5% |
| College / Undergraduate | 0 | 0.0% |
| Graduate / Professional | 2 | 9.1% |
| Total | 22 | 100.0% |
School Enrollment by Age by Funding Source in Cheshire
Out of a total of 22 students who are enrolled in schools in Cheshire, 10 (45.5%) attend a private institution, while the remaining 12 (54.5%) are enrolled in public schools. The age group of 15 to 17 year olds has the highest likelihood of being enrolled in private schools, with 6 (100.0% in the age bracket) enrolled. Conversely, the age group of 10 to 14 year olds has the lowest likelihood of being enrolled in a private school, with 3 (100.0% in the age bracket) attending a public institution.
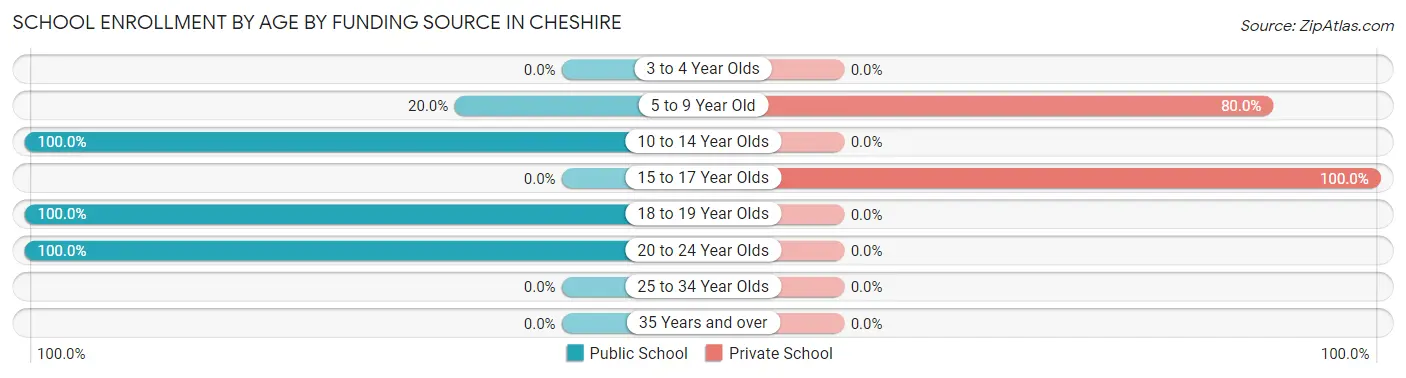
| Age Bracket | Public School | Private School |
| 3 to 4 Year Olds | 0 (0.0%) | 0 (0.0%) |
| 5 to 9 Year Old | 1 (20.0%) | 4 (80.0%) |
| 10 to 14 Year Olds | 3 (100.0%) | 0 (0.0%) |
| 15 to 17 Year Olds | 0 (0.0%) | 6 (100.0%) |
| 18 to 19 Year Olds | 6 (100.0%) | 0 (0.0%) |
| 20 to 24 Year Olds | 2 (100.0%) | 0 (0.0%) |
| 25 to 34 Year Olds | 0 (0.0%) | 0 (0.0%) |
| 35 Years and over | 0 (0.0%) | 0 (0.0%) |
| Total | 12 (54.5%) | 10 (45.5%) |
Educational Attainment by Field of Study in Cheshire
Science & technology (3 | 50.0%), education (2 | 33.3%), and physical & health sciences (1 | 16.7%) are the most common fields of study among 6 individuals in Cheshire who have obtained a bachelor's degree or higher.
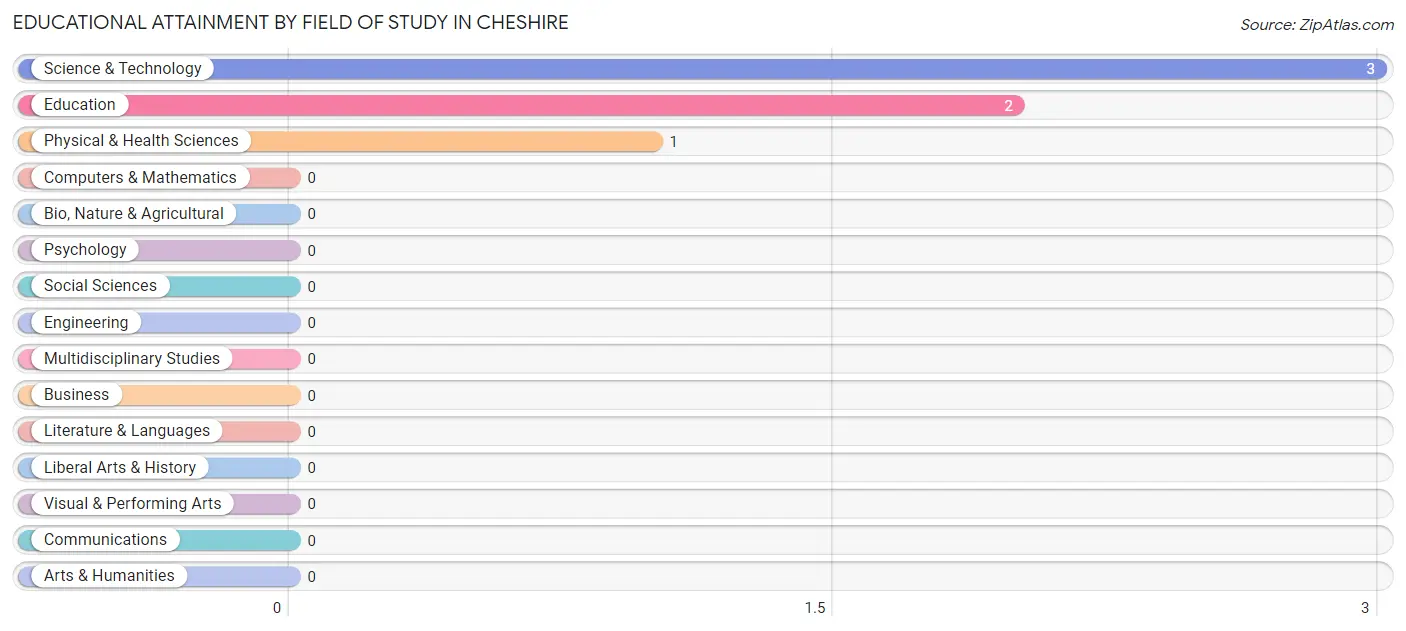
| Field of Study | # Graduates | % Graduates |
| Computers & Mathematics | 0 | 0.0% |
| Bio, Nature & Agricultural | 0 | 0.0% |
| Physical & Health Sciences | 1 | 16.7% |
| Psychology | 0 | 0.0% |
| Social Sciences | 0 | 0.0% |
| Engineering | 0 | 0.0% |
| Multidisciplinary Studies | 0 | 0.0% |
| Science & Technology | 3 | 50.0% |
| Business | 0 | 0.0% |
| Education | 2 | 33.3% |
| Literature & Languages | 0 | 0.0% |
| Liberal Arts & History | 0 | 0.0% |
| Visual & Performing Arts | 0 | 0.0% |
| Communications | 0 | 0.0% |
| Arts & Humanities | 0 | 0.0% |
| Total | 6 | 100.0% |
Transportation & Commute in Cheshire
Vehicle Availability by Sex in Cheshire
The most prevalent vehicle ownership categories in Cheshire are males with 1 vehicle (9, accounting for 40.9%) and females with 1 vehicle (12, making up 32.1%).
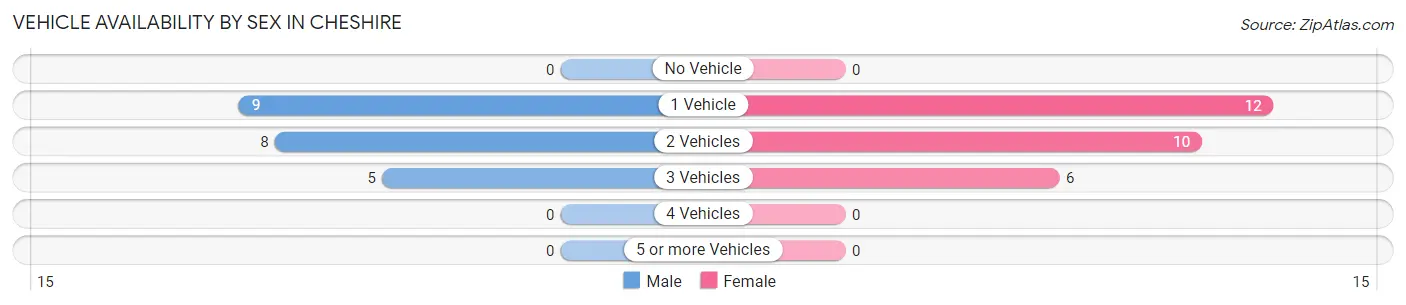
| Vehicles Available | Male | Female |
| No Vehicle | 0 (0.0%) | 0 (0.0%) |
| 1 Vehicle | 9 (40.9%) | 12 (42.9%) |
| 2 Vehicles | 8 (36.4%) | 10 (35.7%) |
| 3 Vehicles | 5 (22.7%) | 6 (21.4%) |
| 4 Vehicles | 0 (0.0%) | 0 (0.0%) |
| 5 or more Vehicles | 0 (0.0%) | 0 (0.0%) |
| Total | 22 (100.0%) | 28 (100.0%) |
Commute Time in Cheshire
The most frequently occuring commute durations in Cheshire are 20 to 24 minutes (16 commuters, 32.7%), 90 or more minutes (13 commuters, 26.5%), and less than 5 minutes (6 commuters, 12.2%).
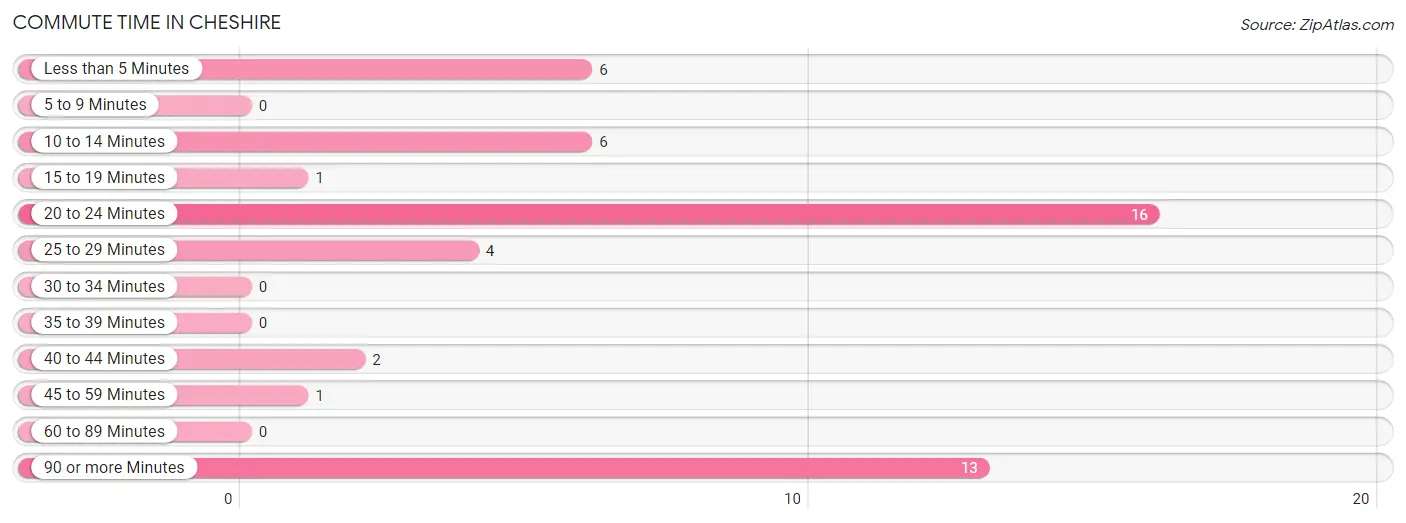
| Commute Time | # Commuters | % Commuters |
| Less than 5 Minutes | 6 | 12.2% |
| 5 to 9 Minutes | 0 | 0.0% |
| 10 to 14 Minutes | 6 | 12.2% |
| 15 to 19 Minutes | 1 | 2.0% |
| 20 to 24 Minutes | 16 | 32.7% |
| 25 to 29 Minutes | 4 | 8.2% |
| 30 to 34 Minutes | 0 | 0.0% |
| 35 to 39 Minutes | 0 | 0.0% |
| 40 to 44 Minutes | 2 | 4.1% |
| 45 to 59 Minutes | 1 | 2.0% |
| 60 to 89 Minutes | 0 | 0.0% |
| 90 or more Minutes | 13 | 26.5% |
Commute Time by Sex in Cheshire
The most common commute times in Cheshire are 90 or more minutes (7 commuters, 31.8%) for males and 20 to 24 minutes (10 commuters, 37.0%) for females.
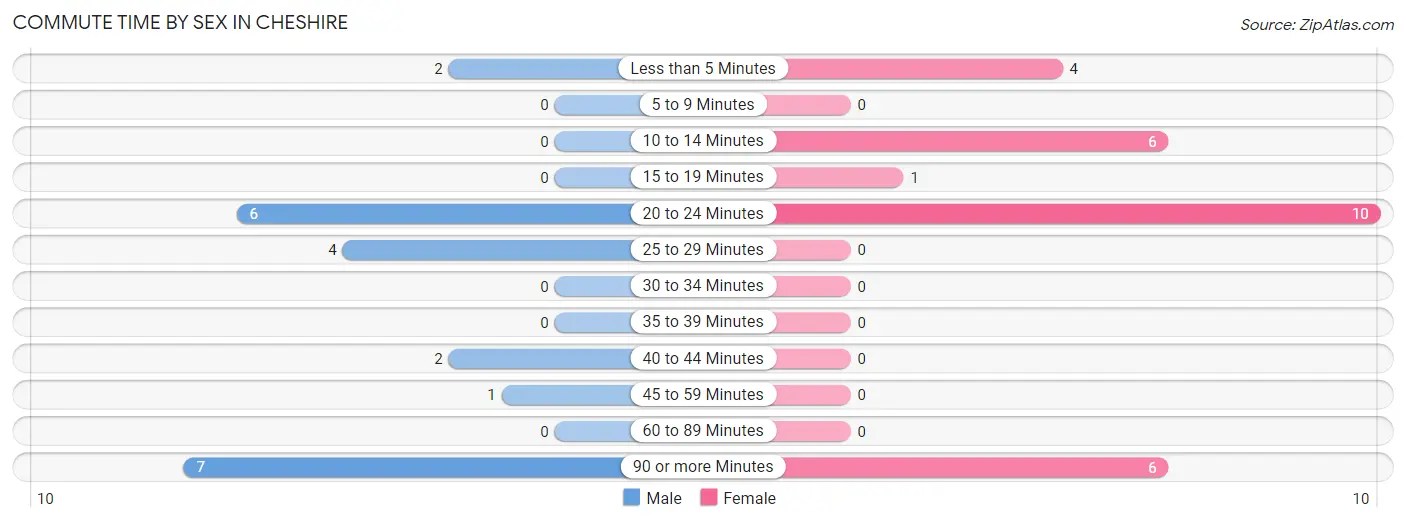
| Commute Time | Male | Female |
| Less than 5 Minutes | 2 (9.1%) | 4 (14.8%) |
| 5 to 9 Minutes | 0 (0.0%) | 0 (0.0%) |
| 10 to 14 Minutes | 0 (0.0%) | 6 (22.2%) |
| 15 to 19 Minutes | 0 (0.0%) | 1 (3.7%) |
| 20 to 24 Minutes | 6 (27.3%) | 10 (37.0%) |
| 25 to 29 Minutes | 4 (18.2%) | 0 (0.0%) |
| 30 to 34 Minutes | 0 (0.0%) | 0 (0.0%) |
| 35 to 39 Minutes | 0 (0.0%) | 0 (0.0%) |
| 40 to 44 Minutes | 2 (9.1%) | 0 (0.0%) |
| 45 to 59 Minutes | 1 (4.5%) | 0 (0.0%) |
| 60 to 89 Minutes | 0 (0.0%) | 0 (0.0%) |
| 90 or more Minutes | 7 (31.8%) | 6 (22.2%) |
Time of Departure to Work by Sex in Cheshire
The most frequent times of departure to work in Cheshire are 7:00 AM to 7:29 AM (7, 31.8%) for males and 12:00 AM to 4:59 AM (9, 33.3%) for females.
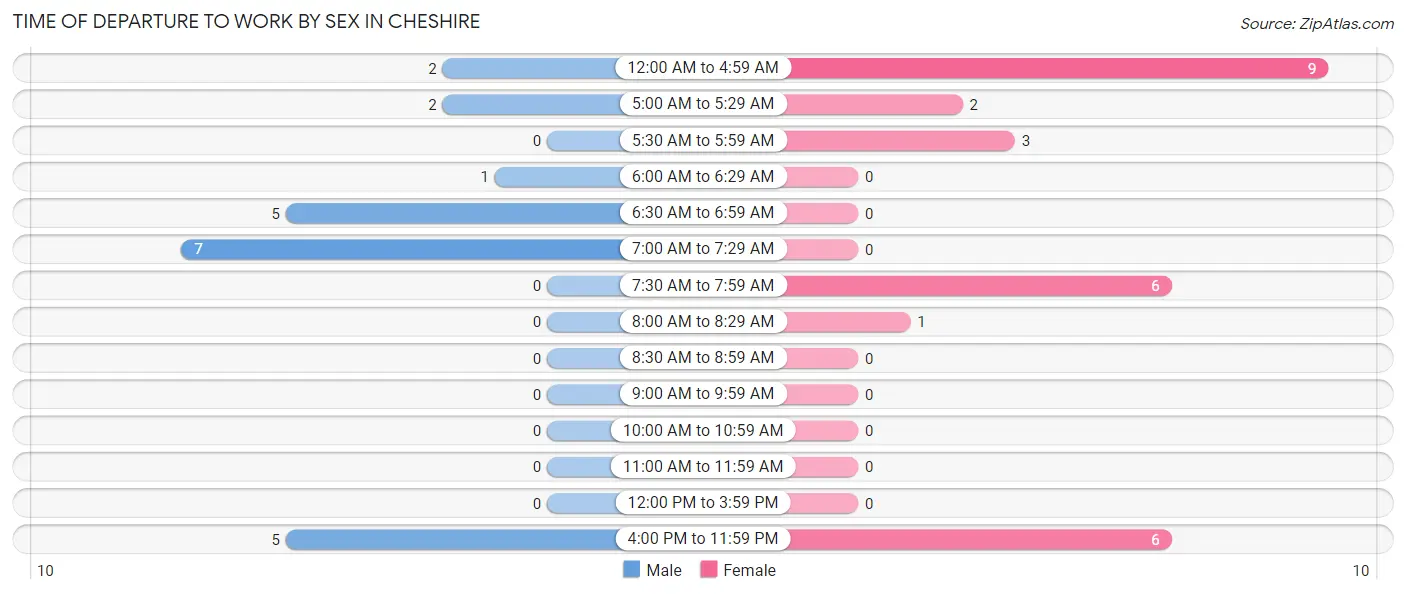
| Time of Departure | Male | Female |
| 12:00 AM to 4:59 AM | 2 (9.1%) | 9 (33.3%) |
| 5:00 AM to 5:29 AM | 2 (9.1%) | 2 (7.4%) |
| 5:30 AM to 5:59 AM | 0 (0.0%) | 3 (11.1%) |
| 6:00 AM to 6:29 AM | 1 (4.5%) | 0 (0.0%) |
| 6:30 AM to 6:59 AM | 5 (22.7%) | 0 (0.0%) |
| 7:00 AM to 7:29 AM | 7 (31.8%) | 0 (0.0%) |
| 7:30 AM to 7:59 AM | 0 (0.0%) | 6 (22.2%) |
| 8:00 AM to 8:29 AM | 0 (0.0%) | 1 (3.7%) |
| 8:30 AM to 8:59 AM | 0 (0.0%) | 0 (0.0%) |
| 9:00 AM to 9:59 AM | 0 (0.0%) | 0 (0.0%) |
| 10:00 AM to 10:59 AM | 0 (0.0%) | 0 (0.0%) |
| 11:00 AM to 11:59 AM | 0 (0.0%) | 0 (0.0%) |
| 12:00 PM to 3:59 PM | 0 (0.0%) | 0 (0.0%) |
| 4:00 PM to 11:59 PM | 5 (22.7%) | 6 (22.2%) |
| Total | 22 (100.0%) | 27 (100.0%) |
Housing Occupancy in Cheshire
Occupancy by Ownership in Cheshire
Of the total 45 dwellings in Cheshire, owner-occupied units account for 37 (82.2%), while renter-occupied units make up 8 (17.8%).
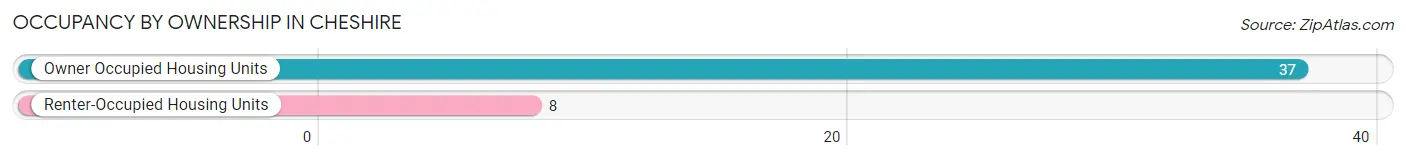
| Occupancy | # Housing Units | % Housing Units |
| Owner Occupied Housing Units | 37 | 82.2% |
| Renter-Occupied Housing Units | 8 | 17.8% |
| Total Occupied Housing Units | 45 | 100.0% |
Occupancy by Household Size in Cheshire
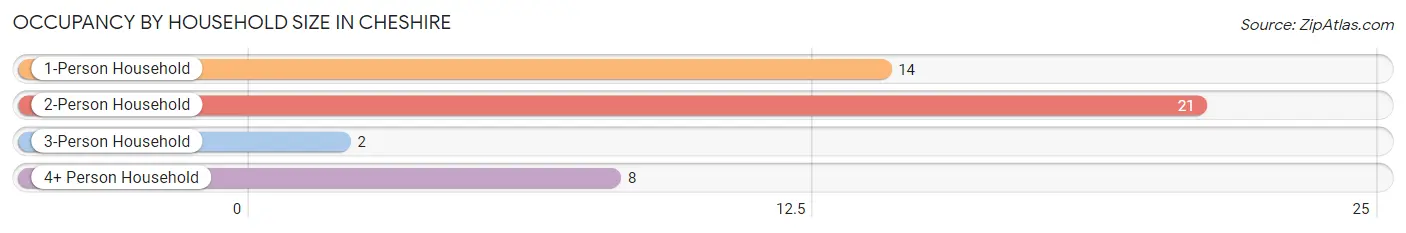
| Household Size | # Housing Units | % Housing Units |
| 1-Person Household | 14 | 31.1% |
| 2-Person Household | 21 | 46.7% |
| 3-Person Household | 2 | 4.4% |
| 4+ Person Household | 8 | 17.8% |
| Total Housing Units | 45 | 100.0% |
Occupancy by Ownership by Household Size in Cheshire
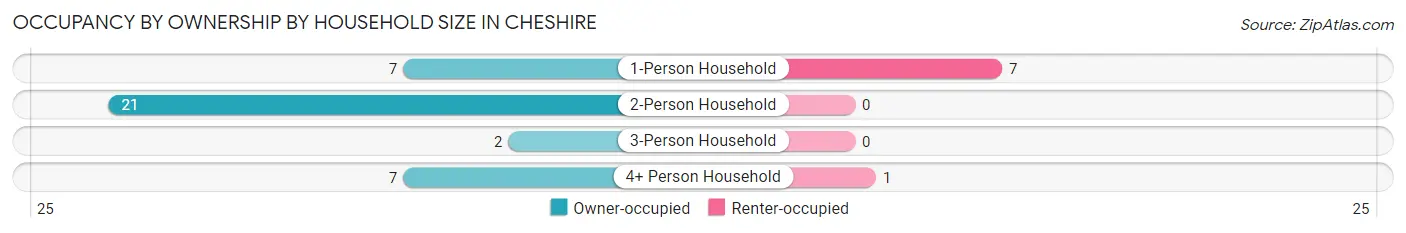
| Household Size | Owner-occupied | Renter-occupied |
| 1-Person Household | 7 (50.0%) | 7 (50.0%) |
| 2-Person Household | 21 (100.0%) | 0 (0.0%) |
| 3-Person Household | 2 (100.0%) | 0 (0.0%) |
| 4+ Person Household | 7 (87.5%) | 1 (12.5%) |
| Total Housing Units | 37 (82.2%) | 8 (17.8%) |
Occupancy by Educational Attainment in Cheshire
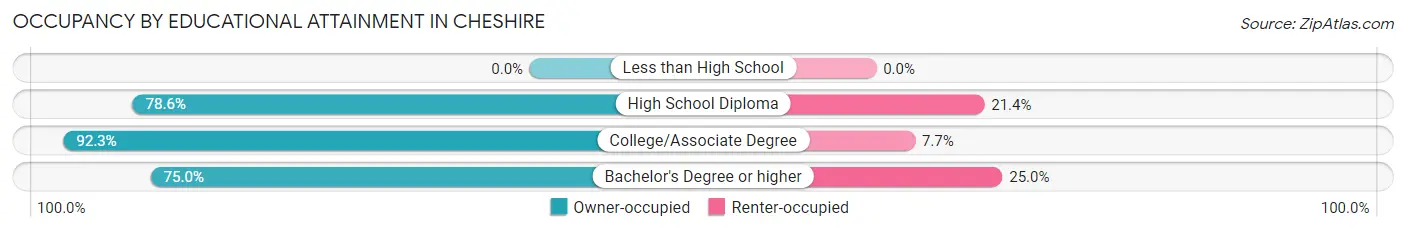
| Household Size | Owner-occupied | Renter-occupied |
| Less than High School | 0 (0.0%) | 0 (0.0%) |
| High School Diploma | 22 (78.6%) | 6 (21.4%) |
| College/Associate Degree | 12 (92.3%) | 1 (7.7%) |
| Bachelor's Degree or higher | 3 (75.0%) | 1 (25.0%) |
Occupancy by Age of Householder in Cheshire
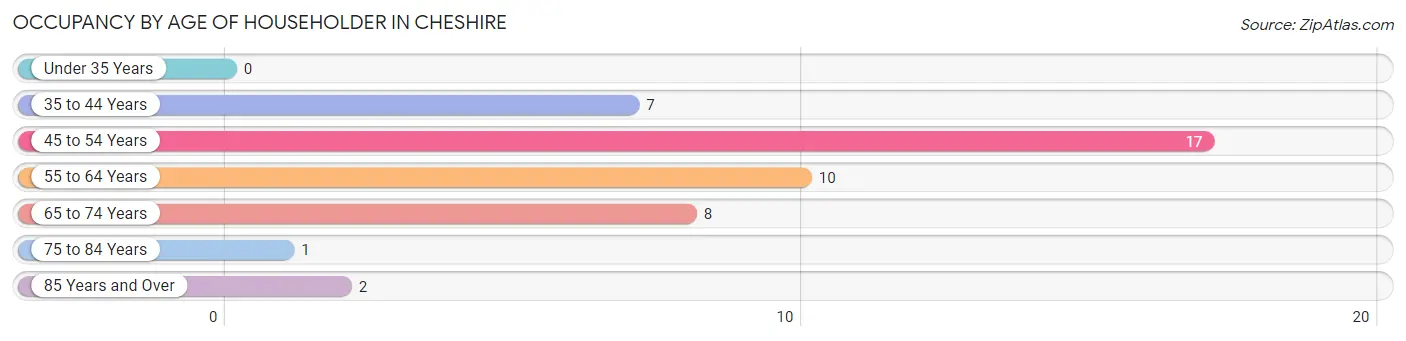
| Age Bracket | # Households | % Households |
| Under 35 Years | 0 | 0.0% |
| 35 to 44 Years | 7 | 15.6% |
| 45 to 54 Years | 17 | 37.8% |
| 55 to 64 Years | 10 | 22.2% |
| 65 to 74 Years | 8 | 17.8% |
| 75 to 84 Years | 1 | 2.2% |
| 85 Years and Over | 2 | 4.4% |
| Total | 45 | 100.0% |
Housing Finances in Cheshire
Median Income by Occupancy in Cheshire
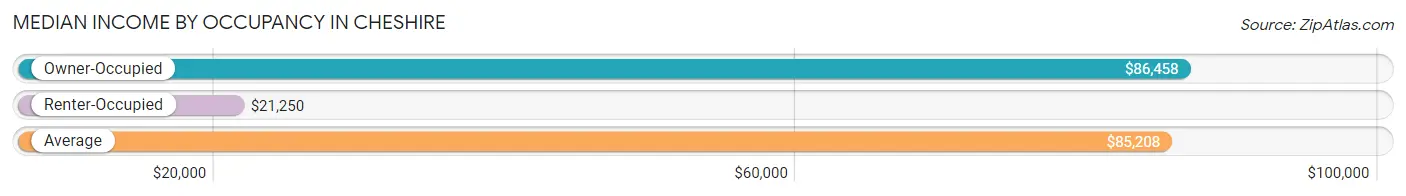
| Occupancy Type | # Households | Median Income |
| Owner-Occupied | 37 (82.2%) | $86,458 |
| Renter-Occupied | 8 (17.8%) | $21,250 |
| Average | 45 (100.0%) | $85,208 |
Occupancy by Householder Income Bracket in Cheshire
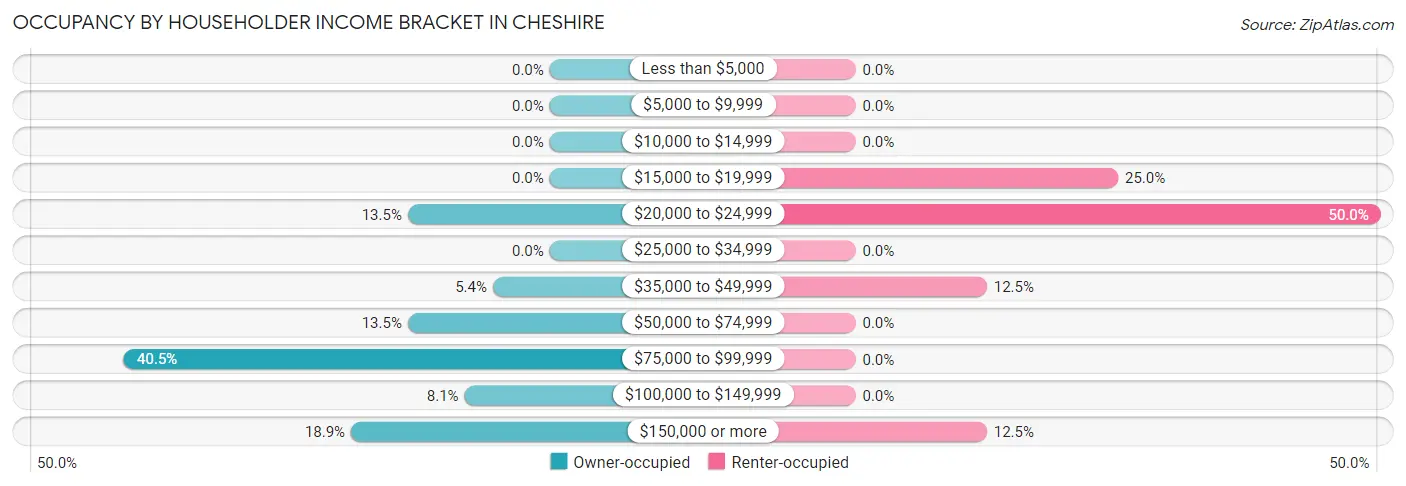
| Income Bracket | Owner-occupied | Renter-occupied |
| Less than $5,000 | 0 (0.0%) | 0 (0.0%) |
| $5,000 to $9,999 | 0 (0.0%) | 0 (0.0%) |
| $10,000 to $14,999 | 0 (0.0%) | 0 (0.0%) |
| $15,000 to $19,999 | 0 (0.0%) | 2 (25.0%) |
| $20,000 to $24,999 | 5 (13.5%) | 4 (50.0%) |
| $25,000 to $34,999 | 0 (0.0%) | 0 (0.0%) |
| $35,000 to $49,999 | 2 (5.4%) | 1 (12.5%) |
| $50,000 to $74,999 | 5 (13.5%) | 0 (0.0%) |
| $75,000 to $99,999 | 15 (40.5%) | 0 (0.0%) |
| $100,000 to $149,999 | 3 (8.1%) | 0 (0.0%) |
| $150,000 or more | 7 (18.9%) | 1 (12.5%) |
| Total | 37 (100.0%) | 8 (100.0%) |
Monthly Housing Cost Tiers in Cheshire
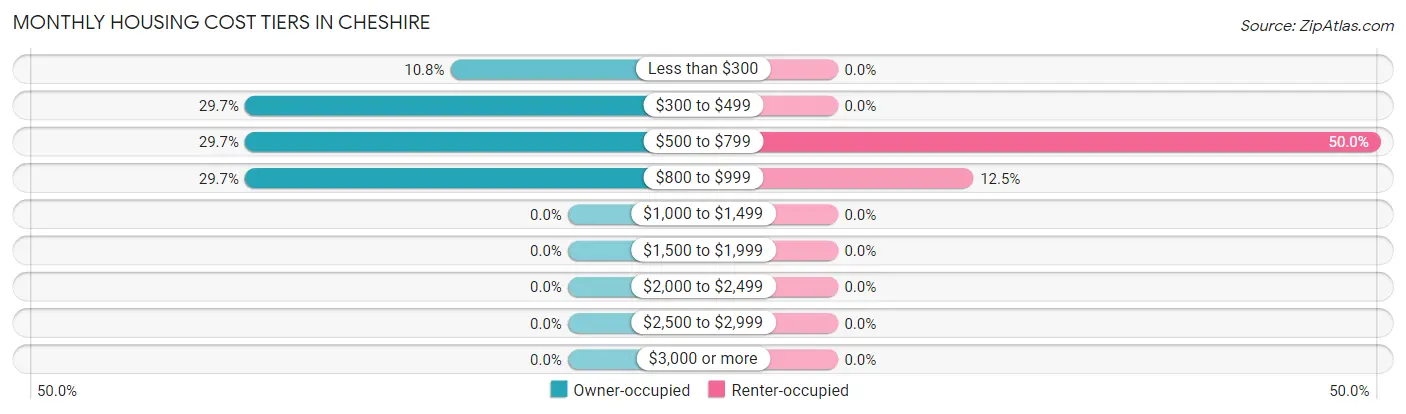
| Monthly Cost | Owner-occupied | Renter-occupied |
| Less than $300 | 4 (10.8%) | 0 (0.0%) |
| $300 to $499 | 11 (29.7%) | 0 (0.0%) |
| $500 to $799 | 11 (29.7%) | 4 (50.0%) |
| $800 to $999 | 11 (29.7%) | 1 (12.5%) |
| $1,000 to $1,499 | 0 (0.0%) | 0 (0.0%) |
| $1,500 to $1,999 | 0 (0.0%) | 0 (0.0%) |
| $2,000 to $2,499 | 0 (0.0%) | 0 (0.0%) |
| $2,500 to $2,999 | 0 (0.0%) | 0 (0.0%) |
| $3,000 or more | 0 (0.0%) | 0 (0.0%) |
| Total | 37 (100.0%) | 8 (100.0%) |
Physical Housing Characteristics in Cheshire
Housing Structures in Cheshire
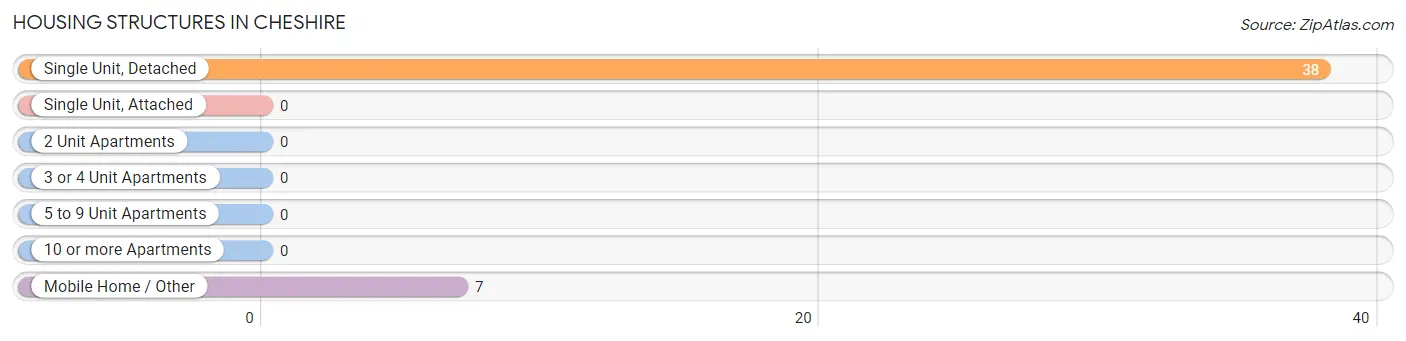
| Structure Type | # Housing Units | % Housing Units |
| Single Unit, Detached | 38 | 84.4% |
| Single Unit, Attached | 0 | 0.0% |
| 2 Unit Apartments | 0 | 0.0% |
| 3 or 4 Unit Apartments | 0 | 0.0% |
| 5 to 9 Unit Apartments | 0 | 0.0% |
| 10 or more Apartments | 0 | 0.0% |
| Mobile Home / Other | 7 | 15.6% |
| Total | 45 | 100.0% |
Housing Structures by Occupancy in Cheshire
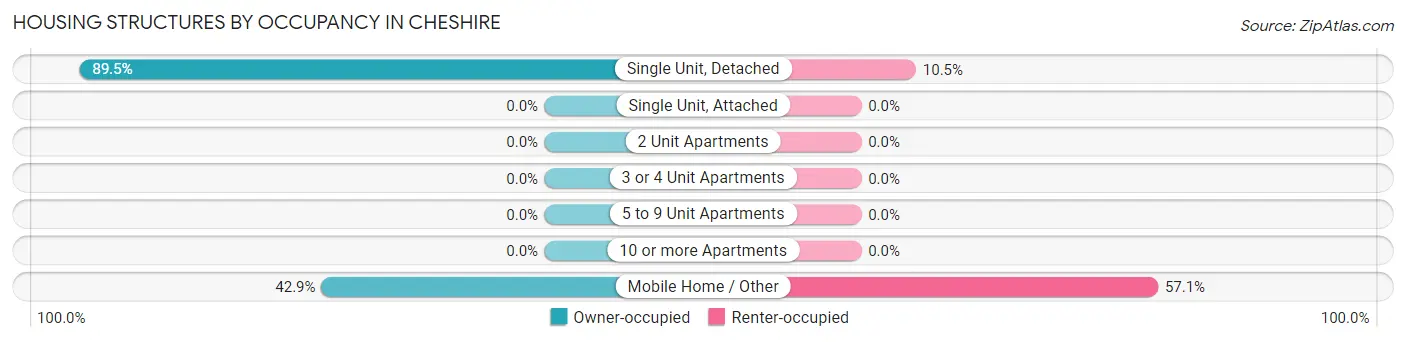
| Structure Type | Owner-occupied | Renter-occupied |
| Single Unit, Detached | 34 (89.5%) | 4 (10.5%) |
| Single Unit, Attached | 0 (0.0%) | 0 (0.0%) |
| 2 Unit Apartments | 0 (0.0%) | 0 (0.0%) |
| 3 or 4 Unit Apartments | 0 (0.0%) | 0 (0.0%) |
| 5 to 9 Unit Apartments | 0 (0.0%) | 0 (0.0%) |
| 10 or more Apartments | 0 (0.0%) | 0 (0.0%) |
| Mobile Home / Other | 3 (42.9%) | 4 (57.1%) |
| Total | 37 (82.2%) | 8 (17.8%) |
Housing Structures by Number of Rooms in Cheshire
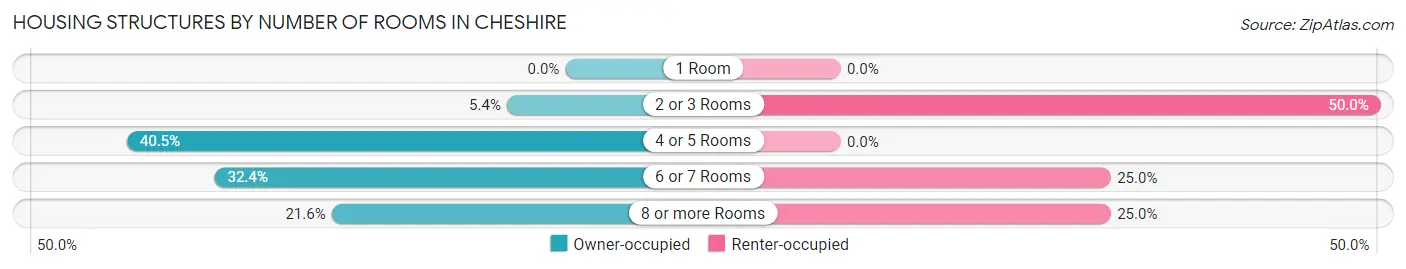
| Number of Rooms | Owner-occupied | Renter-occupied |
| 1 Room | 0 (0.0%) | 0 (0.0%) |
| 2 or 3 Rooms | 2 (5.4%) | 4 (50.0%) |
| 4 or 5 Rooms | 15 (40.5%) | 0 (0.0%) |
| 6 or 7 Rooms | 12 (32.4%) | 2 (25.0%) |
| 8 or more Rooms | 8 (21.6%) | 2 (25.0%) |
| Total | 37 (100.0%) | 8 (100.0%) |
Housing Structure by Heating Type in Cheshire
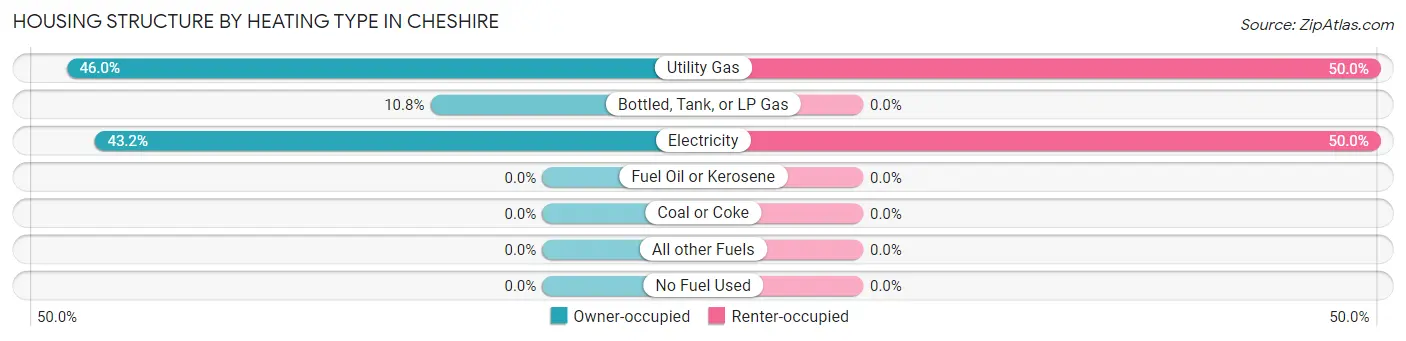
| Heating Type | Owner-occupied | Renter-occupied |
| Utility Gas | 17 (46.0%) | 4 (50.0%) |
| Bottled, Tank, or LP Gas | 4 (10.8%) | 0 (0.0%) |
| Electricity | 16 (43.2%) | 4 (50.0%) |
| Fuel Oil or Kerosene | 0 (0.0%) | 0 (0.0%) |
| Coal or Coke | 0 (0.0%) | 0 (0.0%) |
| All other Fuels | 0 (0.0%) | 0 (0.0%) |
| No Fuel Used | 0 (0.0%) | 0 (0.0%) |
| Total | 37 (100.0%) | 8 (100.0%) |
Household Vehicle Usage in Cheshire
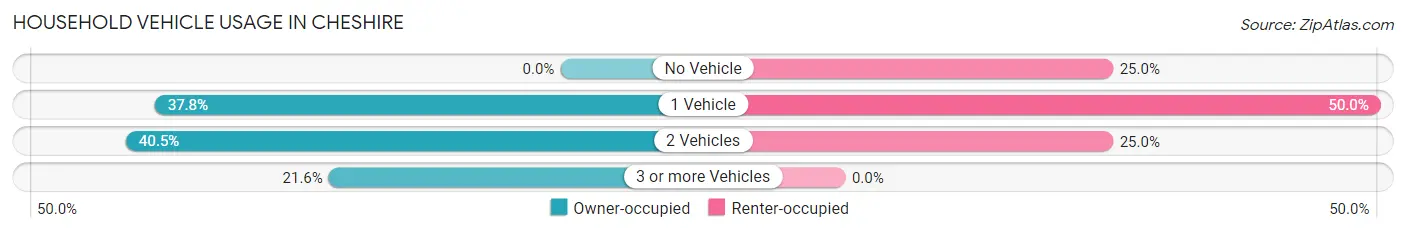
| Vehicles per Household | Owner-occupied | Renter-occupied |
| No Vehicle | 0 (0.0%) | 2 (25.0%) |
| 1 Vehicle | 14 (37.8%) | 4 (50.0%) |
| 2 Vehicles | 15 (40.5%) | 2 (25.0%) |
| 3 or more Vehicles | 8 (21.6%) | 0 (0.0%) |
| Total | 37 (100.0%) | 8 (100.0%) |
Real Estate & Mortgages in Cheshire
Real Estate and Mortgage Overview in Cheshire
| Characteristic | Without Mortgage | With Mortgage |
| Housing Units | 20 | 17 |
| Median Property Value | $97,500 | $70,800 |
| Median Household Income | $76,250 | $5 |
| Monthly Housing Costs | $390 | $0 |
| Real Estate Taxes | $956 | $0 |
Property Value by Mortgage Status in Cheshire
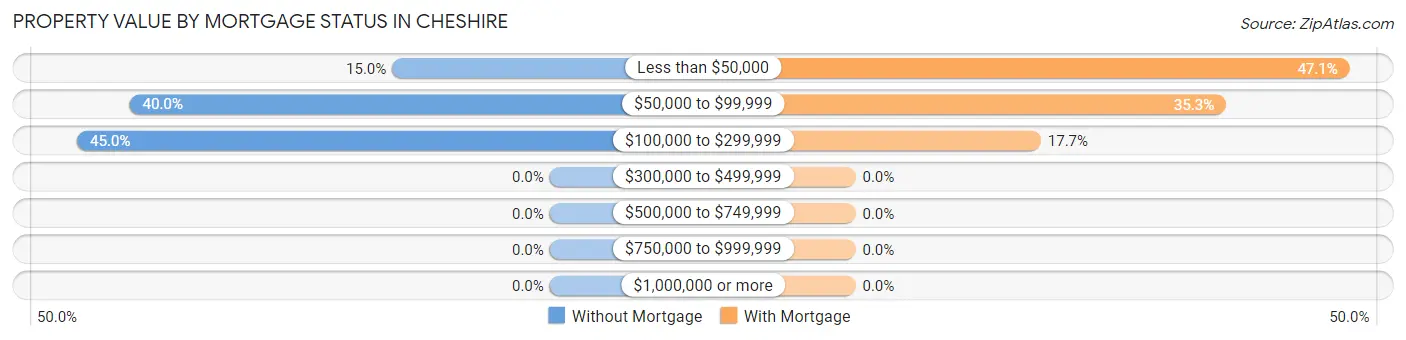
| Property Value | Without Mortgage | With Mortgage |
| Less than $50,000 | 3 (15.0%) | 8 (47.1%) |
| $50,000 to $99,999 | 8 (40.0%) | 6 (35.3%) |
| $100,000 to $299,999 | 9 (45.0%) | 3 (17.6%) |
| $300,000 to $499,999 | 0 (0.0%) | 0 (0.0%) |
| $500,000 to $749,999 | 0 (0.0%) | 0 (0.0%) |
| $750,000 to $999,999 | 0 (0.0%) | 0 (0.0%) |
| $1,000,000 or more | 0 (0.0%) | 0 (0.0%) |
| Total | 20 (100.0%) | 17 (100.0%) |
Household Income by Mortgage Status in Cheshire
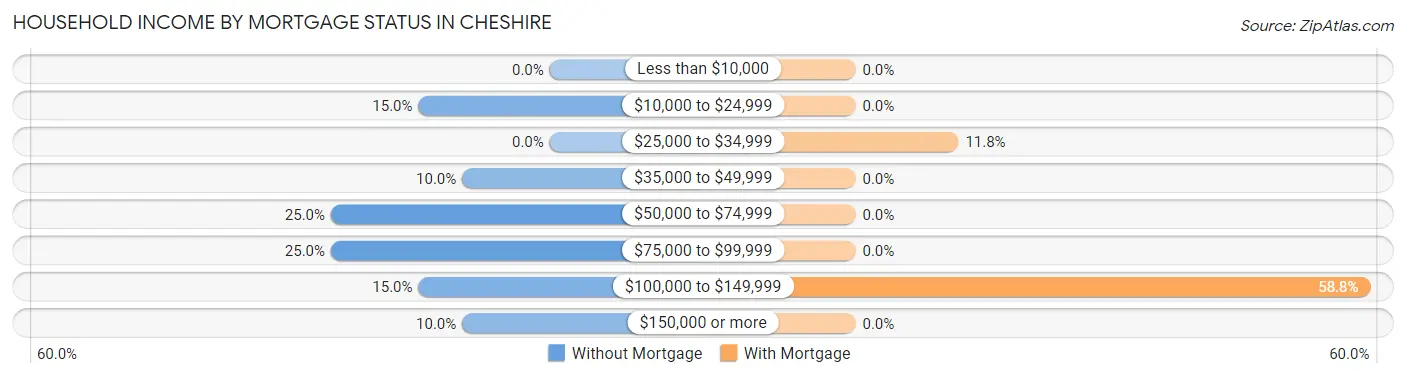
| Household Income | Without Mortgage | With Mortgage |
| Less than $10,000 | 0 (0.0%) | 0 (0.0%) |
| $10,000 to $24,999 | 3 (15.0%) | 0 (0.0%) |
| $25,000 to $34,999 | 0 (0.0%) | 2 (11.8%) |
| $35,000 to $49,999 | 2 (10.0%) | 0 (0.0%) |
| $50,000 to $74,999 | 5 (25.0%) | 0 (0.0%) |
| $75,000 to $99,999 | 5 (25.0%) | 0 (0.0%) |
| $100,000 to $149,999 | 3 (15.0%) | 10 (58.8%) |
| $150,000 or more | 2 (10.0%) | 0 (0.0%) |
| Total | 20 (100.0%) | 17 (100.0%) |
Property Value to Household Income Ratio in Cheshire
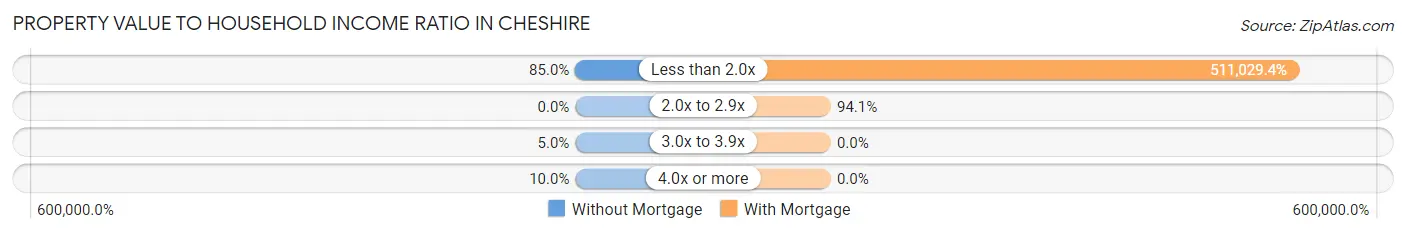
| Value-to-Income Ratio | Without Mortgage | With Mortgage |
| Less than 2.0x | 17 (85.0%) | 86,875 (511,029.4%) |
| 2.0x to 2.9x | 0 (0.0%) | 16 (94.1%) |
| 3.0x to 3.9x | 1 (5.0%) | 0 (0.0%) |
| 4.0x or more | 2 (10.0%) | 0 (0.0%) |
| Total | 20 (100.0%) | 17 (100.0%) |
Real Estate Taxes by Mortgage Status in Cheshire
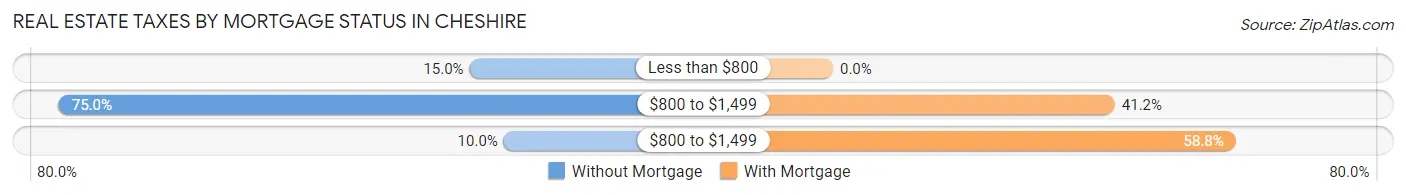
| Property Taxes | Without Mortgage | With Mortgage |
| Less than $800 | 3 (15.0%) | 0 (0.0%) |
| $800 to $1,499 | 15 (75.0%) | 7 (41.2%) |
| $800 to $1,499 | 2 (10.0%) | 10 (58.8%) |
| Total | 20 (100.0%) | 17 (100.0%) |
Health & Disability in Cheshire
Health Insurance Coverage by Age in Cheshire
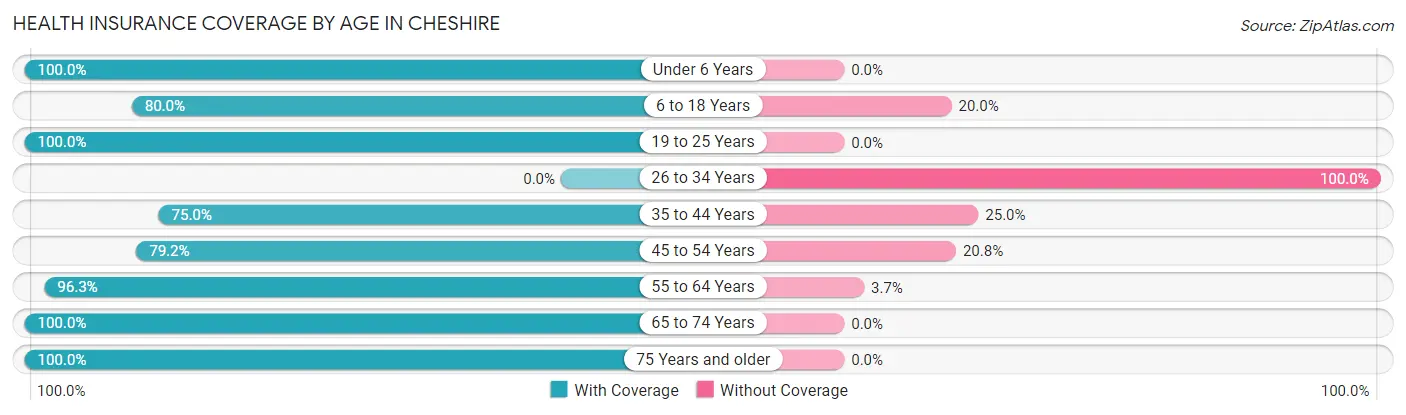
| Age Bracket | With Coverage | Without Coverage |
| Under 6 Years | 11 (100.0%) | 0 (0.0%) |
| 6 to 18 Years | 16 (80.0%) | 4 (20.0%) |
| 19 to 25 Years | 2 (100.0%) | 0 (0.0%) |
| 26 to 34 Years | 0 (0.0%) | 5 (100.0%) |
| 35 to 44 Years | 9 (75.0%) | 3 (25.0%) |
| 45 to 54 Years | 19 (79.2%) | 5 (20.8%) |
| 55 to 64 Years | 26 (96.3%) | 1 (3.7%) |
| 65 to 74 Years | 10 (100.0%) | 0 (0.0%) |
| 75 Years and older | 3 (100.0%) | 0 (0.0%) |
| Total | 96 (84.2%) | 18 (15.8%) |
Health Insurance Coverage by Citizenship Status in Cheshire
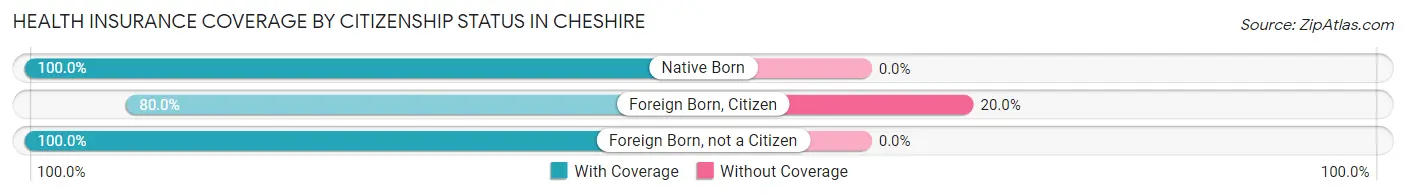
| Citizenship Status | With Coverage | Without Coverage |
| Native Born | 11 (100.0%) | 0 (0.0%) |
| Foreign Born, Citizen | 16 (80.0%) | 4 (20.0%) |
| Foreign Born, not a Citizen | 2 (100.0%) | 0 (0.0%) |
Health Insurance Coverage by Household Income in Cheshire
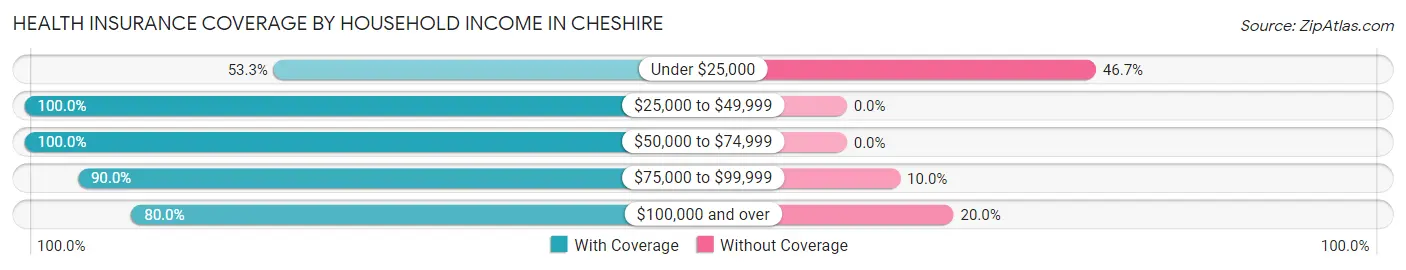
| Household Income | With Coverage | Without Coverage |
| Under $25,000 | 8 (53.3%) | 7 (46.7%) |
| $25,000 to $49,999 | 7 (100.0%) | 0 (0.0%) |
| $50,000 to $74,999 | 12 (100.0%) | 0 (0.0%) |
| $75,000 to $99,999 | 45 (90.0%) | 5 (10.0%) |
| $100,000 and over | 24 (80.0%) | 6 (20.0%) |
Public vs Private Health Insurance Coverage by Age in Cheshire
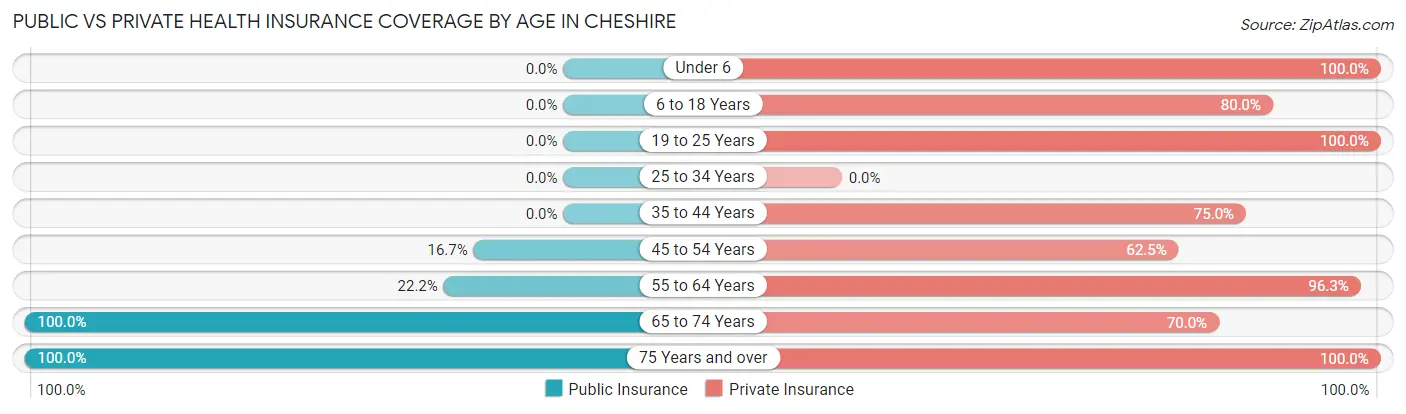
| Age Bracket | Public Insurance | Private Insurance |
| Under 6 | 0 (0.0%) | 11 (100.0%) |
| 6 to 18 Years | 0 (0.0%) | 16 (80.0%) |
| 19 to 25 Years | 0 (0.0%) | 2 (100.0%) |
| 25 to 34 Years | 0 (0.0%) | 0 (0.0%) |
| 35 to 44 Years | 0 (0.0%) | 9 (75.0%) |
| 45 to 54 Years | 4 (16.7%) | 15 (62.5%) |
| 55 to 64 Years | 6 (22.2%) | 26 (96.3%) |
| 65 to 74 Years | 10 (100.0%) | 7 (70.0%) |
| 75 Years and over | 3 (100.0%) | 3 (100.0%) |
| Total | 23 (20.2%) | 89 (78.1%) |
Disability Status by Sex by Age in Cheshire
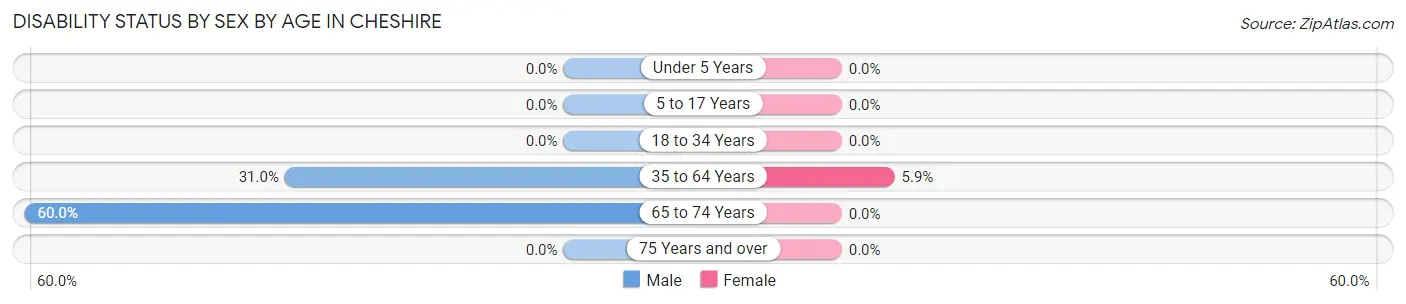
| Age Bracket | Male | Female |
| Under 5 Years | 0 (0.0%) | 0 (0.0%) |
| 5 to 17 Years | 0 (0.0%) | 0 (0.0%) |
| 18 to 34 Years | 0 (0.0%) | 0 (0.0%) |
| 35 to 64 Years | 9 (31.0%) | 2 (5.9%) |
| 65 to 74 Years | 3 (60.0%) | 0 (0.0%) |
| 75 Years and over | 0 (0.0%) | 0 (0.0%) |
Disability Class by Sex by Age in Cheshire
Disability Class: Hearing Difficulty
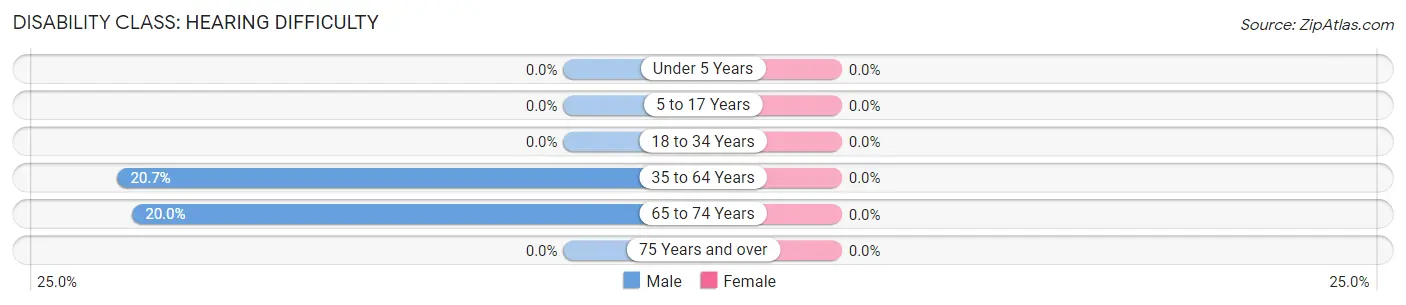
| Age Bracket | Male | Female |
| Under 5 Years | 0 (0.0%) | 0 (0.0%) |
| 5 to 17 Years | 0 (0.0%) | 0 (0.0%) |
| 18 to 34 Years | 0 (0.0%) | 0 (0.0%) |
| 35 to 64 Years | 6 (20.7%) | 0 (0.0%) |
| 65 to 74 Years | 1 (20.0%) | 0 (0.0%) |
| 75 Years and over | 0 (0.0%) | 0 (0.0%) |
Disability Class: Vision Difficulty
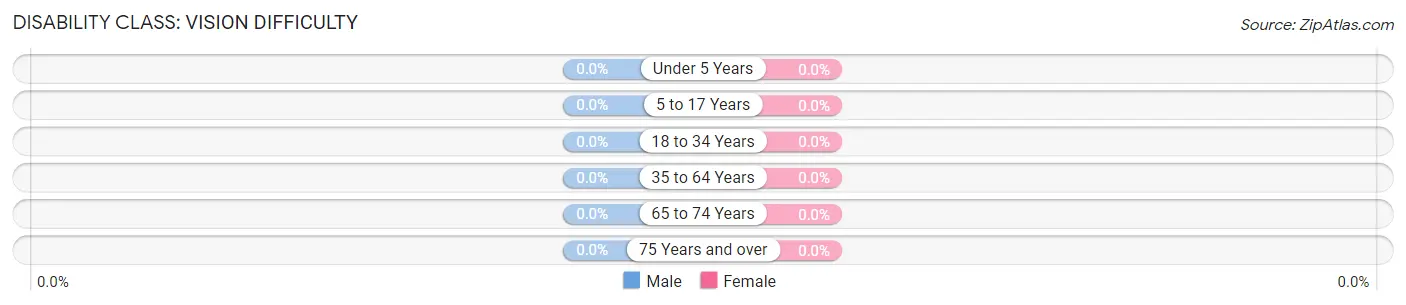
| Age Bracket | Male | Female |
| Under 5 Years | 0 (0.0%) | 0 (0.0%) |
| 5 to 17 Years | 0 (0.0%) | 0 (0.0%) |
| 18 to 34 Years | 0 (0.0%) | 0 (0.0%) |
| 35 to 64 Years | 0 (0.0%) | 0 (0.0%) |
| 65 to 74 Years | 0 (0.0%) | 0 (0.0%) |
| 75 Years and over | 0 (0.0%) | 0 (0.0%) |
Disability Class: Cognitive Difficulty
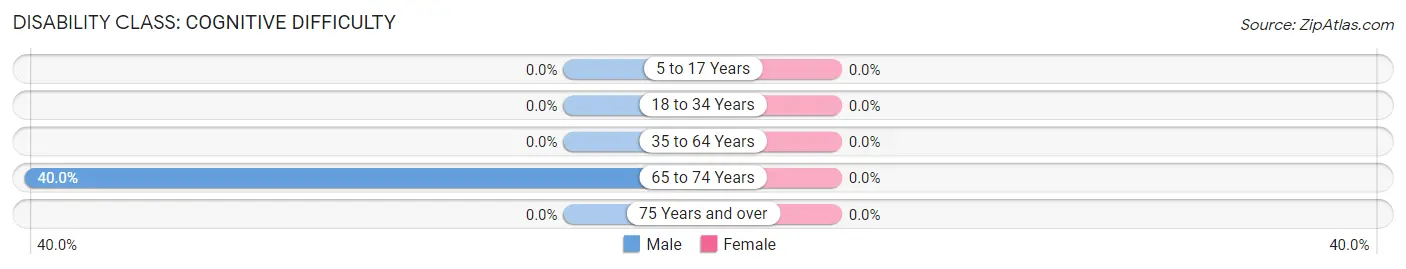
| Age Bracket | Male | Female |
| 5 to 17 Years | 0 (0.0%) | 0 (0.0%) |
| 18 to 34 Years | 0 (0.0%) | 0 (0.0%) |
| 35 to 64 Years | 0 (0.0%) | 0 (0.0%) |
| 65 to 74 Years | 2 (40.0%) | 0 (0.0%) |
| 75 Years and over | 0 (0.0%) | 0 (0.0%) |
Disability Class: Ambulatory Difficulty
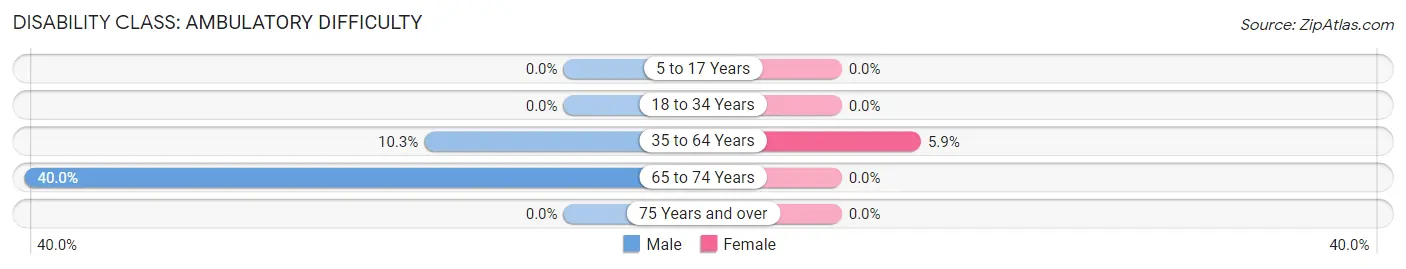
| Age Bracket | Male | Female |
| 5 to 17 Years | 0 (0.0%) | 0 (0.0%) |
| 18 to 34 Years | 0 (0.0%) | 0 (0.0%) |
| 35 to 64 Years | 3 (10.3%) | 2 (5.9%) |
| 65 to 74 Years | 2 (40.0%) | 0 (0.0%) |
| 75 Years and over | 0 (0.0%) | 0 (0.0%) |
Disability Class: Self-Care Difficulty
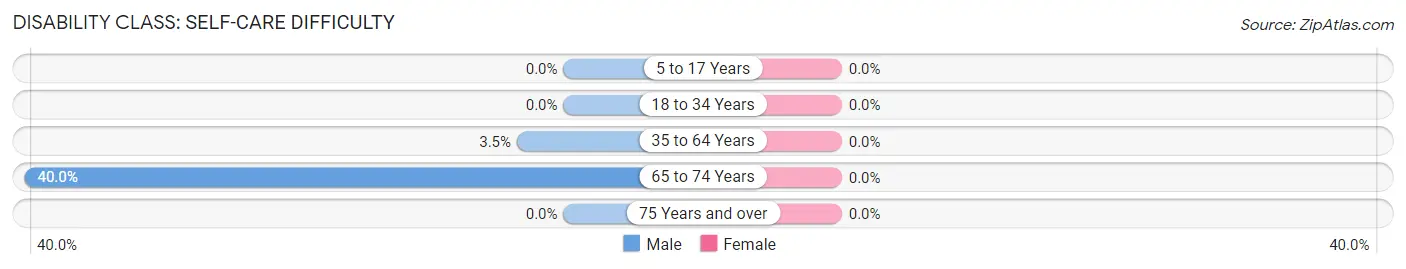
| Age Bracket | Male | Female |
| 5 to 17 Years | 0 (0.0%) | 0 (0.0%) |
| 18 to 34 Years | 0 (0.0%) | 0 (0.0%) |
| 35 to 64 Years | 1 (3.5%) | 0 (0.0%) |
| 65 to 74 Years | 2 (40.0%) | 0 (0.0%) |
| 75 Years and over | 0 (0.0%) | 0 (0.0%) |
Technology Access in Cheshire
Computing Device Access in Cheshire
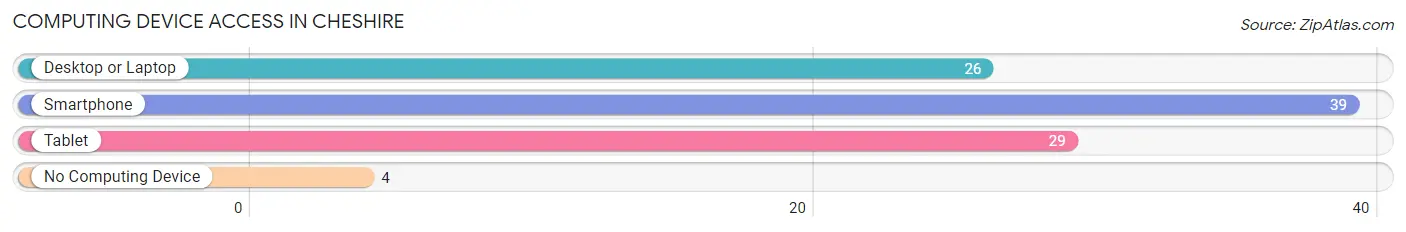
| Device Type | # Households | % Households |
| Desktop or Laptop | 26 | 57.8% |
| Smartphone | 39 | 86.7% |
| Tablet | 29 | 64.4% |
| No Computing Device | 4 | 8.9% |
| Total | 45 | 100.0% |
Internet Access in Cheshire
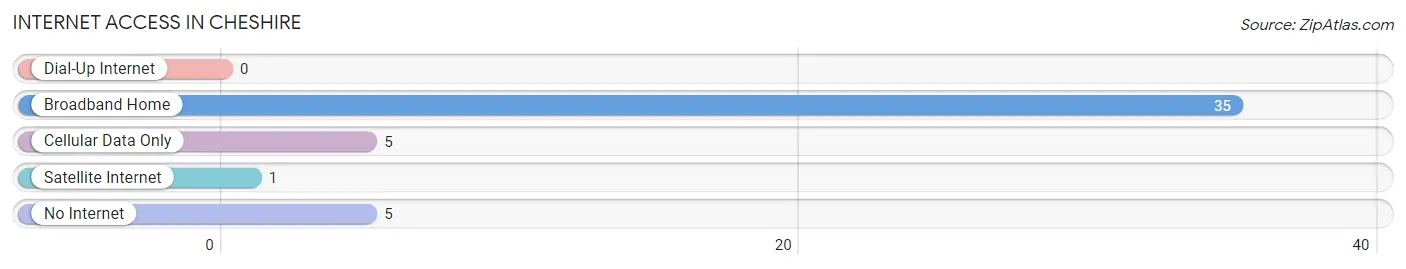
| Internet Type | # Households | % Households |
| Dial-Up Internet | 0 | 0.0% |
| Broadband Home | 35 | 77.8% |
| Cellular Data Only | 5 | 11.1% |
| Satellite Internet | 1 | 2.2% |
| No Internet | 5 | 11.1% |
| Total | 45 | 100.0% |
Cheshire Summary
Cheshire, Ohio is a small village located in Gallia County in the southeastern part of the state. It is situated on the Ohio River, about 25 miles south of the city of Portsmouth. The village has a population of approximately 1,000 people and is part of the Point Pleasant Micropolitan Statistical Area.
History
Cheshire was founded in 1817 by a group of settlers from Pennsylvania. The village was named after the English county of Cheshire, which was the home of many of the settlers. The village was incorporated in 1837 and has remained a small, rural community ever since.
The village was an important stop on the Underground Railroad, with many of the local residents helping to hide and transport escaped slaves. During the Civil War, the village was the site of a skirmish between Union and Confederate forces.
Geography
Cheshire is located in the Appalachian Plateau region of Ohio. The village is situated on the Ohio River, about 25 miles south of the city of Portsmouth. The village is surrounded by rolling hills and forests, and is home to several small creeks and streams.
The climate in Cheshire is humid continental, with hot summers and cold winters. The average annual temperature is around 50 degrees Fahrenheit, and the average annual precipitation is around 40 inches.
Economy
The economy of Cheshire is largely based on agriculture and tourism. The village is home to several small farms, which produce a variety of crops, including corn, soybeans, and hay. The village also has several small businesses, including a grocery store, a hardware store, and a few restaurants.
Tourism is an important part of the local economy, with many visitors coming to the village to enjoy the scenic beauty of the Ohio River and the surrounding hills and forests. The village is also home to several historic sites, including the Cheshire Covered Bridge, which was built in 1875.
Demographics
As of the 2010 census, the population of Cheshire was 1,000 people. The racial makeup of the village was 97.2% White, 0.7% African American, 0.3% Native American, 0.2% Asian, and 1.6% from other races. The median household income was $37,500, and the median family income was $45,000.
The village is served by the Gallia County School District, which includes two elementary schools, one middle school, and one high school. The village is also home to a branch of the Gallia County Public Library.
Cheshire is a small, rural village with a rich history and a strong sense of community. The village is home to a variety of businesses and attractions, and is a popular destination for tourists looking to enjoy the beauty of the Ohio River and the surrounding hills and forests.
Common Questions
What is Per Capita Income in Cheshire?
Per Capita income in Cheshire is $45,346.
What is the Median Family Income in Cheshire?
Median Family Income in Cheshire is $76,250.
What is the Median Household income in Cheshire?
Median Household Income in Cheshire is $85,208.
What is Income or Wage Gap in Cheshire?
Income or Wage Gap in Cheshire is 59.0%.
Women in Cheshire earn 41.0 cents for every dollar earned by a man.
What is Inequality or Gini Index in Cheshire?
Inequality or Gini Index in Cheshire is 0.49.
What is the Total Population of Cheshire?
Total Population of Cheshire is 114.
What is the Total Male Population of Cheshire?
Total Male Population of Cheshire is 64.
What is the Total Female Population of Cheshire?
Total Female Population of Cheshire is 50.
What is the Ratio of Males per 100 Females in Cheshire?
There are 128.00 Males per 100 Females in Cheshire.
What is the Ratio of Females per 100 Males in Cheshire?
There are 78.12 Females per 100 Males in Cheshire.
What is the Median Population Age in Cheshire?
Median Population Age in Cheshire is 52.0 Years.
What is the Average Family Size in Cheshire
Average Family Size in Cheshire is 3.1 People.
What is the Average Household Size in Cheshire
Average Household Size in Cheshire is 2.5 People.
How Large is the Labor Force in Cheshire?
There are 54 People in the Labor Forcein in Cheshire.
What is the Percentage of People in the Labor Force in Cheshire?
60.7% of People are in the Labor Force in Cheshire.