Dillonvale, OH Map & Demographics
Dillonvale Map
Dillonvale Overview
$27,499
PER CAPITA INCOME
$52,500
AVG FAMILY INCOME
$37,292
AVG HOUSEHOLD INCOME
22.0%
WAGE / INCOME GAP [ % ]
78.0¢/ $1
WAGE / INCOME GAP [ $ ]
0.48
INEQUALITY / GINI INDEX
639
TOTAL POPULATION
348
MALE POPULATION
291
FEMALE POPULATION
119.59
MALES / 100 FEMALES
83.62
FEMALES / 100 MALES
57.0
MEDIAN AGE
3.2
AVG FAMILY SIZE
2.2
AVG HOUSEHOLD SIZE
280
LABOR FORCE [ PEOPLE ]
49.6%
PERCENT IN LABOR FORCE
8.2%
UNEMPLOYMENT RATE
Dillonvale Zip Codes
Dillonvale Area Codes
Income in Dillonvale
Income Overview in Dillonvale
Per Capita Income in Dillonvale is $27,499, while median incomes of families and households are $52,500 and $37,292 respectively.
| Characteristic | Number | Measure |
| Per Capita Income | 639 | $27,499 |
| Median Family Income | 148 | $52,500 |
| Mean Family Income | 148 | $65,732 |
| Median Household Income | 291 | $37,292 |
| Mean Household Income | 291 | $51,382 |
| Income Deficit | 148 | $0 |
| Wage / Income Gap (%) | 639 | 22.02% |
| Wage / Income Gap ($) | 639 | 77.98¢ per $1 |
| Gini / Inequality Index | 639 | 0.48 |
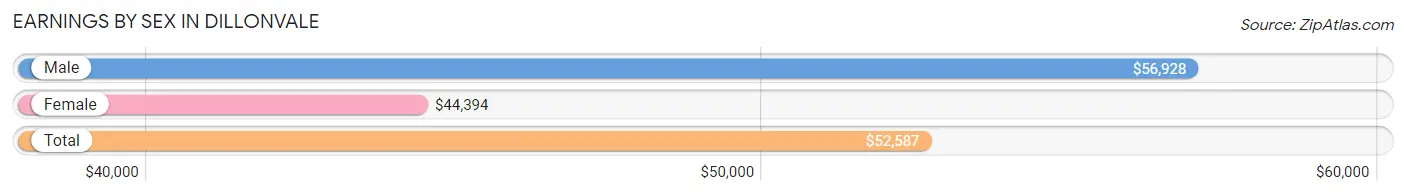
Earnings by Sex in Dillonvale
Average Earnings in Dillonvale are $52,587, $56,928 for men and $44,394 for women, a difference of 22.0%.
| Sex | Number | Average Earnings |
| Male | 197 (63.7%) | $56,928 |
| Female | 112 (36.2%) | $44,394 |
| Total | 309 (100.0%) | $52,587 |
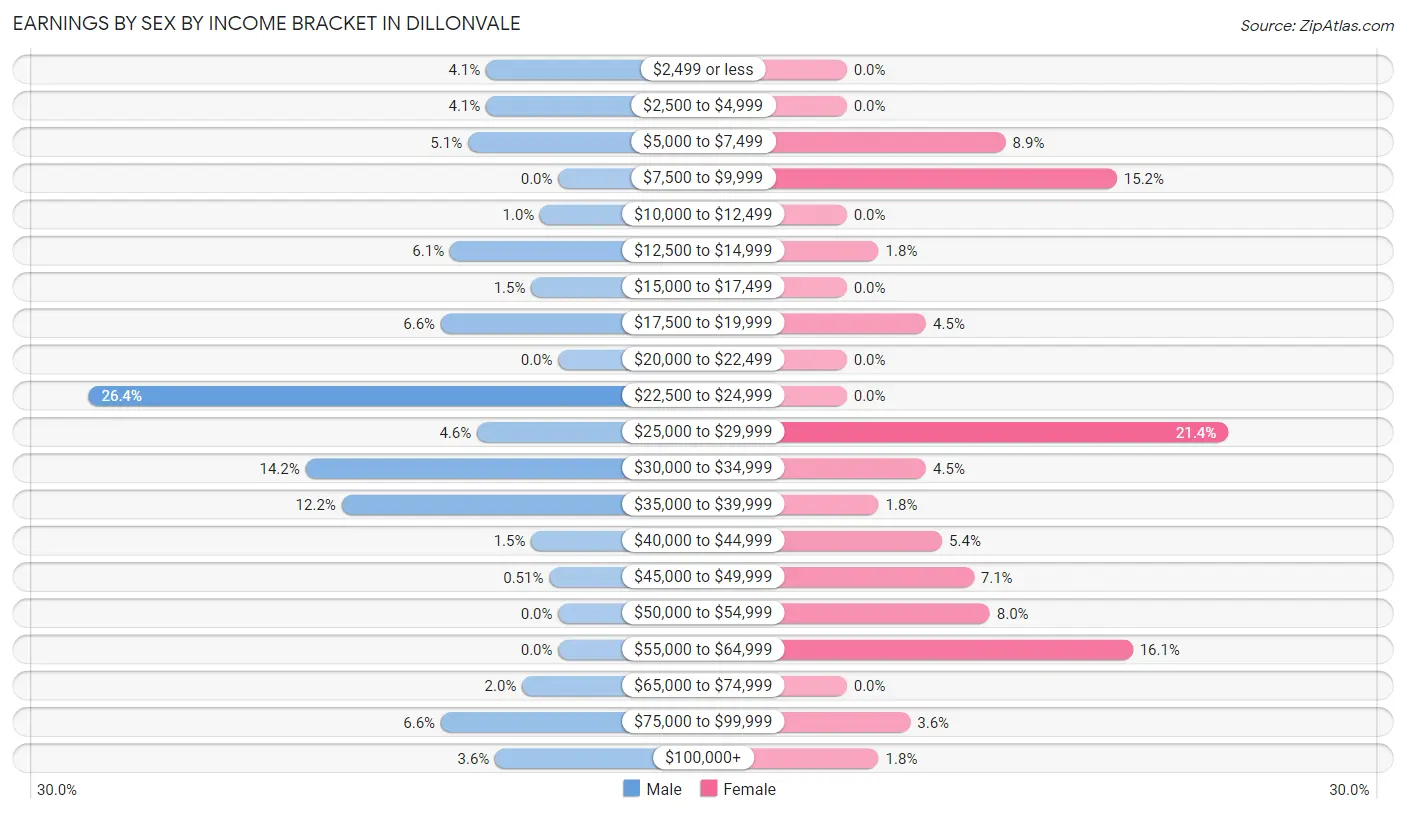
Earnings by Sex by Income Bracket in Dillonvale
The most common earnings brackets in Dillonvale are $22,500 to $24,999 for men (52 | 26.4%) and $25,000 to $29,999 for women (24 | 21.4%).
| Income | Male | Female |
| $2,499 or less | 8 (4.1%) | 0 (0.0%) |
| $2,500 to $4,999 | 8 (4.1%) | 0 (0.0%) |
| $5,000 to $7,499 | 10 (5.1%) | 10 (8.9%) |
| $7,500 to $9,999 | 0 (0.0%) | 17 (15.2%) |
| $10,000 to $12,499 | 2 (1.0%) | 0 (0.0%) |
| $12,500 to $14,999 | 12 (6.1%) | 2 (1.8%) |
| $15,000 to $17,499 | 3 (1.5%) | 0 (0.0%) |
| $17,500 to $19,999 | 13 (6.6%) | 5 (4.5%) |
| $20,000 to $22,499 | 0 (0.0%) | 0 (0.0%) |
| $22,500 to $24,999 | 52 (26.4%) | 0 (0.0%) |
| $25,000 to $29,999 | 9 (4.6%) | 24 (21.4%) |
| $30,000 to $34,999 | 28 (14.2%) | 5 (4.5%) |
| $35,000 to $39,999 | 24 (12.2%) | 2 (1.8%) |
| $40,000 to $44,999 | 3 (1.5%) | 6 (5.4%) |
| $45,000 to $49,999 | 1 (0.5%) | 8 (7.1%) |
| $50,000 to $54,999 | 0 (0.0%) | 9 (8.0%) |
| $55,000 to $64,999 | 0 (0.0%) | 18 (16.1%) |
| $65,000 to $74,999 | 4 (2.0%) | 0 (0.0%) |
| $75,000 to $99,999 | 13 (6.6%) | 4 (3.6%) |
| $100,000+ | 7 (3.5%) | 2 (1.8%) |
| Total | 197 (100.0%) | 112 (100.0%) |
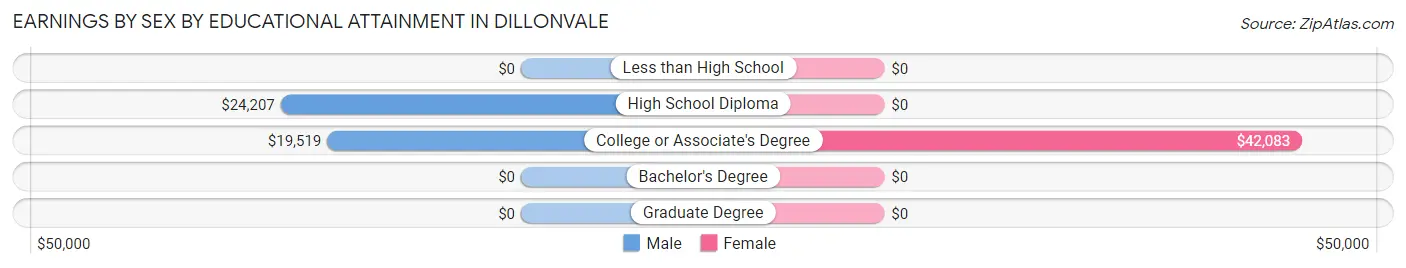
Earnings by Sex by Educational Attainment in Dillonvale
Average earnings in Dillonvale are $24,856 for men and $29,808 for women, a difference of 16.6%. Men with an educational attainment of high school diploma enjoy the highest average annual earnings of $24,207, while those with college or associate's degree education earn the least with $19,519. Women with an educational attainment of college or associate's degree earn the most with the average annual earnings of $42,083, while those with college or associate's degree education have the smallest earnings of $42,083.
| Educational Attainment | Male Income | Female Income |
| Less than High School | - | - |
| High School Diploma | $24,207 | $0 |
| College or Associate's Degree | $19,519 | $42,083 |
| Bachelor's Degree | - | - |
| Graduate Degree | - | - |
| Total | $24,856 | $29,808 |
Family Income in Dillonvale
Family Income Brackets in Dillonvale
According to the Dillonvale family income data, there are 48 families falling into the $75,000 to $99,999 income range, which is the most common income bracket and makes up 32.4% of all families.
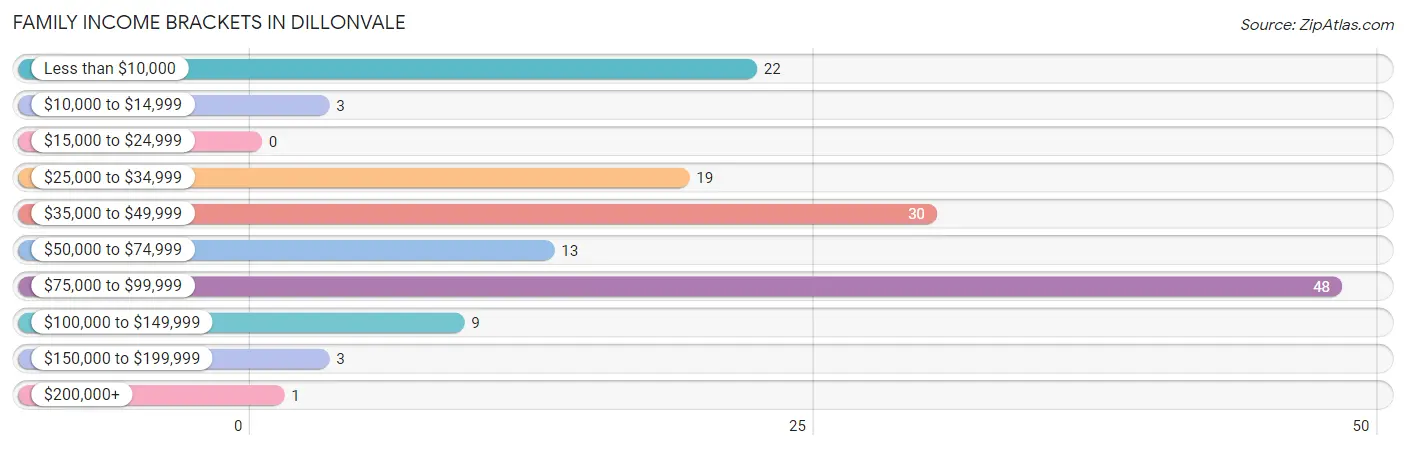
| Income Bracket | # Families | % Families |
| Less than $10,000 | 22 | 14.9% |
| $10,000 to $14,999 | 3 | 2.0% |
| $15,000 to $24,999 | 0 | 0.0% |
| $25,000 to $34,999 | 19 | 12.8% |
| $35,000 to $49,999 | 30 | 20.3% |
| $50,000 to $74,999 | 13 | 8.8% |
| $75,000 to $99,999 | 48 | 32.4% |
| $100,000 to $149,999 | 9 | 6.1% |
| $150,000 to $199,999 | 3 | 2.0% |
| $200,000+ | 1 | 0.7% |
Family Income by Famaliy Size in Dillonvale
3-person families (83 | 56.1%) account for the highest median family income in Dillonvale with $75,580 per family, while 3-person families (83 | 56.1%) have the highest median income of $25,193 per family member.
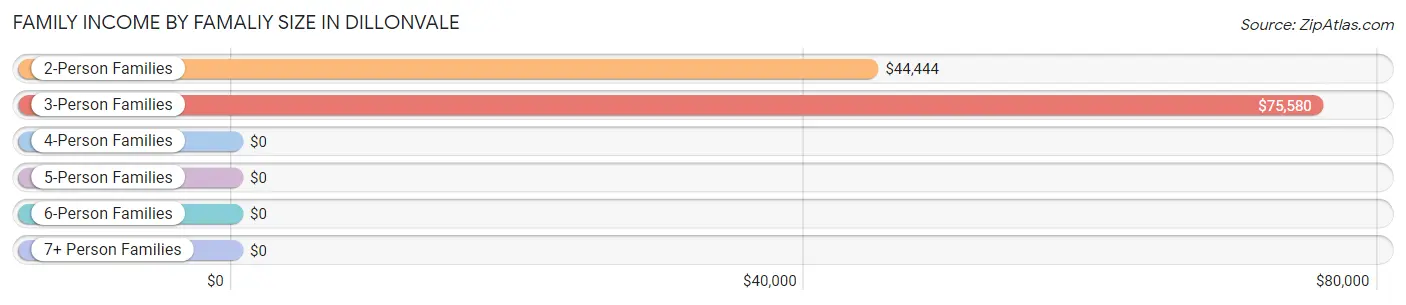
| Income Bracket | # Families | Median Income |
| 2-Person Families | 58 (39.2%) | $44,444 |
| 3-Person Families | 83 (56.1%) | $75,580 |
| 4-Person Families | 5 (3.4%) | $0 |
| 5-Person Families | 0 (0.0%) | $0 |
| 6-Person Families | 2 (1.3%) | $0 |
| 7+ Person Families | 0 (0.0%) | $0 |
| Total | 148 (100.0%) | $52,500 |
Family Income by Number of Earners in Dillonvale
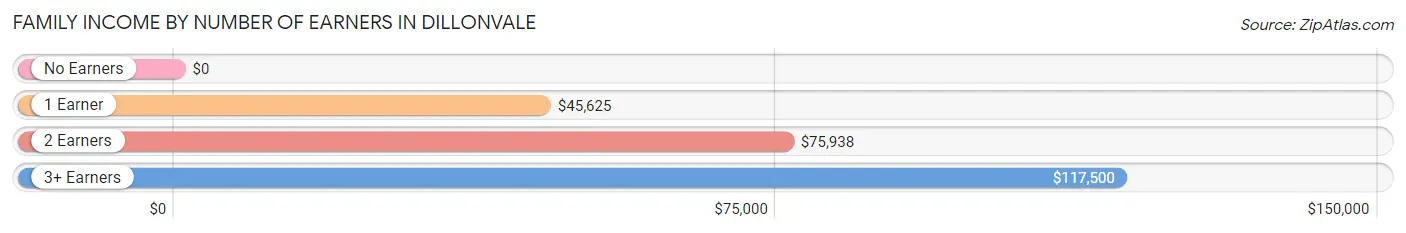
| Number of Earners | # Families | Median Income |
| No Earners | 25 (16.9%) | $0 |
| 1 Earner | 42 (28.4%) | $45,625 |
| 2 Earners | 71 (48.0%) | $75,938 |
| 3+ Earners | 10 (6.8%) | $117,500 |
| Total | 148 (100.0%) | $52,500 |
Household Income in Dillonvale
Household Income Brackets in Dillonvale
With 61 households falling in the category, the $75,000 to $99,999 income range is the most frequent in Dillonvale, accounting for 21.0% of all households. In contrast, only 1 households (0.3%) fall into the $200,000+ income bracket, making it the least populous group.
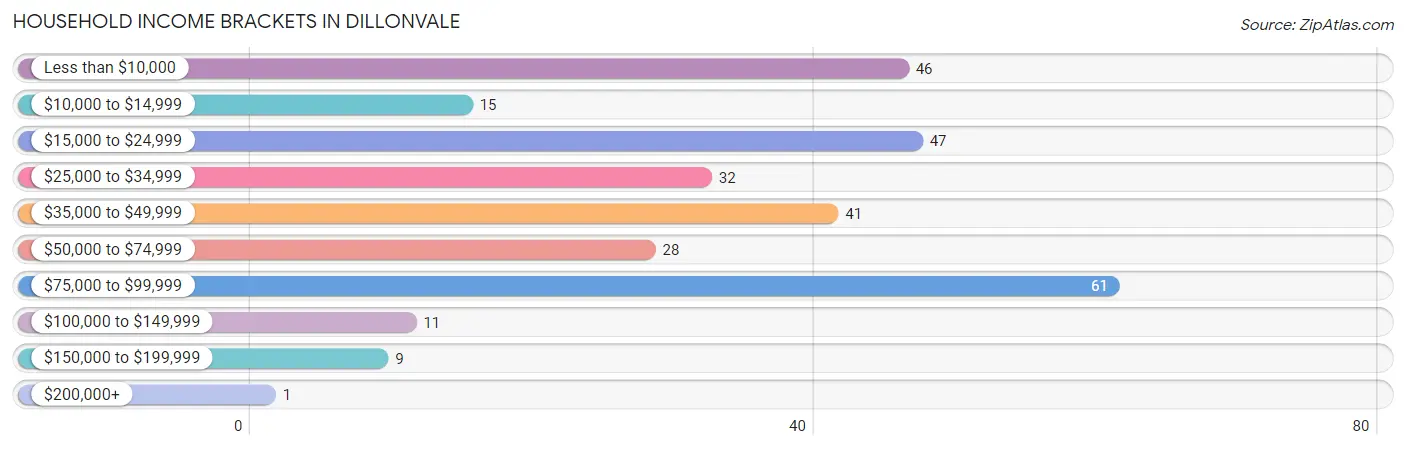
| Income Bracket | # Households | % Households |
| Less than $10,000 | 46 | 15.8% |
| $10,000 to $14,999 | 15 | 5.2% |
| $15,000 to $24,999 | 47 | 16.2% |
| $25,000 to $34,999 | 32 | 11.0% |
| $35,000 to $49,999 | 41 | 14.1% |
| $50,000 to $74,999 | 28 | 9.6% |
| $75,000 to $99,999 | 61 | 21.0% |
| $100,000 to $149,999 | 11 | 3.8% |
| $150,000 to $199,999 | 9 | 3.1% |
| $200,000+ | 1 | 0.3% |
Household Income by Householder Age in Dillonvale
The median household income in Dillonvale is $37,292, with the highest median household income of $62,188 found in the 45 to 64 years age bracket for the primary householder. A total of 107 households (36.8%) fall into this category.
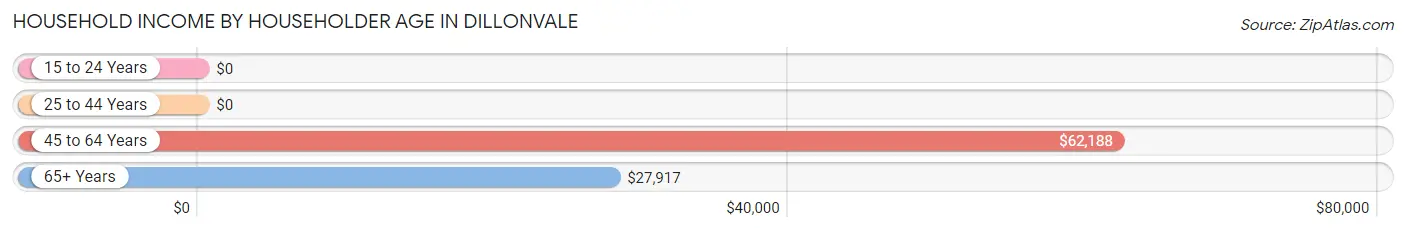
| Income Bracket | # Households | Median Income |
| 15 to 24 Years | 0 (0.0%) | $0 |
| 25 to 44 Years | 83 (28.5%) | $0 |
| 45 to 64 Years | 107 (36.8%) | $62,188 |
| 65+ Years | 101 (34.7%) | $27,917 |
| Total | 291 (100.0%) | $37,292 |
Poverty in Dillonvale
Income Below Poverty by Sex and Age in Dillonvale
With 14.9% poverty level for males and 29.2% for females among the residents of Dillonvale, 5 year old males and 5 year old females are the most vulnerable to poverty, with 8 males (100.0%) and 14 females (100.0%) in their respective age groups living below the poverty level.
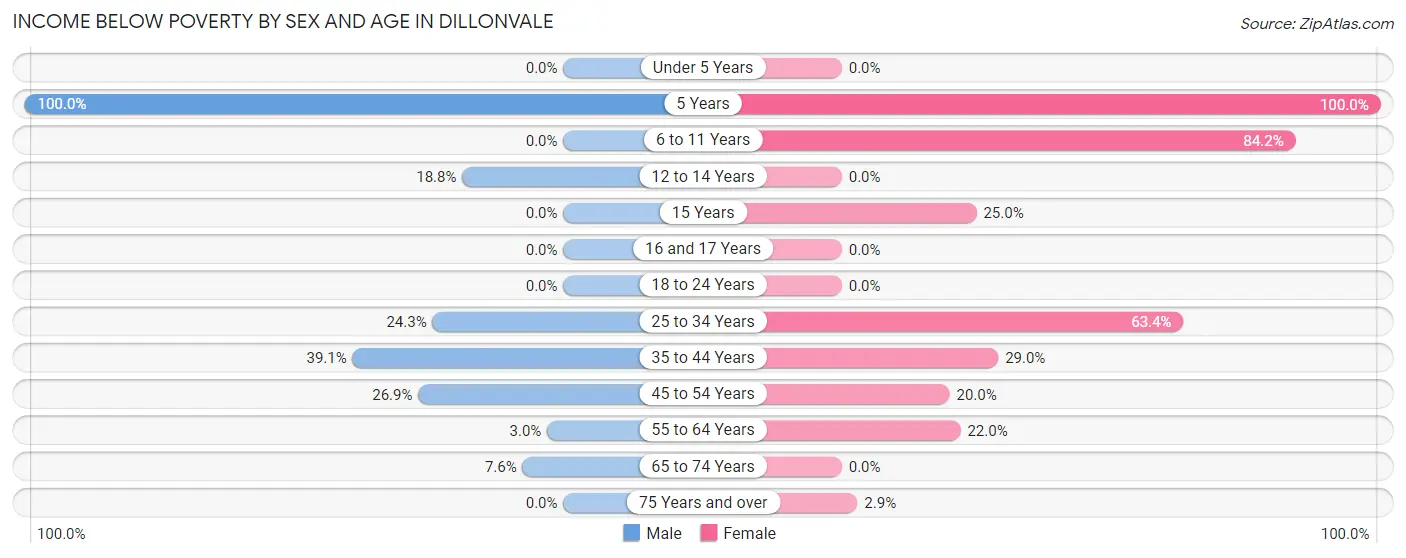
| Age Bracket | Male | Female |
| Under 5 Years | 0 (0.0%) | 0 (0.0%) |
| 5 Years | 8 (100.0%) | 14 (100.0%) |
| 6 to 11 Years | 0 (0.0%) | 16 (84.2%) |
| 12 to 14 Years | 3 (18.8%) | 0 (0.0%) |
| 15 Years | 0 (0.0%) | 2 (25.0%) |
| 16 and 17 Years | 0 (0.0%) | 0 (0.0%) |
| 18 to 24 Years | 0 (0.0%) | 0 (0.0%) |
| 25 to 34 Years | 17 (24.3%) | 26 (63.4%) |
| 35 to 44 Years | 9 (39.1%) | 9 (29.0%) |
| 45 to 54 Years | 7 (26.9%) | 3 (20.0%) |
| 55 to 64 Years | 3 (3.0%) | 13 (22.0%) |
| 65 to 74 Years | 5 (7.6%) | 0 (0.0%) |
| 75 Years and over | 0 (0.0%) | 2 (2.9%) |
| Total | 52 (14.9%) | 85 (29.2%) |
Income Above Poverty by Sex and Age in Dillonvale
According to the poverty statistics in Dillonvale, males aged under 5 years and females aged 18 to 24 years are the age groups that are most secure financially, with 100.0% of males and 100.0% of females in these age groups living above the poverty line.
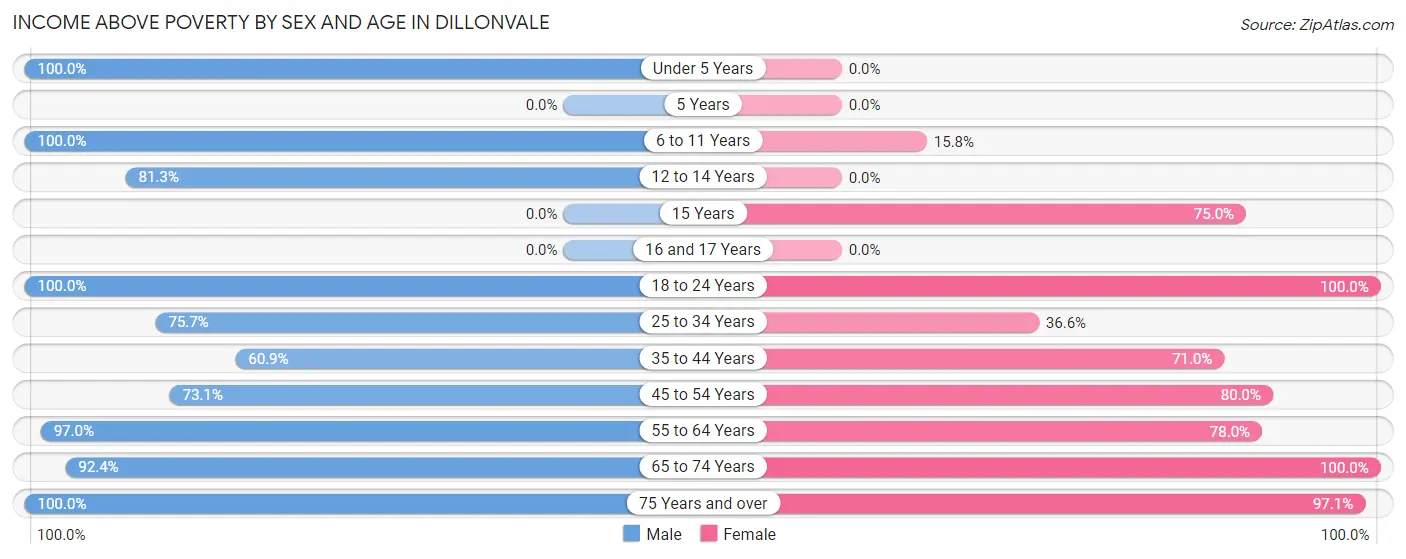
| Age Bracket | Male | Female |
| Under 5 Years | 3 (100.0%) | 0 (0.0%) |
| 5 Years | 0 (0.0%) | 0 (0.0%) |
| 6 to 11 Years | 7 (100.0%) | 3 (15.8%) |
| 12 to 14 Years | 13 (81.2%) | 0 (0.0%) |
| 15 Years | 0 (0.0%) | 6 (75.0%) |
| 16 and 17 Years | 0 (0.0%) | 0 (0.0%) |
| 18 to 24 Years | 15 (100.0%) | 2 (100.0%) |
| 25 to 34 Years | 53 (75.7%) | 15 (36.6%) |
| 35 to 44 Years | 14 (60.9%) | 22 (71.0%) |
| 45 to 54 Years | 19 (73.1%) | 12 (80.0%) |
| 55 to 64 Years | 97 (97.0%) | 46 (78.0%) |
| 65 to 74 Years | 61 (92.4%) | 33 (100.0%) |
| 75 Years and over | 14 (100.0%) | 67 (97.1%) |
| Total | 296 (85.1%) | 206 (70.8%) |
Income Below Poverty Among Married-Couple Families in Dillonvale
The poverty statistics for married-couple families in Dillonvale show that 4.9% or 3 of the total 61 families live below the poverty line. Families with 1 or 2 children have the highest poverty rate of 16.7%, comprising of 3 families. On the other hand, families with no children have the lowest poverty rate of 0.0%, which includes 0 families.
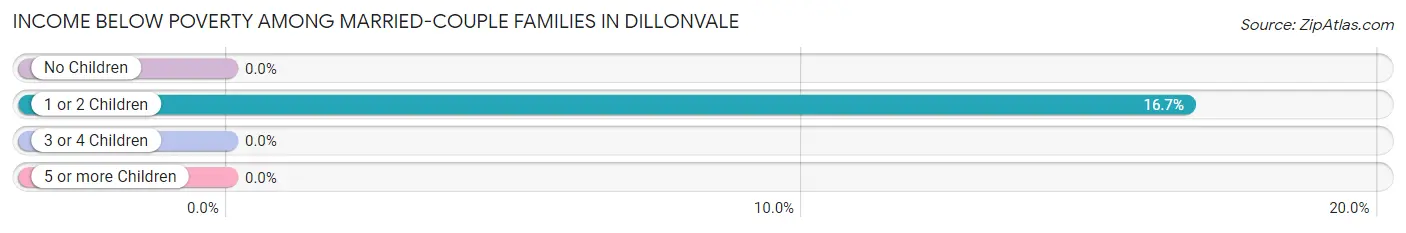
| Children | Above Poverty | Below Poverty |
| No Children | 43 (100.0%) | 0 (0.0%) |
| 1 or 2 Children | 15 (83.3%) | 3 (16.7%) |
| 3 or 4 Children | 0 (0.0%) | 0 (0.0%) |
| 5 or more Children | 0 (0.0%) | 0 (0.0%) |
| Total | 58 (95.1%) | 3 (4.9%) |
Income Below Poverty Among Single-Parent Households in Dillonvale
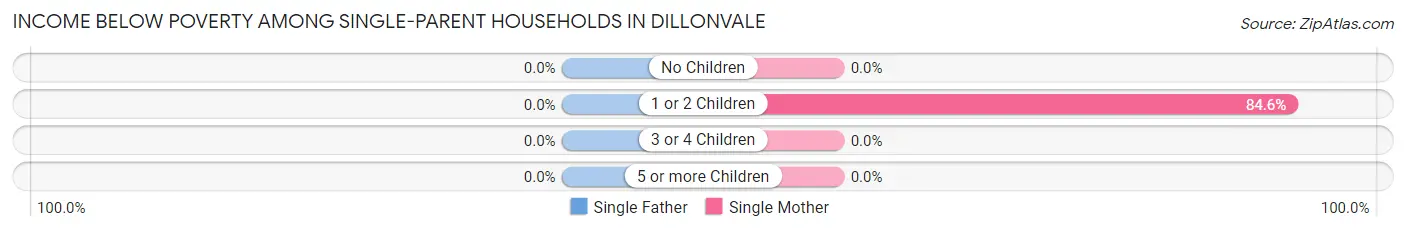
| Children | Single Father | Single Mother |
| No Children | 0 (0.0%) | 0 (0.0%) |
| 1 or 2 Children | 0 (0.0%) | 22 (84.6%) |
| 3 or 4 Children | 0 (0.0%) | 0 (0.0%) |
| 5 or more Children | 0 (0.0%) | 0 (0.0%) |
| Total | 0 (0.0%) | 22 (47.8%) |
Income Below Poverty Among Married-Couple vs Single-Parent Households in Dillonvale
The poverty data for Dillonvale shows that 3 of the married-couple family households (4.9%) and 22 of the single-parent households (25.3%) are living below the poverty level. Within the married-couple family households, those with 1 or 2 children have the highest poverty rate, with 3 households (16.7%) falling below the poverty line. Among the single-parent households, those with 1 or 2 children have the highest poverty rate, with 22 household (73.3%) living below poverty.
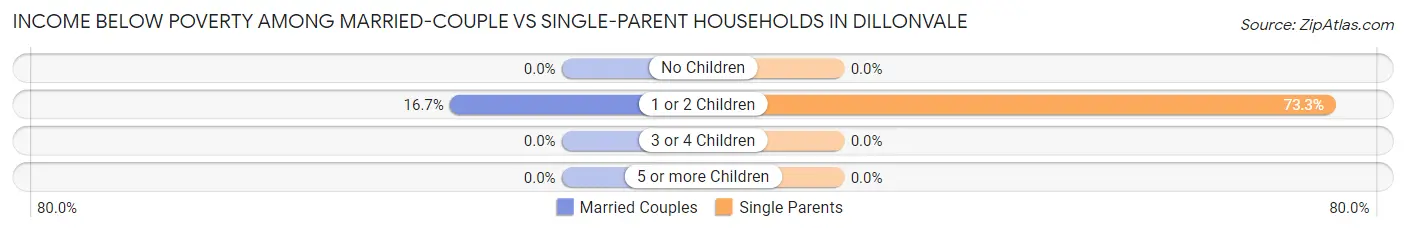
| Children | Married-Couple Families | Single-Parent Households |
| No Children | 0 (0.0%) | 0 (0.0%) |
| 1 or 2 Children | 3 (16.7%) | 22 (73.3%) |
| 3 or 4 Children | 0 (0.0%) | 0 (0.0%) |
| 5 or more Children | 0 (0.0%) | 0 (0.0%) |
| Total | 3 (4.9%) | 22 (25.3%) |
Race in Dillonvale
The most populous races in Dillonvale are White / Caucasian (630 | 98.6%), Two or more Races (7 | 1.1%), and Hispanic or Latino (3 | 0.5%).
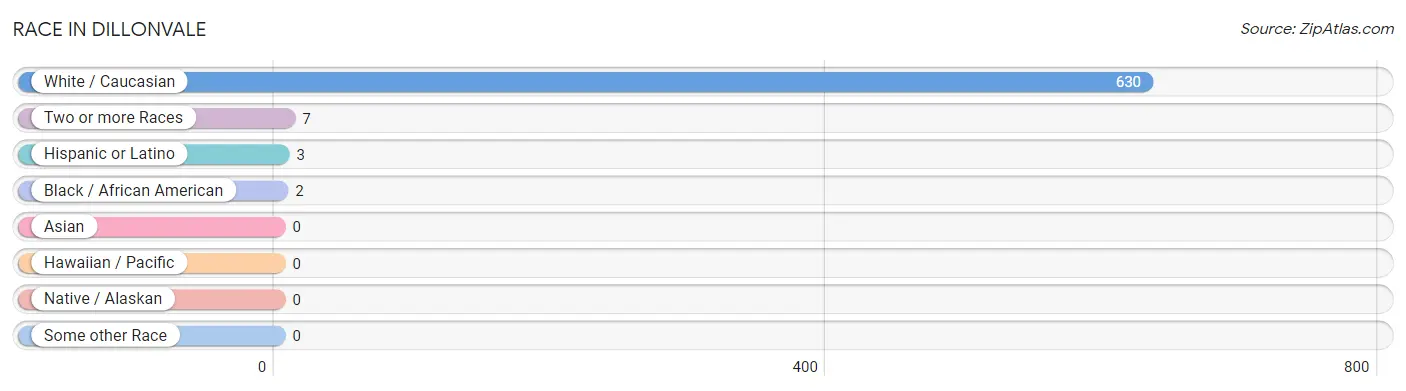
| Race | # Population | % Population |
| Asian | 0 | 0.0% |
| Black / African American | 2 | 0.3% |
| Hawaiian / Pacific | 0 | 0.0% |
| Hispanic or Latino | 3 | 0.5% |
| Native / Alaskan | 0 | 0.0% |
| White / Caucasian | 630 | 98.6% |
| Two or more Races | 7 | 1.1% |
| Some other Race | 0 | 0.0% |
| Total | 639 | 100.0% |
Ancestry in Dillonvale
The most populous ancestries reported in Dillonvale are German (108 | 16.9%), Polish (87 | 13.6%), Irish (75 | 11.7%), English (72 | 11.3%), and Hungarian (59 | 9.2%), together accounting for 62.8% of all Dillonvale residents.
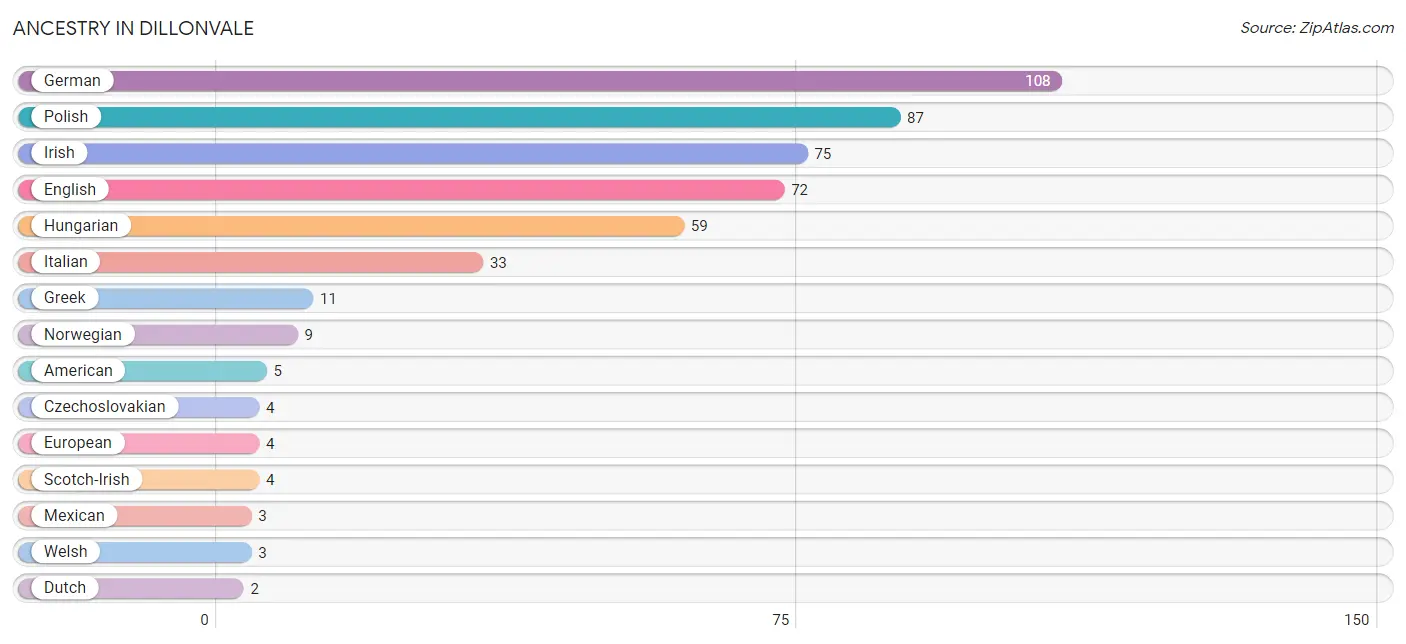
| Ancestry | # Population | % Population |
| American | 5 | 0.8% |
| Czechoslovakian | 4 | 0.6% |
| Dutch | 2 | 0.3% |
| English | 72 | 11.3% |
| European | 4 | 0.6% |
| French | 2 | 0.3% |
| German | 108 | 16.9% |
| Ghanaian | 2 | 0.3% |
| Greek | 11 | 1.7% |
| Hungarian | 59 | 9.2% |
| Irish | 75 | 11.7% |
| Italian | 33 | 5.2% |
| Mexican | 3 | 0.5% |
| Norwegian | 9 | 1.4% |
| Polish | 87 | 13.6% |
| Scotch-Irish | 4 | 0.6% |
| Subsaharan African | 2 | 0.3% |
| Swedish | 2 | 0.3% |
| Welsh | 3 | 0.5% | View All 19 Rows |
Immigrants in Dillonvale
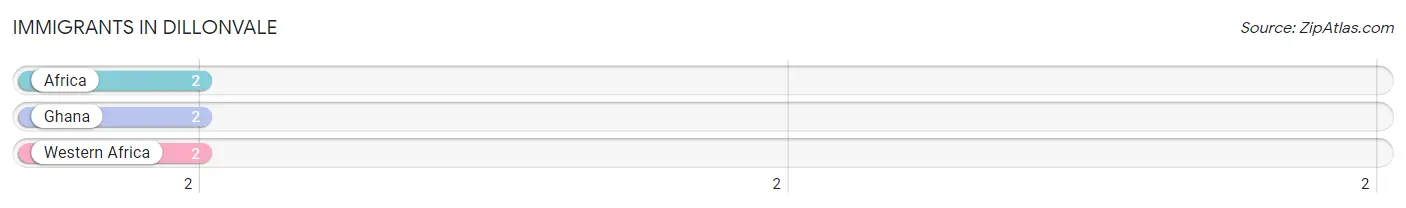
The most numerous immigrant groups reported in Dillonvale came from Africa (2 | 0.3%), Ghana (2 | 0.3%), and Western Africa (2 | 0.3%), together accounting for 0.9% of all Dillonvale residents.
| Immigration Origin | # Population | % Population |
| Africa | 2 | 0.3% |
| Ghana | 2 | 0.3% |
| Western Africa | 2 | 0.3% | View All 3 Rows |
Sex and Age in Dillonvale
Sex and Age in Dillonvale
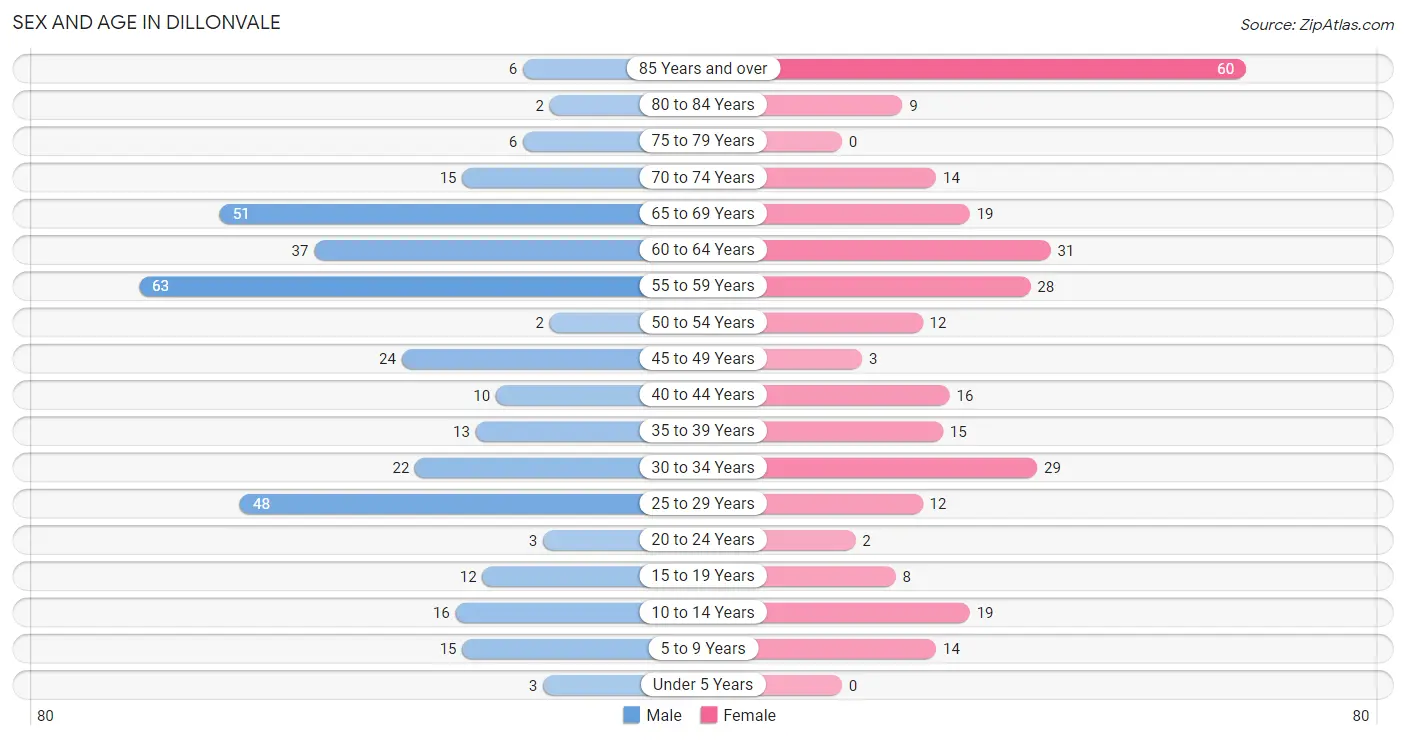
The most populous age groups in Dillonvale are 55 to 59 Years (63 | 18.1%) for men and 85 Years and over (60 | 20.6%) for women.
| Age Bracket | Male | Female |
| Under 5 Years | 3 (0.9%) | 0 (0.0%) |
| 5 to 9 Years | 15 (4.3%) | 14 (4.8%) |
| 10 to 14 Years | 16 (4.6%) | 19 (6.5%) |
| 15 to 19 Years | 12 (3.5%) | 8 (2.8%) |
| 20 to 24 Years | 3 (0.9%) | 2 (0.7%) |
| 25 to 29 Years | 48 (13.8%) | 12 (4.1%) |
| 30 to 34 Years | 22 (6.3%) | 29 (10.0%) |
| 35 to 39 Years | 13 (3.7%) | 15 (5.1%) |
| 40 to 44 Years | 10 (2.9%) | 16 (5.5%) |
| 45 to 49 Years | 24 (6.9%) | 3 (1.0%) |
| 50 to 54 Years | 2 (0.6%) | 12 (4.1%) |
| 55 to 59 Years | 63 (18.1%) | 28 (9.6%) |
| 60 to 64 Years | 37 (10.6%) | 31 (10.6%) |
| 65 to 69 Years | 51 (14.7%) | 19 (6.5%) |
| 70 to 74 Years | 15 (4.3%) | 14 (4.8%) |
| 75 to 79 Years | 6 (1.7%) | 0 (0.0%) |
| 80 to 84 Years | 2 (0.6%) | 9 (3.1%) |
| 85 Years and over | 6 (1.7%) | 60 (20.6%) |
| Total | 348 (100.0%) | 291 (100.0%) |
Families and Households in Dillonvale
Median Family Size in Dillonvale
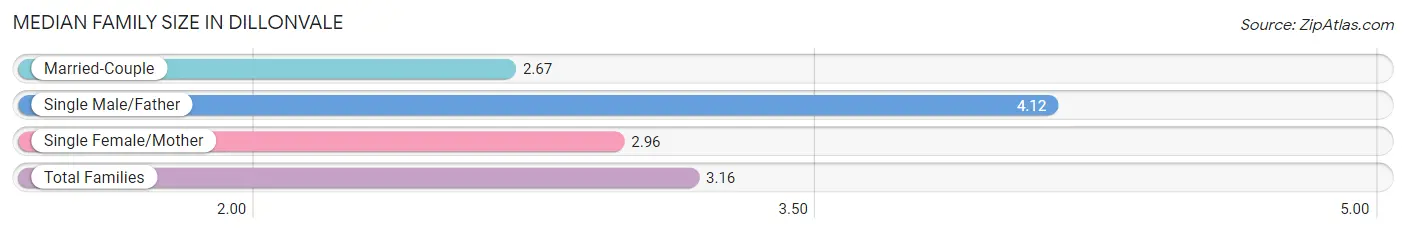
The median family size in Dillonvale is 3.16 persons per family, with single male/father families (41 | 27.7%) accounting for the largest median family size of 4.12 persons per family. On the other hand, married-couple families (61 | 41.2%) represent the smallest median family size with 2.67 persons per family.
| Family Type | # Families | Family Size |
| Married-Couple | 61 (41.2%) | 2.67 |
| Single Male/Father | 41 (27.7%) | 4.12 |
| Single Female/Mother | 46 (31.1%) | 2.96 |
| Total Families | 148 (100.0%) | 3.16 |
Median Household Size in Dillonvale
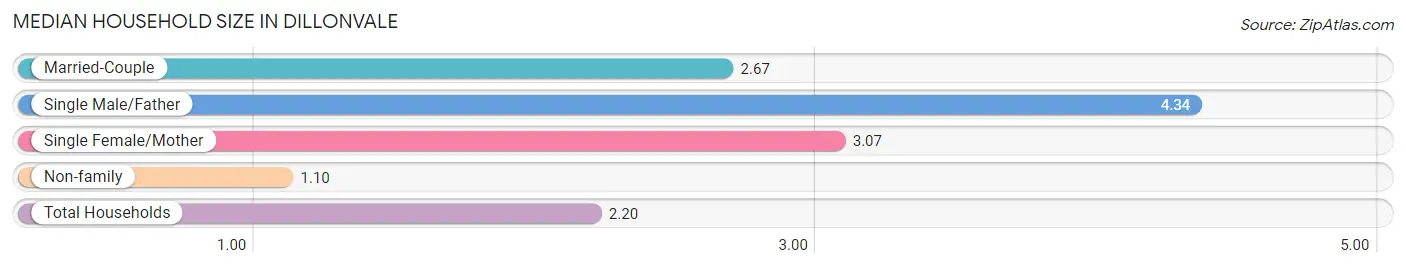
The median household size in Dillonvale is 2.20 persons per household, with single male/father households (41 | 14.1%) accounting for the largest median household size of 4.34 persons per household. non-family households (143 | 49.1%) represent the smallest median household size with 1.10 persons per household.
| Household Type | # Households | Household Size |
| Married-Couple | 61 (21.0%) | 2.67 |
| Single Male/Father | 41 (14.1%) | 4.34 |
| Single Female/Mother | 46 (15.8%) | 3.07 |
| Non-family | 143 (49.1%) | 1.10 |
| Total Households | 291 (100.0%) | 2.20 |
Household Size by Marriage Status in Dillonvale
Out of a total of 291 households in Dillonvale, 148 (50.9%) are family households, while 143 (49.1%) are nonfamily households. The most numerous type of family households are 3-person households, comprising 75, and the most common type of nonfamily households are 1-person households, comprising 130.
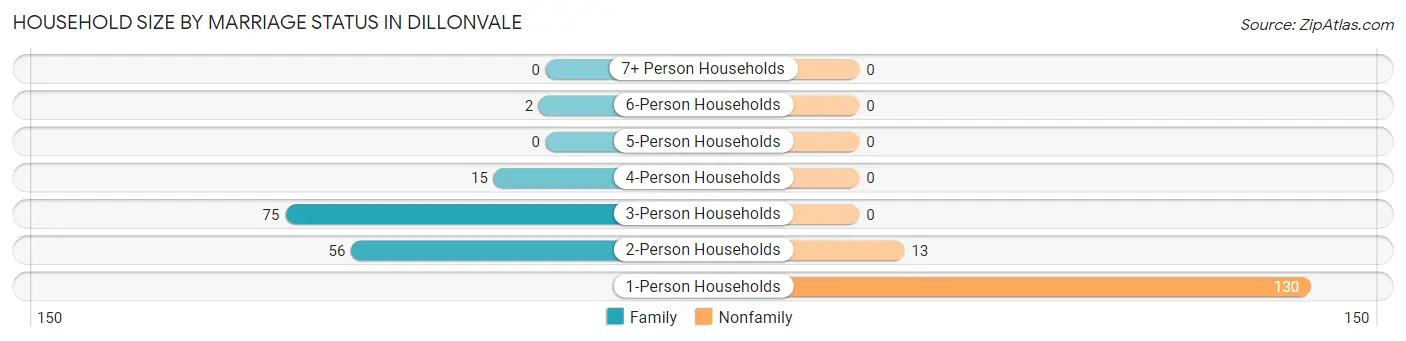
| Household Size | Family Households | Nonfamily Households |
| 1-Person Households | - | 130 (44.7%) |
| 2-Person Households | 56 (19.2%) | 13 (4.5%) |
| 3-Person Households | 75 (25.8%) | 0 (0.0%) |
| 4-Person Households | 15 (5.1%) | 0 (0.0%) |
| 5-Person Households | 0 (0.0%) | 0 (0.0%) |
| 6-Person Households | 2 (0.7%) | 0 (0.0%) |
| 7+ Person Households | 0 (0.0%) | 0 (0.0%) |
| Total | 148 (50.9%) | 143 (49.1%) |
Female Fertility in Dillonvale
Fertility by Age in Dillonvale
| Age Bracket | Women with Births | Births / 1,000 Women |
| 15 to 19 years | 0 (0.0%) | 0.0 |
| 20 to 34 years | 0 (0.0%) | 0.0 |
| 35 to 50 years | 0 (0.0%) | 0.0 |
| Total | 0 (0.0%) | 0.0 |
Fertility by Age by Marriage Status in Dillonvale
| Age Bracket | Married | Unmarried |
| 15 to 19 years | 0 (0.0%) | 0 (0.0%) |
| 20 to 34 years | 0 (0.0%) | 0 (0.0%) |
| 35 to 50 years | 0 (0.0%) | 0 (0.0%) |
| Total | 0 (0.0%) | 0 (0.0%) |
Fertility by Education in Dillonvale
| Educational Attainment | Women with Births | Births / 1,000 Women |
| Less than High School | 0 (0.0%) | 0.0 |
| High School Diploma | 0 (0.0%) | 0.0 |
| College or Associate's Degree | 0 (0.0%) | 0.0 |
| Bachelor's Degree | 0 (0.0%) | 0.0 |
| Graduate Degree | 0 (0.0%) | 0.0 |
| Total | 0 (0.0%) | 0.0 |
Fertility by Education by Marriage Status in Dillonvale
| Educational Attainment | Married | Unmarried |
| Less than High School | 0 (0.0%) | 0 (0.0%) |
| High School Diploma | 0 (0.0%) | 0 (0.0%) |
| College or Associate's Degree | 0 (0.0%) | 0 (0.0%) |
| Bachelor's Degree | 0 (0.0%) | 0 (0.0%) |
| Graduate Degree | 0 (0.0%) | 0 (0.0%) |
| Total | 0 (0.0%) | 0 (0.0%) |
Employment Characteristics in Dillonvale
Employment by Class of Employer in Dillonvale
Among the 257 employed individuals in Dillonvale, private company employees (208 | 80.9%), not-for-profit organizations (24 | 9.3%), and local government employees (13 | 5.1%) make up the most common classes of employment.
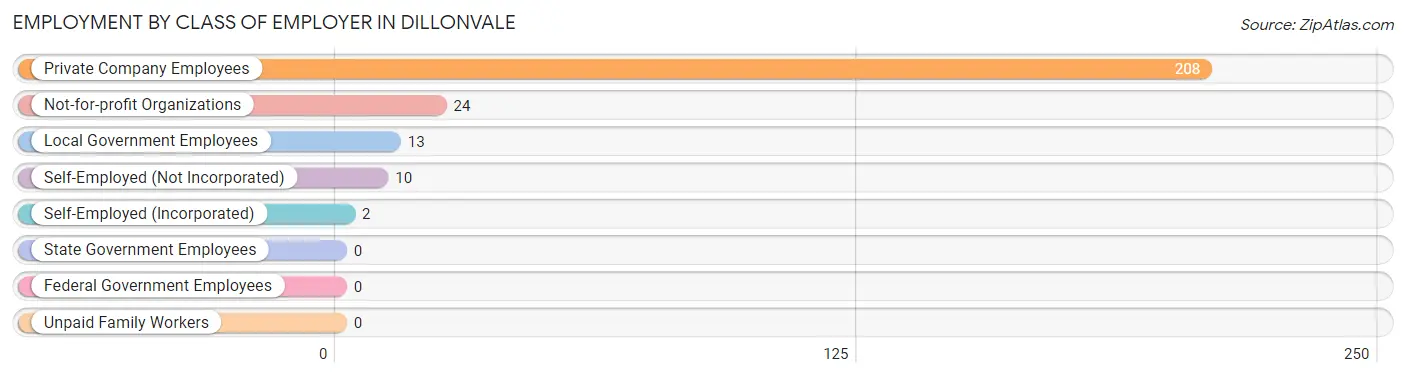
| Employer Class | # Employees | % Employees |
| Private Company Employees | 208 | 80.9% |
| Self-Employed (Incorporated) | 2 | 0.8% |
| Self-Employed (Not Incorporated) | 10 | 3.9% |
| Not-for-profit Organizations | 24 | 9.3% |
| Local Government Employees | 13 | 5.1% |
| State Government Employees | 0 | 0.0% |
| Federal Government Employees | 0 | 0.0% |
| Unpaid Family Workers | 0 | 0.0% |
| Total | 257 | 100.0% |
Employment Status by Age in Dillonvale
According to the labor force statistics for Dillonvale, out of the total population over 16 years of age (564), 49.6% or 280 individuals are in the labor force, with 8.2% or 23 of them unemployed. The age group with the highest labor force participation rate is 20 to 24 years, with 100.0% or 5 individuals in the labor force. Within the labor force, the 25 to 29 years age range has the highest percentage of unemployed individuals, with 19.6% or 11 of them being unemployed.
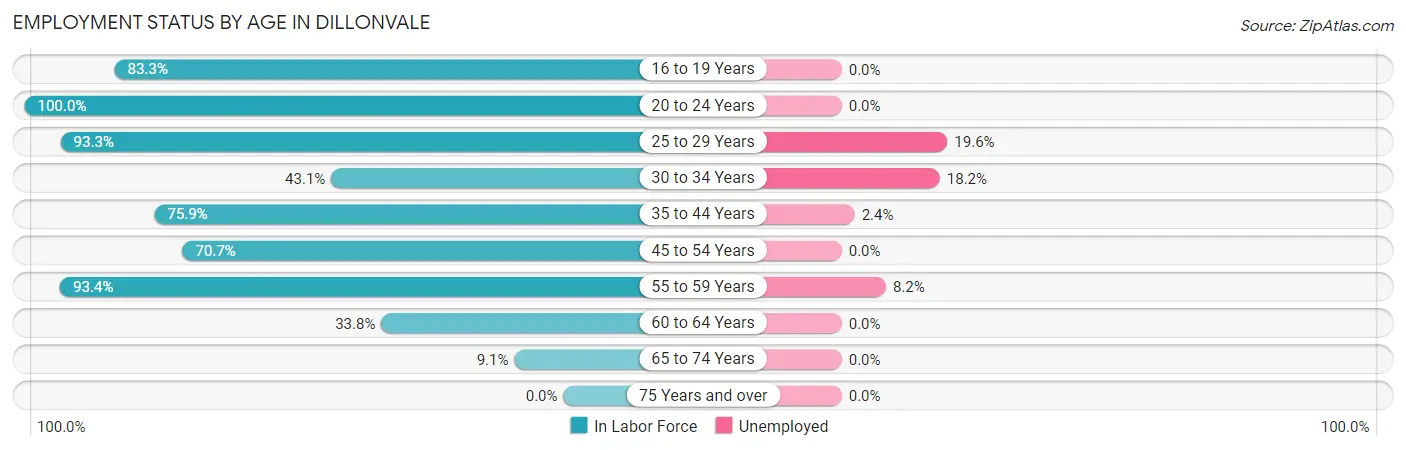
| Age Bracket | In Labor Force | Unemployed |
| 16 to 19 Years | 10 (83.3%) | 0 (0.0%) |
| 20 to 24 Years | 5 (100.0%) | 0 (0.0%) |
| 25 to 29 Years | 56 (93.3%) | 11 (19.6%) |
| 30 to 34 Years | 22 (43.1%) | 4 (18.2%) |
| 35 to 44 Years | 41 (75.9%) | 1 (2.4%) |
| 45 to 54 Years | 29 (70.7%) | 0 (0.0%) |
| 55 to 59 Years | 85 (93.4%) | 7 (8.2%) |
| 60 to 64 Years | 23 (33.8%) | 0 (0.0%) |
| 65 to 74 Years | 9 (9.1%) | 0 (0.0%) |
| 75 Years and over | 0 (0.0%) | 0 (0.0%) |
| Total | 280 (49.6%) | 23 (8.2%) |
Employment Status by Educational Attainment in Dillonvale
According to labor force statistics for Dillonvale, 70.1% of individuals (256) out of the total population between 25 and 64 years of age (365) are in the labor force, with 9.0% or 23 of them being unemployed. The group with the highest labor force participation rate are those with the educational attainment of high school diploma, with 78.1% or 139 individuals in the labor force. Within the labor force, individuals with college / associate degree education have the highest percentage of unemployment, with 15.1% or 16 of them being unemployed.
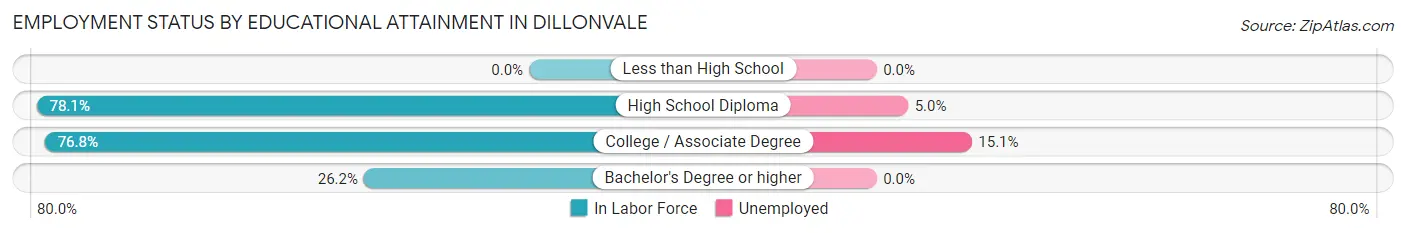
| Educational Attainment | In Labor Force | Unemployed |
| Less than High School | 0 (0.0%) | 0 (0.0%) |
| High School Diploma | 139 (78.1%) | 9 (5.0%) |
| College / Associate Degree | 106 (76.8%) | 21 (15.1%) |
| Bachelor's Degree or higher | 11 (26.2%) | 0 (0.0%) |
| Total | 256 (70.1%) | 33 (9.0%) |
Employment Occupations by Sex in Dillonvale
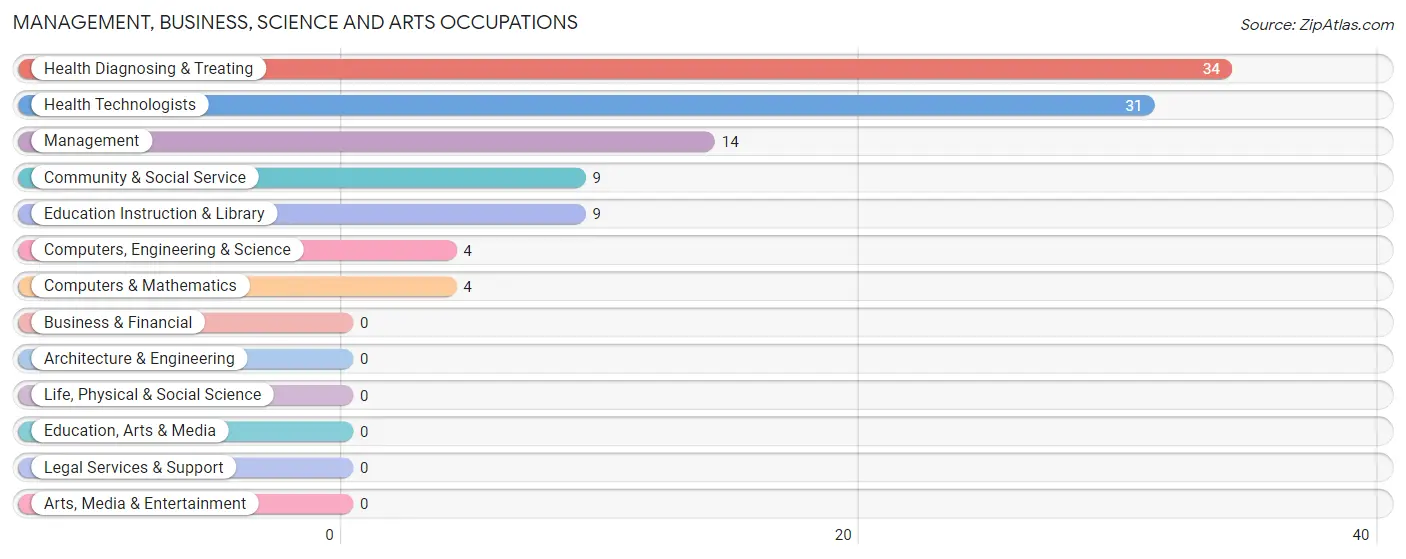
Management, Business, Science and Arts Occupations
The most common Management, Business, Science and Arts occupations in Dillonvale are Health Diagnosing & Treating (34 | 13.2%), Health Technologists (31 | 12.1%), Management (14 | 5.4%), Community & Social Service (9 | 3.5%), and Education Instruction & Library (9 | 3.5%).
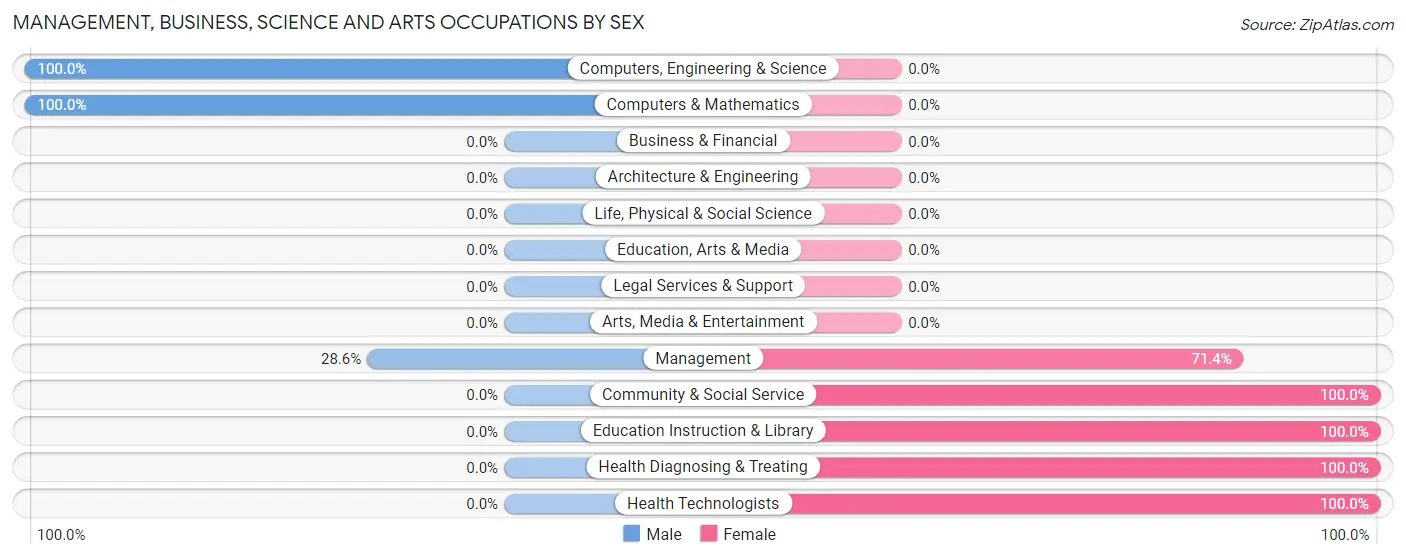
Management, Business, Science and Arts Occupations by Sex
Within the Management, Business, Science and Arts occupations in Dillonvale, the most male-oriented occupations are Computers, Engineering & Science (100.0%), Computers & Mathematics (100.0%), and Management (28.6%), while the most female-oriented occupations are Community & Social Service (100.0%), Education Instruction & Library (100.0%), and Health Diagnosing & Treating (100.0%).
| Occupation | Male | Female |
| Management | 4 (28.6%) | 10 (71.4%) |
| Business & Financial | 0 (0.0%) | 0 (0.0%) |
| Computers, Engineering & Science | 4 (100.0%) | 0 (0.0%) |
| Computers & Mathematics | 4 (100.0%) | 0 (0.0%) |
| Architecture & Engineering | 0 (0.0%) | 0 (0.0%) |
| Life, Physical & Social Science | 0 (0.0%) | 0 (0.0%) |
| Community & Social Service | 0 (0.0%) | 9 (100.0%) |
| Education, Arts & Media | 0 (0.0%) | 0 (0.0%) |
| Legal Services & Support | 0 (0.0%) | 0 (0.0%) |
| Education Instruction & Library | 0 (0.0%) | 9 (100.0%) |
| Arts, Media & Entertainment | 0 (0.0%) | 0 (0.0%) |
| Health Diagnosing & Treating | 0 (0.0%) | 34 (100.0%) |
| Health Technologists | 0 (0.0%) | 31 (100.0%) |
| Total (Category) | 8 (13.1%) | 53 (86.9%) |
| Total (Overall) | 159 (61.9%) | 98 (38.1%) |
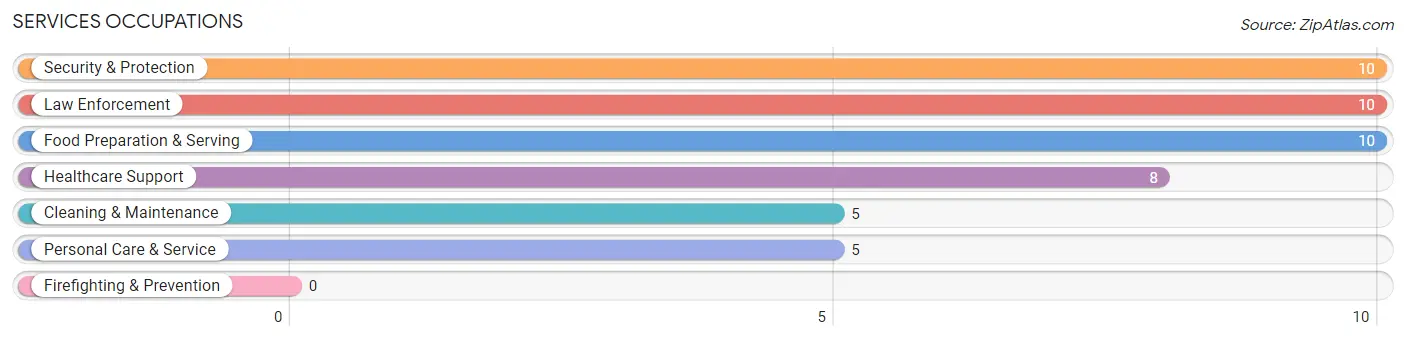
Services Occupations
The most common Services occupations in Dillonvale are Security & Protection (10 | 3.9%), Law Enforcement (10 | 3.9%), Food Preparation & Serving (10 | 3.9%), Healthcare Support (8 | 3.1%), and Cleaning & Maintenance (5 | 1.9%).
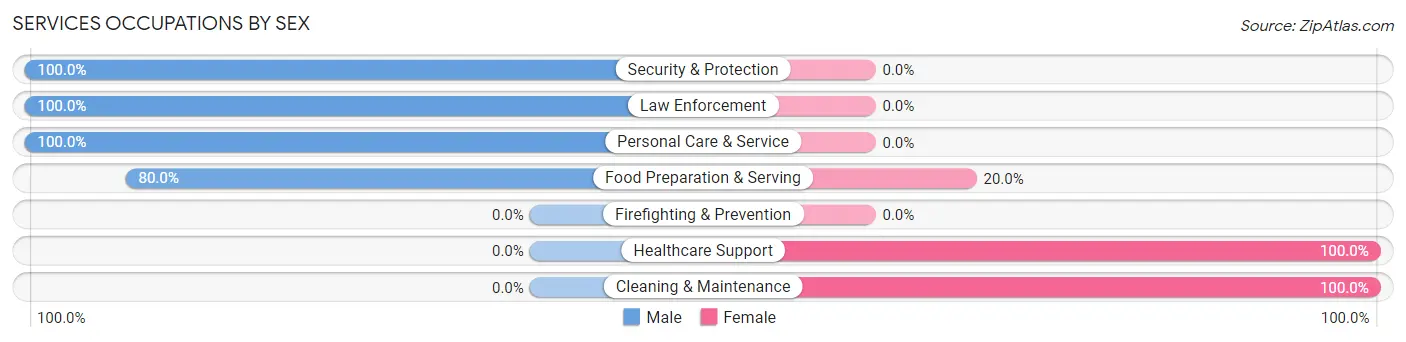
Services Occupations by Sex
Within the Services occupations in Dillonvale, the most male-oriented occupations are Security & Protection (100.0%), Law Enforcement (100.0%), and Personal Care & Service (100.0%), while the most female-oriented occupations are Healthcare Support (100.0%), Cleaning & Maintenance (100.0%), and Food Preparation & Serving (20.0%).
| Occupation | Male | Female |
| Healthcare Support | 0 (0.0%) | 8 (100.0%) |
| Security & Protection | 10 (100.0%) | 0 (0.0%) |
| Firefighting & Prevention | 0 (0.0%) | 0 (0.0%) |
| Law Enforcement | 10 (100.0%) | 0 (0.0%) |
| Food Preparation & Serving | 8 (80.0%) | 2 (20.0%) |
| Cleaning & Maintenance | 0 (0.0%) | 5 (100.0%) |
| Personal Care & Service | 5 (100.0%) | 0 (0.0%) |
| Total (Category) | 23 (60.5%) | 15 (39.5%) |
| Total (Overall) | 159 (61.9%) | 98 (38.1%) |
Sales and Office Occupations
The most common Sales and Office occupations in Dillonvale are Sales & Related (30 | 11.7%), and Office & Administration (11 | 4.3%).
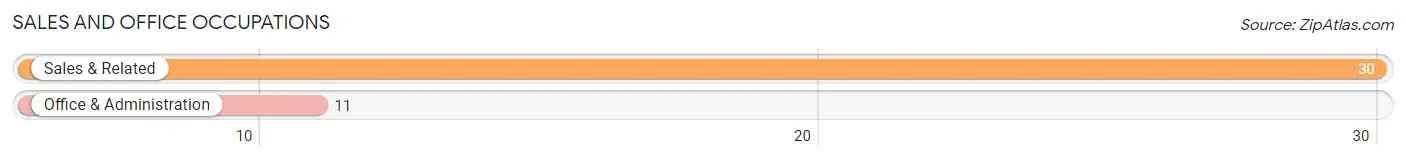
Sales and Office Occupations by Sex
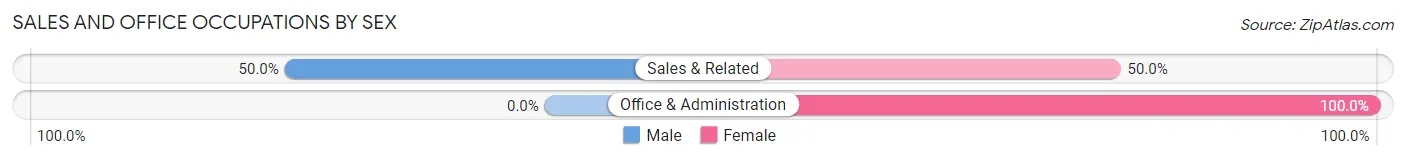
| Occupation | Male | Female |
| Sales & Related | 15 (50.0%) | 15 (50.0%) |
| Office & Administration | 0 (0.0%) | 11 (100.0%) |
| Total (Category) | 15 (36.6%) | 26 (63.4%) |
| Total (Overall) | 159 (61.9%) | 98 (38.1%) |
Natural Resources, Construction and Maintenance Occupations
The most common Natural Resources, Construction and Maintenance occupations in Dillonvale are Installation, Maintenance & Repair (17 | 6.6%), and Construction & Extraction (10 | 3.9%).
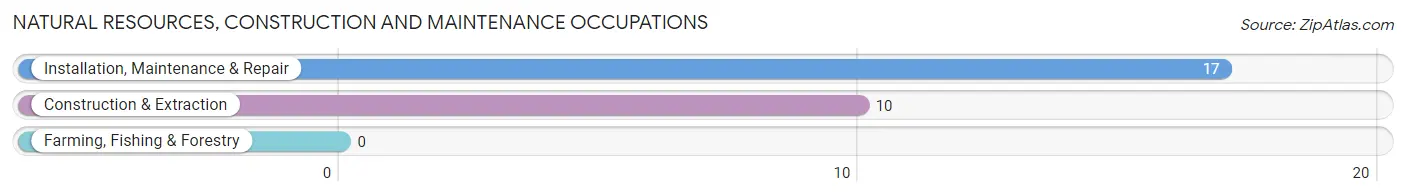
Natural Resources, Construction and Maintenance Occupations by Sex
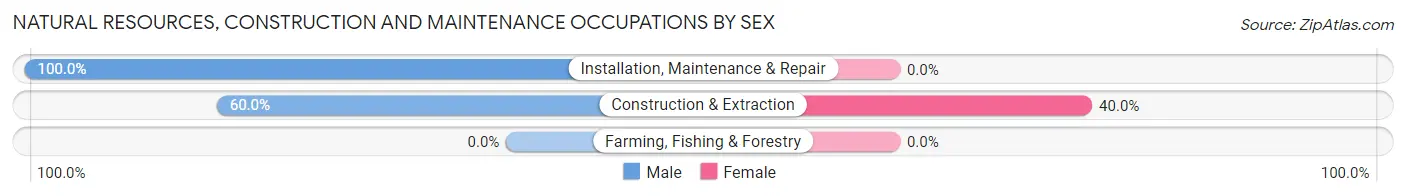
| Occupation | Male | Female |
| Farming, Fishing & Forestry | 0 (0.0%) | 0 (0.0%) |
| Construction & Extraction | 6 (60.0%) | 4 (40.0%) |
| Installation, Maintenance & Repair | 17 (100.0%) | 0 (0.0%) |
| Total (Category) | 23 (85.2%) | 4 (14.8%) |
| Total (Overall) | 159 (61.9%) | 98 (38.1%) |
Production, Transportation and Moving Occupations
The most common Production, Transportation and Moving occupations in Dillonvale are Production (67 | 26.1%), Material Moving (12 | 4.7%), and Transportation (11 | 4.3%).
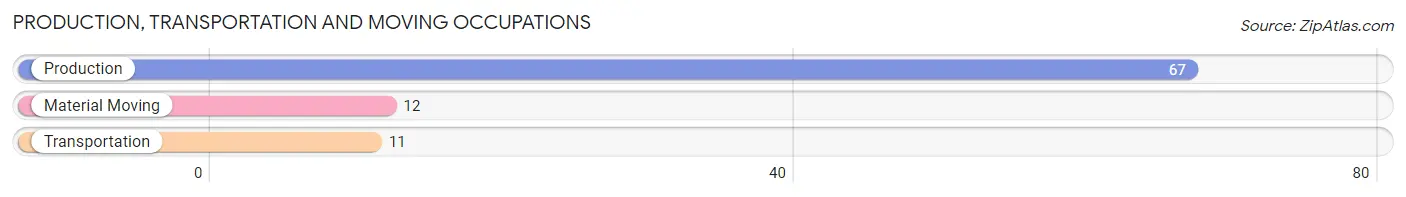
Production, Transportation and Moving Occupations by Sex
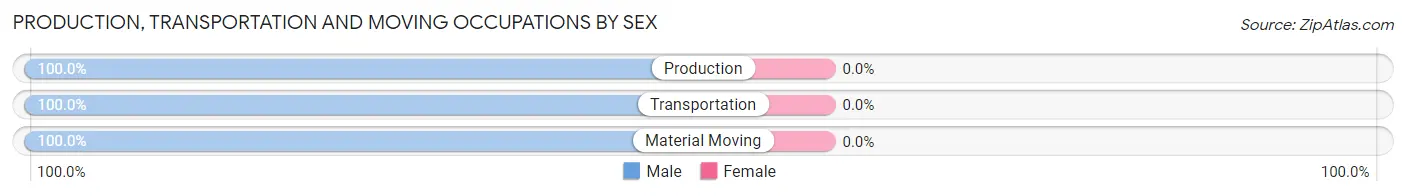
| Occupation | Male | Female |
| Production | 67 (100.0%) | 0 (0.0%) |
| Transportation | 11 (100.0%) | 0 (0.0%) |
| Material Moving | 12 (100.0%) | 0 (0.0%) |
| Total (Category) | 90 (100.0%) | 0 (0.0%) |
| Total (Overall) | 159 (61.9%) | 98 (38.1%) |
Employment Industries by Sex in Dillonvale
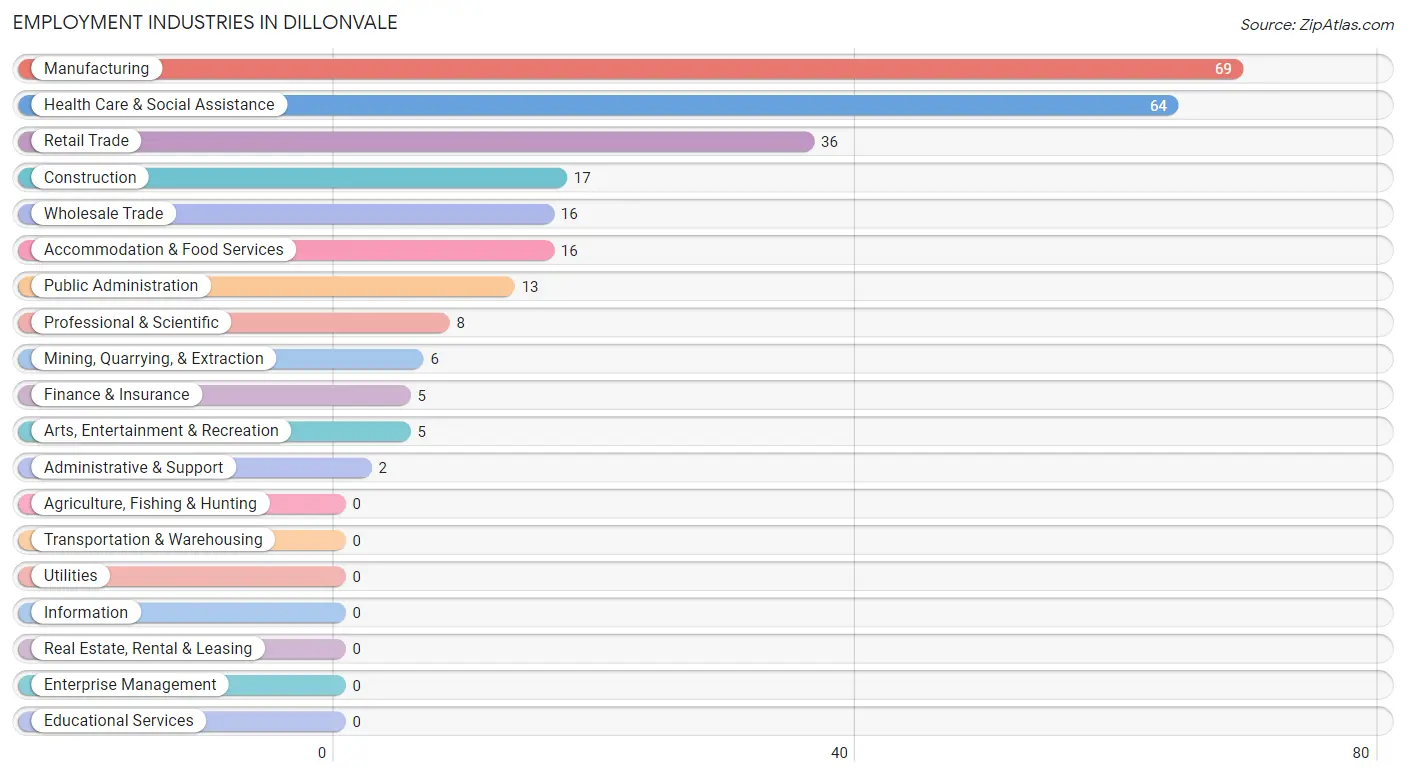
Employment Industries in Dillonvale
The major employment industries in Dillonvale include Manufacturing (69 | 26.9%), Health Care & Social Assistance (64 | 24.9%), Retail Trade (36 | 14.0%), Construction (17 | 6.6%), and Wholesale Trade (16 | 6.2%).
Employment Industries by Sex in Dillonvale
The Dillonvale industries that see more men than women are Mining, Quarrying, & Extraction (100.0%), Manufacturing (100.0%), and Public Administration (100.0%), whereas the industries that tend to have a higher number of women are Finance & Insurance (100.0%), Administrative & Support (100.0%), and Arts, Entertainment & Recreation (100.0%).
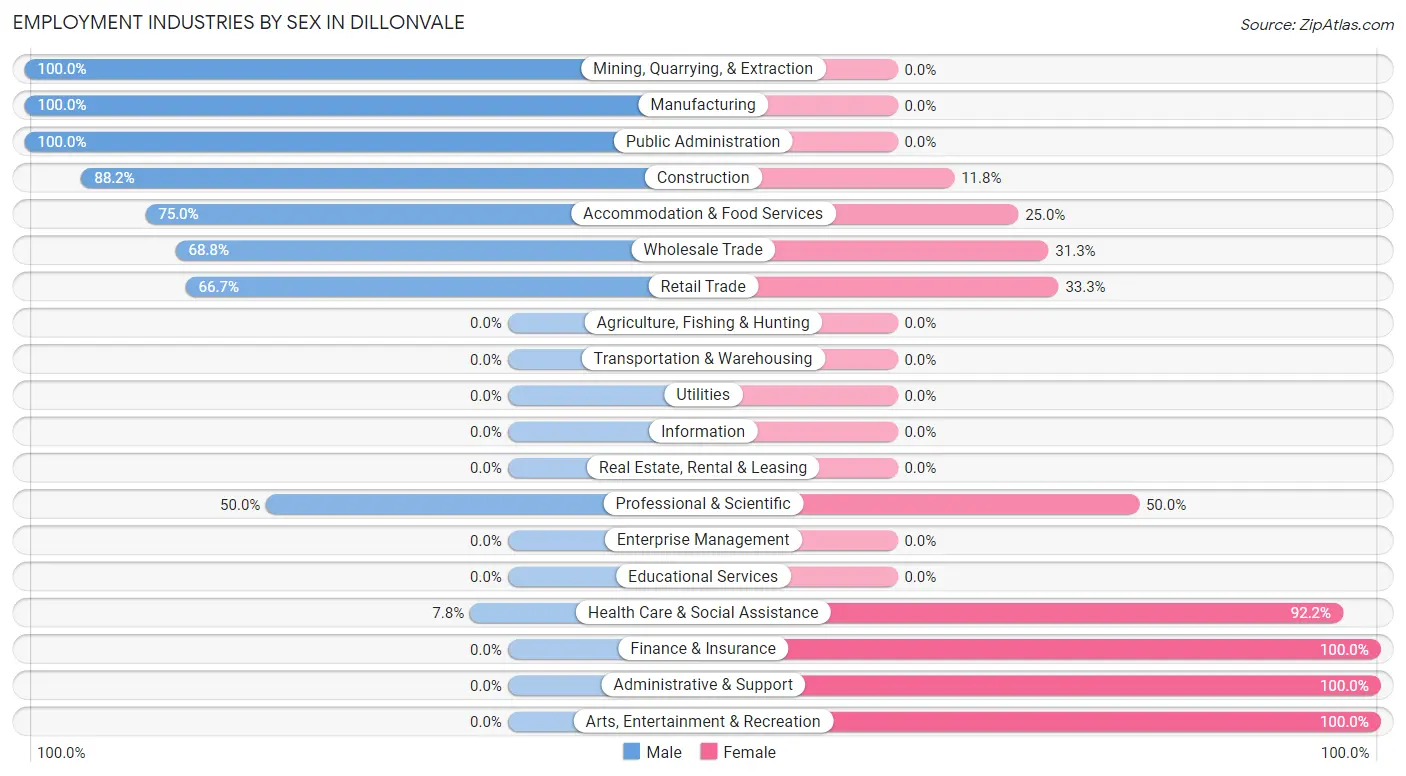
| Industry | Male | Female |
| Agriculture, Fishing & Hunting | 0 (0.0%) | 0 (0.0%) |
| Mining, Quarrying, & Extraction | 6 (100.0%) | 0 (0.0%) |
| Construction | 15 (88.2%) | 2 (11.8%) |
| Manufacturing | 69 (100.0%) | 0 (0.0%) |
| Wholesale Trade | 11 (68.8%) | 5 (31.2%) |
| Retail Trade | 24 (66.7%) | 12 (33.3%) |
| Transportation & Warehousing | 0 (0.0%) | 0 (0.0%) |
| Utilities | 0 (0.0%) | 0 (0.0%) |
| Information | 0 (0.0%) | 0 (0.0%) |
| Finance & Insurance | 0 (0.0%) | 5 (100.0%) |
| Real Estate, Rental & Leasing | 0 (0.0%) | 0 (0.0%) |
| Professional & Scientific | 4 (50.0%) | 4 (50.0%) |
| Enterprise Management | 0 (0.0%) | 0 (0.0%) |
| Administrative & Support | 0 (0.0%) | 2 (100.0%) |
| Educational Services | 0 (0.0%) | 0 (0.0%) |
| Health Care & Social Assistance | 5 (7.8%) | 59 (92.2%) |
| Arts, Entertainment & Recreation | 0 (0.0%) | 5 (100.0%) |
| Accommodation & Food Services | 12 (75.0%) | 4 (25.0%) |
| Public Administration | 13 (100.0%) | 0 (0.0%) |
| Total | 159 (61.9%) | 98 (38.1%) |
Education in Dillonvale
School Enrollment in Dillonvale
The most common levels of schooling among the 81 students in Dillonvale are middle school (32 | 39.5%), kindergarten (14 | 17.3%), and high school (14 | 17.3%).
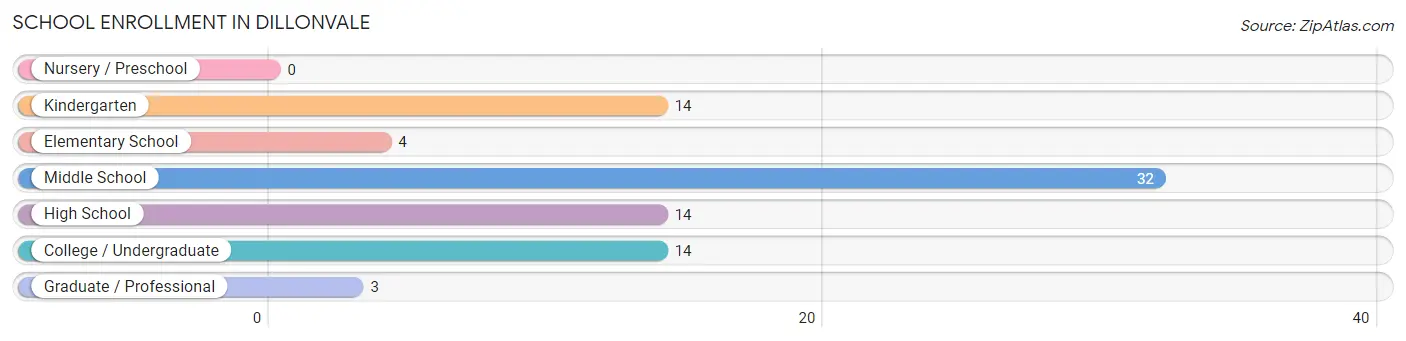
| School Level | # Students | % Students |
| Nursery / Preschool | 0 | 0.0% |
| Kindergarten | 14 | 17.3% |
| Elementary School | 4 | 4.9% |
| Middle School | 32 | 39.5% |
| High School | 14 | 17.3% |
| College / Undergraduate | 14 | 17.3% |
| Graduate / Professional | 3 | 3.7% |
| Total | 81 | 100.0% |
School Enrollment by Age by Funding Source in Dillonvale
Out of a total of 81 students who are enrolled in schools in Dillonvale, 5 (6.2%) attend a private institution, while the remaining 76 (93.8%) are enrolled in public schools. The age group of 20 to 24 year olds has the highest likelihood of being enrolled in private schools, with 2 (100.0% in the age bracket) enrolled. Conversely, the age group of 5 to 9 year old has the lowest likelihood of being enrolled in a private school, with 18 (100.0% in the age bracket) attending a public institution.
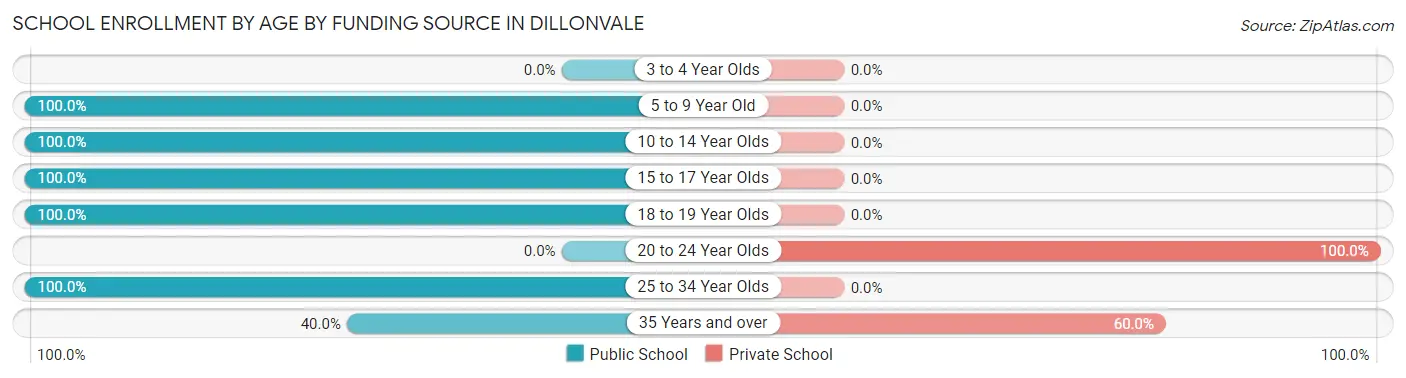
| Age Bracket | Public School | Private School |
| 3 to 4 Year Olds | 0 (0.0%) | 0 (0.0%) |
| 5 to 9 Year Old | 18 (100.0%) | 0 (0.0%) |
| 10 to 14 Year Olds | 35 (100.0%) | 0 (0.0%) |
| 15 to 17 Year Olds | 6 (100.0%) | 0 (0.0%) |
| 18 to 19 Year Olds | 7 (100.0%) | 0 (0.0%) |
| 20 to 24 Year Olds | 0 (0.0%) | 2 (100.0%) |
| 25 to 34 Year Olds | 8 (100.0%) | 0 (0.0%) |
| 35 Years and over | 2 (40.0%) | 3 (60.0%) |
| Total | 76 (93.8%) | 5 (6.2%) |
Educational Attainment by Field of Study in Dillonvale
Education (28 | 57.1%), arts & humanities (7 | 14.3%), science & technology (4 | 8.2%), business (4 | 8.2%), and literature & languages (3 | 6.1%) are the most common fields of study among 49 individuals in Dillonvale who have obtained a bachelor's degree or higher.
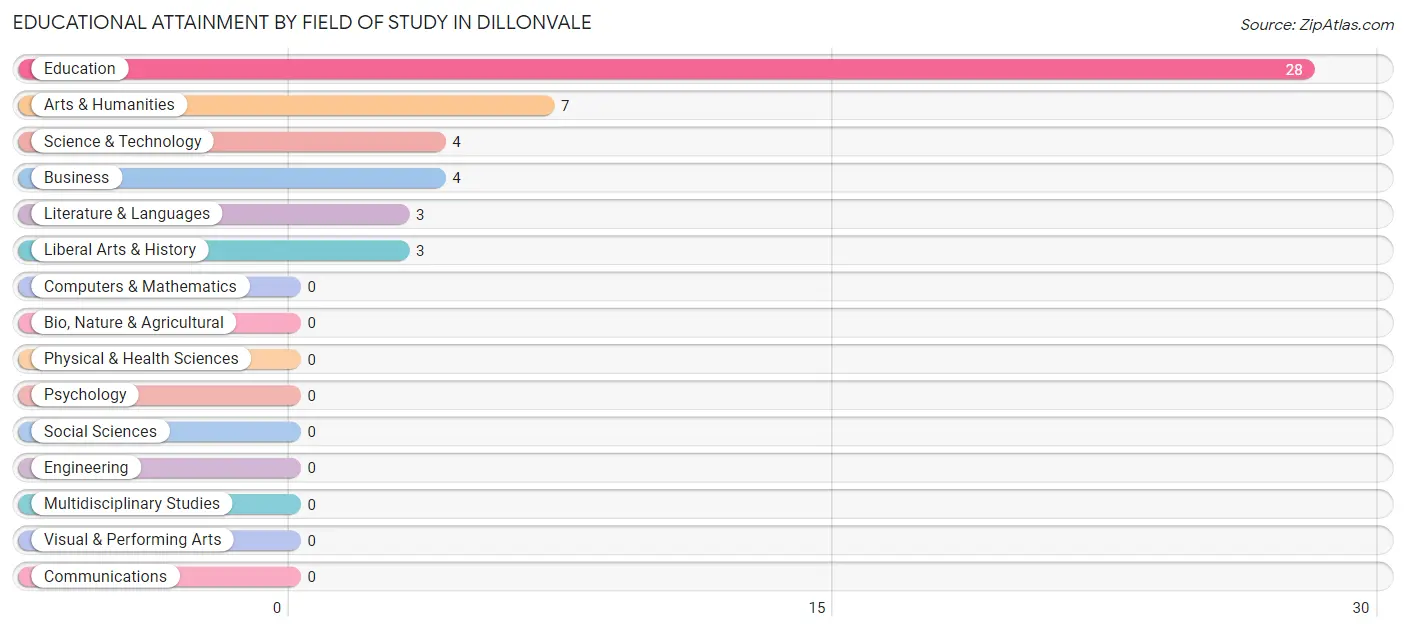
| Field of Study | # Graduates | % Graduates |
| Computers & Mathematics | 0 | 0.0% |
| Bio, Nature & Agricultural | 0 | 0.0% |
| Physical & Health Sciences | 0 | 0.0% |
| Psychology | 0 | 0.0% |
| Social Sciences | 0 | 0.0% |
| Engineering | 0 | 0.0% |
| Multidisciplinary Studies | 0 | 0.0% |
| Science & Technology | 4 | 8.2% |
| Business | 4 | 8.2% |
| Education | 28 | 57.1% |
| Literature & Languages | 3 | 6.1% |
| Liberal Arts & History | 3 | 6.1% |
| Visual & Performing Arts | 0 | 0.0% |
| Communications | 0 | 0.0% |
| Arts & Humanities | 7 | 14.3% |
| Total | 49 | 100.0% |
Transportation & Commute in Dillonvale
Vehicle Availability by Sex in Dillonvale
The most prevalent vehicle ownership categories in Dillonvale are males with 2 vehicles (104, accounting for 65.4%) and females with 2 vehicles (60, making up 106.1%).
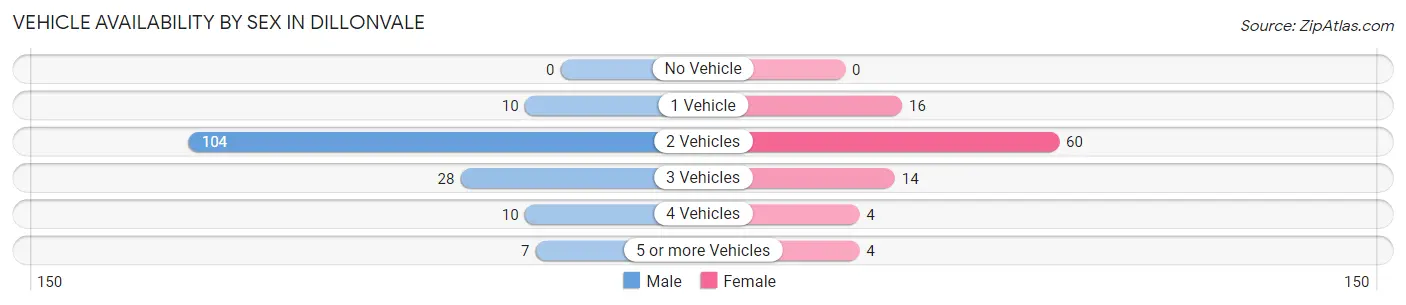
| Vehicles Available | Male | Female |
| No Vehicle | 0 (0.0%) | 0 (0.0%) |
| 1 Vehicle | 10 (6.3%) | 16 (16.3%) |
| 2 Vehicles | 104 (65.4%) | 60 (61.2%) |
| 3 Vehicles | 28 (17.6%) | 14 (14.3%) |
| 4 Vehicles | 10 (6.3%) | 4 (4.1%) |
| 5 or more Vehicles | 7 (4.4%) | 4 (4.1%) |
| Total | 159 (100.0%) | 98 (100.0%) |
Commute Time in Dillonvale
The most frequently occuring commute durations in Dillonvale are 20 to 24 minutes (83 commuters, 33.3%), 30 to 34 minutes (48 commuters, 19.3%), and 45 to 59 minutes (39 commuters, 15.7%).
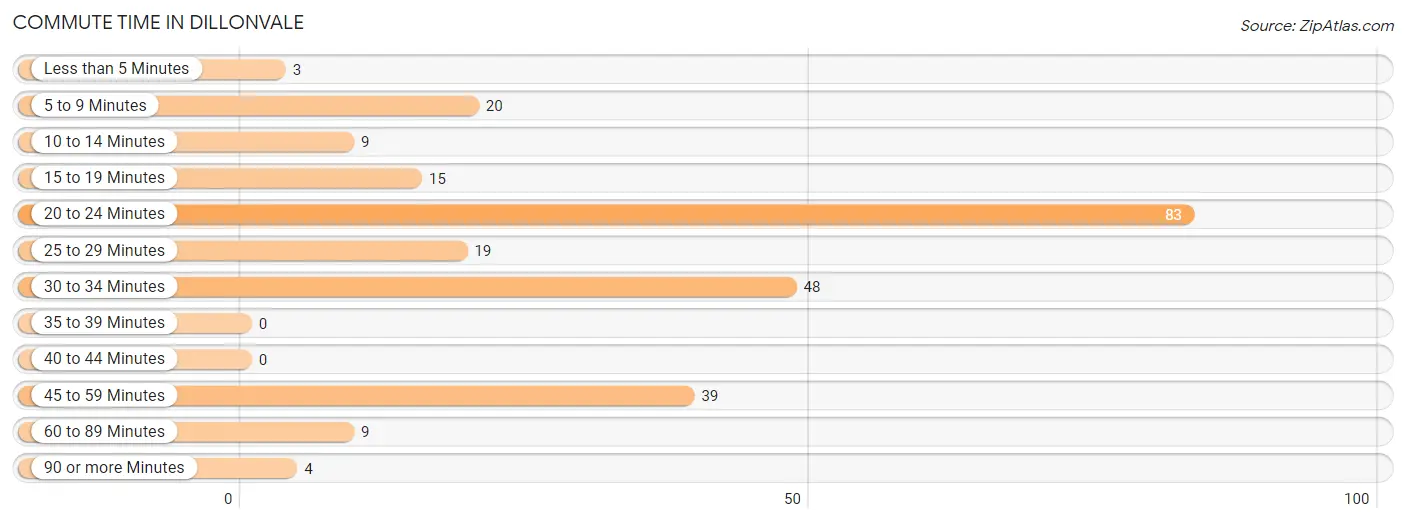
| Commute Time | # Commuters | % Commuters |
| Less than 5 Minutes | 3 | 1.2% |
| 5 to 9 Minutes | 20 | 8.0% |
| 10 to 14 Minutes | 9 | 3.6% |
| 15 to 19 Minutes | 15 | 6.0% |
| 20 to 24 Minutes | 83 | 33.3% |
| 25 to 29 Minutes | 19 | 7.6% |
| 30 to 34 Minutes | 48 | 19.3% |
| 35 to 39 Minutes | 0 | 0.0% |
| 40 to 44 Minutes | 0 | 0.0% |
| 45 to 59 Minutes | 39 | 15.7% |
| 60 to 89 Minutes | 9 | 3.6% |
| 90 or more Minutes | 4 | 1.6% |
Commute Time by Sex in Dillonvale
The most common commute times in Dillonvale are 20 to 24 minutes (70 commuters, 44.0%) for males and 5 to 9 minutes (17 commuters, 18.9%) for females.
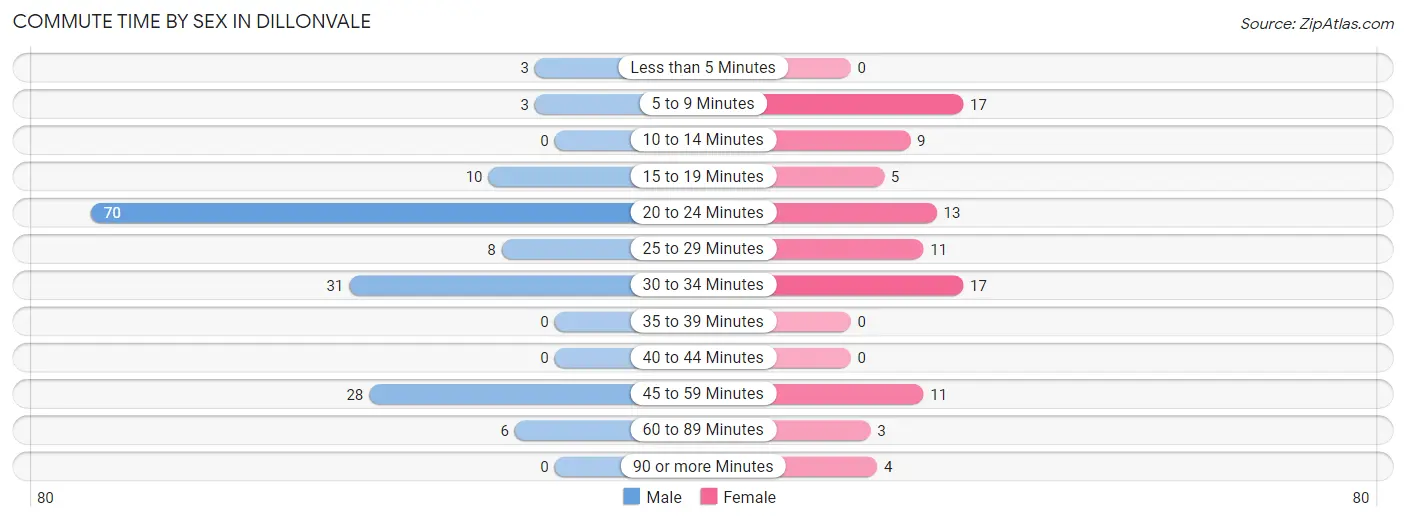
| Commute Time | Male | Female |
| Less than 5 Minutes | 3 (1.9%) | 0 (0.0%) |
| 5 to 9 Minutes | 3 (1.9%) | 17 (18.9%) |
| 10 to 14 Minutes | 0 (0.0%) | 9 (10.0%) |
| 15 to 19 Minutes | 10 (6.3%) | 5 (5.6%) |
| 20 to 24 Minutes | 70 (44.0%) | 13 (14.4%) |
| 25 to 29 Minutes | 8 (5.0%) | 11 (12.2%) |
| 30 to 34 Minutes | 31 (19.5%) | 17 (18.9%) |
| 35 to 39 Minutes | 0 (0.0%) | 0 (0.0%) |
| 40 to 44 Minutes | 0 (0.0%) | 0 (0.0%) |
| 45 to 59 Minutes | 28 (17.6%) | 11 (12.2%) |
| 60 to 89 Minutes | 6 (3.8%) | 3 (3.3%) |
| 90 or more Minutes | 0 (0.0%) | 4 (4.4%) |
Time of Departure to Work by Sex in Dillonvale
The most frequent times of departure to work in Dillonvale are 7:30 AM to 7:59 AM (52, 32.7%) for males and 8:30 AM to 8:59 AM (17, 18.9%) for females.
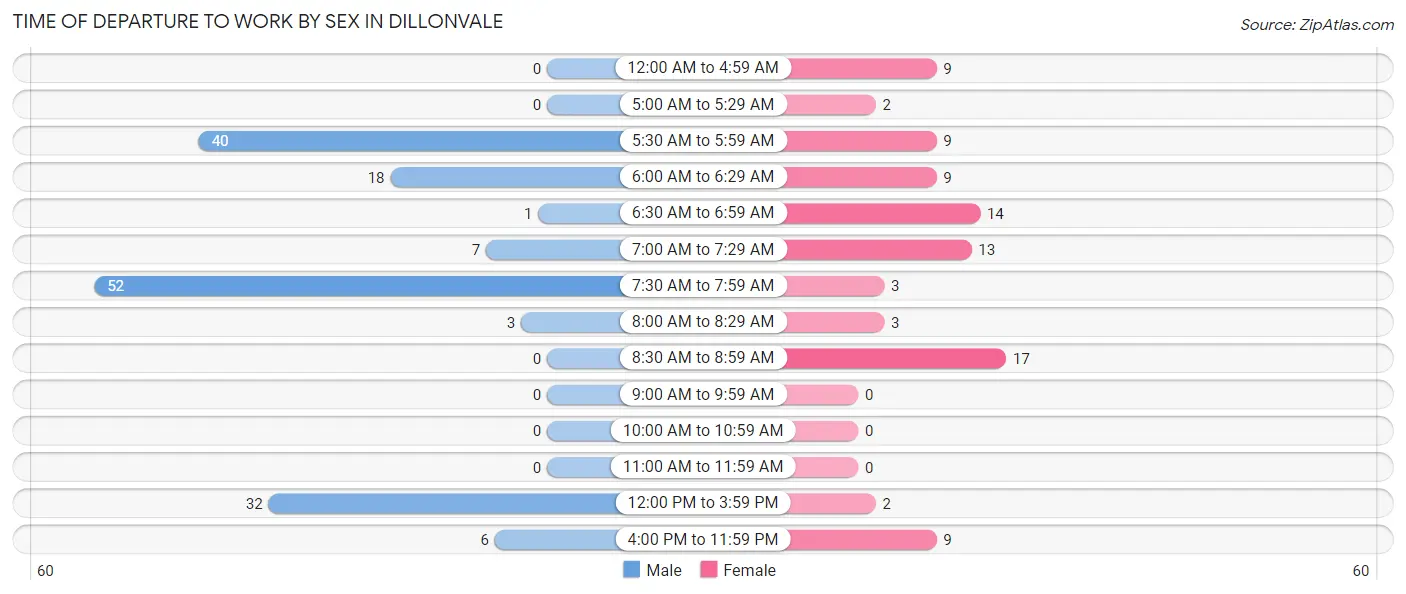
| Time of Departure | Male | Female |
| 12:00 AM to 4:59 AM | 0 (0.0%) | 9 (10.0%) |
| 5:00 AM to 5:29 AM | 0 (0.0%) | 2 (2.2%) |
| 5:30 AM to 5:59 AM | 40 (25.2%) | 9 (10.0%) |
| 6:00 AM to 6:29 AM | 18 (11.3%) | 9 (10.0%) |
| 6:30 AM to 6:59 AM | 1 (0.6%) | 14 (15.6%) |
| 7:00 AM to 7:29 AM | 7 (4.4%) | 13 (14.4%) |
| 7:30 AM to 7:59 AM | 52 (32.7%) | 3 (3.3%) |
| 8:00 AM to 8:29 AM | 3 (1.9%) | 3 (3.3%) |
| 8:30 AM to 8:59 AM | 0 (0.0%) | 17 (18.9%) |
| 9:00 AM to 9:59 AM | 0 (0.0%) | 0 (0.0%) |
| 10:00 AM to 10:59 AM | 0 (0.0%) | 0 (0.0%) |
| 11:00 AM to 11:59 AM | 0 (0.0%) | 0 (0.0%) |
| 12:00 PM to 3:59 PM | 32 (20.1%) | 2 (2.2%) |
| 4:00 PM to 11:59 PM | 6 (3.8%) | 9 (10.0%) |
| Total | 159 (100.0%) | 90 (100.0%) |
Housing Occupancy in Dillonvale
Occupancy by Ownership in Dillonvale
Of the total 1,518 dwellings in Dillonvale, owner-occupied units account for 1,327 (87.4%), while renter-occupied units make up 191 (12.6%).
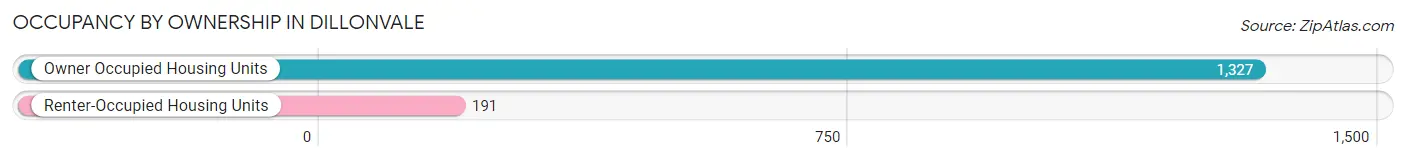
| Occupancy | # Housing Units | % Housing Units |
| Owner Occupied Housing Units | 1,327 | 87.4% |
| Renter-Occupied Housing Units | 191 | 12.6% |
| Total Occupied Housing Units | 1,518 | 100.0% |
Occupancy by Household Size in Dillonvale
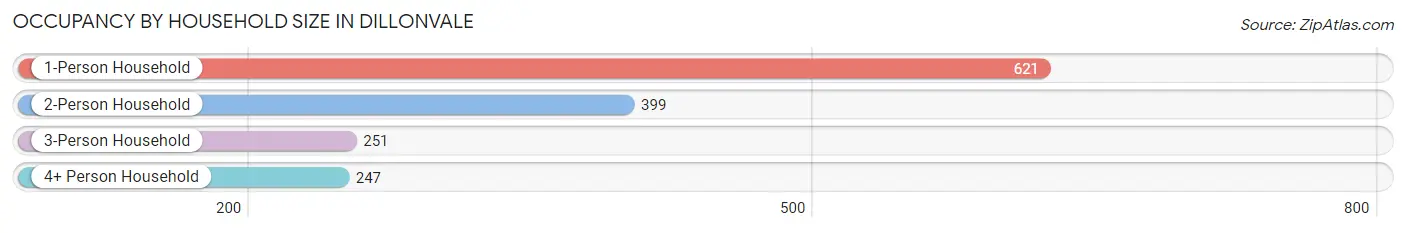
| Household Size | # Housing Units | % Housing Units |
| 1-Person Household | 621 | 40.9% |
| 2-Person Household | 399 | 26.3% |
| 3-Person Household | 251 | 16.5% |
| 4+ Person Household | 247 | 16.3% |
| Total Housing Units | 1,518 | 100.0% |
Occupancy by Ownership by Household Size in Dillonvale
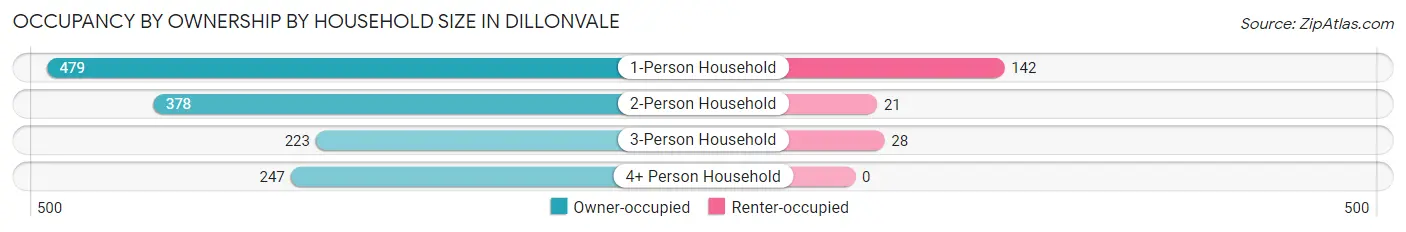
| Household Size | Owner-occupied | Renter-occupied |
| 1-Person Household | 479 (77.1%) | 142 (22.9%) |
| 2-Person Household | 378 (94.7%) | 21 (5.3%) |
| 3-Person Household | 223 (88.8%) | 28 (11.2%) |
| 4+ Person Household | 247 (100.0%) | 0 (0.0%) |
| Total Housing Units | 1,327 (87.4%) | 191 (12.6%) |
Occupancy by Educational Attainment in Dillonvale
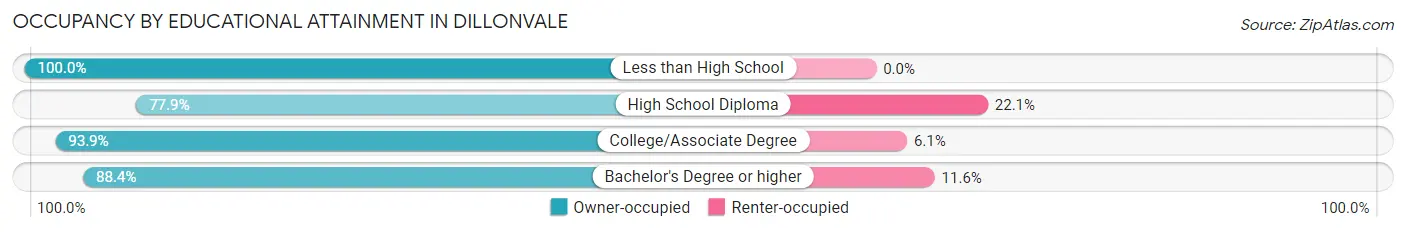
| Household Size | Owner-occupied | Renter-occupied |
| Less than High School | 34 (100.0%) | 0 (0.0%) |
| High School Diploma | 299 (77.9%) | 85 (22.1%) |
| College/Associate Degree | 369 (93.9%) | 24 (6.1%) |
| Bachelor's Degree or higher | 625 (88.4%) | 82 (11.6%) |
Occupancy by Age of Householder in Dillonvale
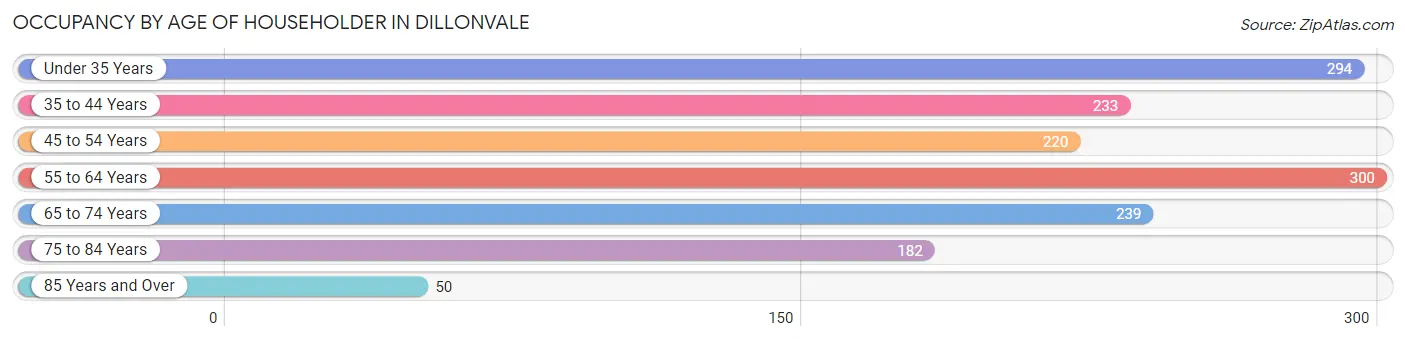
| Age Bracket | # Households | % Households |
| Under 35 Years | 294 | 19.4% |
| 35 to 44 Years | 233 | 15.3% |
| 45 to 54 Years | 220 | 14.5% |
| 55 to 64 Years | 300 | 19.8% |
| 65 to 74 Years | 239 | 15.7% |
| 75 to 84 Years | 182 | 12.0% |
| 85 Years and Over | 50 | 3.3% |
| Total | 1,518 | 100.0% |
Housing Finances in Dillonvale
Median Income by Occupancy in Dillonvale
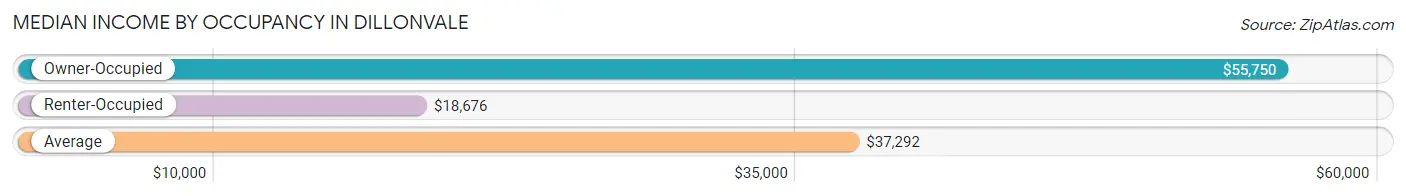
| Occupancy Type | # Households | Median Income |
| Owner-Occupied | 197 (67.7%) | $55,750 |
| Renter-Occupied | 94 (32.3%) | $18,676 |
| Average | 291 (100.0%) | $37,292 |
Occupancy by Householder Income Bracket in Dillonvale
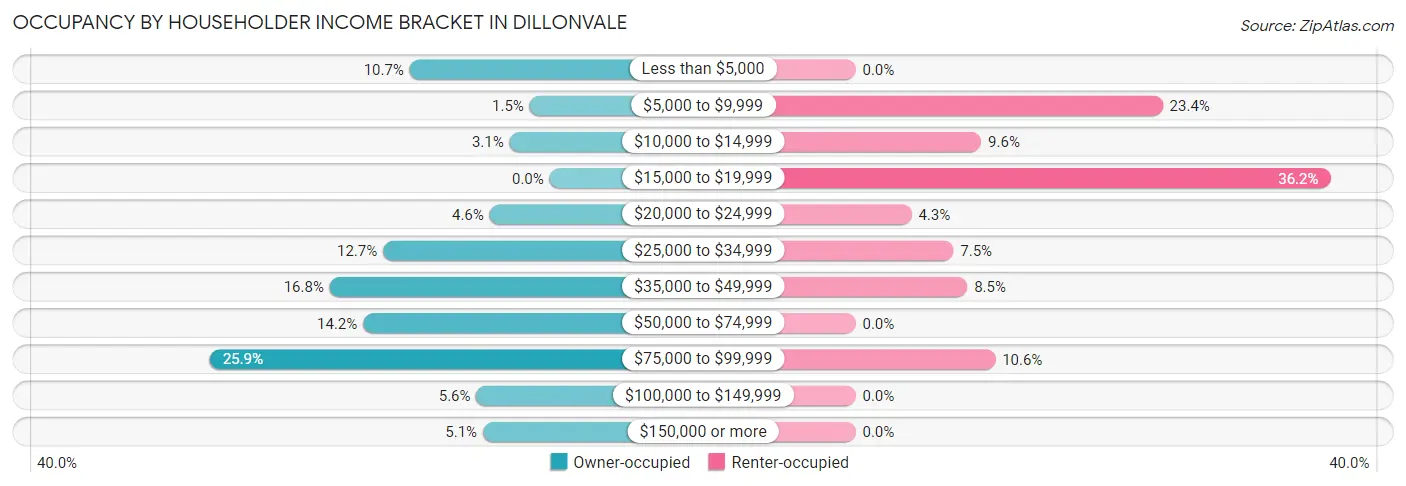
| Income Bracket | Owner-occupied | Renter-occupied |
| Less than $5,000 | 21 (10.7%) | 0 (0.0%) |
| $5,000 to $9,999 | 3 (1.5%) | 22 (23.4%) |
| $10,000 to $14,999 | 6 (3.0%) | 9 (9.6%) |
| $15,000 to $19,999 | 0 (0.0%) | 34 (36.2%) |
| $20,000 to $24,999 | 9 (4.6%) | 4 (4.3%) |
| $25,000 to $34,999 | 25 (12.7%) | 7 (7.4%) |
| $35,000 to $49,999 | 33 (16.8%) | 8 (8.5%) |
| $50,000 to $74,999 | 28 (14.2%) | 0 (0.0%) |
| $75,000 to $99,999 | 51 (25.9%) | 10 (10.6%) |
| $100,000 to $149,999 | 11 (5.6%) | 0 (0.0%) |
| $150,000 or more | 10 (5.1%) | 0 (0.0%) |
| Total | 197 (100.0%) | 94 (100.0%) |
Monthly Housing Cost Tiers in Dillonvale
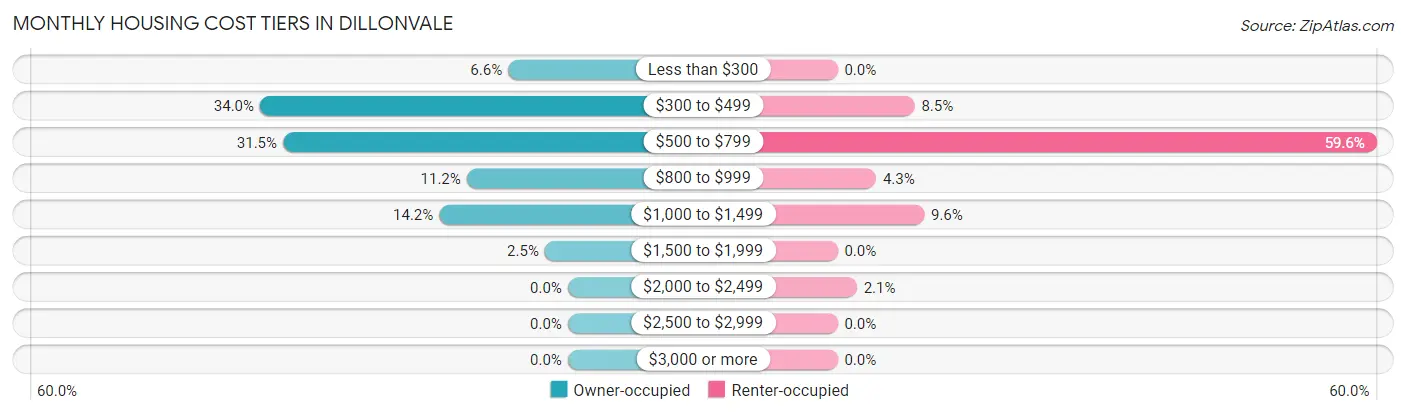
| Monthly Cost | Owner-occupied | Renter-occupied |
| Less than $300 | 13 (6.6%) | 0 (0.0%) |
| $300 to $499 | 67 (34.0%) | 8 (8.5%) |
| $500 to $799 | 62 (31.5%) | 56 (59.6%) |
| $800 to $999 | 22 (11.2%) | 4 (4.3%) |
| $1,000 to $1,499 | 28 (14.2%) | 9 (9.6%) |
| $1,500 to $1,999 | 5 (2.5%) | 0 (0.0%) |
| $2,000 to $2,499 | 0 (0.0%) | 2 (2.1%) |
| $2,500 to $2,999 | 0 (0.0%) | 0 (0.0%) |
| $3,000 or more | 0 (0.0%) | 0 (0.0%) |
| Total | 197 (100.0%) | 94 (100.0%) |
Physical Housing Characteristics in Dillonvale
Housing Structures in Dillonvale
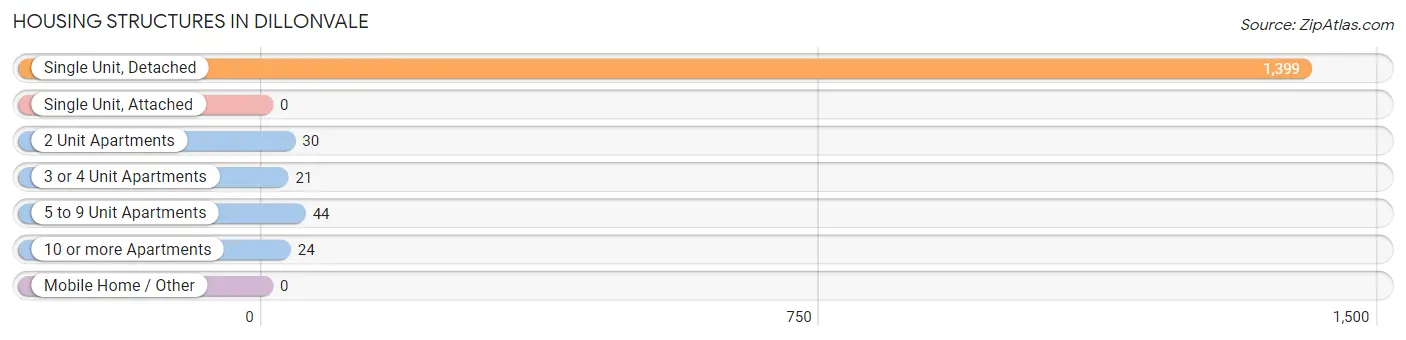
| Structure Type | # Housing Units | % Housing Units |
| Single Unit, Detached | 1,399 | 92.2% |
| Single Unit, Attached | 0 | 0.0% |
| 2 Unit Apartments | 30 | 2.0% |
| 3 or 4 Unit Apartments | 21 | 1.4% |
| 5 to 9 Unit Apartments | 44 | 2.9% |
| 10 or more Apartments | 24 | 1.6% |
| Mobile Home / Other | 0 | 0.0% |
| Total | 1,518 | 100.0% |
Housing Structures by Occupancy in Dillonvale
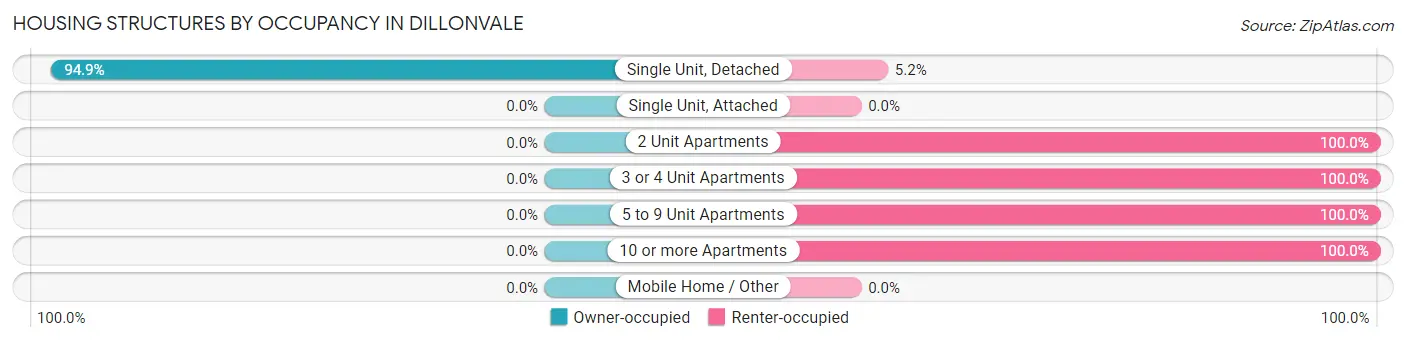
| Structure Type | Owner-occupied | Renter-occupied |
| Single Unit, Detached | 1,327 (94.9%) | 72 (5.1%) |
| Single Unit, Attached | 0 (0.0%) | 0 (0.0%) |
| 2 Unit Apartments | 0 (0.0%) | 30 (100.0%) |
| 3 or 4 Unit Apartments | 0 (0.0%) | 21 (100.0%) |
| 5 to 9 Unit Apartments | 0 (0.0%) | 44 (100.0%) |
| 10 or more Apartments | 0 (0.0%) | 24 (100.0%) |
| Mobile Home / Other | 0 (0.0%) | 0 (0.0%) |
| Total | 1,327 (87.4%) | 191 (12.6%) |
Housing Structures by Number of Rooms in Dillonvale
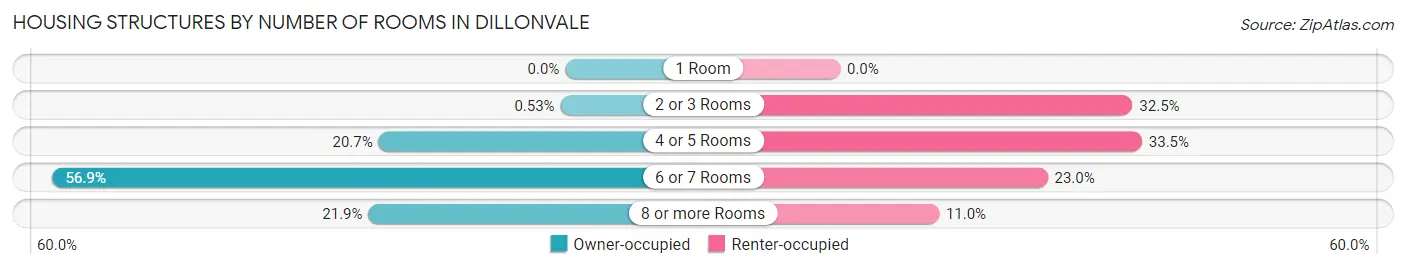
| Number of Rooms | Owner-occupied | Renter-occupied |
| 1 Room | 0 (0.0%) | 0 (0.0%) |
| 2 or 3 Rooms | 7 (0.5%) | 62 (32.5%) |
| 4 or 5 Rooms | 275 (20.7%) | 64 (33.5%) |
| 6 or 7 Rooms | 755 (56.9%) | 44 (23.0%) |
| 8 or more Rooms | 290 (21.8%) | 21 (11.0%) |
| Total | 1,327 (100.0%) | 191 (100.0%) |
Housing Structure by Heating Type in Dillonvale
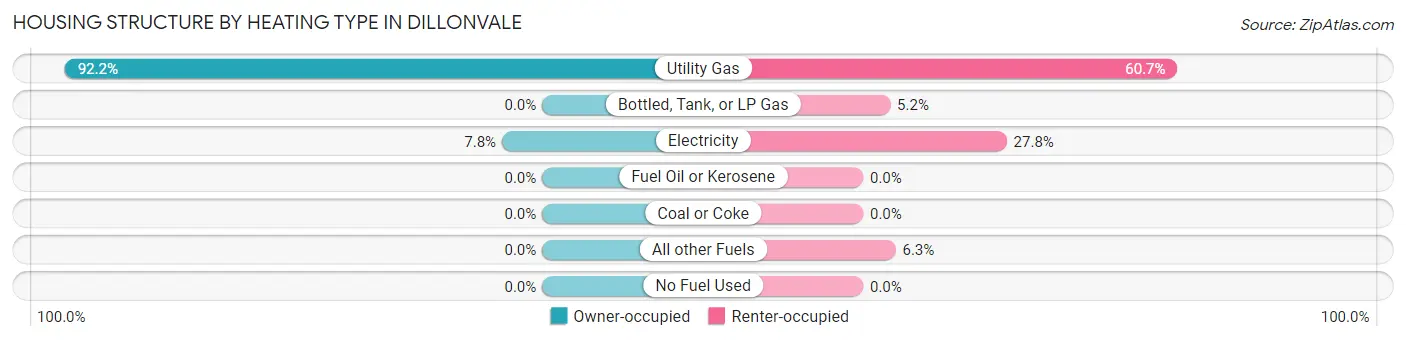
| Heating Type | Owner-occupied | Renter-occupied |
| Utility Gas | 1,224 (92.2%) | 116 (60.7%) |
| Bottled, Tank, or LP Gas | 0 (0.0%) | 10 (5.2%) |
| Electricity | 103 (7.8%) | 53 (27.8%) |
| Fuel Oil or Kerosene | 0 (0.0%) | 0 (0.0%) |
| Coal or Coke | 0 (0.0%) | 0 (0.0%) |
| All other Fuels | 0 (0.0%) | 12 (6.3%) |
| No Fuel Used | 0 (0.0%) | 0 (0.0%) |
| Total | 1,327 (100.0%) | 191 (100.0%) |
Household Vehicle Usage in Dillonvale

| Vehicles per Household | Owner-occupied | Renter-occupied |
| No Vehicle | 14 (1.1%) | 24 (12.6%) |
| 1 Vehicle | 542 (40.8%) | 125 (65.4%) |
| 2 Vehicles | 494 (37.2%) | 8 (4.2%) |
| 3 or more Vehicles | 277 (20.9%) | 34 (17.8%) |
| Total | 1,327 (100.0%) | 191 (100.0%) |
Real Estate & Mortgages in Dillonvale
Real Estate and Mortgage Overview in Dillonvale
| Characteristic | Without Mortgage | With Mortgage |
| Housing Units | 427 | 63 |
| Median Property Value | $192,400 | $65,800 |
| Median Household Income | $75,438 | $7 |
| Monthly Housing Costs | $672 | $0 |
| Real Estate Taxes | $3,447 | $0 |
Property Value by Mortgage Status in Dillonvale
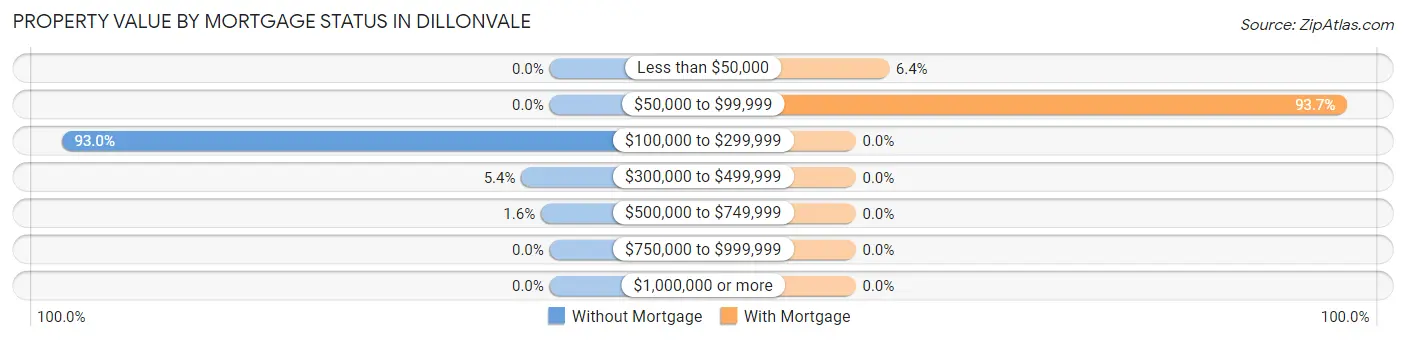
| Property Value | Without Mortgage | With Mortgage |
| Less than $50,000 | 0 (0.0%) | 4 (6.4%) |
| $50,000 to $99,999 | 0 (0.0%) | 59 (93.6%) |
| $100,000 to $299,999 | 397 (93.0%) | 0 (0.0%) |
| $300,000 to $499,999 | 23 (5.4%) | 0 (0.0%) |
| $500,000 to $749,999 | 7 (1.6%) | 0 (0.0%) |
| $750,000 to $999,999 | 0 (0.0%) | 0 (0.0%) |
| $1,000,000 or more | 0 (0.0%) | 0 (0.0%) |
| Total | 427 (100.0%) | 63 (100.0%) |
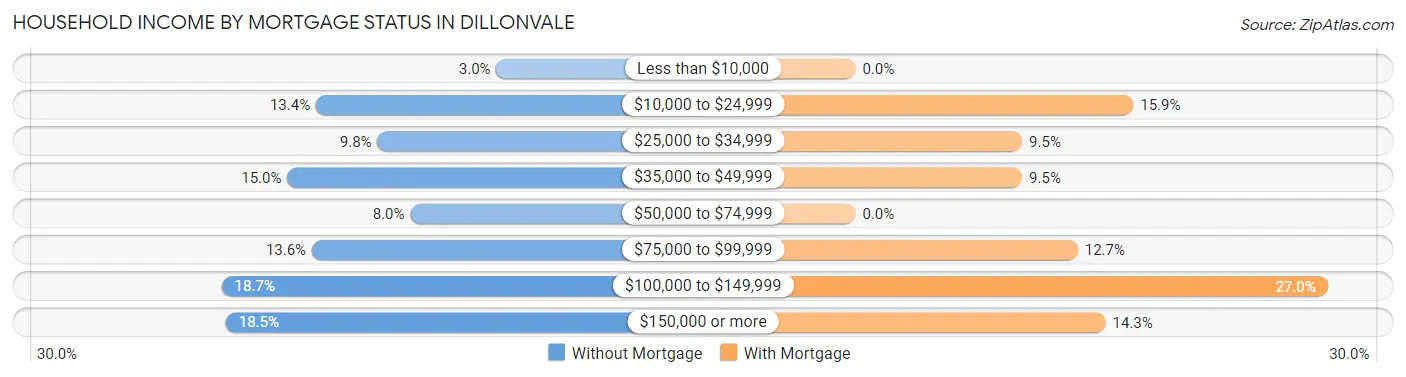
Household Income by Mortgage Status in Dillonvale
| Household Income | Without Mortgage | With Mortgage |
| Less than $10,000 | 13 (3.0%) | 0 (0.0%) |
| $10,000 to $24,999 | 57 (13.4%) | 10 (15.9%) |
| $25,000 to $34,999 | 42 (9.8%) | 6 (9.5%) |
| $35,000 to $49,999 | 64 (15.0%) | 6 (9.5%) |
| $50,000 to $74,999 | 34 (8.0%) | 0 (0.0%) |
| $75,000 to $99,999 | 58 (13.6%) | 8 (12.7%) |
| $100,000 to $149,999 | 80 (18.7%) | 17 (27.0%) |
| $150,000 or more | 79 (18.5%) | 9 (14.3%) |
| Total | 427 (100.0%) | 63 (100.0%) |
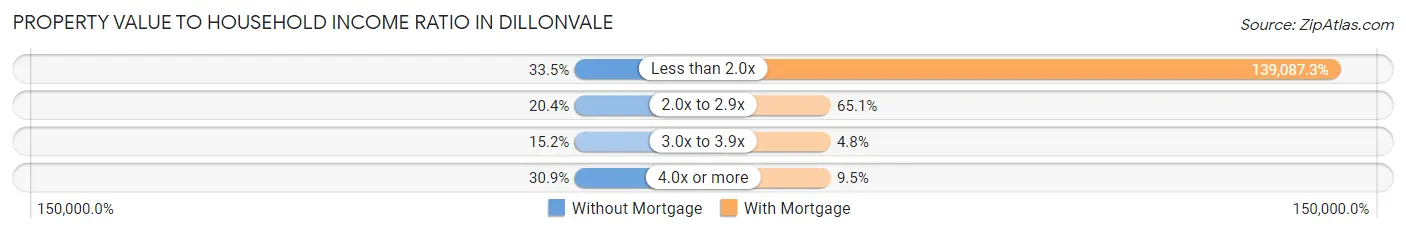
Property Value to Household Income Ratio in Dillonvale
| Value-to-Income Ratio | Without Mortgage | With Mortgage |
| Less than 2.0x | 143 (33.5%) | 87,625 (139,087.3%) |
| 2.0x to 2.9x | 87 (20.4%) | 41 (65.1%) |
| 3.0x to 3.9x | 65 (15.2%) | 3 (4.8%) |
| 4.0x or more | 132 (30.9%) | 6 (9.5%) |
| Total | 427 (100.0%) | 63 (100.0%) |
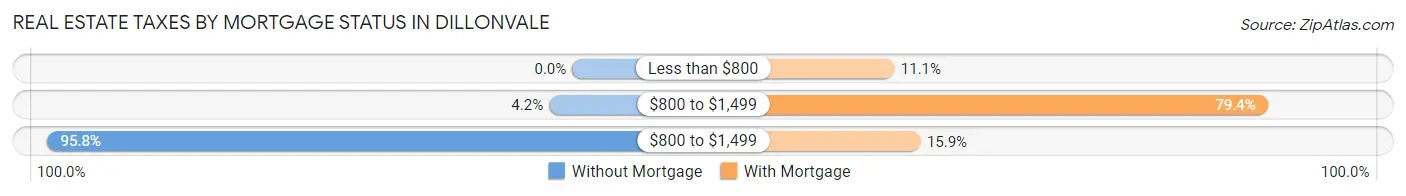
Real Estate Taxes by Mortgage Status in Dillonvale
| Property Taxes | Without Mortgage | With Mortgage |
| Less than $800 | 0 (0.0%) | 7 (11.1%) |
| $800 to $1,499 | 18 (4.2%) | 50 (79.4%) |
| $800 to $1,499 | 409 (95.8%) | 10 (15.9%) |
| Total | 427 (100.0%) | 63 (100.0%) |
Health & Disability in Dillonvale
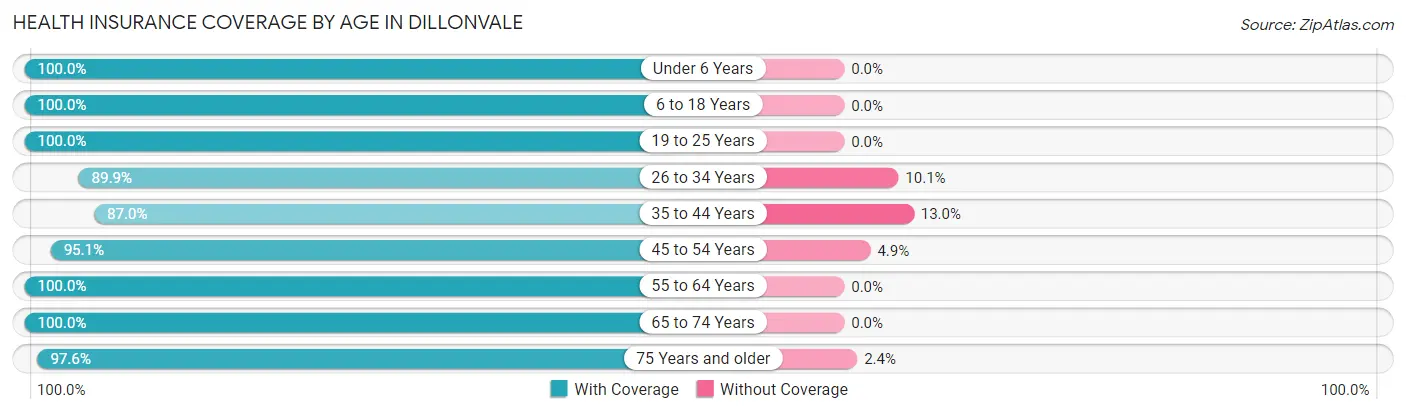
Health Insurance Coverage by Age in Dillonvale
| Age Bracket | With Coverage | Without Coverage |
| Under 6 Years | 25 (100.0%) | 0 (0.0%) |
| 6 to 18 Years | 60 (100.0%) | 0 (0.0%) |
| 19 to 25 Years | 9 (100.0%) | 0 (0.0%) |
| 26 to 34 Years | 98 (89.9%) | 11 (10.1%) |
| 35 to 44 Years | 47 (87.0%) | 7 (13.0%) |
| 45 to 54 Years | 39 (95.1%) | 2 (4.9%) |
| 55 to 64 Years | 159 (100.0%) | 0 (0.0%) |
| 65 to 74 Years | 99 (100.0%) | 0 (0.0%) |
| 75 Years and older | 81 (97.6%) | 2 (2.4%) |
| Total | 617 (96.6%) | 22 (3.4%) |
Health Insurance Coverage by Citizenship Status in Dillonvale
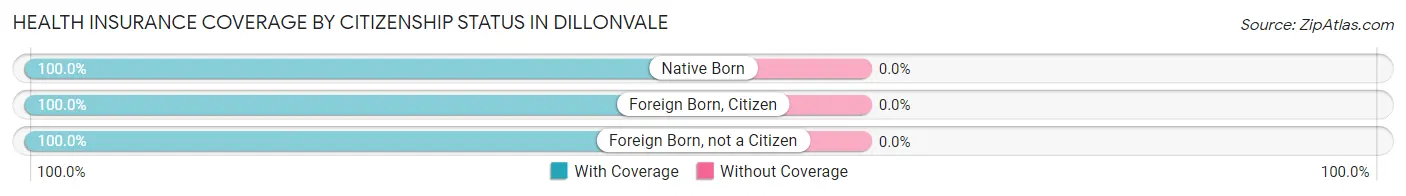
| Citizenship Status | With Coverage | Without Coverage |
| Native Born | 25 (100.0%) | 0 (0.0%) |
| Foreign Born, Citizen | 60 (100.0%) | 0 (0.0%) |
| Foreign Born, not a Citizen | 9 (100.0%) | 0 (0.0%) |
Health Insurance Coverage by Household Income in Dillonvale
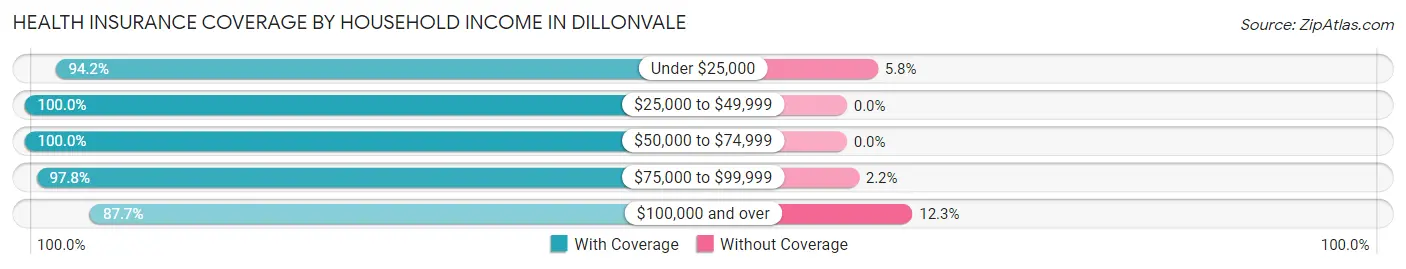
| Household Income | With Coverage | Without Coverage |
| Under $25,000 | 162 (94.2%) | 10 (5.8%) |
| $25,000 to $49,999 | 132 (100.0%) | 0 (0.0%) |
| $50,000 to $74,999 | 55 (100.0%) | 0 (0.0%) |
| $75,000 to $99,999 | 218 (97.8%) | 5 (2.2%) |
| $100,000 and over | 50 (87.7%) | 7 (12.3%) |
Public vs Private Health Insurance Coverage by Age in Dillonvale
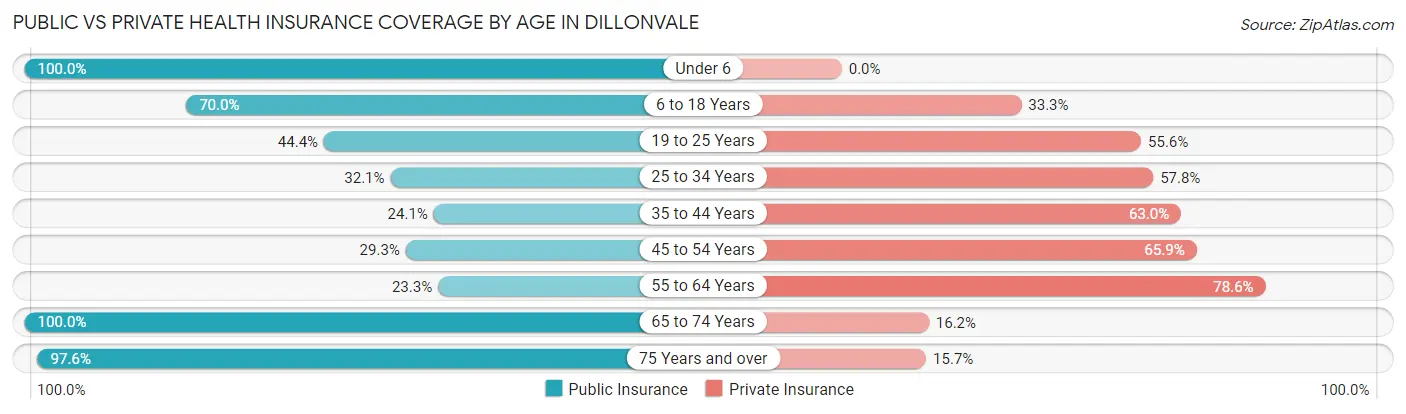
| Age Bracket | Public Insurance | Private Insurance |
| Under 6 | 25 (100.0%) | 0 (0.0%) |
| 6 to 18 Years | 42 (70.0%) | 20 (33.3%) |
| 19 to 25 Years | 4 (44.4%) | 5 (55.6%) |
| 25 to 34 Years | 35 (32.1%) | 63 (57.8%) |
| 35 to 44 Years | 13 (24.1%) | 34 (63.0%) |
| 45 to 54 Years | 12 (29.3%) | 27 (65.8%) |
| 55 to 64 Years | 37 (23.3%) | 125 (78.6%) |
| 65 to 74 Years | 99 (100.0%) | 16 (16.2%) |
| 75 Years and over | 81 (97.6%) | 13 (15.7%) |
| Total | 348 (54.5%) | 303 (47.4%) |
Disability Status by Sex by Age in Dillonvale
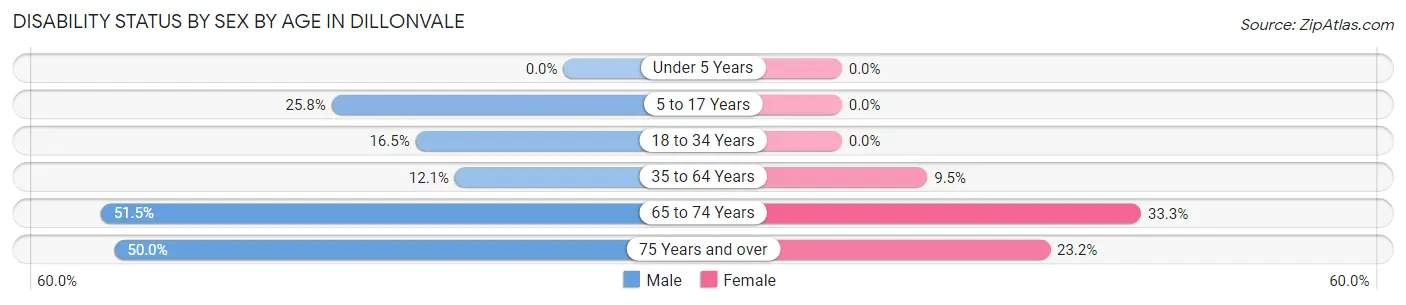
| Age Bracket | Male | Female |
| Under 5 Years | 0 (0.0%) | 0 (0.0%) |
| 5 to 17 Years | 8 (25.8%) | 0 (0.0%) |
| 18 to 34 Years | 14 (16.5%) | 0 (0.0%) |
| 35 to 64 Years | 18 (12.1%) | 10 (9.5%) |
| 65 to 74 Years | 34 (51.5%) | 11 (33.3%) |
| 75 Years and over | 7 (50.0%) | 16 (23.2%) |
Disability Class by Sex by Age in Dillonvale
Disability Class: Hearing Difficulty
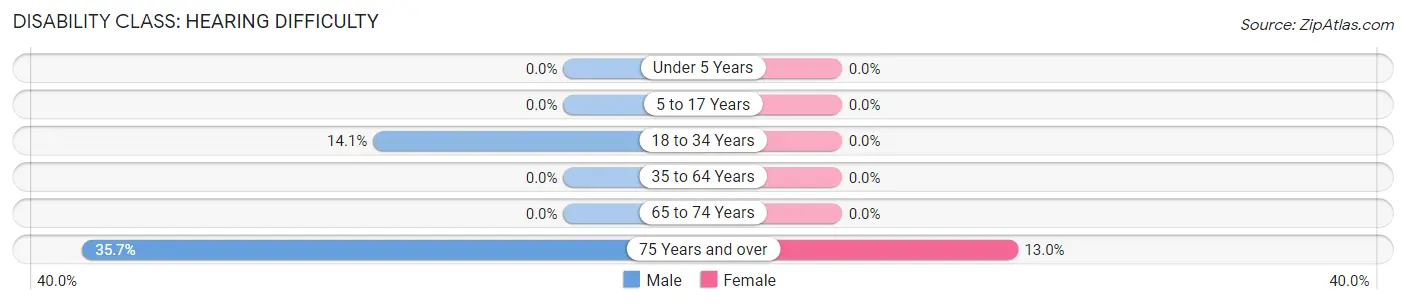
| Age Bracket | Male | Female |
| Under 5 Years | 0 (0.0%) | 0 (0.0%) |
| 5 to 17 Years | 0 (0.0%) | 0 (0.0%) |
| 18 to 34 Years | 12 (14.1%) | 0 (0.0%) |
| 35 to 64 Years | 0 (0.0%) | 0 (0.0%) |
| 65 to 74 Years | 0 (0.0%) | 0 (0.0%) |
| 75 Years and over | 5 (35.7%) | 9 (13.0%) |
Disability Class: Vision Difficulty
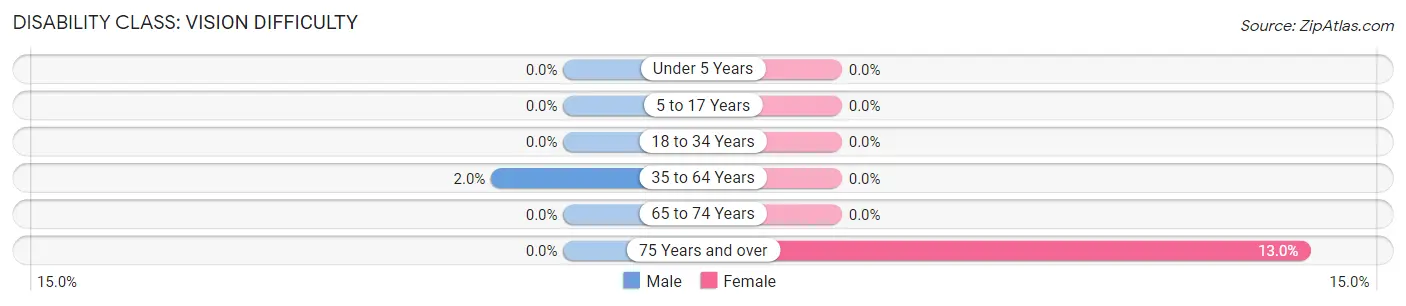
| Age Bracket | Male | Female |
| Under 5 Years | 0 (0.0%) | 0 (0.0%) |
| 5 to 17 Years | 0 (0.0%) | 0 (0.0%) |
| 18 to 34 Years | 0 (0.0%) | 0 (0.0%) |
| 35 to 64 Years | 3 (2.0%) | 0 (0.0%) |
| 65 to 74 Years | 0 (0.0%) | 0 (0.0%) |
| 75 Years and over | 0 (0.0%) | 9 (13.0%) |
Disability Class: Cognitive Difficulty
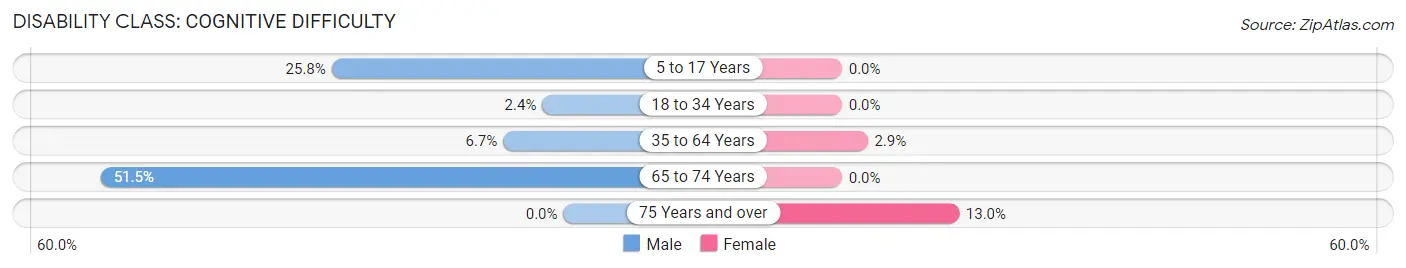
| Age Bracket | Male | Female |
| 5 to 17 Years | 8 (25.8%) | 0 (0.0%) |
| 18 to 34 Years | 2 (2.4%) | 0 (0.0%) |
| 35 to 64 Years | 10 (6.7%) | 3 (2.9%) |
| 65 to 74 Years | 34 (51.5%) | 0 (0.0%) |
| 75 Years and over | 0 (0.0%) | 9 (13.0%) |
Disability Class: Ambulatory Difficulty
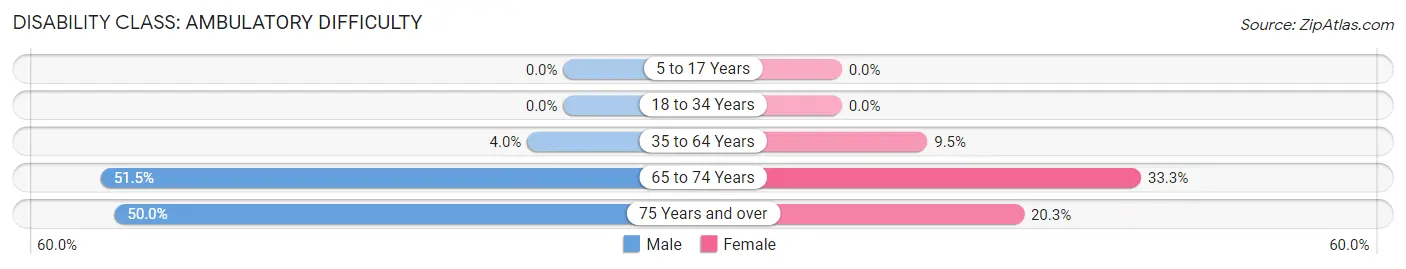
| Age Bracket | Male | Female |
| 5 to 17 Years | 0 (0.0%) | 0 (0.0%) |
| 18 to 34 Years | 0 (0.0%) | 0 (0.0%) |
| 35 to 64 Years | 6 (4.0%) | 10 (9.5%) |
| 65 to 74 Years | 34 (51.5%) | 11 (33.3%) |
| 75 Years and over | 7 (50.0%) | 14 (20.3%) |
Disability Class: Self-Care Difficulty
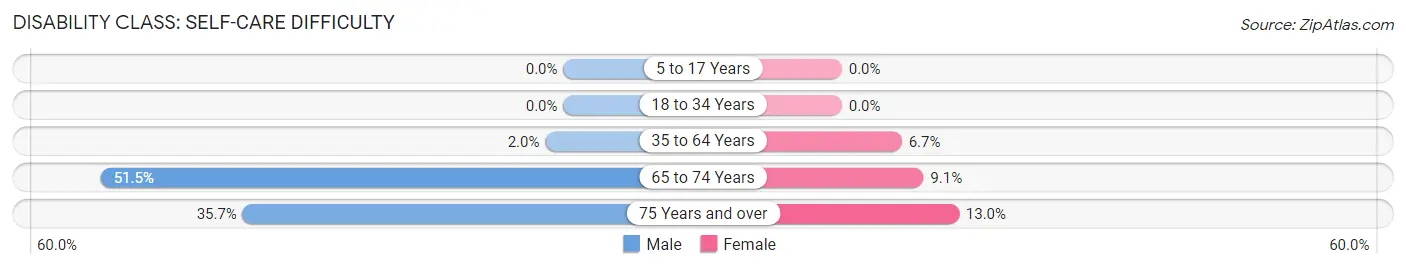
| Age Bracket | Male | Female |
| 5 to 17 Years | 0 (0.0%) | 0 (0.0%) |
| 18 to 34 Years | 0 (0.0%) | 0 (0.0%) |
| 35 to 64 Years | 3 (2.0%) | 7 (6.7%) |
| 65 to 74 Years | 34 (51.5%) | 3 (9.1%) |
| 75 Years and over | 5 (35.7%) | 9 (13.0%) |
Technology Access in Dillonvale
Computing Device Access in Dillonvale
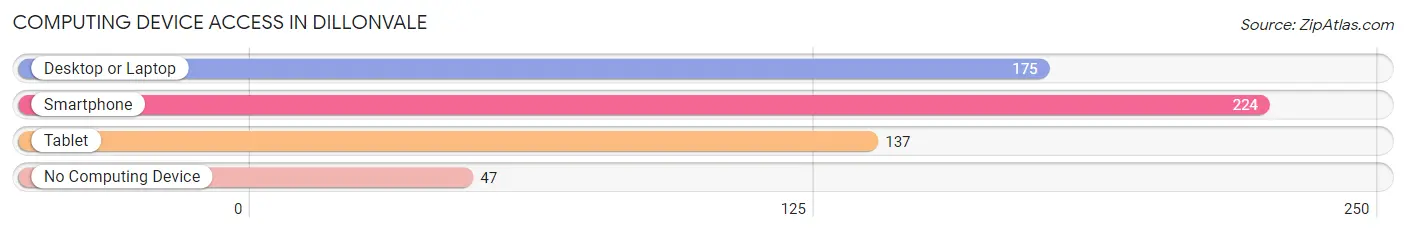
| Device Type | # Households | % Households |
| Desktop or Laptop | 175 | 60.1% |
| Smartphone | 224 | 77.0% |
| Tablet | 137 | 47.1% |
| No Computing Device | 47 | 16.2% |
| Total | 291 | 100.0% |
Internet Access in Dillonvale
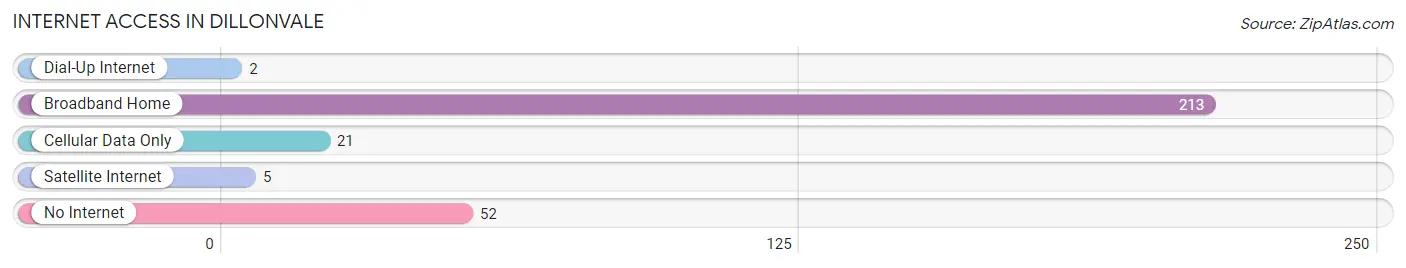
| Internet Type | # Households | % Households |
| Dial-Up Internet | 2 | 0.7% |
| Broadband Home | 213 | 73.2% |
| Cellular Data Only | 21 | 7.2% |
| Satellite Internet | 5 | 1.7% |
| No Internet | 52 | 17.9% |
| Total | 291 | 100.0% |
Dillonvale Summary
Dillonvale is a small village located in Jefferson County, Ohio. It is situated in the southeastern part of the state, approximately 30 miles south of Steubenville and 40 miles west of Pittsburgh, Pennsylvania. The village is part of the Steubenville-Weirton Metropolitan Statistical Area. As of the 2010 census, the population of Dillonvale was 1,845.
History
Dillonvale was founded in 1817 by William Dillon, a Revolutionary War veteran. The village was originally known as “Dillon’s Vale” and was later shortened to Dillonvale. The village was incorporated in 1867.
In the late 19th century, Dillonvale was a thriving coal mining town. The coal industry was the primary source of employment for the residents of Dillonvale. The coal mines were owned by the Dillonvale Coal Company, which was founded in 1872. The company operated several mines in the area, including the Dillonvale Mine, which was located just outside of town.
The coal industry in Dillonvale began to decline in the early 20th century. By the 1950s, the coal mines had closed and the town’s economy shifted to other industries, such as manufacturing and agriculture.
Geography
Dillonvale is located at 39°45'N 80°45'W (39.75, -80.75). The village is situated in the Appalachian Plateau region of Ohio. The terrain is mostly hilly and the elevation is approximately 1,000 feet above sea level.
The village is located in the Ohio River Valley, which is part of the larger Ohio Valley region. The Ohio River forms the western boundary of Dillonvale. The village is also bordered by the towns of Rayland, Tiltonsville, and Yorkville.
Economy
The economy of Dillonvale is largely based on manufacturing and agriculture. The village is home to several manufacturing companies, including a plastics factory, a metal fabrication plant, and a paper mill.
Agriculture is also an important part of the local economy. The surrounding area is home to several farms, which produce a variety of crops, including corn, soybeans, and wheat.
Demographics
As of the 2010 census, the population of Dillonvale was 1,845. The racial makeup of the village was 97.3% White, 0.7% African American, 0.3% Native American, 0.2% Asian, and 1.5% from other races.
The median household income in Dillonvale was $37,917, and the median family income was $45,938. The per capita income was $19,845. Approximately 11.2% of the population was below the poverty line.
Conclusion
Dillonvale is a small village located in Jefferson County, Ohio. It was founded in 1817 and was originally known as “Dillon’s Vale.” The village was once a thriving coal mining town, but the industry declined in the early 20th century. Today, the economy of Dillonvale is largely based on manufacturing and agriculture. As of the 2010 census, the population of Dillonvale was 1,845.
Common Questions
What is Per Capita Income in Dillonvale?
Per Capita income in Dillonvale is $27,499.
What is the Median Family Income in Dillonvale?
Median Family Income in Dillonvale is $52,500.
What is the Median Household income in Dillonvale?
Median Household Income in Dillonvale is $37,292.
What is Income or Wage Gap in Dillonvale?
Income or Wage Gap in Dillonvale is 22.0%.
Women in Dillonvale earn 78.0 cents for every dollar earned by a man.
What is Inequality or Gini Index in Dillonvale?
Inequality or Gini Index in Dillonvale is 0.48.
What is the Total Population of Dillonvale?
Total Population of Dillonvale is 639.
What is the Total Male Population of Dillonvale?
Total Male Population of Dillonvale is 348.
What is the Total Female Population of Dillonvale?
Total Female Population of Dillonvale is 291.
What is the Ratio of Males per 100 Females in Dillonvale?
There are 119.59 Males per 100 Females in Dillonvale.
What is the Ratio of Females per 100 Males in Dillonvale?
There are 83.62 Females per 100 Males in Dillonvale.
What is the Median Population Age in Dillonvale?
Median Population Age in Dillonvale is 57.0 Years.
What is the Average Family Size in Dillonvale
Average Family Size in Dillonvale is 3.2 People.
What is the Average Household Size in Dillonvale
Average Household Size in Dillonvale is 2.2 People.
How Large is the Labor Force in Dillonvale?
There are 280 People in the Labor Forcein in Dillonvale.
What is the Percentage of People in the Labor Force in Dillonvale?
49.6% of People are in the Labor Force in Dillonvale.
What is the Unemployment Rate in Dillonvale?
Unemployment Rate in Dillonvale is 8.2%.