Waverly, OH Map & Demographics
Waverly Map
Waverly Overview
$30,990
PER CAPITA INCOME
$63,555
AVG FAMILY INCOME
$55,146
AVG HOUSEHOLD INCOME
39.1%
WAGE / INCOME GAP [ % ]
60.9¢/ $1
WAGE / INCOME GAP [ $ ]
$5,581
FAMILY INCOME DEFICIT
0.42
INEQUALITY / GINI INDEX
4,154
TOTAL POPULATION
2,044
MALE POPULATION
2,110
FEMALE POPULATION
96.87
MALES / 100 FEMALES
103.23
FEMALES / 100 MALES
44.8
MEDIAN AGE
2.7
AVG FAMILY SIZE
2.2
AVG HOUSEHOLD SIZE
1,939
LABOR FORCE [ PEOPLE ]
56.0%
PERCENT IN LABOR FORCE
3.2%
UNEMPLOYMENT RATE
Waverly Zip Codes
Waverly Area Codes
Income in Waverly
Income Overview in Waverly
Per Capita Income in Waverly is $30,990, while median incomes of families and households are $63,555 and $55,146 respectively.
| Characteristic | Number | Measure |
| Per Capita Income | 4,154 | $30,990 |
| Median Family Income | 1,163 | $63,555 |
| Mean Family Income | 1,163 | $80,233 |
| Median Household Income | 1,857 | $55,146 |
| Mean Household Income | 1,857 | $67,971 |
| Income Deficit | 1,163 | $5,581 |
| Wage / Income Gap (%) | 4,154 | 39.10% |
| Wage / Income Gap ($) | 4,154 | 60.90¢ per $1 |
| Gini / Inequality Index | 4,154 | 0.42 |
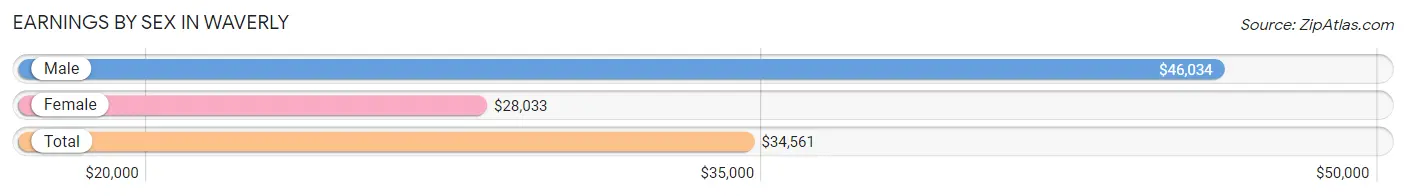
Earnings by Sex in Waverly
Average Earnings in Waverly are $34,561, $46,034 for men and $28,033 for women, a difference of 39.1%.
| Sex | Number | Average Earnings |
| Male | 954 (47.0%) | $46,034 |
| Female | 1,076 (53.0%) | $28,033 |
| Total | 2,030 (100.0%) | $34,561 |
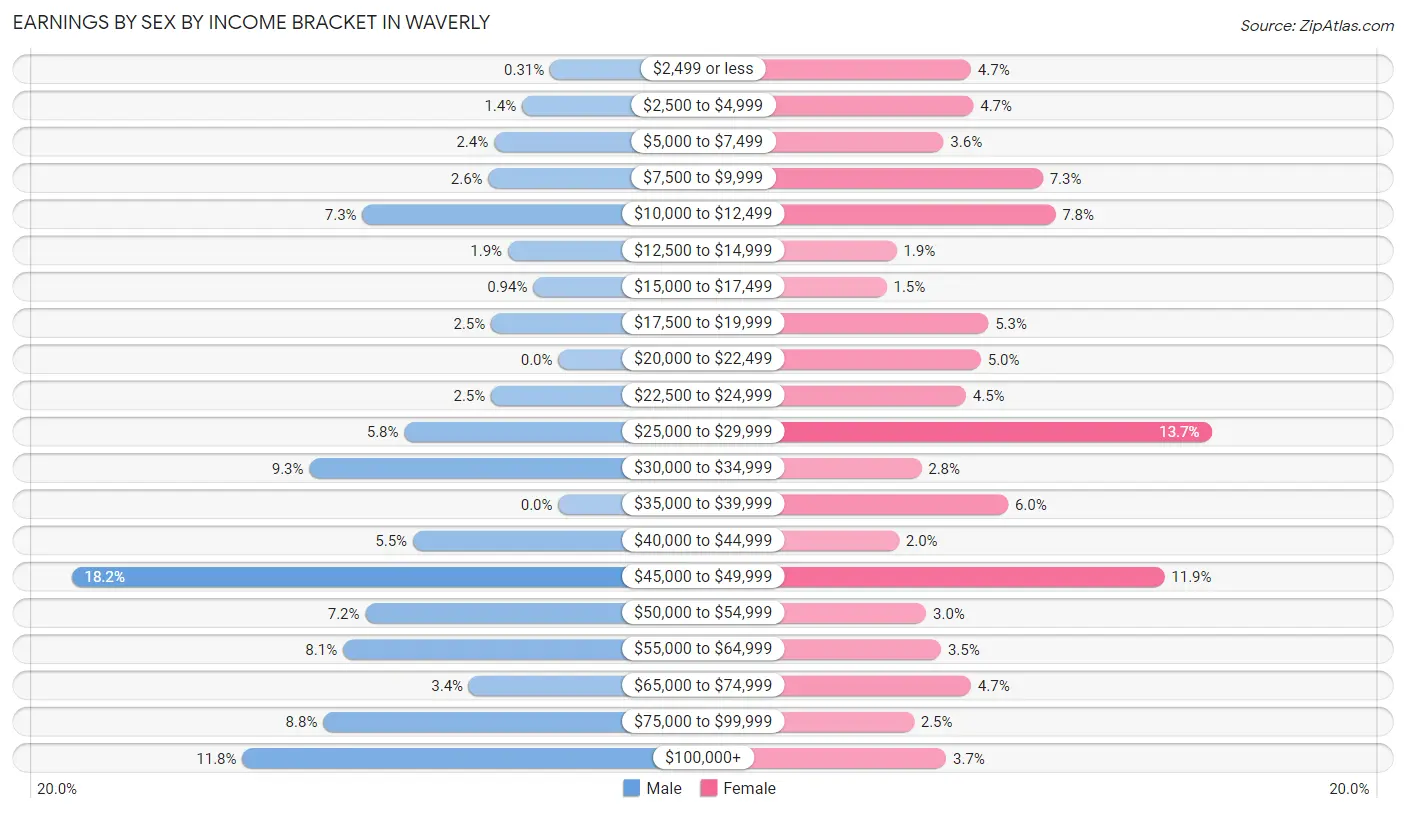
Earnings by Sex by Income Bracket in Waverly
The most common earnings brackets in Waverly are $45,000 to $49,999 for men (174 | 18.2%) and $25,000 to $29,999 for women (147 | 13.7%).
| Income | Male | Female |
| $2,499 or less | 3 (0.3%) | 50 (4.6%) |
| $2,500 to $4,999 | 13 (1.4%) | 51 (4.7%) |
| $5,000 to $7,499 | 23 (2.4%) | 39 (3.6%) |
| $7,500 to $9,999 | 25 (2.6%) | 79 (7.3%) |
| $10,000 to $12,499 | 70 (7.3%) | 84 (7.8%) |
| $12,500 to $14,999 | 18 (1.9%) | 20 (1.9%) |
| $15,000 to $17,499 | 9 (0.9%) | 16 (1.5%) |
| $17,500 to $19,999 | 24 (2.5%) | 57 (5.3%) |
| $20,000 to $22,499 | 0 (0.0%) | 54 (5.0%) |
| $22,500 to $24,999 | 24 (2.5%) | 48 (4.5%) |
| $25,000 to $29,999 | 55 (5.8%) | 147 (13.7%) |
| $30,000 to $34,999 | 89 (9.3%) | 30 (2.8%) |
| $35,000 to $39,999 | 0 (0.0%) | 65 (6.0%) |
| $40,000 to $44,999 | 52 (5.4%) | 21 (1.9%) |
| $45,000 to $49,999 | 174 (18.2%) | 128 (11.9%) |
| $50,000 to $54,999 | 69 (7.2%) | 32 (3.0%) |
| $55,000 to $64,999 | 77 (8.1%) | 38 (3.5%) |
| $65,000 to $74,999 | 32 (3.4%) | 50 (4.6%) |
| $75,000 to $99,999 | 84 (8.8%) | 27 (2.5%) |
| $100,000+ | 113 (11.8%) | 40 (3.7%) |
| Total | 954 (100.0%) | 1,076 (100.0%) |
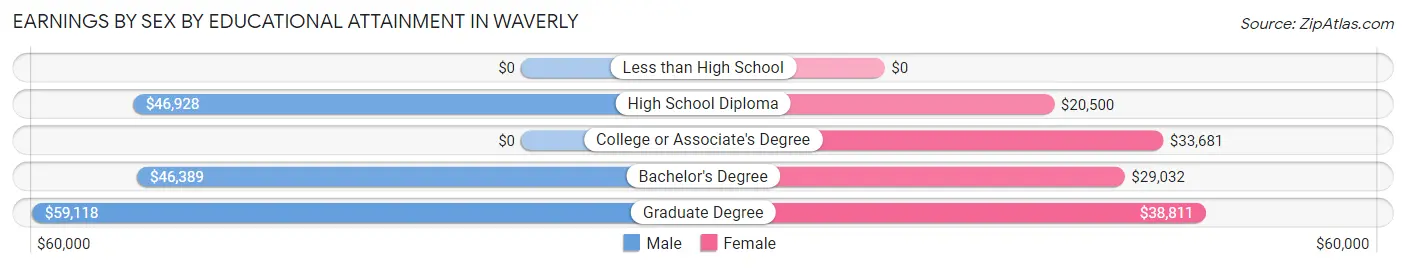
Earnings by Sex by Educational Attainment in Waverly
Average earnings in Waverly are $46,243 for men and $28,676 for women, a difference of 38.0%. Men with an educational attainment of graduate degree enjoy the highest average annual earnings of $59,118, while those with bachelor's degree education earn the least with $46,389. Women with an educational attainment of graduate degree earn the most with the average annual earnings of $38,811, while those with high school diploma education have the smallest earnings of $20,500.
| Educational Attainment | Male Income | Female Income |
| Less than High School | - | - |
| High School Diploma | $46,928 | $20,500 |
| College or Associate's Degree | - | - |
| Bachelor's Degree | $46,389 | $29,032 |
| Graduate Degree | $59,118 | $38,811 |
| Total | $46,243 | $28,676 |
Family Income in Waverly
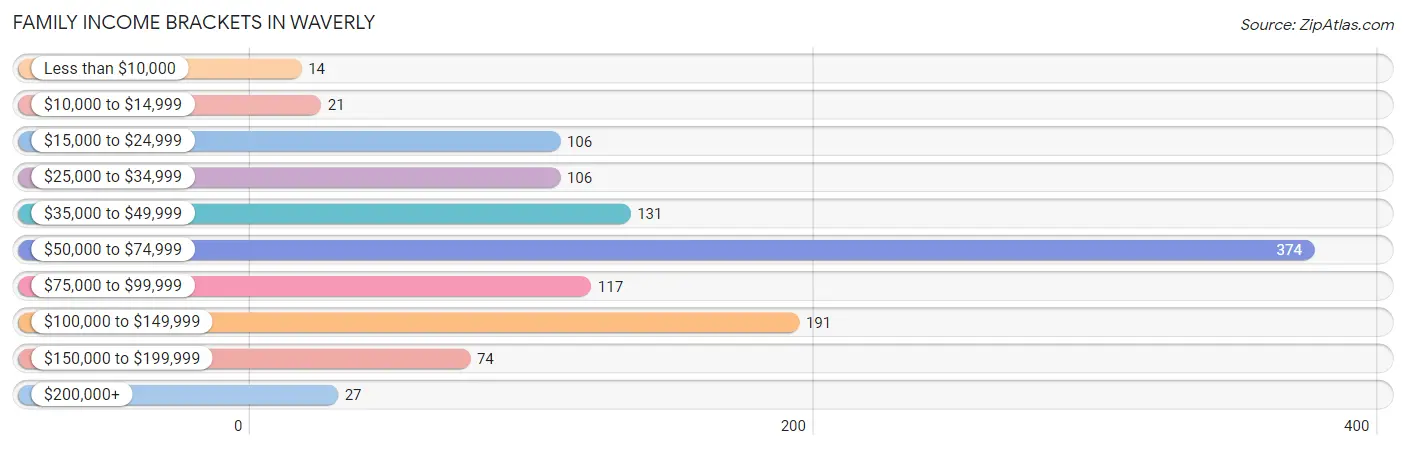
Family Income Brackets in Waverly
According to the Waverly family income data, there are 374 families falling into the $50,000 to $74,999 income range, which is the most common income bracket and makes up 32.2% of all families. Conversely, the less than $10,000 income bracket is the least frequent group with only 14 families (1.2%) belonging to this category.
| Income Bracket | # Families | % Families |
| Less than $10,000 | 14 | 1.2% |
| $10,000 to $14,999 | 21 | 1.8% |
| $15,000 to $24,999 | 106 | 9.1% |
| $25,000 to $34,999 | 106 | 9.1% |
| $35,000 to $49,999 | 131 | 11.3% |
| $50,000 to $74,999 | 374 | 32.2% |
| $75,000 to $99,999 | 117 | 10.1% |
| $100,000 to $149,999 | 191 | 16.4% |
| $150,000 to $199,999 | 74 | 6.4% |
| $200,000+ | 27 | 2.3% |
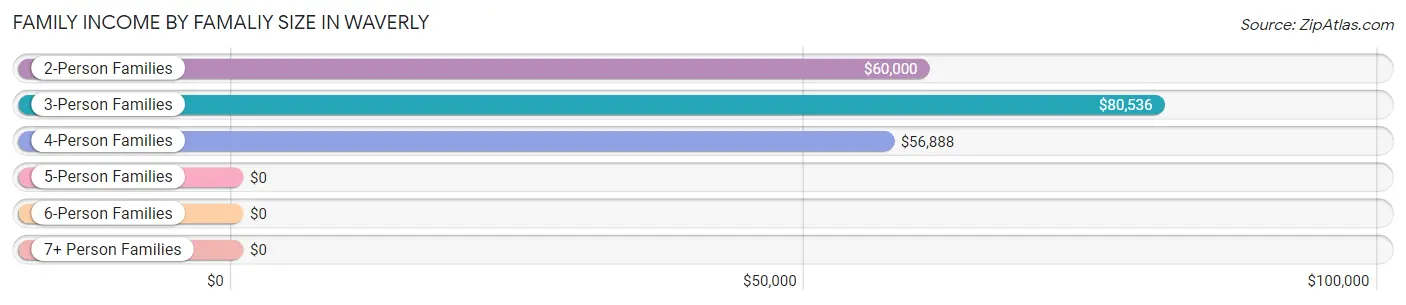
Family Income by Famaliy Size in Waverly
3-person families (225 | 19.4%) account for the highest median family income in Waverly with $80,536 per family, while 2-person families (736 | 63.3%) have the highest median income of $30,000 per family member.
| Income Bracket | # Families | Median Income |
| 2-Person Families | 736 (63.3%) | $60,000 |
| 3-Person Families | 225 (19.4%) | $80,536 |
| 4-Person Families | 103 (8.9%) | $56,888 |
| 5-Person Families | 34 (2.9%) | $0 |
| 6-Person Families | 40 (3.4%) | $0 |
| 7+ Person Families | 25 (2.1%) | $0 |
| Total | 1,163 (100.0%) | $63,555 |
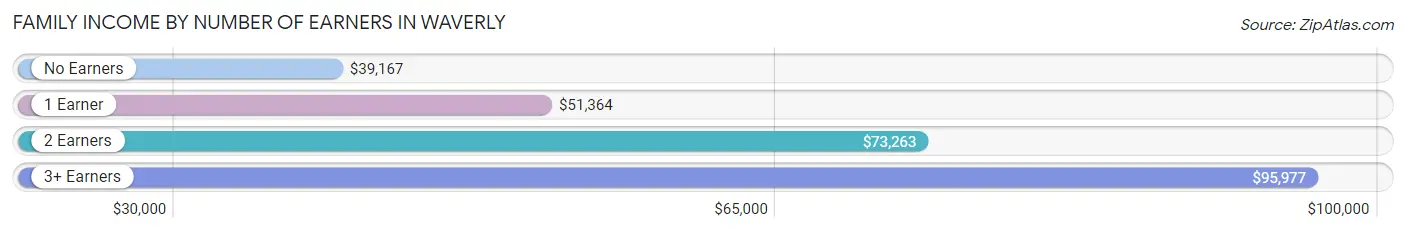
Family Income by Number of Earners in Waverly
The median family income in Waverly is $63,555, with families comprising 3+ earners (89) having the highest median family income of $95,977, while families with no earners (192) have the lowest median family income of $39,167, accounting for 7.6% and 16.5% of families, respectively.
| Number of Earners | # Families | Median Income |
| No Earners | 192 (16.5%) | $39,167 |
| 1 Earner | 374 (32.2%) | $51,364 |
| 2 Earners | 508 (43.7%) | $73,263 |
| 3+ Earners | 89 (7.6%) | $95,977 |
| Total | 1,163 (100.0%) | $63,555 |
Household Income in Waverly
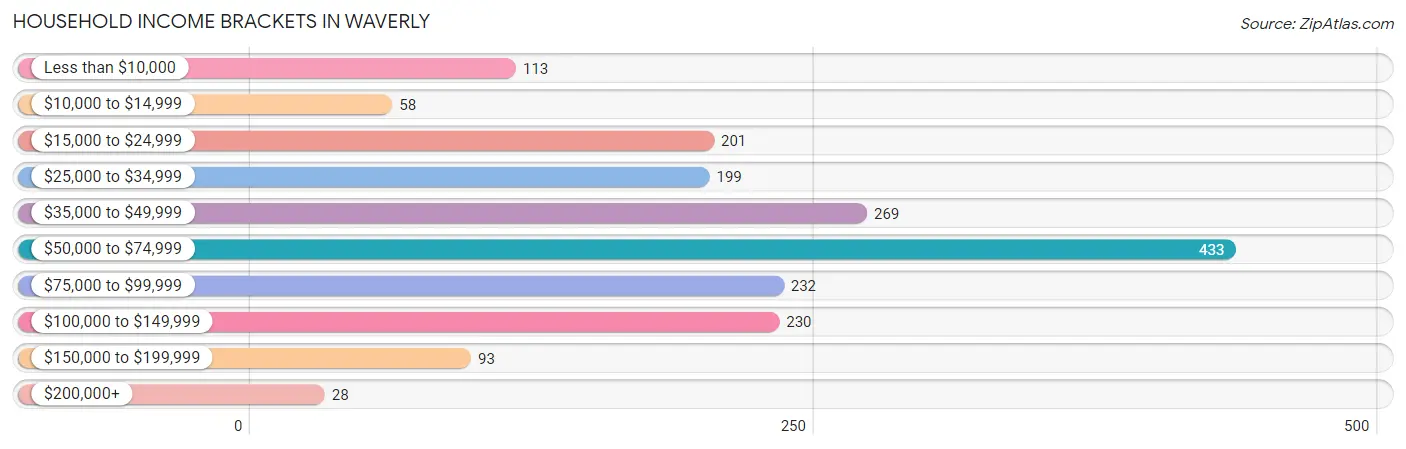
Household Income Brackets in Waverly
With 433 households falling in the category, the $50,000 to $74,999 income range is the most frequent in Waverly, accounting for 23.3% of all households. In contrast, only 28 households (1.5%) fall into the $200,000+ income bracket, making it the least populous group.
| Income Bracket | # Households | % Households |
| Less than $10,000 | 113 | 6.1% |
| $10,000 to $14,999 | 58 | 3.1% |
| $15,000 to $24,999 | 201 | 10.8% |
| $25,000 to $34,999 | 199 | 10.7% |
| $35,000 to $49,999 | 269 | 14.5% |
| $50,000 to $74,999 | 433 | 23.3% |
| $75,000 to $99,999 | 232 | 12.5% |
| $100,000 to $149,999 | 230 | 12.4% |
| $150,000 to $199,999 | 93 | 5.0% |
| $200,000+ | 28 | 1.5% |
Household Income by Householder Age in Waverly
The median household income in Waverly is $55,146, with the highest median household income of $65,800 found in the 25 to 44 years age bracket for the primary householder. A total of 558 households (30.0%) fall into this category. Meanwhile, the 15 to 24 years age bracket for the primary householder has the lowest median household income of $0, with 39 households (2.1%) in this group.
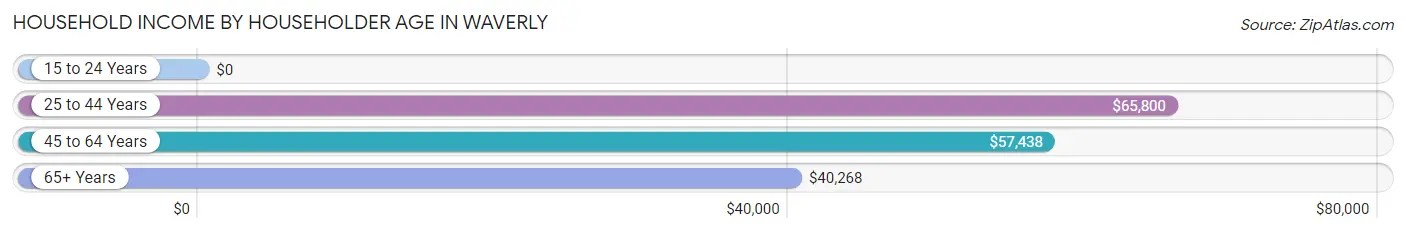
| Income Bracket | # Households | Median Income |
| 15 to 24 Years | 39 (2.1%) | $0 |
| 25 to 44 Years | 558 (30.0%) | $65,800 |
| 45 to 64 Years | 707 (38.1%) | $57,438 |
| 65+ Years | 553 (29.8%) | $40,268 |
| Total | 1,857 (100.0%) | $55,146 |
Poverty in Waverly
Income Below Poverty by Sex and Age in Waverly
With 9.0% poverty level for males and 11.8% for females among the residents of Waverly, 15 year old males and 15 year old females are the most vulnerable to poverty, with 4 males (33.3%) and 14 females (25.0%) in their respective age groups living below the poverty level.
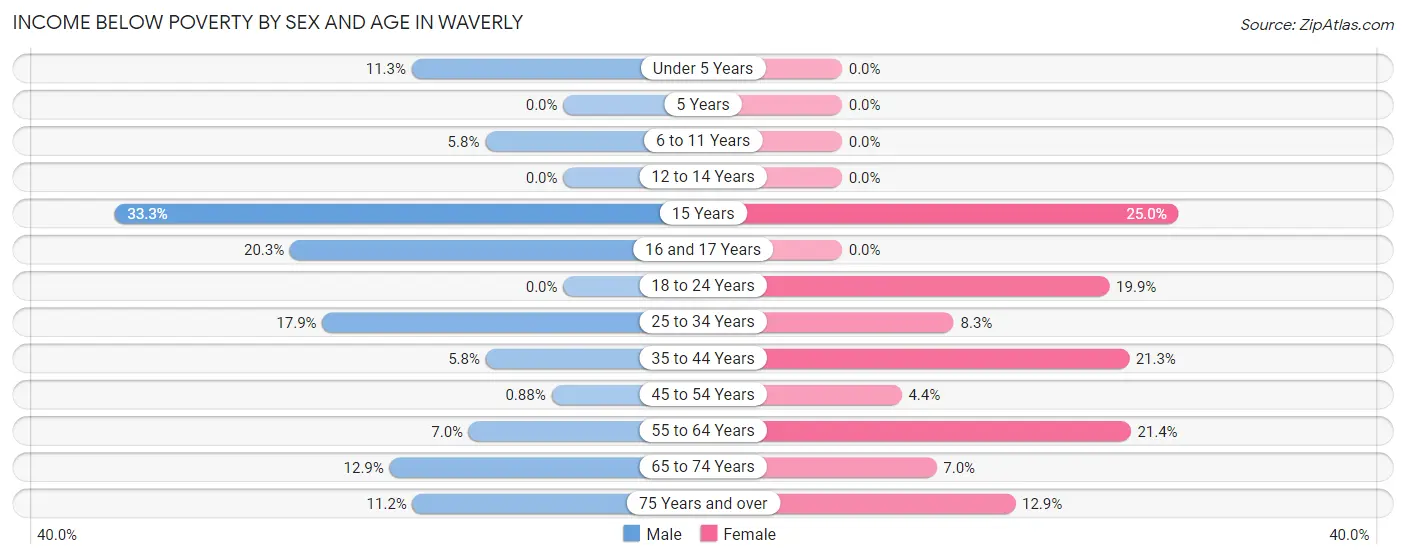
| Age Bracket | Male | Female |
| Under 5 Years | 9 (11.3%) | 0 (0.0%) |
| 5 Years | 0 (0.0%) | 0 (0.0%) |
| 6 to 11 Years | 8 (5.8%) | 0 (0.0%) |
| 12 to 14 Years | 0 (0.0%) | 0 (0.0%) |
| 15 Years | 4 (33.3%) | 14 (25.0%) |
| 16 and 17 Years | 14 (20.3%) | 0 (0.0%) |
| 18 to 24 Years | 0 (0.0%) | 27 (19.9%) |
| 25 to 34 Years | 68 (17.9%) | 22 (8.3%) |
| 35 to 44 Years | 14 (5.8%) | 36 (21.3%) |
| 45 to 54 Years | 2 (0.9%) | 12 (4.4%) |
| 55 to 64 Years | 22 (7.0%) | 90 (21.4%) |
| 65 to 74 Years | 24 (12.9%) | 17 (7.0%) |
| 75 Years and over | 15 (11.2%) | 27 (12.9%) |
| Total | 180 (9.0%) | 245 (11.8%) |
Income Above Poverty by Sex and Age in Waverly
According to the poverty statistics in Waverly, males aged 5 years and females aged under 5 years are the age groups that are most secure financially, with 100.0% of males and 100.0% of females in these age groups living above the poverty line.
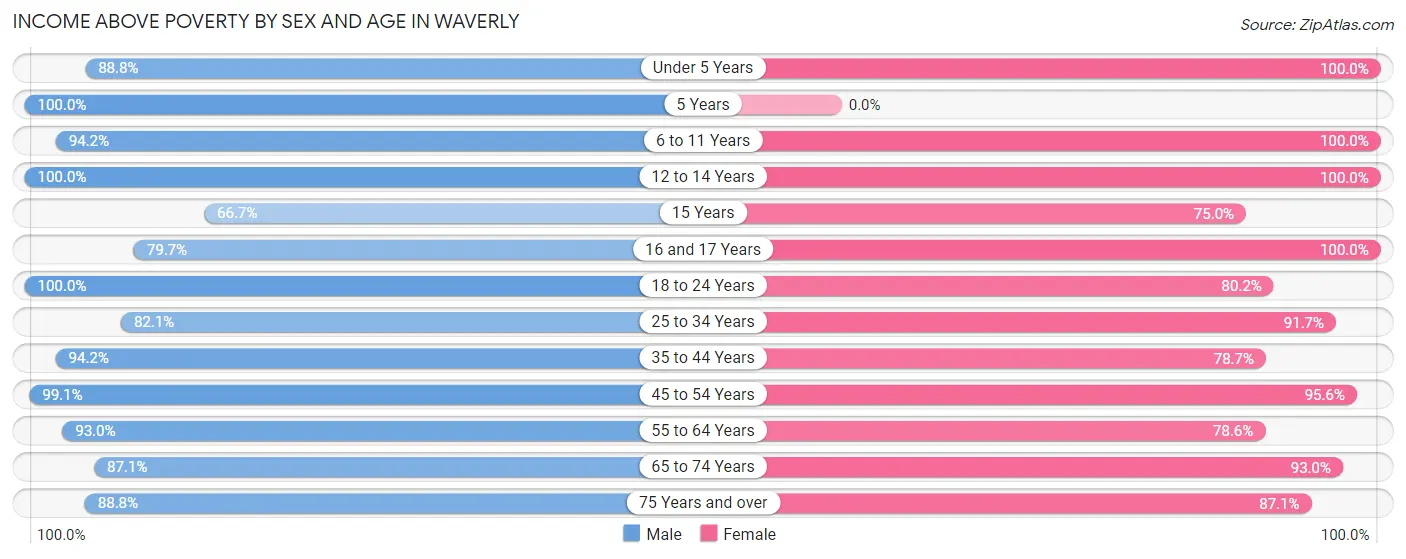
| Age Bracket | Male | Female |
| Under 5 Years | 71 (88.7%) | 17 (100.0%) |
| 5 Years | 28 (100.0%) | 0 (0.0%) |
| 6 to 11 Years | 130 (94.2%) | 218 (100.0%) |
| 12 to 14 Years | 94 (100.0%) | 39 (100.0%) |
| 15 Years | 8 (66.7%) | 42 (75.0%) |
| 16 and 17 Years | 55 (79.7%) | 41 (100.0%) |
| 18 to 24 Years | 92 (100.0%) | 109 (80.1%) |
| 25 to 34 Years | 312 (82.1%) | 243 (91.7%) |
| 35 to 44 Years | 229 (94.2%) | 133 (78.7%) |
| 45 to 54 Years | 224 (99.1%) | 259 (95.6%) |
| 55 to 64 Years | 292 (93.0%) | 330 (78.6%) |
| 65 to 74 Years | 162 (87.1%) | 225 (93.0%) |
| 75 Years and over | 119 (88.8%) | 183 (87.1%) |
| Total | 1,816 (91.0%) | 1,839 (88.2%) |
Income Below Poverty Among Married-Couple Families in Waverly
The poverty statistics for married-couple families in Waverly show that 3.0% or 23 of the total 764 families live below the poverty line. Families with 1 or 2 children have the highest poverty rate of 8.5%, comprising of 18 families. On the other hand, families with 3 or 4 children have the lowest poverty rate of 0.0%, which includes 0 families.
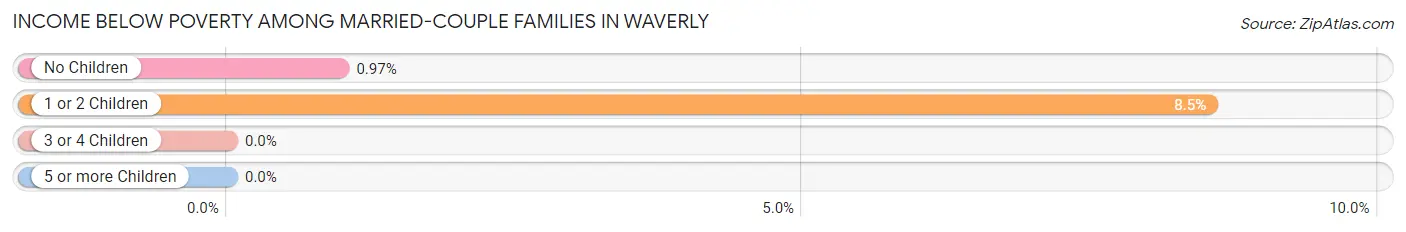
| Children | Above Poverty | Below Poverty |
| No Children | 509 (99.0%) | 5 (1.0%) |
| 1 or 2 Children | 193 (91.5%) | 18 (8.5%) |
| 3 or 4 Children | 14 (100.0%) | 0 (0.0%) |
| 5 or more Children | 25 (100.0%) | 0 (0.0%) |
| Total | 741 (97.0%) | 23 (3.0%) |
Income Below Poverty Among Single-Parent Households in Waverly
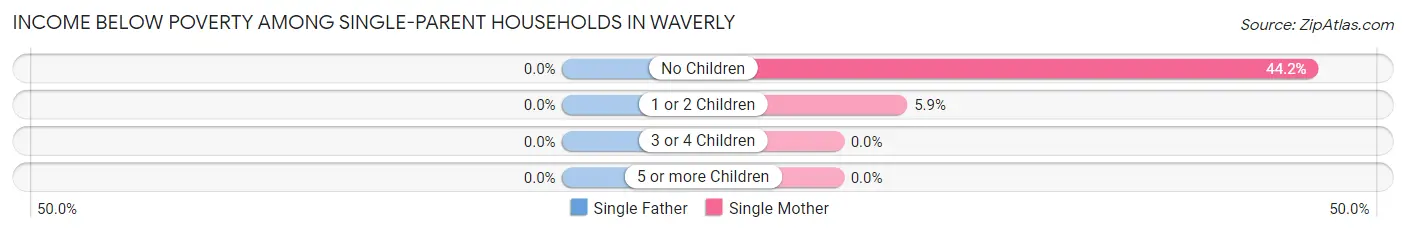
| Children | Single Father | Single Mother |
| No Children | 0 (0.0%) | 42 (44.2%) |
| 1 or 2 Children | 0 (0.0%) | 9 (5.9%) |
| 3 or 4 Children | 0 (0.0%) | 0 (0.0%) |
| 5 or more Children | 0 (0.0%) | 0 (0.0%) |
| Total | 0 (0.0%) | 51 (19.3%) |
Income Below Poverty Among Married-Couple vs Single-Parent Households in Waverly
The poverty data for Waverly shows that 23 of the married-couple family households (3.0%) and 51 of the single-parent households (12.8%) are living below the poverty level. Within the married-couple family households, those with 1 or 2 children have the highest poverty rate, with 18 households (8.5%) falling below the poverty line. Among the single-parent households, those with no children have the highest poverty rate, with 42 household (31.8%) living below poverty.
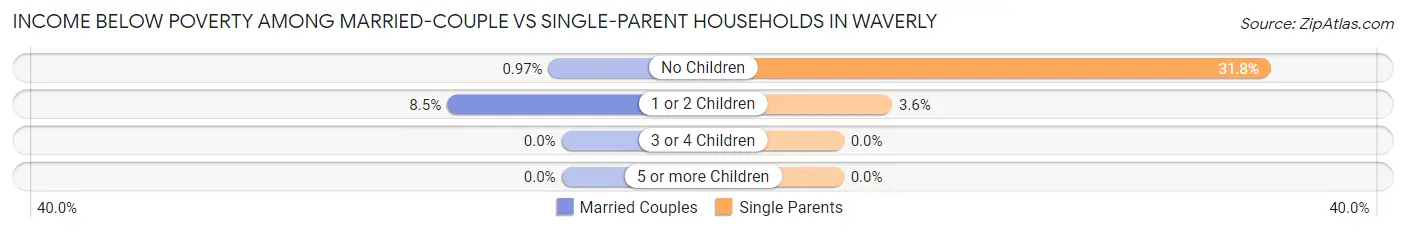
| Children | Married-Couple Families | Single-Parent Households |
| No Children | 5 (1.0%) | 42 (31.8%) |
| 1 or 2 Children | 18 (8.5%) | 9 (3.6%) |
| 3 or 4 Children | 0 (0.0%) | 0 (0.0%) |
| 5 or more Children | 0 (0.0%) | 0 (0.0%) |
| Total | 23 (3.0%) | 51 (12.8%) |
Race in Waverly
The most populous races in Waverly are White / Caucasian (4,059 | 97.7%), Two or more Races (69 | 1.7%), and Hispanic or Latino (15 | 0.4%).
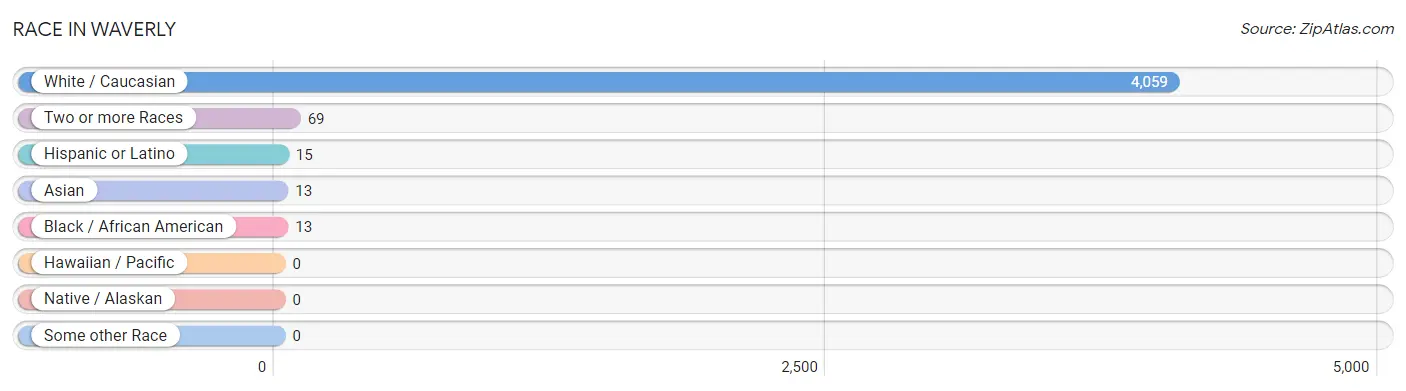
| Race | # Population | % Population |
| Asian | 13 | 0.3% |
| Black / African American | 13 | 0.3% |
| Hawaiian / Pacific | 0 | 0.0% |
| Hispanic or Latino | 15 | 0.4% |
| Native / Alaskan | 0 | 0.0% |
| White / Caucasian | 4,059 | 97.7% |
| Two or more Races | 69 | 1.7% |
| Some other Race | 0 | 0.0% |
| Total | 4,154 | 100.0% |
Ancestry in Waverly
The most populous ancestries reported in Waverly are German (660 | 15.9%), Irish (480 | 11.6%), American (411 | 9.9%), English (350 | 8.4%), and Russian (128 | 3.1%), together accounting for 48.8% of all Waverly residents.
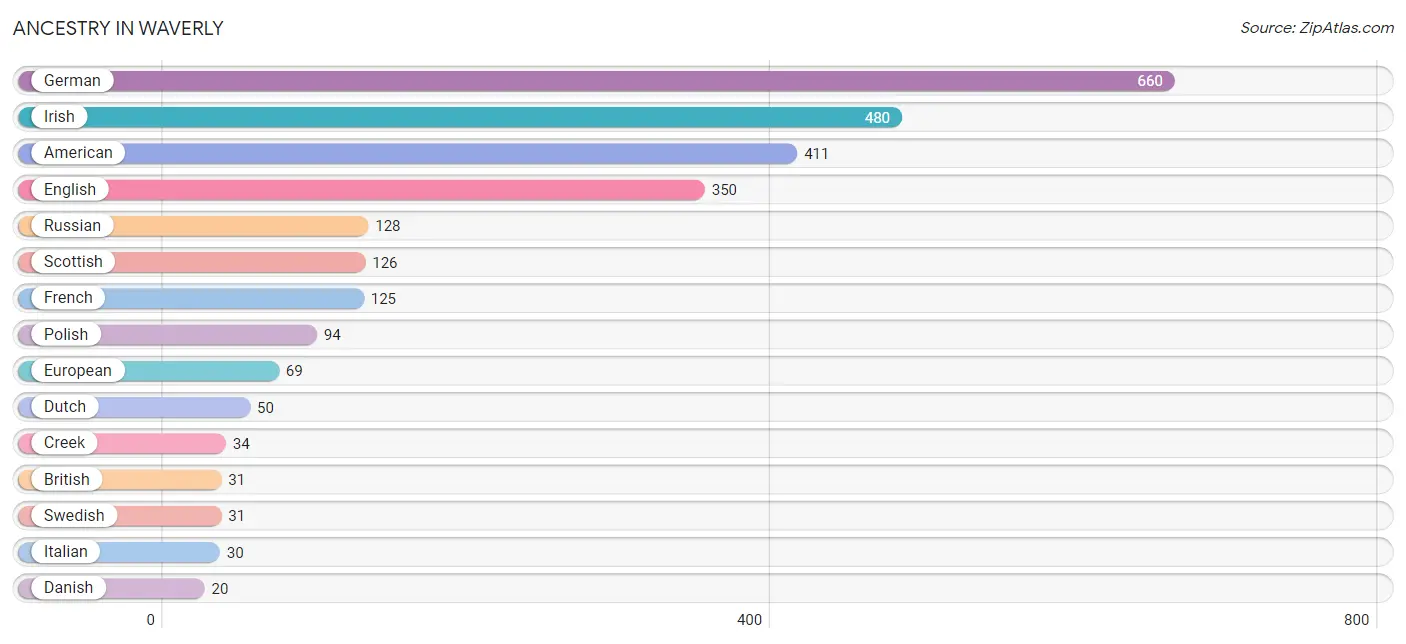
| Ancestry | # Population | % Population |
| American | 411 | 9.9% |
| British | 31 | 0.7% |
| Burmese | 10 | 0.2% |
| Creek | 34 | 0.8% |
| Cuban | 15 | 0.4% |
| Danish | 20 | 0.5% |
| Dutch | 50 | 1.2% |
| Eastern European | 15 | 0.4% |
| English | 350 | 8.4% |
| European | 69 | 1.7% |
| French | 125 | 3.0% |
| German | 660 | 15.9% |
| Greek | 9 | 0.2% |
| Irish | 480 | 11.6% |
| Italian | 30 | 0.7% |
| Norwegian | 6 | 0.1% |
| Polish | 94 | 2.3% |
| Russian | 128 | 3.1% |
| Scottish | 126 | 3.0% |
| Sri Lankan | 3 | 0.1% |
| Swedish | 31 | 0.7% |
| Swiss | 10 | 0.2% |
| Thai | 10 | 0.2% |
| Welsh | 8 | 0.2% | View All 24 Rows |
Immigrants in Waverly
The most numerous immigrant groups reported in Waverly came from Asia (13 | 0.3%), Eastern Asia (10 | 0.2%), Korea (10 | 0.2%), Canada (7 | 0.2%), and South Eastern Asia (3 | 0.1%), together accounting for 1.0% of all Waverly residents.
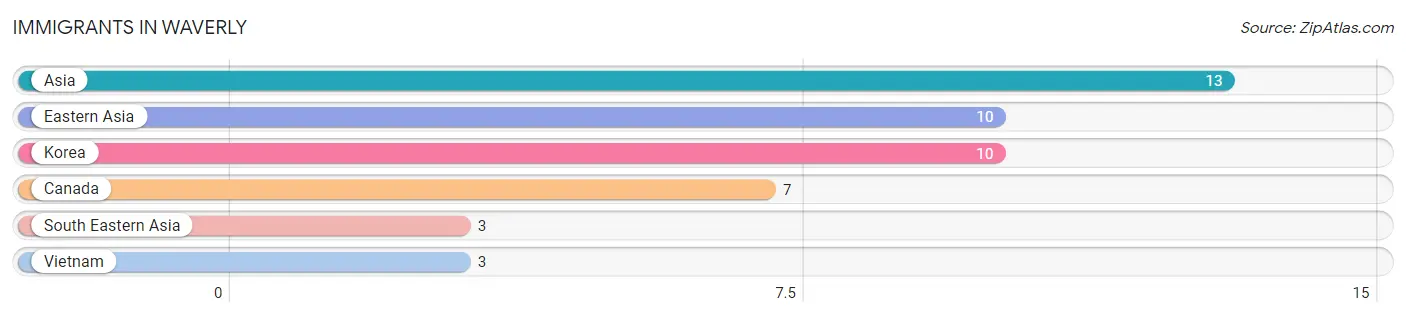
| Immigration Origin | # Population | % Population |
| Asia | 13 | 0.3% |
| Canada | 7 | 0.2% |
| Eastern Asia | 10 | 0.2% |
| Korea | 10 | 0.2% |
| South Eastern Asia | 3 | 0.1% |
| Vietnam | 3 | 0.1% | View All 6 Rows |
Sex and Age in Waverly
Sex and Age in Waverly
The most populous age groups in Waverly are 25 to 29 Years (268 | 13.1%) for men and 60 to 64 Years (252 | 11.9%) for women.
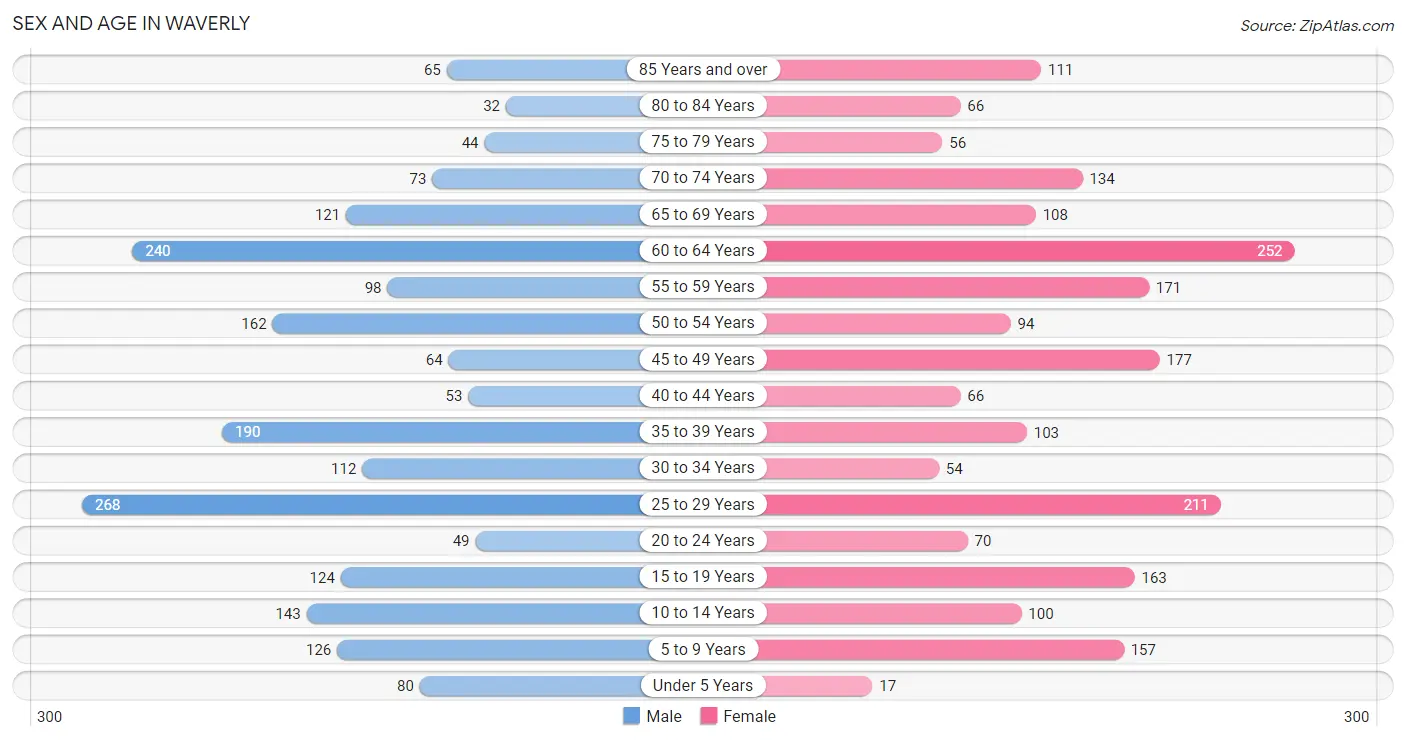
| Age Bracket | Male | Female |
| Under 5 Years | 80 (3.9%) | 17 (0.8%) |
| 5 to 9 Years | 126 (6.2%) | 157 (7.4%) |
| 10 to 14 Years | 143 (7.0%) | 100 (4.7%) |
| 15 to 19 Years | 124 (6.1%) | 163 (7.7%) |
| 20 to 24 Years | 49 (2.4%) | 70 (3.3%) |
| 25 to 29 Years | 268 (13.1%) | 211 (10.0%) |
| 30 to 34 Years | 112 (5.5%) | 54 (2.6%) |
| 35 to 39 Years | 190 (9.3%) | 103 (4.9%) |
| 40 to 44 Years | 53 (2.6%) | 66 (3.1%) |
| 45 to 49 Years | 64 (3.1%) | 177 (8.4%) |
| 50 to 54 Years | 162 (7.9%) | 94 (4.4%) |
| 55 to 59 Years | 98 (4.8%) | 171 (8.1%) |
| 60 to 64 Years | 240 (11.7%) | 252 (11.9%) |
| 65 to 69 Years | 121 (5.9%) | 108 (5.1%) |
| 70 to 74 Years | 73 (3.6%) | 134 (6.4%) |
| 75 to 79 Years | 44 (2.1%) | 56 (2.6%) |
| 80 to 84 Years | 32 (1.6%) | 66 (3.1%) |
| 85 Years and over | 65 (3.2%) | 111 (5.3%) |
| Total | 2,044 (100.0%) | 2,110 (100.0%) |
Families and Households in Waverly
Median Family Size in Waverly
The median family size in Waverly is 2.74 persons per family, with married-couple families (764 | 65.7%) accounting for the largest median family size of 2.9 persons per family. On the other hand, single male/father families (135 | 11.6%) represent the smallest median family size with 2.29 persons per family.
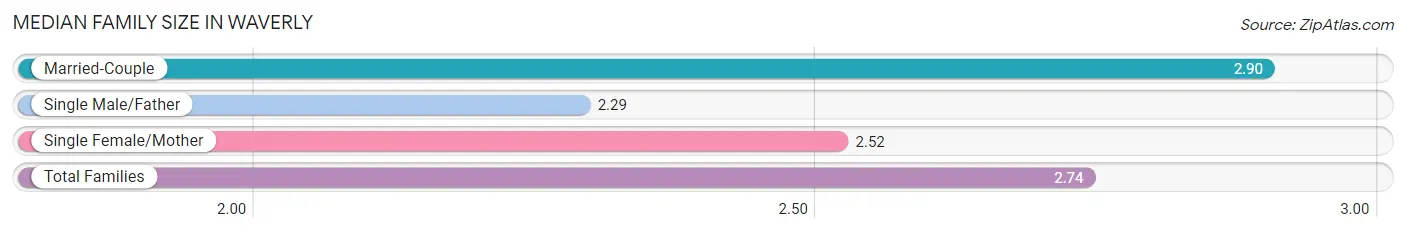
| Family Type | # Families | Family Size |
| Married-Couple | 764 (65.7%) | 2.90 |
| Single Male/Father | 135 (11.6%) | 2.29 |
| Single Female/Mother | 264 (22.7%) | 2.52 |
| Total Families | 1,163 (100.0%) | 2.74 |
Median Household Size in Waverly
The median household size in Waverly is 2.18 persons per household, with married-couple households (764 | 41.1%) accounting for the largest median household size of 2.92 persons per household. non-family households (694 | 37.4%) represent the smallest median household size with 1.09 persons per household.
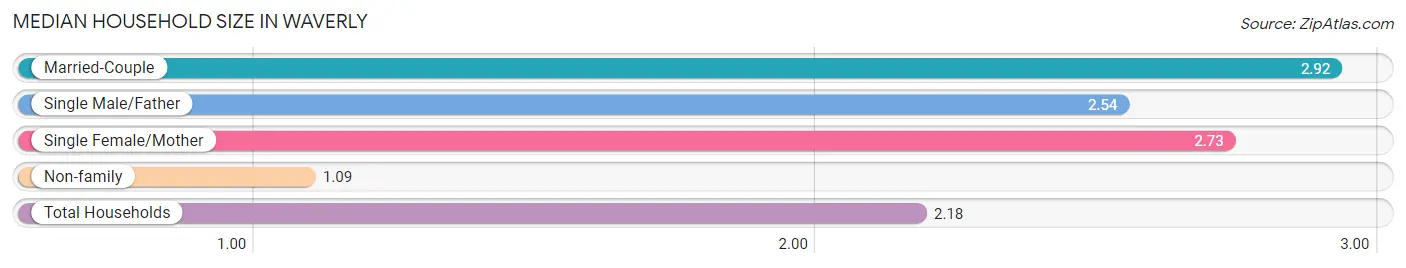
| Household Type | # Households | Household Size |
| Married-Couple | 764 (41.1%) | 2.92 |
| Single Male/Father | 135 (7.3%) | 2.54 |
| Single Female/Mother | 264 (14.2%) | 2.73 |
| Non-family | 694 (37.4%) | 1.09 |
| Total Households | 1,857 (100.0%) | 2.18 |
Household Size by Marriage Status in Waverly
Out of a total of 1,857 households in Waverly, 1,163 (62.6%) are family households, while 694 (37.4%) are nonfamily households. The most numerous type of family households are 2-person households, comprising 669, and the most common type of nonfamily households are 1-person households, comprising 630.
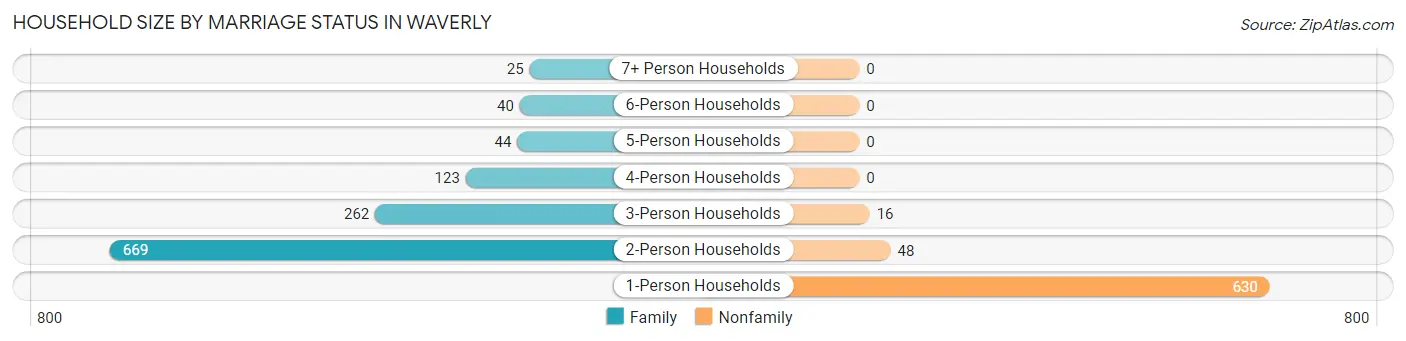
| Household Size | Family Households | Nonfamily Households |
| 1-Person Households | - | 630 (33.9%) |
| 2-Person Households | 669 (36.0%) | 48 (2.6%) |
| 3-Person Households | 262 (14.1%) | 16 (0.9%) |
| 4-Person Households | 123 (6.6%) | 0 (0.0%) |
| 5-Person Households | 44 (2.4%) | 0 (0.0%) |
| 6-Person Households | 40 (2.1%) | 0 (0.0%) |
| 7+ Person Households | 25 (1.3%) | 0 (0.0%) |
| Total | 1,163 (62.6%) | 694 (37.4%) |
Female Fertility in Waverly
Fertility by Age in Waverly
Average fertility rate in Waverly is 37.0 births per 1,000 women. Women in the age bracket of 20 to 34 years have the highest fertility rate with 96.0 births per 1,000 women. Women in the age bracket of 20 to 34 years acount for 100.0% of all women with births.
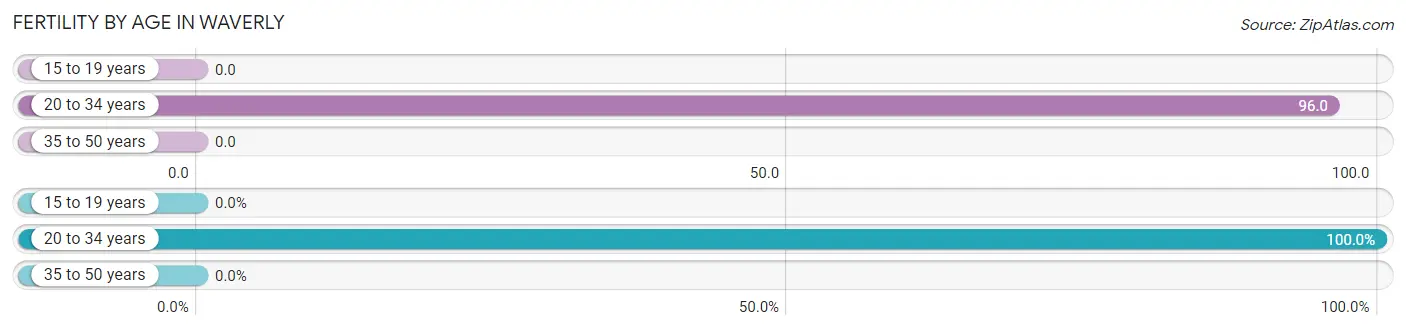
| Age Bracket | Women with Births | Births / 1,000 Women |
| 15 to 19 years | 0 (0.0%) | 0.0 |
| 20 to 34 years | 32 (100.0%) | 96.0 |
| 35 to 50 years | 0 (0.0%) | 0.0 |
| Total | 32 (100.0%) | 37.0 |
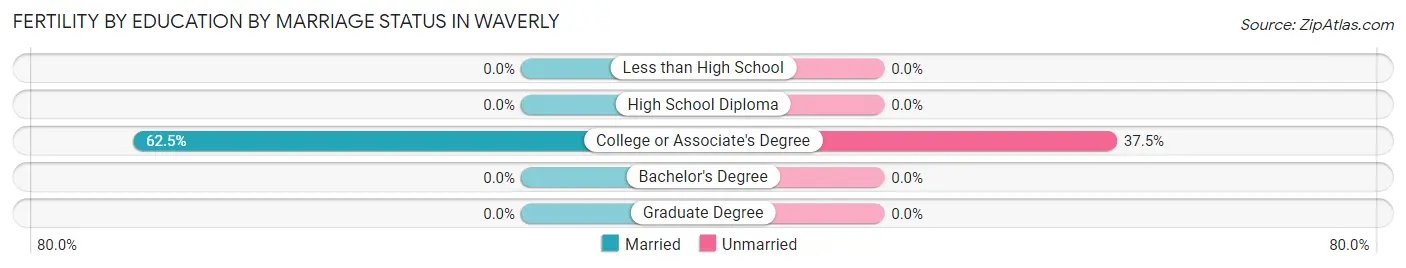
Fertility by Age by Marriage Status in Waverly
62.5% of women with births (32) in Waverly are married. The highest percentage of unmarried women with births falls into 20 to 34 years age bracket with 37.5% of them unmarried at the time of birth, while the lowest percentage of unmarried women with births belong to 20 to 34 years age bracket with 37.5% of them unmarried.
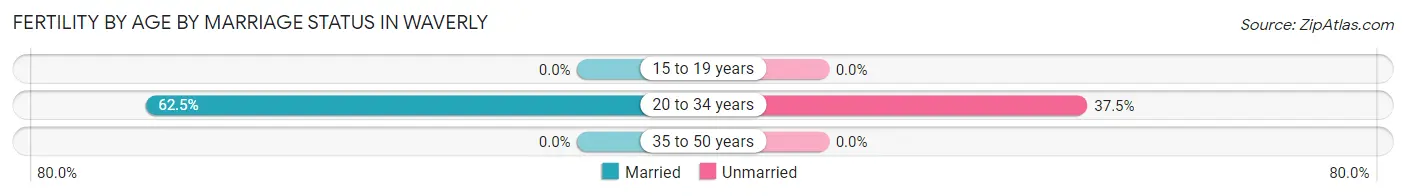
| Age Bracket | Married | Unmarried |
| 15 to 19 years | 0 (0.0%) | 0 (0.0%) |
| 20 to 34 years | 20 (62.5%) | 12 (37.5%) |
| 35 to 50 years | 0 (0.0%) | 0 (0.0%) |
| Total | 20 (62.5%) | 12 (37.5%) |
Fertility by Education in Waverly
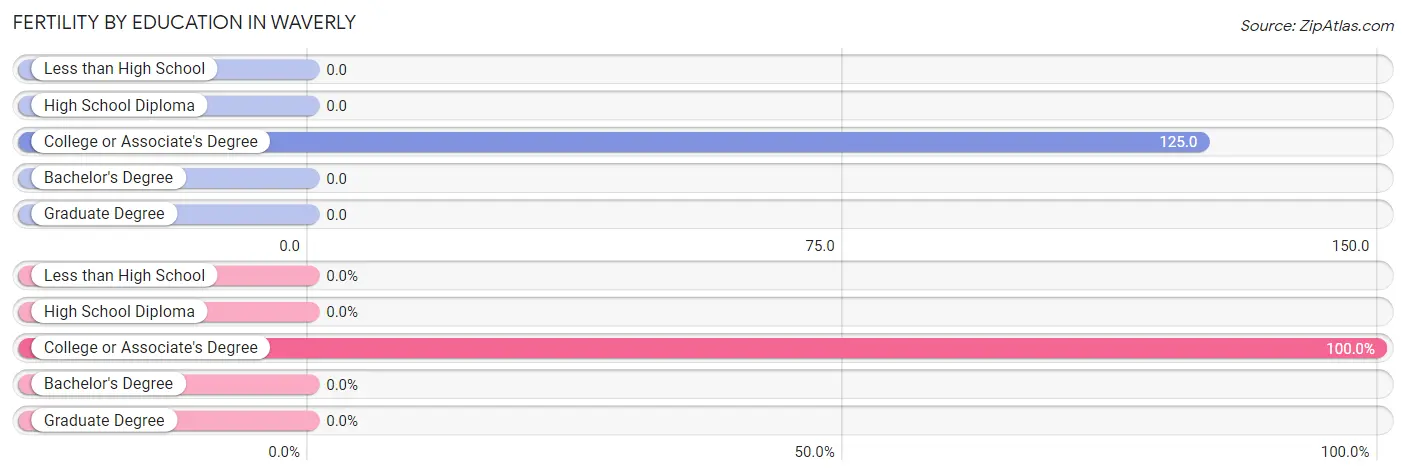
| Educational Attainment | Women with Births | Births / 1,000 Women |
| Less than High School | 0 (0.0%) | 0.0 |
| High School Diploma | 0 (0.0%) | 0.0 |
| College or Associate's Degree | 32 (100.0%) | 125.0 |
| Bachelor's Degree | 0 (0.0%) | 0.0 |
| Graduate Degree | 0 (0.0%) | 0.0 |
| Total | 32 (100.0%) | 37.0 |
Fertility by Education by Marriage Status in Waverly
37.5% of women with births in Waverly are unmarried. Women with the educational attainment of college or associate's degree are most likely to be married with 62.5% of them married at childbirth, while women with the educational attainment of college or associate's degree are least likely to be married with 37.5% of them unmarried at childbirth.
| Educational Attainment | Married | Unmarried |
| Less than High School | 0 (0.0%) | 0 (0.0%) |
| High School Diploma | 0 (0.0%) | 0 (0.0%) |
| College or Associate's Degree | 20 (62.5%) | 12 (37.5%) |
| Bachelor's Degree | 0 (0.0%) | 0 (0.0%) |
| Graduate Degree | 0 (0.0%) | 0 (0.0%) |
| Total | 20 (62.5%) | 12 (37.5%) |
Employment Characteristics in Waverly
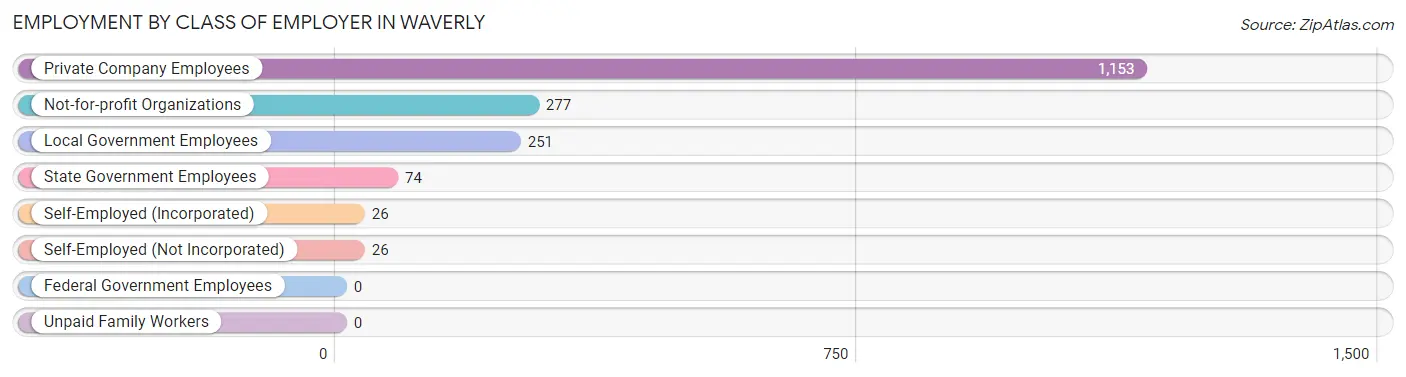
Employment by Class of Employer in Waverly
Among the 1,807 employed individuals in Waverly, private company employees (1,153 | 63.8%), not-for-profit organizations (277 | 15.3%), and local government employees (251 | 13.9%) make up the most common classes of employment.
| Employer Class | # Employees | % Employees |
| Private Company Employees | 1,153 | 63.8% |
| Self-Employed (Incorporated) | 26 | 1.4% |
| Self-Employed (Not Incorporated) | 26 | 1.4% |
| Not-for-profit Organizations | 277 | 15.3% |
| Local Government Employees | 251 | 13.9% |
| State Government Employees | 74 | 4.1% |
| Federal Government Employees | 0 | 0.0% |
| Unpaid Family Workers | 0 | 0.0% |
| Total | 1,807 | 100.0% |
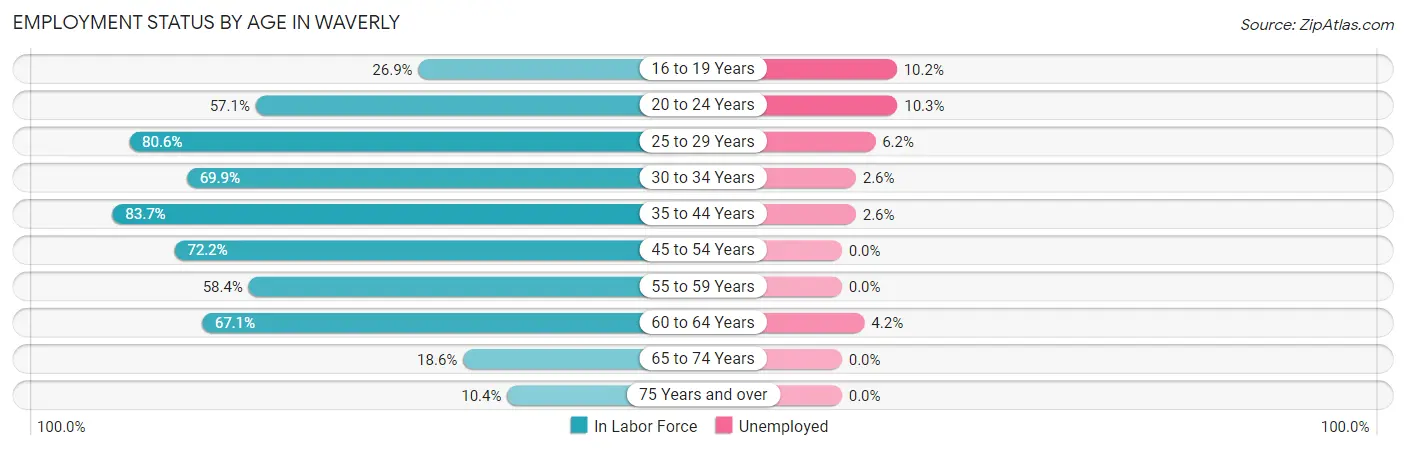
Employment Status by Age in Waverly
According to the labor force statistics for Waverly, out of the total population over 16 years of age (3,463), 56.0% or 1,939 individuals are in the labor force, with 3.2% or 62 of them unemployed. The age group with the highest labor force participation rate is 35 to 44 years, with 83.7% or 345 individuals in the labor force. Within the labor force, the 20 to 24 years age range has the highest percentage of unemployed individuals, with 10.3% or 7 of them being unemployed.
| Age Bracket | In Labor Force | Unemployed |
| 16 to 19 Years | 59 (26.9%) | 6 (10.2%) |
| 20 to 24 Years | 68 (57.1%) | 7 (10.3%) |
| 25 to 29 Years | 386 (80.6%) | 24 (6.2%) |
| 30 to 34 Years | 116 (69.9%) | 3 (2.6%) |
| 35 to 44 Years | 345 (83.7%) | 9 (2.6%) |
| 45 to 54 Years | 359 (72.2%) | 0 (0.0%) |
| 55 to 59 Years | 157 (58.4%) | 0 (0.0%) |
| 60 to 64 Years | 330 (67.1%) | 14 (4.2%) |
| 65 to 74 Years | 81 (18.6%) | 0 (0.0%) |
| 75 Years and over | 39 (10.4%) | 0 (0.0%) |
| Total | 1,939 (56.0%) | 62 (3.2%) |
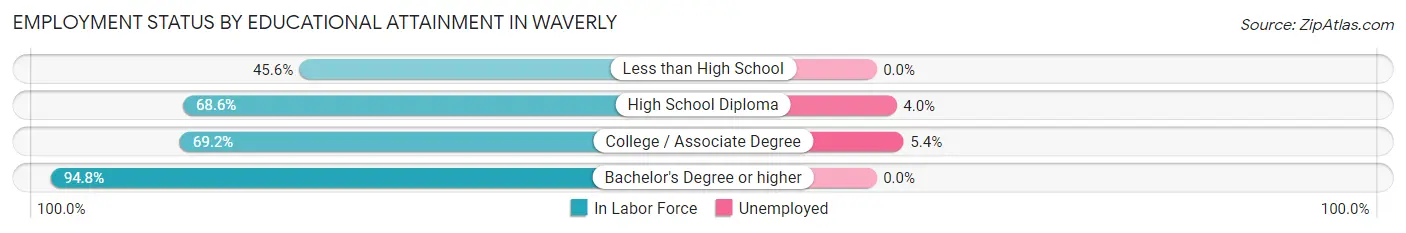
Employment Status by Educational Attainment in Waverly
According to labor force statistics for Waverly, 73.1% of individuals (1,692) out of the total population between 25 and 64 years of age (2,315) are in the labor force, with 3.0% or 51 of them being unemployed. The group with the highest labor force participation rate are those with the educational attainment of bachelor's degree or higher, with 94.8% or 515 individuals in the labor force. Within the labor force, individuals with college / associate degree education have the highest percentage of unemployment, with 5.4% or 24 of them being unemployed.
| Educational Attainment | In Labor Force | Unemployed |
| Less than High School | 82 (45.6%) | 0 (0.0%) |
| High School Diploma | 653 (68.6%) | 38 (4.0%) |
| College / Associate Degree | 443 (69.2%) | 35 (5.4%) |
| Bachelor's Degree or higher | 515 (94.8%) | 0 (0.0%) |
| Total | 1,692 (73.1%) | 69 (3.0%) |
Employment Occupations by Sex in Waverly
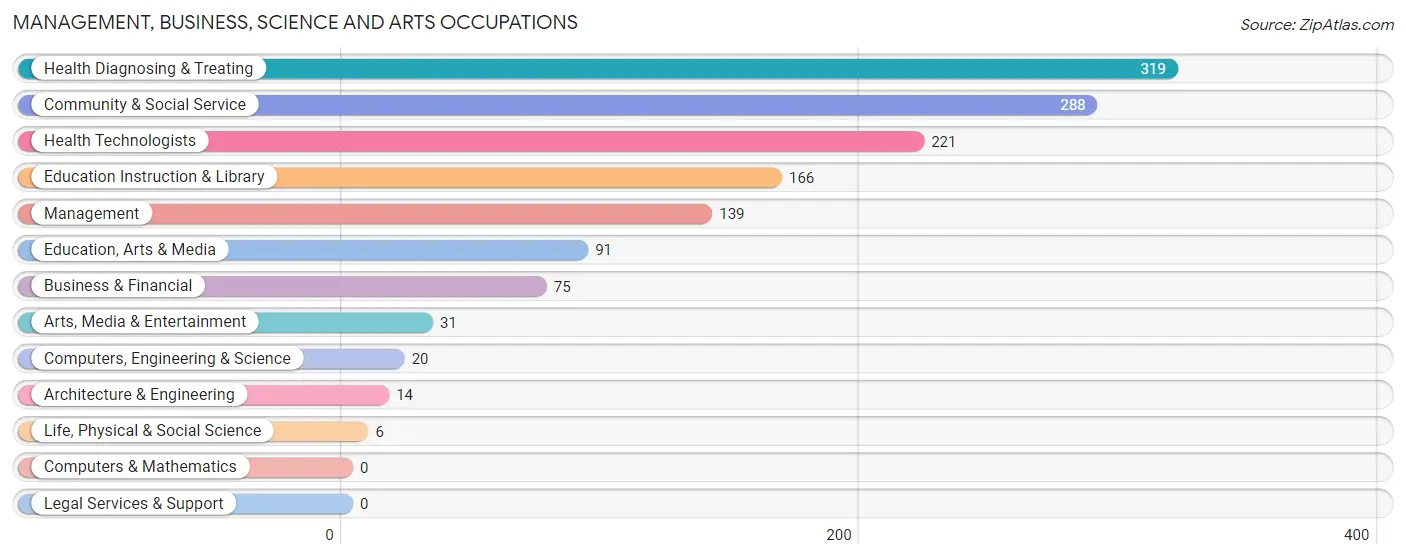
Management, Business, Science and Arts Occupations
The most common Management, Business, Science and Arts occupations in Waverly are Health Diagnosing & Treating (319 | 17.0%), Community & Social Service (288 | 15.3%), Health Technologists (221 | 11.8%), Education Instruction & Library (166 | 8.8%), and Management (139 | 7.4%).
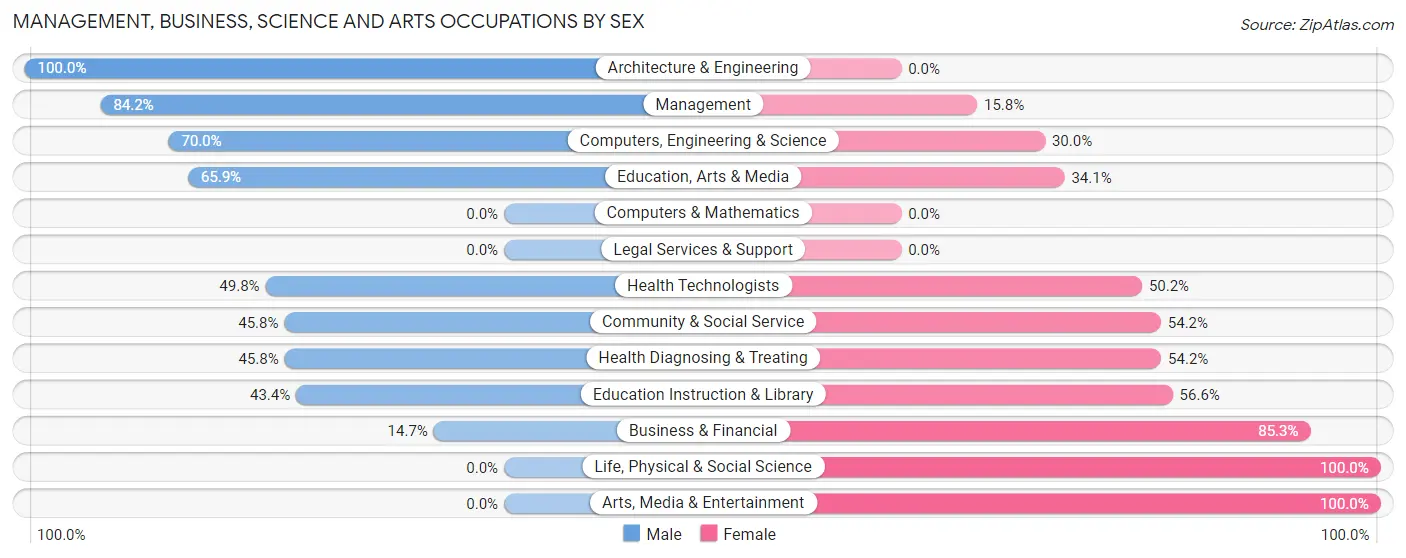
Management, Business, Science and Arts Occupations by Sex
Within the Management, Business, Science and Arts occupations in Waverly, the most male-oriented occupations are Architecture & Engineering (100.0%), Management (84.2%), and Computers, Engineering & Science (70.0%), while the most female-oriented occupations are Life, Physical & Social Science (100.0%), Arts, Media & Entertainment (100.0%), and Business & Financial (85.3%).
| Occupation | Male | Female |
| Management | 117 (84.2%) | 22 (15.8%) |
| Business & Financial | 11 (14.7%) | 64 (85.3%) |
| Computers, Engineering & Science | 14 (70.0%) | 6 (30.0%) |
| Computers & Mathematics | 0 (0.0%) | 0 (0.0%) |
| Architecture & Engineering | 14 (100.0%) | 0 (0.0%) |
| Life, Physical & Social Science | 0 (0.0%) | 6 (100.0%) |
| Community & Social Service | 132 (45.8%) | 156 (54.2%) |
| Education, Arts & Media | 60 (65.9%) | 31 (34.1%) |
| Legal Services & Support | 0 (0.0%) | 0 (0.0%) |
| Education Instruction & Library | 72 (43.4%) | 94 (56.6%) |
| Arts, Media & Entertainment | 0 (0.0%) | 31 (100.0%) |
| Health Diagnosing & Treating | 146 (45.8%) | 173 (54.2%) |
| Health Technologists | 110 (49.8%) | 111 (50.2%) |
| Total (Category) | 420 (49.9%) | 421 (50.1%) |
| Total (Overall) | 905 (48.2%) | 972 (51.8%) |
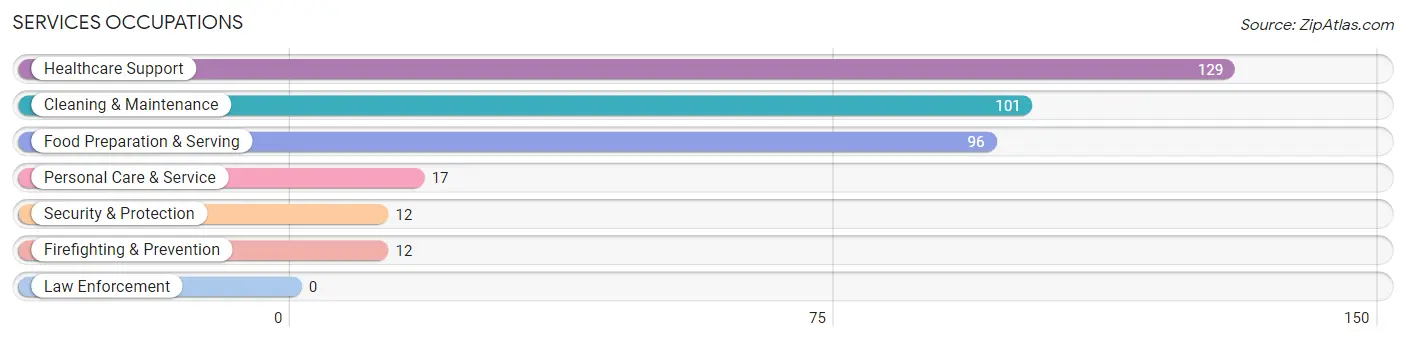
Services Occupations
The most common Services occupations in Waverly are Healthcare Support (129 | 6.9%), Cleaning & Maintenance (101 | 5.4%), Food Preparation & Serving (96 | 5.1%), Personal Care & Service (17 | 0.9%), and Security & Protection (12 | 0.6%).
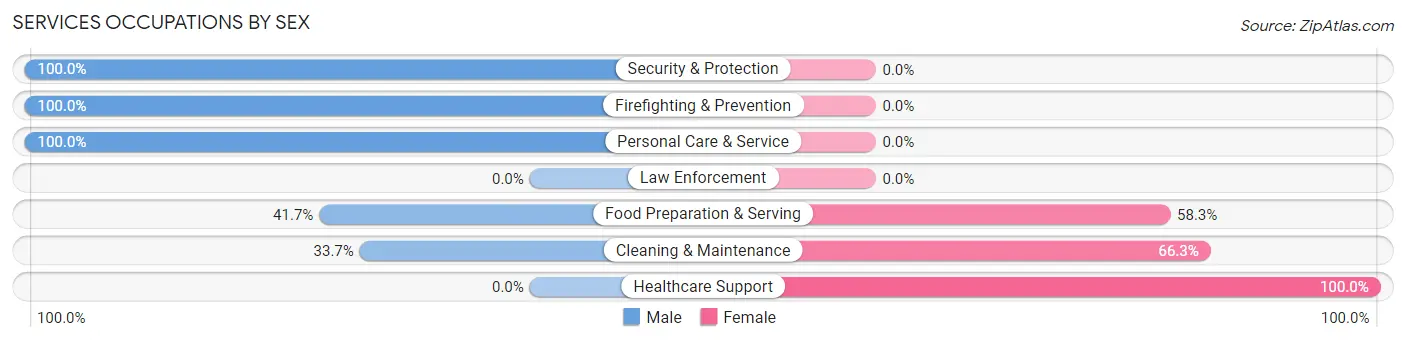
Services Occupations by Sex
Within the Services occupations in Waverly, the most male-oriented occupations are Security & Protection (100.0%), Firefighting & Prevention (100.0%), and Personal Care & Service (100.0%), while the most female-oriented occupations are Healthcare Support (100.0%), Cleaning & Maintenance (66.3%), and Food Preparation & Serving (58.3%).
| Occupation | Male | Female |
| Healthcare Support | 0 (0.0%) | 129 (100.0%) |
| Security & Protection | 12 (100.0%) | 0 (0.0%) |
| Firefighting & Prevention | 12 (100.0%) | 0 (0.0%) |
| Law Enforcement | 0 (0.0%) | 0 (0.0%) |
| Food Preparation & Serving | 40 (41.7%) | 56 (58.3%) |
| Cleaning & Maintenance | 34 (33.7%) | 67 (66.3%) |
| Personal Care & Service | 17 (100.0%) | 0 (0.0%) |
| Total (Category) | 103 (29.0%) | 252 (71.0%) |
| Total (Overall) | 905 (48.2%) | 972 (51.8%) |
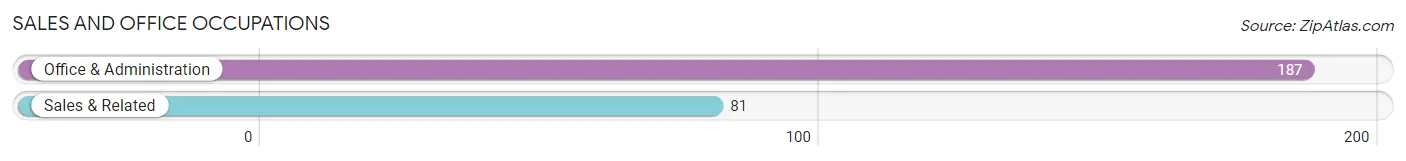
Sales and Office Occupations
The most common Sales and Office occupations in Waverly are Office & Administration (187 | 10.0%), and Sales & Related (81 | 4.3%).
Sales and Office Occupations by Sex
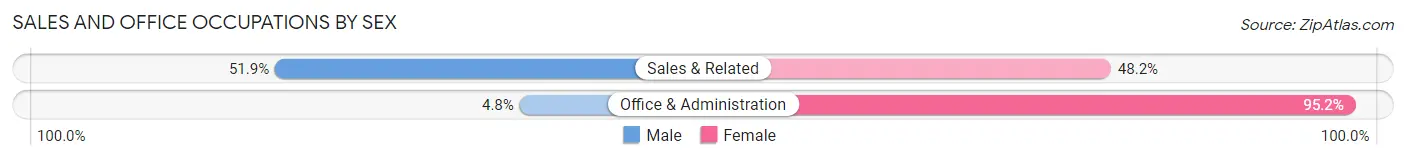
| Occupation | Male | Female |
| Sales & Related | 42 (51.8%) | 39 (48.1%) |
| Office & Administration | 9 (4.8%) | 178 (95.2%) |
| Total (Category) | 51 (19.0%) | 217 (81.0%) |
| Total (Overall) | 905 (48.2%) | 972 (51.8%) |
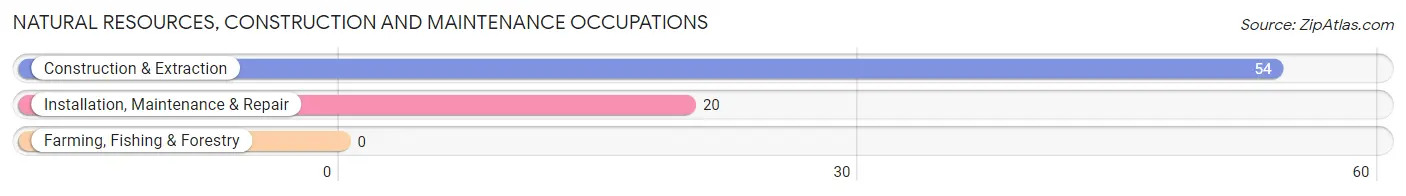
Natural Resources, Construction and Maintenance Occupations
The most common Natural Resources, Construction and Maintenance occupations in Waverly are Construction & Extraction (54 | 2.9%), and Installation, Maintenance & Repair (20 | 1.1%).
Natural Resources, Construction and Maintenance Occupations by Sex
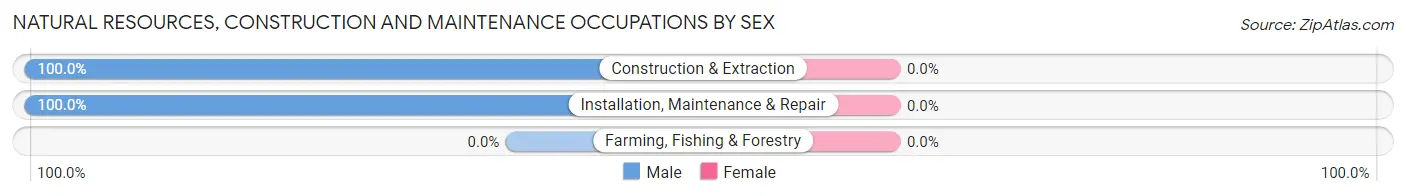
| Occupation | Male | Female |
| Farming, Fishing & Forestry | 0 (0.0%) | 0 (0.0%) |
| Construction & Extraction | 54 (100.0%) | 0 (0.0%) |
| Installation, Maintenance & Repair | 20 (100.0%) | 0 (0.0%) |
| Total (Category) | 74 (100.0%) | 0 (0.0%) |
| Total (Overall) | 905 (48.2%) | 972 (51.8%) |
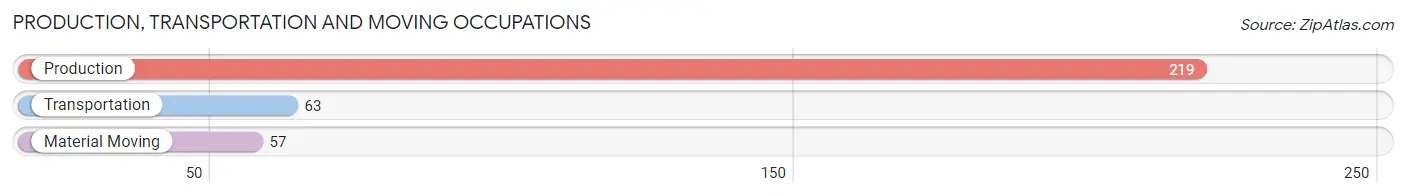
Production, Transportation and Moving Occupations
The most common Production, Transportation and Moving occupations in Waverly are Production (219 | 11.7%), Transportation (63 | 3.4%), and Material Moving (57 | 3.0%).
Production, Transportation and Moving Occupations by Sex
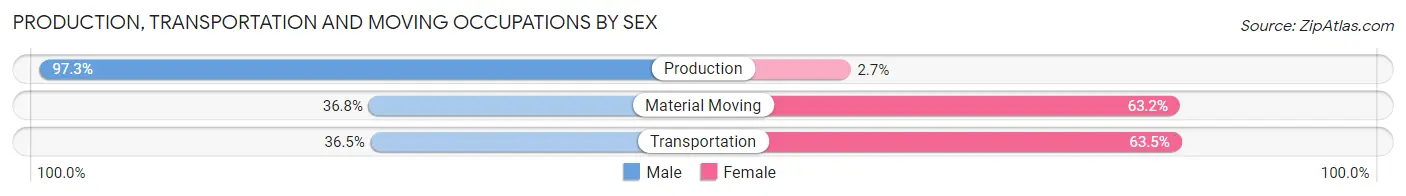
| Occupation | Male | Female |
| Production | 213 (97.3%) | 6 (2.7%) |
| Transportation | 23 (36.5%) | 40 (63.5%) |
| Material Moving | 21 (36.8%) | 36 (63.2%) |
| Total (Category) | 257 (75.8%) | 82 (24.2%) |
| Total (Overall) | 905 (48.2%) | 972 (51.8%) |
Employment Industries by Sex in Waverly
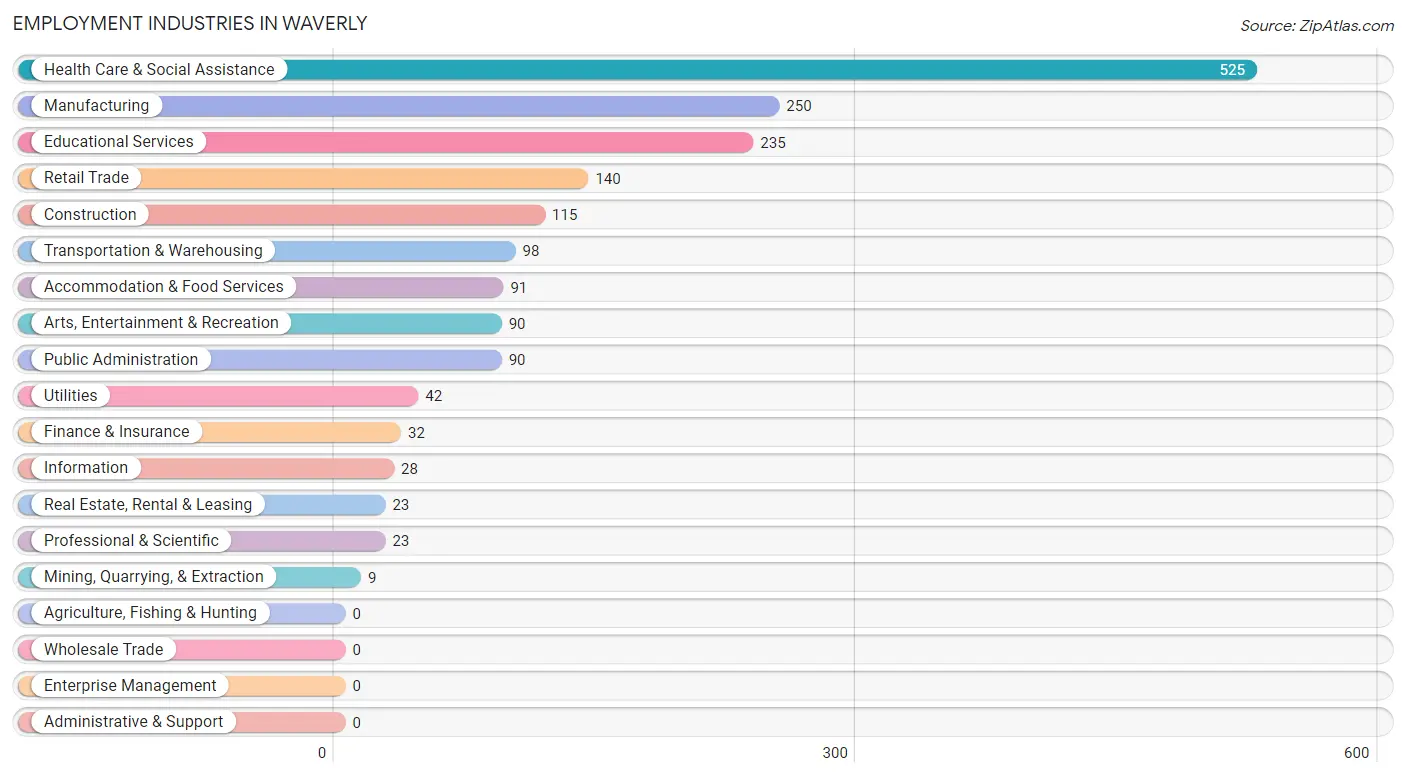
Employment Industries in Waverly
The major employment industries in Waverly include Health Care & Social Assistance (525 | 28.0%), Manufacturing (250 | 13.3%), Educational Services (235 | 12.5%), Retail Trade (140 | 7.5%), and Construction (115 | 6.1%).
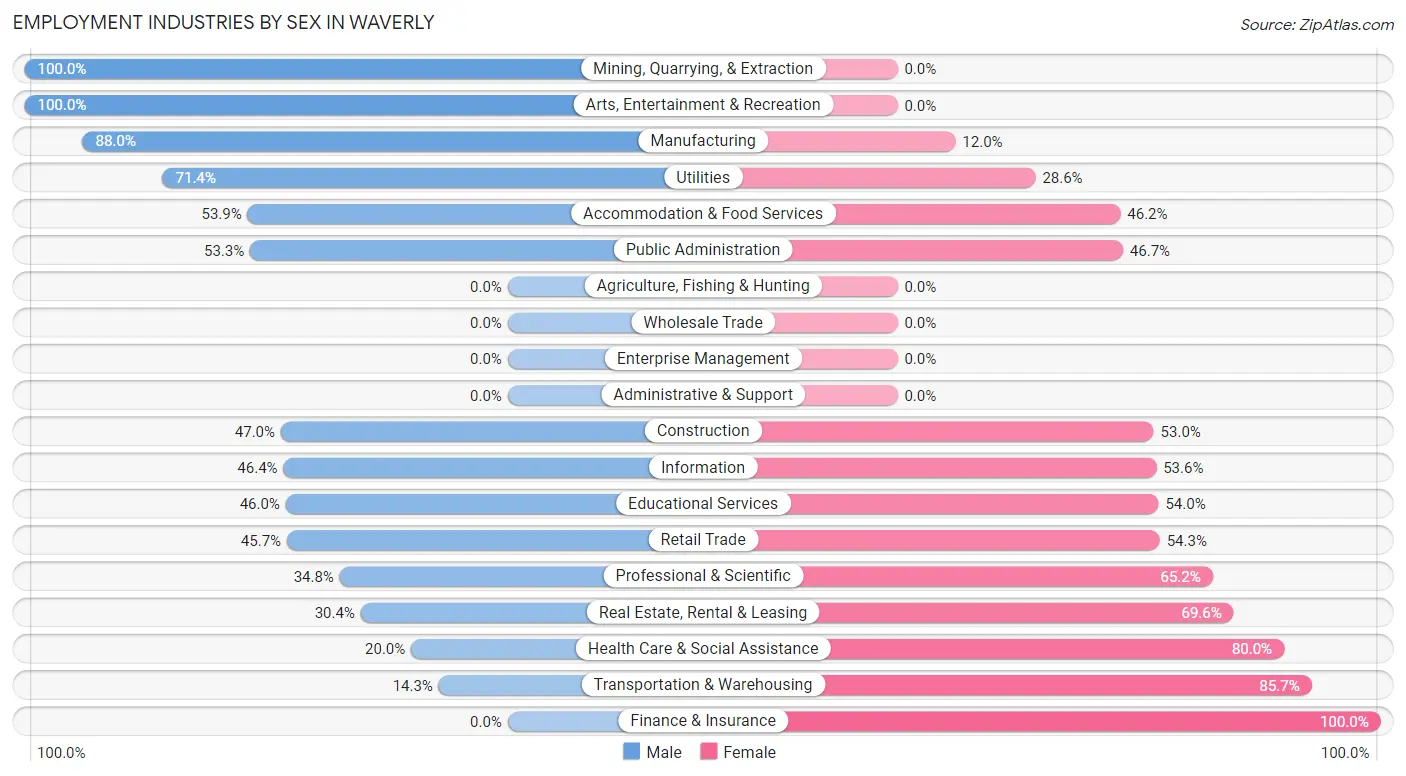
Employment Industries by Sex in Waverly
The Waverly industries that see more men than women are Mining, Quarrying, & Extraction (100.0%), Arts, Entertainment & Recreation (100.0%), and Manufacturing (88.0%), whereas the industries that tend to have a higher number of women are Finance & Insurance (100.0%), Transportation & Warehousing (85.7%), and Health Care & Social Assistance (80.0%).
| Industry | Male | Female |
| Agriculture, Fishing & Hunting | 0 (0.0%) | 0 (0.0%) |
| Mining, Quarrying, & Extraction | 9 (100.0%) | 0 (0.0%) |
| Construction | 54 (47.0%) | 61 (53.0%) |
| Manufacturing | 220 (88.0%) | 30 (12.0%) |
| Wholesale Trade | 0 (0.0%) | 0 (0.0%) |
| Retail Trade | 64 (45.7%) | 76 (54.3%) |
| Transportation & Warehousing | 14 (14.3%) | 84 (85.7%) |
| Utilities | 30 (71.4%) | 12 (28.6%) |
| Information | 13 (46.4%) | 15 (53.6%) |
| Finance & Insurance | 0 (0.0%) | 32 (100.0%) |
| Real Estate, Rental & Leasing | 7 (30.4%) | 16 (69.6%) |
| Professional & Scientific | 8 (34.8%) | 15 (65.2%) |
| Enterprise Management | 0 (0.0%) | 0 (0.0%) |
| Administrative & Support | 0 (0.0%) | 0 (0.0%) |
| Educational Services | 108 (46.0%) | 127 (54.0%) |
| Health Care & Social Assistance | 105 (20.0%) | 420 (80.0%) |
| Arts, Entertainment & Recreation | 90 (100.0%) | 0 (0.0%) |
| Accommodation & Food Services | 49 (53.8%) | 42 (46.2%) |
| Public Administration | 48 (53.3%) | 42 (46.7%) |
| Total | 905 (48.2%) | 972 (51.8%) |
Education in Waverly
School Enrollment in Waverly
The most common levels of schooling among the 897 students in Waverly are high school (260 | 29.0%), elementary school (212 | 23.6%), and middle school (211 | 23.5%).
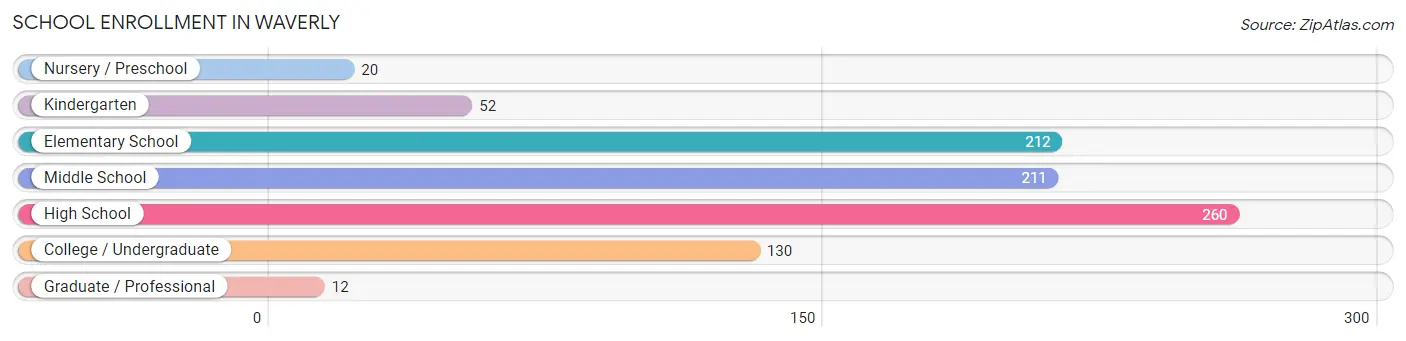
| School Level | # Students | % Students |
| Nursery / Preschool | 20 | 2.2% |
| Kindergarten | 52 | 5.8% |
| Elementary School | 212 | 23.6% |
| Middle School | 211 | 23.5% |
| High School | 260 | 29.0% |
| College / Undergraduate | 130 | 14.5% |
| Graduate / Professional | 12 | 1.3% |
| Total | 897 | 100.0% |
School Enrollment by Age by Funding Source in Waverly
Out of a total of 897 students who are enrolled in schools in Waverly, 105 (11.7%) attend a private institution, while the remaining 792 (88.3%) are enrolled in public schools. The age group of 25 to 34 year olds has the highest likelihood of being enrolled in private schools, with 32 (45.7% in the age bracket) enrolled. Conversely, the age group of 5 to 9 year old has the lowest likelihood of being enrolled in a private school, with 275 (100.0% in the age bracket) attending a public institution.
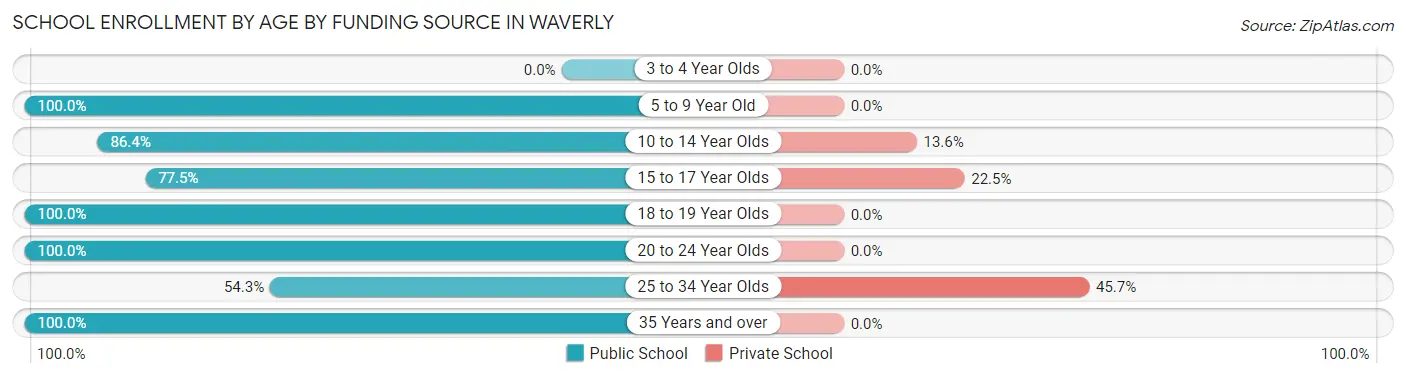
| Age Bracket | Public School | Private School |
| 3 to 4 Year Olds | 0 (0.0%) | 0 (0.0%) |
| 5 to 9 Year Old | 275 (100.0%) | 0 (0.0%) |
| 10 to 14 Year Olds | 210 (86.4%) | 33 (13.6%) |
| 15 to 17 Year Olds | 138 (77.5%) | 40 (22.5%) |
| 18 to 19 Year Olds | 66 (100.0%) | 0 (0.0%) |
| 20 to 24 Year Olds | 29 (100.0%) | 0 (0.0%) |
| 25 to 34 Year Olds | 38 (54.3%) | 32 (45.7%) |
| 35 Years and over | 36 (100.0%) | 0 (0.0%) |
| Total | 792 (88.3%) | 105 (11.7%) |
Educational Attainment by Field of Study in Waverly
Science & technology (263 | 38.0%), education (83 | 12.0%), liberal arts & history (76 | 11.0%), business (66 | 9.5%), and social sciences (55 | 8.0%) are the most common fields of study among 692 individuals in Waverly who have obtained a bachelor's degree or higher.
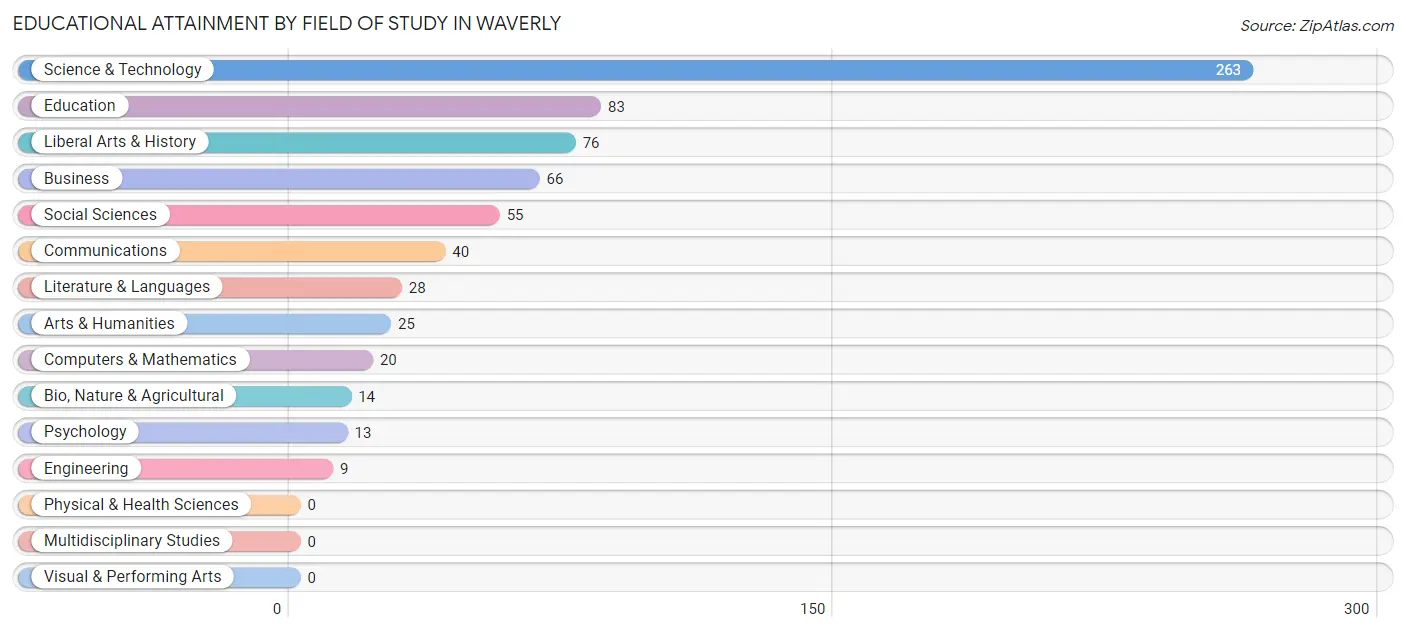
| Field of Study | # Graduates | % Graduates |
| Computers & Mathematics | 20 | 2.9% |
| Bio, Nature & Agricultural | 14 | 2.0% |
| Physical & Health Sciences | 0 | 0.0% |
| Psychology | 13 | 1.9% |
| Social Sciences | 55 | 8.0% |
| Engineering | 9 | 1.3% |
| Multidisciplinary Studies | 0 | 0.0% |
| Science & Technology | 263 | 38.0% |
| Business | 66 | 9.5% |
| Education | 83 | 12.0% |
| Literature & Languages | 28 | 4.1% |
| Liberal Arts & History | 76 | 11.0% |
| Visual & Performing Arts | 0 | 0.0% |
| Communications | 40 | 5.8% |
| Arts & Humanities | 25 | 3.6% |
| Total | 692 | 100.0% |
Transportation & Commute in Waverly
Vehicle Availability by Sex in Waverly
The most prevalent vehicle ownership categories in Waverly are males with 2 vehicles (442, accounting for 48.8%) and females with 2 vehicles (503, making up 49.0%).
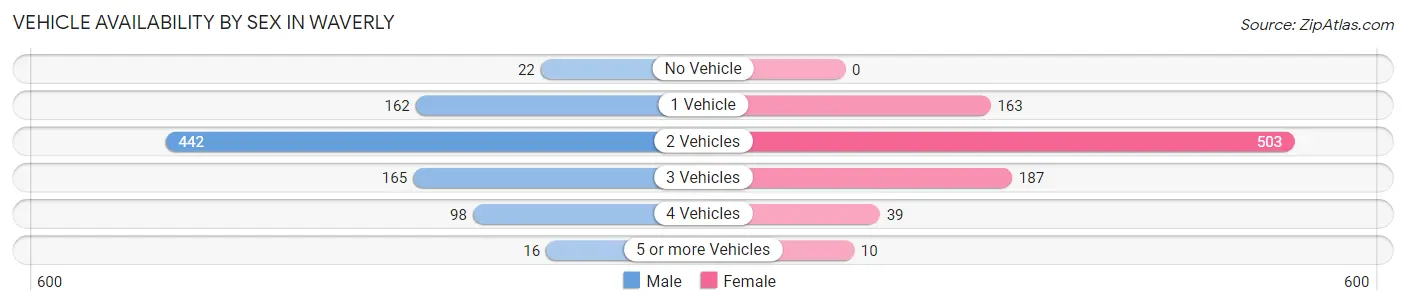
| Vehicles Available | Male | Female |
| No Vehicle | 22 (2.4%) | 0 (0.0%) |
| 1 Vehicle | 162 (17.9%) | 163 (18.1%) |
| 2 Vehicles | 442 (48.8%) | 503 (55.8%) |
| 3 Vehicles | 165 (18.2%) | 187 (20.7%) |
| 4 Vehicles | 98 (10.8%) | 39 (4.3%) |
| 5 or more Vehicles | 16 (1.8%) | 10 (1.1%) |
| Total | 905 (100.0%) | 902 (100.0%) |
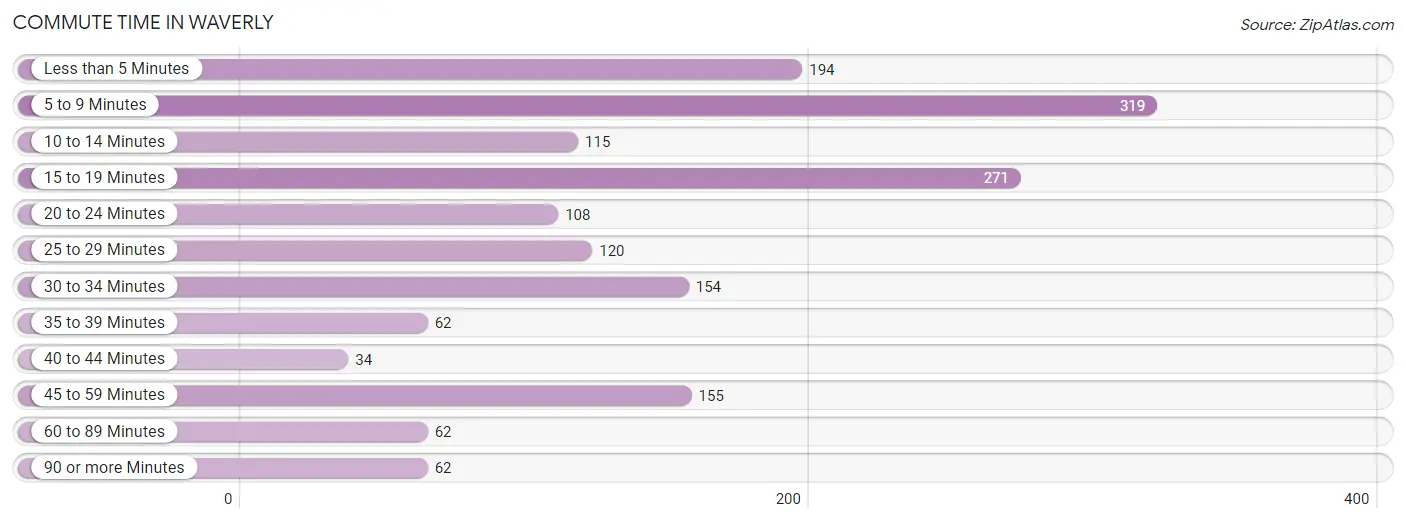
Commute Time in Waverly
The most frequently occuring commute durations in Waverly are 5 to 9 minutes (319 commuters, 19.3%), 15 to 19 minutes (271 commuters, 16.4%), and less than 5 minutes (194 commuters, 11.7%).
| Commute Time | # Commuters | % Commuters |
| Less than 5 Minutes | 194 | 11.7% |
| 5 to 9 Minutes | 319 | 19.3% |
| 10 to 14 Minutes | 115 | 6.9% |
| 15 to 19 Minutes | 271 | 16.4% |
| 20 to 24 Minutes | 108 | 6.5% |
| 25 to 29 Minutes | 120 | 7.2% |
| 30 to 34 Minutes | 154 | 9.3% |
| 35 to 39 Minutes | 62 | 3.7% |
| 40 to 44 Minutes | 34 | 2.1% |
| 45 to 59 Minutes | 155 | 9.4% |
| 60 to 89 Minutes | 62 | 3.7% |
| 90 or more Minutes | 62 | 3.7% |
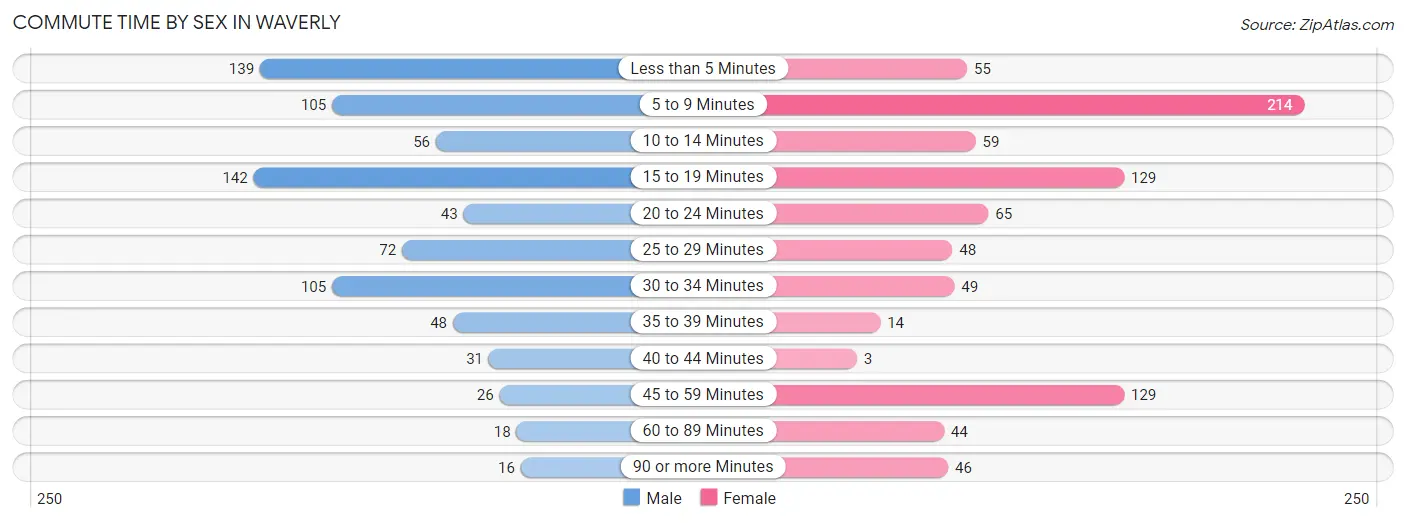
Commute Time by Sex in Waverly
The most common commute times in Waverly are 15 to 19 minutes (142 commuters, 17.7%) for males and 5 to 9 minutes (214 commuters, 25.0%) for females.
| Commute Time | Male | Female |
| Less than 5 Minutes | 139 (17.3%) | 55 (6.4%) |
| 5 to 9 Minutes | 105 (13.1%) | 214 (25.0%) |
| 10 to 14 Minutes | 56 (7.0%) | 59 (6.9%) |
| 15 to 19 Minutes | 142 (17.7%) | 129 (15.1%) |
| 20 to 24 Minutes | 43 (5.4%) | 65 (7.6%) |
| 25 to 29 Minutes | 72 (9.0%) | 48 (5.6%) |
| 30 to 34 Minutes | 105 (13.1%) | 49 (5.7%) |
| 35 to 39 Minutes | 48 (6.0%) | 14 (1.6%) |
| 40 to 44 Minutes | 31 (3.9%) | 3 (0.4%) |
| 45 to 59 Minutes | 26 (3.3%) | 129 (15.1%) |
| 60 to 89 Minutes | 18 (2.2%) | 44 (5.1%) |
| 90 or more Minutes | 16 (2.0%) | 46 (5.4%) |
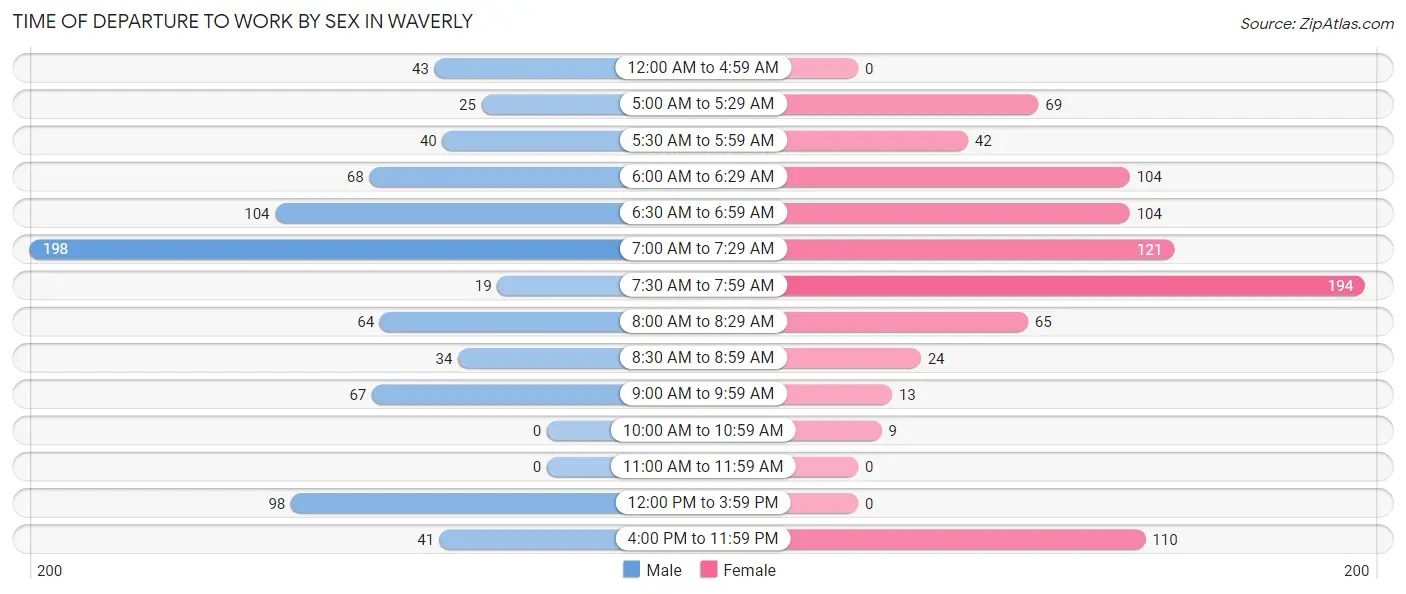
Time of Departure to Work by Sex in Waverly
The most frequent times of departure to work in Waverly are 7:00 AM to 7:29 AM (198, 24.7%) for males and 7:30 AM to 7:59 AM (194, 22.7%) for females.
| Time of Departure | Male | Female |
| 12:00 AM to 4:59 AM | 43 (5.4%) | 0 (0.0%) |
| 5:00 AM to 5:29 AM | 25 (3.1%) | 69 (8.1%) |
| 5:30 AM to 5:59 AM | 40 (5.0%) | 42 (4.9%) |
| 6:00 AM to 6:29 AM | 68 (8.5%) | 104 (12.2%) |
| 6:30 AM to 6:59 AM | 104 (13.0%) | 104 (12.2%) |
| 7:00 AM to 7:29 AM | 198 (24.7%) | 121 (14.1%) |
| 7:30 AM to 7:59 AM | 19 (2.4%) | 194 (22.7%) |
| 8:00 AM to 8:29 AM | 64 (8.0%) | 65 (7.6%) |
| 8:30 AM to 8:59 AM | 34 (4.2%) | 24 (2.8%) |
| 9:00 AM to 9:59 AM | 67 (8.4%) | 13 (1.5%) |
| 10:00 AM to 10:59 AM | 0 (0.0%) | 9 (1.1%) |
| 11:00 AM to 11:59 AM | 0 (0.0%) | 0 (0.0%) |
| 12:00 PM to 3:59 PM | 98 (12.2%) | 0 (0.0%) |
| 4:00 PM to 11:59 PM | 41 (5.1%) | 110 (12.9%) |
| Total | 801 (100.0%) | 855 (100.0%) |
Housing Occupancy in Waverly
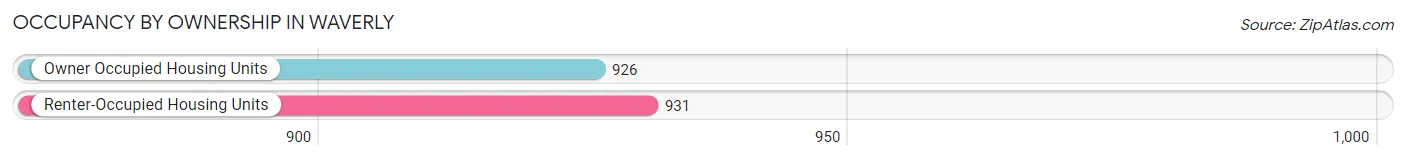
Occupancy by Ownership in Waverly
Of the total 1,857 dwellings in Waverly, owner-occupied units account for 926 (49.9%), while renter-occupied units make up 931 (50.1%).
| Occupancy | # Housing Units | % Housing Units |
| Owner Occupied Housing Units | 926 | 49.9% |
| Renter-Occupied Housing Units | 931 | 50.1% |
| Total Occupied Housing Units | 1,857 | 100.0% |
Occupancy by Household Size in Waverly
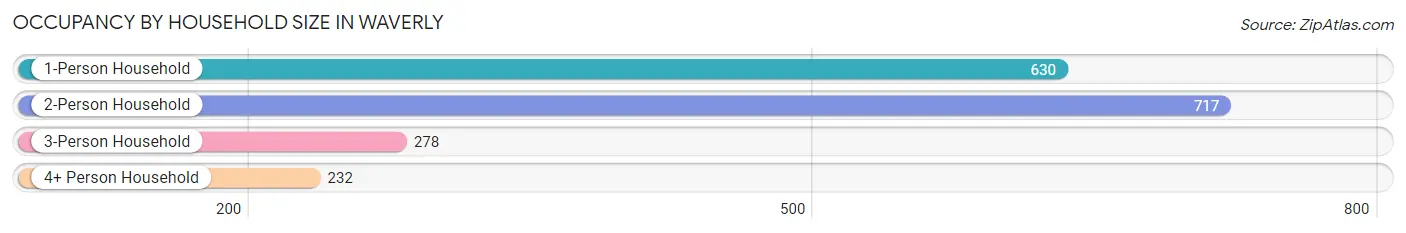
| Household Size | # Housing Units | % Housing Units |
| 1-Person Household | 630 | 33.9% |
| 2-Person Household | 717 | 38.6% |
| 3-Person Household | 278 | 15.0% |
| 4+ Person Household | 232 | 12.5% |
| Total Housing Units | 1,857 | 100.0% |
Occupancy by Ownership by Household Size in Waverly
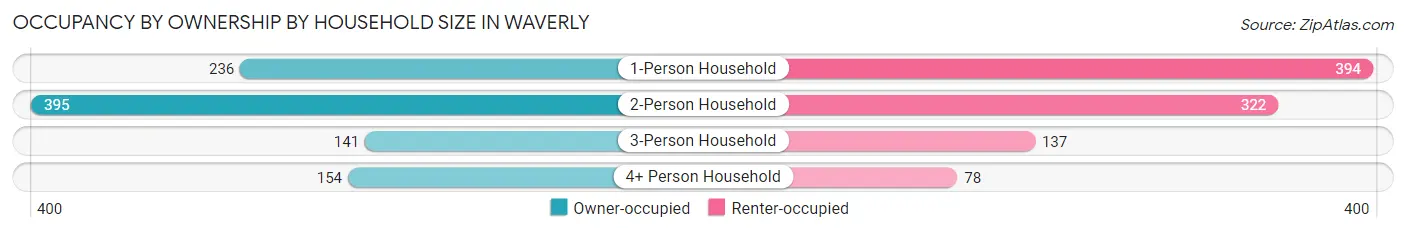
| Household Size | Owner-occupied | Renter-occupied |
| 1-Person Household | 236 (37.5%) | 394 (62.5%) |
| 2-Person Household | 395 (55.1%) | 322 (44.9%) |
| 3-Person Household | 141 (50.7%) | 137 (49.3%) |
| 4+ Person Household | 154 (66.4%) | 78 (33.6%) |
| Total Housing Units | 926 (49.9%) | 931 (50.1%) |
Occupancy by Educational Attainment in Waverly
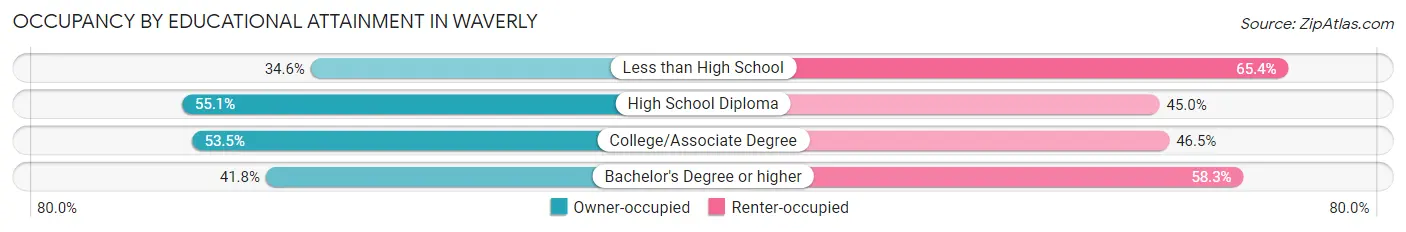
| Household Size | Owner-occupied | Renter-occupied |
| Less than High School | 54 (34.6%) | 102 (65.4%) |
| High School Diploma | 414 (55.0%) | 338 (45.0%) |
| College/Associate Degree | 281 (53.5%) | 244 (46.5%) |
| Bachelor's Degree or higher | 177 (41.7%) | 247 (58.3%) |
Occupancy by Age of Householder in Waverly
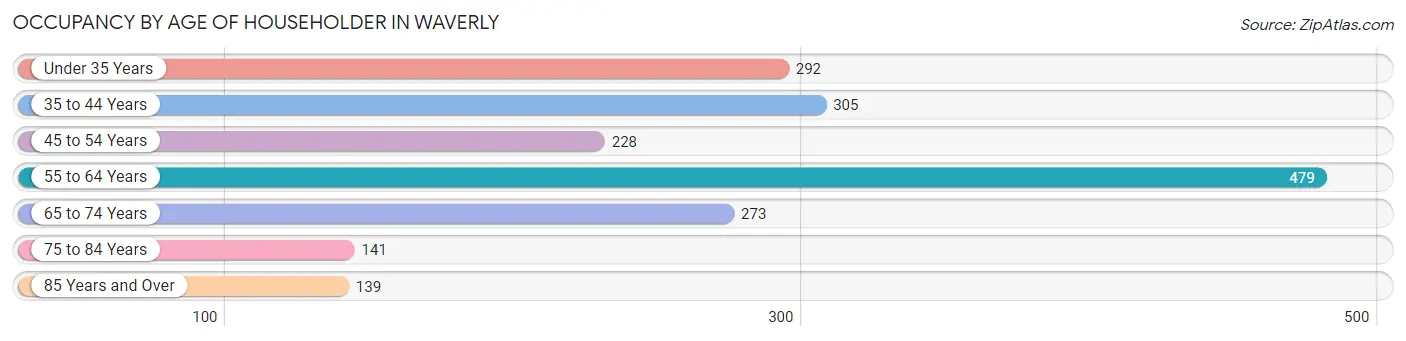
| Age Bracket | # Households | % Households |
| Under 35 Years | 292 | 15.7% |
| 35 to 44 Years | 305 | 16.4% |
| 45 to 54 Years | 228 | 12.3% |
| 55 to 64 Years | 479 | 25.8% |
| 65 to 74 Years | 273 | 14.7% |
| 75 to 84 Years | 141 | 7.6% |
| 85 Years and Over | 139 | 7.5% |
| Total | 1,857 | 100.0% |
Housing Finances in Waverly
Median Income by Occupancy in Waverly
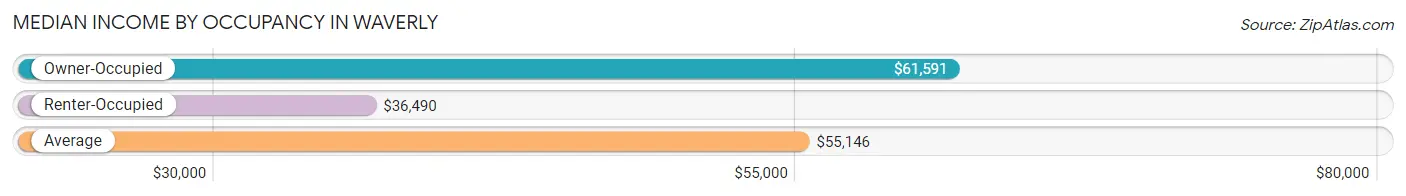
| Occupancy Type | # Households | Median Income |
| Owner-Occupied | 926 (49.9%) | $61,591 |
| Renter-Occupied | 931 (50.1%) | $36,490 |
| Average | 1,857 (100.0%) | $55,146 |
Occupancy by Householder Income Bracket in Waverly
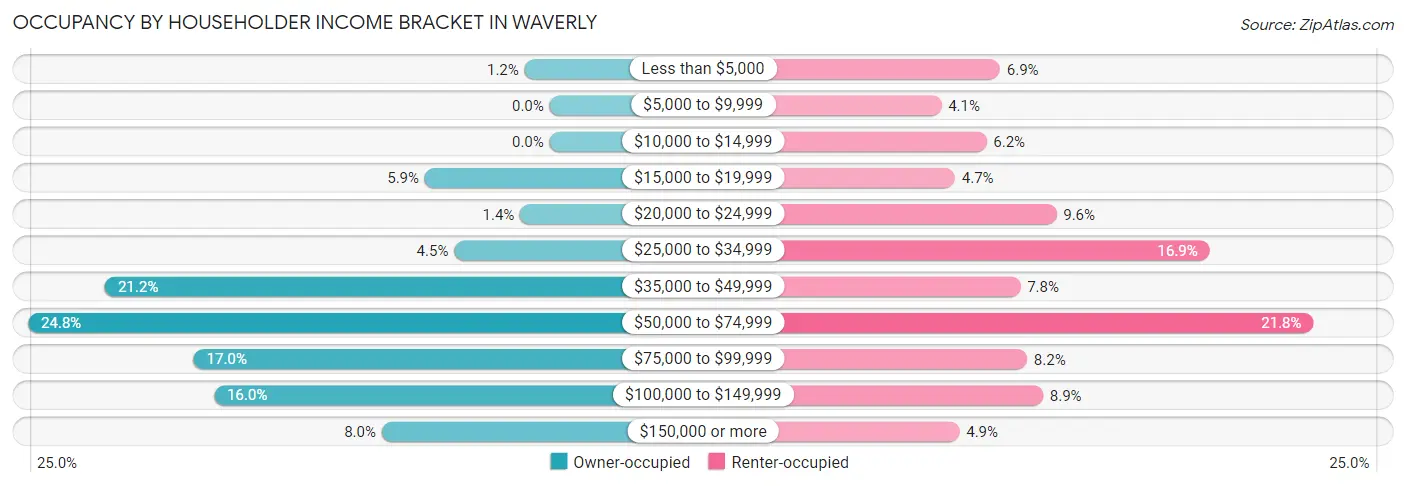
| Income Bracket | Owner-occupied | Renter-occupied |
| Less than $5,000 | 11 (1.2%) | 64 (6.9%) |
| $5,000 to $9,999 | 0 (0.0%) | 38 (4.1%) |
| $10,000 to $14,999 | 0 (0.0%) | 58 (6.2%) |
| $15,000 to $19,999 | 55 (5.9%) | 44 (4.7%) |
| $20,000 to $24,999 | 13 (1.4%) | 89 (9.6%) |
| $25,000 to $34,999 | 42 (4.5%) | 157 (16.9%) |
| $35,000 to $49,999 | 196 (21.2%) | 73 (7.8%) |
| $50,000 to $74,999 | 230 (24.8%) | 203 (21.8%) |
| $75,000 to $99,999 | 157 (17.0%) | 76 (8.2%) |
| $100,000 to $149,999 | 148 (16.0%) | 83 (8.9%) |
| $150,000 or more | 74 (8.0%) | 46 (4.9%) |
| Total | 926 (100.0%) | 931 (100.0%) |
Monthly Housing Cost Tiers in Waverly
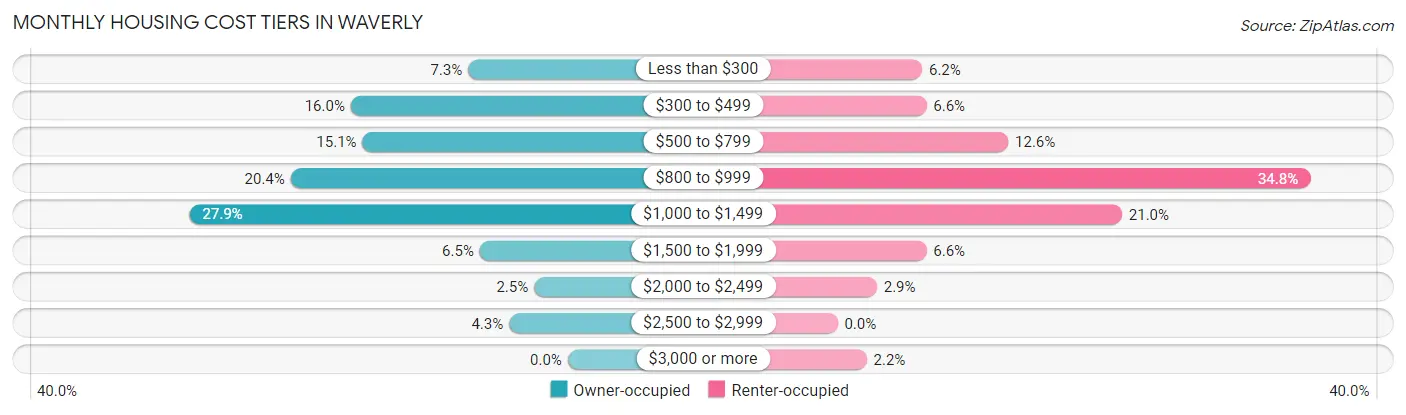
| Monthly Cost | Owner-occupied | Renter-occupied |
| Less than $300 | 68 (7.3%) | 58 (6.2%) |
| $300 to $499 | 148 (16.0%) | 61 (6.6%) |
| $500 to $799 | 140 (15.1%) | 117 (12.6%) |
| $800 to $999 | 189 (20.4%) | 324 (34.8%) |
| $1,000 to $1,499 | 258 (27.9%) | 195 (20.9%) |
| $1,500 to $1,999 | 60 (6.5%) | 61 (6.6%) |
| $2,000 to $2,499 | 23 (2.5%) | 27 (2.9%) |
| $2,500 to $2,999 | 40 (4.3%) | 0 (0.0%) |
| $3,000 or more | 0 (0.0%) | 20 (2.1%) |
| Total | 926 (100.0%) | 931 (100.0%) |
Physical Housing Characteristics in Waverly
Housing Structures in Waverly
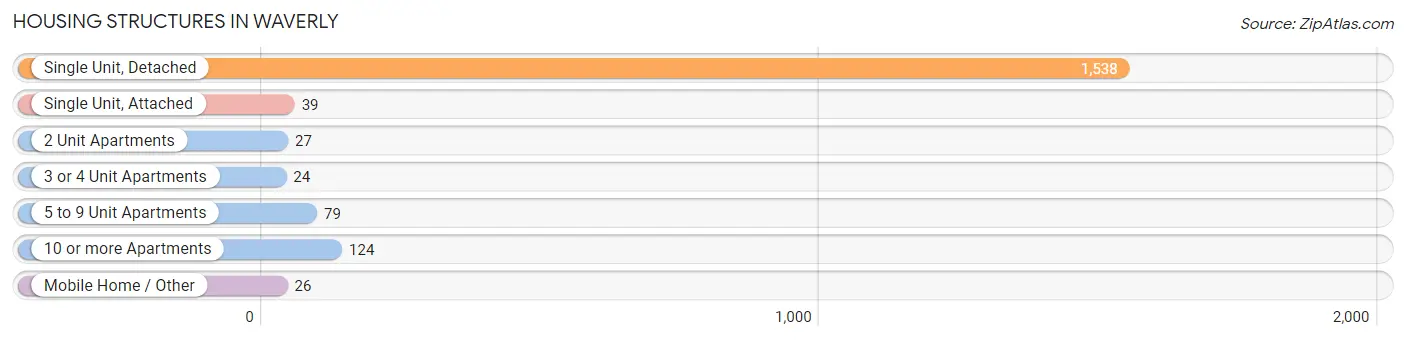
| Structure Type | # Housing Units | % Housing Units |
| Single Unit, Detached | 1,538 | 82.8% |
| Single Unit, Attached | 39 | 2.1% |
| 2 Unit Apartments | 27 | 1.5% |
| 3 or 4 Unit Apartments | 24 | 1.3% |
| 5 to 9 Unit Apartments | 79 | 4.3% |
| 10 or more Apartments | 124 | 6.7% |
| Mobile Home / Other | 26 | 1.4% |
| Total | 1,857 | 100.0% |
Housing Structures by Occupancy in Waverly
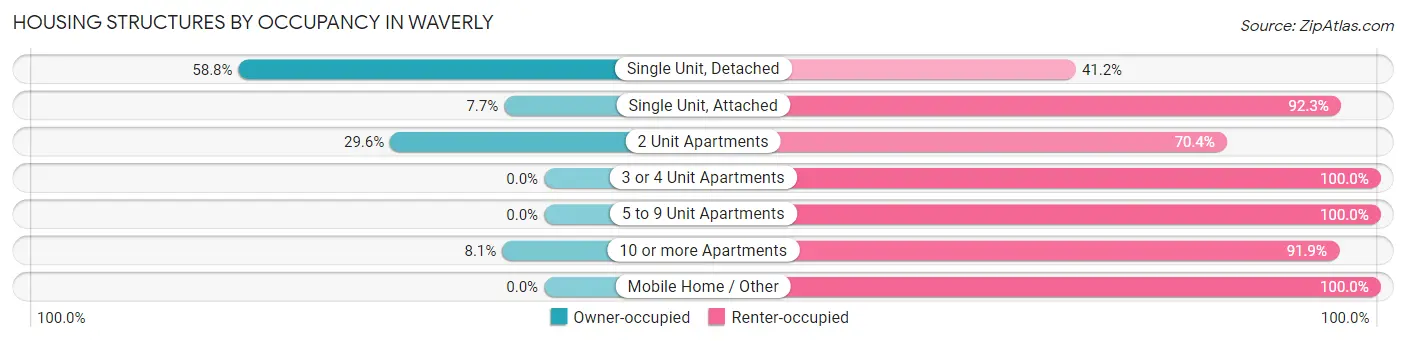
| Structure Type | Owner-occupied | Renter-occupied |
| Single Unit, Detached | 905 (58.8%) | 633 (41.2%) |
| Single Unit, Attached | 3 (7.7%) | 36 (92.3%) |
| 2 Unit Apartments | 8 (29.6%) | 19 (70.4%) |
| 3 or 4 Unit Apartments | 0 (0.0%) | 24 (100.0%) |
| 5 to 9 Unit Apartments | 0 (0.0%) | 79 (100.0%) |
| 10 or more Apartments | 10 (8.1%) | 114 (91.9%) |
| Mobile Home / Other | 0 (0.0%) | 26 (100.0%) |
| Total | 926 (49.9%) | 931 (50.1%) |
Housing Structures by Number of Rooms in Waverly
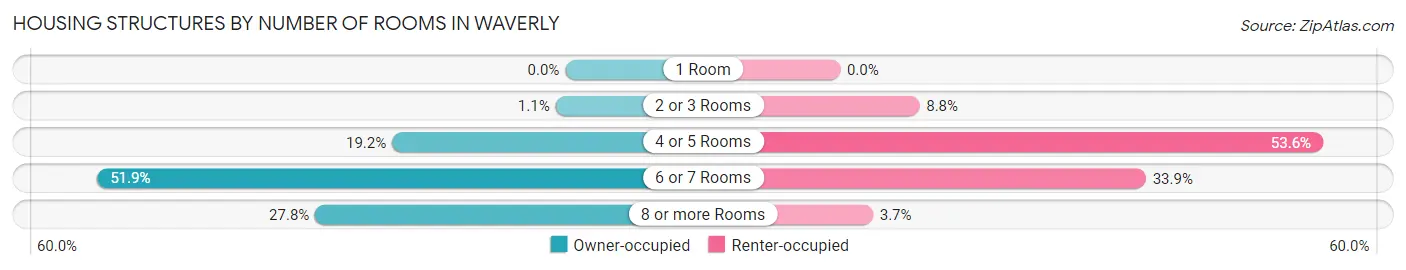
| Number of Rooms | Owner-occupied | Renter-occupied |
| 1 Room | 0 (0.0%) | 0 (0.0%) |
| 2 or 3 Rooms | 10 (1.1%) | 82 (8.8%) |
| 4 or 5 Rooms | 178 (19.2%) | 499 (53.6%) |
| 6 or 7 Rooms | 481 (51.9%) | 316 (33.9%) |
| 8 or more Rooms | 257 (27.8%) | 34 (3.6%) |
| Total | 926 (100.0%) | 931 (100.0%) |
Housing Structure by Heating Type in Waverly
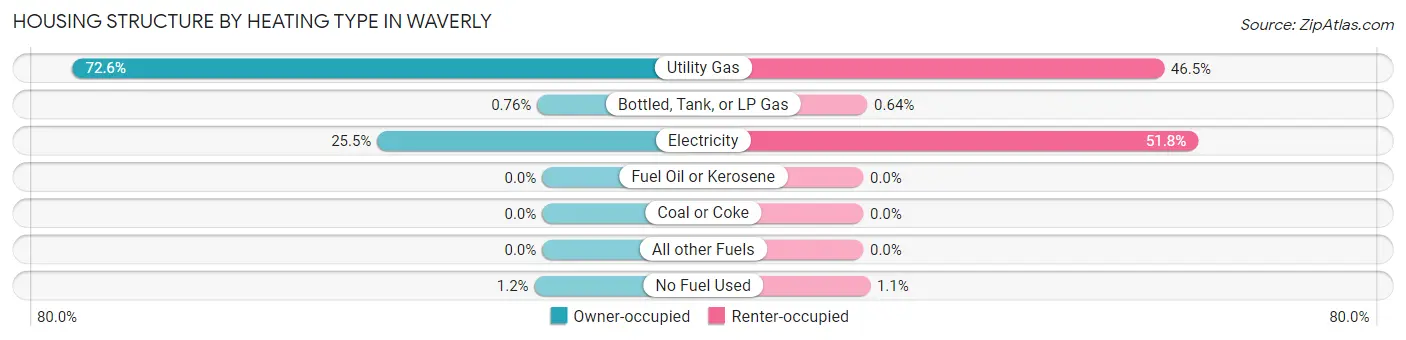
| Heating Type | Owner-occupied | Renter-occupied |
| Utility Gas | 672 (72.6%) | 433 (46.5%) |
| Bottled, Tank, or LP Gas | 7 (0.8%) | 6 (0.6%) |
| Electricity | 236 (25.5%) | 482 (51.8%) |
| Fuel Oil or Kerosene | 0 (0.0%) | 0 (0.0%) |
| Coal or Coke | 0 (0.0%) | 0 (0.0%) |
| All other Fuels | 0 (0.0%) | 0 (0.0%) |
| No Fuel Used | 11 (1.2%) | 10 (1.1%) |
| Total | 926 (100.0%) | 931 (100.0%) |
Household Vehicle Usage in Waverly
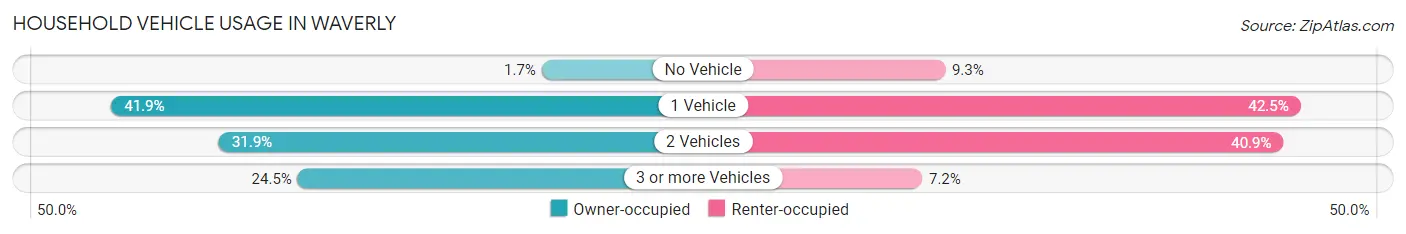
| Vehicles per Household | Owner-occupied | Renter-occupied |
| No Vehicle | 16 (1.7%) | 87 (9.3%) |
| 1 Vehicle | 388 (41.9%) | 396 (42.5%) |
| 2 Vehicles | 295 (31.9%) | 381 (40.9%) |
| 3 or more Vehicles | 227 (24.5%) | 67 (7.2%) |
| Total | 926 (100.0%) | 931 (100.0%) |
Real Estate & Mortgages in Waverly
Real Estate and Mortgage Overview in Waverly
| Characteristic | Without Mortgage | With Mortgage |
| Housing Units | 268 | 658 |
| Median Property Value | $163,000 | $137,200 |
| Median Household Income | $57,181 | $63 |
| Monthly Housing Costs | $416 | $0 |
| Real Estate Taxes | $1,123 | $3 |
Property Value by Mortgage Status in Waverly
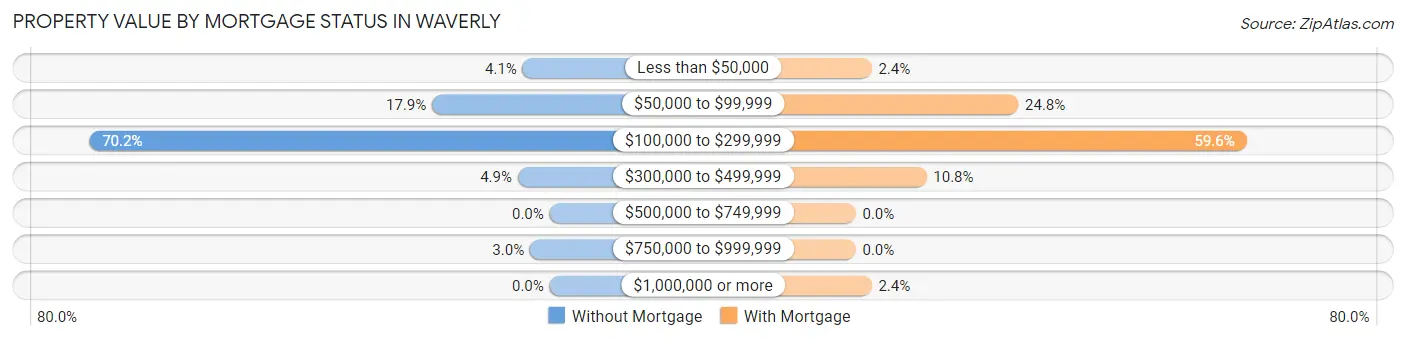
| Property Value | Without Mortgage | With Mortgage |
| Less than $50,000 | 11 (4.1%) | 16 (2.4%) |
| $50,000 to $99,999 | 48 (17.9%) | 163 (24.8%) |
| $100,000 to $299,999 | 188 (70.2%) | 392 (59.6%) |
| $300,000 to $499,999 | 13 (4.9%) | 71 (10.8%) |
| $500,000 to $749,999 | 0 (0.0%) | 0 (0.0%) |
| $750,000 to $999,999 | 8 (3.0%) | 0 (0.0%) |
| $1,000,000 or more | 0 (0.0%) | 16 (2.4%) |
| Total | 268 (100.0%) | 658 (100.0%) |
Household Income by Mortgage Status in Waverly
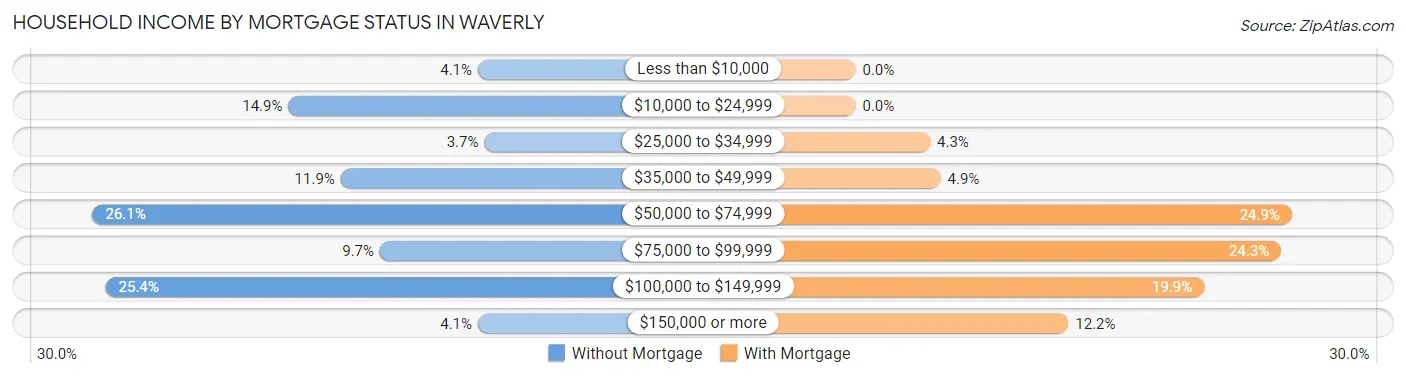
| Household Income | Without Mortgage | With Mortgage |
| Less than $10,000 | 11 (4.1%) | 0 (0.0%) |
| $10,000 to $24,999 | 40 (14.9%) | 0 (0.0%) |
| $25,000 to $34,999 | 10 (3.7%) | 28 (4.3%) |
| $35,000 to $49,999 | 32 (11.9%) | 32 (4.9%) |
| $50,000 to $74,999 | 70 (26.1%) | 164 (24.9%) |
| $75,000 to $99,999 | 26 (9.7%) | 160 (24.3%) |
| $100,000 to $149,999 | 68 (25.4%) | 131 (19.9%) |
| $150,000 or more | 11 (4.1%) | 80 (12.2%) |
| Total | 268 (100.0%) | 658 (100.0%) |
Property Value to Household Income Ratio in Waverly
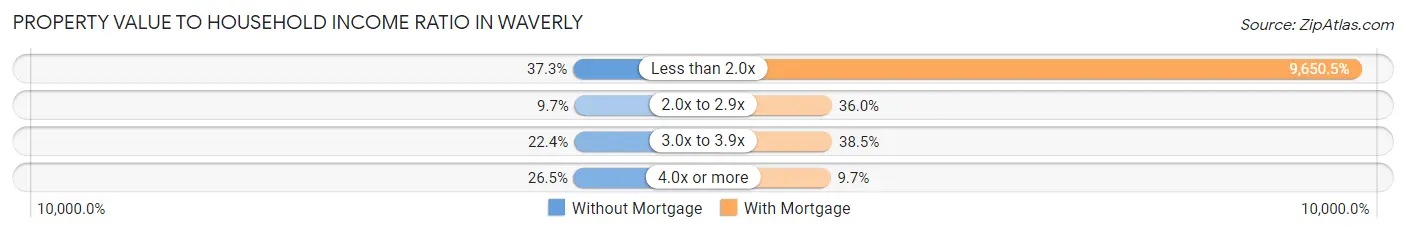
| Value-to-Income Ratio | Without Mortgage | With Mortgage |
| Less than 2.0x | 100 (37.3%) | 63,500 (9,650.5%) |
| 2.0x to 2.9x | 26 (9.7%) | 237 (36.0%) |
| 3.0x to 3.9x | 60 (22.4%) | 253 (38.5%) |
| 4.0x or more | 71 (26.5%) | 64 (9.7%) |
| Total | 268 (100.0%) | 658 (100.0%) |
Real Estate Taxes by Mortgage Status in Waverly
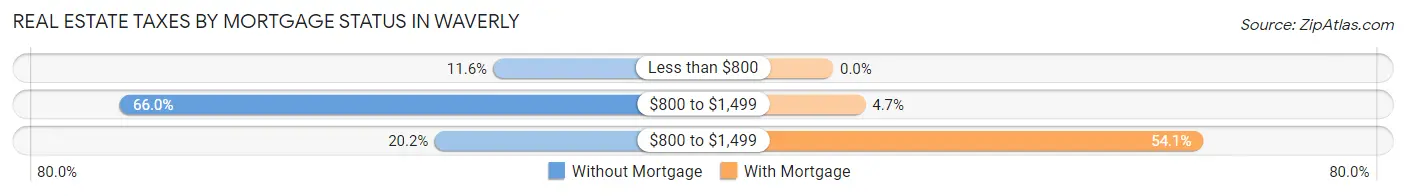
| Property Taxes | Without Mortgage | With Mortgage |
| Less than $800 | 31 (11.6%) | 0 (0.0%) |
| $800 to $1,499 | 177 (66.0%) | 31 (4.7%) |
| $800 to $1,499 | 54 (20.2%) | 356 (54.1%) |
| Total | 268 (100.0%) | 658 (100.0%) |
Health & Disability in Waverly
Health Insurance Coverage by Age in Waverly
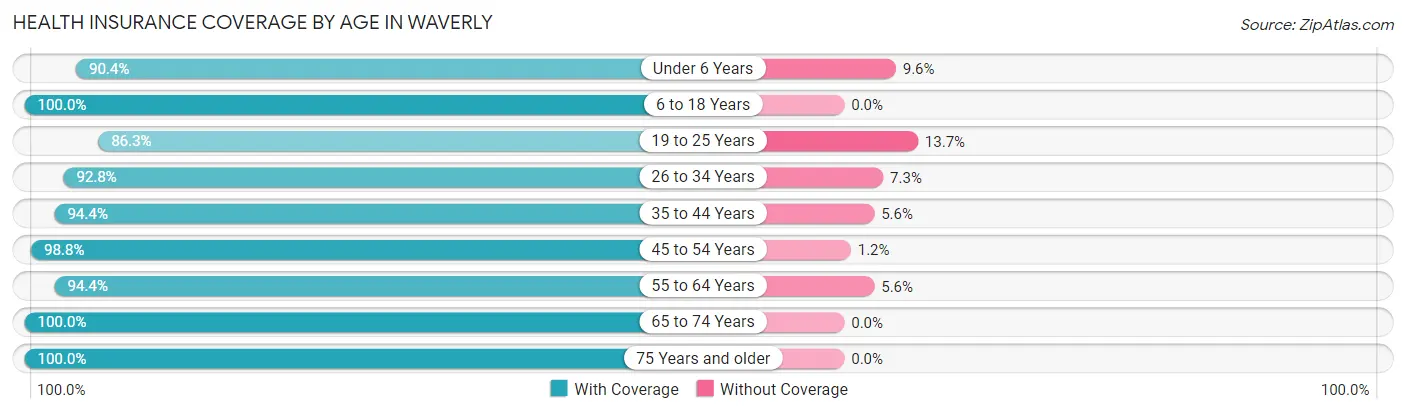
| Age Bracket | With Coverage | Without Coverage |
| Under 6 Years | 113 (90.4%) | 12 (9.6%) |
| 6 to 18 Years | 764 (100.0%) | 0 (0.0%) |
| 19 to 25 Years | 201 (86.3%) | 32 (13.7%) |
| 26 to 34 Years | 512 (92.7%) | 40 (7.2%) |
| 35 to 44 Years | 389 (94.4%) | 23 (5.6%) |
| 45 to 54 Years | 491 (98.8%) | 6 (1.2%) |
| 55 to 64 Years | 693 (94.4%) | 41 (5.6%) |
| 65 to 74 Years | 428 (100.0%) | 0 (0.0%) |
| 75 Years and older | 344 (100.0%) | 0 (0.0%) |
| Total | 3,935 (96.2%) | 154 (3.8%) |
Health Insurance Coverage by Citizenship Status in Waverly
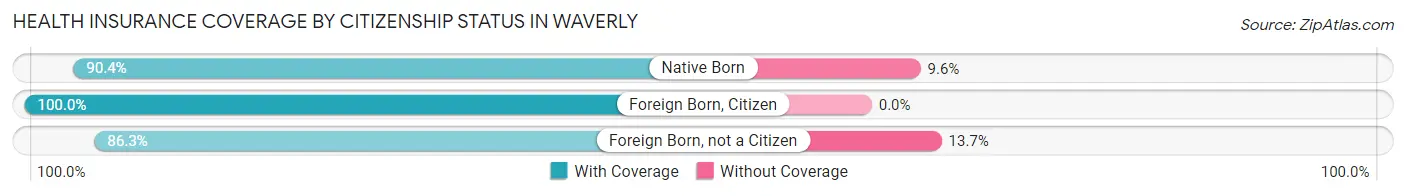
| Citizenship Status | With Coverage | Without Coverage |
| Native Born | 113 (90.4%) | 12 (9.6%) |
| Foreign Born, Citizen | 764 (100.0%) | 0 (0.0%) |
| Foreign Born, not a Citizen | 201 (86.3%) | 32 (13.7%) |
Health Insurance Coverage by Household Income in Waverly
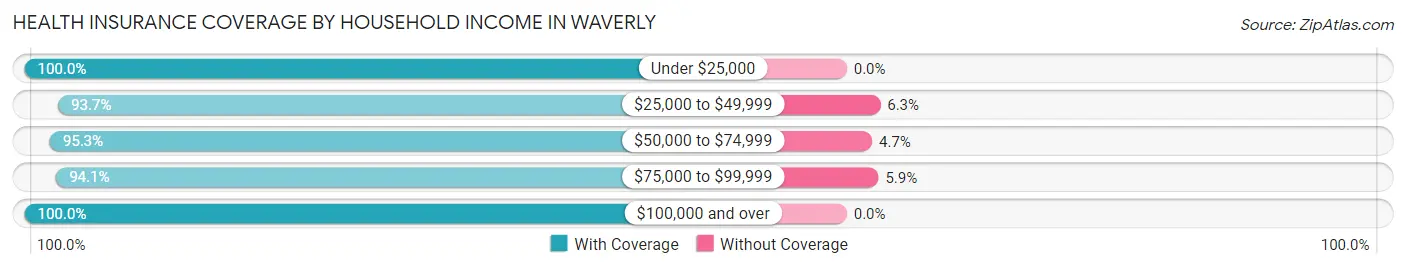
| Household Income | With Coverage | Without Coverage |
| Under $25,000 | 493 (100.0%) | 0 (0.0%) |
| $25,000 to $49,999 | 822 (93.7%) | 55 (6.3%) |
| $50,000 to $74,999 | 1,064 (95.3%) | 53 (4.7%) |
| $75,000 to $99,999 | 635 (94.1%) | 40 (5.9%) |
| $100,000 and over | 890 (100.0%) | 0 (0.0%) |
Public vs Private Health Insurance Coverage by Age in Waverly
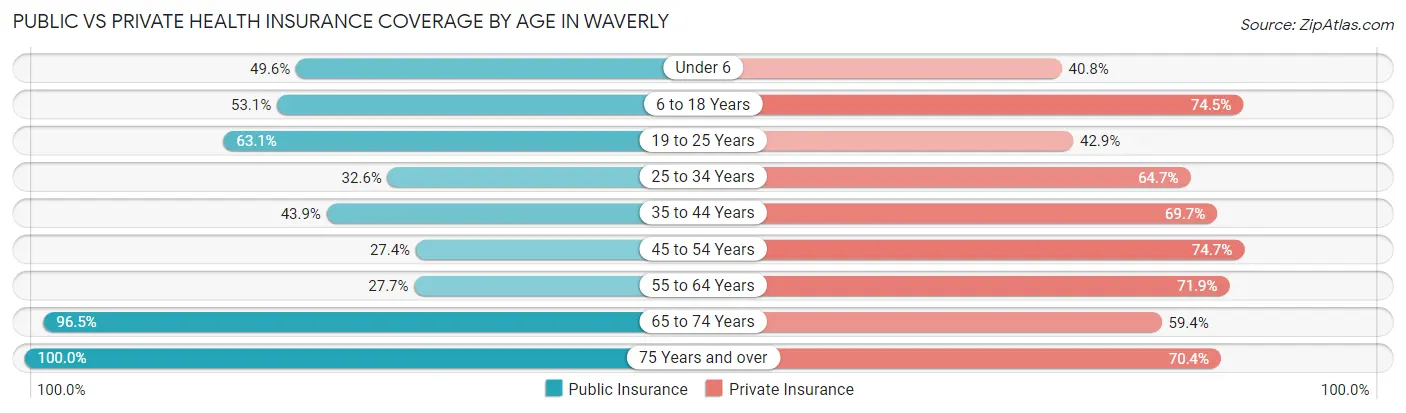
| Age Bracket | Public Insurance | Private Insurance |
| Under 6 | 62 (49.6%) | 51 (40.8%) |
| 6 to 18 Years | 406 (53.1%) | 569 (74.5%) |
| 19 to 25 Years | 147 (63.1%) | 100 (42.9%) |
| 25 to 34 Years | 180 (32.6%) | 357 (64.7%) |
| 35 to 44 Years | 181 (43.9%) | 287 (69.7%) |
| 45 to 54 Years | 136 (27.4%) | 371 (74.7%) |
| 55 to 64 Years | 203 (27.7%) | 528 (71.9%) |
| 65 to 74 Years | 413 (96.5%) | 254 (59.4%) |
| 75 Years and over | 344 (100.0%) | 242 (70.4%) |
| Total | 2,072 (50.7%) | 2,759 (67.5%) |
Disability Status by Sex by Age in Waverly
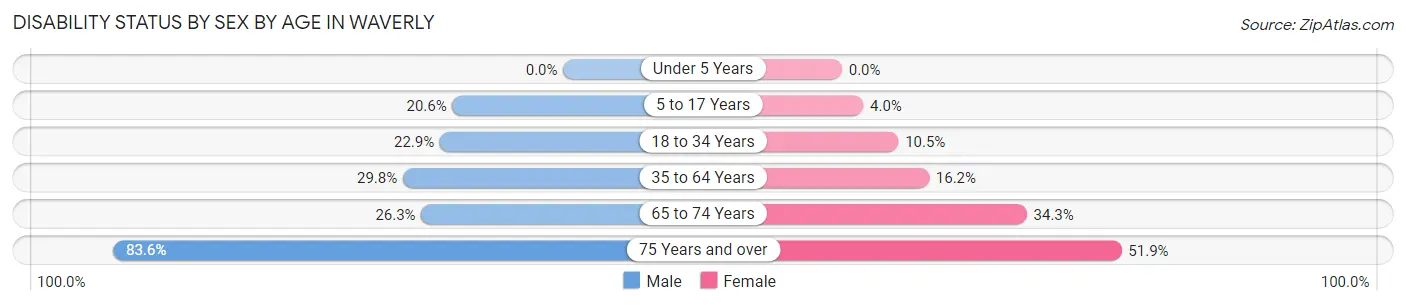
| Age Bracket | Male | Female |
| Under 5 Years | 0 (0.0%) | 0 (0.0%) |
| 5 to 17 Years | 72 (20.6%) | 14 (4.0%) |
| 18 to 34 Years | 108 (22.9%) | 42 (10.5%) |
| 35 to 64 Years | 233 (29.8%) | 139 (16.2%) |
| 65 to 74 Years | 49 (26.3%) | 83 (34.3%) |
| 75 Years and over | 112 (83.6%) | 109 (51.9%) |
Disability Class by Sex by Age in Waverly
Disability Class: Hearing Difficulty
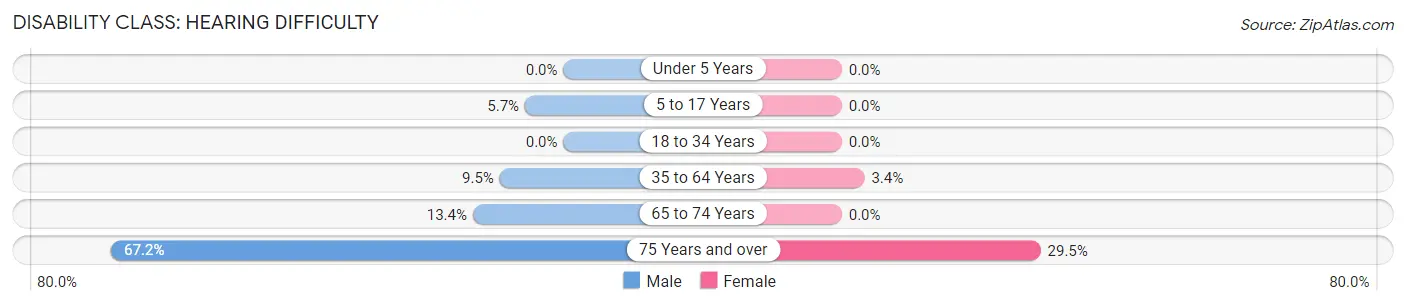
| Age Bracket | Male | Female |
| Under 5 Years | 0 (0.0%) | 0 (0.0%) |
| 5 to 17 Years | 20 (5.7%) | 0 (0.0%) |
| 18 to 34 Years | 0 (0.0%) | 0 (0.0%) |
| 35 to 64 Years | 74 (9.5%) | 29 (3.4%) |
| 65 to 74 Years | 25 (13.4%) | 0 (0.0%) |
| 75 Years and over | 90 (67.2%) | 62 (29.5%) |
Disability Class: Vision Difficulty
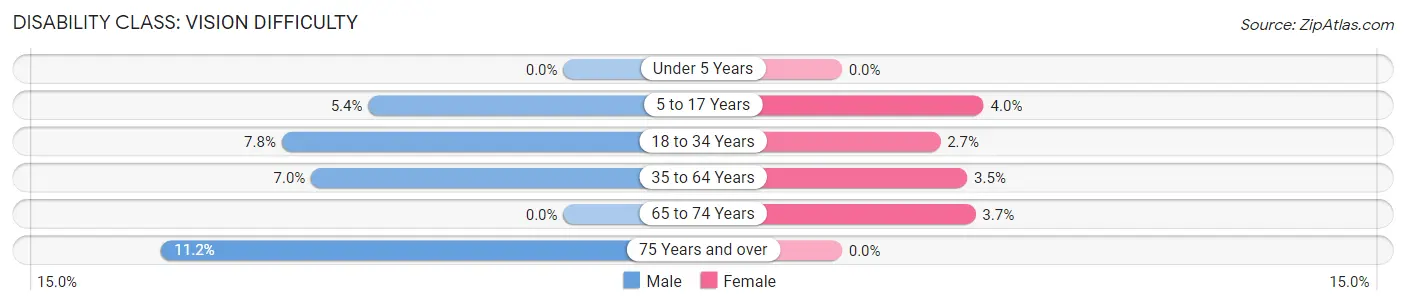
| Age Bracket | Male | Female |
| Under 5 Years | 0 (0.0%) | 0 (0.0%) |
| 5 to 17 Years | 19 (5.4%) | 14 (4.0%) |
| 18 to 34 Years | 37 (7.8%) | 11 (2.7%) |
| 35 to 64 Years | 55 (7.0%) | 30 (3.5%) |
| 65 to 74 Years | 0 (0.0%) | 9 (3.7%) |
| 75 Years and over | 15 (11.2%) | 0 (0.0%) |
Disability Class: Cognitive Difficulty
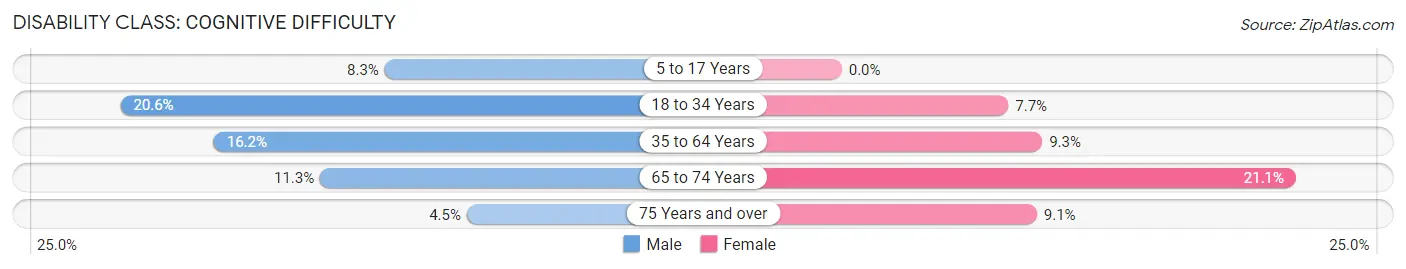
| Age Bracket | Male | Female |
| 5 to 17 Years | 29 (8.3%) | 0 (0.0%) |
| 18 to 34 Years | 97 (20.5%) | 31 (7.7%) |
| 35 to 64 Years | 127 (16.2%) | 80 (9.3%) |
| 65 to 74 Years | 21 (11.3%) | 51 (21.1%) |
| 75 Years and over | 6 (4.5%) | 19 (9.0%) |
Disability Class: Ambulatory Difficulty
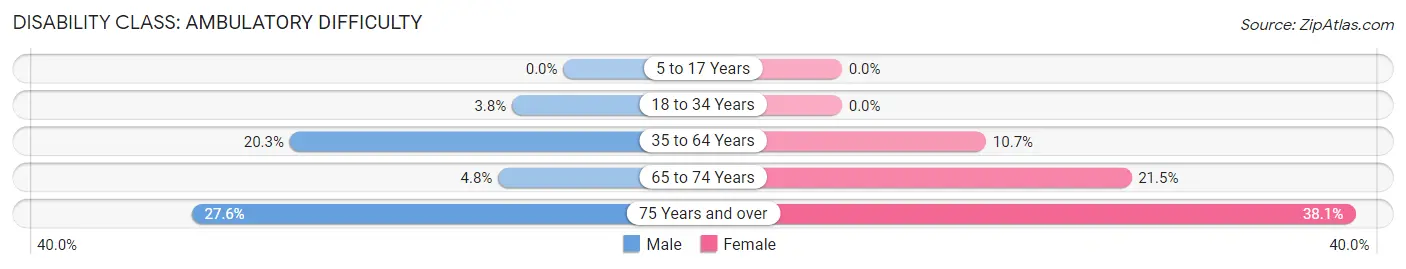
| Age Bracket | Male | Female |
| 5 to 17 Years | 0 (0.0%) | 0 (0.0%) |
| 18 to 34 Years | 18 (3.8%) | 0 (0.0%) |
| 35 to 64 Years | 159 (20.3%) | 92 (10.7%) |
| 65 to 74 Years | 9 (4.8%) | 52 (21.5%) |
| 75 Years and over | 37 (27.6%) | 80 (38.1%) |
Disability Class: Self-Care Difficulty
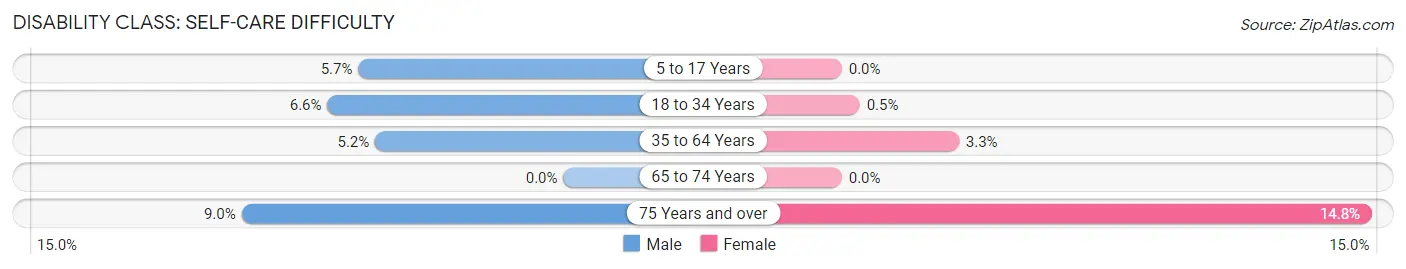
| Age Bracket | Male | Female |
| 5 to 17 Years | 20 (5.7%) | 0 (0.0%) |
| 18 to 34 Years | 31 (6.6%) | 2 (0.5%) |
| 35 to 64 Years | 41 (5.2%) | 28 (3.3%) |
| 65 to 74 Years | 0 (0.0%) | 0 (0.0%) |
| 75 Years and over | 12 (9.0%) | 31 (14.8%) |
Technology Access in Waverly
Computing Device Access in Waverly
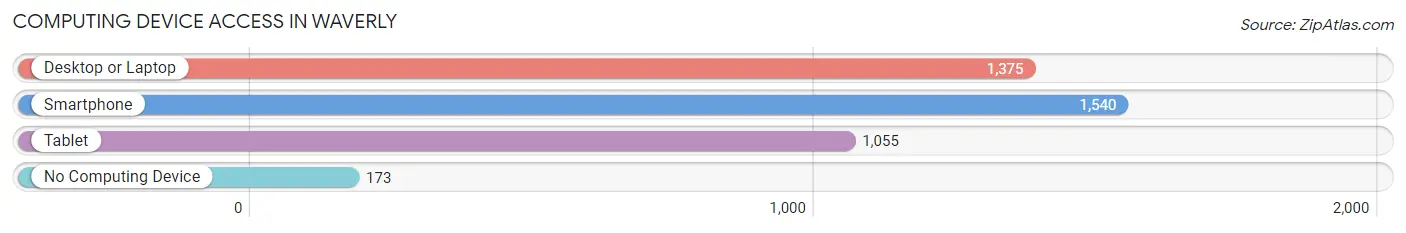
| Device Type | # Households | % Households |
| Desktop or Laptop | 1,375 | 74.0% |
| Smartphone | 1,540 | 82.9% |
| Tablet | 1,055 | 56.8% |
| No Computing Device | 173 | 9.3% |
| Total | 1,857 | 100.0% |
Internet Access in Waverly
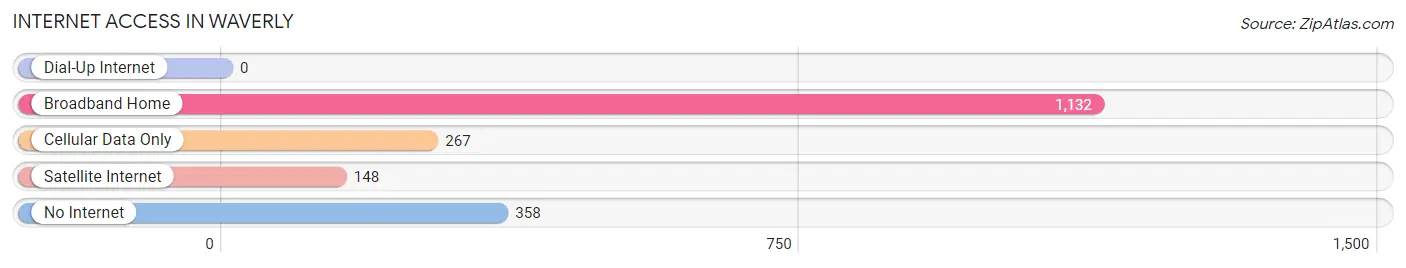
| Internet Type | # Households | % Households |
| Dial-Up Internet | 0 | 0.0% |
| Broadband Home | 1,132 | 61.0% |
| Cellular Data Only | 267 | 14.4% |
| Satellite Internet | 148 | 8.0% |
| No Internet | 358 | 19.3% |
| Total | 1,857 | 100.0% |
Waverly Summary
Waverly, Ohio is a small city located in Pike County, Ohio. It is situated along the Scioto River, approximately 40 miles south of Columbus. The city has a population of approximately 5,000 people and is the county seat of Pike County.
History
Waverly was founded in 1815 by a group of settlers from New England. The city was named after the Earl of Waverly, a character in Sir Walter Scott’s novel, Waverly. The city was incorporated in 1832 and was the first city in Pike County.
In the early 19th century, Waverly was a major stop on the Underground Railroad. The city was home to several abolitionists, including the Reverend John Rankin, who helped many slaves escape to freedom.
Geography
Waverly is located in the Appalachian Plateau region of Ohio. The city is situated along the Scioto River, which flows through the city. The city is surrounded by rolling hills and forests.
The climate in Waverly is humid continental, with hot summers and cold winters. The average annual temperature is around 50 degrees Fahrenheit.
Economy
The economy of Waverly is largely based on agriculture and manufacturing. The city is home to several large manufacturing companies, including the Waverly Manufacturing Company, which produces paper products.
The city is also home to several small businesses, including restaurants, retail stores, and service providers.
Demographics
As of the 2010 census, the population of Waverly was 5,067. The racial makeup of the city was 95.3% White, 1.2% African American, 0.3% Native American, 0.7% Asian, 0.1% Pacific Islander, and 2.4% from other races.
The median household income in Waverly was $37,941, and the median family income was $45,941. The per capita income was $19,941.
Conclusion
Waverly, Ohio is a small city located in Pike County, Ohio. It is situated along the Scioto River, approximately 40 miles south of Columbus. The city has a population of approximately 5,000 people and is the county seat of Pike County. The economy of Waverly is largely based on agriculture and manufacturing, and the city is home to several small businesses. The racial makeup of the city is 95.3% White, 1.2% African American, 0.3% Native American, 0.7% Asian, 0.1% Pacific Islander, and 2.4% from other races. The median household income in Waverly was $37,941, and the median family income was $45,941. The per capita income was $19,941.
Common Questions
What is Per Capita Income in Waverly?
Per Capita income in Waverly is $30,990.
What is the Median Family Income in Waverly?
Median Family Income in Waverly is $63,555.
What is the Median Household income in Waverly?
Median Household Income in Waverly is $55,146.
What is Income or Wage Gap in Waverly?
Income or Wage Gap in Waverly is 39.1%.
Women in Waverly earn 60.9 cents for every dollar earned by a man.
What is Family Income Deficit in Waverly?
Family Income Deficit in Waverly is $5,581.
Families that are below poverty line in Waverly earn $5,581 less on average than the poverty threshold level.
What is Inequality or Gini Index in Waverly?
Inequality or Gini Index in Waverly is 0.42.
What is the Total Population of Waverly?
Total Population of Waverly is 4,154.
What is the Total Male Population of Waverly?
Total Male Population of Waverly is 2,044.
What is the Total Female Population of Waverly?
Total Female Population of Waverly is 2,110.
What is the Ratio of Males per 100 Females in Waverly?
There are 96.87 Males per 100 Females in Waverly.
What is the Ratio of Females per 100 Males in Waverly?
There are 103.23 Females per 100 Males in Waverly.
What is the Median Population Age in Waverly?
Median Population Age in Waverly is 44.8 Years.
What is the Average Family Size in Waverly
Average Family Size in Waverly is 2.7 People.
What is the Average Household Size in Waverly
Average Household Size in Waverly is 2.2 People.
How Large is the Labor Force in Waverly?
There are 1,939 People in the Labor Forcein in Waverly.
What is the Percentage of People in the Labor Force in Waverly?
56.0% of People are in the Labor Force in Waverly.
What is the Unemployment Rate in Waverly?
Unemployment Rate in Waverly is 3.2%.