Masury, OH Map & Demographics
Masury Map
Masury Overview
$25,181
PER CAPITA INCOME
$59,290
AVG FAMILY INCOME
$43,688
AVG HOUSEHOLD INCOME
23.7%
WAGE / INCOME GAP [ % ]
76.3¢/ $1
WAGE / INCOME GAP [ $ ]
0.37
INEQUALITY / GINI INDEX
2,212
TOTAL POPULATION
1,242
MALE POPULATION
970
FEMALE POPULATION
128.04
MALES / 100 FEMALES
78.10
FEMALES / 100 MALES
44.6
MEDIAN AGE
3.0
AVG FAMILY SIZE
2.1
AVG HOUSEHOLD SIZE
967
LABOR FORCE [ PEOPLE ]
53.6%
PERCENT IN LABOR FORCE
7.1%
UNEMPLOYMENT RATE
Masury Zip Codes
Masury Area Codes
Income in Masury
Income Overview in Masury
Per Capita Income in Masury is $25,181, while median incomes of families and households are $59,290 and $43,688 respectively.
| Characteristic | Number | Measure |
| Per Capita Income | 2,212 | $25,181 |
| Median Family Income | 541 | $59,290 |
| Mean Family Income | 541 | $70,563 |
| Median Household Income | 1,074 | $43,688 |
| Mean Household Income | 1,074 | $51,271 |
| Income Deficit | 541 | $0 |
| Wage / Income Gap (%) | 2,212 | 23.73% |
| Wage / Income Gap ($) | 2,212 | 76.27¢ per $1 |
| Gini / Inequality Index | 2,212 | 0.37 |
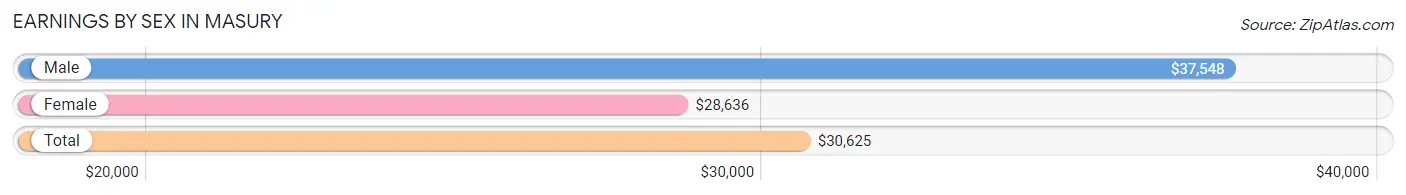
Earnings by Sex in Masury
Average Earnings in Masury are $30,625, $37,548 for men and $28,636 for women, a difference of 23.7%.
| Sex | Number | Average Earnings |
| Male | 561 (59.1%) | $37,548 |
| Female | 388 (40.9%) | $28,636 |
| Total | 949 (100.0%) | $30,625 |
Earnings by Sex by Income Bracket in Masury
The most common earnings brackets in Masury are $45,000 to $49,999 for men (116 | 20.7%) and $25,000 to $29,999 for women (68 | 17.5%).
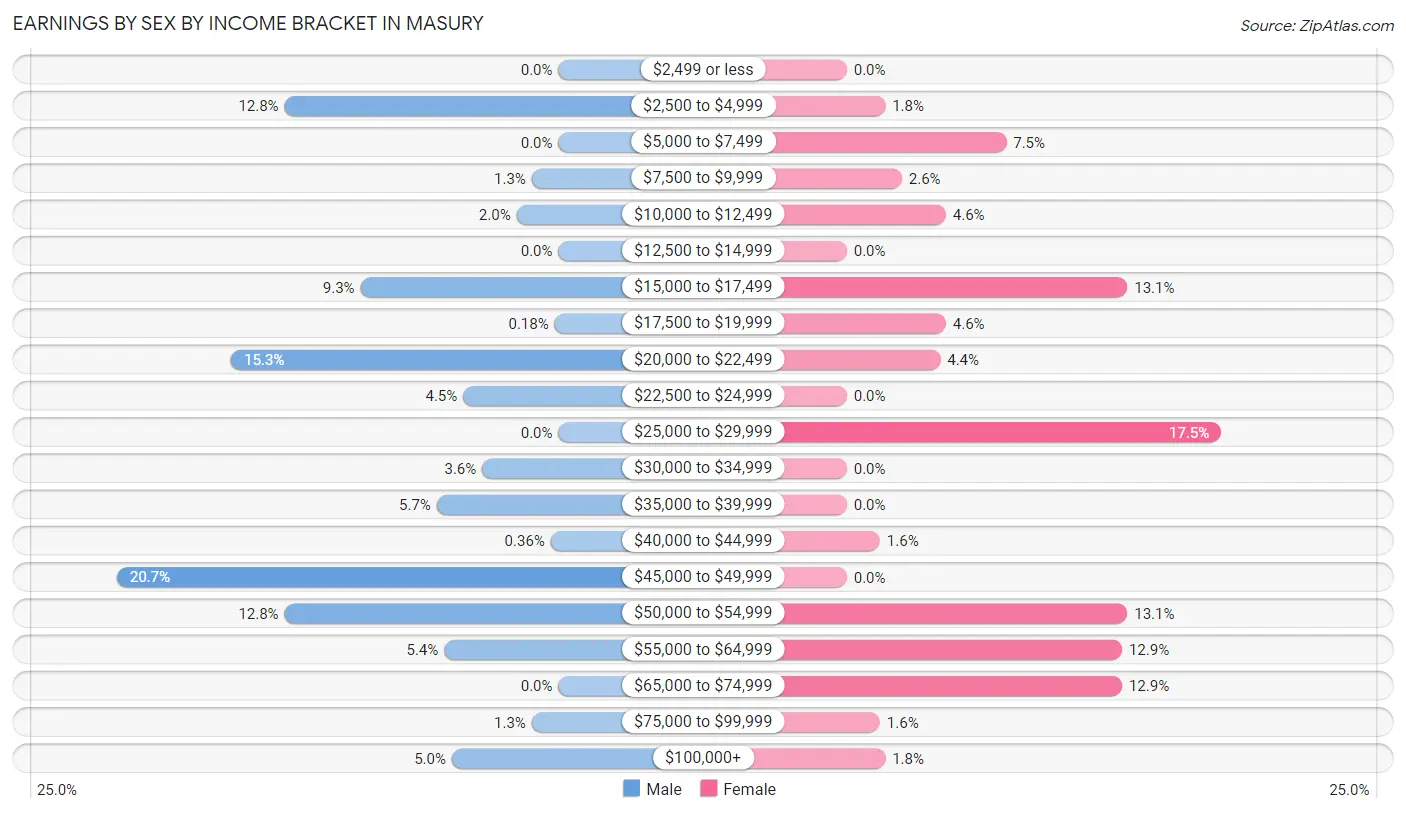
| Income | Male | Female |
| $2,499 or less | 0 (0.0%) | 0 (0.0%) |
| $2,500 to $4,999 | 72 (12.8%) | 7 (1.8%) |
| $5,000 to $7,499 | 0 (0.0%) | 29 (7.5%) |
| $7,500 to $9,999 | 7 (1.3%) | 10 (2.6%) |
| $10,000 to $12,499 | 11 (2.0%) | 18 (4.6%) |
| $12,500 to $14,999 | 0 (0.0%) | 0 (0.0%) |
| $15,000 to $17,499 | 52 (9.3%) | 51 (13.1%) |
| $17,500 to $19,999 | 1 (0.2%) | 18 (4.6%) |
| $20,000 to $22,499 | 86 (15.3%) | 17 (4.4%) |
| $22,500 to $24,999 | 25 (4.5%) | 0 (0.0%) |
| $25,000 to $29,999 | 0 (0.0%) | 68 (17.5%) |
| $30,000 to $34,999 | 20 (3.6%) | 0 (0.0%) |
| $35,000 to $39,999 | 32 (5.7%) | 0 (0.0%) |
| $40,000 to $44,999 | 2 (0.4%) | 6 (1.5%) |
| $45,000 to $49,999 | 116 (20.7%) | 0 (0.0%) |
| $50,000 to $54,999 | 72 (12.8%) | 51 (13.1%) |
| $55,000 to $64,999 | 30 (5.3%) | 50 (12.9%) |
| $65,000 to $74,999 | 0 (0.0%) | 50 (12.9%) |
| $75,000 to $99,999 | 7 (1.3%) | 6 (1.5%) |
| $100,000+ | 28 (5.0%) | 7 (1.8%) |
| Total | 561 (100.0%) | 388 (100.0%) |
Earnings by Sex by Educational Attainment in Masury
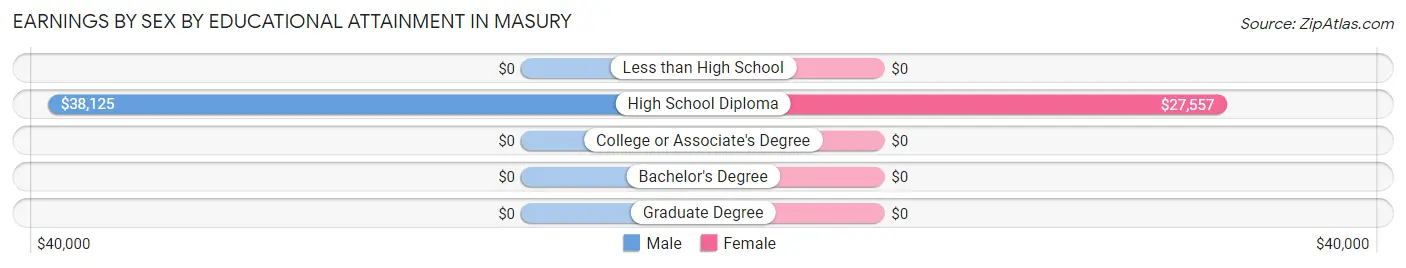
| Educational Attainment | Male Income | Female Income |
| Less than High School | - | - |
| High School Diploma | $38,125 | $27,557 |
| College or Associate's Degree | - | - |
| Bachelor's Degree | - | - |
| Graduate Degree | - | - |
| Total | $39,952 | $0 |
Family Income in Masury
Family Income Brackets in Masury
According to the Masury family income data, there are 163 families falling into the $50,000 to $74,999 income range, which is the most common income bracket and makes up 30.1% of all families.
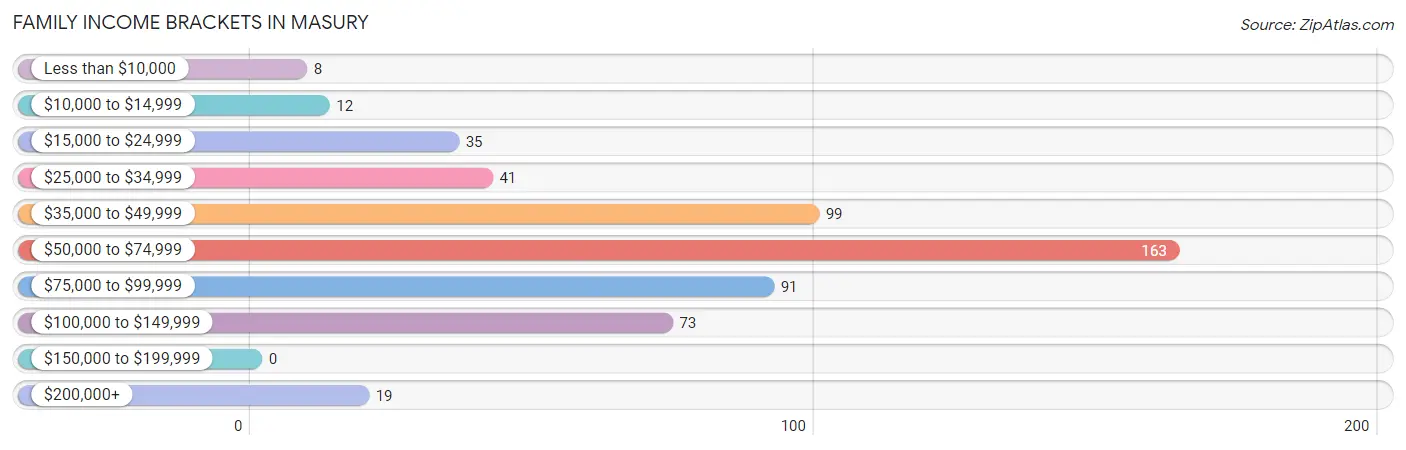
| Income Bracket | # Families | % Families |
| Less than $10,000 | 8 | 1.5% |
| $10,000 to $14,999 | 12 | 2.2% |
| $15,000 to $24,999 | 35 | 6.5% |
| $25,000 to $34,999 | 41 | 7.6% |
| $35,000 to $49,999 | 99 | 18.3% |
| $50,000 to $74,999 | 163 | 30.1% |
| $75,000 to $99,999 | 91 | 16.8% |
| $100,000 to $149,999 | 73 | 13.5% |
| $150,000 to $199,999 | 0 | 0.0% |
| $200,000+ | 19 | 3.5% |
Family Income by Famaliy Size in Masury
3-person families (55 | 10.2%) account for the highest median family income in Masury with $75,469 per family, while 2-person families (304 | 56.2%) have the highest median income of $28,864 per family member.
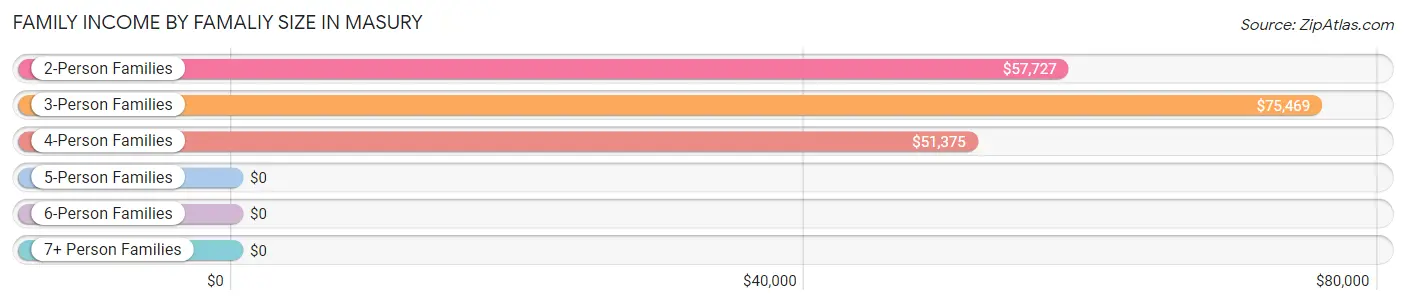
| Income Bracket | # Families | Median Income |
| 2-Person Families | 304 (56.2%) | $57,727 |
| 3-Person Families | 55 (10.2%) | $75,469 |
| 4-Person Families | 127 (23.5%) | $51,375 |
| 5-Person Families | 26 (4.8%) | $0 |
| 6-Person Families | 29 (5.4%) | $0 |
| 7+ Person Families | 0 (0.0%) | $0 |
| Total | 541 (100.0%) | $59,290 |
Family Income by Number of Earners in Masury
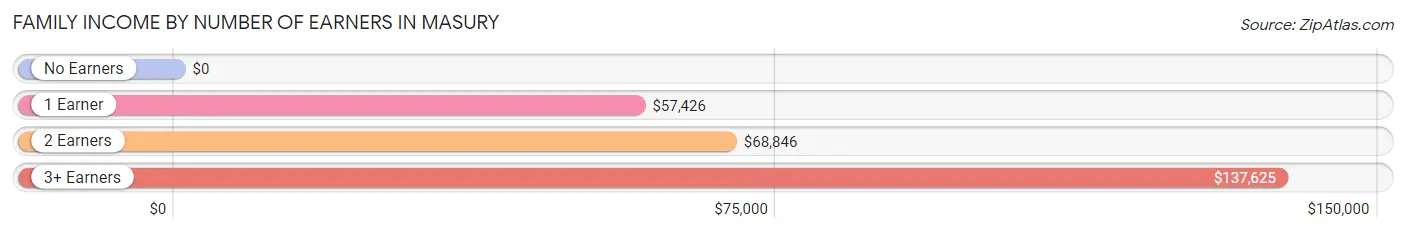
| Number of Earners | # Families | Median Income |
| No Earners | 67 (12.4%) | $0 |
| 1 Earner | 234 (43.2%) | $57,426 |
| 2 Earners | 202 (37.3%) | $68,846 |
| 3+ Earners | 38 (7.0%) | $137,625 |
| Total | 541 (100.0%) | $59,290 |
Household Income in Masury
Household Income Brackets in Masury
With 318 households falling in the category, the $15,000 to $24,999 income range is the most frequent in Masury, accounting for 29.6% of all households.
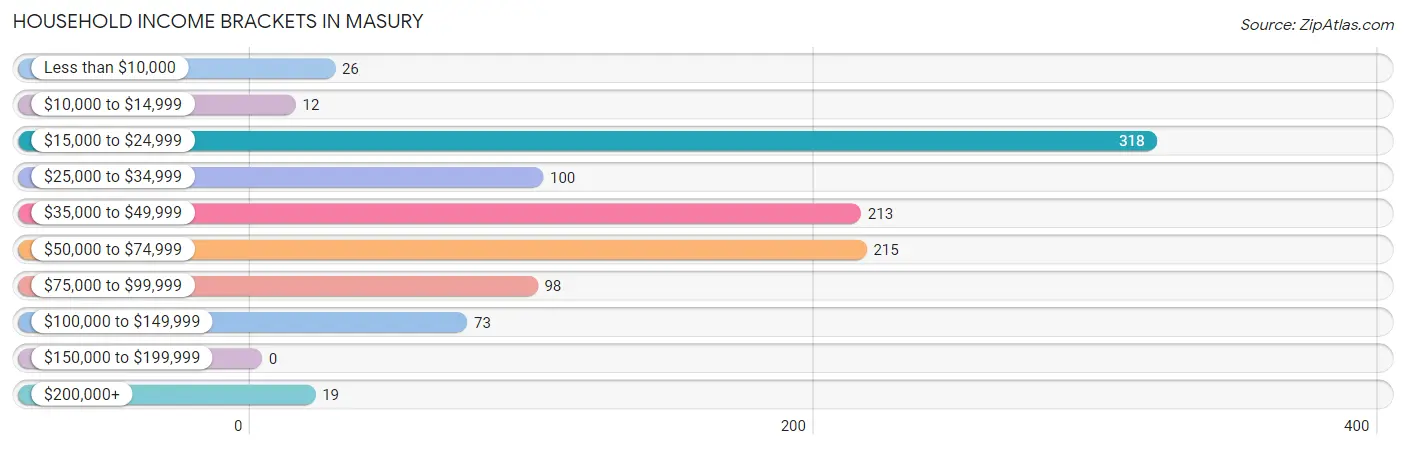
| Income Bracket | # Households | % Households |
| Less than $10,000 | 26 | 2.4% |
| $10,000 to $14,999 | 12 | 1.1% |
| $15,000 to $24,999 | 318 | 29.6% |
| $25,000 to $34,999 | 100 | 9.3% |
| $35,000 to $49,999 | 213 | 19.8% |
| $50,000 to $74,999 | 215 | 20.0% |
| $75,000 to $99,999 | 98 | 9.1% |
| $100,000 to $149,999 | 73 | 6.8% |
| $150,000 to $199,999 | 0 | 0.0% |
| $200,000+ | 19 | 1.8% |
Household Income by Householder Age in Masury
The median household income in Masury is $43,688, with the highest median household income of $76,371 found in the 45 to 64 years age bracket for the primary householder. A total of 306 households (28.5%) fall into this category.
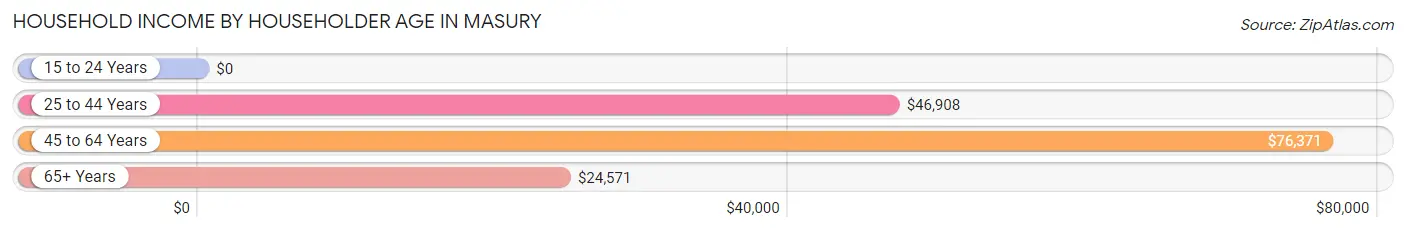
| Income Bracket | # Households | Median Income |
| 15 to 24 Years | 0 (0.0%) | $0 |
| 25 to 44 Years | 289 (26.9%) | $46,908 |
| 45 to 64 Years | 306 (28.5%) | $76,371 |
| 65+ Years | 479 (44.6%) | $24,571 |
| Total | 1,074 (100.0%) | $43,688 |
Poverty in Masury
Income Below Poverty by Sex and Age in Masury
With 13.7% poverty level for males and 17.4% for females among the residents of Masury, 16 and 17 year old males and under 5 year old females are the most vulnerable to poverty, with 10 males (100.0%) and 33 females (45.2%) in their respective age groups living below the poverty level.
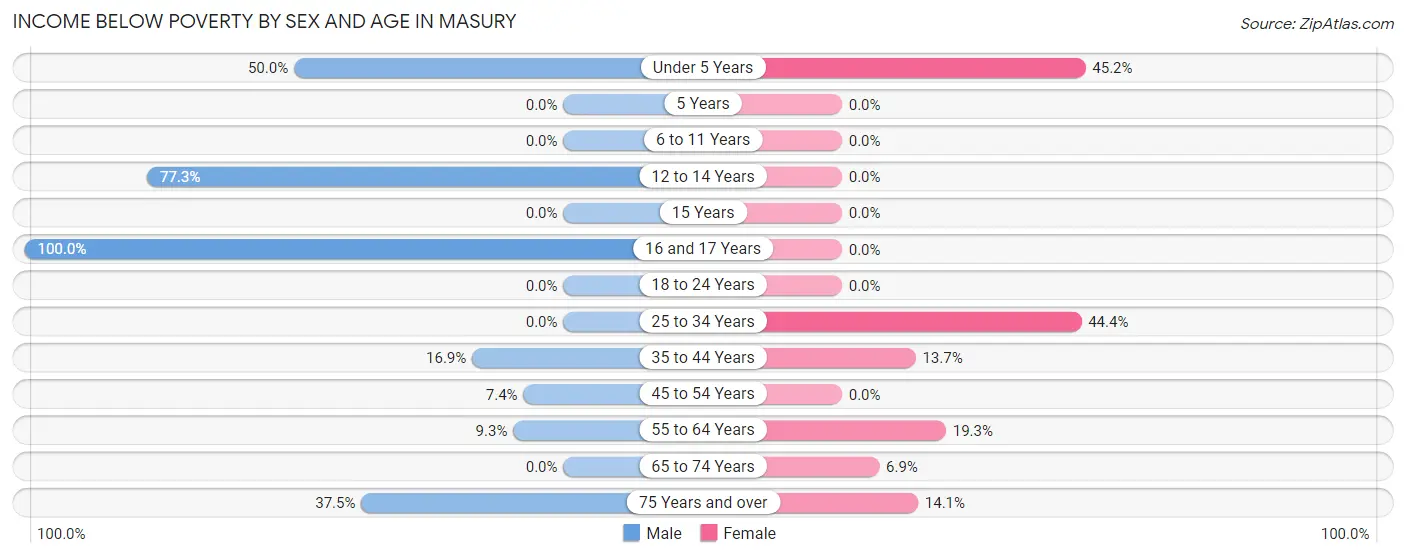
| Age Bracket | Male | Female |
| Under 5 Years | 50 (50.0%) | 33 (45.2%) |
| 5 Years | 0 (0.0%) | 0 (0.0%) |
| 6 to 11 Years | 0 (0.0%) | 0 (0.0%) |
| 12 to 14 Years | 34 (77.3%) | 0 (0.0%) |
| 15 Years | 0 (0.0%) | 0 (0.0%) |
| 16 and 17 Years | 10 (100.0%) | 0 (0.0%) |
| 18 to 24 Years | 0 (0.0%) | 0 (0.0%) |
| 25 to 34 Years | 0 (0.0%) | 68 (44.4%) |
| 35 to 44 Years | 31 (16.9%) | 16 (13.7%) |
| 45 to 54 Years | 8 (7.4%) | 0 (0.0%) |
| 55 to 64 Years | 16 (9.3%) | 33 (19.3%) |
| 65 to 74 Years | 0 (0.0%) | 7 (6.9%) |
| 75 Years and over | 21 (37.5%) | 12 (14.1%) |
| Total | 170 (13.7%) | 169 (17.4%) |
Income Above Poverty by Sex and Age in Masury
According to the poverty statistics in Masury, males aged 6 to 11 years and females aged 6 to 11 years are the age groups that are most secure financially, with 100.0% of males and 100.0% of females in these age groups living above the poverty line.
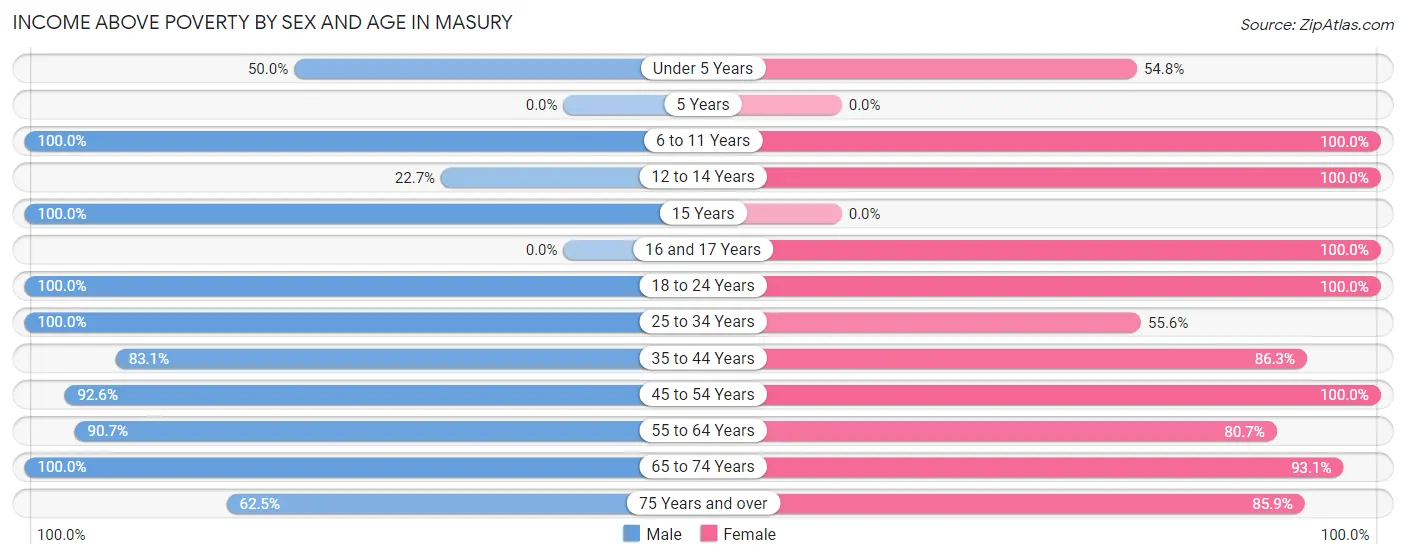
| Age Bracket | Male | Female |
| Under 5 Years | 50 (50.0%) | 40 (54.8%) |
| 5 Years | 0 (0.0%) | 0 (0.0%) |
| 6 to 11 Years | 28 (100.0%) | 111 (100.0%) |
| 12 to 14 Years | 10 (22.7%) | 41 (100.0%) |
| 15 Years | 10 (100.0%) | 0 (0.0%) |
| 16 and 17 Years | 0 (0.0%) | 18 (100.0%) |
| 18 to 24 Years | 77 (100.0%) | 35 (100.0%) |
| 25 to 34 Years | 113 (100.0%) | 85 (55.6%) |
| 35 to 44 Years | 152 (83.1%) | 101 (86.3%) |
| 45 to 54 Years | 100 (92.6%) | 65 (100.0%) |
| 55 to 64 Years | 156 (90.7%) | 138 (80.7%) |
| 65 to 74 Years | 341 (100.0%) | 94 (93.1%) |
| 75 Years and over | 35 (62.5%) | 73 (85.9%) |
| Total | 1,072 (86.3%) | 801 (82.6%) |
Income Below Poverty Among Married-Couple Families in Masury
The poverty statistics for married-couple families in Masury show that 13.9% or 60 of the total 431 families live below the poverty line. Families with 1 or 2 children have the highest poverty rate of 22.0%, comprising of 31 families. On the other hand, families with 3 or 4 children have the lowest poverty rate of 0.0%, which includes 0 families.
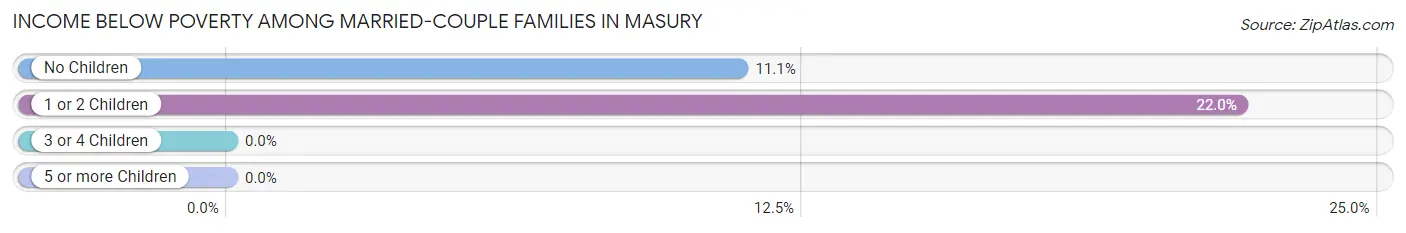
| Children | Above Poverty | Below Poverty |
| No Children | 232 (88.9%) | 29 (11.1%) |
| 1 or 2 Children | 110 (78.0%) | 31 (22.0%) |
| 3 or 4 Children | 29 (100.0%) | 0 (0.0%) |
| 5 or more Children | 0 (0.0%) | 0 (0.0%) |
| Total | 371 (86.1%) | 60 (13.9%) |
Income Below Poverty Among Single-Parent Households in Masury
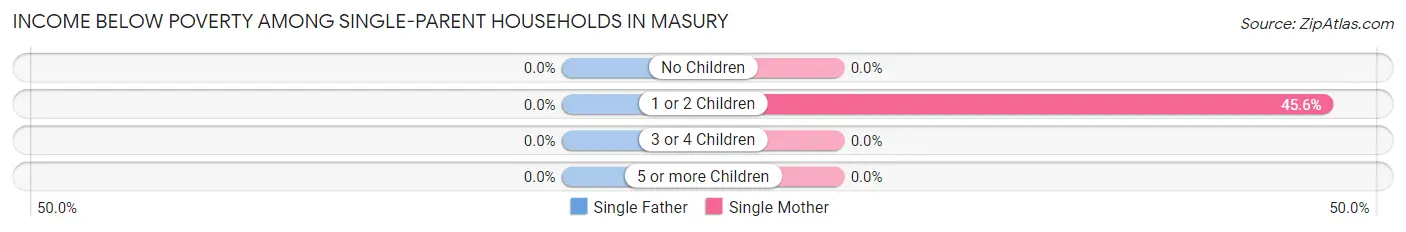
| Children | Single Father | Single Mother |
| No Children | 0 (0.0%) | 0 (0.0%) |
| 1 or 2 Children | 0 (0.0%) | 26 (45.6%) |
| 3 or 4 Children | 0 (0.0%) | 0 (0.0%) |
| 5 or more Children | 0 (0.0%) | 0 (0.0%) |
| Total | 0 (0.0%) | 26 (37.1%) |
Income Below Poverty Among Married-Couple vs Single-Parent Households in Masury
The poverty data for Masury shows that 60 of the married-couple family households (13.9%) and 26 of the single-parent households (23.6%) are living below the poverty level. Within the married-couple family households, those with 1 or 2 children have the highest poverty rate, with 31 households (22.0%) falling below the poverty line. Among the single-parent households, those with 1 or 2 children have the highest poverty rate, with 26 household (45.6%) living below poverty.
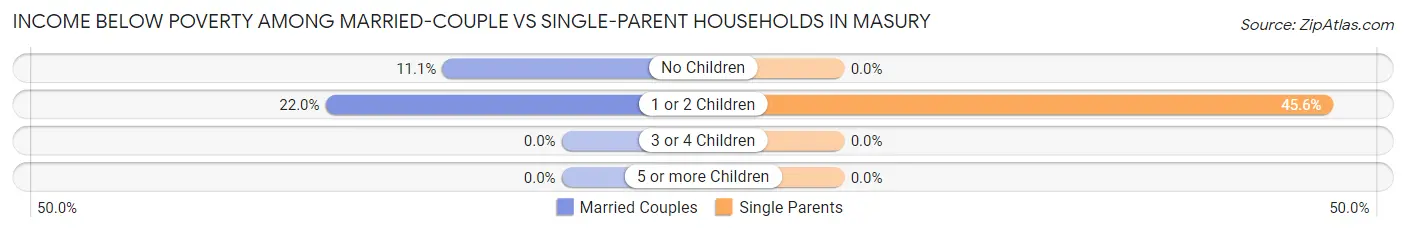
| Children | Married-Couple Families | Single-Parent Households |
| No Children | 29 (11.1%) | 0 (0.0%) |
| 1 or 2 Children | 31 (22.0%) | 26 (45.6%) |
| 3 or 4 Children | 0 (0.0%) | 0 (0.0%) |
| 5 or more Children | 0 (0.0%) | 0 (0.0%) |
| Total | 60 (13.9%) | 26 (23.6%) |
Race in Masury
The most populous races in Masury are White / Caucasian (1,925 | 87.0%), Two or more Races (287 | 13.0%), and Hispanic or Latino (37 | 1.7%).
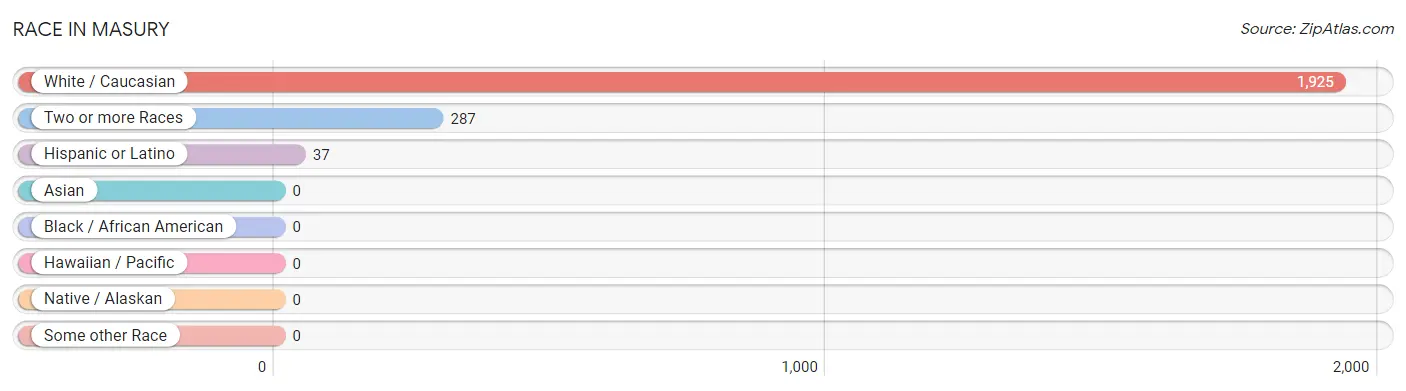
| Race | # Population | % Population |
| Asian | 0 | 0.0% |
| Black / African American | 0 | 0.0% |
| Hawaiian / Pacific | 0 | 0.0% |
| Hispanic or Latino | 37 | 1.7% |
| Native / Alaskan | 0 | 0.0% |
| White / Caucasian | 1,925 | 87.0% |
| Two or more Races | 287 | 13.0% |
| Some other Race | 0 | 0.0% |
| Total | 2,212 | 100.0% |
Ancestry in Masury
The most populous ancestries reported in Masury are American (610 | 27.6%), Irish (349 | 15.8%), German (278 | 12.6%), Italian (247 | 11.2%), and Hungarian (235 | 10.6%), together accounting for 77.7% of all Masury residents.
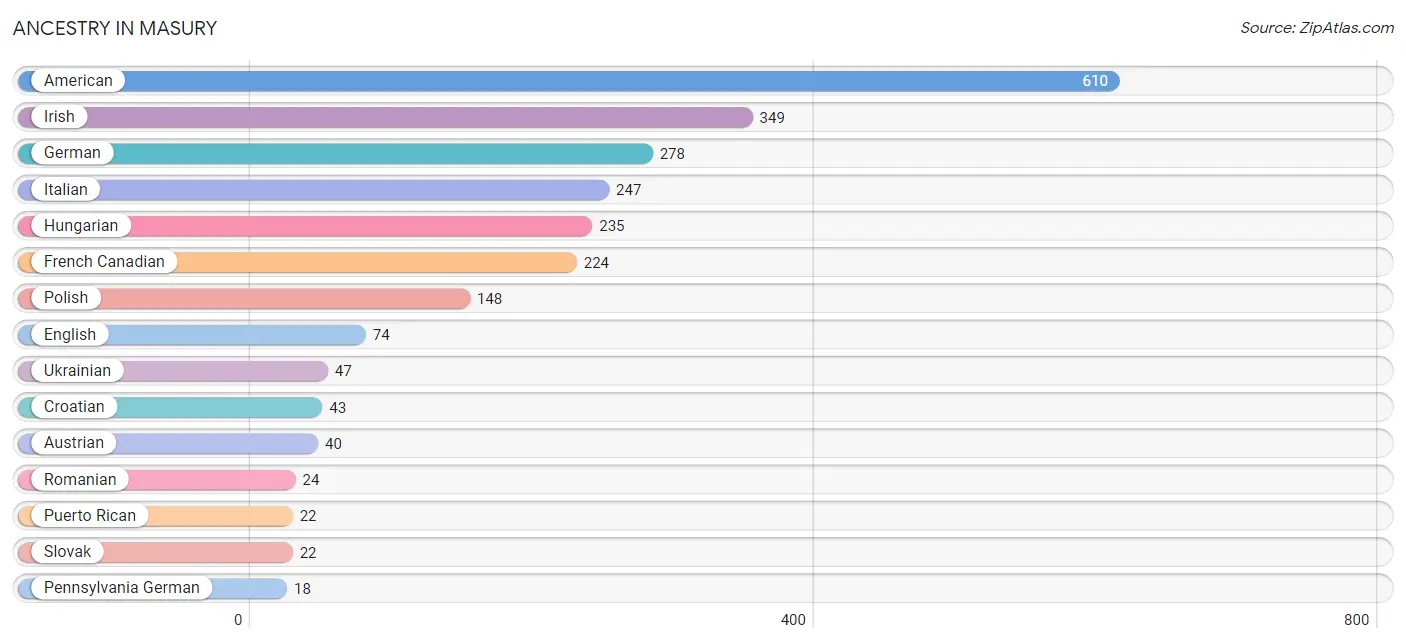
| Ancestry | # Population | % Population |
| American | 610 | 27.6% |
| Austrian | 40 | 1.8% |
| Croatian | 43 | 1.9% |
| Czech | 5 | 0.2% |
| Dutch | 9 | 0.4% |
| English | 74 | 3.4% |
| French | 15 | 0.7% |
| French Canadian | 224 | 10.1% |
| German | 278 | 12.6% |
| Hungarian | 235 | 10.6% |
| Irish | 349 | 15.8% |
| Italian | 247 | 11.2% |
| Mexican | 15 | 0.7% |
| Pennsylvania German | 18 | 0.8% |
| Polish | 148 | 6.7% |
| Puerto Rican | 22 | 1.0% |
| Romanian | 24 | 1.1% |
| Russian | 8 | 0.4% |
| Slovak | 22 | 1.0% |
| Slovene | 10 | 0.4% |
| Swedish | 12 | 0.5% |
| Ukrainian | 47 | 2.1% |
| Welsh | 16 | 0.7% | View All 23 Rows |
Immigrants in Masury
The most numerous immigrant groups reported in Masury came from Europe (8 | 0.4%), Germany (8 | 0.4%), and Western Europe (8 | 0.4%), together accounting for 1.1% of all Masury residents.
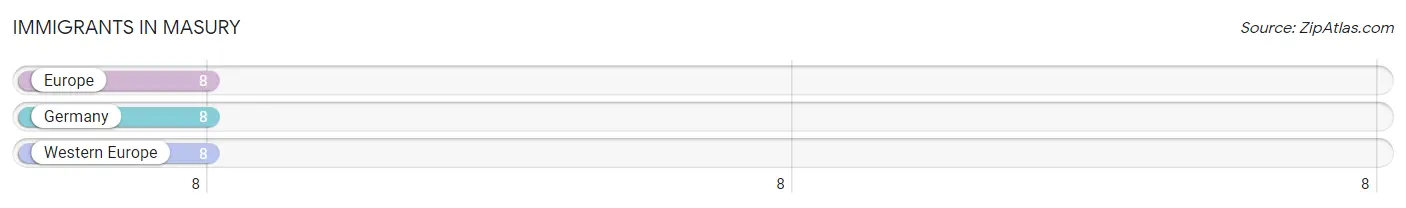
| Immigration Origin | # Population | % Population |
| Europe | 8 | 0.4% |
| Germany | 8 | 0.4% |
| Western Europe | 8 | 0.4% | View All 3 Rows |
Sex and Age in Masury
Sex and Age in Masury
The most populous age groups in Masury are 65 to 69 Years (249 | 20.1%) for men and 30 to 34 Years (131 | 13.5%) for women.
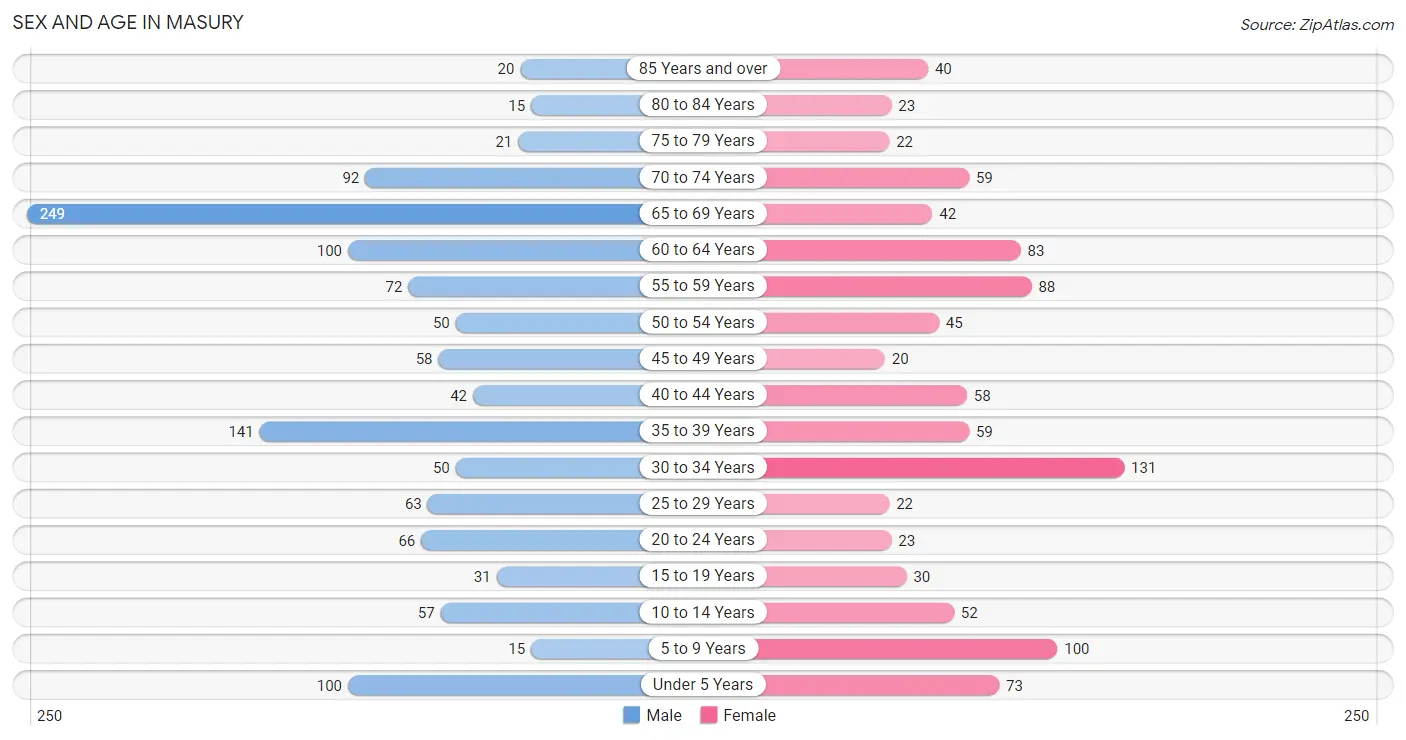
| Age Bracket | Male | Female |
| Under 5 Years | 100 (8.1%) | 73 (7.5%) |
| 5 to 9 Years | 15 (1.2%) | 100 (10.3%) |
| 10 to 14 Years | 57 (4.6%) | 52 (5.4%) |
| 15 to 19 Years | 31 (2.5%) | 30 (3.1%) |
| 20 to 24 Years | 66 (5.3%) | 23 (2.4%) |
| 25 to 29 Years | 63 (5.1%) | 22 (2.3%) |
| 30 to 34 Years | 50 (4.0%) | 131 (13.5%) |
| 35 to 39 Years | 141 (11.4%) | 59 (6.1%) |
| 40 to 44 Years | 42 (3.4%) | 58 (6.0%) |
| 45 to 49 Years | 58 (4.7%) | 20 (2.1%) |
| 50 to 54 Years | 50 (4.0%) | 45 (4.6%) |
| 55 to 59 Years | 72 (5.8%) | 88 (9.1%) |
| 60 to 64 Years | 100 (8.1%) | 83 (8.6%) |
| 65 to 69 Years | 249 (20.1%) | 42 (4.3%) |
| 70 to 74 Years | 92 (7.4%) | 59 (6.1%) |
| 75 to 79 Years | 21 (1.7%) | 22 (2.3%) |
| 80 to 84 Years | 15 (1.2%) | 23 (2.4%) |
| 85 Years and over | 20 (1.6%) | 40 (4.1%) |
| Total | 1,242 (100.0%) | 970 (100.0%) |
Families and Households in Masury
Median Family Size in Masury
The median family size in Masury is 3.05 persons per family, with married-couple families (431 | 79.7%) accounting for the largest median family size of 3.22 persons per family. On the other hand, single male/father families (40 | 7.4%) represent the smallest median family size with 2.15 persons per family.
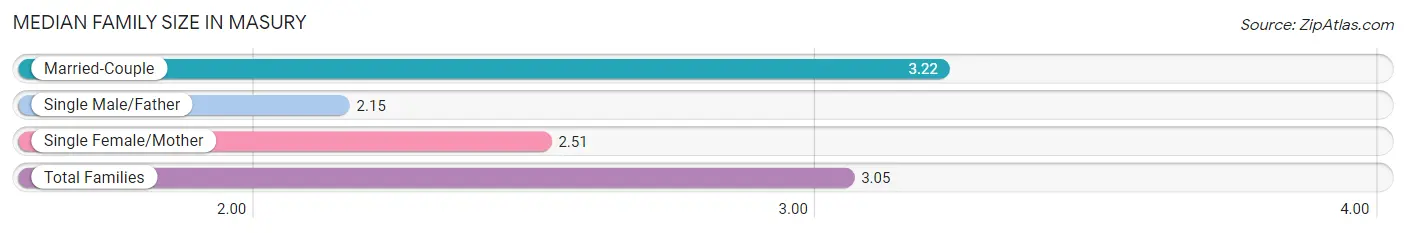
| Family Type | # Families | Family Size |
| Married-Couple | 431 (79.7%) | 3.22 |
| Single Male/Father | 40 (7.4%) | 2.15 |
| Single Female/Mother | 70 (12.9%) | 2.51 |
| Total Families | 541 (100.0%) | 3.05 |
Median Household Size in Masury
The median household size in Masury is 2.06 persons per household, with married-couple households (431 | 40.1%) accounting for the largest median household size of 3.22 persons per household. non-family households (533 | 49.6%) represent the smallest median household size with 1.03 persons per household.
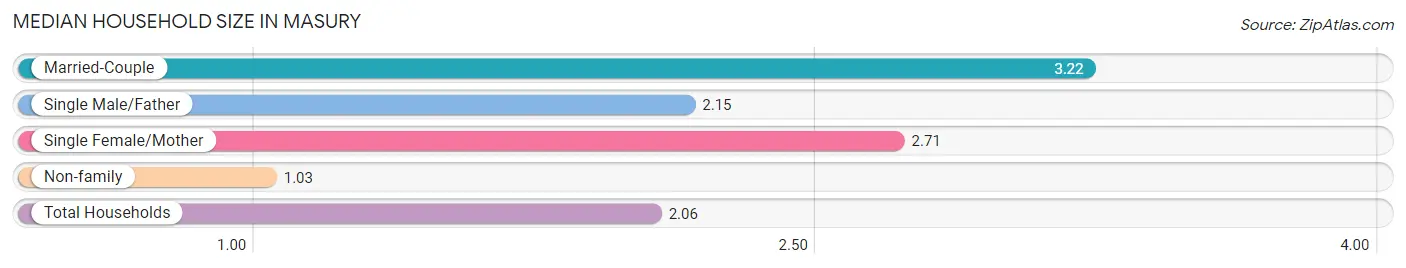
| Household Type | # Households | Household Size |
| Married-Couple | 431 (40.1%) | 3.22 |
| Single Male/Father | 40 (3.7%) | 2.15 |
| Single Female/Mother | 70 (6.5%) | 2.71 |
| Non-family | 533 (49.6%) | 1.03 |
| Total Households | 1,074 (100.0%) | 2.06 |
Household Size by Marriage Status in Masury
Out of a total of 1,074 households in Masury, 541 (50.4%) are family households, while 533 (49.6%) are nonfamily households. The most numerous type of family households are 2-person households, comprising 304, and the most common type of nonfamily households are 1-person households, comprising 521.
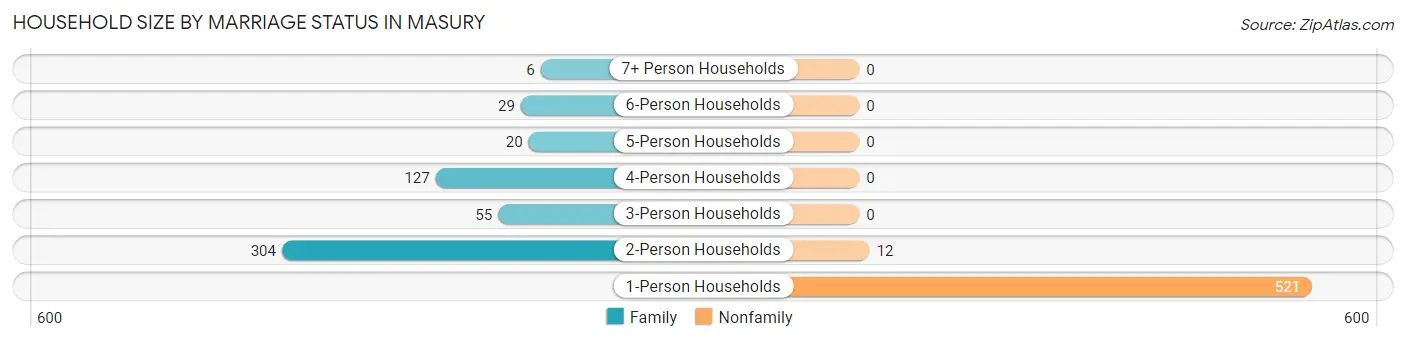
| Household Size | Family Households | Nonfamily Households |
| 1-Person Households | - | 521 (48.5%) |
| 2-Person Households | 304 (28.3%) | 12 (1.1%) |
| 3-Person Households | 55 (5.1%) | 0 (0.0%) |
| 4-Person Households | 127 (11.8%) | 0 (0.0%) |
| 5-Person Households | 20 (1.9%) | 0 (0.0%) |
| 6-Person Households | 29 (2.7%) | 0 (0.0%) |
| 7+ Person Households | 6 (0.6%) | 0 (0.0%) |
| Total | 541 (50.4%) | 533 (49.6%) |
Female Fertility in Masury
Fertility by Age in Masury
| Age Bracket | Women with Births | Births / 1,000 Women |
| 15 to 19 years | 0 (0.0%) | 0.0 |
| 20 to 34 years | 0 (0.0%) | 0.0 |
| 35 to 50 years | 0 (0.0%) | 0.0 |
| Total | 0 (0.0%) | 0.0 |
Fertility by Age by Marriage Status in Masury
| Age Bracket | Married | Unmarried |
| 15 to 19 years | 0 (0.0%) | 0 (0.0%) |
| 20 to 34 years | 0 (0.0%) | 0 (0.0%) |
| 35 to 50 years | 0 (0.0%) | 0 (0.0%) |
| Total | 0 (0.0%) | 0 (0.0%) |
Fertility by Education in Masury
| Educational Attainment | Women with Births | Births / 1,000 Women |
| Less than High School | 0 (0.0%) | 0.0 |
| High School Diploma | 0 (0.0%) | 0.0 |
| College or Associate's Degree | 0 (0.0%) | 0.0 |
| Bachelor's Degree | 0 (0.0%) | 0.0 |
| Graduate Degree | 0 (0.0%) | 0.0 |
| Total | 0 (0.0%) | 0.0 |
Fertility by Education by Marriage Status in Masury
| Educational Attainment | Married | Unmarried |
| Less than High School | 0 (0.0%) | 0 (0.0%) |
| High School Diploma | 0 (0.0%) | 0 (0.0%) |
| College or Associate's Degree | 0 (0.0%) | 0 (0.0%) |
| Bachelor's Degree | 0 (0.0%) | 0 (0.0%) |
| Graduate Degree | 0 (0.0%) | 0 (0.0%) |
| Total | 0 (0.0%) | 0 (0.0%) |
Employment Characteristics in Masury
Employment by Class of Employer in Masury
Among the 891 employed individuals in Masury, private company employees (558 | 62.6%), not-for-profit organizations (131 | 14.7%), and self-employed (not incorporated) (128 | 14.4%) make up the most common classes of employment.
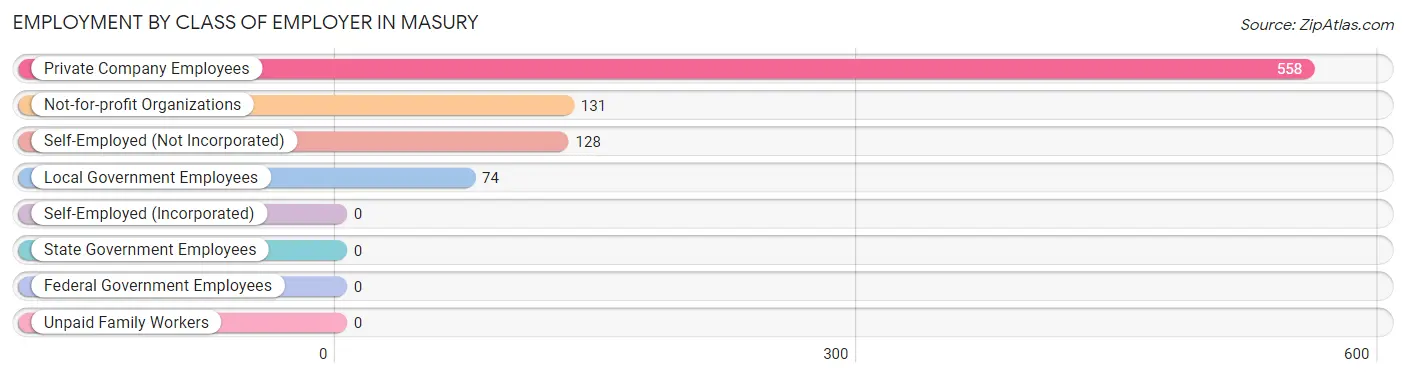
| Employer Class | # Employees | % Employees |
| Private Company Employees | 558 | 62.6% |
| Self-Employed (Incorporated) | 0 | 0.0% |
| Self-Employed (Not Incorporated) | 128 | 14.4% |
| Not-for-profit Organizations | 131 | 14.7% |
| Local Government Employees | 74 | 8.3% |
| State Government Employees | 0 | 0.0% |
| Federal Government Employees | 0 | 0.0% |
| Unpaid Family Workers | 0 | 0.0% |
| Total | 891 | 100.0% |
Employment Status by Age in Masury
According to the labor force statistics for Masury, out of the total population over 16 years of age (1,805), 53.6% or 967 individuals are in the labor force, with 7.1% or 69 of them unemployed. The age group with the highest labor force participation rate is 30 to 34 years, with 95.6% or 173 individuals in the labor force. Within the labor force, the 65 to 74 years age range has the highest percentage of unemployed individuals, with 58.3% or 21 of them being unemployed.
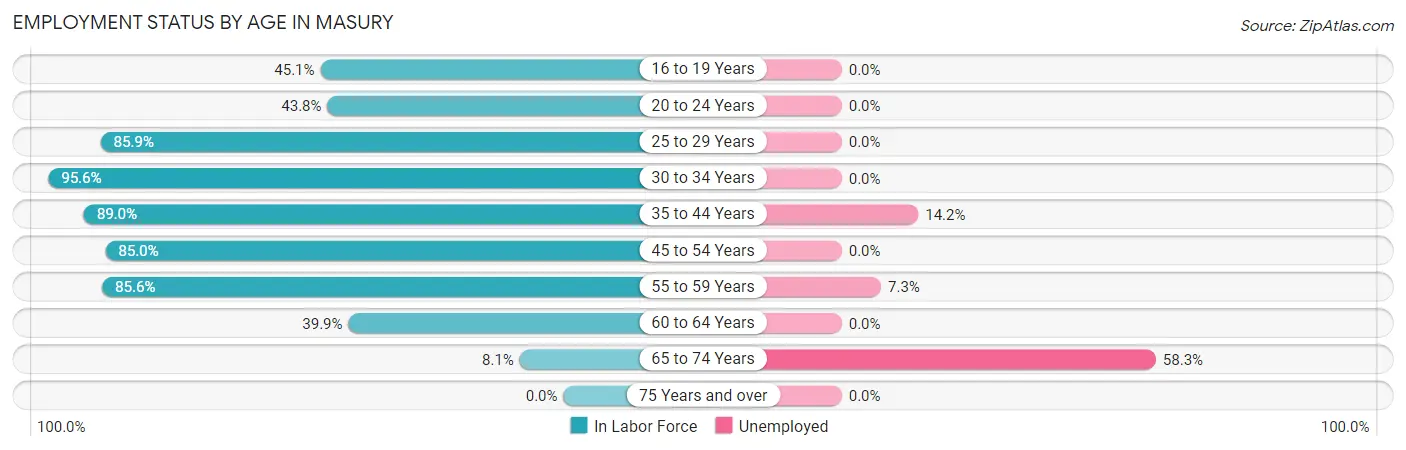
| Age Bracket | In Labor Force | Unemployed |
| 16 to 19 Years | 23 (45.1%) | 0 (0.0%) |
| 20 to 24 Years | 39 (43.8%) | 0 (0.0%) |
| 25 to 29 Years | 73 (85.9%) | 0 (0.0%) |
| 30 to 34 Years | 173 (95.6%) | 0 (0.0%) |
| 35 to 44 Years | 267 (89.0%) | 38 (14.2%) |
| 45 to 54 Years | 147 (85.0%) | 0 (0.0%) |
| 55 to 59 Years | 137 (85.6%) | 10 (7.3%) |
| 60 to 64 Years | 73 (39.9%) | 0 (0.0%) |
| 65 to 74 Years | 36 (8.1%) | 21 (58.3%) |
| 75 Years and over | 0 (0.0%) | 0 (0.0%) |
| Total | 967 (53.6%) | 69 (7.1%) |
Employment Status by Educational Attainment in Masury
According to labor force statistics for Masury, 80.4% of individuals (870) out of the total population between 25 and 64 years of age (1,082) are in the labor force, with 5.5% or 48 of them being unemployed. The group with the highest labor force participation rate are those with the educational attainment of high school diploma, with 85.5% or 590 individuals in the labor force. Within the labor force, individuals with less than high school education have the highest percentage of unemployment, with 34.5% or 10 of them being unemployed.
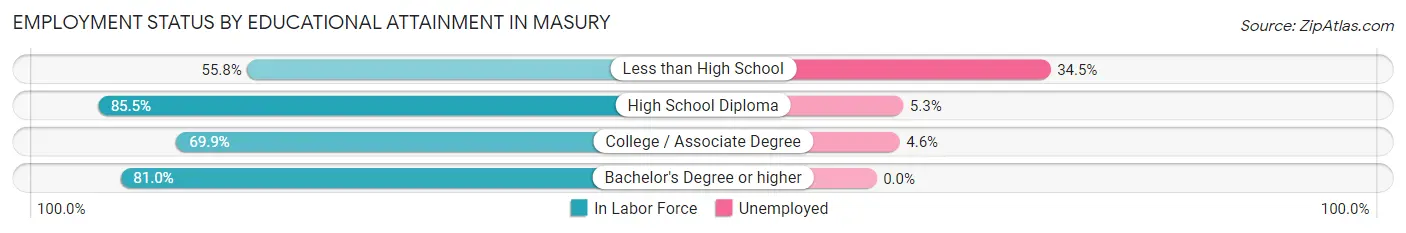
| Educational Attainment | In Labor Force | Unemployed |
| Less than High School | 29 (55.8%) | 18 (34.5%) |
| High School Diploma | 590 (85.5%) | 37 (5.3%) |
| College / Associate Degree | 153 (69.9%) | 10 (4.6%) |
| Bachelor's Degree or higher | 98 (81.0%) | 0 (0.0%) |
| Total | 870 (80.4%) | 60 (5.5%) |
Employment Occupations by Sex in Masury
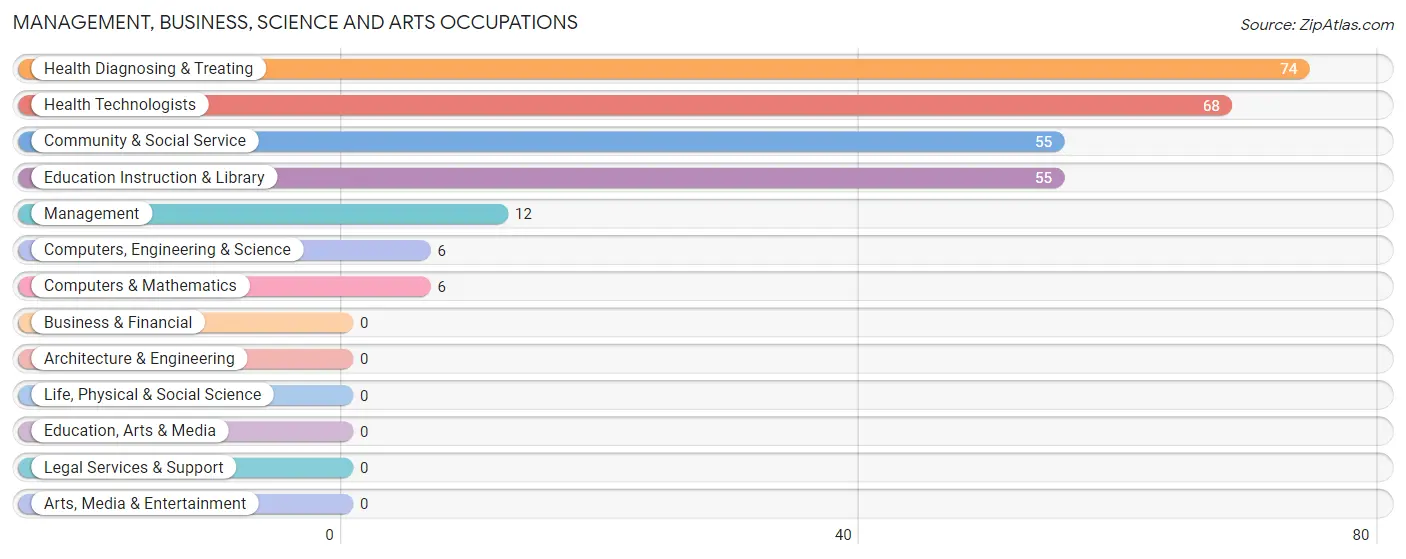
Management, Business, Science and Arts Occupations
The most common Management, Business, Science and Arts occupations in Masury are Health Diagnosing & Treating (74 | 8.2%), Health Technologists (68 | 7.6%), Community & Social Service (55 | 6.1%), Education Instruction & Library (55 | 6.1%), and Management (12 | 1.3%).
Management, Business, Science and Arts Occupations by Sex
Within the Management, Business, Science and Arts occupations in Masury, the most male-oriented occupations are Management (100.0%), Community & Social Service (63.6%), and Education Instruction & Library (63.6%), while the most female-oriented occupations are Computers, Engineering & Science (100.0%), Computers & Mathematics (100.0%), and Health Diagnosing & Treating (100.0%).
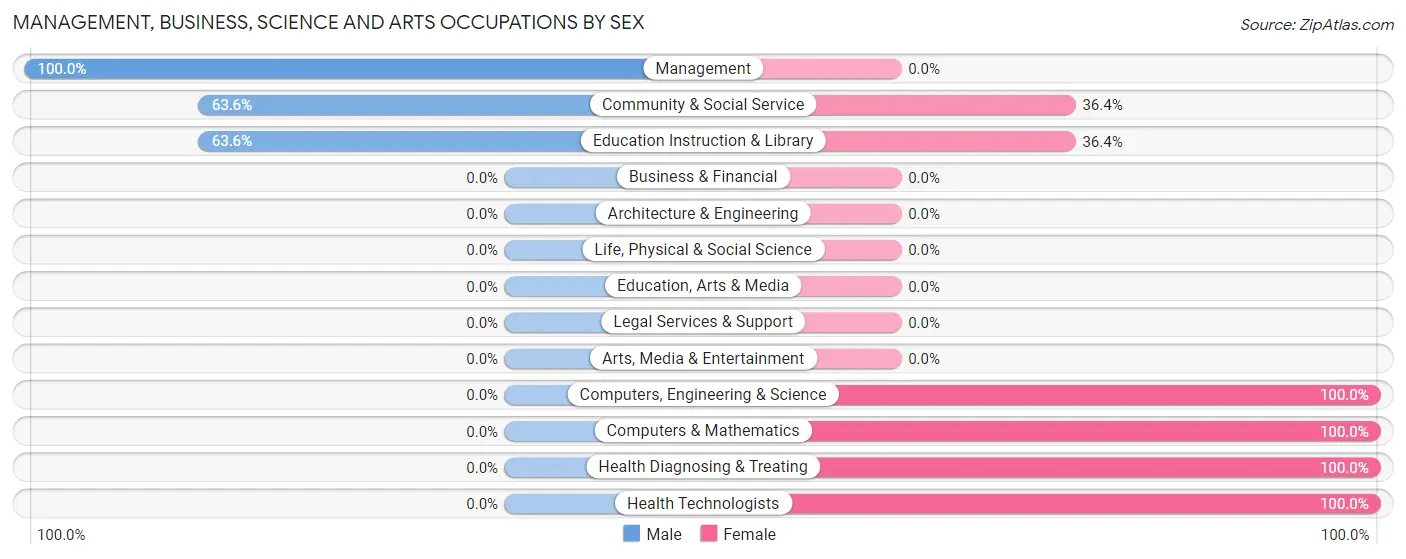
| Occupation | Male | Female |
| Management | 12 (100.0%) | 0 (0.0%) |
| Business & Financial | 0 (0.0%) | 0 (0.0%) |
| Computers, Engineering & Science | 0 (0.0%) | 6 (100.0%) |
| Computers & Mathematics | 0 (0.0%) | 6 (100.0%) |
| Architecture & Engineering | 0 (0.0%) | 0 (0.0%) |
| Life, Physical & Social Science | 0 (0.0%) | 0 (0.0%) |
| Community & Social Service | 35 (63.6%) | 20 (36.4%) |
| Education, Arts & Media | 0 (0.0%) | 0 (0.0%) |
| Legal Services & Support | 0 (0.0%) | 0 (0.0%) |
| Education Instruction & Library | 35 (63.6%) | 20 (36.4%) |
| Arts, Media & Entertainment | 0 (0.0%) | 0 (0.0%) |
| Health Diagnosing & Treating | 0 (0.0%) | 74 (100.0%) |
| Health Technologists | 0 (0.0%) | 68 (100.0%) |
| Total (Category) | 47 (32.0%) | 100 (68.0%) |
| Total (Overall) | 518 (57.6%) | 381 (42.4%) |
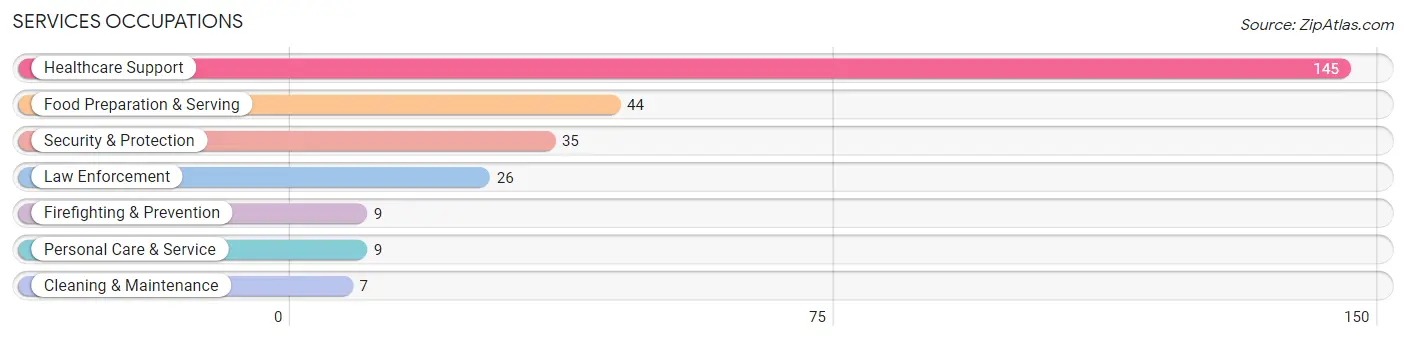
Services Occupations
The most common Services occupations in Masury are Healthcare Support (145 | 16.1%), Food Preparation & Serving (44 | 4.9%), Security & Protection (35 | 3.9%), Law Enforcement (26 | 2.9%), and Firefighting & Prevention (9 | 1.0%).
Services Occupations by Sex
Within the Services occupations in Masury, the most male-oriented occupations are Firefighting & Prevention (100.0%), Healthcare Support (59.3%), and Food Preparation & Serving (50.0%), while the most female-oriented occupations are Law Enforcement (100.0%), Cleaning & Maintenance (100.0%), and Personal Care & Service (100.0%).
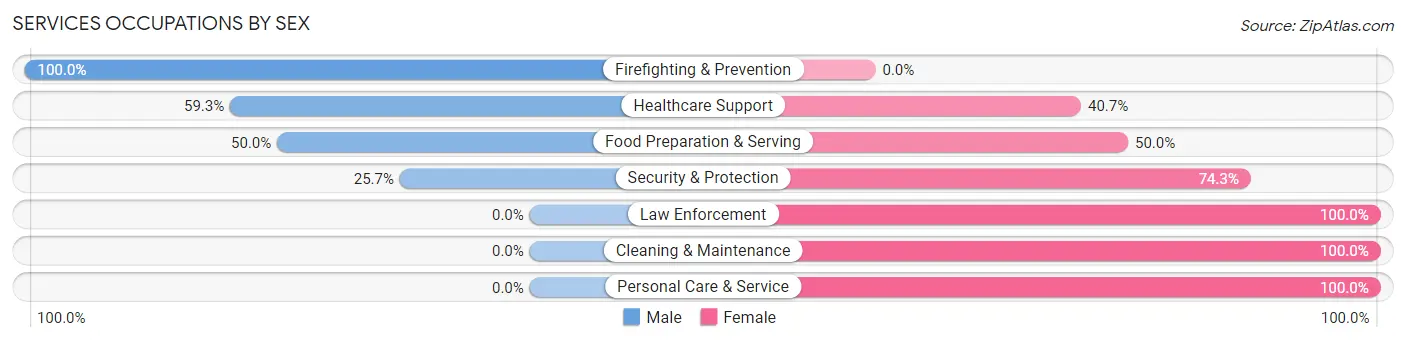
| Occupation | Male | Female |
| Healthcare Support | 86 (59.3%) | 59 (40.7%) |
| Security & Protection | 9 (25.7%) | 26 (74.3%) |
| Firefighting & Prevention | 9 (100.0%) | 0 (0.0%) |
| Law Enforcement | 0 (0.0%) | 26 (100.0%) |
| Food Preparation & Serving | 22 (50.0%) | 22 (50.0%) |
| Cleaning & Maintenance | 0 (0.0%) | 7 (100.0%) |
| Personal Care & Service | 0 (0.0%) | 9 (100.0%) |
| Total (Category) | 117 (48.7%) | 123 (51.2%) |
| Total (Overall) | 518 (57.6%) | 381 (42.4%) |
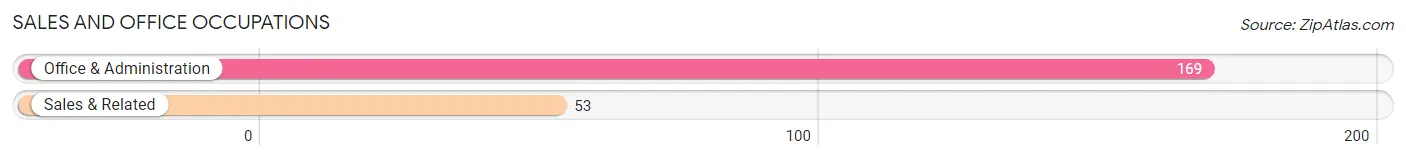
Sales and Office Occupations
The most common Sales and Office occupations in Masury are Office & Administration (169 | 18.8%), and Sales & Related (53 | 5.9%).
Sales and Office Occupations by Sex
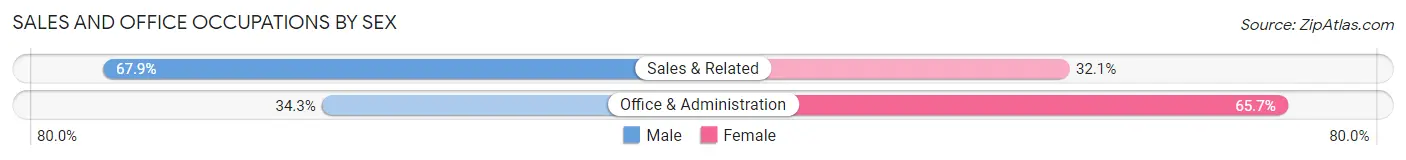
| Occupation | Male | Female |
| Sales & Related | 36 (67.9%) | 17 (32.1%) |
| Office & Administration | 58 (34.3%) | 111 (65.7%) |
| Total (Category) | 94 (42.3%) | 128 (57.7%) |
| Total (Overall) | 518 (57.6%) | 381 (42.4%) |
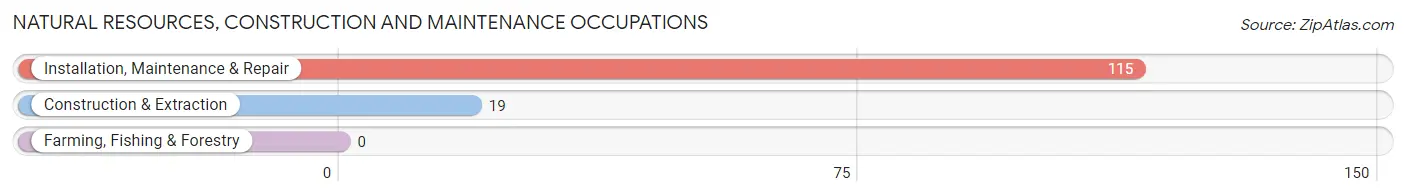
Natural Resources, Construction and Maintenance Occupations
The most common Natural Resources, Construction and Maintenance occupations in Masury are Installation, Maintenance & Repair (115 | 12.8%), and Construction & Extraction (19 | 2.1%).
Natural Resources, Construction and Maintenance Occupations by Sex
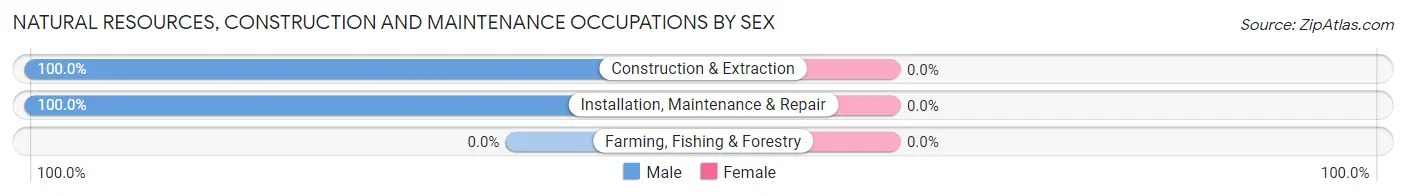
| Occupation | Male | Female |
| Farming, Fishing & Forestry | 0 (0.0%) | 0 (0.0%) |
| Construction & Extraction | 19 (100.0%) | 0 (0.0%) |
| Installation, Maintenance & Repair | 115 (100.0%) | 0 (0.0%) |
| Total (Category) | 134 (100.0%) | 0 (0.0%) |
| Total (Overall) | 518 (57.6%) | 381 (42.4%) |
Production, Transportation and Moving Occupations
The most common Production, Transportation and Moving occupations in Masury are Production (103 | 11.5%), Transportation (32 | 3.6%), and Material Moving (21 | 2.3%).
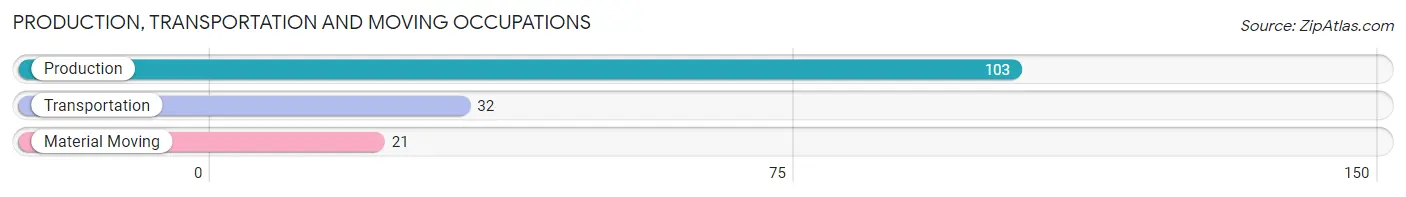
Production, Transportation and Moving Occupations by Sex
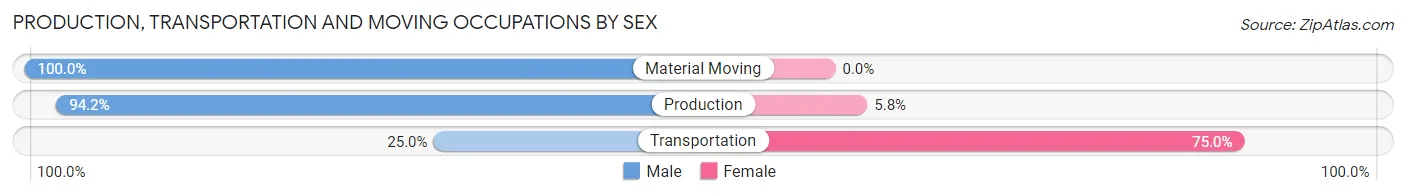
| Occupation | Male | Female |
| Production | 97 (94.2%) | 6 (5.8%) |
| Transportation | 8 (25.0%) | 24 (75.0%) |
| Material Moving | 21 (100.0%) | 0 (0.0%) |
| Total (Category) | 126 (80.8%) | 30 (19.2%) |
| Total (Overall) | 518 (57.6%) | 381 (42.4%) |
Employment Industries by Sex in Masury
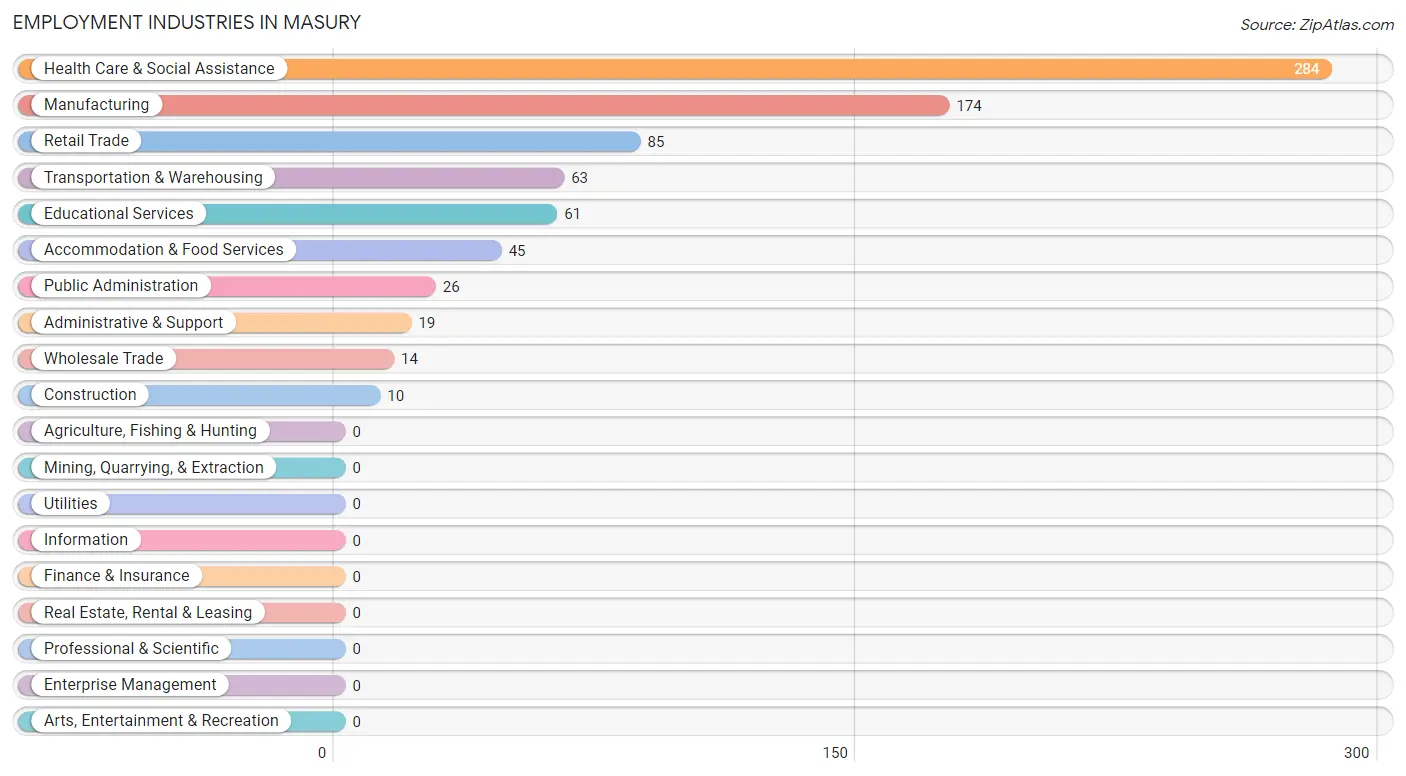
Employment Industries in Masury
The major employment industries in Masury include Health Care & Social Assistance (284 | 31.6%), Manufacturing (174 | 19.4%), Retail Trade (85 | 9.5%), Transportation & Warehousing (63 | 7.0%), and Educational Services (61 | 6.8%).
Employment Industries by Sex in Masury
The Masury industries that see more men than women are Construction (100.0%), Manufacturing (96.6%), and Retail Trade (80.0%), whereas the industries that tend to have a higher number of women are Public Administration (100.0%), Health Care & Social Assistance (69.7%), and Administrative & Support (52.6%).
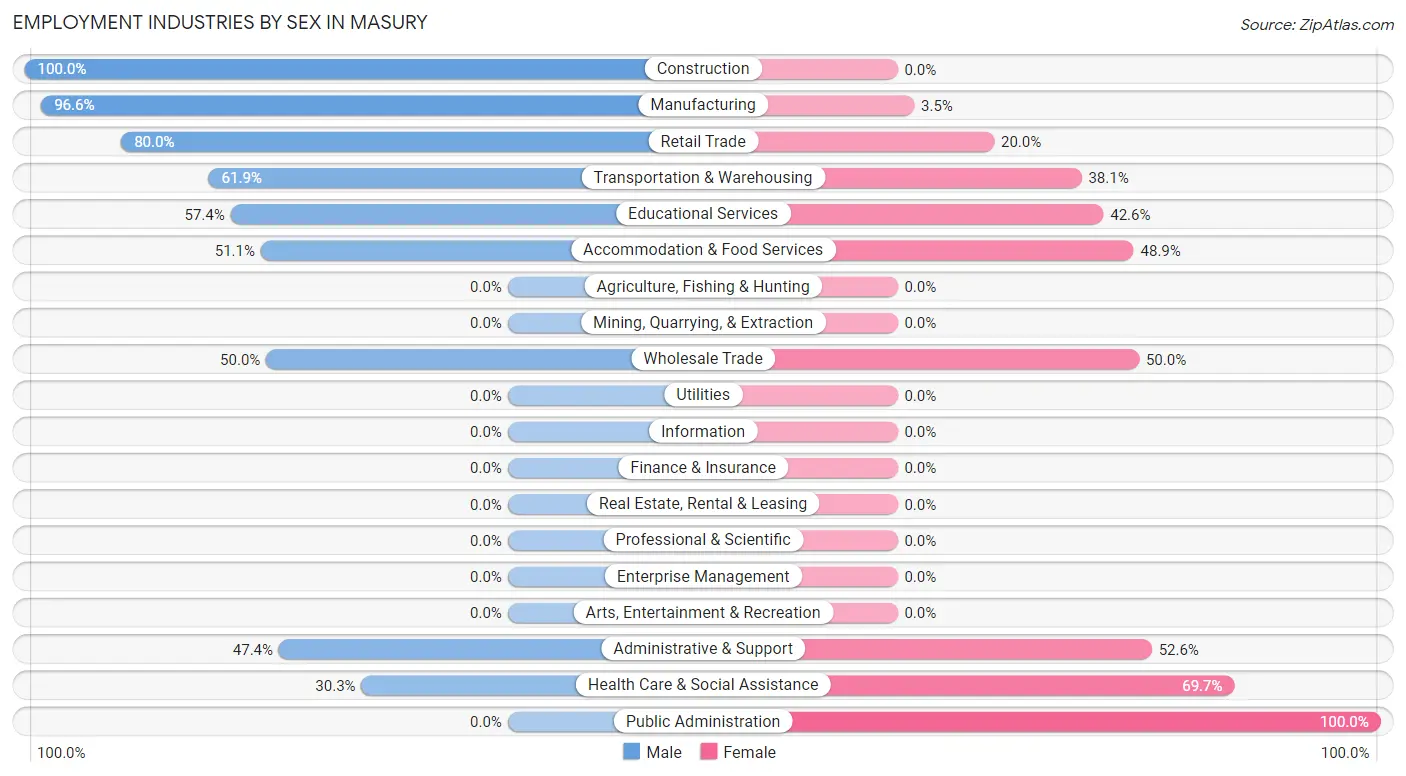
| Industry | Male | Female |
| Agriculture, Fishing & Hunting | 0 (0.0%) | 0 (0.0%) |
| Mining, Quarrying, & Extraction | 0 (0.0%) | 0 (0.0%) |
| Construction | 10 (100.0%) | 0 (0.0%) |
| Manufacturing | 168 (96.6%) | 6 (3.5%) |
| Wholesale Trade | 7 (50.0%) | 7 (50.0%) |
| Retail Trade | 68 (80.0%) | 17 (20.0%) |
| Transportation & Warehousing | 39 (61.9%) | 24 (38.1%) |
| Utilities | 0 (0.0%) | 0 (0.0%) |
| Information | 0 (0.0%) | 0 (0.0%) |
| Finance & Insurance | 0 (0.0%) | 0 (0.0%) |
| Real Estate, Rental & Leasing | 0 (0.0%) | 0 (0.0%) |
| Professional & Scientific | 0 (0.0%) | 0 (0.0%) |
| Enterprise Management | 0 (0.0%) | 0 (0.0%) |
| Administrative & Support | 9 (47.4%) | 10 (52.6%) |
| Educational Services | 35 (57.4%) | 26 (42.6%) |
| Health Care & Social Assistance | 86 (30.3%) | 198 (69.7%) |
| Arts, Entertainment & Recreation | 0 (0.0%) | 0 (0.0%) |
| Accommodation & Food Services | 23 (51.1%) | 22 (48.9%) |
| Public Administration | 0 (0.0%) | 26 (100.0%) |
| Total | 518 (57.6%) | 381 (42.4%) |
Education in Masury
School Enrollment in Masury
The most common levels of schooling among the 371 students in Masury are elementary school (115 | 31.0%), high school (101 | 27.2%), and middle school (69 | 18.6%).

| School Level | # Students | % Students |
| Nursery / Preschool | 25 | 6.7% |
| Kindergarten | 0 | 0.0% |
| Elementary School | 115 | 31.0% |
| Middle School | 69 | 18.6% |
| High School | 101 | 27.2% |
| College / Undergraduate | 61 | 16.4% |
| Graduate / Professional | 0 | 0.0% |
| Total | 371 | 100.0% |
School Enrollment by Age by Funding Source in Masury
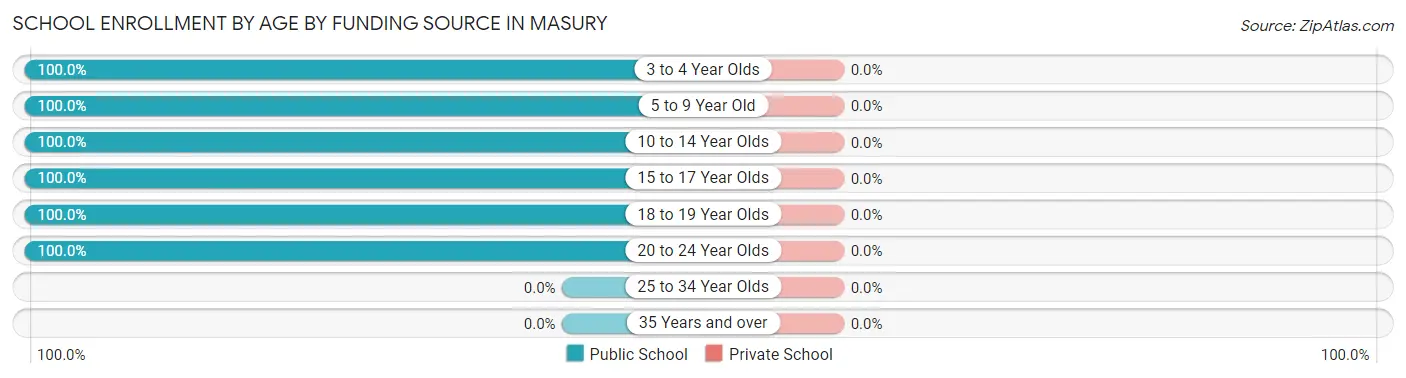
| Age Bracket | Public School | Private School |
| 3 to 4 Year Olds | 25 (100.0%) | 0 (0.0%) |
| 5 to 9 Year Old | 115 (100.0%) | 0 (0.0%) |
| 10 to 14 Year Olds | 109 (100.0%) | 0 (0.0%) |
| 15 to 17 Year Olds | 38 (100.0%) | 0 (0.0%) |
| 18 to 19 Year Olds | 23 (100.0%) | 0 (0.0%) |
| 20 to 24 Year Olds | 61 (100.0%) | 0 (0.0%) |
| 25 to 34 Year Olds | 0 (0.0%) | 0 (0.0%) |
| 35 Years and over | 0 (0.0%) | 0 (0.0%) |
| Total | 371 (100.0%) | 0 (0.0%) |
Educational Attainment by Field of Study in Masury
Arts & humanities (59 | 31.0%), education (49 | 25.8%), science & technology (43 | 22.6%), business (31 | 16.3%), and literature & languages (8 | 4.2%) are the most common fields of study among 190 individuals in Masury who have obtained a bachelor's degree or higher.
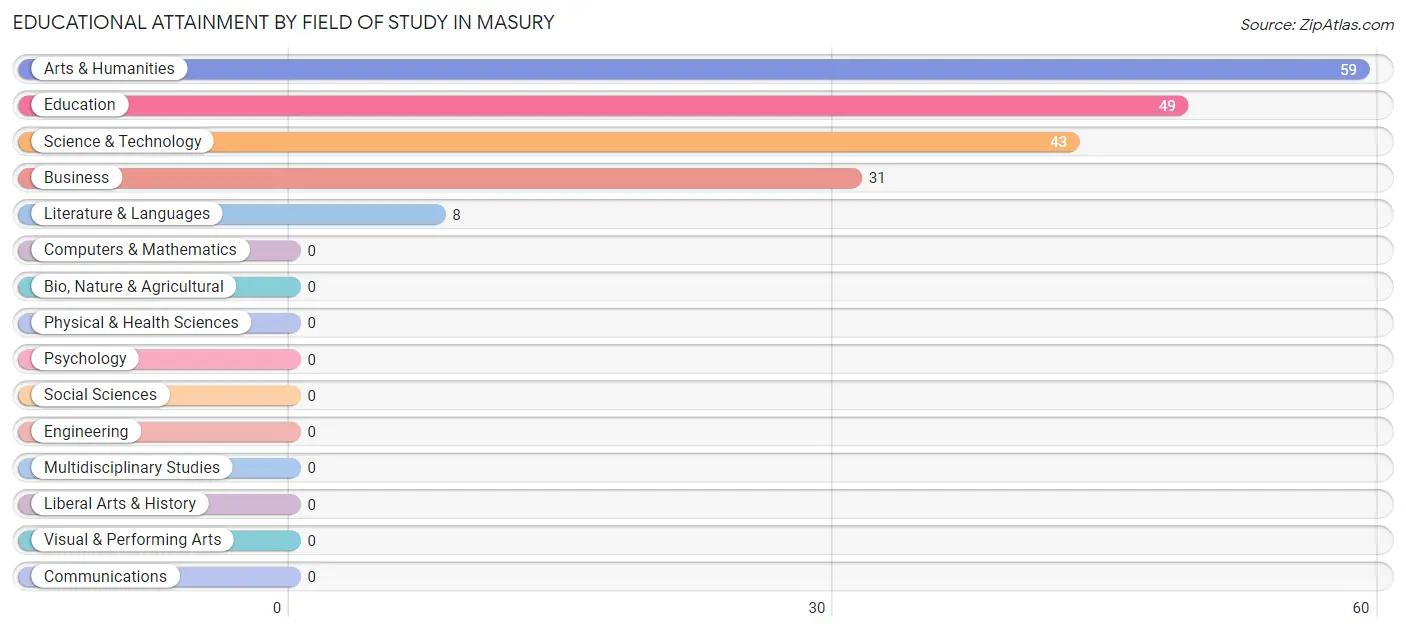
| Field of Study | # Graduates | % Graduates |
| Computers & Mathematics | 0 | 0.0% |
| Bio, Nature & Agricultural | 0 | 0.0% |
| Physical & Health Sciences | 0 | 0.0% |
| Psychology | 0 | 0.0% |
| Social Sciences | 0 | 0.0% |
| Engineering | 0 | 0.0% |
| Multidisciplinary Studies | 0 | 0.0% |
| Science & Technology | 43 | 22.6% |
| Business | 31 | 16.3% |
| Education | 49 | 25.8% |
| Literature & Languages | 8 | 4.2% |
| Liberal Arts & History | 0 | 0.0% |
| Visual & Performing Arts | 0 | 0.0% |
| Communications | 0 | 0.0% |
| Arts & Humanities | 59 | 31.0% |
| Total | 190 | 100.0% |
Transportation & Commute in Masury
Vehicle Availability by Sex in Masury
The most prevalent vehicle ownership categories in Masury are males with 2 vehicles (239, accounting for 46.2%) and females with 2 vehicles (195, making up 64.1%).
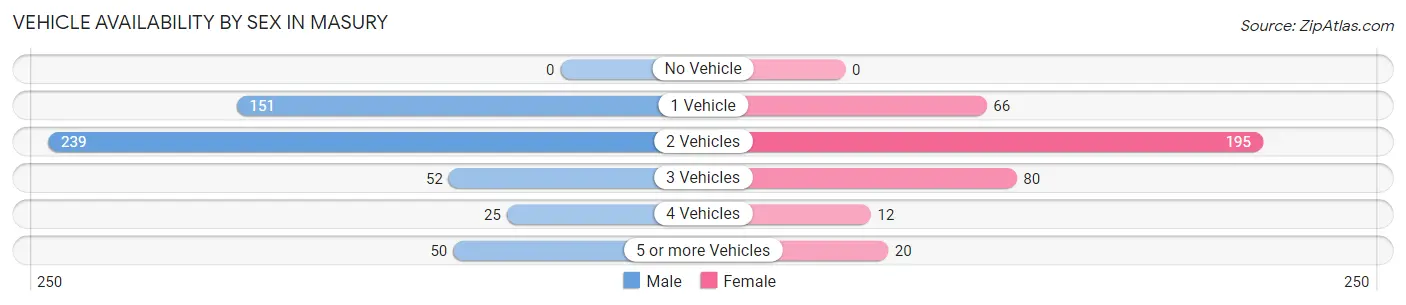
| Vehicles Available | Male | Female |
| No Vehicle | 0 (0.0%) | 0 (0.0%) |
| 1 Vehicle | 151 (29.2%) | 66 (17.7%) |
| 2 Vehicles | 239 (46.2%) | 195 (52.3%) |
| 3 Vehicles | 52 (10.1%) | 80 (21.4%) |
| 4 Vehicles | 25 (4.8%) | 12 (3.2%) |
| 5 or more Vehicles | 50 (9.7%) | 20 (5.4%) |
| Total | 517 (100.0%) | 373 (100.0%) |
Commute Time in Masury
The most frequently occuring commute durations in Masury are 10 to 14 minutes (205 commuters, 28.3%), 15 to 19 minutes (128 commuters, 17.7%), and 30 to 34 minutes (119 commuters, 16.4%).
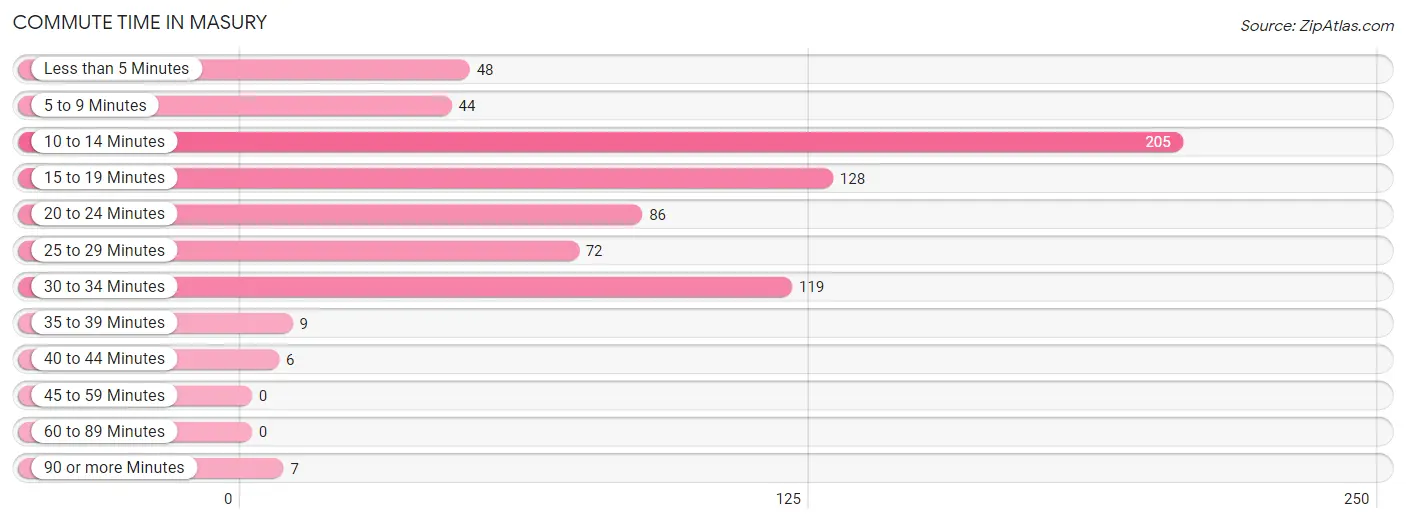
| Commute Time | # Commuters | % Commuters |
| Less than 5 Minutes | 48 | 6.6% |
| 5 to 9 Minutes | 44 | 6.1% |
| 10 to 14 Minutes | 205 | 28.3% |
| 15 to 19 Minutes | 128 | 17.7% |
| 20 to 24 Minutes | 86 | 11.9% |
| 25 to 29 Minutes | 72 | 9.9% |
| 30 to 34 Minutes | 119 | 16.4% |
| 35 to 39 Minutes | 9 | 1.2% |
| 40 to 44 Minutes | 6 | 0.8% |
| 45 to 59 Minutes | 0 | 0.0% |
| 60 to 89 Minutes | 0 | 0.0% |
| 90 or more Minutes | 7 | 1.0% |
Commute Time by Sex in Masury
The most common commute times in Masury are 10 to 14 minutes (149 commuters, 37.6%) for males and 20 to 24 minutes (86 commuters, 26.2%) for females.
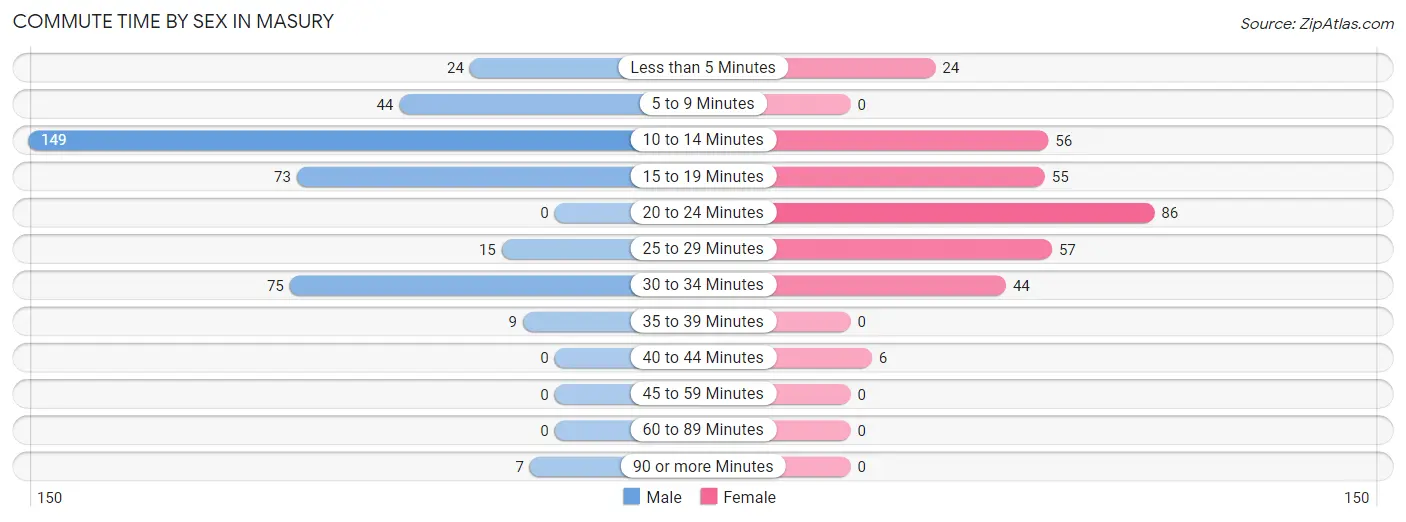
| Commute Time | Male | Female |
| Less than 5 Minutes | 24 (6.1%) | 24 (7.3%) |
| 5 to 9 Minutes | 44 (11.1%) | 0 (0.0%) |
| 10 to 14 Minutes | 149 (37.6%) | 56 (17.1%) |
| 15 to 19 Minutes | 73 (18.4%) | 55 (16.8%) |
| 20 to 24 Minutes | 0 (0.0%) | 86 (26.2%) |
| 25 to 29 Minutes | 15 (3.8%) | 57 (17.4%) |
| 30 to 34 Minutes | 75 (18.9%) | 44 (13.4%) |
| 35 to 39 Minutes | 9 (2.3%) | 0 (0.0%) |
| 40 to 44 Minutes | 0 (0.0%) | 6 (1.8%) |
| 45 to 59 Minutes | 0 (0.0%) | 0 (0.0%) |
| 60 to 89 Minutes | 0 (0.0%) | 0 (0.0%) |
| 90 or more Minutes | 7 (1.8%) | 0 (0.0%) |
Time of Departure to Work by Sex in Masury
The most frequent times of departure to work in Masury are 4:00 PM to 11:59 PM (115, 29.0%) for males and 6:30 AM to 6:59 AM (70, 21.3%) for females.
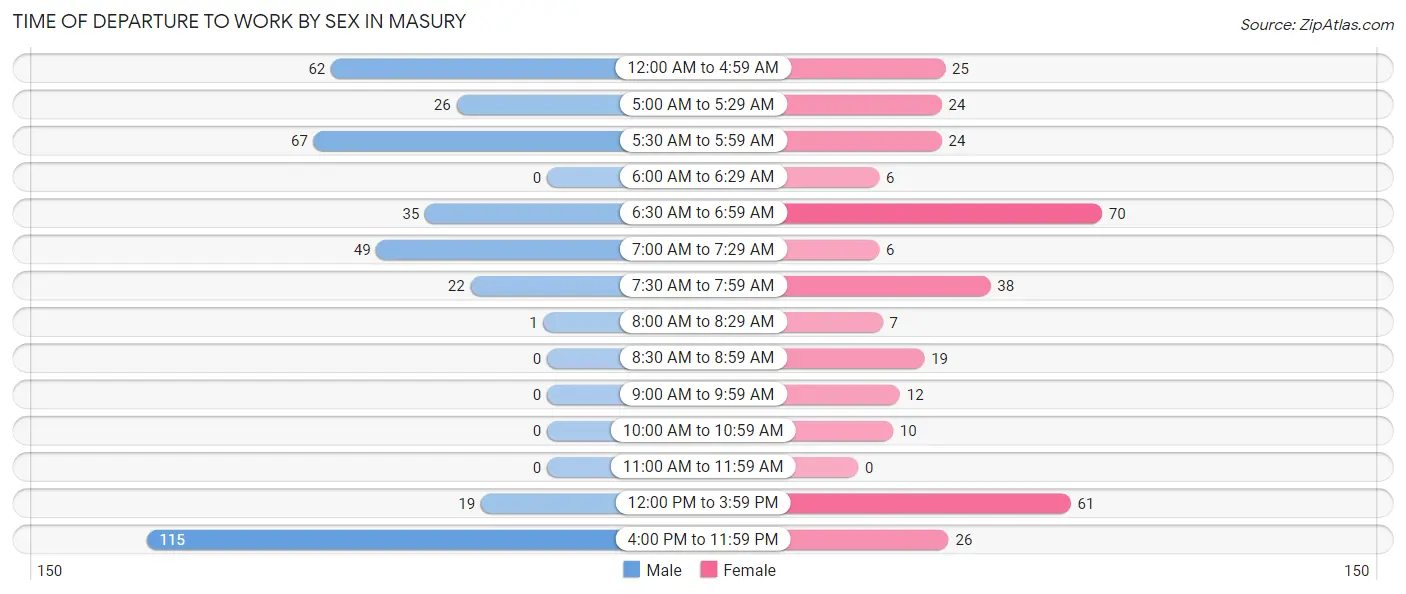
| Time of Departure | Male | Female |
| 12:00 AM to 4:59 AM | 62 (15.7%) | 25 (7.6%) |
| 5:00 AM to 5:29 AM | 26 (6.6%) | 24 (7.3%) |
| 5:30 AM to 5:59 AM | 67 (16.9%) | 24 (7.3%) |
| 6:00 AM to 6:29 AM | 0 (0.0%) | 6 (1.8%) |
| 6:30 AM to 6:59 AM | 35 (8.8%) | 70 (21.3%) |
| 7:00 AM to 7:29 AM | 49 (12.4%) | 6 (1.8%) |
| 7:30 AM to 7:59 AM | 22 (5.6%) | 38 (11.6%) |
| 8:00 AM to 8:29 AM | 1 (0.3%) | 7 (2.1%) |
| 8:30 AM to 8:59 AM | 0 (0.0%) | 19 (5.8%) |
| 9:00 AM to 9:59 AM | 0 (0.0%) | 12 (3.7%) |
| 10:00 AM to 10:59 AM | 0 (0.0%) | 10 (3.0%) |
| 11:00 AM to 11:59 AM | 0 (0.0%) | 0 (0.0%) |
| 12:00 PM to 3:59 PM | 19 (4.8%) | 61 (18.6%) |
| 4:00 PM to 11:59 PM | 115 (29.0%) | 26 (7.9%) |
| Total | 396 (100.0%) | 328 (100.0%) |
Housing Occupancy in Masury
Occupancy by Ownership in Masury
Of the total 1,074 dwellings in Masury, owner-occupied units account for 783 (72.9%), while renter-occupied units make up 291 (27.1%).
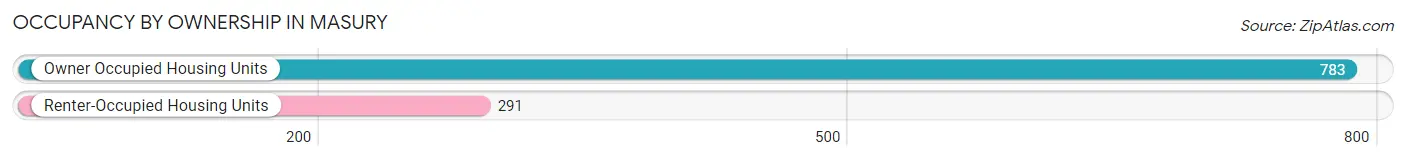
| Occupancy | # Housing Units | % Housing Units |
| Owner Occupied Housing Units | 783 | 72.9% |
| Renter-Occupied Housing Units | 291 | 27.1% |
| Total Occupied Housing Units | 1,074 | 100.0% |
Occupancy by Household Size in Masury
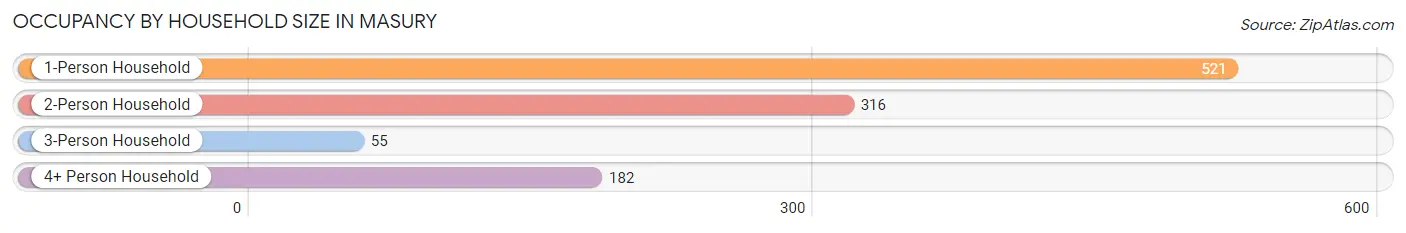
| Household Size | # Housing Units | % Housing Units |
| 1-Person Household | 521 | 48.5% |
| 2-Person Household | 316 | 29.4% |
| 3-Person Household | 55 | 5.1% |
| 4+ Person Household | 182 | 17.0% |
| Total Housing Units | 1,074 | 100.0% |
Occupancy by Ownership by Household Size in Masury
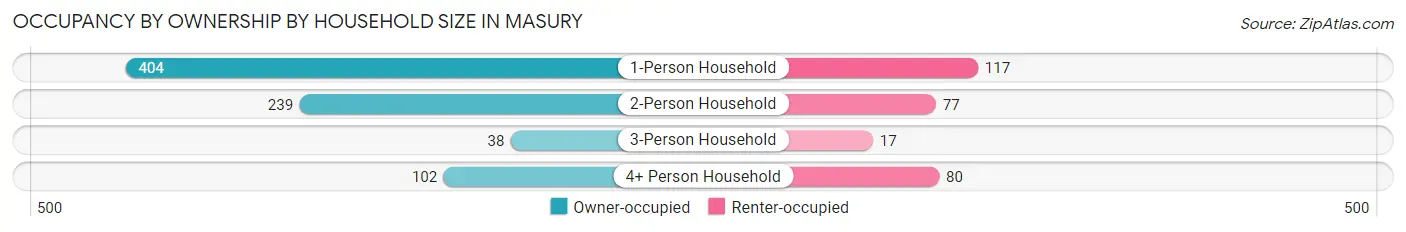
| Household Size | Owner-occupied | Renter-occupied |
| 1-Person Household | 404 (77.5%) | 117 (22.5%) |
| 2-Person Household | 239 (75.6%) | 77 (24.4%) |
| 3-Person Household | 38 (69.1%) | 17 (30.9%) |
| 4+ Person Household | 102 (56.0%) | 80 (44.0%) |
| Total Housing Units | 783 (72.9%) | 291 (27.1%) |
Occupancy by Educational Attainment in Masury
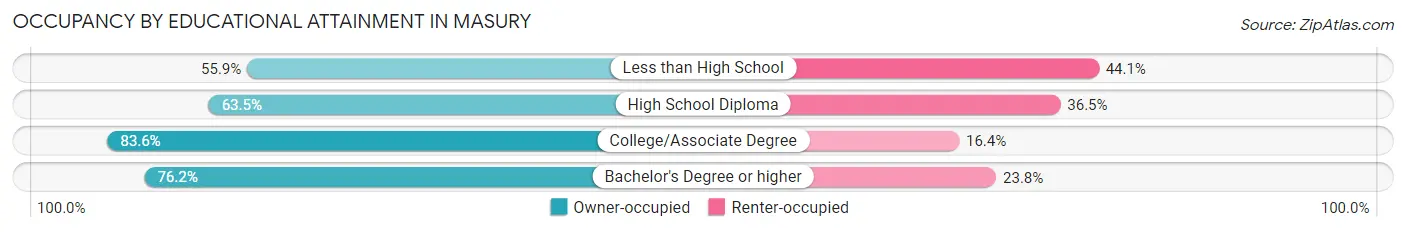
| Household Size | Owner-occupied | Renter-occupied |
| Less than High School | 19 (55.9%) | 15 (44.1%) |
| High School Diploma | 299 (63.5%) | 172 (36.5%) |
| College/Associate Degree | 356 (83.6%) | 70 (16.4%) |
| Bachelor's Degree or higher | 109 (76.2%) | 34 (23.8%) |
Occupancy by Age of Householder in Masury
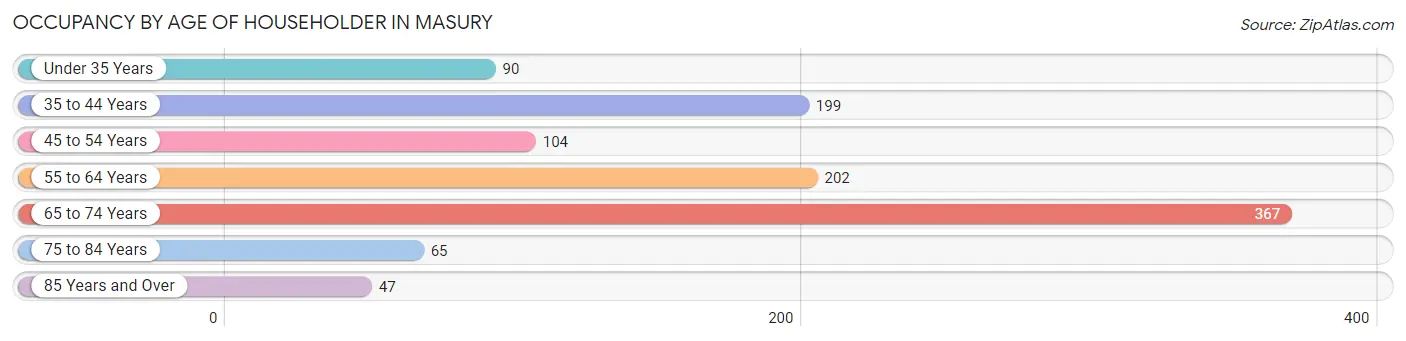
| Age Bracket | # Households | % Households |
| Under 35 Years | 90 | 8.4% |
| 35 to 44 Years | 199 | 18.5% |
| 45 to 54 Years | 104 | 9.7% |
| 55 to 64 Years | 202 | 18.8% |
| 65 to 74 Years | 367 | 34.2% |
| 75 to 84 Years | 65 | 6.0% |
| 85 Years and Over | 47 | 4.4% |
| Total | 1,074 | 100.0% |
Housing Finances in Masury
Median Income by Occupancy in Masury
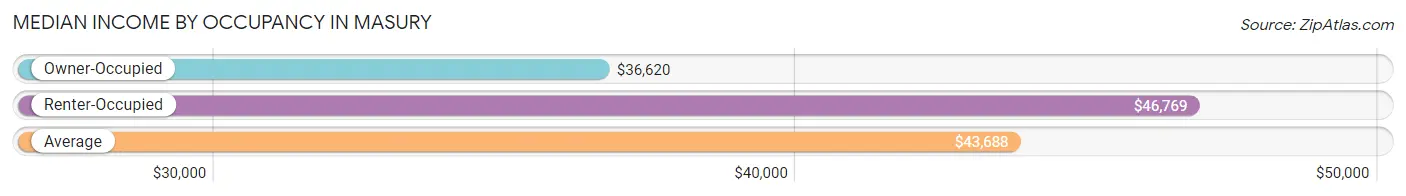
| Occupancy Type | # Households | Median Income |
| Owner-Occupied | 783 (72.9%) | $36,620 |
| Renter-Occupied | 291 (27.1%) | $46,769 |
| Average | 1,074 (100.0%) | $43,688 |
Occupancy by Householder Income Bracket in Masury
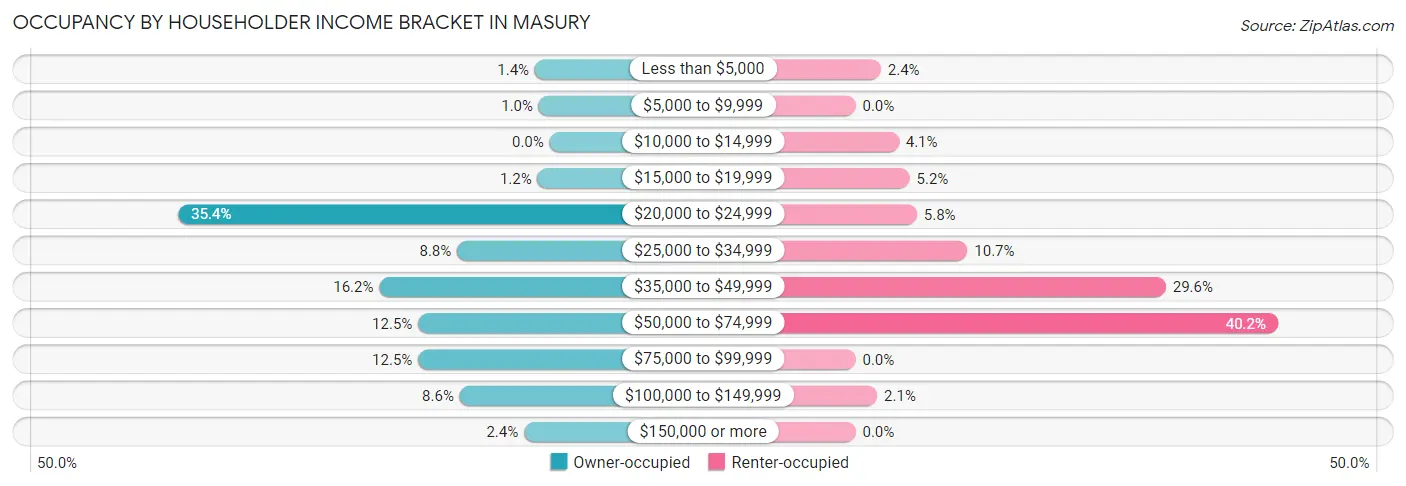
| Income Bracket | Owner-occupied | Renter-occupied |
| Less than $5,000 | 11 (1.4%) | 7 (2.4%) |
| $5,000 to $9,999 | 8 (1.0%) | 0 (0.0%) |
| $10,000 to $14,999 | 0 (0.0%) | 12 (4.1%) |
| $15,000 to $19,999 | 9 (1.1%) | 15 (5.1%) |
| $20,000 to $24,999 | 277 (35.4%) | 17 (5.8%) |
| $25,000 to $34,999 | 69 (8.8%) | 31 (10.6%) |
| $35,000 to $49,999 | 127 (16.2%) | 86 (29.5%) |
| $50,000 to $74,999 | 98 (12.5%) | 117 (40.2%) |
| $75,000 to $99,999 | 98 (12.5%) | 0 (0.0%) |
| $100,000 to $149,999 | 67 (8.6%) | 6 (2.1%) |
| $150,000 or more | 19 (2.4%) | 0 (0.0%) |
| Total | 783 (100.0%) | 291 (100.0%) |
Monthly Housing Cost Tiers in Masury
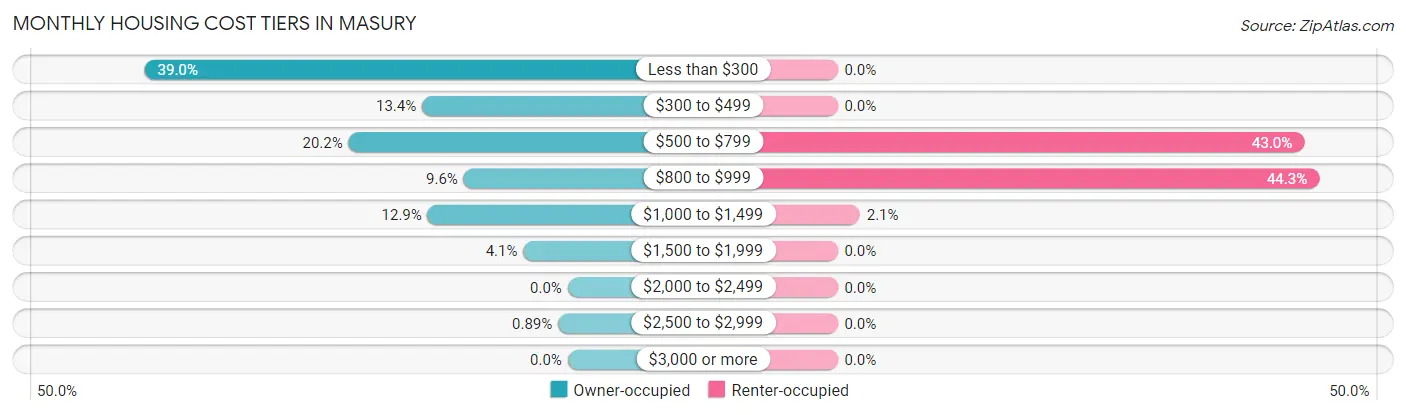
| Monthly Cost | Owner-occupied | Renter-occupied |
| Less than $300 | 305 (39.0%) | 0 (0.0%) |
| $300 to $499 | 105 (13.4%) | 0 (0.0%) |
| $500 to $799 | 158 (20.2%) | 125 (43.0%) |
| $800 to $999 | 75 (9.6%) | 129 (44.3%) |
| $1,000 to $1,499 | 101 (12.9%) | 6 (2.1%) |
| $1,500 to $1,999 | 32 (4.1%) | 0 (0.0%) |
| $2,000 to $2,499 | 0 (0.0%) | 0 (0.0%) |
| $2,500 to $2,999 | 7 (0.9%) | 0 (0.0%) |
| $3,000 or more | 0 (0.0%) | 0 (0.0%) |
| Total | 783 (100.0%) | 291 (100.0%) |
Physical Housing Characteristics in Masury
Housing Structures in Masury
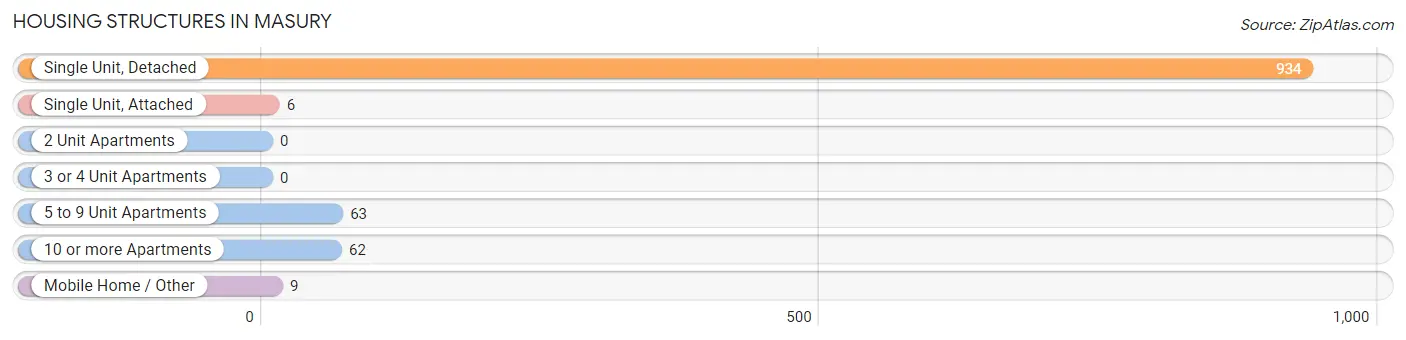
| Structure Type | # Housing Units | % Housing Units |
| Single Unit, Detached | 934 | 87.0% |
| Single Unit, Attached | 6 | 0.6% |
| 2 Unit Apartments | 0 | 0.0% |
| 3 or 4 Unit Apartments | 0 | 0.0% |
| 5 to 9 Unit Apartments | 63 | 5.9% |
| 10 or more Apartments | 62 | 5.8% |
| Mobile Home / Other | 9 | 0.8% |
| Total | 1,074 | 100.0% |
Housing Structures by Occupancy in Masury

| Structure Type | Owner-occupied | Renter-occupied |
| Single Unit, Detached | 768 (82.2%) | 166 (17.8%) |
| Single Unit, Attached | 6 (100.0%) | 0 (0.0%) |
| 2 Unit Apartments | 0 (0.0%) | 0 (0.0%) |
| 3 or 4 Unit Apartments | 0 (0.0%) | 0 (0.0%) |
| 5 to 9 Unit Apartments | 0 (0.0%) | 63 (100.0%) |
| 10 or more Apartments | 0 (0.0%) | 62 (100.0%) |
| Mobile Home / Other | 9 (100.0%) | 0 (0.0%) |
| Total | 783 (72.9%) | 291 (27.1%) |
Housing Structures by Number of Rooms in Masury
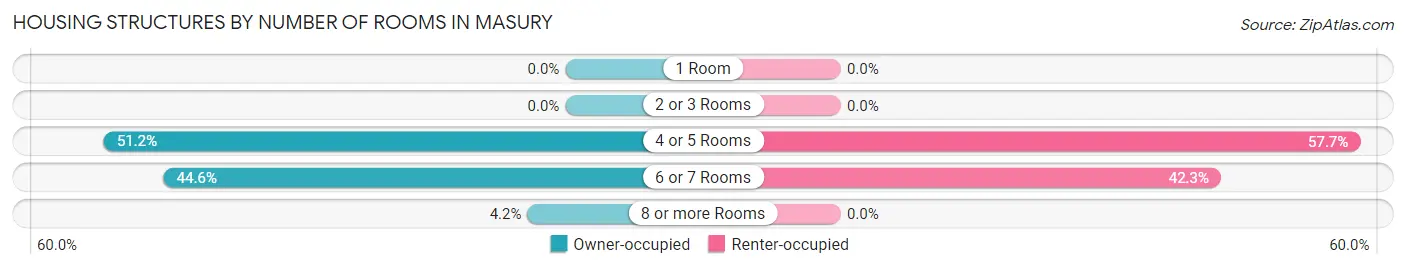
| Number of Rooms | Owner-occupied | Renter-occupied |
| 1 Room | 0 (0.0%) | 0 (0.0%) |
| 2 or 3 Rooms | 0 (0.0%) | 0 (0.0%) |
| 4 or 5 Rooms | 401 (51.2%) | 168 (57.7%) |
| 6 or 7 Rooms | 349 (44.6%) | 123 (42.3%) |
| 8 or more Rooms | 33 (4.2%) | 0 (0.0%) |
| Total | 783 (100.0%) | 291 (100.0%) |
Housing Structure by Heating Type in Masury
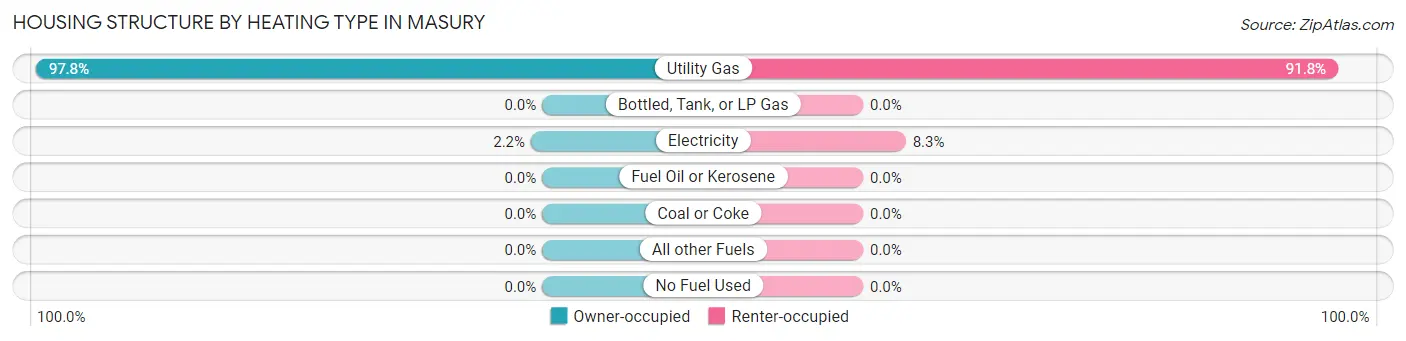
| Heating Type | Owner-occupied | Renter-occupied |
| Utility Gas | 766 (97.8%) | 267 (91.7%) |
| Bottled, Tank, or LP Gas | 0 (0.0%) | 0 (0.0%) |
| Electricity | 17 (2.2%) | 24 (8.3%) |
| Fuel Oil or Kerosene | 0 (0.0%) | 0 (0.0%) |
| Coal or Coke | 0 (0.0%) | 0 (0.0%) |
| All other Fuels | 0 (0.0%) | 0 (0.0%) |
| No Fuel Used | 0 (0.0%) | 0 (0.0%) |
| Total | 783 (100.0%) | 291 (100.0%) |
Household Vehicle Usage in Masury
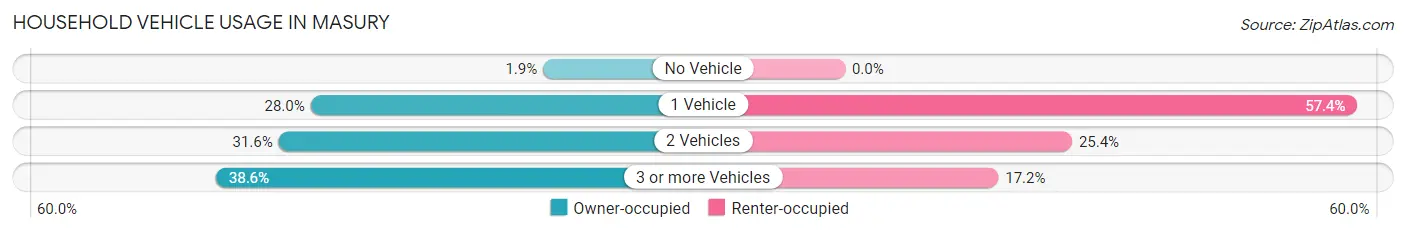
| Vehicles per Household | Owner-occupied | Renter-occupied |
| No Vehicle | 15 (1.9%) | 0 (0.0%) |
| 1 Vehicle | 219 (28.0%) | 167 (57.4%) |
| 2 Vehicles | 247 (31.6%) | 74 (25.4%) |
| 3 or more Vehicles | 302 (38.6%) | 50 (17.2%) |
| Total | 783 (100.0%) | 291 (100.0%) |
Real Estate & Mortgages in Masury
Real Estate and Mortgage Overview in Masury
| Characteristic | Without Mortgage | With Mortgage |
| Housing Units | 416 | 367 |
| Median Property Value | $47,600 | $103,300 |
| Median Household Income | $24,617 | $19 |
| Monthly Housing Costs | $195 | $0 |
| Real Estate Taxes | $735 | $0 |
Property Value by Mortgage Status in Masury
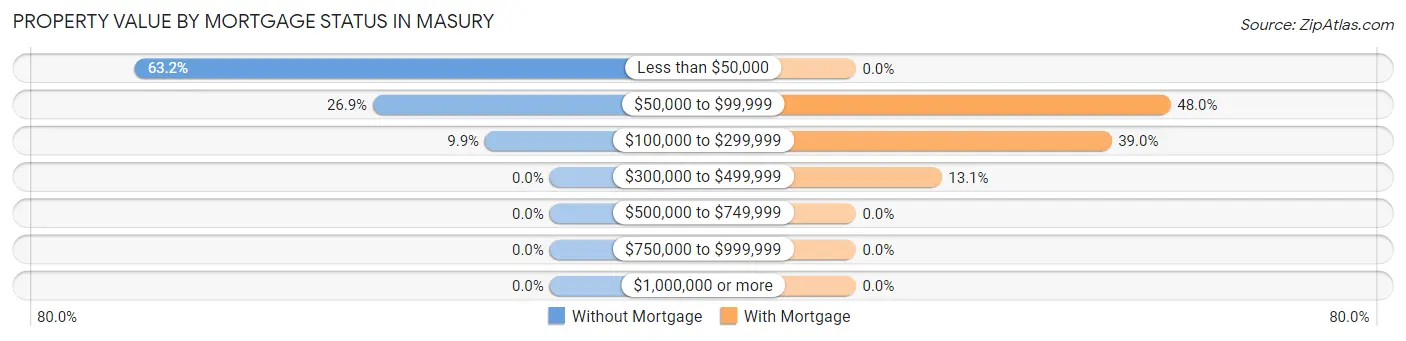
| Property Value | Without Mortgage | With Mortgage |
| Less than $50,000 | 263 (63.2%) | 0 (0.0%) |
| $50,000 to $99,999 | 112 (26.9%) | 176 (48.0%) |
| $100,000 to $299,999 | 41 (9.9%) | 143 (39.0%) |
| $300,000 to $499,999 | 0 (0.0%) | 48 (13.1%) |
| $500,000 to $749,999 | 0 (0.0%) | 0 (0.0%) |
| $750,000 to $999,999 | 0 (0.0%) | 0 (0.0%) |
| $1,000,000 or more | 0 (0.0%) | 0 (0.0%) |
| Total | 416 (100.0%) | 367 (100.0%) |
Household Income by Mortgage Status in Masury
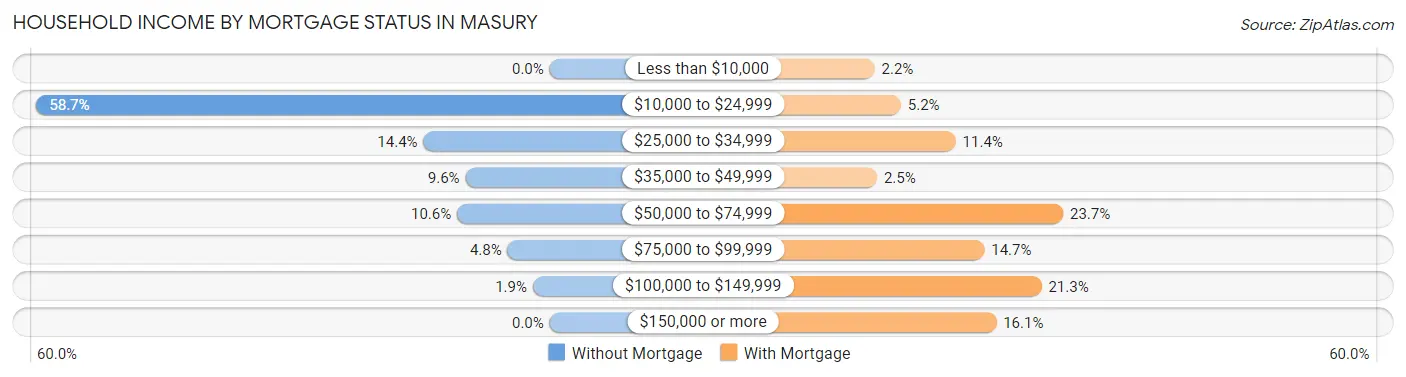
| Household Income | Without Mortgage | With Mortgage |
| Less than $10,000 | 0 (0.0%) | 8 (2.2%) |
| $10,000 to $24,999 | 244 (58.7%) | 19 (5.2%) |
| $25,000 to $34,999 | 60 (14.4%) | 42 (11.4%) |
| $35,000 to $49,999 | 40 (9.6%) | 9 (2.5%) |
| $50,000 to $74,999 | 44 (10.6%) | 87 (23.7%) |
| $75,000 to $99,999 | 20 (4.8%) | 54 (14.7%) |
| $100,000 to $149,999 | 8 (1.9%) | 78 (21.2%) |
| $150,000 or more | 0 (0.0%) | 59 (16.1%) |
| Total | 416 (100.0%) | 367 (100.0%) |
Property Value to Household Income Ratio in Masury
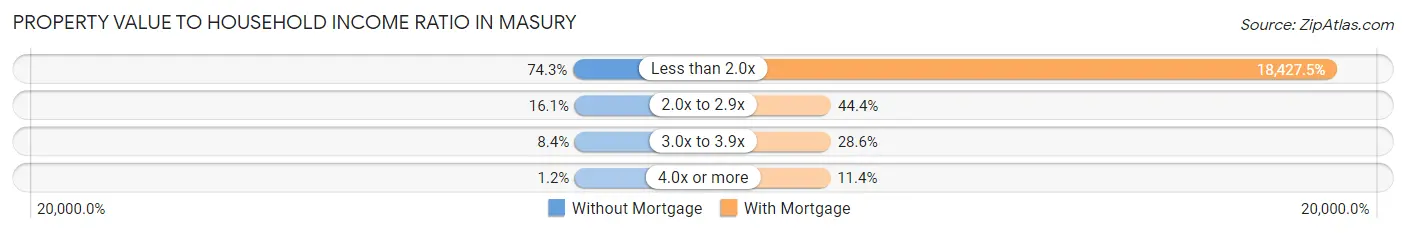
| Value-to-Income Ratio | Without Mortgage | With Mortgage |
| Less than 2.0x | 309 (74.3%) | 67,629 (18,427.5%) |
| 2.0x to 2.9x | 67 (16.1%) | 163 (44.4%) |
| 3.0x to 3.9x | 35 (8.4%) | 105 (28.6%) |
| 4.0x or more | 5 (1.2%) | 42 (11.4%) |
| Total | 416 (100.0%) | 367 (100.0%) |
Real Estate Taxes by Mortgage Status in Masury
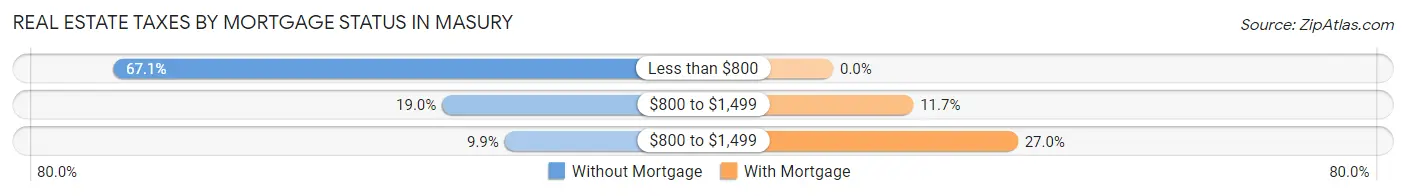
| Property Taxes | Without Mortgage | With Mortgage |
| Less than $800 | 279 (67.1%) | 0 (0.0%) |
| $800 to $1,499 | 79 (19.0%) | 43 (11.7%) |
| $800 to $1,499 | 41 (9.9%) | 99 (27.0%) |
| Total | 416 (100.0%) | 367 (100.0%) |
Health & Disability in Masury
Health Insurance Coverage by Age in Masury
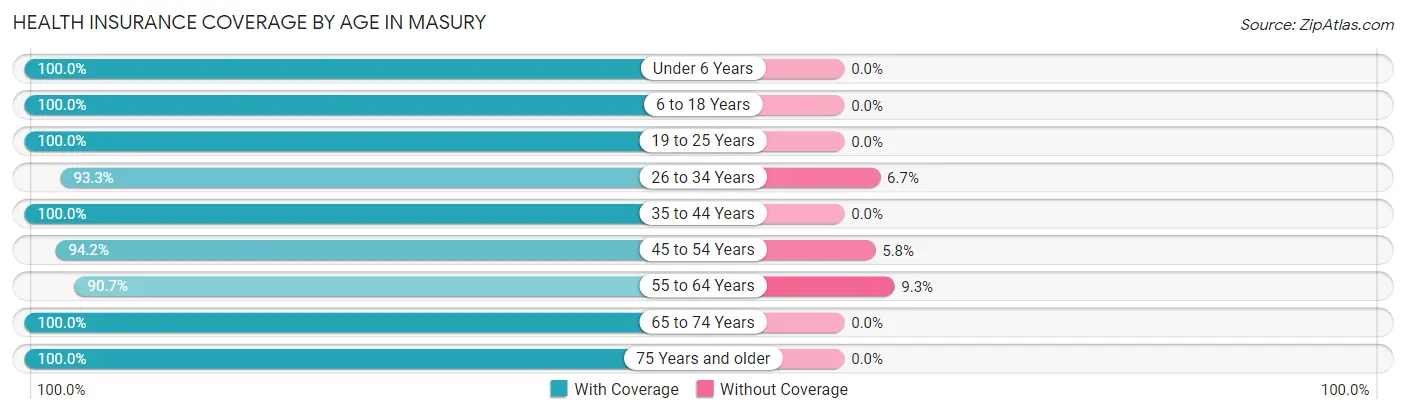
| Age Bracket | With Coverage | Without Coverage |
| Under 6 Years | 173 (100.0%) | 0 (0.0%) |
| 6 to 18 Years | 285 (100.0%) | 0 (0.0%) |
| 19 to 25 Years | 101 (100.0%) | 0 (0.0%) |
| 26 to 34 Years | 237 (93.3%) | 17 (6.7%) |
| 35 to 44 Years | 300 (100.0%) | 0 (0.0%) |
| 45 to 54 Years | 163 (94.2%) | 10 (5.8%) |
| 55 to 64 Years | 311 (90.7%) | 32 (9.3%) |
| 65 to 74 Years | 442 (100.0%) | 0 (0.0%) |
| 75 Years and older | 141 (100.0%) | 0 (0.0%) |
| Total | 2,153 (97.3%) | 59 (2.7%) |
Health Insurance Coverage by Citizenship Status in Masury
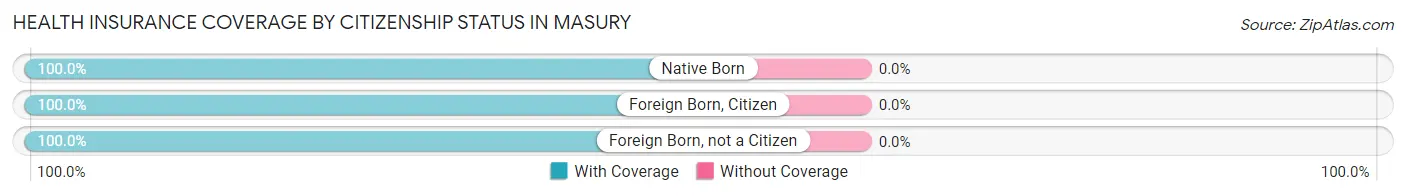
| Citizenship Status | With Coverage | Without Coverage |
| Native Born | 173 (100.0%) | 0 (0.0%) |
| Foreign Born, Citizen | 285 (100.0%) | 0 (0.0%) |
| Foreign Born, not a Citizen | 101 (100.0%) | 0 (0.0%) |
Health Insurance Coverage by Household Income in Masury
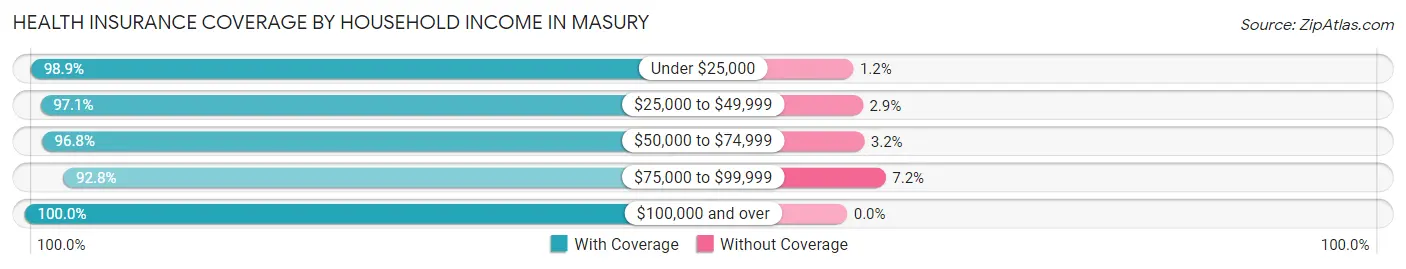
| Household Income | With Coverage | Without Coverage |
| Under $25,000 | 431 (98.9%) | 5 (1.1%) |
| $25,000 to $49,999 | 596 (97.1%) | 18 (2.9%) |
| $50,000 to $74,999 | 577 (96.8%) | 19 (3.2%) |
| $75,000 to $99,999 | 218 (92.8%) | 17 (7.2%) |
| $100,000 and over | 330 (100.0%) | 0 (0.0%) |
Public vs Private Health Insurance Coverage by Age in Masury
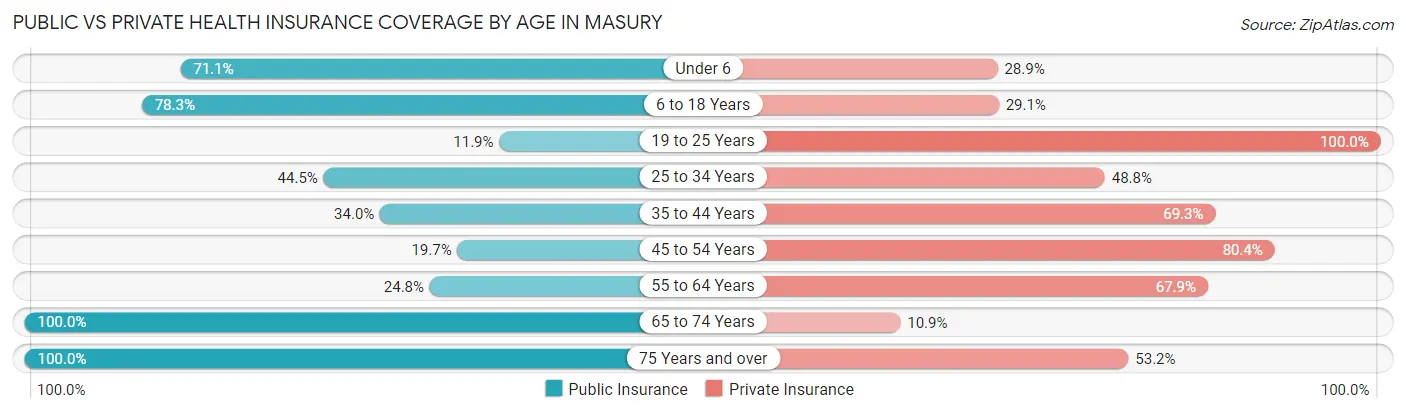
| Age Bracket | Public Insurance | Private Insurance |
| Under 6 | 123 (71.1%) | 50 (28.9%) |
| 6 to 18 Years | 223 (78.2%) | 83 (29.1%) |
| 19 to 25 Years | 12 (11.9%) | 101 (100.0%) |
| 25 to 34 Years | 113 (44.5%) | 124 (48.8%) |
| 35 to 44 Years | 102 (34.0%) | 208 (69.3%) |
| 45 to 54 Years | 34 (19.7%) | 139 (80.3%) |
| 55 to 64 Years | 85 (24.8%) | 233 (67.9%) |
| 65 to 74 Years | 442 (100.0%) | 48 (10.9%) |
| 75 Years and over | 141 (100.0%) | 75 (53.2%) |
| Total | 1,275 (57.6%) | 1,061 (48.0%) |
Disability Status by Sex by Age in Masury
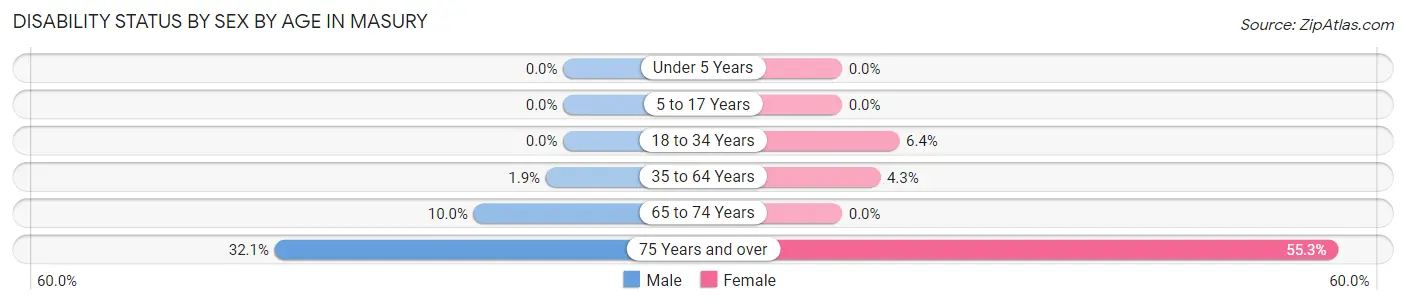
| Age Bracket | Male | Female |
| Under 5 Years | 0 (0.0%) | 0 (0.0%) |
| 5 to 17 Years | 0 (0.0%) | 0 (0.0%) |
| 18 to 34 Years | 0 (0.0%) | 12 (6.4%) |
| 35 to 64 Years | 9 (1.9%) | 15 (4.3%) |
| 65 to 74 Years | 34 (10.0%) | 0 (0.0%) |
| 75 Years and over | 18 (32.1%) | 47 (55.3%) |
Disability Class by Sex by Age in Masury
Disability Class: Hearing Difficulty
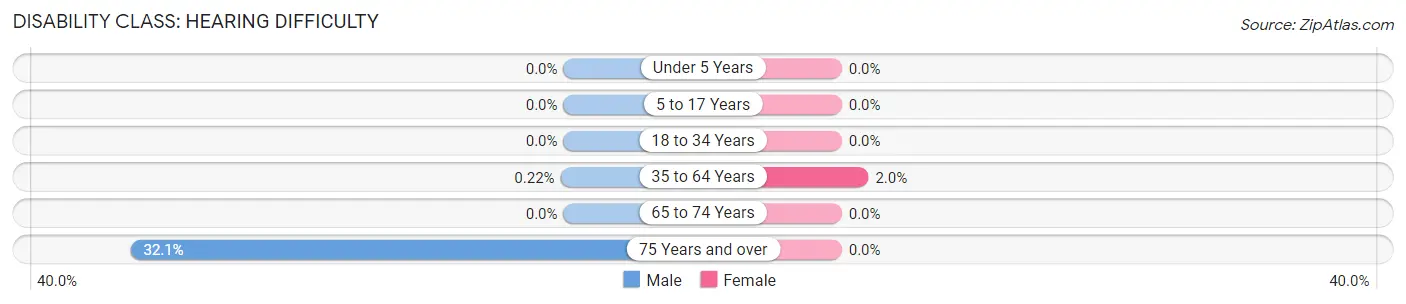
| Age Bracket | Male | Female |
| Under 5 Years | 0 (0.0%) | 0 (0.0%) |
| 5 to 17 Years | 0 (0.0%) | 0 (0.0%) |
| 18 to 34 Years | 0 (0.0%) | 0 (0.0%) |
| 35 to 64 Years | 1 (0.2%) | 7 (2.0%) |
| 65 to 74 Years | 0 (0.0%) | 0 (0.0%) |
| 75 Years and over | 18 (32.1%) | 0 (0.0%) |
Disability Class: Vision Difficulty
| Age Bracket | Male | Female |
| Under 5 Years | 0 (0.0%) | 0 (0.0%) |
| 5 to 17 Years | 0 (0.0%) | 0 (0.0%) |
| 18 to 34 Years | 0 (0.0%) | 0 (0.0%) |
| 35 to 64 Years | 0 (0.0%) | 0 (0.0%) |
| 65 to 74 Years | 0 (0.0%) | 0 (0.0%) |
| 75 Years and over | 0 (0.0%) | 0 (0.0%) |
Disability Class: Cognitive Difficulty
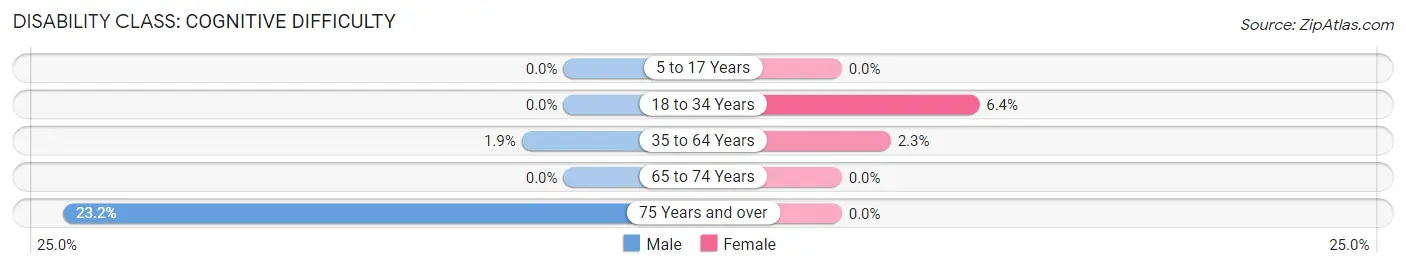
| Age Bracket | Male | Female |
| 5 to 17 Years | 0 (0.0%) | 0 (0.0%) |
| 18 to 34 Years | 0 (0.0%) | 12 (6.4%) |
| 35 to 64 Years | 9 (1.9%) | 8 (2.3%) |
| 65 to 74 Years | 0 (0.0%) | 0 (0.0%) |
| 75 Years and over | 13 (23.2%) | 0 (0.0%) |
Disability Class: Ambulatory Difficulty
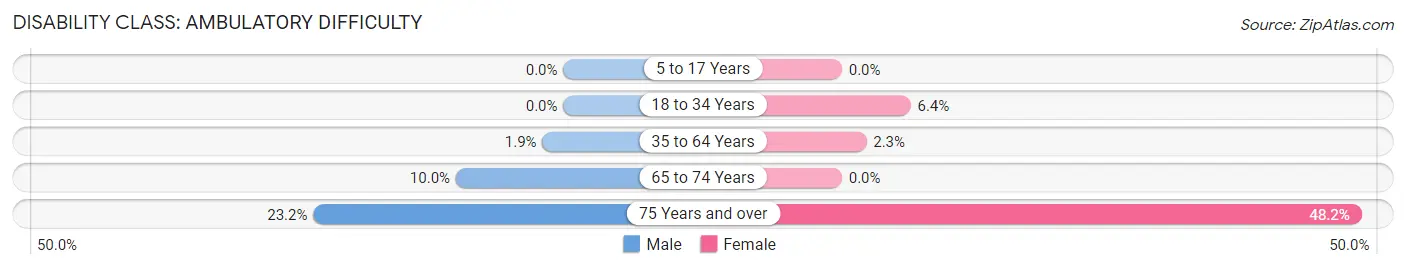
| Age Bracket | Male | Female |
| 5 to 17 Years | 0 (0.0%) | 0 (0.0%) |
| 18 to 34 Years | 0 (0.0%) | 12 (6.4%) |
| 35 to 64 Years | 9 (1.9%) | 8 (2.3%) |
| 65 to 74 Years | 34 (10.0%) | 0 (0.0%) |
| 75 Years and over | 13 (23.2%) | 41 (48.2%) |
Disability Class: Self-Care Difficulty
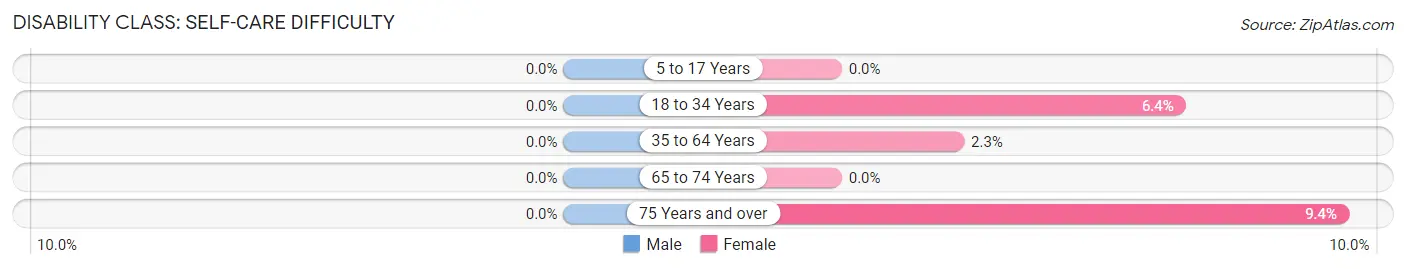
| Age Bracket | Male | Female |
| 5 to 17 Years | 0 (0.0%) | 0 (0.0%) |
| 18 to 34 Years | 0 (0.0%) | 12 (6.4%) |
| 35 to 64 Years | 0 (0.0%) | 8 (2.3%) |
| 65 to 74 Years | 0 (0.0%) | 0 (0.0%) |
| 75 Years and over | 0 (0.0%) | 8 (9.4%) |
Technology Access in Masury
Computing Device Access in Masury
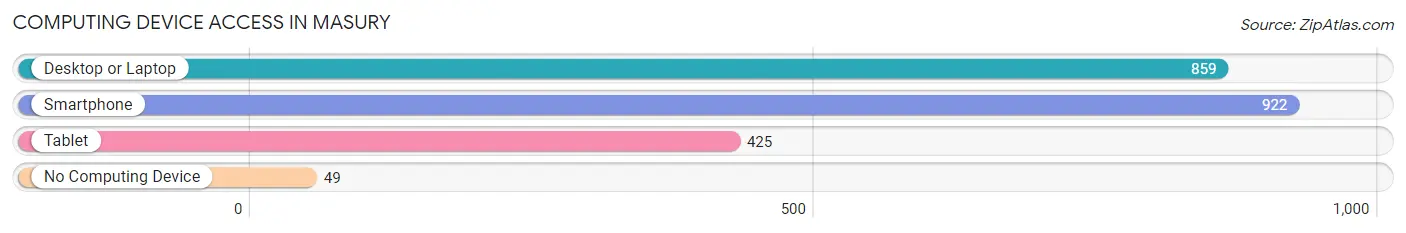
| Device Type | # Households | % Households |
| Desktop or Laptop | 859 | 80.0% |
| Smartphone | 922 | 85.9% |
| Tablet | 425 | 39.6% |
| No Computing Device | 49 | 4.6% |
| Total | 1,074 | 100.0% |
Internet Access in Masury
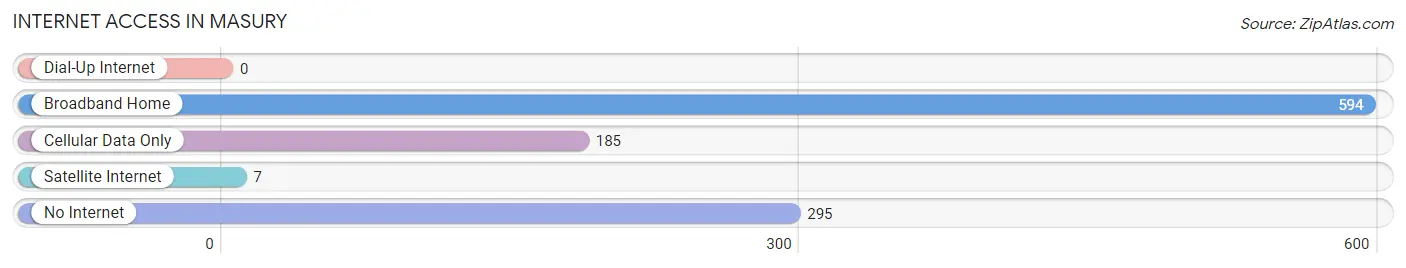
| Internet Type | # Households | % Households |
| Dial-Up Internet | 0 | 0.0% |
| Broadband Home | 594 | 55.3% |
| Cellular Data Only | 185 | 17.2% |
| Satellite Internet | 7 | 0.6% |
| No Internet | 295 | 27.5% |
| Total | 1,074 | 100.0% |
Masury Summary
Masury, Ohio is a small village located in Trumbull County, Ohio. It is situated on the Mahoning River, approximately 10 miles northwest of Youngstown. The village has a population of 1,845 people, according to the 2010 census.
History
Masury was founded in 1802 by John Masury, a Revolutionary War veteran. He purchased the land from the Connecticut Land Company and named the village after himself. The village was incorporated in 1837.
Masury was an important stop on the Underground Railroad. It was a safe haven for escaped slaves, and many of the local residents were involved in the abolitionist movement.
In the late 19th century, Masury was a thriving industrial center. It was home to several factories, including a steel mill, a glass factory, and a brickyard. The village also had a railroad station, which connected it to other towns in the area.
Geography
Masury is located in northeastern Ohio, in Trumbull County. It is situated on the Mahoning River, approximately 10 miles northwest of Youngstown. The village has a total area of 0.9 square miles, all of which is land.
The climate in Masury is humid continental, with hot summers and cold winters. The average annual temperature is around 50 degrees Fahrenheit.
Economy
Masury’s economy is largely based on manufacturing. The village is home to several factories, including a steel mill, a glass factory, and a brickyard. The village also has a railroad station, which connects it to other towns in the area.
In addition to manufacturing, Masury also has a few retail stores and restaurants. The village also has a few small businesses, such as auto repair shops and hair salons.
Demographics
According to the 2010 census, Masury has a population of 1,845 people. The racial makeup of the village is 97.3% White, 0.9% African American, 0.2% Native American, 0.2% Asian, and 1.4% from other races.
The median household income in Masury is $37,917, and the median family income is $45,938. The per capita income is $19,945. The unemployment rate is 6.2%.
Masury is served by the Masury Local School District. The village has one elementary school, one middle school, and one high school. The village also has a public library.
Common Questions
What is Per Capita Income in Masury?
Per Capita income in Masury is $25,181.
What is the Median Family Income in Masury?
Median Family Income in Masury is $59,290.
What is the Median Household income in Masury?
Median Household Income in Masury is $43,688.
What is Income or Wage Gap in Masury?
Income or Wage Gap in Masury is 23.7%.
Women in Masury earn 76.3 cents for every dollar earned by a man.
What is Inequality or Gini Index in Masury?
Inequality or Gini Index in Masury is 0.37.
What is the Total Population of Masury?
Total Population of Masury is 2,212.
What is the Total Male Population of Masury?
Total Male Population of Masury is 1,242.
What is the Total Female Population of Masury?
Total Female Population of Masury is 970.
What is the Ratio of Males per 100 Females in Masury?
There are 128.04 Males per 100 Females in Masury.
What is the Ratio of Females per 100 Males in Masury?
There are 78.10 Females per 100 Males in Masury.
What is the Median Population Age in Masury?
Median Population Age in Masury is 44.6 Years.
What is the Average Family Size in Masury
Average Family Size in Masury is 3.0 People.
What is the Average Household Size in Masury
Average Household Size in Masury is 2.1 People.
How Large is the Labor Force in Masury?
There are 967 People in the Labor Forcein in Masury.
What is the Percentage of People in the Labor Force in Masury?
53.6% of People are in the Labor Force in Masury.
What is the Unemployment Rate in Masury?
Unemployment Rate in Masury is 7.1%.