Franklin Furnace, OH Map & Demographics
Franklin Furnace Map
Franklin Furnace Overview
$22,124
PER CAPITA INCOME
$51,335
AVG FAMILY INCOME
$49,200
AVG HOUSEHOLD INCOME
0.42
INEQUALITY / GINI INDEX
1,896
TOTAL POPULATION
1,081
MALE POPULATION
815
FEMALE POPULATION
132.64
MALES / 100 FEMALES
75.39
FEMALES / 100 MALES
38.9
MEDIAN AGE
2.8
AVG FAMILY SIZE
2.4
AVG HOUSEHOLD SIZE
601
LABOR FORCE [ PEOPLE ]
35.8%
PERCENT IN LABOR FORCE
2.5%
UNEMPLOYMENT RATE
Franklin Furnace Zip Codes
Franklin Furnace Area Codes
Income in Franklin Furnace
Income Overview in Franklin Furnace
Per Capita Income in Franklin Furnace is $22,124, while median incomes of families and households are $51,335 and $49,200 respectively.
| Characteristic | Number | Measure |
| Per Capita Income | 1,896 | $22,124 |
| Median Family Income | 411 | $51,335 |
| Mean Family Income | 411 | $69,614 |
| Median Household Income | 622 | $49,200 |
| Mean Household Income | 622 | $60,884 |
| Income Deficit | 411 | $0 |
| Wage / Income Gap (%) | 1,896 | 0.00% |
| Wage / Income Gap ($) | 1,896 | 100.00¢ per $1 |
| Gini / Inequality Index | 1,896 | 0.42 |
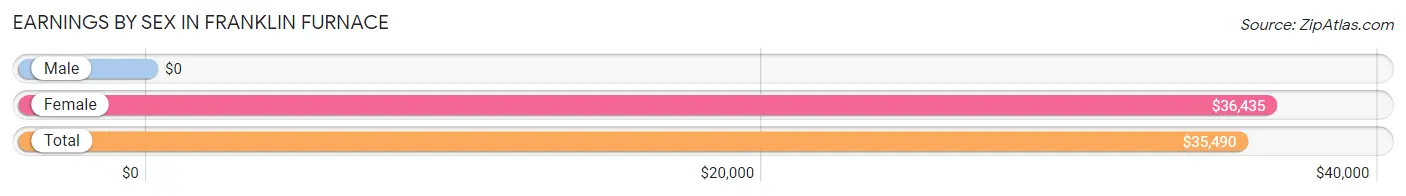
Earnings by Sex in Franklin Furnace
| Sex | Number | Average Earnings |
| Male | 323 (45.8%) | $0 |
| Female | 383 (54.2%) | $36,435 |
| Total | 706 (100.0%) | $35,490 |
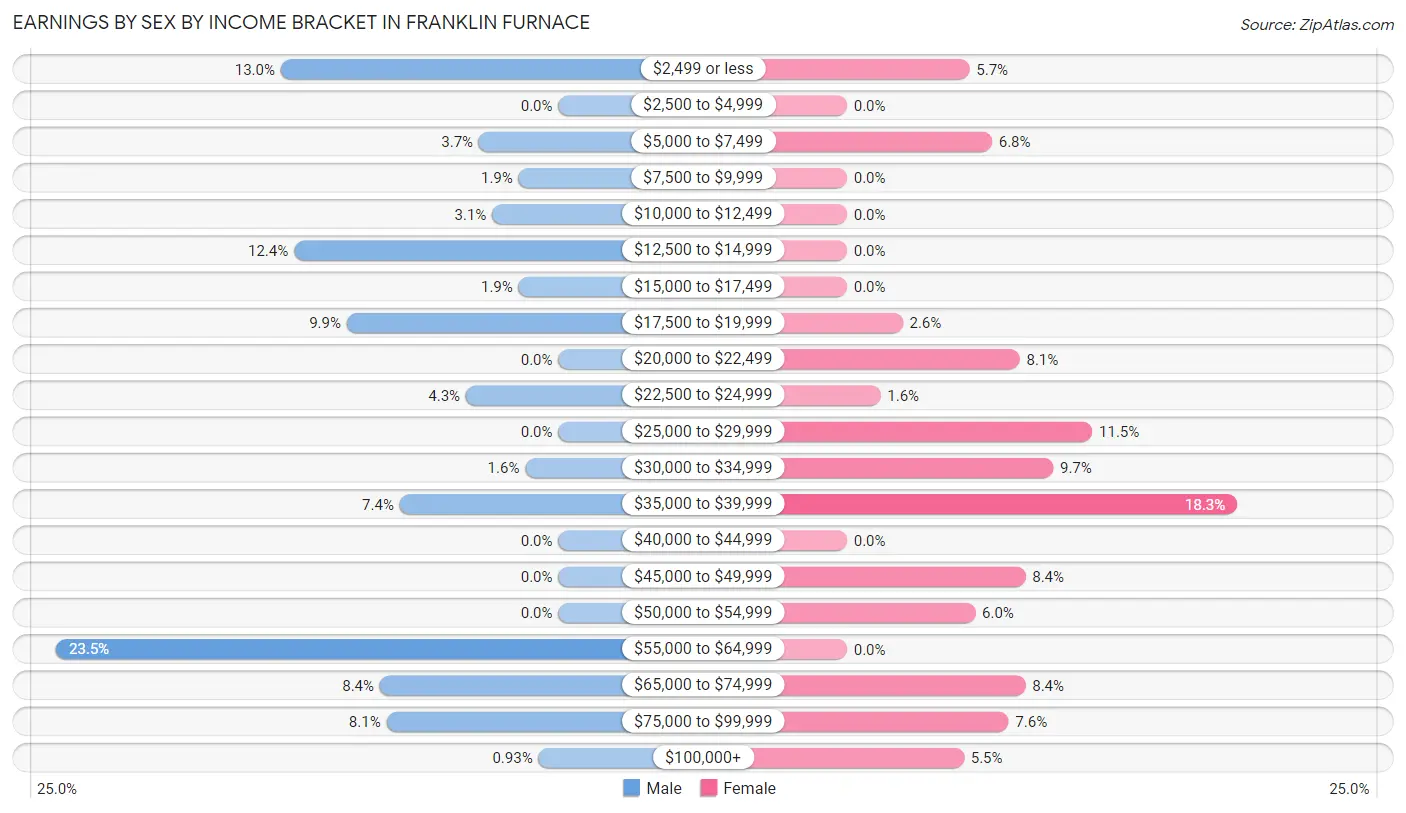
Earnings by Sex by Income Bracket in Franklin Furnace
The most common earnings brackets in Franklin Furnace are $55,000 to $64,999 for men (76 | 23.5%) and $35,000 to $39,999 for women (70 | 18.3%).
| Income | Male | Female |
| $2,499 or less | 42 (13.0%) | 22 (5.7%) |
| $2,500 to $4,999 | 0 (0.0%) | 0 (0.0%) |
| $5,000 to $7,499 | 12 (3.7%) | 26 (6.8%) |
| $7,500 to $9,999 | 6 (1.9%) | 0 (0.0%) |
| $10,000 to $12,499 | 10 (3.1%) | 0 (0.0%) |
| $12,500 to $14,999 | 40 (12.4%) | 0 (0.0%) |
| $15,000 to $17,499 | 6 (1.9%) | 0 (0.0%) |
| $17,500 to $19,999 | 32 (9.9%) | 10 (2.6%) |
| $20,000 to $22,499 | 0 (0.0%) | 31 (8.1%) |
| $22,500 to $24,999 | 14 (4.3%) | 6 (1.6%) |
| $25,000 to $29,999 | 0 (0.0%) | 44 (11.5%) |
| $30,000 to $34,999 | 5 (1.5%) | 37 (9.7%) |
| $35,000 to $39,999 | 24 (7.4%) | 70 (18.3%) |
| $40,000 to $44,999 | 0 (0.0%) | 0 (0.0%) |
| $45,000 to $49,999 | 0 (0.0%) | 32 (8.4%) |
| $50,000 to $54,999 | 0 (0.0%) | 23 (6.0%) |
| $55,000 to $64,999 | 76 (23.5%) | 0 (0.0%) |
| $65,000 to $74,999 | 27 (8.4%) | 32 (8.4%) |
| $75,000 to $99,999 | 26 (8.1%) | 29 (7.6%) |
| $100,000+ | 3 (0.9%) | 21 (5.5%) |
| Total | 323 (100.0%) | 383 (100.0%) |
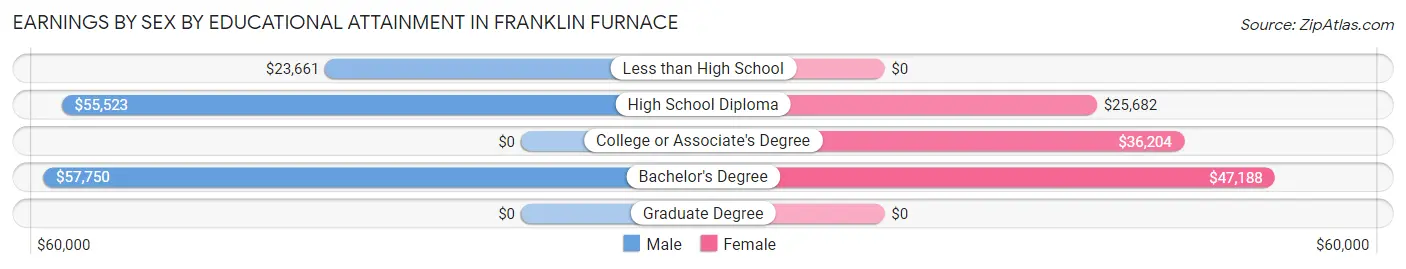
Earnings by Sex by Educational Attainment in Franklin Furnace
| Educational Attainment | Male Income | Female Income |
| Less than High School | $23,661 | $0 |
| High School Diploma | $55,523 | $25,682 |
| College or Associate's Degree | - | - |
| Bachelor's Degree | $57,750 | $47,188 |
| Graduate Degree | - | - |
| Total | - | - |
Family Income in Franklin Furnace
Family Income Brackets in Franklin Furnace
According to the Franklin Furnace family income data, there are 124 families falling into the $50,000 to $74,999 income range, which is the most common income bracket and makes up 30.2% of all families.
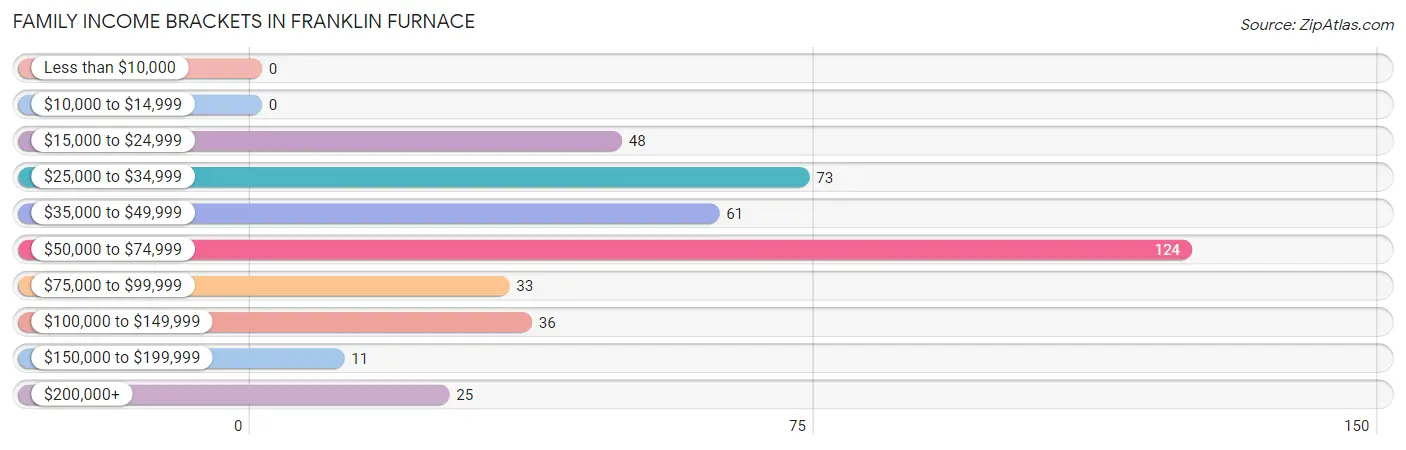
| Income Bracket | # Families | % Families |
| Less than $10,000 | 0 | 0.0% |
| $10,000 to $14,999 | 0 | 0.0% |
| $15,000 to $24,999 | 48 | 11.7% |
| $25,000 to $34,999 | 73 | 17.8% |
| $35,000 to $49,999 | 61 | 14.8% |
| $50,000 to $74,999 | 124 | 30.2% |
| $75,000 to $99,999 | 33 | 8.0% |
| $100,000 to $149,999 | 36 | 8.8% |
| $150,000 to $199,999 | 11 | 2.7% |
| $200,000+ | 25 | 6.1% |
Family Income by Famaliy Size in Franklin Furnace
3-person families (122 | 29.7%) account for the highest median family income in Franklin Furnace with $71,563 per family, while 3-person families (122 | 29.7%) have the highest median income of $23,854 per family member.
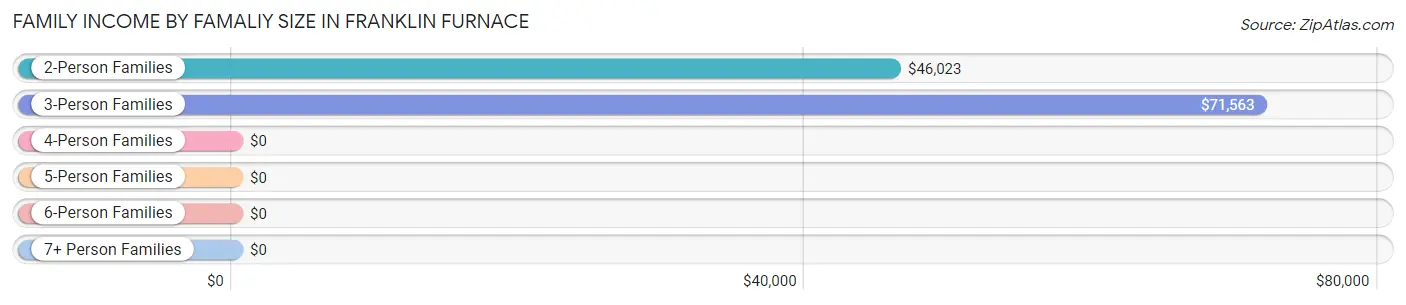
| Income Bracket | # Families | Median Income |
| 2-Person Families | 217 (52.8%) | $46,023 |
| 3-Person Families | 122 (29.7%) | $71,563 |
| 4-Person Families | 72 (17.5%) | $0 |
| 5-Person Families | 0 (0.0%) | $0 |
| 6-Person Families | 0 (0.0%) | $0 |
| 7+ Person Families | 0 (0.0%) | $0 |
| Total | 411 (100.0%) | $51,335 |
Family Income by Number of Earners in Franklin Furnace
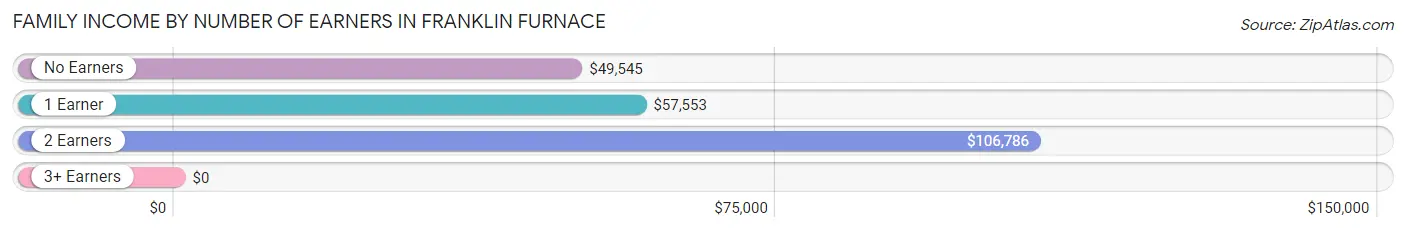
| Number of Earners | # Families | Median Income |
| No Earners | 112 (27.3%) | $49,545 |
| 1 Earner | 198 (48.2%) | $57,553 |
| 2 Earners | 68 (16.6%) | $106,786 |
| 3+ Earners | 33 (8.0%) | $0 |
| Total | 411 (100.0%) | $51,335 |
Household Income in Franklin Furnace
Household Income Brackets in Franklin Furnace
With 168 households falling in the category, the $50,000 to $74,999 income range is the most frequent in Franklin Furnace, accounting for 27.0% of all households.
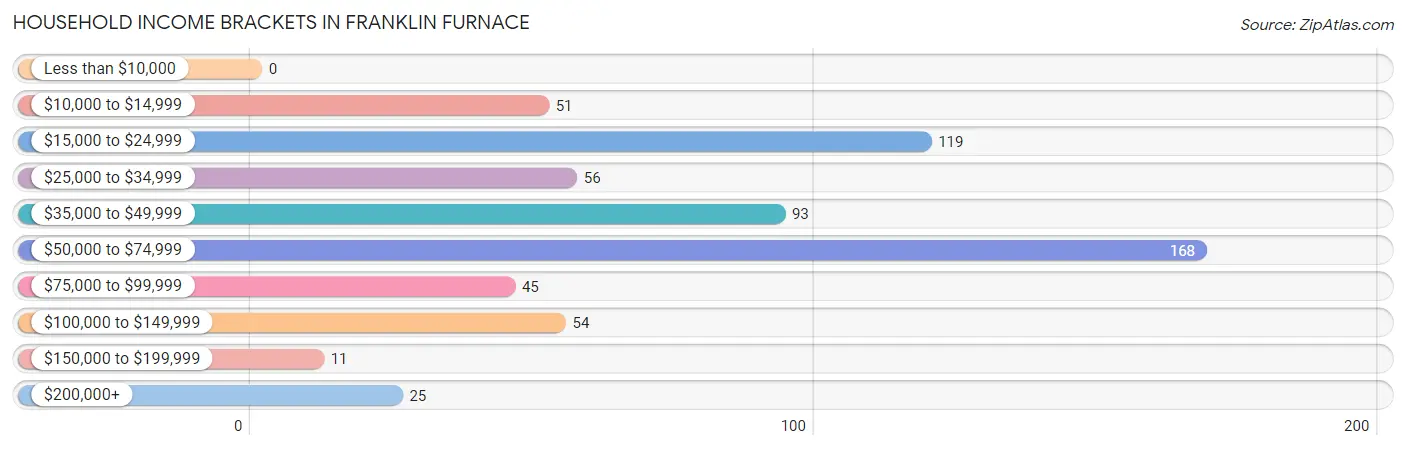
| Income Bracket | # Households | % Households |
| Less than $10,000 | 0 | 0.0% |
| $10,000 to $14,999 | 51 | 8.2% |
| $15,000 to $24,999 | 119 | 19.1% |
| $25,000 to $34,999 | 56 | 9.0% |
| $35,000 to $49,999 | 93 | 15.0% |
| $50,000 to $74,999 | 168 | 27.0% |
| $75,000 to $99,999 | 45 | 7.2% |
| $100,000 to $149,999 | 54 | 8.7% |
| $150,000 to $199,999 | 11 | 1.8% |
| $200,000+ | 25 | 4.0% |
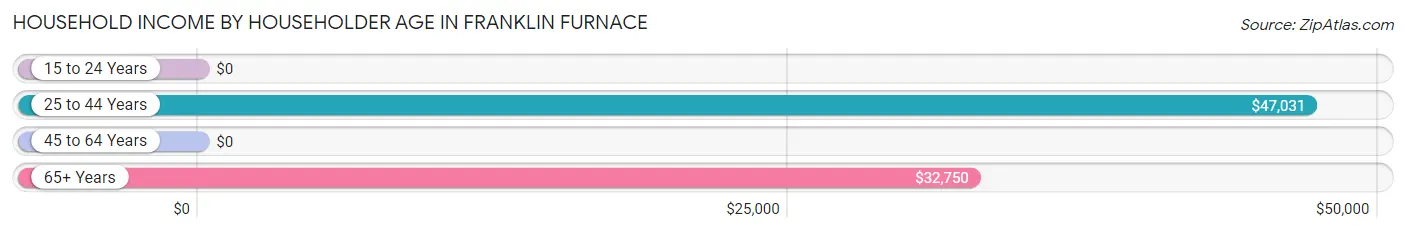
Household Income by Householder Age in Franklin Furnace
The median household income in Franklin Furnace is $49,200, with the highest median household income of $47,031 found in the 25 to 44 years age bracket for the primary householder. A total of 214 households (34.4%) fall into this category.
| Income Bracket | # Households | Median Income |
| 15 to 24 Years | 0 (0.0%) | $0 |
| 25 to 44 Years | 214 (34.4%) | $47,031 |
| 45 to 64 Years | 233 (37.5%) | $0 |
| 65+ Years | 175 (28.1%) | $32,750 |
| Total | 622 (100.0%) | $49,200 |
Poverty in Franklin Furnace
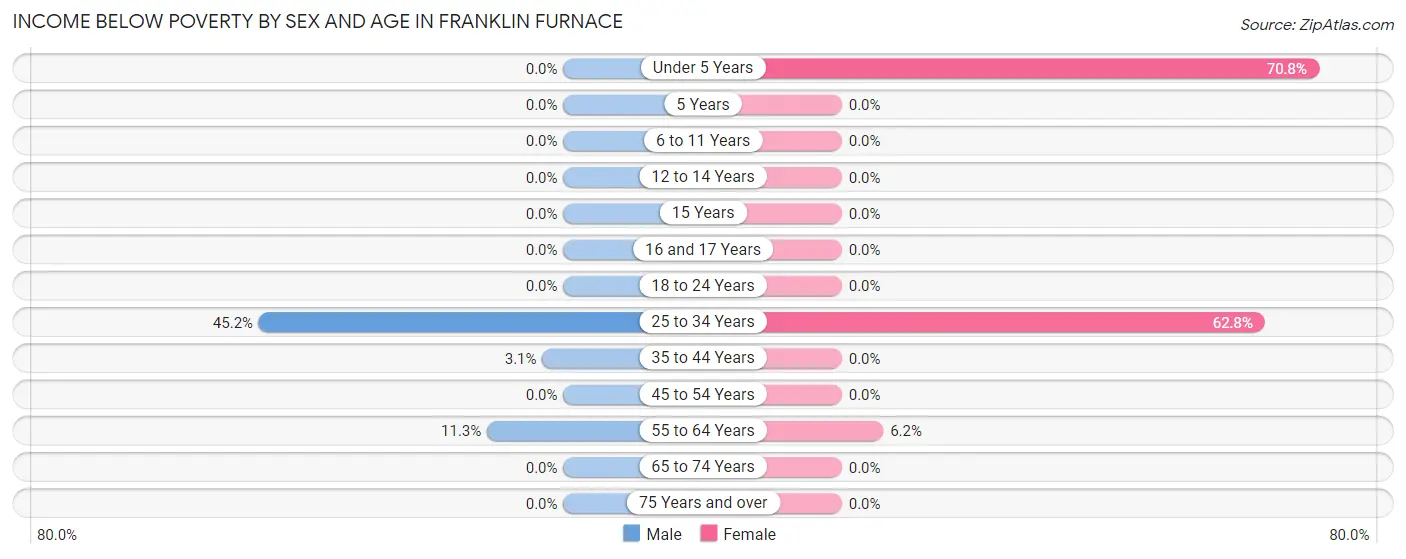
Income Below Poverty by Sex and Age in Franklin Furnace
With 10.2% poverty level for males and 14.8% for females among the residents of Franklin Furnace, 25 to 34 year old males and under 5 year old females are the most vulnerable to poverty, with 66 males (45.2%) and 17 females (70.8%) in their respective age groups living below the poverty level.
| Age Bracket | Male | Female |
| Under 5 Years | 0 (0.0%) | 17 (70.8%) |
| 5 Years | 0 (0.0%) | 0 (0.0%) |
| 6 to 11 Years | 0 (0.0%) | 0 (0.0%) |
| 12 to 14 Years | 0 (0.0%) | 0 (0.0%) |
| 15 Years | 0 (0.0%) | 0 (0.0%) |
| 16 and 17 Years | 0 (0.0%) | 0 (0.0%) |
| 18 to 24 Years | 0 (0.0%) | 0 (0.0%) |
| 25 to 34 Years | 66 (45.2%) | 76 (62.8%) |
| 35 to 44 Years | 3 (3.1%) | 0 (0.0%) |
| 45 to 54 Years | 0 (0.0%) | 0 (0.0%) |
| 55 to 64 Years | 12 (11.3%) | 12 (6.1%) |
| 65 to 74 Years | 0 (0.0%) | 0 (0.0%) |
| 75 Years and over | 0 (0.0%) | 0 (0.0%) |
| Total | 81 (10.2%) | 105 (14.8%) |
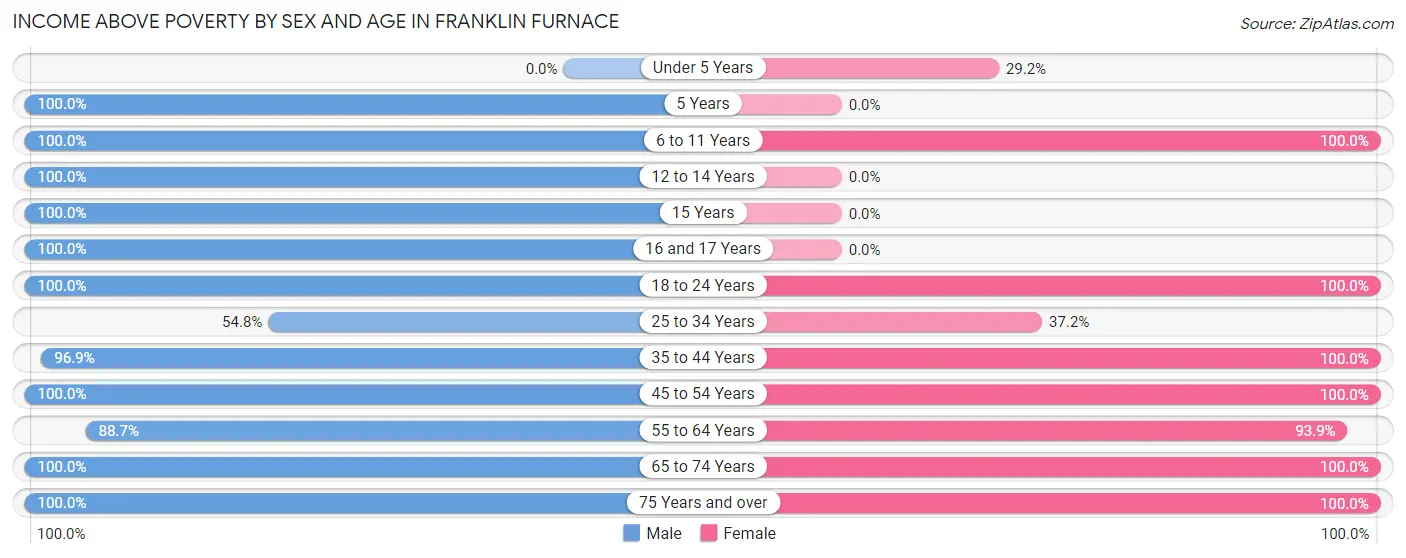
Income Above Poverty by Sex and Age in Franklin Furnace
According to the poverty statistics in Franklin Furnace, males aged 5 years and females aged 6 to 11 years are the age groups that are most secure financially, with 100.0% of males and 100.0% of females in these age groups living above the poverty line.
| Age Bracket | Male | Female |
| Under 5 Years | 0 (0.0%) | 7 (29.2%) |
| 5 Years | 47 (100.0%) | 0 (0.0%) |
| 6 to 11 Years | 57 (100.0%) | 16 (100.0%) |
| 12 to 14 Years | 10 (100.0%) | 0 (0.0%) |
| 15 Years | 34 (100.0%) | 0 (0.0%) |
| 16 and 17 Years | 9 (100.0%) | 0 (0.0%) |
| 18 to 24 Years | 101 (100.0%) | 73 (100.0%) |
| 25 to 34 Years | 80 (54.8%) | 45 (37.2%) |
| 35 to 44 Years | 93 (96.9%) | 54 (100.0%) |
| 45 to 54 Years | 58 (100.0%) | 117 (100.0%) |
| 55 to 64 Years | 94 (88.7%) | 183 (93.9%) |
| 65 to 74 Years | 64 (100.0%) | 69 (100.0%) |
| 75 Years and over | 65 (100.0%) | 41 (100.0%) |
| Total | 712 (89.8%) | 605 (85.2%) |
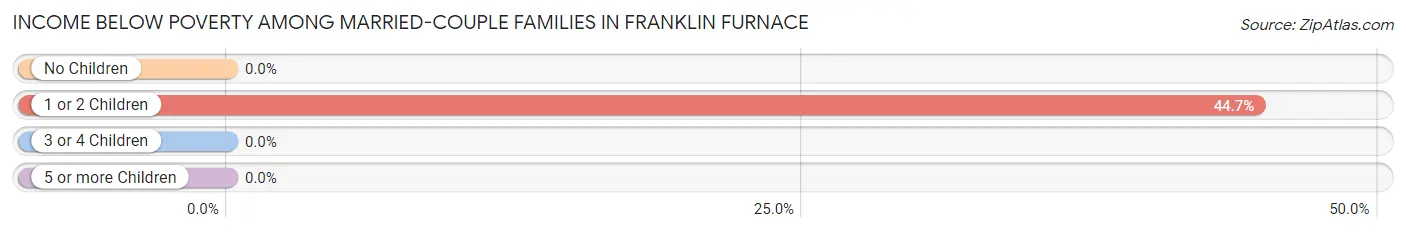
Income Below Poverty Among Married-Couple Families in Franklin Furnace
The poverty statistics for married-couple families in Franklin Furnace show that 6.4% or 17 of the total 264 families live below the poverty line. Families with 1 or 2 children have the highest poverty rate of 44.7%, comprising of 17 families. On the other hand, families with no children have the lowest poverty rate of 0.0%, which includes 0 families.
| Children | Above Poverty | Below Poverty |
| No Children | 226 (100.0%) | 0 (0.0%) |
| 1 or 2 Children | 21 (55.3%) | 17 (44.7%) |
| 3 or 4 Children | 0 (0.0%) | 0 (0.0%) |
| 5 or more Children | 0 (0.0%) | 0 (0.0%) |
| Total | 247 (93.6%) | 17 (6.4%) |
Income Below Poverty Among Single-Parent Households in Franklin Furnace
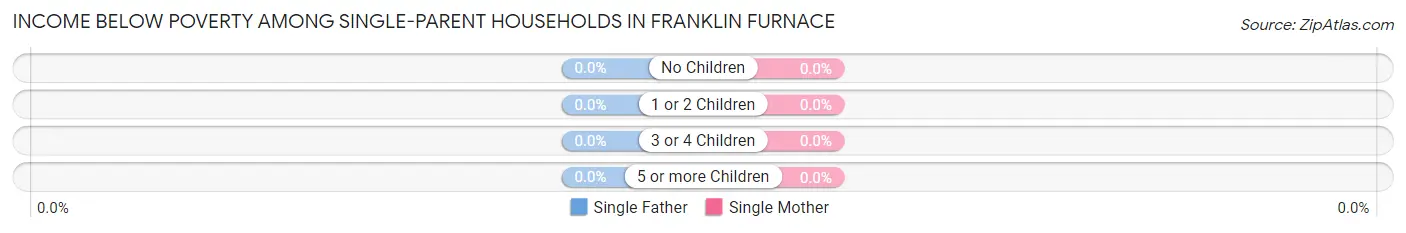
| Children | Single Father | Single Mother |
| No Children | 0 (0.0%) | 0 (0.0%) |
| 1 or 2 Children | 0 (0.0%) | 0 (0.0%) |
| 3 or 4 Children | 0 (0.0%) | 0 (0.0%) |
| 5 or more Children | 0 (0.0%) | 0 (0.0%) |
| Total | 0 (0.0%) | 0 (0.0%) |
Income Below Poverty Among Married-Couple vs Single-Parent Households in Franklin Furnace
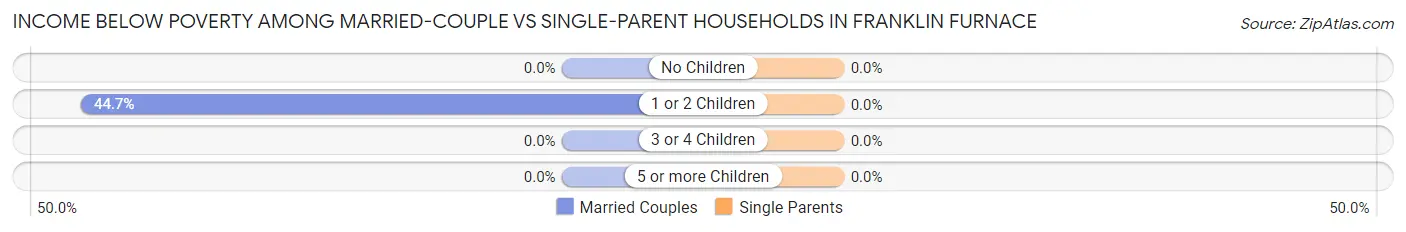
| Children | Married-Couple Families | Single-Parent Households |
| No Children | 0 (0.0%) | 0 (0.0%) |
| 1 or 2 Children | 17 (44.7%) | 0 (0.0%) |
| 3 or 4 Children | 0 (0.0%) | 0 (0.0%) |
| 5 or more Children | 0 (0.0%) | 0 (0.0%) |
| Total | 17 (6.4%) | 0 (0.0%) |
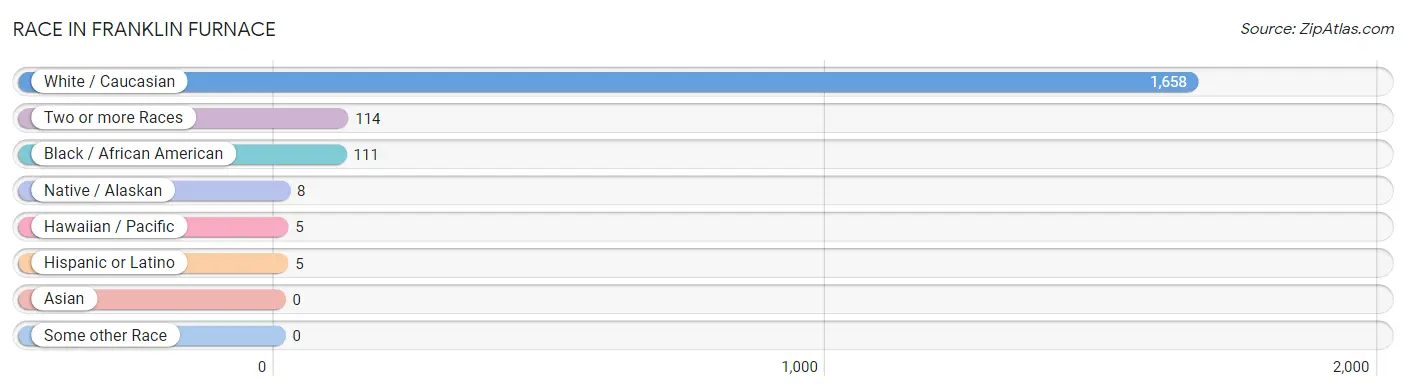
Race in Franklin Furnace
The most populous races in Franklin Furnace are White / Caucasian (1,658 | 87.5%), Two or more Races (114 | 6.0%), and Black / African American (111 | 5.9%).
| Race | # Population | % Population |
| Asian | 0 | 0.0% |
| Black / African American | 111 | 5.9% |
| Hawaiian / Pacific | 5 | 0.3% |
| Hispanic or Latino | 5 | 0.3% |
| Native / Alaskan | 8 | 0.4% |
| White / Caucasian | 1,658 | 87.5% |
| Two or more Races | 114 | 6.0% |
| Some other Race | 0 | 0.0% |
| Total | 1,896 | 100.0% |
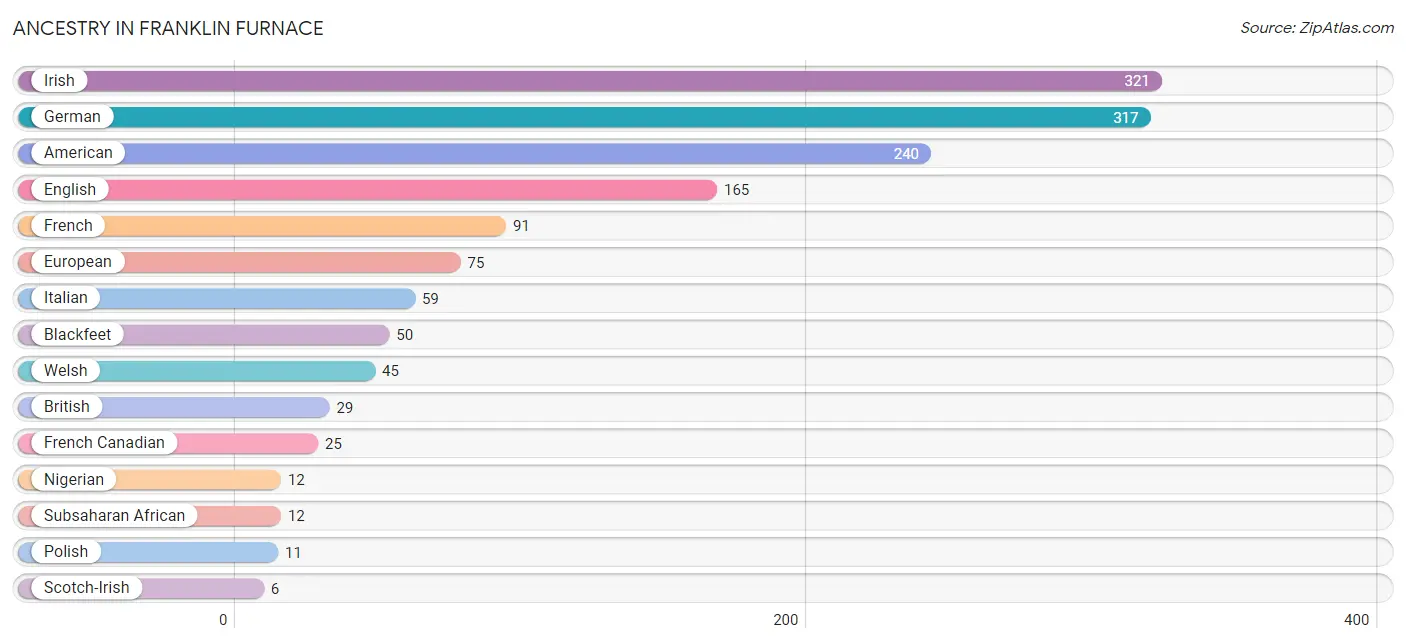
Ancestry in Franklin Furnace
The most populous ancestries reported in Franklin Furnace are Irish (321 | 16.9%), German (317 | 16.7%), American (240 | 12.7%), English (165 | 8.7%), and French (91 | 4.8%), together accounting for 59.8% of all Franklin Furnace residents.
| Ancestry | # Population | % Population |
| American | 240 | 12.7% |
| Blackfeet | 50 | 2.6% |
| British | 29 | 1.5% |
| Cherokee | 5 | 0.3% |
| Cuban | 5 | 0.3% |
| English | 165 | 8.7% |
| European | 75 | 4.0% |
| French | 91 | 4.8% |
| French Canadian | 25 | 1.3% |
| German | 317 | 16.7% |
| Irish | 321 | 16.9% |
| Italian | 59 | 3.1% |
| Native Hawaiian | 5 | 0.3% |
| Nigerian | 12 | 0.6% |
| Polish | 11 | 0.6% |
| Scotch-Irish | 6 | 0.3% |
| Scottish | 6 | 0.3% |
| Subsaharan African | 12 | 0.6% |
| Welsh | 45 | 2.4% | View All 19 Rows |
Immigrants in Franklin Furnace

| Immigration Origin | # Population | % Population | View All 0 Rows |
Sex and Age in Franklin Furnace
Sex and Age in Franklin Furnace
The most populous age groups in Franklin Furnace are 30 to 34 Years (147 | 13.6%) for men and 55 to 59 Years (133 | 16.3%) for women.
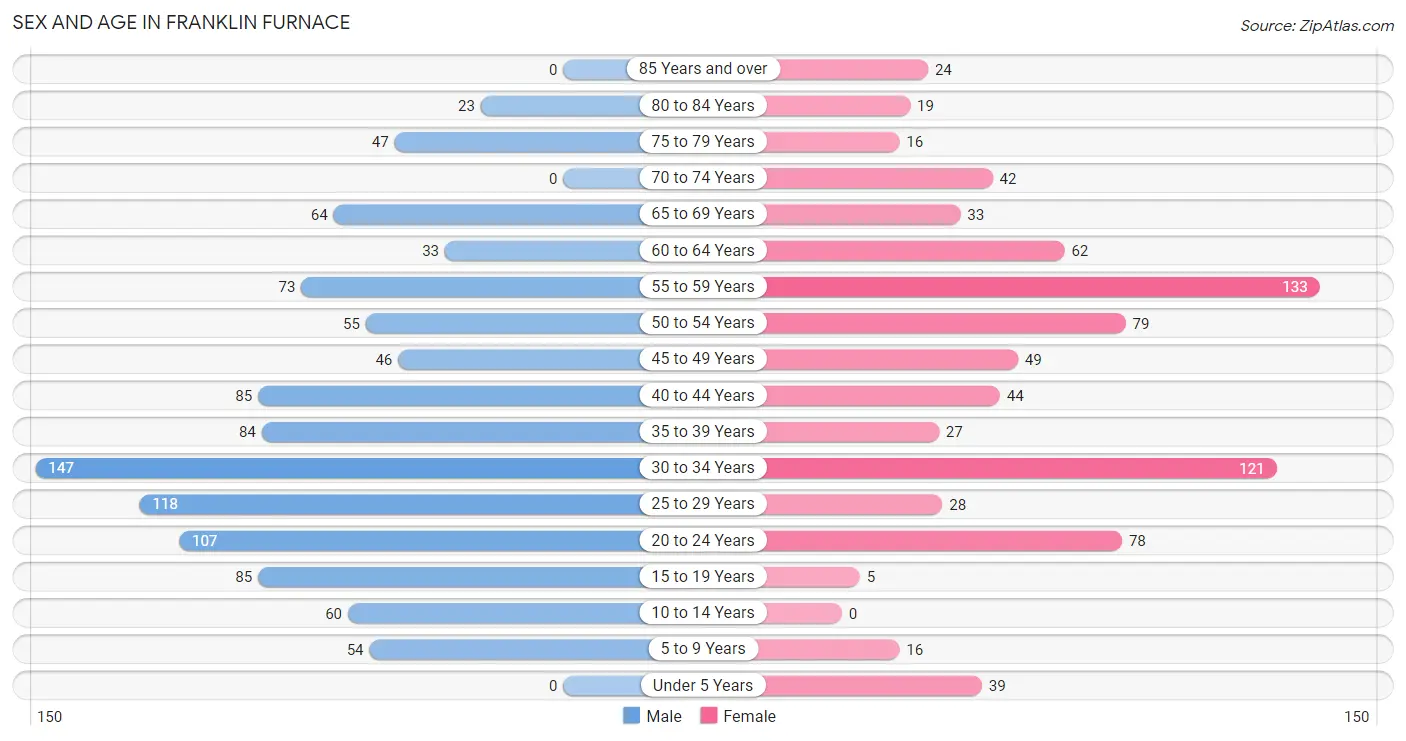
| Age Bracket | Male | Female |
| Under 5 Years | 0 (0.0%) | 39 (4.8%) |
| 5 to 9 Years | 54 (5.0%) | 16 (2.0%) |
| 10 to 14 Years | 60 (5.6%) | 0 (0.0%) |
| 15 to 19 Years | 85 (7.9%) | 5 (0.6%) |
| 20 to 24 Years | 107 (9.9%) | 78 (9.6%) |
| 25 to 29 Years | 118 (10.9%) | 28 (3.4%) |
| 30 to 34 Years | 147 (13.6%) | 121 (14.8%) |
| 35 to 39 Years | 84 (7.8%) | 27 (3.3%) |
| 40 to 44 Years | 85 (7.9%) | 44 (5.4%) |
| 45 to 49 Years | 46 (4.3%) | 49 (6.0%) |
| 50 to 54 Years | 55 (5.1%) | 79 (9.7%) |
| 55 to 59 Years | 73 (6.8%) | 133 (16.3%) |
| 60 to 64 Years | 33 (3.0%) | 62 (7.6%) |
| 65 to 69 Years | 64 (5.9%) | 33 (4.1%) |
| 70 to 74 Years | 0 (0.0%) | 42 (5.1%) |
| 75 to 79 Years | 47 (4.3%) | 16 (2.0%) |
| 80 to 84 Years | 23 (2.1%) | 19 (2.3%) |
| 85 Years and over | 0 (0.0%) | 24 (2.9%) |
| Total | 1,081 (100.0%) | 815 (100.0%) |
Families and Households in Franklin Furnace
Median Family Size in Franklin Furnace
The median family size in Franklin Furnace is 2.83 persons per family, with single male/father families (81 | 19.7%) accounting for the largest median family size of 3.12 persons per family. On the other hand, single female/mother families (66 | 16.1%) represent the smallest median family size with 2.32 persons per family.
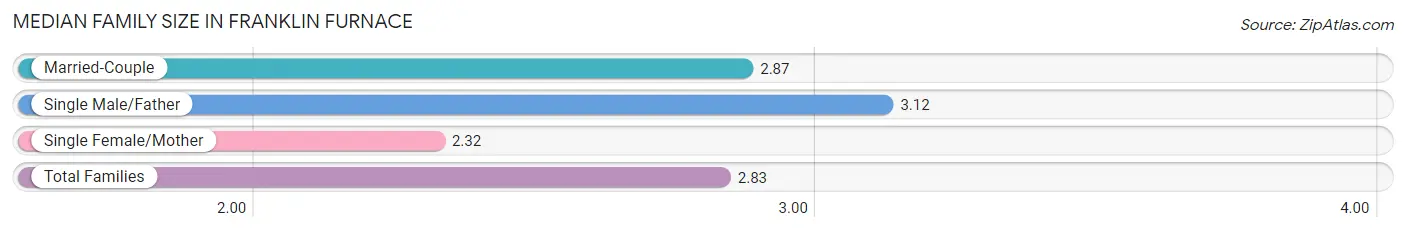
| Family Type | # Families | Family Size |
| Married-Couple | 264 (64.2%) | 2.87 |
| Single Male/Father | 81 (19.7%) | 3.12 |
| Single Female/Mother | 66 (16.1%) | 2.32 |
| Total Families | 411 (100.0%) | 2.83 |
Median Household Size in Franklin Furnace
The median household size in Franklin Furnace is 2.44 persons per household, with single male/father households (81 | 13.0%) accounting for the largest median household size of 3.85 persons per household. non-family households (211 | 33.9%) represent the smallest median household size with 1.11 persons per household.
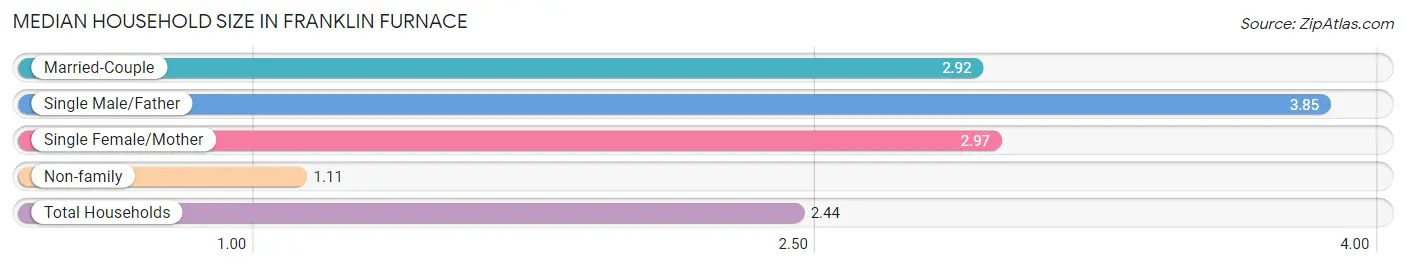
| Household Type | # Households | Household Size |
| Married-Couple | 264 (42.4%) | 2.92 |
| Single Male/Father | 81 (13.0%) | 3.85 |
| Single Female/Mother | 66 (10.6%) | 2.97 |
| Non-family | 211 (33.9%) | 1.11 |
| Total Households | 622 (100.0%) | 2.44 |
Household Size by Marriage Status in Franklin Furnace
Out of a total of 622 households in Franklin Furnace, 411 (66.1%) are family households, while 211 (33.9%) are nonfamily households. The most numerous type of family households are 2-person households, comprising 173, and the most common type of nonfamily households are 1-person households, comprising 195.
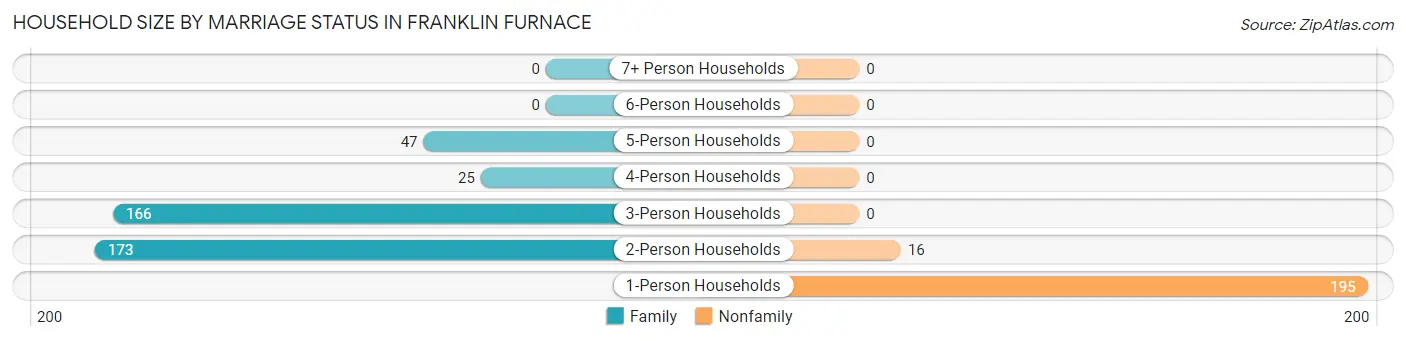
| Household Size | Family Households | Nonfamily Households |
| 1-Person Households | - | 195 (31.4%) |
| 2-Person Households | 173 (27.8%) | 16 (2.6%) |
| 3-Person Households | 166 (26.7%) | 0 (0.0%) |
| 4-Person Households | 25 (4.0%) | 0 (0.0%) |
| 5-Person Households | 47 (7.6%) | 0 (0.0%) |
| 6-Person Households | 0 (0.0%) | 0 (0.0%) |
| 7+ Person Households | 0 (0.0%) | 0 (0.0%) |
| Total | 411 (66.1%) | 211 (33.9%) |
Female Fertility in Franklin Furnace
Fertility by Age in Franklin Furnace
| Age Bracket | Women with Births | Births / 1,000 Women |
| 15 to 19 years | 0 (0.0%) | 0.0 |
| 20 to 34 years | 0 (0.0%) | 0.0 |
| 35 to 50 years | 0 (0.0%) | 0.0 |
| Total | 0 (0.0%) | 0.0 |
Fertility by Age by Marriage Status in Franklin Furnace
| Age Bracket | Married | Unmarried |
| 15 to 19 years | 0 (0.0%) | 0 (0.0%) |
| 20 to 34 years | 0 (0.0%) | 0 (0.0%) |
| 35 to 50 years | 0 (0.0%) | 0 (0.0%) |
| Total | 0 (0.0%) | 0 (0.0%) |
Fertility by Education in Franklin Furnace
| Educational Attainment | Women with Births | Births / 1,000 Women |
| Less than High School | 0 (0.0%) | 0.0 |
| High School Diploma | 0 (0.0%) | 0.0 |
| College or Associate's Degree | 0 (0.0%) | 0.0 |
| Bachelor's Degree | 0 (0.0%) | 0.0 |
| Graduate Degree | 0 (0.0%) | 0.0 |
| Total | 0 (0.0%) | 0.0 |
Fertility by Education by Marriage Status in Franklin Furnace
| Educational Attainment | Married | Unmarried |
| Less than High School | 0 (0.0%) | 0 (0.0%) |
| High School Diploma | 0 (0.0%) | 0 (0.0%) |
| College or Associate's Degree | 0 (0.0%) | 0 (0.0%) |
| Bachelor's Degree | 0 (0.0%) | 0 (0.0%) |
| Graduate Degree | 0 (0.0%) | 0 (0.0%) |
| Total | 0 (0.0%) | 0 (0.0%) |
Employment Characteristics in Franklin Furnace
Employment by Class of Employer in Franklin Furnace
Among the 580 employed individuals in Franklin Furnace, private company employees (377 | 65.0%), not-for-profit organizations (58 | 10.0%), and state government employees (43 | 7.4%) make up the most common classes of employment.
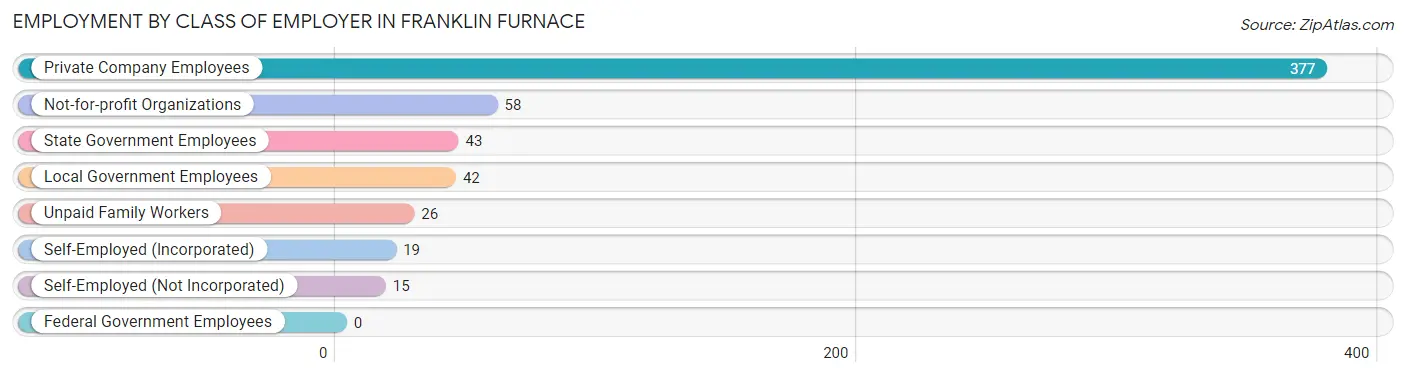
| Employer Class | # Employees | % Employees |
| Private Company Employees | 377 | 65.0% |
| Self-Employed (Incorporated) | 19 | 3.3% |
| Self-Employed (Not Incorporated) | 15 | 2.6% |
| Not-for-profit Organizations | 58 | 10.0% |
| Local Government Employees | 42 | 7.2% |
| State Government Employees | 43 | 7.4% |
| Federal Government Employees | 0 | 0.0% |
| Unpaid Family Workers | 26 | 4.5% |
| Total | 580 | 100.0% |
Employment Status by Age in Franklin Furnace
According to the labor force statistics for Franklin Furnace, out of the total population over 16 years of age (1,679), 35.8% or 601 individuals are in the labor force, with 2.5% or 15 of them unemployed. The age group with the highest labor force participation rate is 20 to 24 years, with 56.8% or 105 individuals in the labor force. Within the labor force, the 16 to 19 years age range has the highest percentage of unemployed individuals, with 100.0% or 15 of them being unemployed.
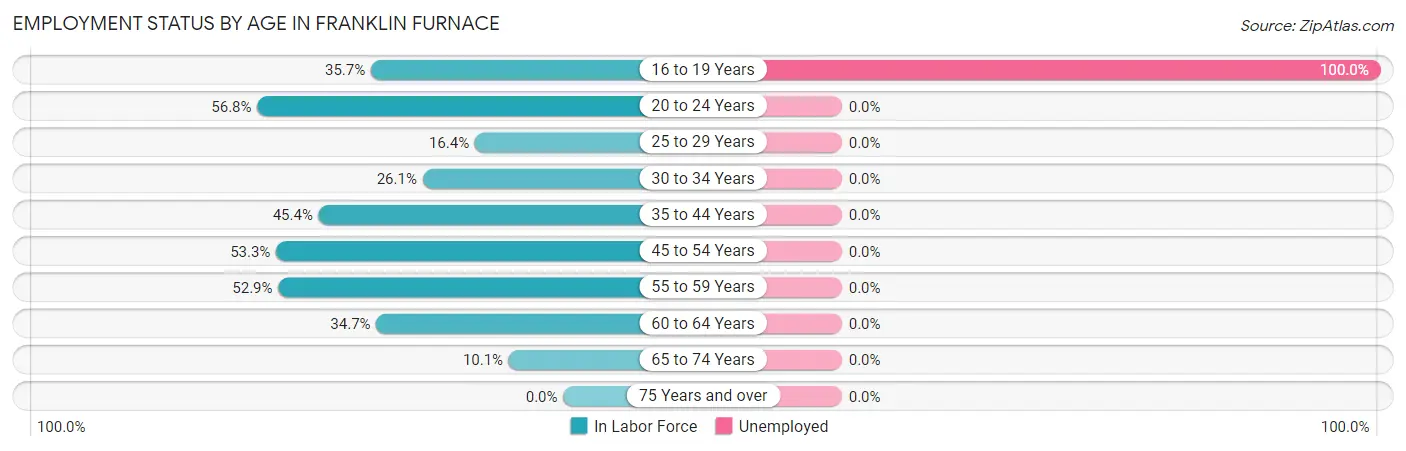
| Age Bracket | In Labor Force | Unemployed |
| 16 to 19 Years | 15 (35.7%) | 15 (100.0%) |
| 20 to 24 Years | 105 (56.8%) | 0 (0.0%) |
| 25 to 29 Years | 24 (16.4%) | 0 (0.0%) |
| 30 to 34 Years | 70 (26.1%) | 0 (0.0%) |
| 35 to 44 Years | 109 (45.4%) | 0 (0.0%) |
| 45 to 54 Years | 122 (53.3%) | 0 (0.0%) |
| 55 to 59 Years | 109 (52.9%) | 0 (0.0%) |
| 60 to 64 Years | 33 (34.7%) | 0 (0.0%) |
| 65 to 74 Years | 14 (10.1%) | 0 (0.0%) |
| 75 Years and over | 0 (0.0%) | 0 (0.0%) |
| Total | 601 (35.8%) | 15 (2.5%) |
Employment Status by Educational Attainment in Franklin Furnace
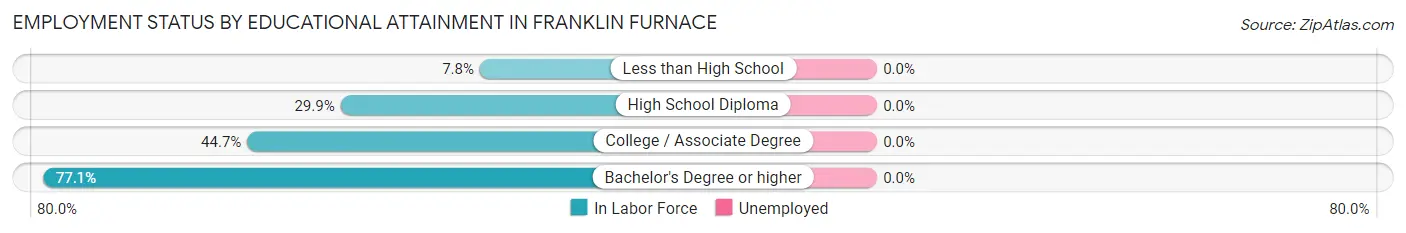
| Educational Attainment | In Labor Force | Unemployed |
| Less than High School | 10 (7.8%) | 0 (0.0%) |
| High School Diploma | 156 (29.9%) | 0 (0.0%) |
| College / Associate Degree | 153 (44.7%) | 0 (0.0%) |
| Bachelor's Degree or higher | 148 (77.1%) | 0 (0.0%) |
| Total | 466 (39.4%) | 0 (0.0%) |
Employment Occupations by Sex in Franklin Furnace
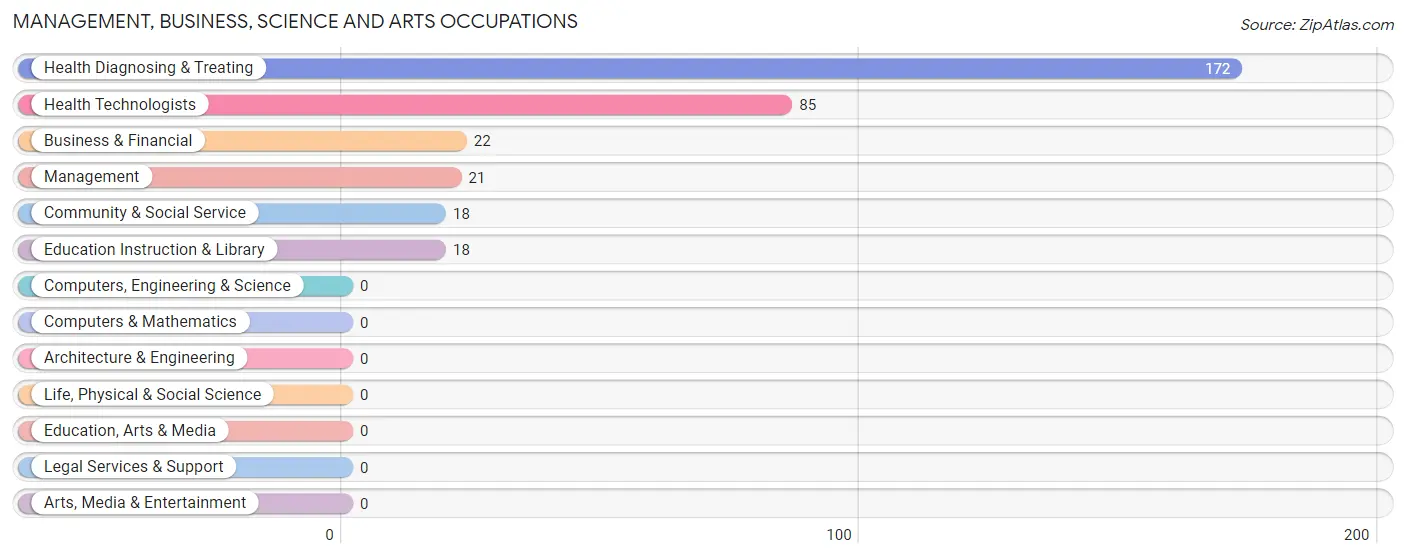
Management, Business, Science and Arts Occupations
The most common Management, Business, Science and Arts occupations in Franklin Furnace are Health Diagnosing & Treating (172 | 29.3%), Health Technologists (85 | 14.5%), Business & Financial (22 | 3.7%), Management (21 | 3.6%), and Community & Social Service (18 | 3.1%).
Management, Business, Science and Arts Occupations by Sex
Within the Management, Business, Science and Arts occupations in Franklin Furnace, the most male-oriented occupations are Business & Financial (86.4%), Management (52.4%), and Health Technologists (12.9%), while the most female-oriented occupations are Community & Social Service (100.0%), Education Instruction & Library (100.0%), and Health Diagnosing & Treating (93.6%).
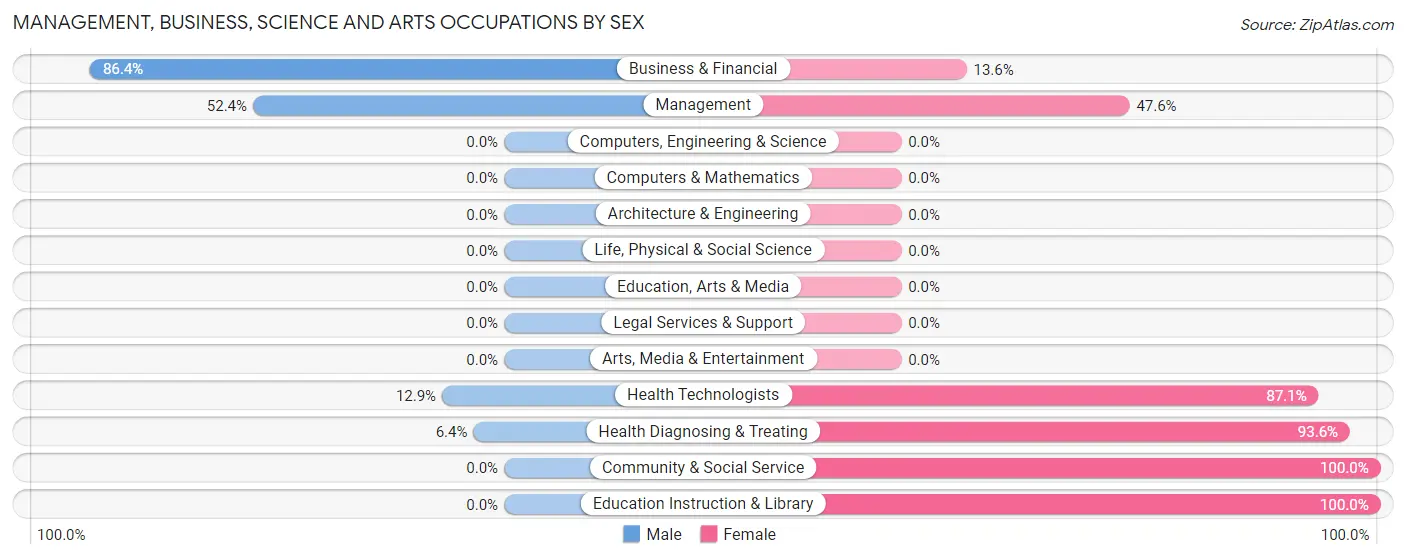
| Occupation | Male | Female |
| Management | 11 (52.4%) | 10 (47.6%) |
| Business & Financial | 19 (86.4%) | 3 (13.6%) |
| Computers, Engineering & Science | 0 (0.0%) | 0 (0.0%) |
| Computers & Mathematics | 0 (0.0%) | 0 (0.0%) |
| Architecture & Engineering | 0 (0.0%) | 0 (0.0%) |
| Life, Physical & Social Science | 0 (0.0%) | 0 (0.0%) |
| Community & Social Service | 0 (0.0%) | 18 (100.0%) |
| Education, Arts & Media | 0 (0.0%) | 0 (0.0%) |
| Legal Services & Support | 0 (0.0%) | 0 (0.0%) |
| Education Instruction & Library | 0 (0.0%) | 18 (100.0%) |
| Arts, Media & Entertainment | 0 (0.0%) | 0 (0.0%) |
| Health Diagnosing & Treating | 11 (6.4%) | 161 (93.6%) |
| Health Technologists | 11 (12.9%) | 74 (87.1%) |
| Total (Category) | 41 (17.6%) | 192 (82.4%) |
| Total (Overall) | 242 (41.3%) | 344 (58.7%) |
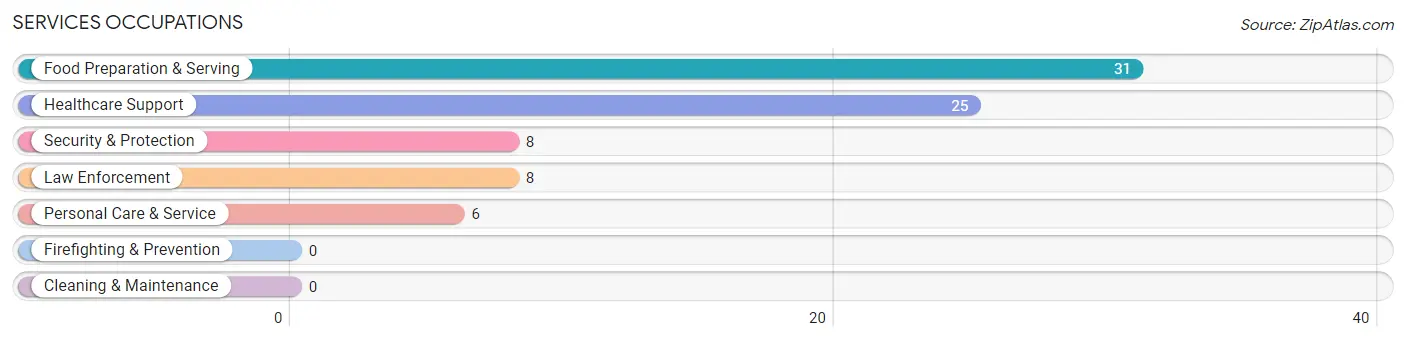
Services Occupations
The most common Services occupations in Franklin Furnace are Food Preparation & Serving (31 | 5.3%), Healthcare Support (25 | 4.3%), Security & Protection (8 | 1.4%), Law Enforcement (8 | 1.4%), and Personal Care & Service (6 | 1.0%).
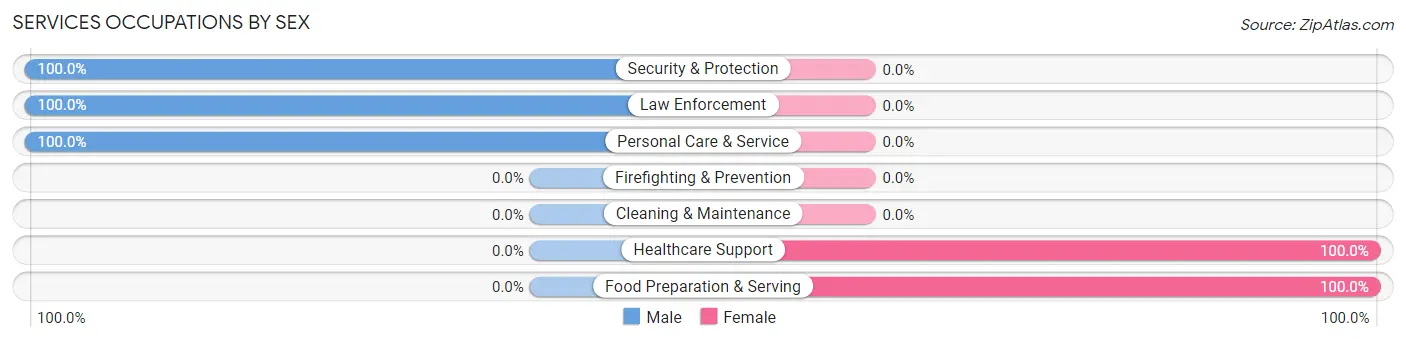
Services Occupations by Sex
Within the Services occupations in Franklin Furnace, the most male-oriented occupations are Security & Protection (100.0%), Law Enforcement (100.0%), and Personal Care & Service (100.0%), while the most female-oriented occupations are Healthcare Support (100.0%), and Food Preparation & Serving (100.0%).
| Occupation | Male | Female |
| Healthcare Support | 0 (0.0%) | 25 (100.0%) |
| Security & Protection | 8 (100.0%) | 0 (0.0%) |
| Firefighting & Prevention | 0 (0.0%) | 0 (0.0%) |
| Law Enforcement | 8 (100.0%) | 0 (0.0%) |
| Food Preparation & Serving | 0 (0.0%) | 31 (100.0%) |
| Cleaning & Maintenance | 0 (0.0%) | 0 (0.0%) |
| Personal Care & Service | 6 (100.0%) | 0 (0.0%) |
| Total (Category) | 14 (20.0%) | 56 (80.0%) |
| Total (Overall) | 242 (41.3%) | 344 (58.7%) |
Sales and Office Occupations
The most common Sales and Office occupations in Franklin Furnace are , and Office & Administration (109 | 18.6%).
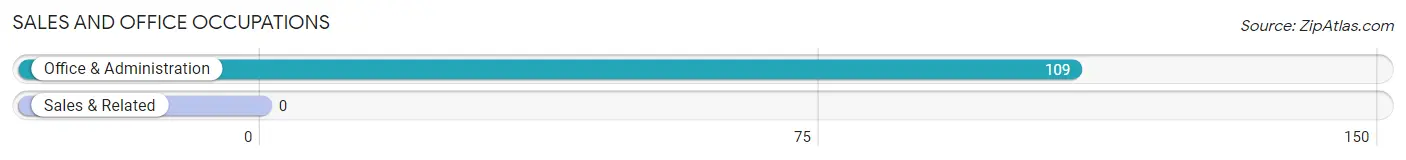
Sales and Office Occupations by Sex
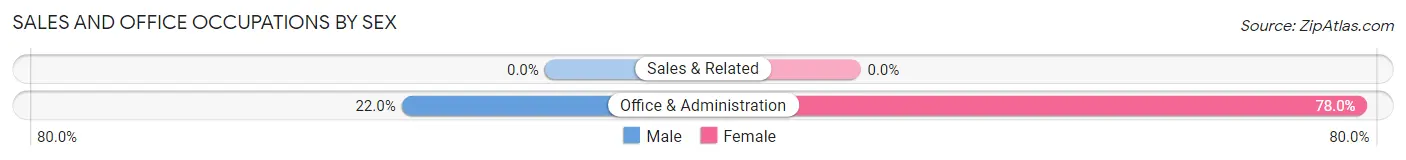
| Occupation | Male | Female |
| Sales & Related | 0 (0.0%) | 0 (0.0%) |
| Office & Administration | 24 (22.0%) | 85 (78.0%) |
| Total (Category) | 24 (22.0%) | 85 (78.0%) |
| Total (Overall) | 242 (41.3%) | 344 (58.7%) |
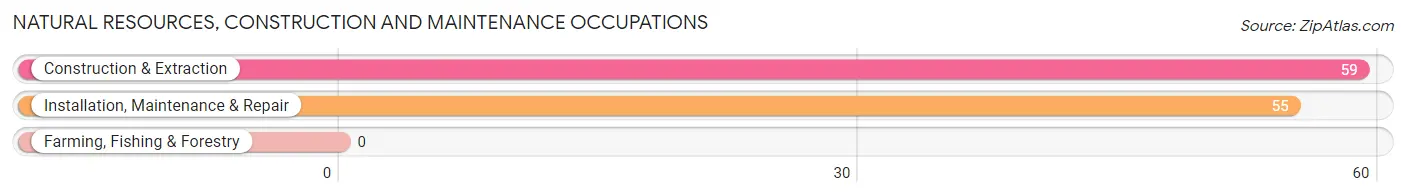
Natural Resources, Construction and Maintenance Occupations
The most common Natural Resources, Construction and Maintenance occupations in Franklin Furnace are Construction & Extraction (59 | 10.1%), and Installation, Maintenance & Repair (55 | 9.4%).
Natural Resources, Construction and Maintenance Occupations by Sex
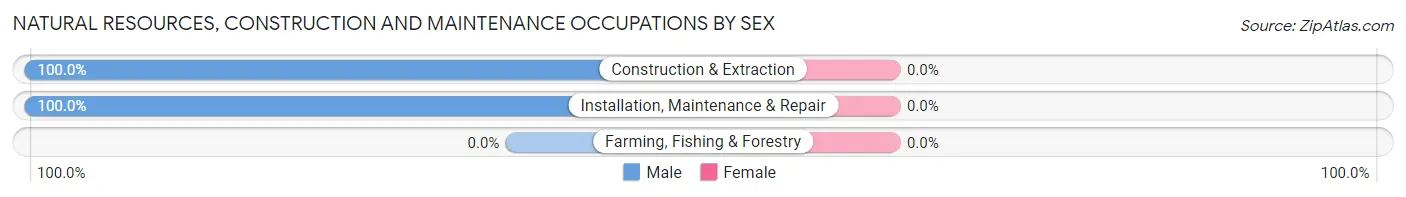
| Occupation | Male | Female |
| Farming, Fishing & Forestry | 0 (0.0%) | 0 (0.0%) |
| Construction & Extraction | 59 (100.0%) | 0 (0.0%) |
| Installation, Maintenance & Repair | 55 (100.0%) | 0 (0.0%) |
| Total (Category) | 114 (100.0%) | 0 (0.0%) |
| Total (Overall) | 242 (41.3%) | 344 (58.7%) |
Production, Transportation and Moving Occupations
The most common Production, Transportation and Moving occupations in Franklin Furnace are Transportation (26 | 4.4%), Material Moving (25 | 4.3%), and Production (9 | 1.5%).
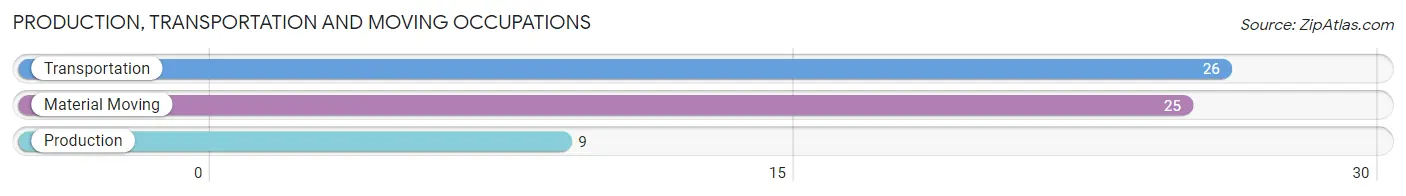
Production, Transportation and Moving Occupations by Sex
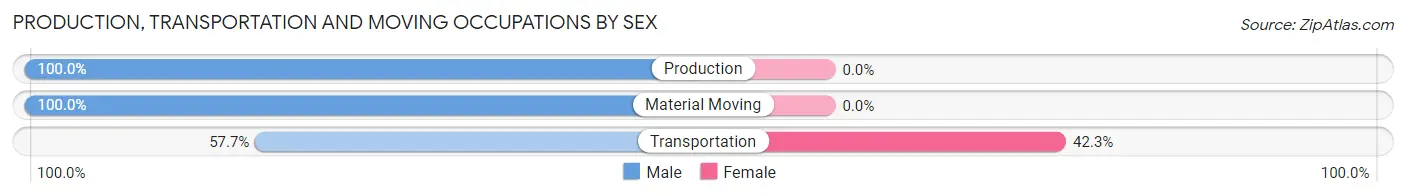
| Occupation | Male | Female |
| Production | 9 (100.0%) | 0 (0.0%) |
| Transportation | 15 (57.7%) | 11 (42.3%) |
| Material Moving | 25 (100.0%) | 0 (0.0%) |
| Total (Category) | 49 (81.7%) | 11 (18.3%) |
| Total (Overall) | 242 (41.3%) | 344 (58.7%) |
Employment Industries by Sex in Franklin Furnace
Employment Industries in Franklin Furnace
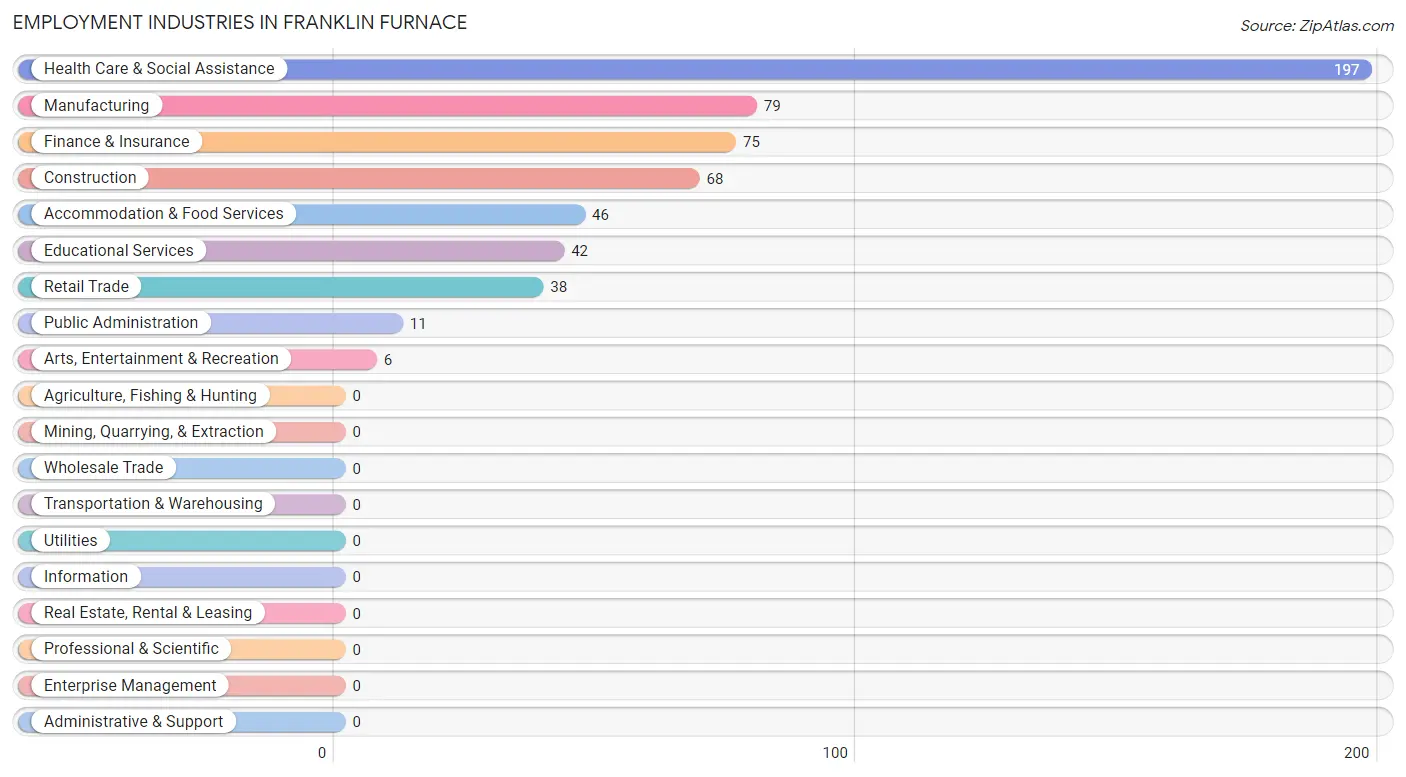
The major employment industries in Franklin Furnace include Health Care & Social Assistance (197 | 33.6%), Manufacturing (79 | 13.5%), Finance & Insurance (75 | 12.8%), Construction (68 | 11.6%), and Accommodation & Food Services (46 | 7.9%).
Employment Industries by Sex in Franklin Furnace
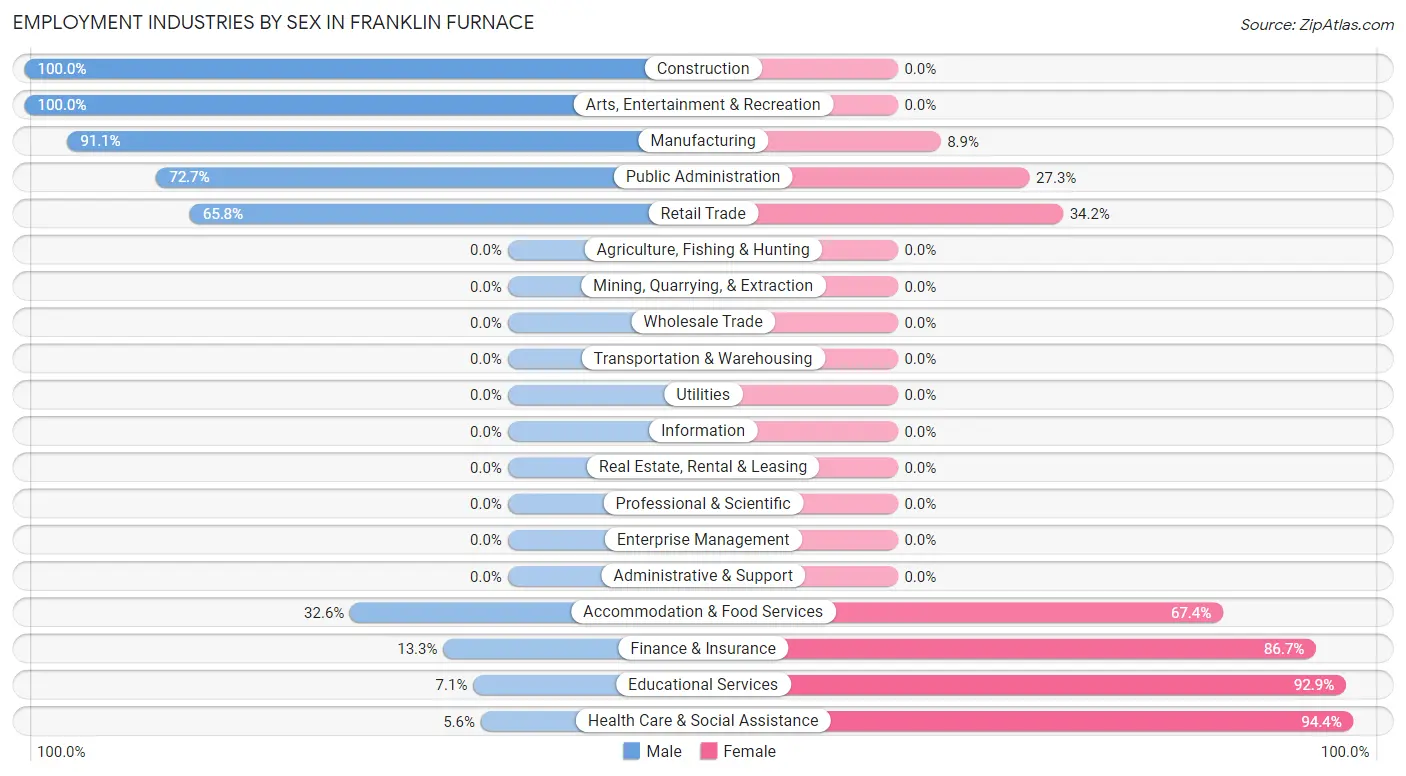
The Franklin Furnace industries that see more men than women are Construction (100.0%), Arts, Entertainment & Recreation (100.0%), and Manufacturing (91.1%), whereas the industries that tend to have a higher number of women are Health Care & Social Assistance (94.4%), Educational Services (92.9%), and Finance & Insurance (86.7%).
| Industry | Male | Female |
| Agriculture, Fishing & Hunting | 0 (0.0%) | 0 (0.0%) |
| Mining, Quarrying, & Extraction | 0 (0.0%) | 0 (0.0%) |
| Construction | 68 (100.0%) | 0 (0.0%) |
| Manufacturing | 72 (91.1%) | 7 (8.9%) |
| Wholesale Trade | 0 (0.0%) | 0 (0.0%) |
| Retail Trade | 25 (65.8%) | 13 (34.2%) |
| Transportation & Warehousing | 0 (0.0%) | 0 (0.0%) |
| Utilities | 0 (0.0%) | 0 (0.0%) |
| Information | 0 (0.0%) | 0 (0.0%) |
| Finance & Insurance | 10 (13.3%) | 65 (86.7%) |
| Real Estate, Rental & Leasing | 0 (0.0%) | 0 (0.0%) |
| Professional & Scientific | 0 (0.0%) | 0 (0.0%) |
| Enterprise Management | 0 (0.0%) | 0 (0.0%) |
| Administrative & Support | 0 (0.0%) | 0 (0.0%) |
| Educational Services | 3 (7.1%) | 39 (92.9%) |
| Health Care & Social Assistance | 11 (5.6%) | 186 (94.4%) |
| Arts, Entertainment & Recreation | 6 (100.0%) | 0 (0.0%) |
| Accommodation & Food Services | 15 (32.6%) | 31 (67.4%) |
| Public Administration | 8 (72.7%) | 3 (27.3%) |
| Total | 242 (41.3%) | 344 (58.7%) |
Education in Franklin Furnace
School Enrollment in Franklin Furnace
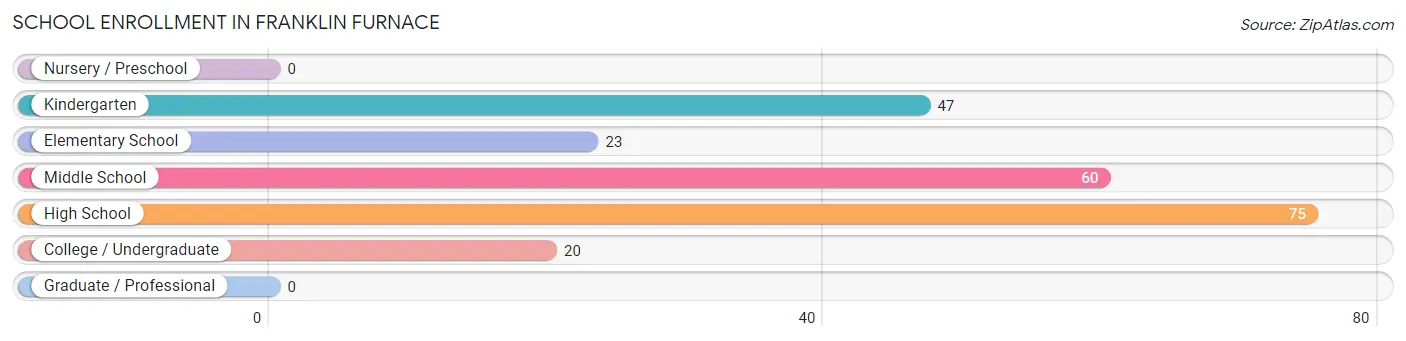
The most common levels of schooling among the 225 students in Franklin Furnace are high school (75 | 33.3%), middle school (60 | 26.7%), and kindergarten (47 | 20.9%).
| School Level | # Students | % Students |
| Nursery / Preschool | 0 | 0.0% |
| Kindergarten | 47 | 20.9% |
| Elementary School | 23 | 10.2% |
| Middle School | 60 | 26.7% |
| High School | 75 | 33.3% |
| College / Undergraduate | 20 | 8.9% |
| Graduate / Professional | 0 | 0.0% |
| Total | 225 | 100.0% |
School Enrollment by Age by Funding Source in Franklin Furnace
Out of a total of 225 students who are enrolled in schools in Franklin Furnace, 5 (2.2%) attend a private institution, while the remaining 220 (97.8%) are enrolled in public schools. The age group of 18 to 19 year olds has the highest likelihood of being enrolled in private schools, with 5 (100.0% in the age bracket) enrolled. Conversely, the age group of 5 to 9 year old has the lowest likelihood of being enrolled in a private school, with 70 (100.0% in the age bracket) attending a public institution.
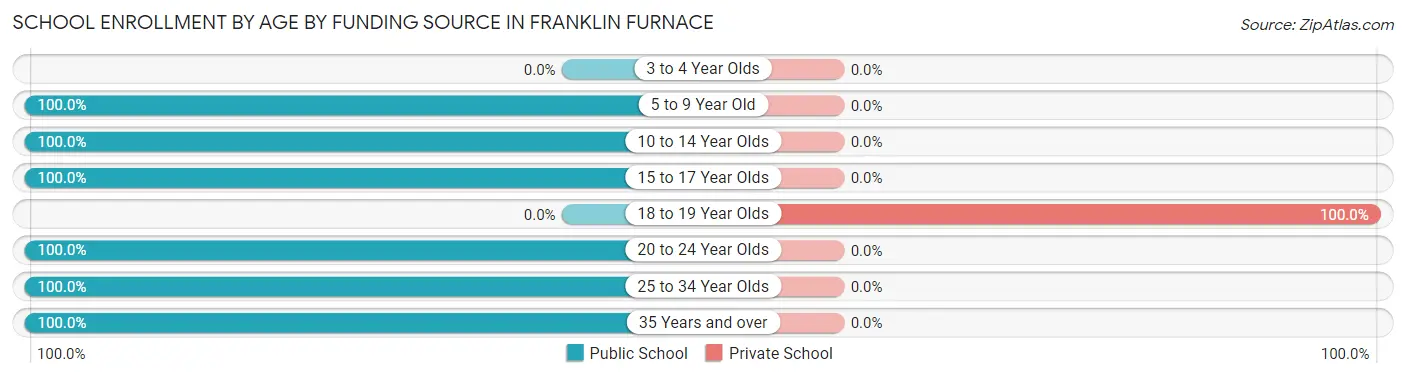
| Age Bracket | Public School | Private School |
| 3 to 4 Year Olds | 0 (0.0%) | 0 (0.0%) |
| 5 to 9 Year Old | 70 (100.0%) | 0 (0.0%) |
| 10 to 14 Year Olds | 60 (100.0%) | 0 (0.0%) |
| 15 to 17 Year Olds | 65 (100.0%) | 0 (0.0%) |
| 18 to 19 Year Olds | 0 (0.0%) | 5 (100.0%) |
| 20 to 24 Year Olds | 6 (100.0%) | 0 (0.0%) |
| 25 to 34 Year Olds | 5 (100.0%) | 0 (0.0%) |
| 35 Years and over | 14 (100.0%) | 0 (0.0%) |
| Total | 220 (97.8%) | 5 (2.2%) |
Educational Attainment by Field of Study in Franklin Furnace
Business (47 | 18.4%), science & technology (41 | 16.1%), communications (32 | 12.6%), bio, nature & agricultural (27 | 10.6%), and liberal arts & history (25 | 9.8%) are the most common fields of study among 255 individuals in Franklin Furnace who have obtained a bachelor's degree or higher.
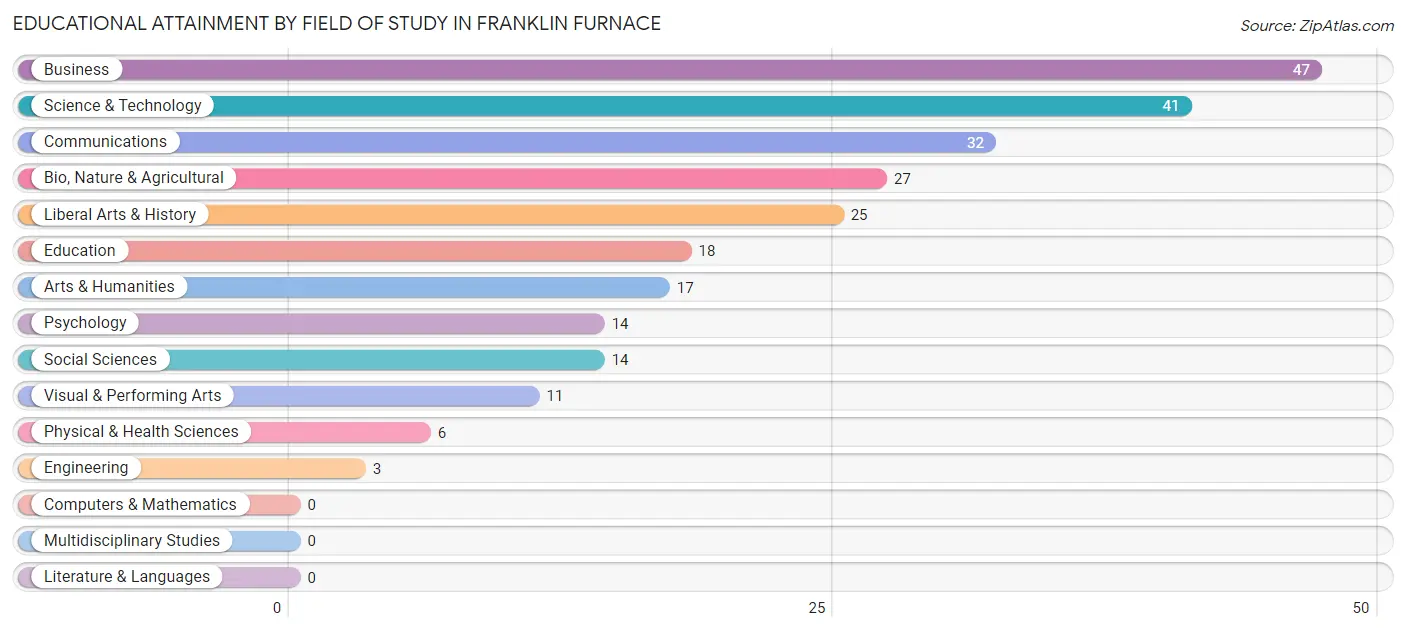
| Field of Study | # Graduates | % Graduates |
| Computers & Mathematics | 0 | 0.0% |
| Bio, Nature & Agricultural | 27 | 10.6% |
| Physical & Health Sciences | 6 | 2.4% |
| Psychology | 14 | 5.5% |
| Social Sciences | 14 | 5.5% |
| Engineering | 3 | 1.2% |
| Multidisciplinary Studies | 0 | 0.0% |
| Science & Technology | 41 | 16.1% |
| Business | 47 | 18.4% |
| Education | 18 | 7.1% |
| Literature & Languages | 0 | 0.0% |
| Liberal Arts & History | 25 | 9.8% |
| Visual & Performing Arts | 11 | 4.3% |
| Communications | 32 | 12.6% |
| Arts & Humanities | 17 | 6.7% |
| Total | 255 | 100.0% |
Transportation & Commute in Franklin Furnace
Vehicle Availability by Sex in Franklin Furnace
The most prevalent vehicle ownership categories in Franklin Furnace are males with 3 vehicles (131, accounting for 55.5%) and females with 3 vehicles (160, making up 38.1%).
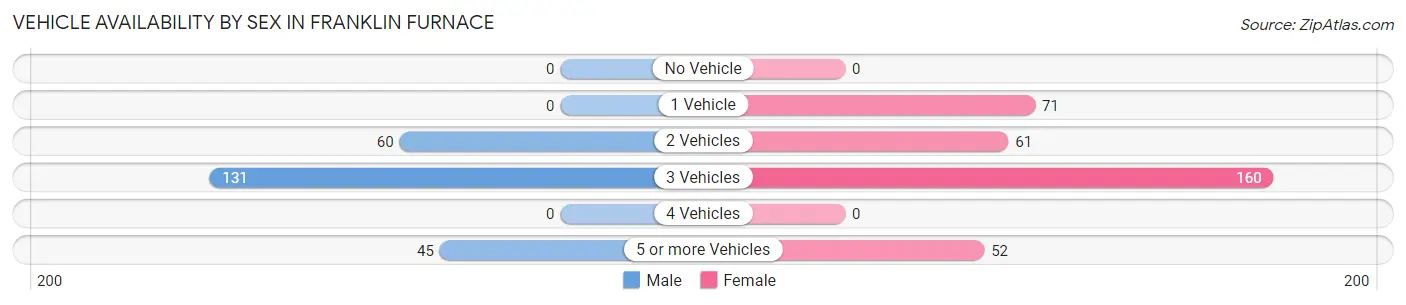
| Vehicles Available | Male | Female |
| No Vehicle | 0 (0.0%) | 0 (0.0%) |
| 1 Vehicle | 0 (0.0%) | 71 (20.6%) |
| 2 Vehicles | 60 (25.4%) | 61 (17.7%) |
| 3 Vehicles | 131 (55.5%) | 160 (46.5%) |
| 4 Vehicles | 0 (0.0%) | 0 (0.0%) |
| 5 or more Vehicles | 45 (19.1%) | 52 (15.1%) |
| Total | 236 (100.0%) | 344 (100.0%) |
Commute Time in Franklin Furnace
The most frequently occuring commute durations in Franklin Furnace are 30 to 34 minutes (149 commuters, 27.1%), 5 to 9 minutes (82 commuters, 14.9%), and 15 to 19 minutes (72 commuters, 13.1%).
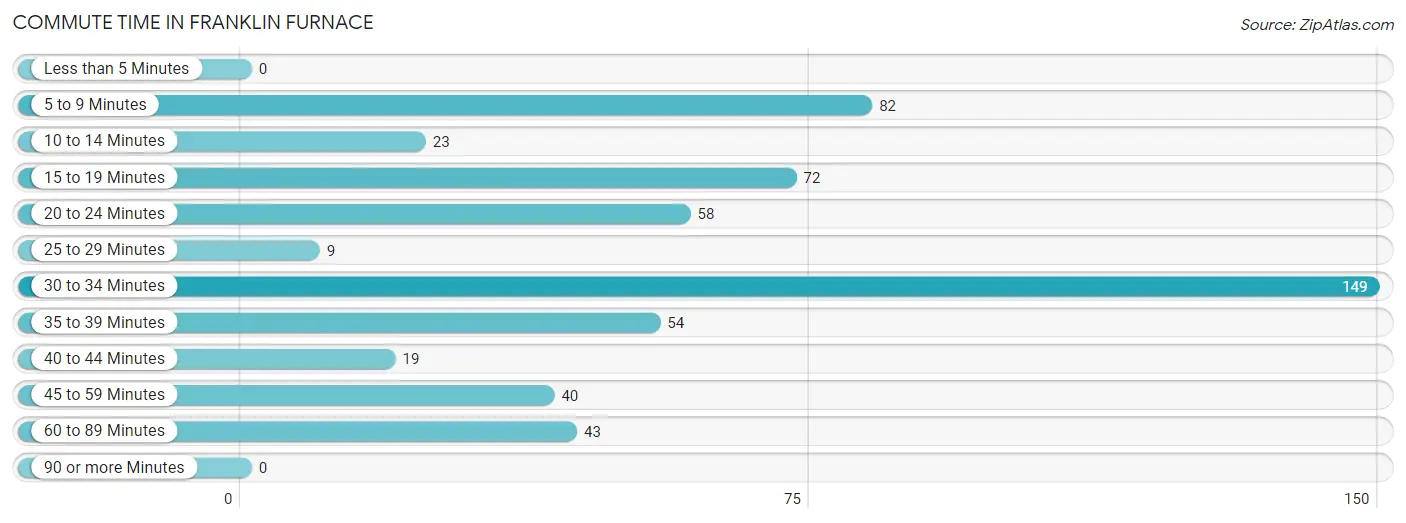
| Commute Time | # Commuters | % Commuters |
| Less than 5 Minutes | 0 | 0.0% |
| 5 to 9 Minutes | 82 | 14.9% |
| 10 to 14 Minutes | 23 | 4.2% |
| 15 to 19 Minutes | 72 | 13.1% |
| 20 to 24 Minutes | 58 | 10.6% |
| 25 to 29 Minutes | 9 | 1.6% |
| 30 to 34 Minutes | 149 | 27.1% |
| 35 to 39 Minutes | 54 | 9.8% |
| 40 to 44 Minutes | 19 | 3.5% |
| 45 to 59 Minutes | 40 | 7.3% |
| 60 to 89 Minutes | 43 | 7.8% |
| 90 or more Minutes | 0 | 0.0% |
Commute Time by Sex in Franklin Furnace
The most common commute times in Franklin Furnace are 5 to 9 minutes (56 commuters, 26.4%) for males and 30 to 34 minutes (132 commuters, 39.2%) for females.
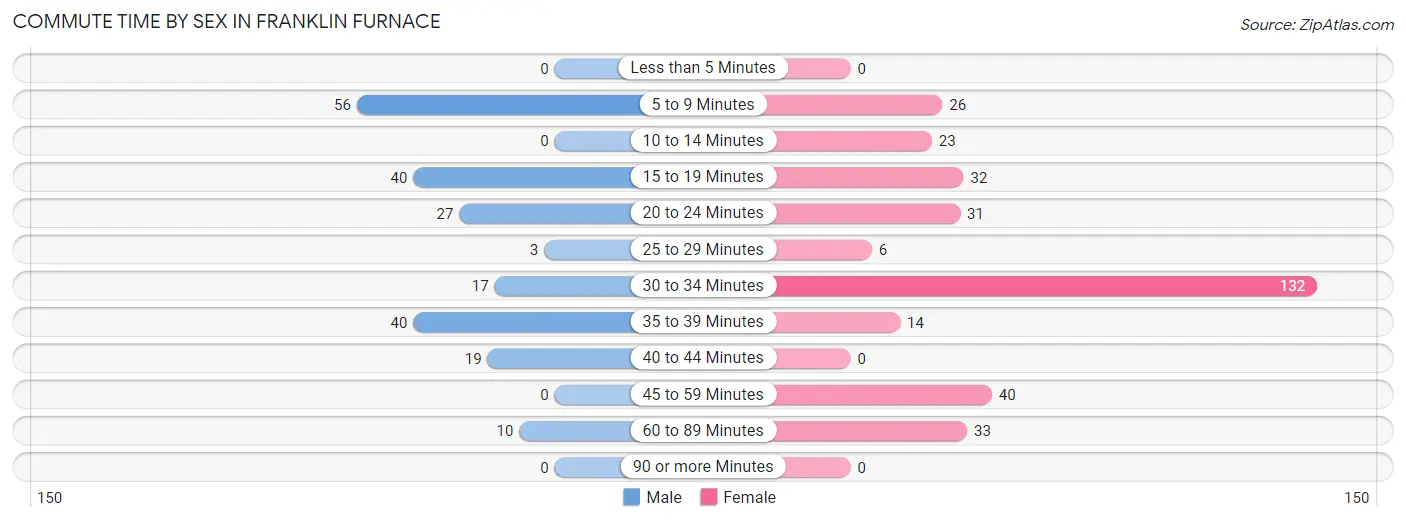
| Commute Time | Male | Female |
| Less than 5 Minutes | 0 (0.0%) | 0 (0.0%) |
| 5 to 9 Minutes | 56 (26.4%) | 26 (7.7%) |
| 10 to 14 Minutes | 0 (0.0%) | 23 (6.8%) |
| 15 to 19 Minutes | 40 (18.9%) | 32 (9.5%) |
| 20 to 24 Minutes | 27 (12.7%) | 31 (9.2%) |
| 25 to 29 Minutes | 3 (1.4%) | 6 (1.8%) |
| 30 to 34 Minutes | 17 (8.0%) | 132 (39.2%) |
| 35 to 39 Minutes | 40 (18.9%) | 14 (4.2%) |
| 40 to 44 Minutes | 19 (9.0%) | 0 (0.0%) |
| 45 to 59 Minutes | 0 (0.0%) | 40 (11.9%) |
| 60 to 89 Minutes | 10 (4.7%) | 33 (9.8%) |
| 90 or more Minutes | 0 (0.0%) | 0 (0.0%) |
Time of Departure to Work by Sex in Franklin Furnace
The most frequent times of departure to work in Franklin Furnace are 6:00 AM to 6:29 AM (55, 25.9%) for males and 8:00 AM to 8:29 AM (81, 24.0%) for females.
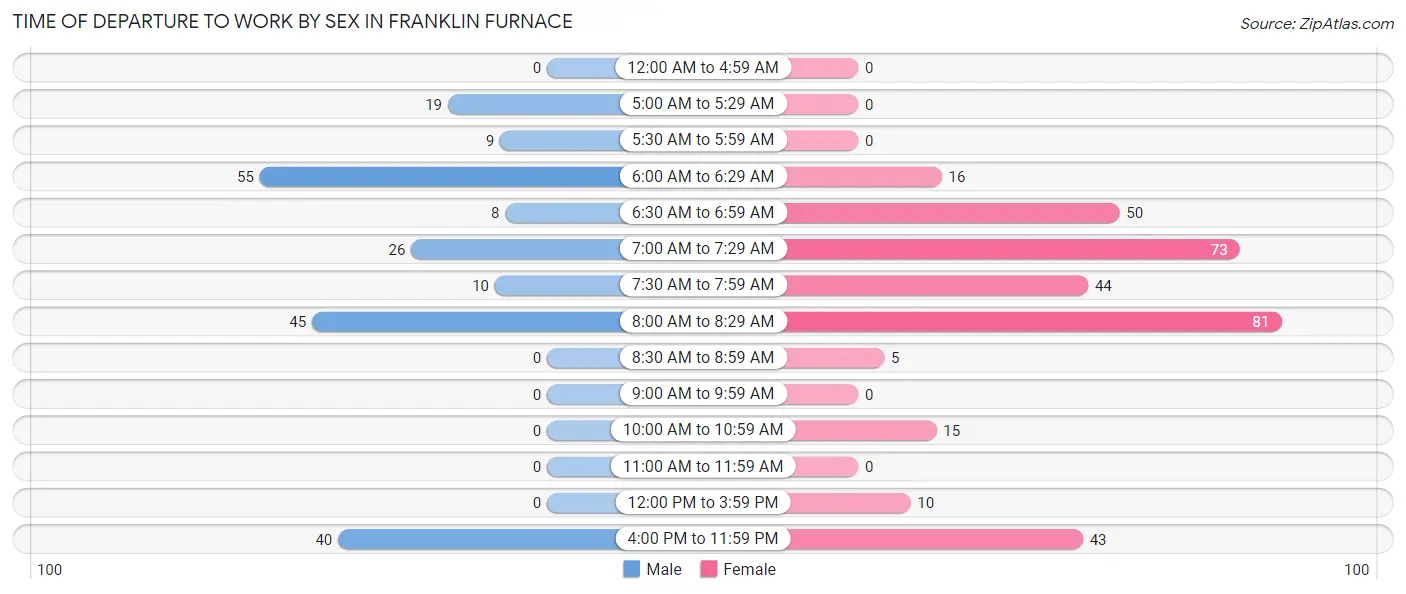
| Time of Departure | Male | Female |
| 12:00 AM to 4:59 AM | 0 (0.0%) | 0 (0.0%) |
| 5:00 AM to 5:29 AM | 19 (9.0%) | 0 (0.0%) |
| 5:30 AM to 5:59 AM | 9 (4.3%) | 0 (0.0%) |
| 6:00 AM to 6:29 AM | 55 (25.9%) | 16 (4.8%) |
| 6:30 AM to 6:59 AM | 8 (3.8%) | 50 (14.8%) |
| 7:00 AM to 7:29 AM | 26 (12.3%) | 73 (21.7%) |
| 7:30 AM to 7:59 AM | 10 (4.7%) | 44 (13.1%) |
| 8:00 AM to 8:29 AM | 45 (21.2%) | 81 (24.0%) |
| 8:30 AM to 8:59 AM | 0 (0.0%) | 5 (1.5%) |
| 9:00 AM to 9:59 AM | 0 (0.0%) | 0 (0.0%) |
| 10:00 AM to 10:59 AM | 0 (0.0%) | 15 (4.4%) |
| 11:00 AM to 11:59 AM | 0 (0.0%) | 0 (0.0%) |
| 12:00 PM to 3:59 PM | 0 (0.0%) | 10 (3.0%) |
| 4:00 PM to 11:59 PM | 40 (18.9%) | 43 (12.8%) |
| Total | 212 (100.0%) | 337 (100.0%) |
Housing Occupancy in Franklin Furnace
Occupancy by Ownership in Franklin Furnace
Of the total 622 dwellings in Franklin Furnace, owner-occupied units account for 517 (83.1%), while renter-occupied units make up 105 (16.9%).
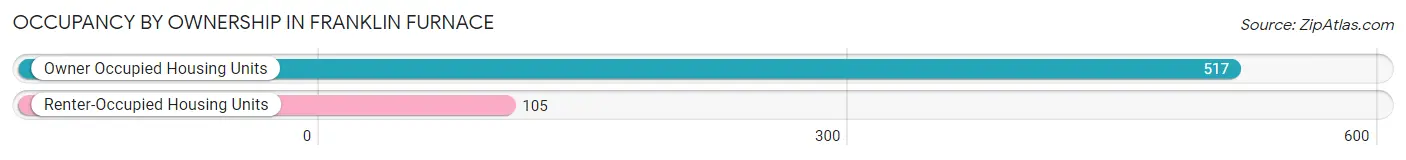
| Occupancy | # Housing Units | % Housing Units |
| Owner Occupied Housing Units | 517 | 83.1% |
| Renter-Occupied Housing Units | 105 | 16.9% |
| Total Occupied Housing Units | 622 | 100.0% |
Occupancy by Household Size in Franklin Furnace
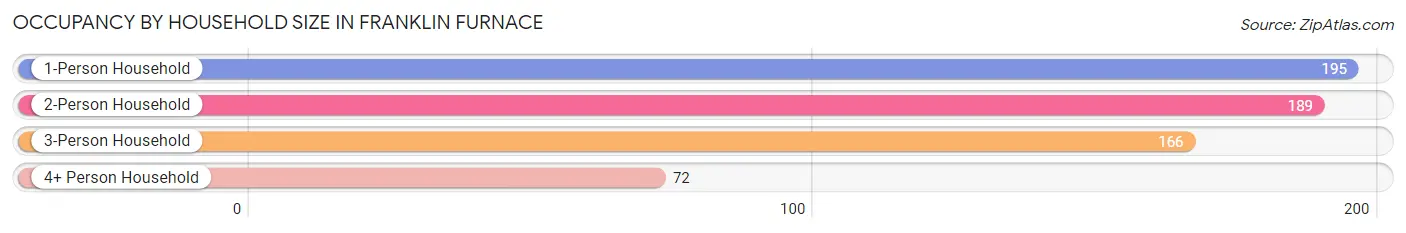
| Household Size | # Housing Units | % Housing Units |
| 1-Person Household | 195 | 31.4% |
| 2-Person Household | 189 | 30.4% |
| 3-Person Household | 166 | 26.7% |
| 4+ Person Household | 72 | 11.6% |
| Total Housing Units | 622 | 100.0% |
Occupancy by Ownership by Household Size in Franklin Furnace
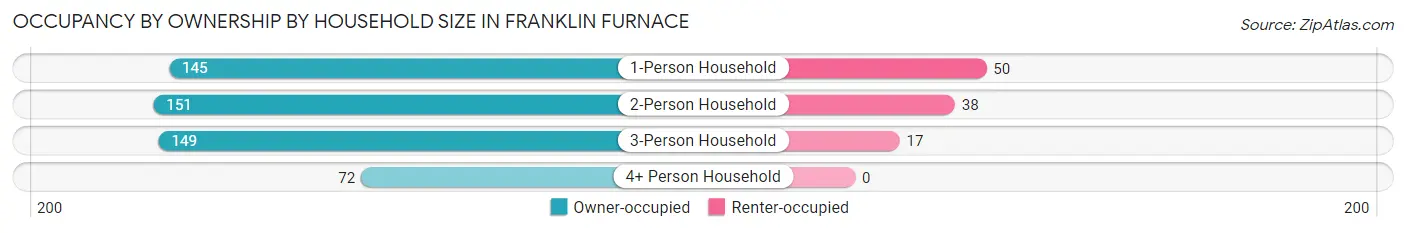
| Household Size | Owner-occupied | Renter-occupied |
| 1-Person Household | 145 (74.4%) | 50 (25.6%) |
| 2-Person Household | 151 (79.9%) | 38 (20.1%) |
| 3-Person Household | 149 (89.8%) | 17 (10.2%) |
| 4+ Person Household | 72 (100.0%) | 0 (0.0%) |
| Total Housing Units | 517 (83.1%) | 105 (16.9%) |
Occupancy by Educational Attainment in Franklin Furnace
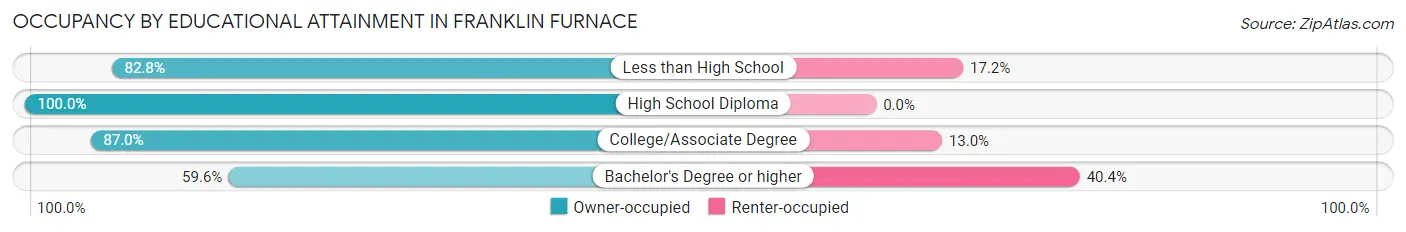
| Household Size | Owner-occupied | Renter-occupied |
| Less than High School | 24 (82.8%) | 5 (17.2%) |
| High School Diploma | 174 (100.0%) | 0 (0.0%) |
| College/Associate Degree | 220 (87.0%) | 33 (13.0%) |
| Bachelor's Degree or higher | 99 (59.6%) | 67 (40.4%) |
Occupancy by Age of Householder in Franklin Furnace
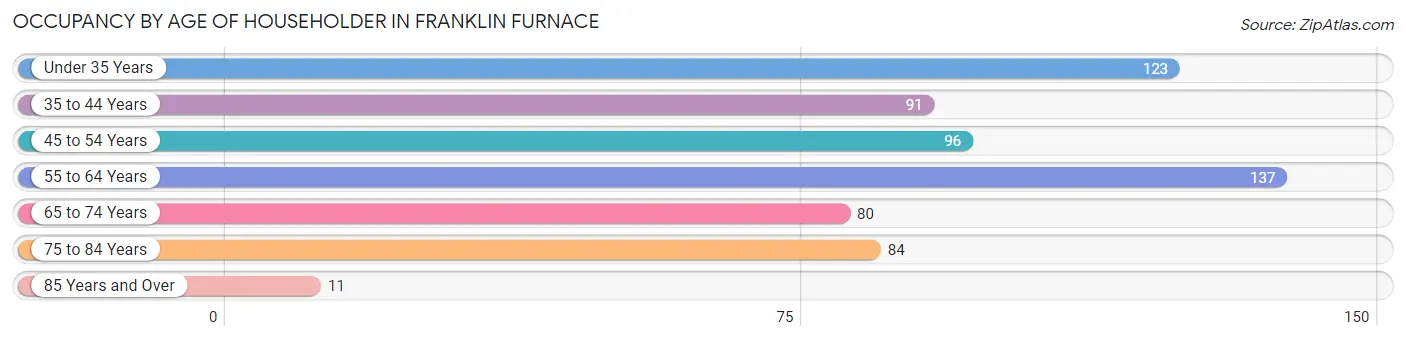
| Age Bracket | # Households | % Households |
| Under 35 Years | 123 | 19.8% |
| 35 to 44 Years | 91 | 14.6% |
| 45 to 54 Years | 96 | 15.4% |
| 55 to 64 Years | 137 | 22.0% |
| 65 to 74 Years | 80 | 12.9% |
| 75 to 84 Years | 84 | 13.5% |
| 85 Years and Over | 11 | 1.8% |
| Total | 622 | 100.0% |
Housing Finances in Franklin Furnace
Median Income by Occupancy in Franklin Furnace
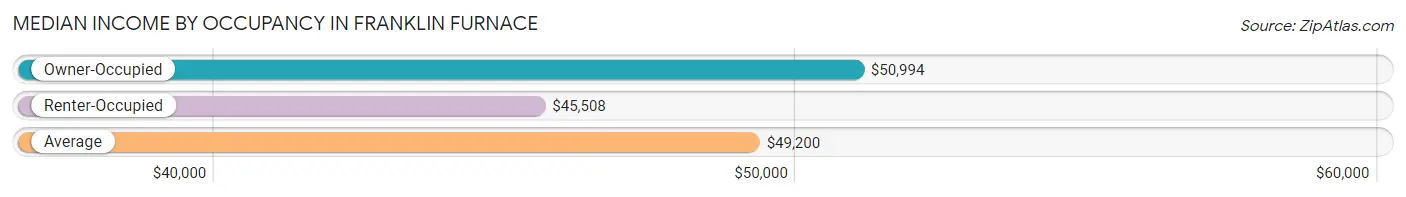
| Occupancy Type | # Households | Median Income |
| Owner-Occupied | 517 (83.1%) | $50,994 |
| Renter-Occupied | 105 (16.9%) | $45,508 |
| Average | 622 (100.0%) | $49,200 |
Occupancy by Householder Income Bracket in Franklin Furnace
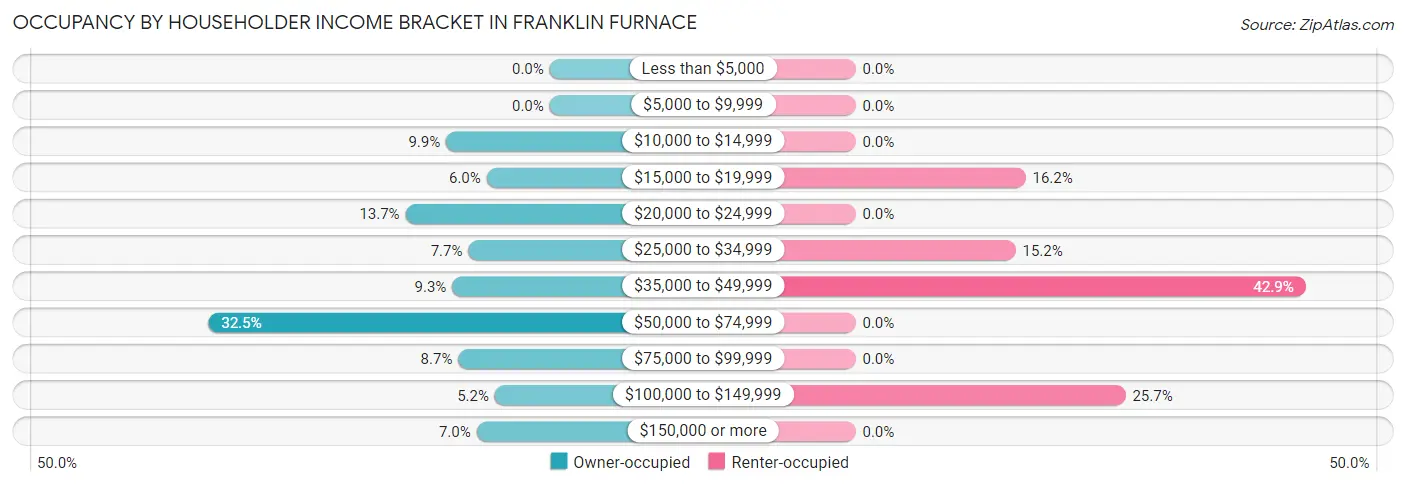
| Income Bracket | Owner-occupied | Renter-occupied |
| Less than $5,000 | 0 (0.0%) | 0 (0.0%) |
| $5,000 to $9,999 | 0 (0.0%) | 0 (0.0%) |
| $10,000 to $14,999 | 51 (9.9%) | 0 (0.0%) |
| $15,000 to $19,999 | 31 (6.0%) | 17 (16.2%) |
| $20,000 to $24,999 | 71 (13.7%) | 0 (0.0%) |
| $25,000 to $34,999 | 40 (7.7%) | 16 (15.2%) |
| $35,000 to $49,999 | 48 (9.3%) | 45 (42.9%) |
| $50,000 to $74,999 | 168 (32.5%) | 0 (0.0%) |
| $75,000 to $99,999 | 45 (8.7%) | 0 (0.0%) |
| $100,000 to $149,999 | 27 (5.2%) | 27 (25.7%) |
| $150,000 or more | 36 (7.0%) | 0 (0.0%) |
| Total | 517 (100.0%) | 105 (100.0%) |
Monthly Housing Cost Tiers in Franklin Furnace
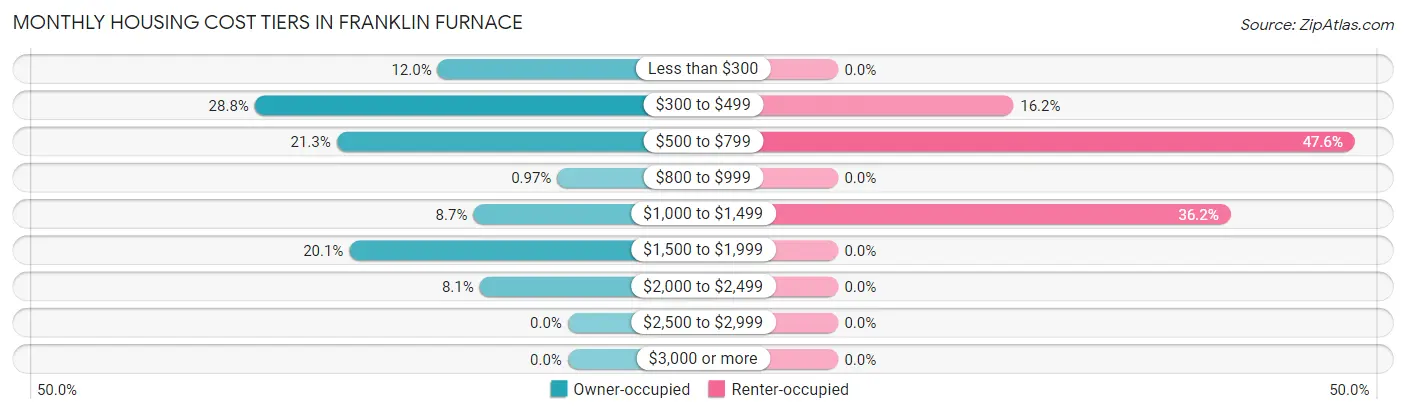
| Monthly Cost | Owner-occupied | Renter-occupied |
| Less than $300 | 62 (12.0%) | 0 (0.0%) |
| $300 to $499 | 149 (28.8%) | 17 (16.2%) |
| $500 to $799 | 110 (21.3%) | 50 (47.6%) |
| $800 to $999 | 5 (1.0%) | 0 (0.0%) |
| $1,000 to $1,499 | 45 (8.7%) | 38 (36.2%) |
| $1,500 to $1,999 | 104 (20.1%) | 0 (0.0%) |
| $2,000 to $2,499 | 42 (8.1%) | 0 (0.0%) |
| $2,500 to $2,999 | 0 (0.0%) | 0 (0.0%) |
| $3,000 or more | 0 (0.0%) | 0 (0.0%) |
| Total | 517 (100.0%) | 105 (100.0%) |
Physical Housing Characteristics in Franklin Furnace
Housing Structures in Franklin Furnace
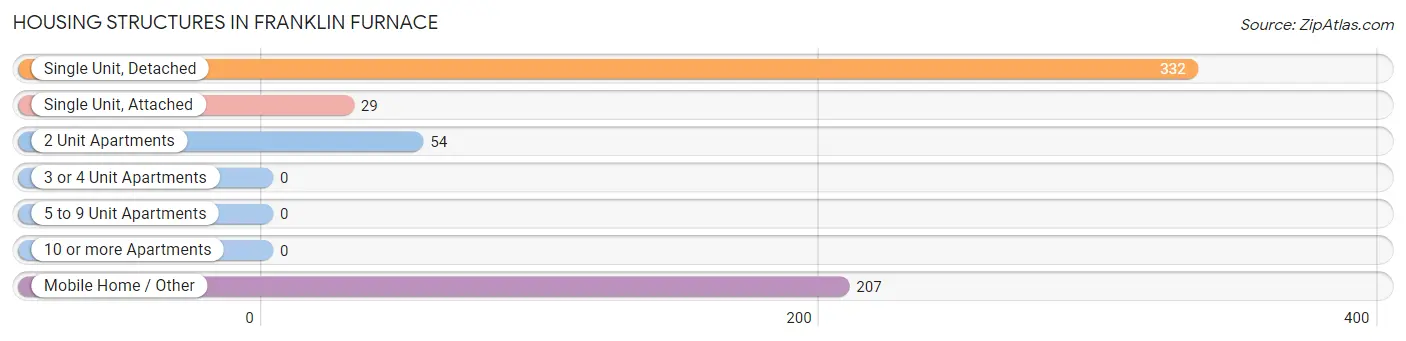
| Structure Type | # Housing Units | % Housing Units |
| Single Unit, Detached | 332 | 53.4% |
| Single Unit, Attached | 29 | 4.7% |
| 2 Unit Apartments | 54 | 8.7% |
| 3 or 4 Unit Apartments | 0 | 0.0% |
| 5 to 9 Unit Apartments | 0 | 0.0% |
| 10 or more Apartments | 0 | 0.0% |
| Mobile Home / Other | 207 | 33.3% |
| Total | 622 | 100.0% |
Housing Structures by Occupancy in Franklin Furnace
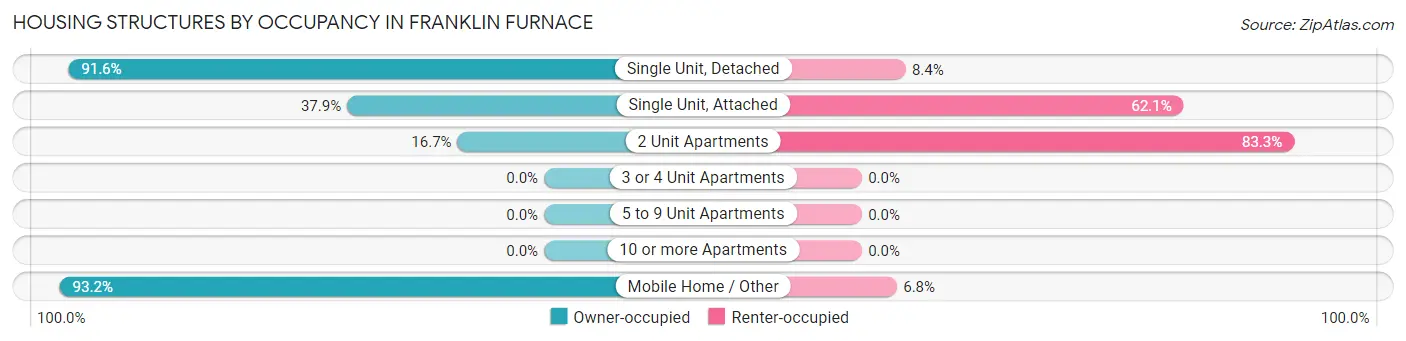
| Structure Type | Owner-occupied | Renter-occupied |
| Single Unit, Detached | 304 (91.6%) | 28 (8.4%) |
| Single Unit, Attached | 11 (37.9%) | 18 (62.1%) |
| 2 Unit Apartments | 9 (16.7%) | 45 (83.3%) |
| 3 or 4 Unit Apartments | 0 (0.0%) | 0 (0.0%) |
| 5 to 9 Unit Apartments | 0 (0.0%) | 0 (0.0%) |
| 10 or more Apartments | 0 (0.0%) | 0 (0.0%) |
| Mobile Home / Other | 193 (93.2%) | 14 (6.8%) |
| Total | 517 (83.1%) | 105 (16.9%) |
Housing Structures by Number of Rooms in Franklin Furnace
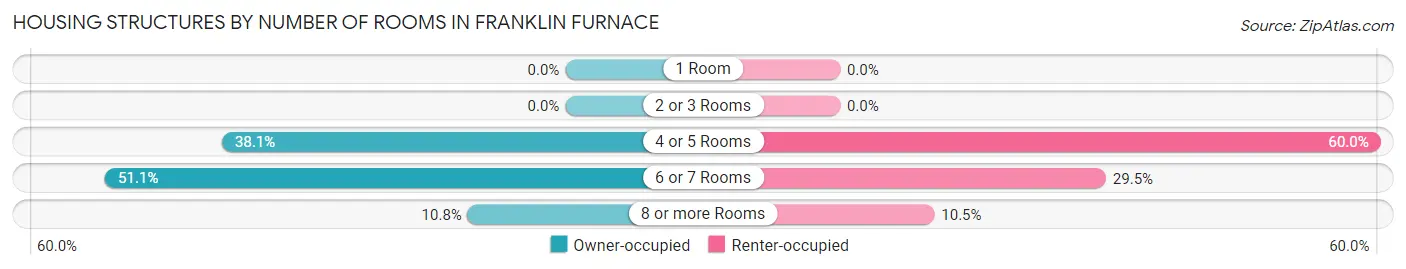
| Number of Rooms | Owner-occupied | Renter-occupied |
| 1 Room | 0 (0.0%) | 0 (0.0%) |
| 2 or 3 Rooms | 0 (0.0%) | 0 (0.0%) |
| 4 or 5 Rooms | 197 (38.1%) | 63 (60.0%) |
| 6 or 7 Rooms | 264 (51.1%) | 31 (29.5%) |
| 8 or more Rooms | 56 (10.8%) | 11 (10.5%) |
| Total | 517 (100.0%) | 105 (100.0%) |
Housing Structure by Heating Type in Franklin Furnace
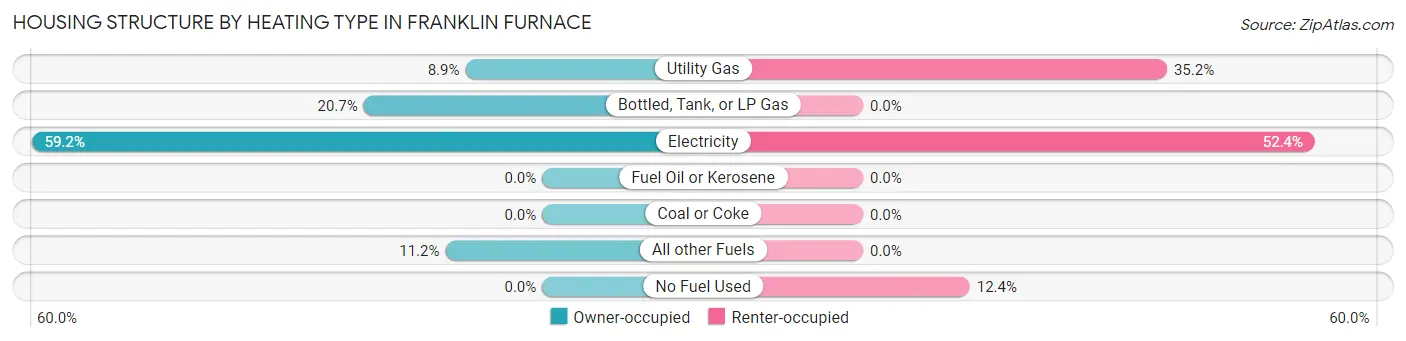
| Heating Type | Owner-occupied | Renter-occupied |
| Utility Gas | 46 (8.9%) | 37 (35.2%) |
| Bottled, Tank, or LP Gas | 107 (20.7%) | 0 (0.0%) |
| Electricity | 306 (59.2%) | 55 (52.4%) |
| Fuel Oil or Kerosene | 0 (0.0%) | 0 (0.0%) |
| Coal or Coke | 0 (0.0%) | 0 (0.0%) |
| All other Fuels | 58 (11.2%) | 0 (0.0%) |
| No Fuel Used | 0 (0.0%) | 13 (12.4%) |
| Total | 517 (100.0%) | 105 (100.0%) |
Household Vehicle Usage in Franklin Furnace
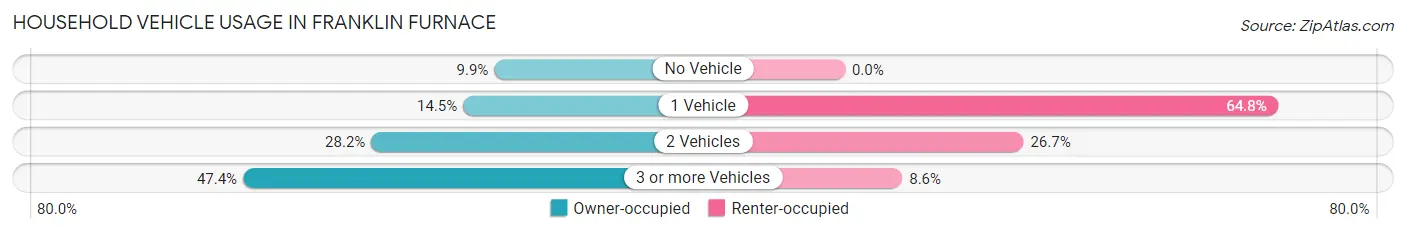
| Vehicles per Household | Owner-occupied | Renter-occupied |
| No Vehicle | 51 (9.9%) | 0 (0.0%) |
| 1 Vehicle | 75 (14.5%) | 68 (64.8%) |
| 2 Vehicles | 146 (28.2%) | 28 (26.7%) |
| 3 or more Vehicles | 245 (47.4%) | 9 (8.6%) |
| Total | 517 (100.0%) | 105 (100.0%) |
Real Estate & Mortgages in Franklin Furnace
Real Estate and Mortgage Overview in Franklin Furnace
| Characteristic | Without Mortgage | With Mortgage |
| Housing Units | 318 | 199 |
| Median Property Value | $66,000 | $201,900 |
| Median Household Income | $43,958 | $36 |
| Monthly Housing Costs | $379 | $0 |
| Real Estate Taxes | - | - |
Property Value by Mortgage Status in Franklin Furnace
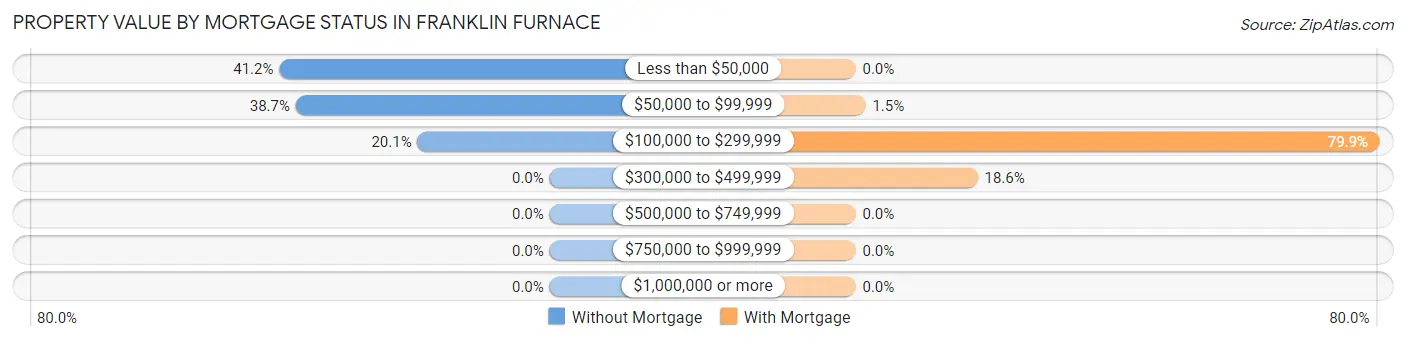
| Property Value | Without Mortgage | With Mortgage |
| Less than $50,000 | 131 (41.2%) | 0 (0.0%) |
| $50,000 to $99,999 | 123 (38.7%) | 3 (1.5%) |
| $100,000 to $299,999 | 64 (20.1%) | 159 (79.9%) |
| $300,000 to $499,999 | 0 (0.0%) | 37 (18.6%) |
| $500,000 to $749,999 | 0 (0.0%) | 0 (0.0%) |
| $750,000 to $999,999 | 0 (0.0%) | 0 (0.0%) |
| $1,000,000 or more | 0 (0.0%) | 0 (0.0%) |
| Total | 318 (100.0%) | 199 (100.0%) |
Household Income by Mortgage Status in Franklin Furnace
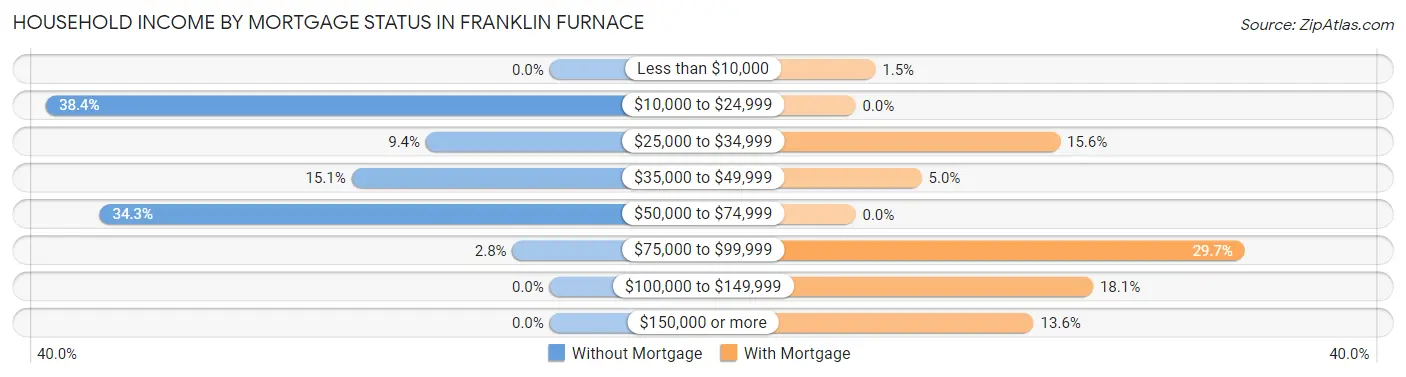
| Household Income | Without Mortgage | With Mortgage |
| Less than $10,000 | 0 (0.0%) | 3 (1.5%) |
| $10,000 to $24,999 | 122 (38.4%) | 0 (0.0%) |
| $25,000 to $34,999 | 30 (9.4%) | 31 (15.6%) |
| $35,000 to $49,999 | 48 (15.1%) | 10 (5.0%) |
| $50,000 to $74,999 | 109 (34.3%) | 0 (0.0%) |
| $75,000 to $99,999 | 9 (2.8%) | 59 (29.6%) |
| $100,000 to $149,999 | 0 (0.0%) | 36 (18.1%) |
| $150,000 or more | 0 (0.0%) | 27 (13.6%) |
| Total | 318 (100.0%) | 199 (100.0%) |
Property Value to Household Income Ratio in Franklin Furnace
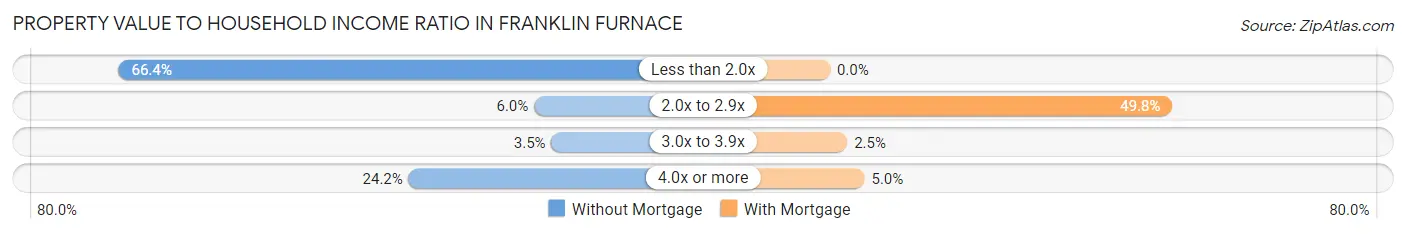
| Value-to-Income Ratio | Without Mortgage | With Mortgage |
| Less than 2.0x | 211 (66.3%) | 0 (0.0%) |
| 2.0x to 2.9x | 19 (6.0%) | 99 (49.7%) |
| 3.0x to 3.9x | 11 (3.5%) | 5 (2.5%) |
| 4.0x or more | 77 (24.2%) | 10 (5.0%) |
| Total | 318 (100.0%) | 199 (100.0%) |
Real Estate Taxes by Mortgage Status in Franklin Furnace
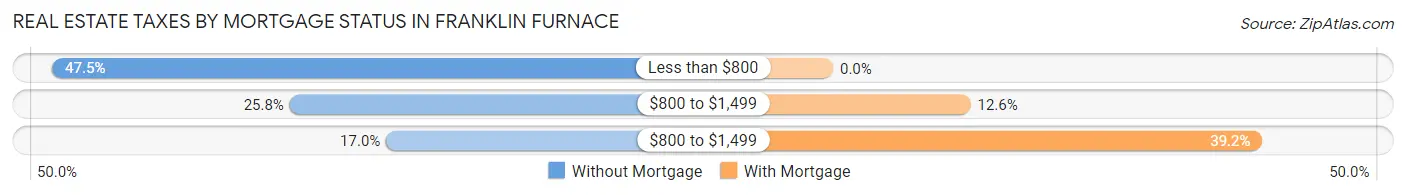
| Property Taxes | Without Mortgage | With Mortgage |
| Less than $800 | 151 (47.5%) | 0 (0.0%) |
| $800 to $1,499 | 82 (25.8%) | 25 (12.6%) |
| $800 to $1,499 | 54 (17.0%) | 78 (39.2%) |
| Total | 318 (100.0%) | 199 (100.0%) |
Health & Disability in Franklin Furnace
Health Insurance Coverage by Age in Franklin Furnace
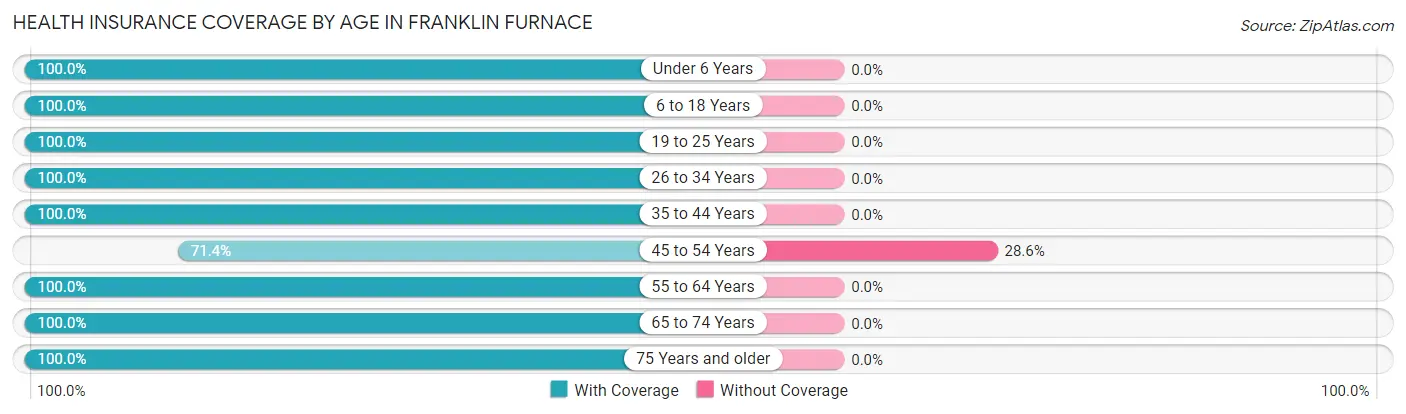
| Age Bracket | With Coverage | Without Coverage |
| Under 6 Years | 86 (100.0%) | 0 (0.0%) |
| 6 to 18 Years | 126 (100.0%) | 0 (0.0%) |
| 19 to 25 Years | 174 (100.0%) | 0 (0.0%) |
| 26 to 34 Years | 267 (100.0%) | 0 (0.0%) |
| 35 to 44 Years | 150 (100.0%) | 0 (0.0%) |
| 45 to 54 Years | 125 (71.4%) | 50 (28.6%) |
| 55 to 64 Years | 301 (100.0%) | 0 (0.0%) |
| 65 to 74 Years | 133 (100.0%) | 0 (0.0%) |
| 75 Years and older | 106 (100.0%) | 0 (0.0%) |
| Total | 1,468 (96.7%) | 50 (3.3%) |
Health Insurance Coverage by Citizenship Status in Franklin Furnace
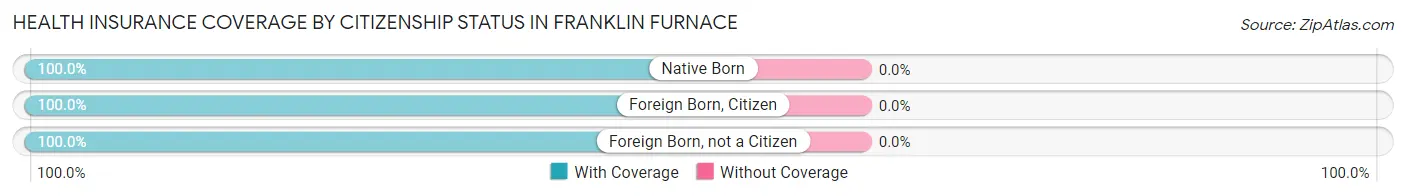
| Citizenship Status | With Coverage | Without Coverage |
| Native Born | 86 (100.0%) | 0 (0.0%) |
| Foreign Born, Citizen | 126 (100.0%) | 0 (0.0%) |
| Foreign Born, not a Citizen | 174 (100.0%) | 0 (0.0%) |
Health Insurance Coverage by Household Income in Franklin Furnace
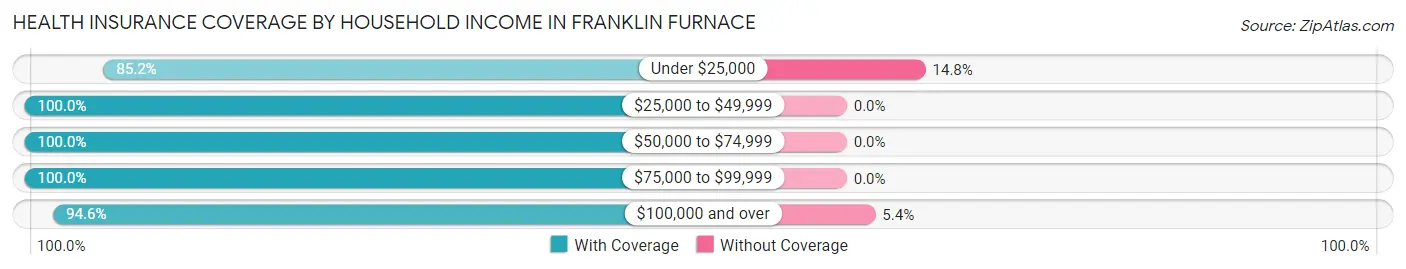
| Household Income | With Coverage | Without Coverage |
| Under $25,000 | 202 (85.2%) | 35 (14.8%) |
| $25,000 to $49,999 | 336 (100.0%) | 0 (0.0%) |
| $50,000 to $74,999 | 522 (100.0%) | 0 (0.0%) |
| $75,000 to $99,999 | 140 (100.0%) | 0 (0.0%) |
| $100,000 and over | 265 (94.6%) | 15 (5.4%) |
Public vs Private Health Insurance Coverage by Age in Franklin Furnace
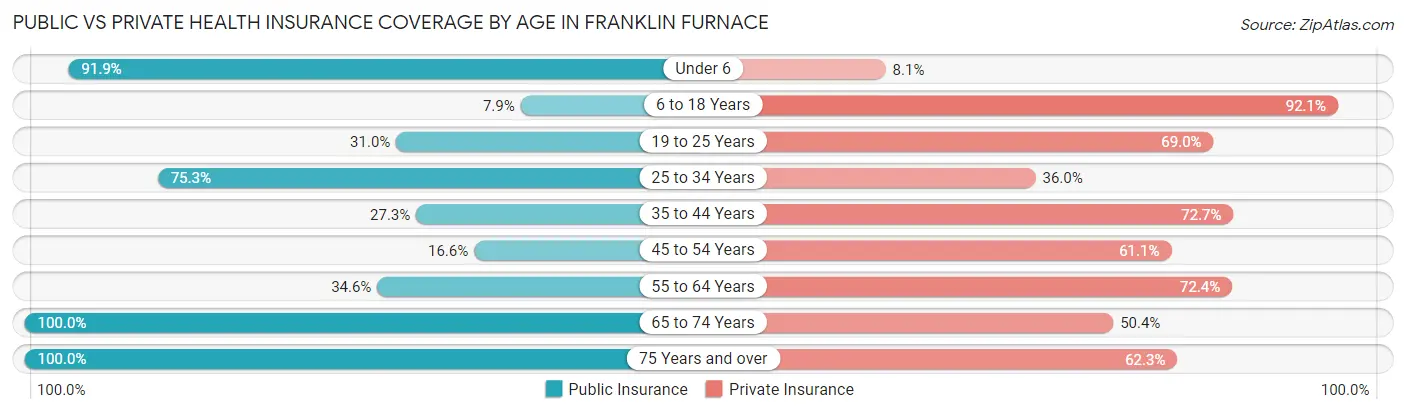
| Age Bracket | Public Insurance | Private Insurance |
| Under 6 | 79 (91.9%) | 7 (8.1%) |
| 6 to 18 Years | 10 (7.9%) | 116 (92.1%) |
| 19 to 25 Years | 54 (31.0%) | 120 (69.0%) |
| 25 to 34 Years | 201 (75.3%) | 96 (36.0%) |
| 35 to 44 Years | 41 (27.3%) | 109 (72.7%) |
| 45 to 54 Years | 29 (16.6%) | 107 (61.1%) |
| 55 to 64 Years | 104 (34.5%) | 218 (72.4%) |
| 65 to 74 Years | 133 (100.0%) | 67 (50.4%) |
| 75 Years and over | 106 (100.0%) | 66 (62.3%) |
| Total | 757 (49.9%) | 906 (59.7%) |
Disability Status by Sex by Age in Franklin Furnace
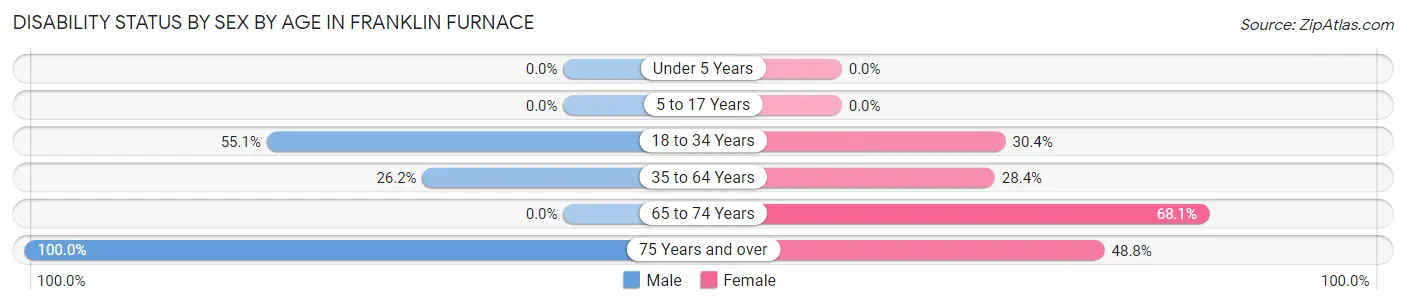
| Age Bracket | Male | Female |
| Under 5 Years | 0 (0.0%) | 0 (0.0%) |
| 5 to 17 Years | 0 (0.0%) | 0 (0.0%) |
| 18 to 34 Years | 136 (55.1%) | 59 (30.4%) |
| 35 to 64 Years | 68 (26.2%) | 104 (28.4%) |
| 65 to 74 Years | 0 (0.0%) | 47 (68.1%) |
| 75 Years and over | 65 (100.0%) | 20 (48.8%) |
Disability Class by Sex by Age in Franklin Furnace
Disability Class: Hearing Difficulty
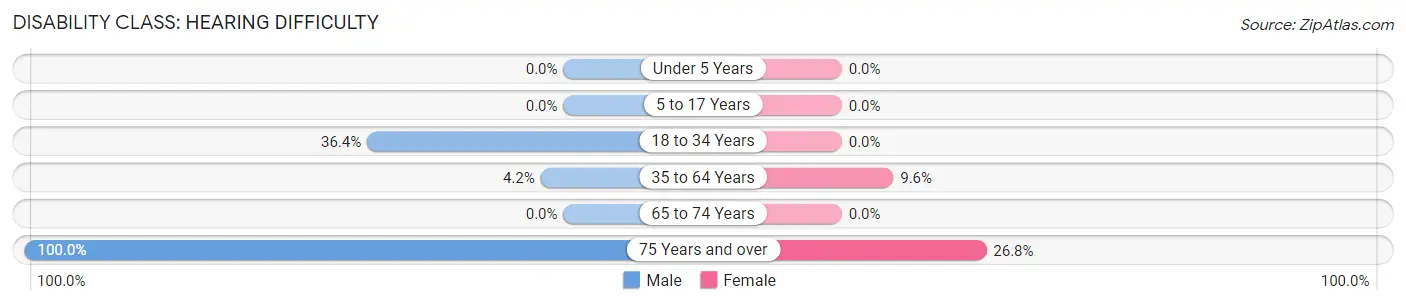
| Age Bracket | Male | Female |
| Under 5 Years | 0 (0.0%) | 0 (0.0%) |
| 5 to 17 Years | 0 (0.0%) | 0 (0.0%) |
| 18 to 34 Years | 90 (36.4%) | 0 (0.0%) |
| 35 to 64 Years | 11 (4.2%) | 35 (9.6%) |
| 65 to 74 Years | 0 (0.0%) | 0 (0.0%) |
| 75 Years and over | 65 (100.0%) | 11 (26.8%) |
Disability Class: Vision Difficulty
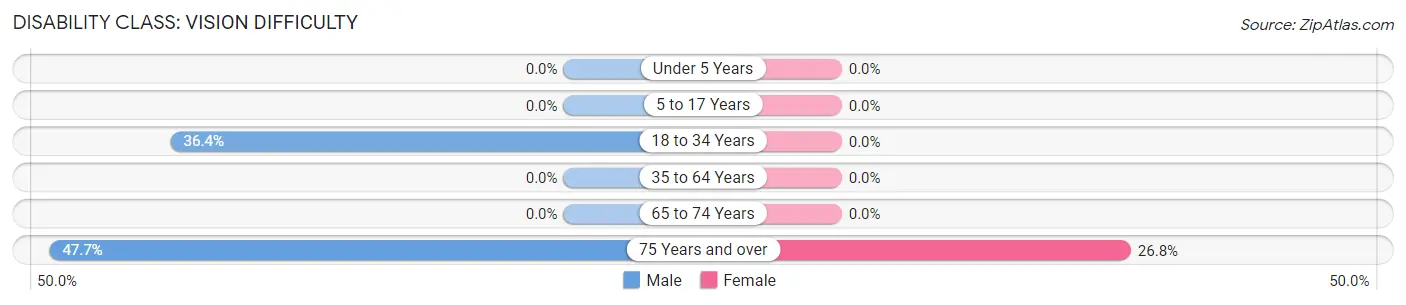
| Age Bracket | Male | Female |
| Under 5 Years | 0 (0.0%) | 0 (0.0%) |
| 5 to 17 Years | 0 (0.0%) | 0 (0.0%) |
| 18 to 34 Years | 90 (36.4%) | 0 (0.0%) |
| 35 to 64 Years | 0 (0.0%) | 0 (0.0%) |
| 65 to 74 Years | 0 (0.0%) | 0 (0.0%) |
| 75 Years and over | 31 (47.7%) | 11 (26.8%) |
Disability Class: Cognitive Difficulty
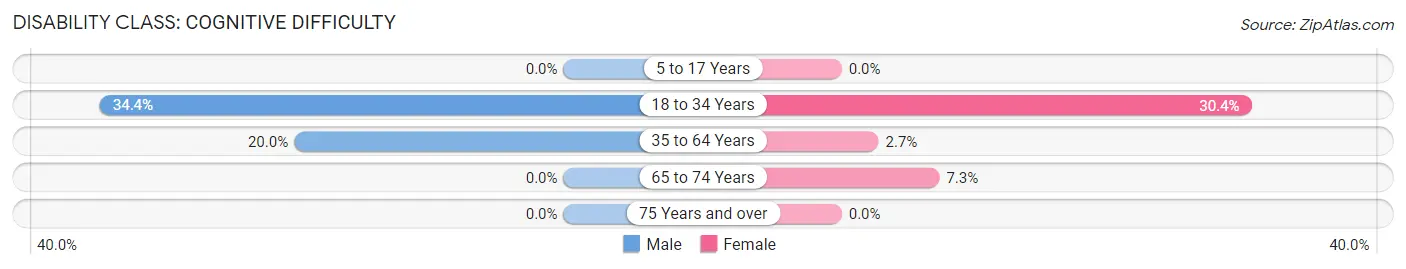
| Age Bracket | Male | Female |
| 5 to 17 Years | 0 (0.0%) | 0 (0.0%) |
| 18 to 34 Years | 85 (34.4%) | 59 (30.4%) |
| 35 to 64 Years | 52 (20.0%) | 10 (2.7%) |
| 65 to 74 Years | 0 (0.0%) | 5 (7.2%) |
| 75 Years and over | 0 (0.0%) | 0 (0.0%) |
Disability Class: Ambulatory Difficulty
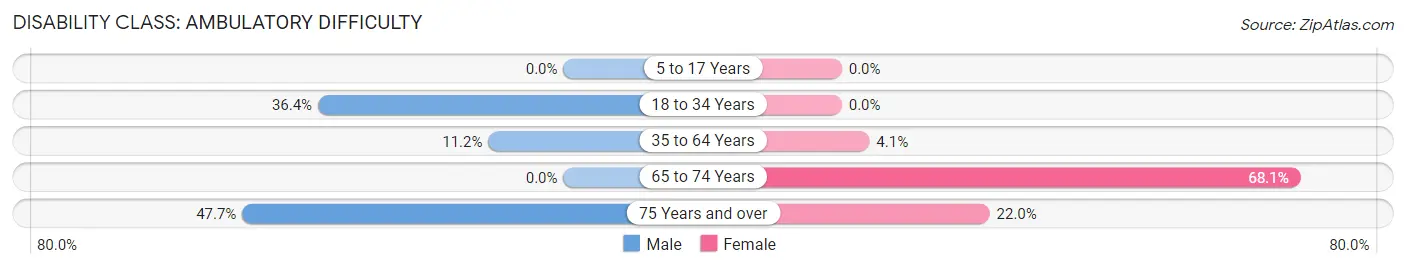
| Age Bracket | Male | Female |
| 5 to 17 Years | 0 (0.0%) | 0 (0.0%) |
| 18 to 34 Years | 90 (36.4%) | 0 (0.0%) |
| 35 to 64 Years | 29 (11.2%) | 15 (4.1%) |
| 65 to 74 Years | 0 (0.0%) | 47 (68.1%) |
| 75 Years and over | 31 (47.7%) | 9 (22.0%) |
Disability Class: Self-Care Difficulty
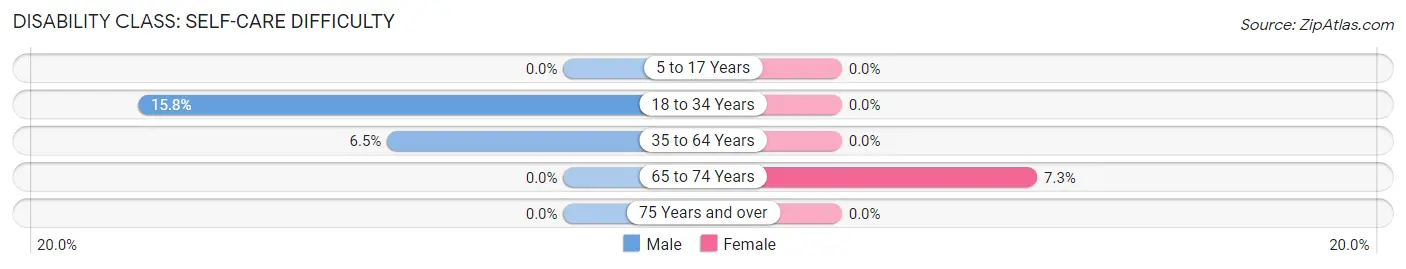
| Age Bracket | Male | Female |
| 5 to 17 Years | 0 (0.0%) | 0 (0.0%) |
| 18 to 34 Years | 39 (15.8%) | 0 (0.0%) |
| 35 to 64 Years | 17 (6.5%) | 0 (0.0%) |
| 65 to 74 Years | 0 (0.0%) | 5 (7.2%) |
| 75 Years and over | 0 (0.0%) | 0 (0.0%) |
Technology Access in Franklin Furnace
Computing Device Access in Franklin Furnace
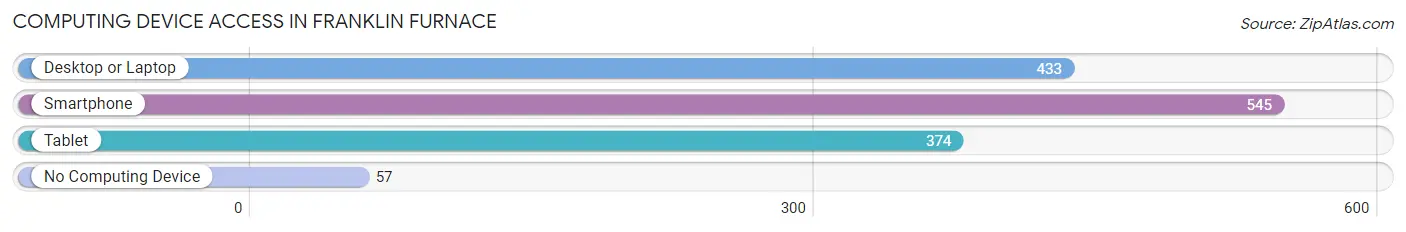
| Device Type | # Households | % Households |
| Desktop or Laptop | 433 | 69.6% |
| Smartphone | 545 | 87.6% |
| Tablet | 374 | 60.1% |
| No Computing Device | 57 | 9.2% |
| Total | 622 | 100.0% |
Internet Access in Franklin Furnace
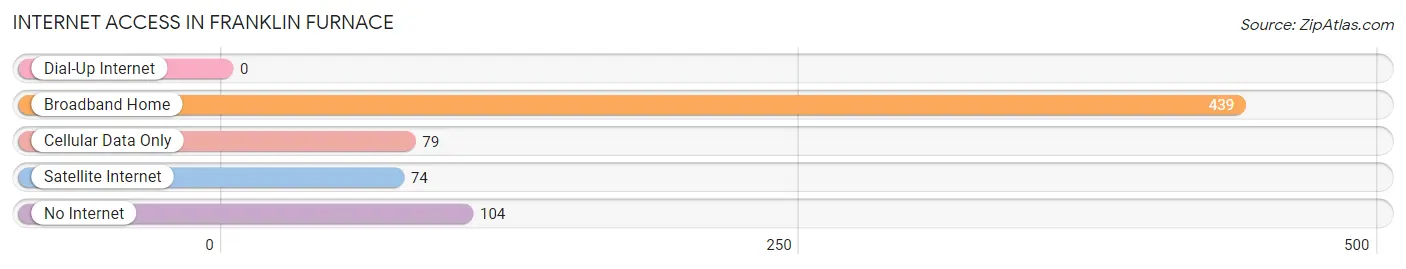
| Internet Type | # Households | % Households |
| Dial-Up Internet | 0 | 0.0% |
| Broadband Home | 439 | 70.6% |
| Cellular Data Only | 79 | 12.7% |
| Satellite Internet | 74 | 11.9% |
| No Internet | 104 | 16.7% |
| Total | 622 | 100.0% |
Franklin Furnace Summary
Franklin Furnace is a small unincorporated community located in Scioto County, Ohio. It is situated along the Ohio River, approximately 10 miles south of Portsmouth. The population of Franklin Furnace was 1,845 at the 2010 census.
History
Franklin Furnace was founded in 1817 by William Franklin, a Revolutionary War veteran. The town was named after Benjamin Franklin, a Founding Father of the United States. The town was originally a farming community, but it soon became a center for iron production. The first iron furnace was built in 1820 and was known as the Franklin Furnace. The furnace was used to produce pig iron, which was then shipped down the Ohio River to be used in the production of steel. The furnace was in operation until 1872, when it was destroyed by a fire.
The town of Franklin Furnace grew rapidly in the late 19th century. It became a center for coal mining and the production of coke, which was used in the steel industry. The town also had several brickyards, a sawmill, and a gristmill. The town was also home to several churches, a school, and a post office.
Geography
Franklin Furnace is located at 38°45'25" North, 82°59'45" West (38.756944, -82.995833). The town is situated along the Ohio River, approximately 10 miles south of Portsmouth. The town has a total area of 0.9 square miles, all of which is land.
Economy
The economy of Franklin Furnace is largely based on agriculture and tourism. The town is home to several farms, which produce a variety of crops, including corn, soybeans, and hay. The town is also home to several tourist attractions, including the Franklin Furnace Iron Furnace, the Scioto County Historical Society Museum, and the Scioto County Fairgrounds.
Demographics
As of the 2010 census, there were 1,845 people, 745 households, and 517 families residing in Franklin Furnace. The population density was 2,039.4 people per square mile. The racial makeup of the town was 97.2% White, 0.7% African American, 0.2% Native American, 0.2% Asian, 0.1% Pacific Islander, 0.4% from other races, and 1.2% from two or more races. Hispanic or Latino of any race were 1.2% of the population.
The median income for a household in Franklin Furnace was $31,250, and the median income for a family was $37,500. Males had a median income of $30,000 versus $20,000 for females. The per capita income for the town was $14,945. About 11.2% of families and 14.2% of the population were below the poverty line, including 18.2% of those under age 18 and 8.3% of those age 65 or over.
Common Questions
What is Per Capita Income in Franklin Furnace?
Per Capita income in Franklin Furnace is $22,124.
What is the Median Family Income in Franklin Furnace?
Median Family Income in Franklin Furnace is $51,335.
What is the Median Household income in Franklin Furnace?
Median Household Income in Franklin Furnace is $49,200.
What is Inequality or Gini Index in Franklin Furnace?
Inequality or Gini Index in Franklin Furnace is 0.42.
What is the Total Population of Franklin Furnace?
Total Population of Franklin Furnace is 1,896.
What is the Total Male Population of Franklin Furnace?
Total Male Population of Franklin Furnace is 1,081.
What is the Total Female Population of Franklin Furnace?
Total Female Population of Franklin Furnace is 815.
What is the Ratio of Males per 100 Females in Franklin Furnace?
There are 132.64 Males per 100 Females in Franklin Furnace.
What is the Ratio of Females per 100 Males in Franklin Furnace?
There are 75.39 Females per 100 Males in Franklin Furnace.
What is the Median Population Age in Franklin Furnace?
Median Population Age in Franklin Furnace is 38.9 Years.
What is the Average Family Size in Franklin Furnace
Average Family Size in Franklin Furnace is 2.8 People.
What is the Average Household Size in Franklin Furnace
Average Household Size in Franklin Furnace is 2.4 People.
How Large is the Labor Force in Franklin Furnace?
There are 601 People in the Labor Forcein in Franklin Furnace.
What is the Percentage of People in the Labor Force in Franklin Furnace?
35.8% of People are in the Labor Force in Franklin Furnace.
What is the Unemployment Rate in Franklin Furnace?
Unemployment Rate in Franklin Furnace is 2.5%.