Northwood, OH Map & Demographics
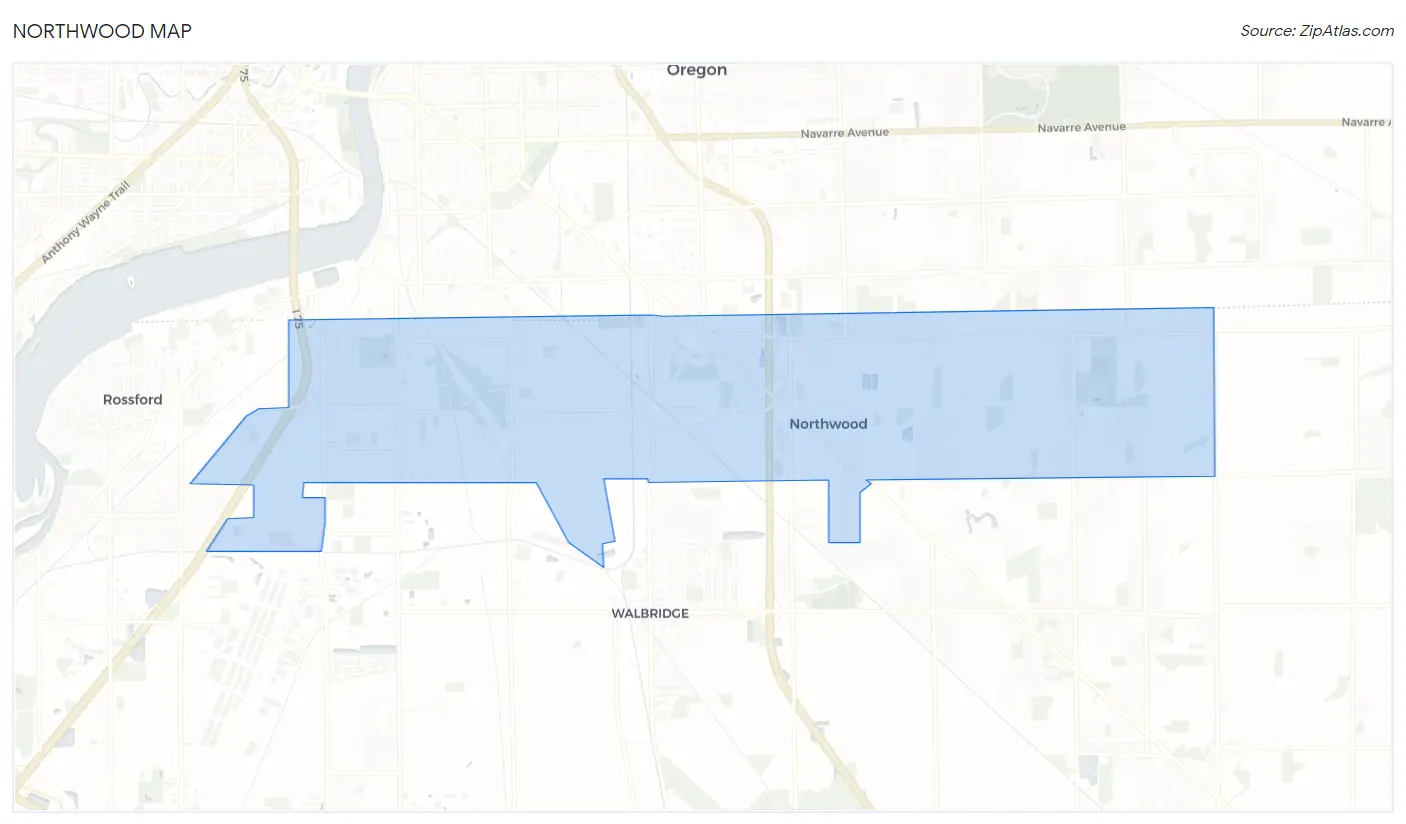
Northwood Map
Northwood Overview
$44,923
PER CAPITA INCOME
$92,037
AVG FAMILY INCOME
$74,404
AVG HOUSEHOLD INCOME
57.7%
WAGE / INCOME GAP [ % ]
42.3¢/ $1
WAGE / INCOME GAP [ $ ]
0.37
INEQUALITY / GINI INDEX
5,180
TOTAL POPULATION
2,526
MALE POPULATION
2,654
FEMALE POPULATION
95.18
MALES / 100 FEMALES
105.07
FEMALES / 100 MALES
42.5
MEDIAN AGE
2.7
AVG FAMILY SIZE
2.2
AVG HOUSEHOLD SIZE
3,041
LABOR FORCE [ PEOPLE ]
73.9%
PERCENT IN LABOR FORCE
0.7%
UNEMPLOYMENT RATE
Northwood Zip Codes
Income in Northwood
Income Overview in Northwood
Per Capita Income in Northwood is $44,923, while median incomes of families and households are $92,037 and $74,404 respectively.
| Characteristic | Number | Measure |
| Per Capita Income | 5,180 | $44,923 |
| Median Family Income | 1,520 | $92,037 |
| Mean Family Income | 1,520 | $112,006 |
| Median Household Income | 2,318 | $74,404 |
| Mean Household Income | 2,318 | $97,427 |
| Income Deficit | 1,520 | $0 |
| Wage / Income Gap (%) | 5,180 | 57.75% |
| Wage / Income Gap ($) | 5,180 | 42.25¢ per $1 |
| Gini / Inequality Index | 5,180 | 0.37 |
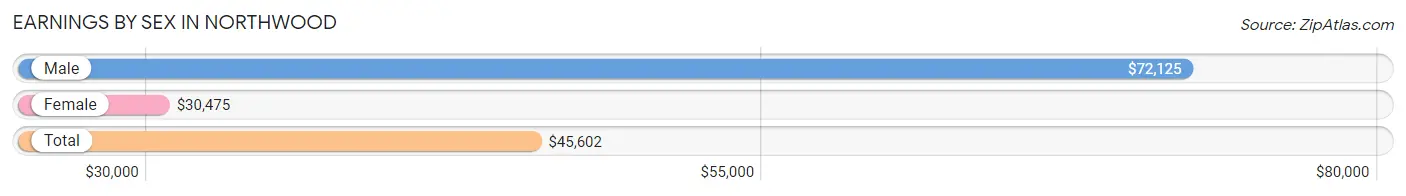
Earnings by Sex in Northwood
Average Earnings in Northwood are $45,602, $72,125 for men and $30,475 for women, a difference of 57.8%.
| Sex | Number | Average Earnings |
| Male | 1,452 (46.2%) | $72,125 |
| Female | 1,688 (53.8%) | $30,475 |
| Total | 3,140 (100.0%) | $45,602 |
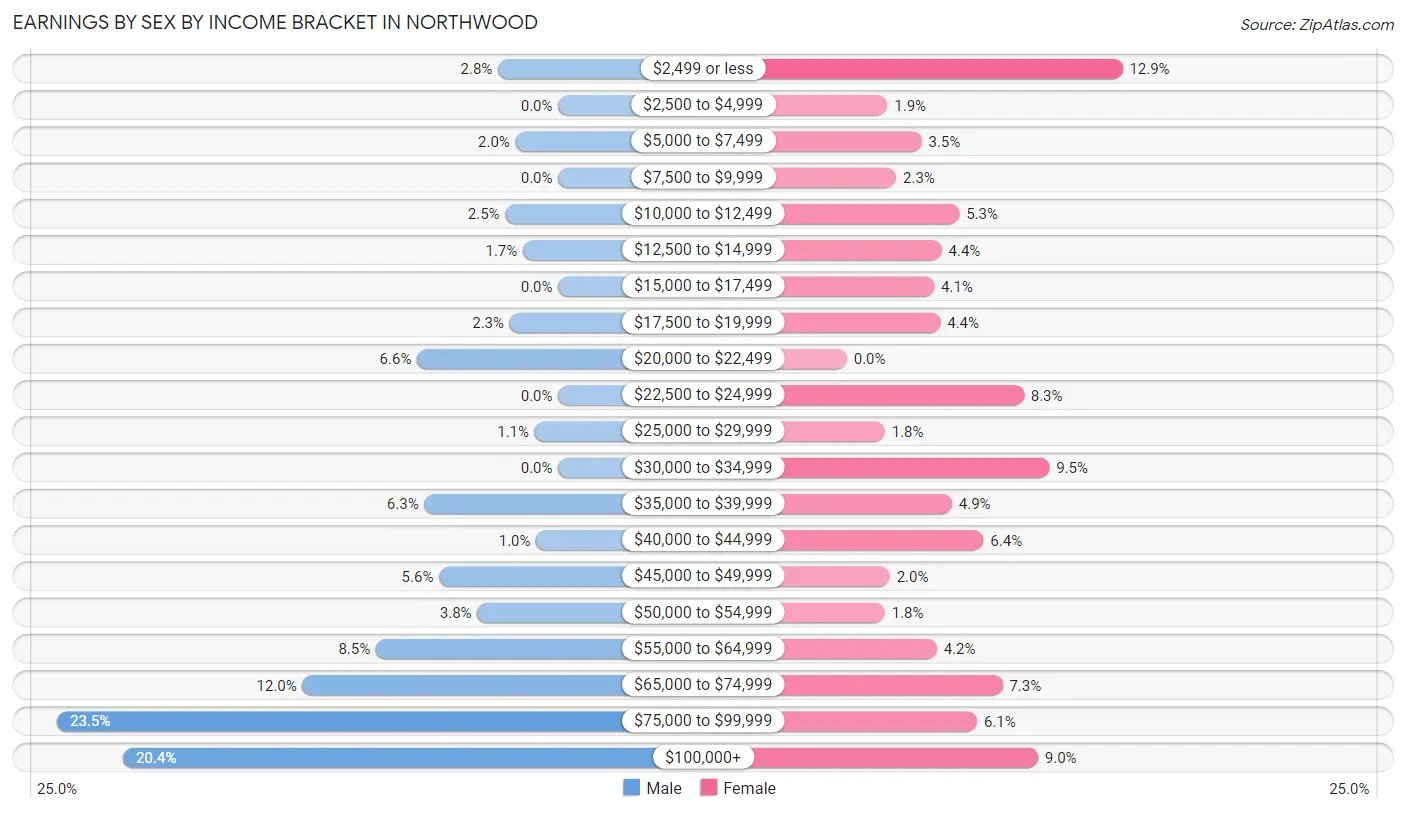
Earnings by Sex by Income Bracket in Northwood
The most common earnings brackets in Northwood are $75,000 to $99,999 for men (341 | 23.5%) and $2,499 or less for women (218 | 12.9%).
| Income | Male | Female |
| $2,499 or less | 41 (2.8%) | 218 (12.9%) |
| $2,500 to $4,999 | 0 (0.0%) | 32 (1.9%) |
| $5,000 to $7,499 | 29 (2.0%) | 59 (3.5%) |
| $7,500 to $9,999 | 0 (0.0%) | 39 (2.3%) |
| $10,000 to $12,499 | 36 (2.5%) | 89 (5.3%) |
| $12,500 to $14,999 | 24 (1.7%) | 75 (4.4%) |
| $15,000 to $17,499 | 0 (0.0%) | 69 (4.1%) |
| $17,500 to $19,999 | 33 (2.3%) | 74 (4.4%) |
| $20,000 to $22,499 | 96 (6.6%) | 0 (0.0%) |
| $22,500 to $24,999 | 0 (0.0%) | 140 (8.3%) |
| $25,000 to $29,999 | 16 (1.1%) | 30 (1.8%) |
| $30,000 to $34,999 | 0 (0.0%) | 160 (9.5%) |
| $35,000 to $39,999 | 91 (6.3%) | 83 (4.9%) |
| $40,000 to $44,999 | 15 (1.0%) | 108 (6.4%) |
| $45,000 to $49,999 | 81 (5.6%) | 34 (2.0%) |
| $50,000 to $54,999 | 55 (3.8%) | 30 (1.8%) |
| $55,000 to $64,999 | 124 (8.5%) | 71 (4.2%) |
| $65,000 to $74,999 | 174 (12.0%) | 123 (7.3%) |
| $75,000 to $99,999 | 341 (23.5%) | 103 (6.1%) |
| $100,000+ | 296 (20.4%) | 151 (8.9%) |
| Total | 1,452 (100.0%) | 1,688 (100.0%) |
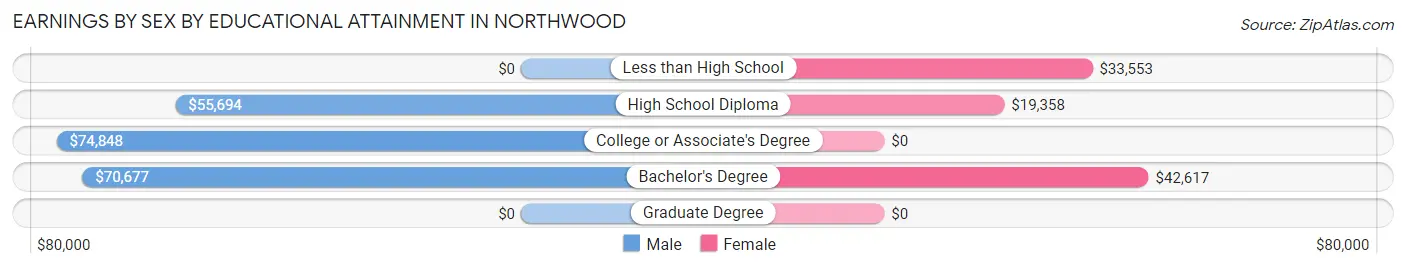
Earnings by Sex by Educational Attainment in Northwood
Average earnings in Northwood are $73,193 for men and $31,688 for women, a difference of 56.7%. Men with an educational attainment of college or associate's degree enjoy the highest average annual earnings of $74,848, while those with high school diploma education earn the least with $55,694. Women with an educational attainment of bachelor's degree earn the most with the average annual earnings of $42,617, while those with high school diploma education have the smallest earnings of $19,358.
| Educational Attainment | Male Income | Female Income |
| Less than High School | - | - |
| High School Diploma | $55,694 | $19,358 |
| College or Associate's Degree | $74,848 | $0 |
| Bachelor's Degree | $70,677 | $42,617 |
| Graduate Degree | - | - |
| Total | $73,193 | $31,688 |
Family Income in Northwood
Family Income Brackets in Northwood
According to the Northwood family income data, there are 302 families falling into the $75,000 to $99,999 income range, which is the most common income bracket and makes up 19.9% of all families.
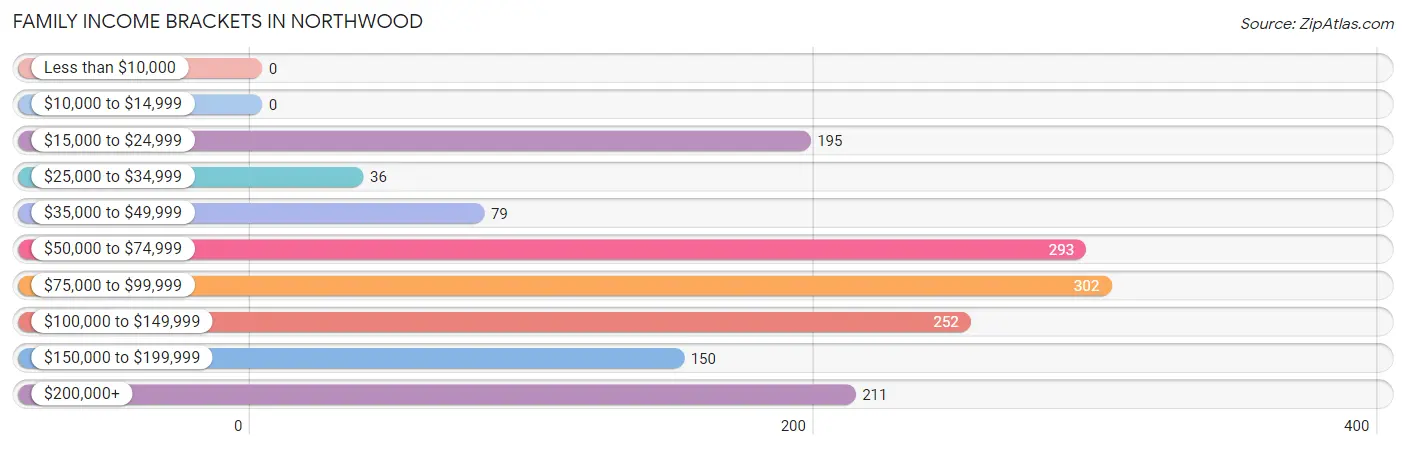
| Income Bracket | # Families | % Families |
| Less than $10,000 | 0 | 0.0% |
| $10,000 to $14,999 | 0 | 0.0% |
| $15,000 to $24,999 | 195 | 12.8% |
| $25,000 to $34,999 | 36 | 2.4% |
| $35,000 to $49,999 | 79 | 5.2% |
| $50,000 to $74,999 | 293 | 19.3% |
| $75,000 to $99,999 | 302 | 19.9% |
| $100,000 to $149,999 | 252 | 16.6% |
| $150,000 to $199,999 | 150 | 9.9% |
| $200,000+ | 211 | 13.9% |
Family Income by Famaliy Size in Northwood
4-person families (202 | 13.3%) account for the highest median family income in Northwood with $131,136 per family, while 2-person families (982 | 64.6%) have the highest median income of $39,775 per family member.
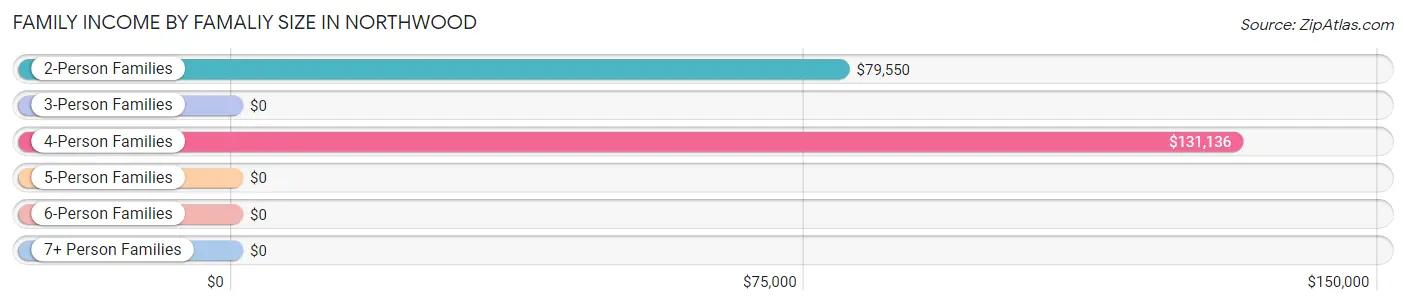
| Income Bracket | # Families | Median Income |
| 2-Person Families | 982 (64.6%) | $79,550 |
| 3-Person Families | 198 (13.0%) | $0 |
| 4-Person Families | 202 (13.3%) | $131,136 |
| 5-Person Families | 111 (7.3%) | $0 |
| 6-Person Families | 8 (0.5%) | $0 |
| 7+ Person Families | 19 (1.3%) | $0 |
| Total | 1,520 (100.0%) | $92,037 |
Family Income by Number of Earners in Northwood
The median family income in Northwood is $92,037, with families comprising 3+ earners (165) having the highest median family income of $141,146, while families with 1 earner (494) have the lowest median family income of $51,404, accounting for 10.9% and 32.5% of families, respectively.
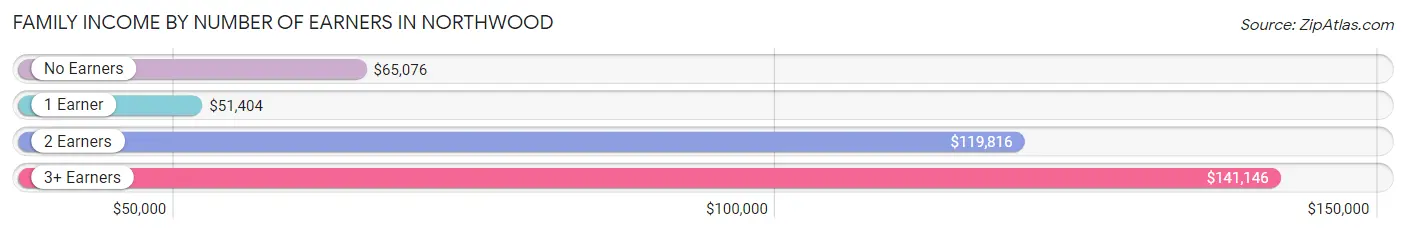
| Number of Earners | # Families | Median Income |
| No Earners | 240 (15.8%) | $65,076 |
| 1 Earner | 494 (32.5%) | $51,404 |
| 2 Earners | 621 (40.9%) | $119,816 |
| 3+ Earners | 165 (10.9%) | $141,146 |
| Total | 1,520 (100.0%) | $92,037 |
Household Income in Northwood
Household Income Brackets in Northwood
With 684 households falling in the category, the $50,000 to $74,999 income range is the most frequent in Northwood, accounting for 29.5% of all households. In contrast, only 14 households (0.6%) fall into the $10,000 to $14,999 income bracket, making it the least populous group.
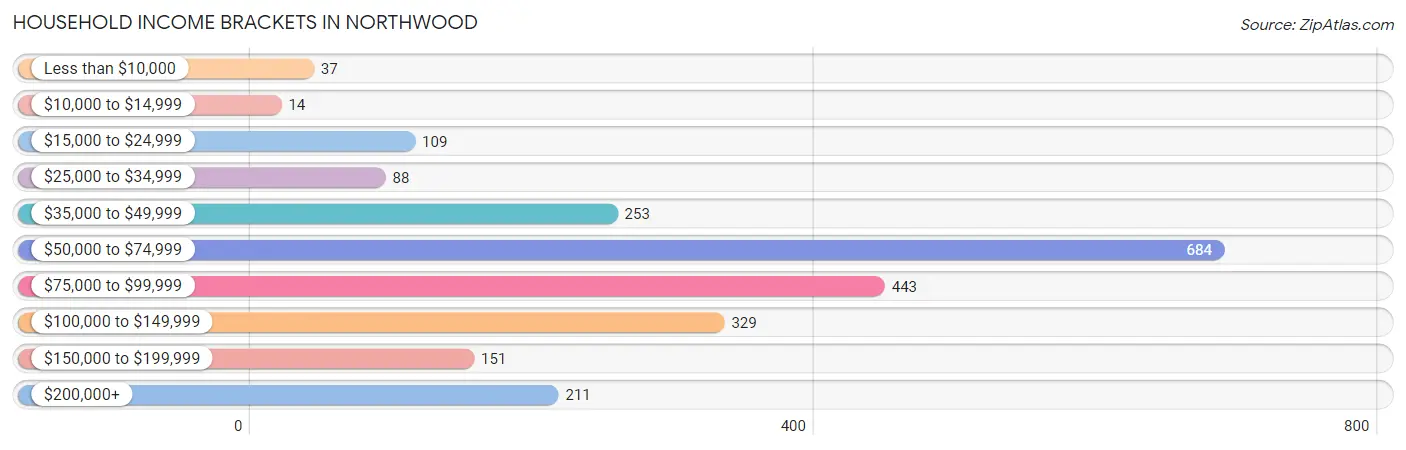
| Income Bracket | # Households | % Households |
| Less than $10,000 | 37 | 1.6% |
| $10,000 to $14,999 | 14 | 0.6% |
| $15,000 to $24,999 | 109 | 4.7% |
| $25,000 to $34,999 | 88 | 3.8% |
| $35,000 to $49,999 | 253 | 10.9% |
| $50,000 to $74,999 | 684 | 29.5% |
| $75,000 to $99,999 | 443 | 19.1% |
| $100,000 to $149,999 | 329 | 14.2% |
| $150,000 to $199,999 | 151 | 6.5% |
| $200,000+ | 211 | 9.1% |
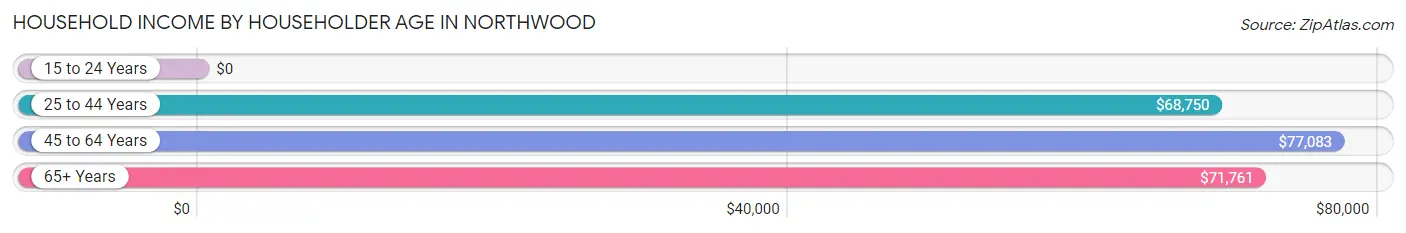
Household Income by Householder Age in Northwood
The median household income in Northwood is $74,404, with the highest median household income of $77,083 found in the 45 to 64 years age bracket for the primary householder. A total of 1,139 households (49.1%) fall into this category. Meanwhile, the 15 to 24 years age bracket for the primary householder has the lowest median household income of $0, with 63 households (2.7%) in this group.
| Income Bracket | # Households | Median Income |
| 15 to 24 Years | 63 (2.7%) | $0 |
| 25 to 44 Years | 627 (27.1%) | $68,750 |
| 45 to 64 Years | 1,139 (49.1%) | $77,083 |
| 65+ Years | 489 (21.1%) | $71,761 |
| Total | 2,318 (100.0%) | $74,404 |
Poverty in Northwood
Income Below Poverty by Sex and Age in Northwood
With 9.1% poverty level for males and 14.5% for females among the residents of Northwood, 6 to 11 year old males and 5 year old females are the most vulnerable to poverty, with 101 males (39.0%) and 80 females (100.0%) in their respective age groups living below the poverty level.
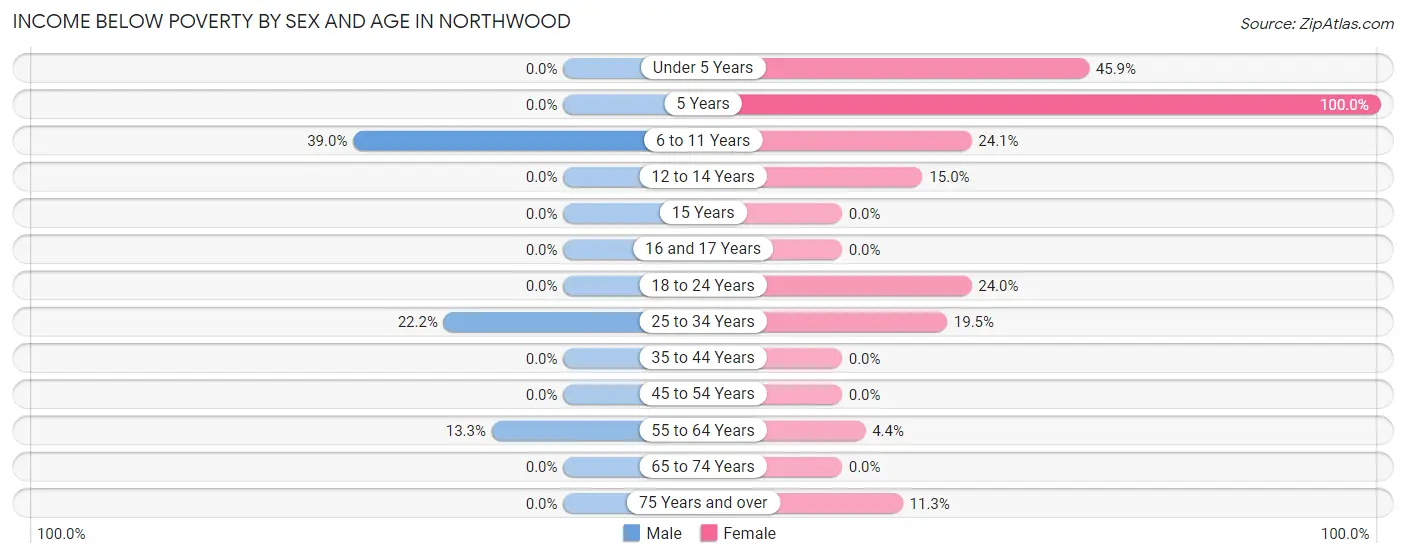
| Age Bracket | Male | Female |
| Under 5 Years | 0 (0.0%) | 83 (45.9%) |
| 5 Years | 0 (0.0%) | 80 (100.0%) |
| 6 to 11 Years | 101 (39.0%) | 38 (24.0%) |
| 12 to 14 Years | 0 (0.0%) | 19 (15.0%) |
| 15 Years | 0 (0.0%) | 0 (0.0%) |
| 16 and 17 Years | 0 (0.0%) | 0 (0.0%) |
| 18 to 24 Years | 0 (0.0%) | 31 (24.0%) |
| 25 to 34 Years | 91 (22.2%) | 94 (19.5%) |
| 35 to 44 Years | 0 (0.0%) | 0 (0.0%) |
| 45 to 54 Years | 0 (0.0%) | 0 (0.0%) |
| 55 to 64 Years | 38 (13.3%) | 24 (4.3%) |
| 65 to 74 Years | 0 (0.0%) | 0 (0.0%) |
| 75 Years and over | 0 (0.0%) | 14 (11.3%) |
| Total | 230 (9.1%) | 383 (14.5%) |
Income Above Poverty by Sex and Age in Northwood
According to the poverty statistics in Northwood, males aged under 5 years and females aged 15 years are the age groups that are most secure financially, with 100.0% of males and 100.0% of females in these age groups living above the poverty line.
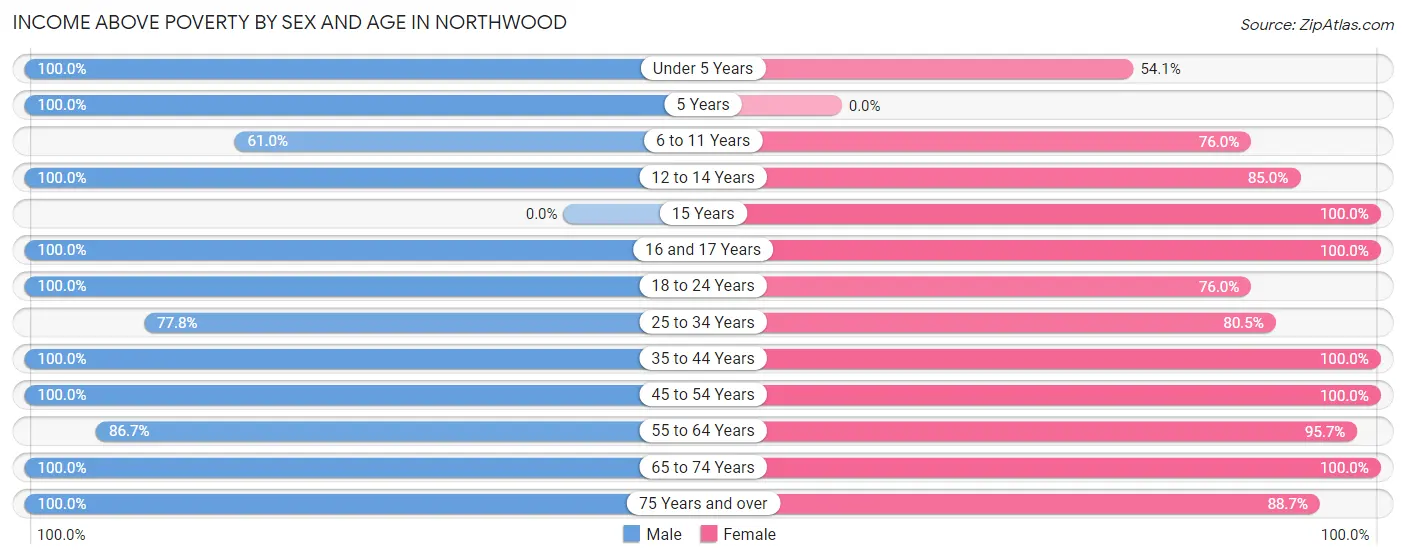
| Age Bracket | Male | Female |
| Under 5 Years | 145 (100.0%) | 98 (54.1%) |
| 5 Years | 25 (100.0%) | 0 (0.0%) |
| 6 to 11 Years | 158 (61.0%) | 120 (75.9%) |
| 12 to 14 Years | 77 (100.0%) | 108 (85.0%) |
| 15 Years | 0 (0.0%) | 13 (100.0%) |
| 16 and 17 Years | 45 (100.0%) | 28 (100.0%) |
| 18 to 24 Years | 147 (100.0%) | 98 (76.0%) |
| 25 to 34 Years | 319 (77.8%) | 388 (80.5%) |
| 35 to 44 Years | 218 (100.0%) | 182 (100.0%) |
| 45 to 54 Years | 462 (100.0%) | 370 (100.0%) |
| 55 to 64 Years | 248 (86.7%) | 528 (95.7%) |
| 65 to 74 Years | 365 (100.0%) | 215 (100.0%) |
| 75 Years and over | 87 (100.0%) | 110 (88.7%) |
| Total | 2,296 (90.9%) | 2,258 (85.5%) |
Income Below Poverty Among Married-Couple Families in Northwood
The poverty statistics for married-couple families in Northwood show that 1.9% or 19 of the total 1,006 families live below the poverty line. Families with 5 or more children have the highest poverty rate of 100.0%, comprising of 19 families. On the other hand, families with no children have the lowest poverty rate of 0.0%, which includes 0 families.
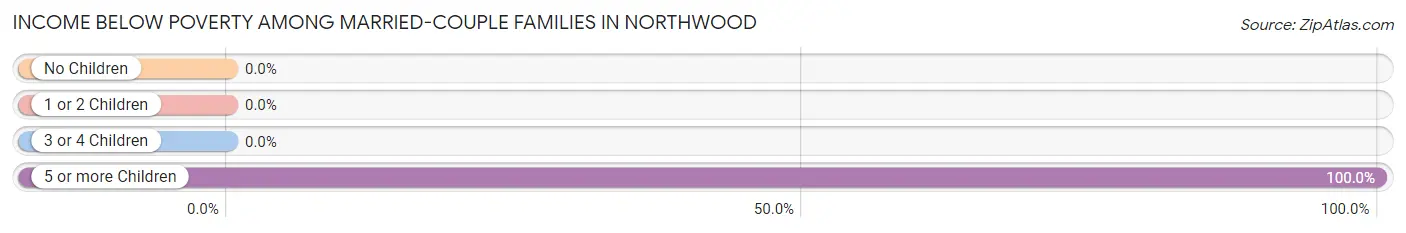
| Children | Above Poverty | Below Poverty |
| No Children | 700 (100.0%) | 0 (0.0%) |
| 1 or 2 Children | 247 (100.0%) | 0 (0.0%) |
| 3 or 4 Children | 40 (100.0%) | 0 (0.0%) |
| 5 or more Children | 0 (0.0%) | 19 (100.0%) |
| Total | 987 (98.1%) | 19 (1.9%) |
Income Below Poverty Among Single-Parent Households in Northwood
According to the poverty data in Northwood, 29.2% or 66 single-father households and 26.0% or 75 single-mother households are living below the poverty line. Among single-father households, those with 1 or 2 children have the highest poverty rate, with 66 households (43.4%) experiencing poverty. Likewise, among single-mother households, those with 1 or 2 children have the highest poverty rate, with 75 households (51.7%) falling below the poverty line.
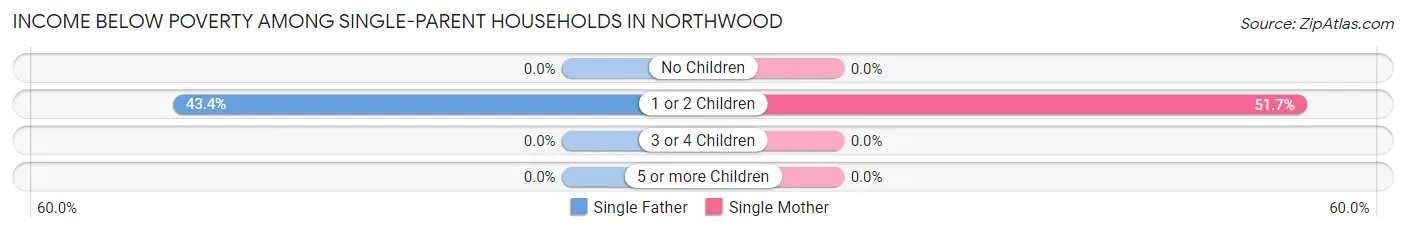
| Children | Single Father | Single Mother |
| No Children | 0 (0.0%) | 0 (0.0%) |
| 1 or 2 Children | 66 (43.4%) | 75 (51.7%) |
| 3 or 4 Children | 0 (0.0%) | 0 (0.0%) |
| 5 or more Children | 0 (0.0%) | 0 (0.0%) |
| Total | 66 (29.2%) | 75 (26.0%) |
Income Below Poverty Among Married-Couple vs Single-Parent Households in Northwood
The poverty data for Northwood shows that 19 of the married-couple family households (1.9%) and 141 of the single-parent households (27.4%) are living below the poverty level. Within the married-couple family households, those with 5 or more children have the highest poverty rate, with 19 households (100.0%) falling below the poverty line. Among the single-parent households, those with 1 or 2 children have the highest poverty rate, with 141 household (47.5%) living below poverty.
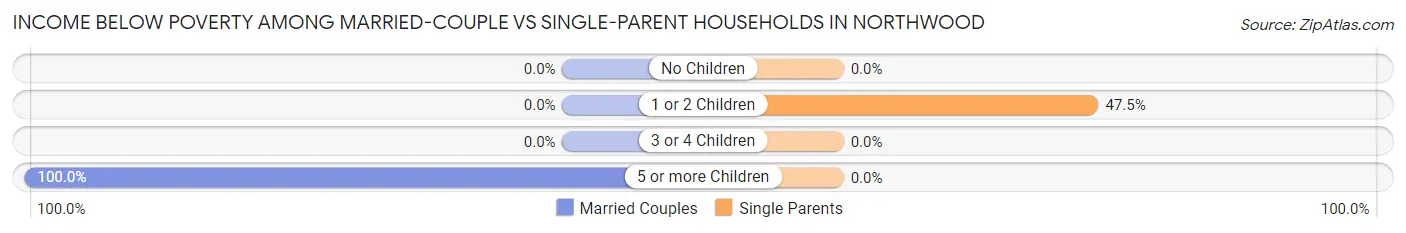
| Children | Married-Couple Families | Single-Parent Households |
| No Children | 0 (0.0%) | 0 (0.0%) |
| 1 or 2 Children | 0 (0.0%) | 141 (47.5%) |
| 3 or 4 Children | 0 (0.0%) | 0 (0.0%) |
| 5 or more Children | 19 (100.0%) | 0 (0.0%) |
| Total | 19 (1.9%) | 141 (27.4%) |
Race in Northwood
The most populous races in Northwood are White / Caucasian (4,821 | 93.1%), Two or more Races (267 | 5.1%), and Hispanic or Latino (241 | 4.6%).
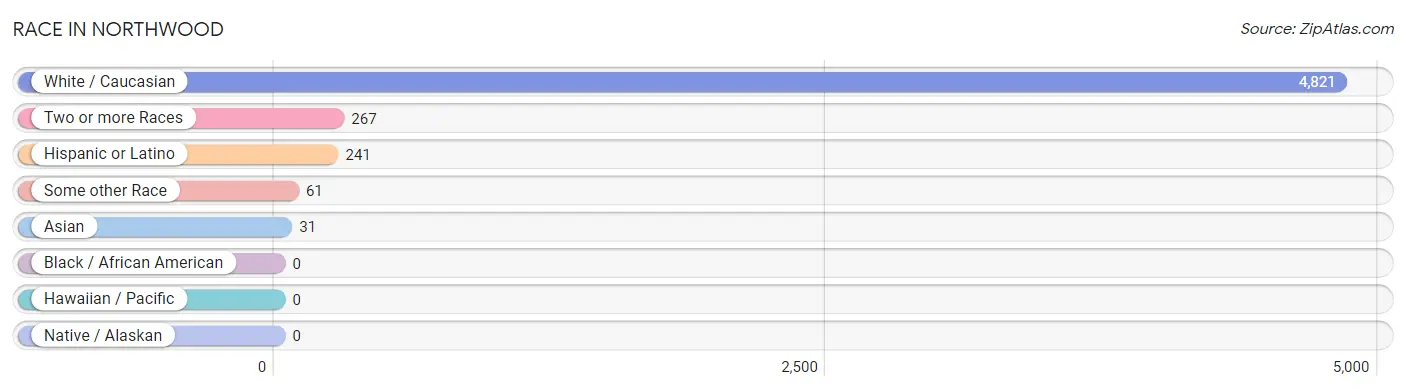
| Race | # Population | % Population |
| Asian | 31 | 0.6% |
| Black / African American | 0 | 0.0% |
| Hawaiian / Pacific | 0 | 0.0% |
| Hispanic or Latino | 241 | 4.6% |
| Native / Alaskan | 0 | 0.0% |
| White / Caucasian | 4,821 | 93.1% |
| Two or more Races | 267 | 5.1% |
| Some other Race | 61 | 1.2% |
| Total | 5,180 | 100.0% |
Ancestry in Northwood
The most populous ancestries reported in Northwood are German (1,618 | 31.2%), Irish (835 | 16.1%), English (569 | 11.0%), Polish (338 | 6.5%), and Mexican (239 | 4.6%), together accounting for 69.5% of all Northwood residents.
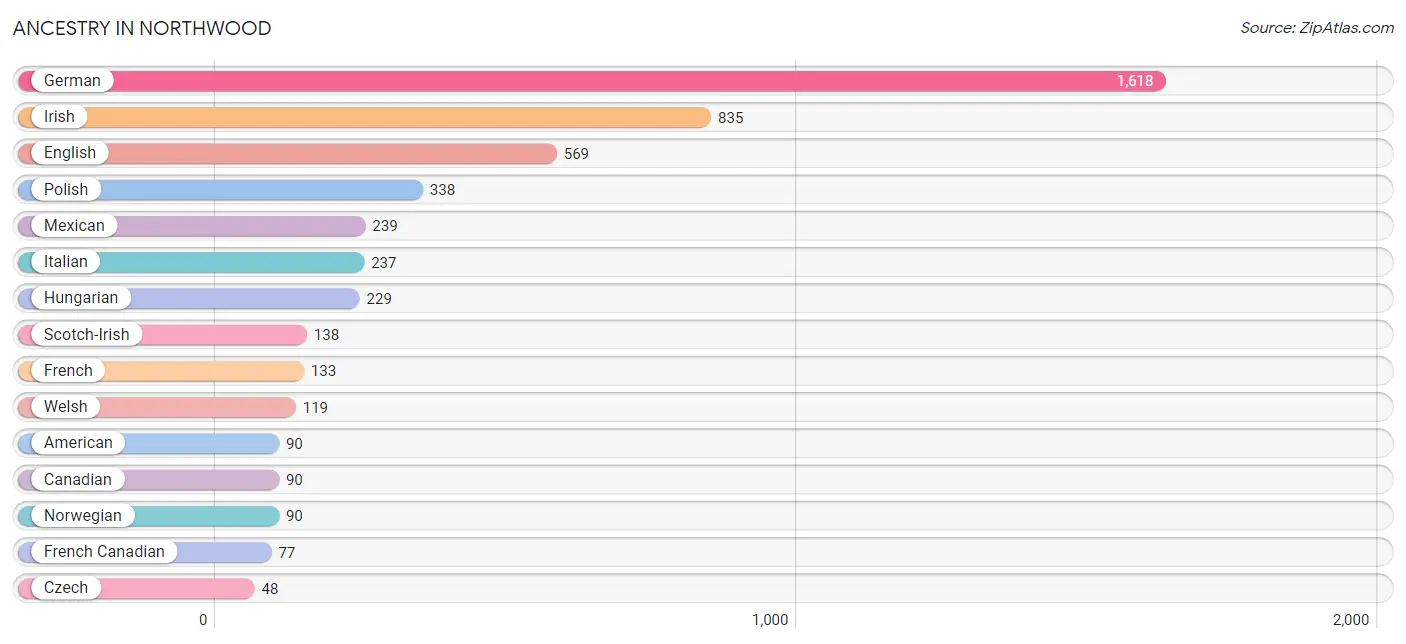
| Ancestry | # Population | % Population |
| American | 90 | 1.7% |
| Armenian | 13 | 0.3% |
| British | 5 | 0.1% |
| Canadian | 90 | 1.7% |
| Czech | 48 | 0.9% |
| Czechoslovakian | 21 | 0.4% |
| Dutch | 7 | 0.1% |
| English | 569 | 11.0% |
| European | 38 | 0.7% |
| French | 133 | 2.6% |
| French Canadian | 77 | 1.5% |
| German | 1,618 | 31.2% |
| Hungarian | 229 | 4.4% |
| Irish | 835 | 16.1% |
| Italian | 237 | 4.6% |
| Korean | 33 | 0.6% |
| Malaysian | 31 | 0.6% |
| Mexican | 239 | 4.6% |
| Northern European | 6 | 0.1% |
| Norwegian | 90 | 1.7% |
| Polish | 338 | 6.5% |
| Russian | 29 | 0.6% |
| Scotch-Irish | 138 | 2.7% |
| Scottish | 45 | 0.9% |
| Slovak | 13 | 0.3% |
| Spanish | 2 | 0.0% |
| Welsh | 119 | 2.3% | View All 27 Rows |
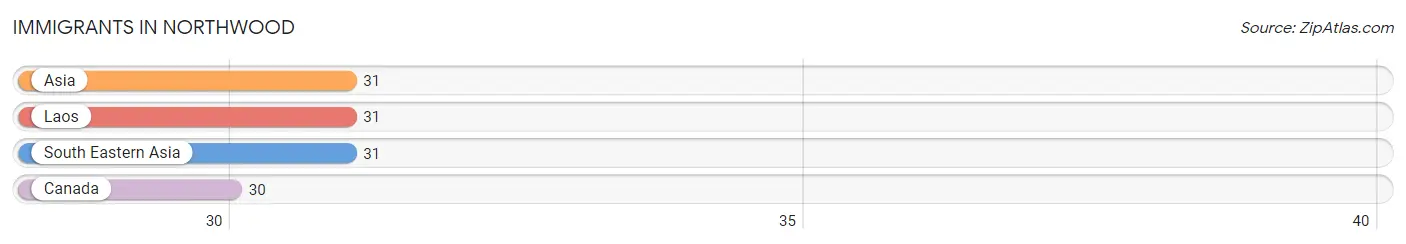
Immigrants in Northwood
The most numerous immigrant groups reported in Northwood came from Asia (31 | 0.6%), Laos (31 | 0.6%), South Eastern Asia (31 | 0.6%), and Canada (30 | 0.6%), together accounting for 2.4% of all Northwood residents.
| Immigration Origin | # Population | % Population |
| Asia | 31 | 0.6% |
| Canada | 30 | 0.6% |
| Laos | 31 | 0.6% |
| South Eastern Asia | 31 | 0.6% | View All 4 Rows |
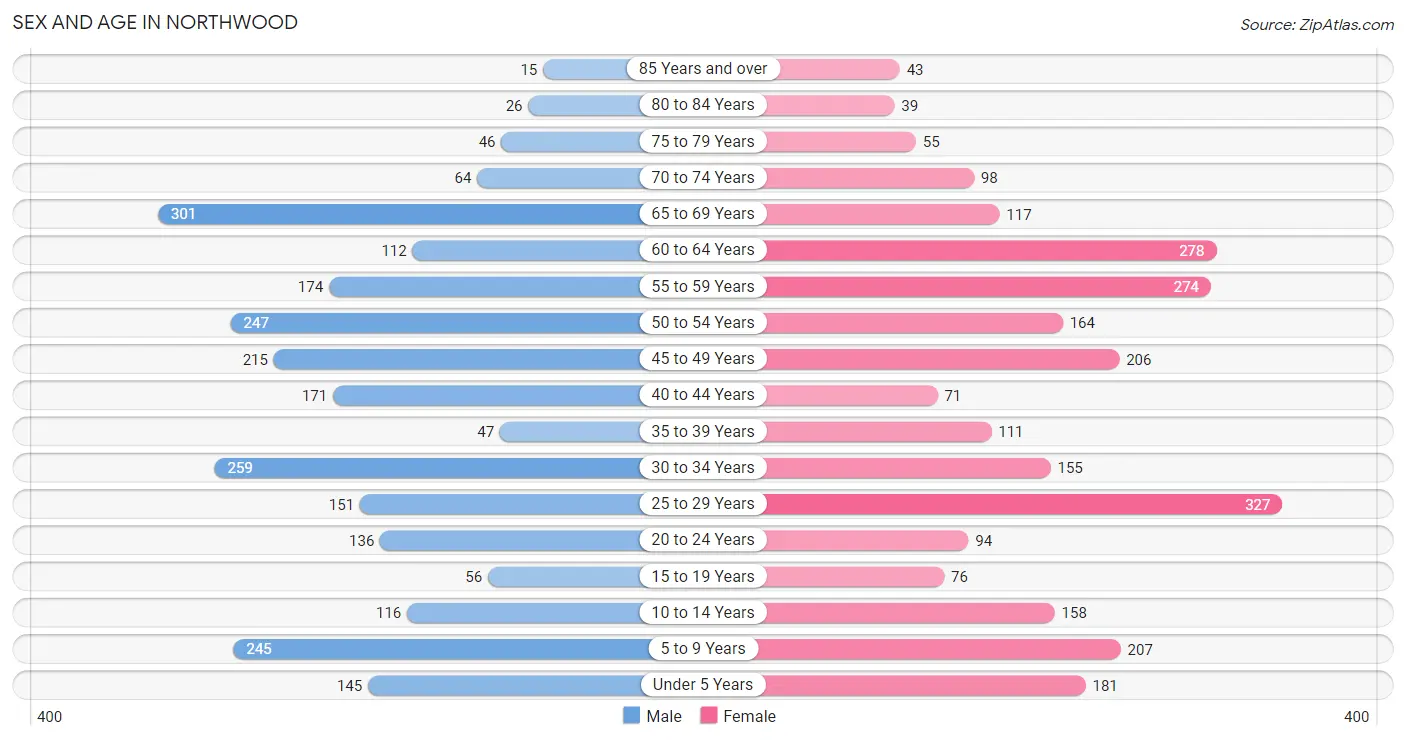
Sex and Age in Northwood
Sex and Age in Northwood
The most populous age groups in Northwood are 65 to 69 Years (301 | 11.9%) for men and 25 to 29 Years (327 | 12.3%) for women.
| Age Bracket | Male | Female |
| Under 5 Years | 145 (5.7%) | 181 (6.8%) |
| 5 to 9 Years | 245 (9.7%) | 207 (7.8%) |
| 10 to 14 Years | 116 (4.6%) | 158 (5.9%) |
| 15 to 19 Years | 56 (2.2%) | 76 (2.9%) |
| 20 to 24 Years | 136 (5.4%) | 94 (3.5%) |
| 25 to 29 Years | 151 (6.0%) | 327 (12.3%) |
| 30 to 34 Years | 259 (10.2%) | 155 (5.8%) |
| 35 to 39 Years | 47 (1.9%) | 111 (4.2%) |
| 40 to 44 Years | 171 (6.8%) | 71 (2.7%) |
| 45 to 49 Years | 215 (8.5%) | 206 (7.8%) |
| 50 to 54 Years | 247 (9.8%) | 164 (6.2%) |
| 55 to 59 Years | 174 (6.9%) | 274 (10.3%) |
| 60 to 64 Years | 112 (4.4%) | 278 (10.5%) |
| 65 to 69 Years | 301 (11.9%) | 117 (4.4%) |
| 70 to 74 Years | 64 (2.5%) | 98 (3.7%) |
| 75 to 79 Years | 46 (1.8%) | 55 (2.1%) |
| 80 to 84 Years | 26 (1.0%) | 39 (1.5%) |
| 85 Years and over | 15 (0.6%) | 43 (1.6%) |
| Total | 2,526 (100.0%) | 2,654 (100.0%) |
Families and Households in Northwood
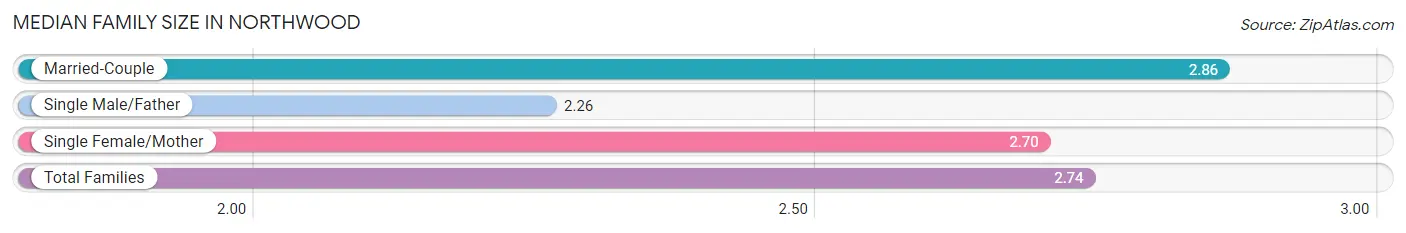
Median Family Size in Northwood
The median family size in Northwood is 2.74 persons per family, with married-couple families (1,006 | 66.2%) accounting for the largest median family size of 2.86 persons per family. On the other hand, single male/father families (226 | 14.9%) represent the smallest median family size with 2.26 persons per family.
| Family Type | # Families | Family Size |
| Married-Couple | 1,006 (66.2%) | 2.86 |
| Single Male/Father | 226 (14.9%) | 2.26 |
| Single Female/Mother | 288 (19.0%) | 2.70 |
| Total Families | 1,520 (100.0%) | 2.74 |
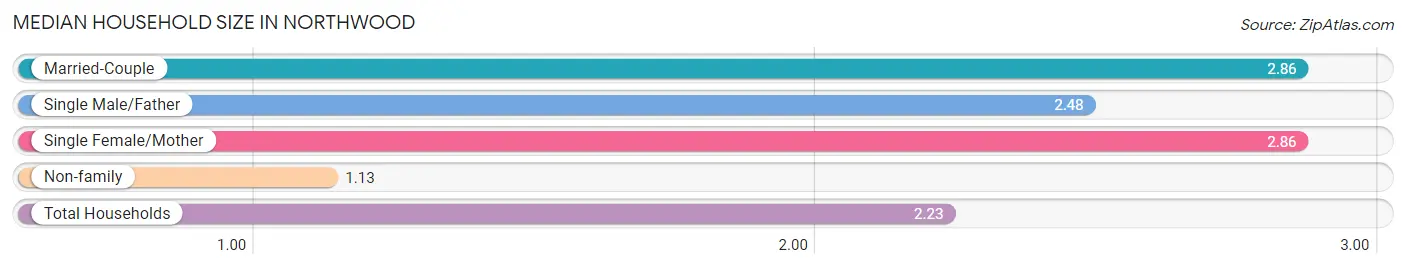
Median Household Size in Northwood
The median household size in Northwood is 2.23 persons per household, with married-couple households (1,006 | 43.4%) accounting for the largest median household size of 2.86 persons per household. non-family households (798 | 34.4%) represent the smallest median household size with 1.13 persons per household.
| Household Type | # Households | Household Size |
| Married-Couple | 1,006 (43.4%) | 2.86 |
| Single Male/Father | 226 (9.8%) | 2.48 |
| Single Female/Mother | 288 (12.4%) | 2.86 |
| Non-family | 798 (34.4%) | 1.13 |
| Total Households | 2,318 (100.0%) | 2.23 |
Household Size by Marriage Status in Northwood
Out of a total of 2,318 households in Northwood, 1,520 (65.6%) are family households, while 798 (34.4%) are nonfamily households. The most numerous type of family households are 2-person households, comprising 862, and the most common type of nonfamily households are 1-person households, comprising 691.
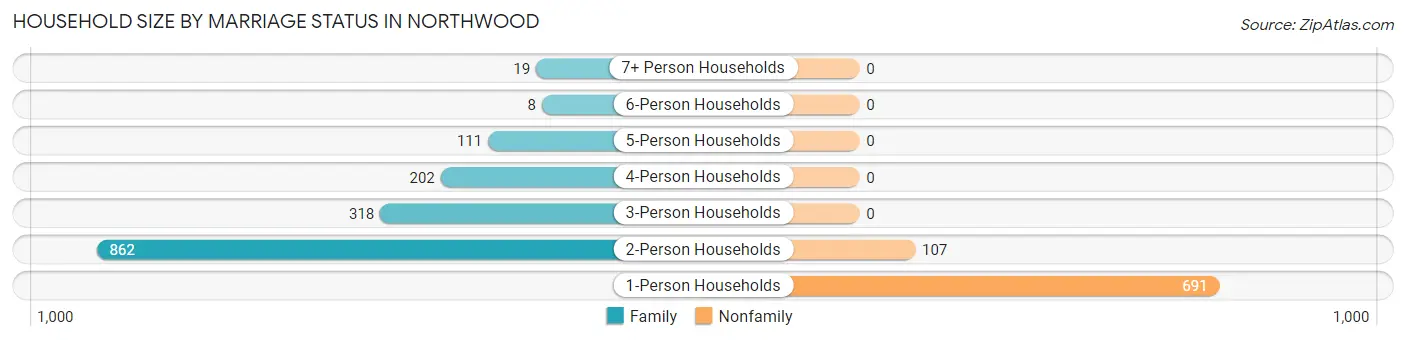
| Household Size | Family Households | Nonfamily Households |
| 1-Person Households | - | 691 (29.8%) |
| 2-Person Households | 862 (37.2%) | 107 (4.6%) |
| 3-Person Households | 318 (13.7%) | 0 (0.0%) |
| 4-Person Households | 202 (8.7%) | 0 (0.0%) |
| 5-Person Households | 111 (4.8%) | 0 (0.0%) |
| 6-Person Households | 8 (0.4%) | 0 (0.0%) |
| 7+ Person Households | 19 (0.8%) | 0 (0.0%) |
| Total | 1,520 (65.6%) | 798 (34.4%) |
Female Fertility in Northwood
Fertility by Age in Northwood
Average fertility rate in Northwood is 24.0 births per 1,000 women. Women in the age bracket of 20 to 34 years have the highest fertility rate with 43.0 births per 1,000 women. Women in the age bracket of 20 to 34 years acount for 100.0% of all women with births.
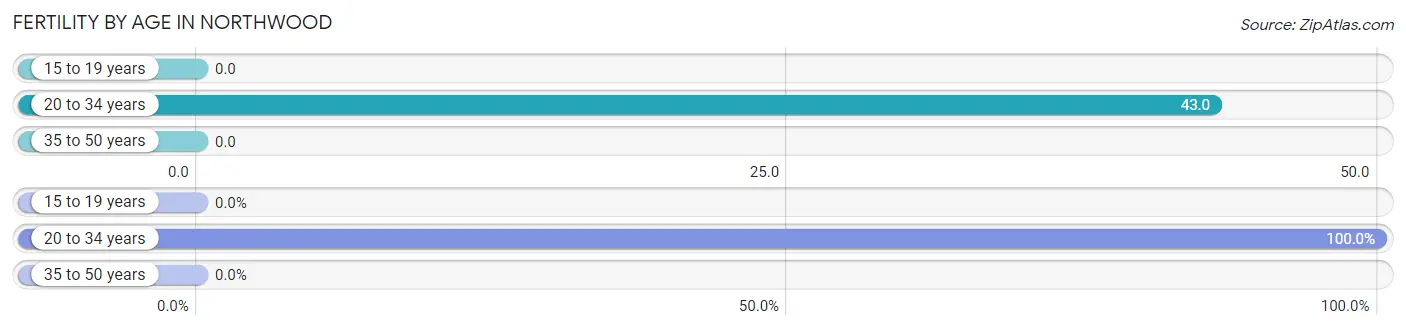
| Age Bracket | Women with Births | Births / 1,000 Women |
| 15 to 19 years | 0 (0.0%) | 0.0 |
| 20 to 34 years | 25 (100.0%) | 43.0 |
| 35 to 50 years | 0 (0.0%) | 0.0 |
| Total | 25 (100.0%) | 24.0 |
Fertility by Age by Marriage Status in Northwood
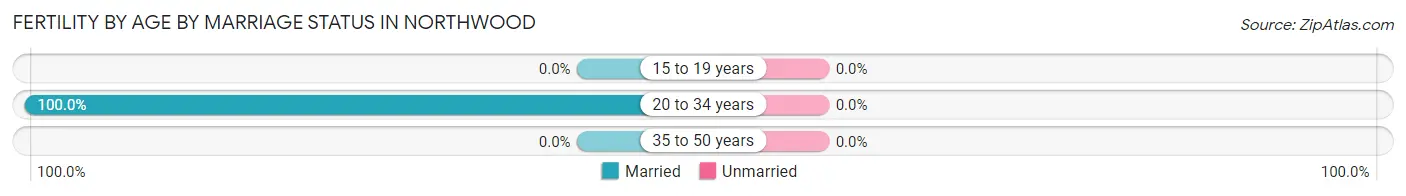
| Age Bracket | Married | Unmarried |
| 15 to 19 years | 0 (0.0%) | 0 (0.0%) |
| 20 to 34 years | 25 (100.0%) | 0 (0.0%) |
| 35 to 50 years | 0 (0.0%) | 0 (0.0%) |
| Total | 25 (100.0%) | 0 (0.0%) |
Fertility by Education in Northwood
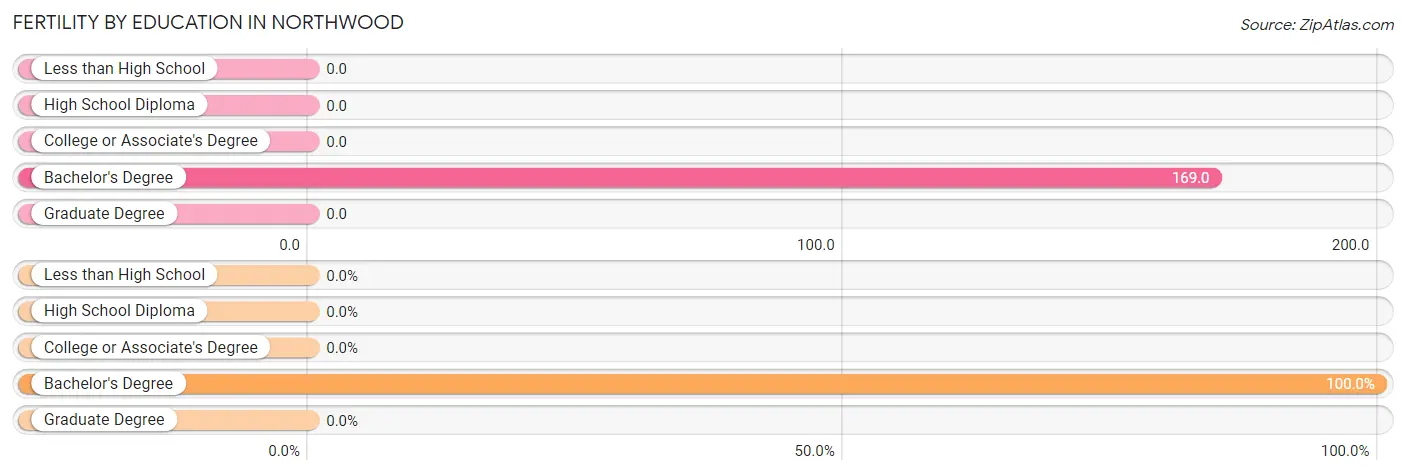
| Educational Attainment | Women with Births | Births / 1,000 Women |
| Less than High School | 0 (0.0%) | 0.0 |
| High School Diploma | 0 (0.0%) | 0.0 |
| College or Associate's Degree | 0 (0.0%) | 0.0 |
| Bachelor's Degree | 25 (100.0%) | 169.0 |
| Graduate Degree | 0 (0.0%) | 0.0 |
| Total | 25 (100.0%) | 24.0 |
Fertility by Education by Marriage Status in Northwood
| Educational Attainment | Married | Unmarried |
| Less than High School | 0 (0.0%) | 0 (0.0%) |
| High School Diploma | 0 (0.0%) | 0 (0.0%) |
| College or Associate's Degree | 0 (0.0%) | 0 (0.0%) |
| Bachelor's Degree | 25 (100.0%) | 0 (0.0%) |
| Graduate Degree | 0 (0.0%) | 0 (0.0%) |
| Total | 25 (100.0%) | 0 (0.0%) |
Employment Characteristics in Northwood
Employment by Class of Employer in Northwood
Among the 2,951 employed individuals in Northwood, private company employees (1,887 | 63.9%), local government employees (483 | 16.4%), and not-for-profit organizations (417 | 14.1%) make up the most common classes of employment.
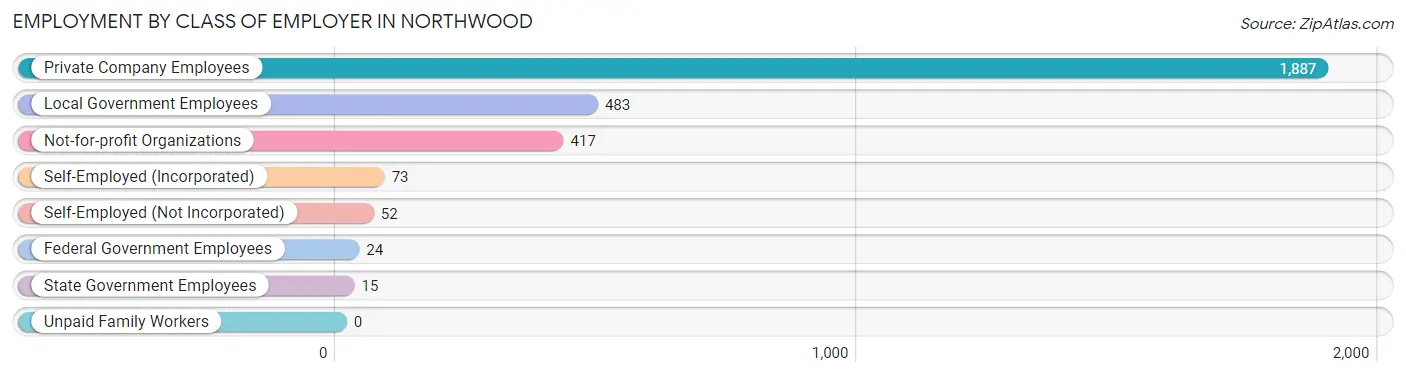
| Employer Class | # Employees | % Employees |
| Private Company Employees | 1,887 | 63.9% |
| Self-Employed (Incorporated) | 73 | 2.5% |
| Self-Employed (Not Incorporated) | 52 | 1.8% |
| Not-for-profit Organizations | 417 | 14.1% |
| Local Government Employees | 483 | 16.4% |
| State Government Employees | 15 | 0.5% |
| Federal Government Employees | 24 | 0.8% |
| Unpaid Family Workers | 0 | 0.0% |
| Total | 2,951 | 100.0% |
Employment Status by Age in Northwood
According to the labor force statistics for Northwood, out of the total population over 16 years of age (4,115), 73.9% or 3,041 individuals are in the labor force, with 0.7% or 21 of them unemployed. The age group with the highest labor force participation rate is 20 to 24 years, with 100.0% or 230 individuals in the labor force. Within the labor force, the 35 to 44 years age range has the highest percentage of unemployed individuals, with 5.8% or 22 of them being unemployed.
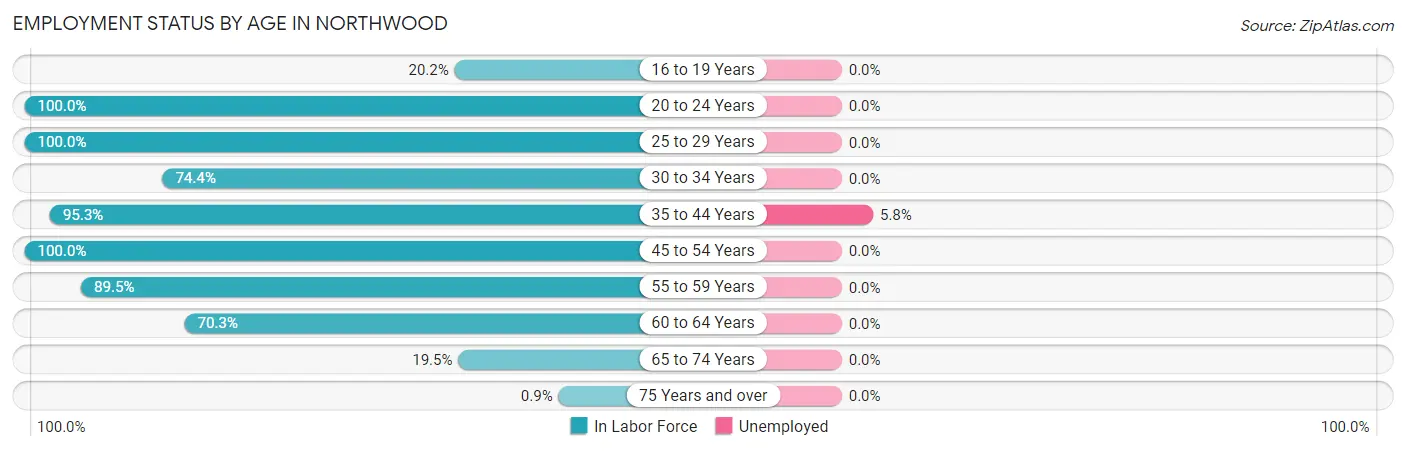
| Age Bracket | In Labor Force | Unemployed |
| 16 to 19 Years | 24 (20.2%) | 0 (0.0%) |
| 20 to 24 Years | 230 (100.0%) | 0 (0.0%) |
| 25 to 29 Years | 478 (100.0%) | 0 (0.0%) |
| 30 to 34 Years | 308 (74.4%) | 0 (0.0%) |
| 35 to 44 Years | 381 (95.3%) | 22 (5.8%) |
| 45 to 54 Years | 832 (100.0%) | 0 (0.0%) |
| 55 to 59 Years | 401 (89.5%) | 0 (0.0%) |
| 60 to 64 Years | 274 (70.3%) | 0 (0.0%) |
| 65 to 74 Years | 113 (19.5%) | 0 (0.0%) |
| 75 Years and over | 2 (0.9%) | 0 (0.0%) |
| Total | 3,041 (73.9%) | 21 (0.7%) |
Employment Status by Educational Attainment in Northwood
According to labor force statistics for Northwood, 90.3% of individuals (2,675) out of the total population between 25 and 64 years of age (2,962) are in the labor force, with 0.8% or 21 of them being unemployed. The group with the highest labor force participation rate are those with the educational attainment of college / associate degree, with 98.5% or 950 individuals in the labor force. Within the labor force, individuals with less than high school education have the highest percentage of unemployment, with 2.7% or 5 of them being unemployed.
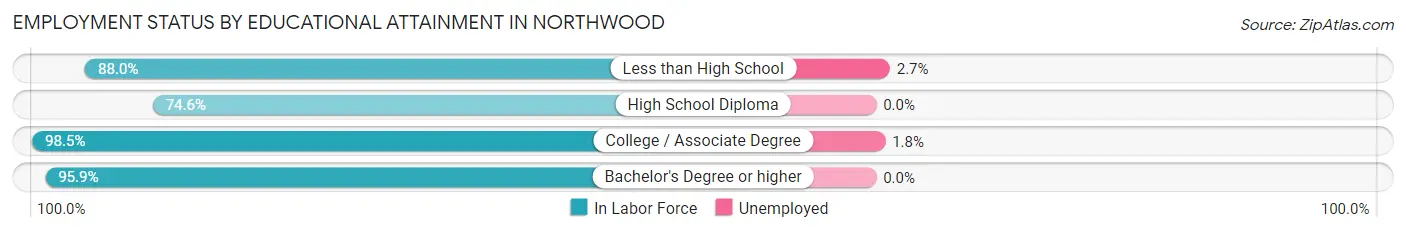
| Educational Attainment | In Labor Force | Unemployed |
| Less than High School | 183 (88.0%) | 6 (2.7%) |
| High School Diploma | 618 (74.6%) | 0 (0.0%) |
| College / Associate Degree | 950 (98.5%) | 17 (1.8%) |
| Bachelor's Degree or higher | 923 (95.9%) | 0 (0.0%) |
| Total | 2,675 (90.3%) | 24 (0.8%) |
Employment Occupations by Sex in Northwood
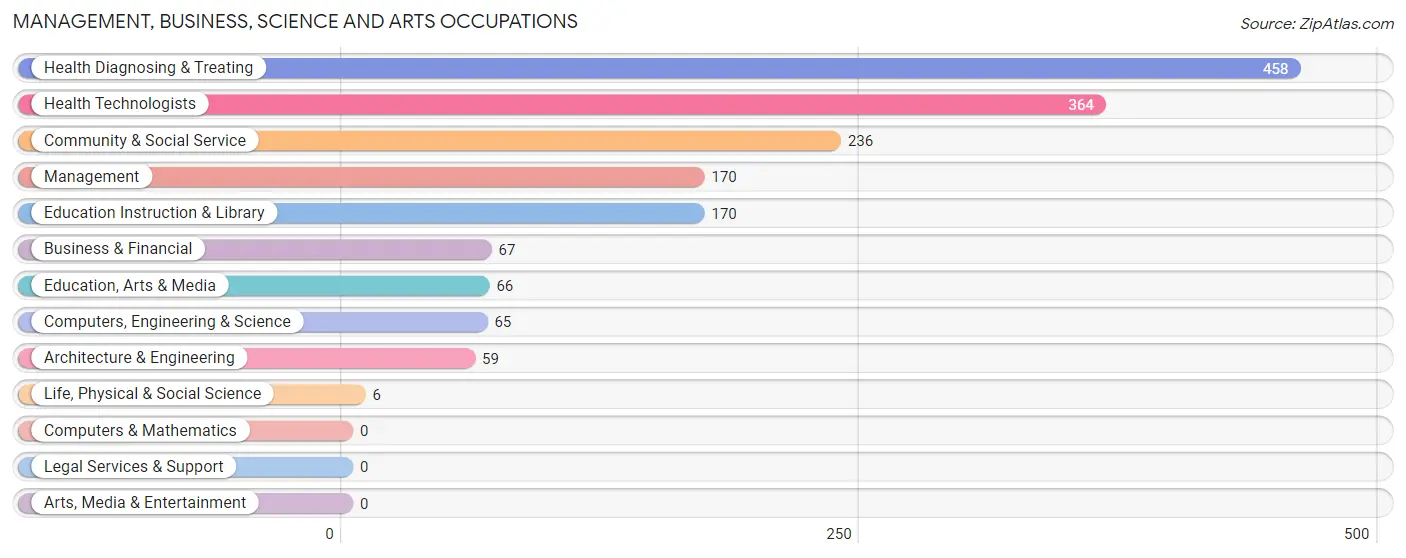
Management, Business, Science and Arts Occupations
The most common Management, Business, Science and Arts occupations in Northwood are Health Diagnosing & Treating (458 | 15.2%), Health Technologists (364 | 12.0%), Community & Social Service (236 | 7.8%), Management (170 | 5.6%), and Education Instruction & Library (170 | 5.6%).
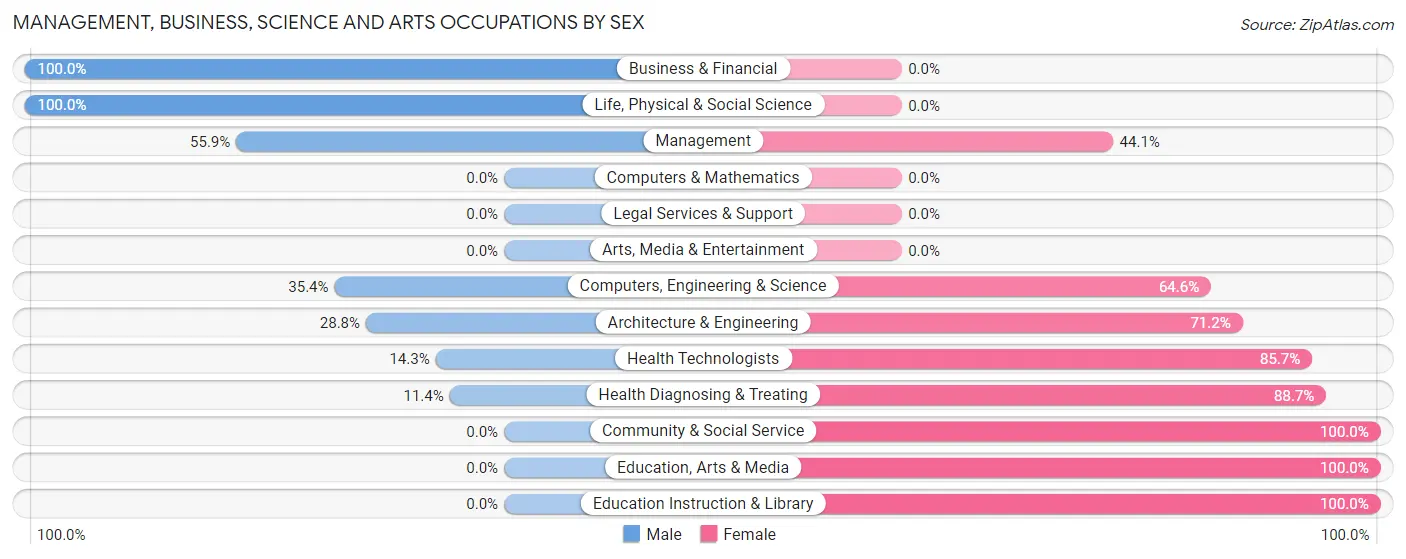
Management, Business, Science and Arts Occupations by Sex
Within the Management, Business, Science and Arts occupations in Northwood, the most male-oriented occupations are Business & Financial (100.0%), Life, Physical & Social Science (100.0%), and Management (55.9%), while the most female-oriented occupations are Community & Social Service (100.0%), Education, Arts & Media (100.0%), and Education Instruction & Library (100.0%).
| Occupation | Male | Female |
| Management | 95 (55.9%) | 75 (44.1%) |
| Business & Financial | 67 (100.0%) | 0 (0.0%) |
| Computers, Engineering & Science | 23 (35.4%) | 42 (64.6%) |
| Computers & Mathematics | 0 (0.0%) | 0 (0.0%) |
| Architecture & Engineering | 17 (28.8%) | 42 (71.2%) |
| Life, Physical & Social Science | 6 (100.0%) | 0 (0.0%) |
| Community & Social Service | 0 (0.0%) | 236 (100.0%) |
| Education, Arts & Media | 0 (0.0%) | 66 (100.0%) |
| Legal Services & Support | 0 (0.0%) | 0 (0.0%) |
| Education Instruction & Library | 0 (0.0%) | 170 (100.0%) |
| Arts, Media & Entertainment | 0 (0.0%) | 0 (0.0%) |
| Health Diagnosing & Treating | 52 (11.4%) | 406 (88.6%) |
| Health Technologists | 52 (14.3%) | 312 (85.7%) |
| Total (Category) | 237 (23.8%) | 759 (76.2%) |
| Total (Overall) | 1,416 (46.9%) | 1,605 (53.1%) |
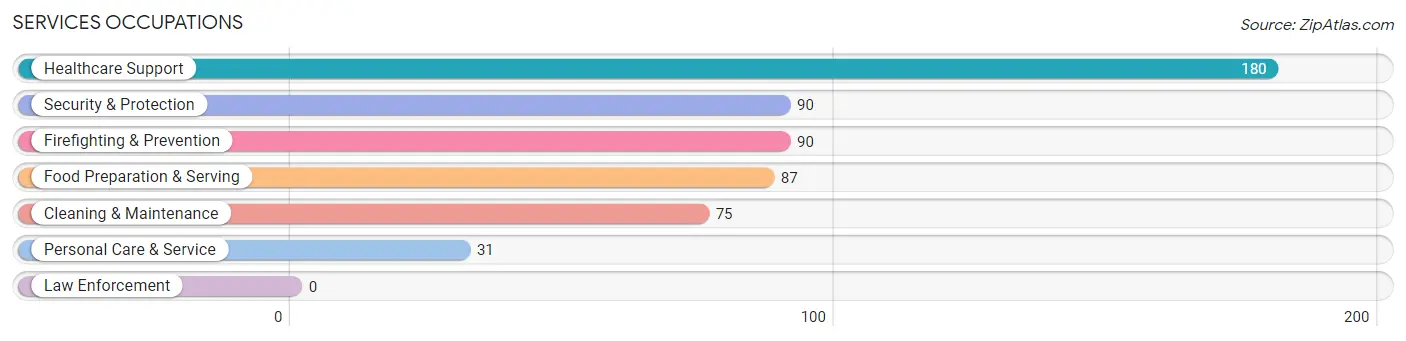
Services Occupations
The most common Services occupations in Northwood are Healthcare Support (180 | 6.0%), Security & Protection (90 | 3.0%), Firefighting & Prevention (90 | 3.0%), Food Preparation & Serving (87 | 2.9%), and Cleaning & Maintenance (75 | 2.5%).
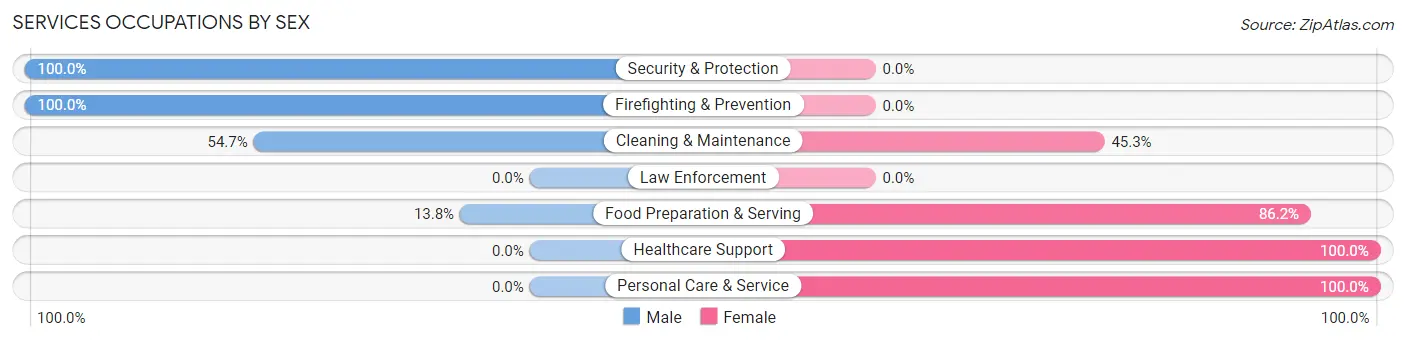
Services Occupations by Sex
Within the Services occupations in Northwood, the most male-oriented occupations are Security & Protection (100.0%), Firefighting & Prevention (100.0%), and Cleaning & Maintenance (54.7%), while the most female-oriented occupations are Healthcare Support (100.0%), Personal Care & Service (100.0%), and Food Preparation & Serving (86.2%).
| Occupation | Male | Female |
| Healthcare Support | 0 (0.0%) | 180 (100.0%) |
| Security & Protection | 90 (100.0%) | 0 (0.0%) |
| Firefighting & Prevention | 90 (100.0%) | 0 (0.0%) |
| Law Enforcement | 0 (0.0%) | 0 (0.0%) |
| Food Preparation & Serving | 12 (13.8%) | 75 (86.2%) |
| Cleaning & Maintenance | 41 (54.7%) | 34 (45.3%) |
| Personal Care & Service | 0 (0.0%) | 31 (100.0%) |
| Total (Category) | 143 (30.9%) | 320 (69.1%) |
| Total (Overall) | 1,416 (46.9%) | 1,605 (53.1%) |
Sales and Office Occupations
The most common Sales and Office occupations in Northwood are Sales & Related (328 | 10.9%), and Office & Administration (324 | 10.7%).
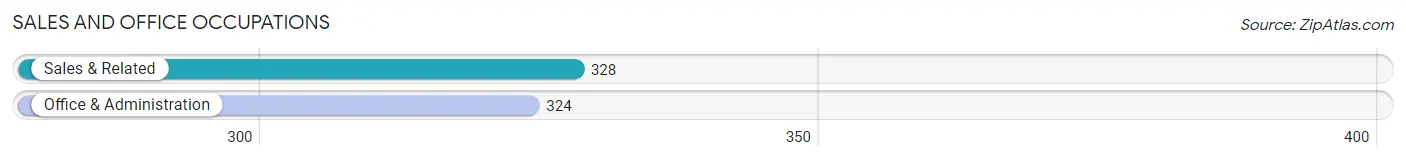
Sales and Office Occupations by Sex
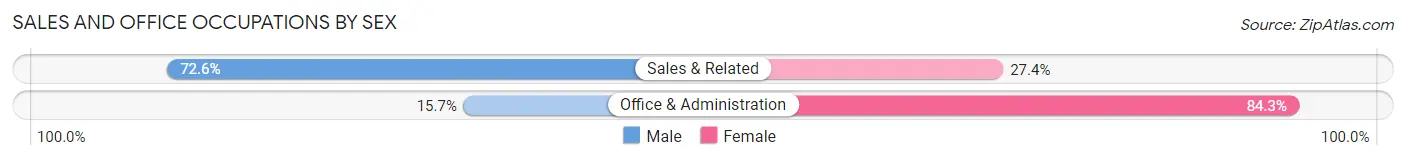
| Occupation | Male | Female |
| Sales & Related | 238 (72.6%) | 90 (27.4%) |
| Office & Administration | 51 (15.7%) | 273 (84.3%) |
| Total (Category) | 289 (44.3%) | 363 (55.7%) |
| Total (Overall) | 1,416 (46.9%) | 1,605 (53.1%) |
Natural Resources, Construction and Maintenance Occupations
The most common Natural Resources, Construction and Maintenance occupations in Northwood are Construction & Extraction (109 | 3.6%), and Installation, Maintenance & Repair (47 | 1.6%).
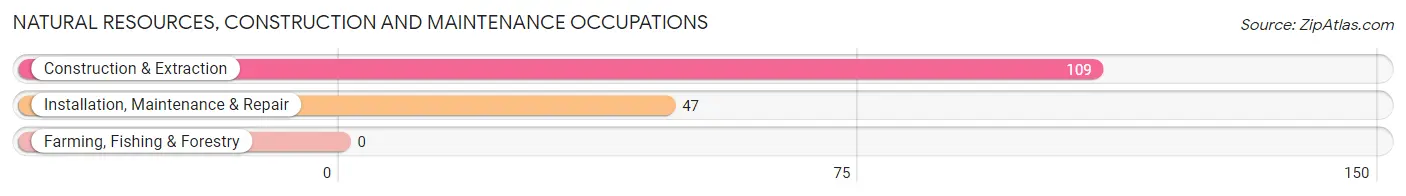
Natural Resources, Construction and Maintenance Occupations by Sex
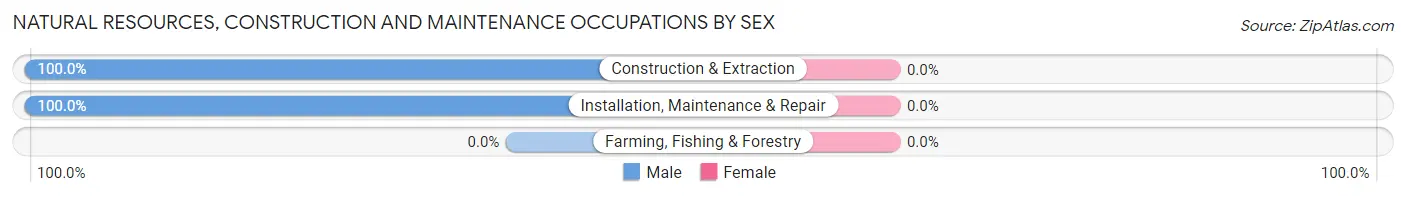
| Occupation | Male | Female |
| Farming, Fishing & Forestry | 0 (0.0%) | 0 (0.0%) |
| Construction & Extraction | 109 (100.0%) | 0 (0.0%) |
| Installation, Maintenance & Repair | 47 (100.0%) | 0 (0.0%) |
| Total (Category) | 156 (100.0%) | 0 (0.0%) |
| Total (Overall) | 1,416 (46.9%) | 1,605 (53.1%) |
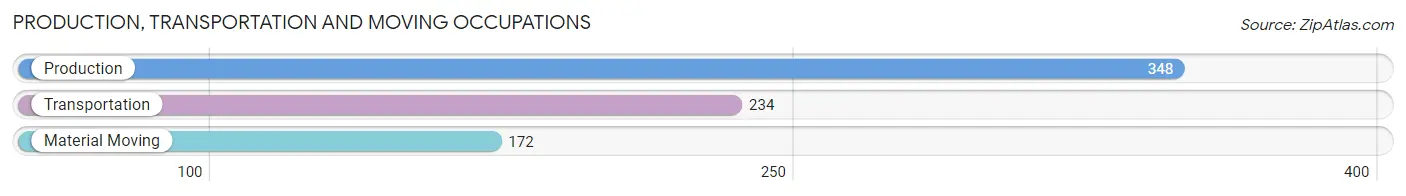
Production, Transportation and Moving Occupations
The most common Production, Transportation and Moving occupations in Northwood are Production (348 | 11.5%), Transportation (234 | 7.7%), and Material Moving (172 | 5.7%).
Production, Transportation and Moving Occupations by Sex
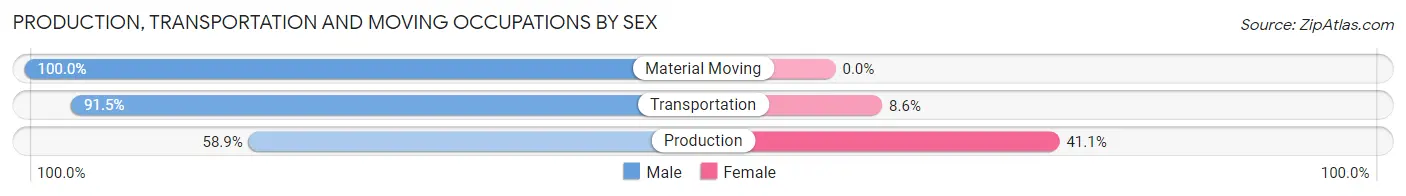
| Occupation | Male | Female |
| Production | 205 (58.9%) | 143 (41.1%) |
| Transportation | 214 (91.4%) | 20 (8.6%) |
| Material Moving | 172 (100.0%) | 0 (0.0%) |
| Total (Category) | 591 (78.4%) | 163 (21.6%) |
| Total (Overall) | 1,416 (46.9%) | 1,605 (53.1%) |
Employment Industries by Sex in Northwood
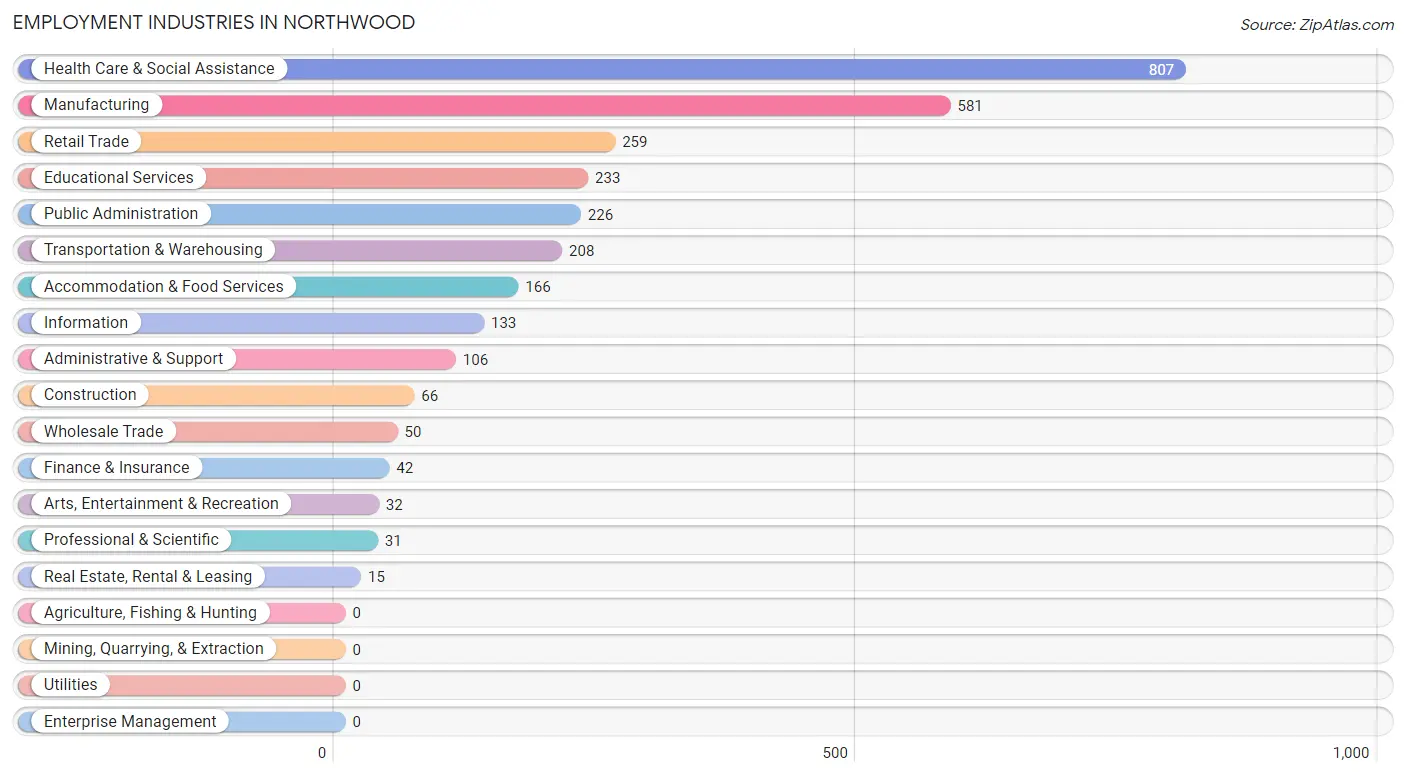
Employment Industries in Northwood
The major employment industries in Northwood include Health Care & Social Assistance (807 | 26.7%), Manufacturing (581 | 19.2%), Retail Trade (259 | 8.6%), Educational Services (233 | 7.7%), and Public Administration (226 | 7.5%).
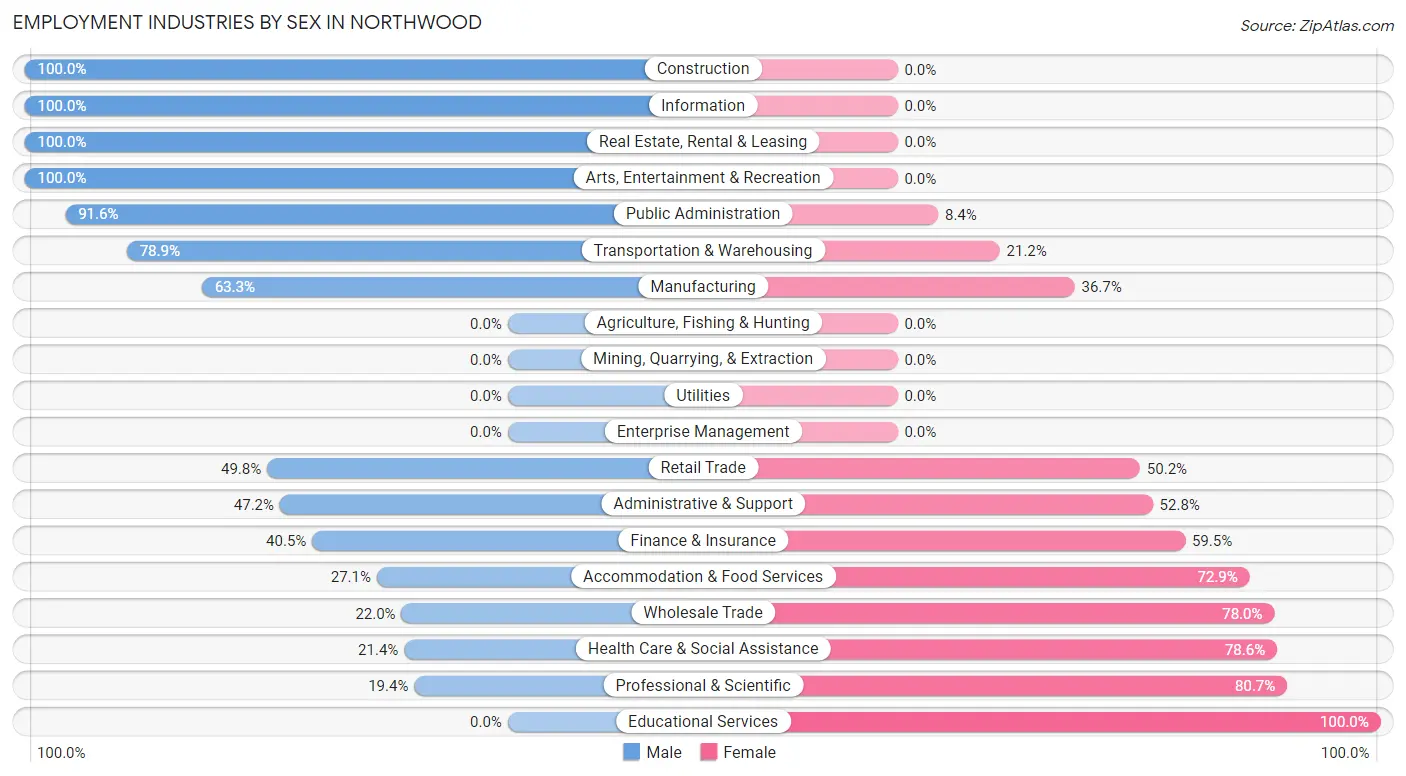
Employment Industries by Sex in Northwood
The Northwood industries that see more men than women are Construction (100.0%), Information (100.0%), and Real Estate, Rental & Leasing (100.0%), whereas the industries that tend to have a higher number of women are Educational Services (100.0%), Professional & Scientific (80.6%), and Health Care & Social Assistance (78.6%).
| Industry | Male | Female |
| Agriculture, Fishing & Hunting | 0 (0.0%) | 0 (0.0%) |
| Mining, Quarrying, & Extraction | 0 (0.0%) | 0 (0.0%) |
| Construction | 66 (100.0%) | 0 (0.0%) |
| Manufacturing | 368 (63.3%) | 213 (36.7%) |
| Wholesale Trade | 11 (22.0%) | 39 (78.0%) |
| Retail Trade | 129 (49.8%) | 130 (50.2%) |
| Transportation & Warehousing | 164 (78.8%) | 44 (21.1%) |
| Utilities | 0 (0.0%) | 0 (0.0%) |
| Information | 133 (100.0%) | 0 (0.0%) |
| Finance & Insurance | 17 (40.5%) | 25 (59.5%) |
| Real Estate, Rental & Leasing | 15 (100.0%) | 0 (0.0%) |
| Professional & Scientific | 6 (19.4%) | 25 (80.6%) |
| Enterprise Management | 0 (0.0%) | 0 (0.0%) |
| Administrative & Support | 50 (47.2%) | 56 (52.8%) |
| Educational Services | 0 (0.0%) | 233 (100.0%) |
| Health Care & Social Assistance | 173 (21.4%) | 634 (78.6%) |
| Arts, Entertainment & Recreation | 32 (100.0%) | 0 (0.0%) |
| Accommodation & Food Services | 45 (27.1%) | 121 (72.9%) |
| Public Administration | 207 (91.6%) | 19 (8.4%) |
| Total | 1,416 (46.9%) | 1,605 (53.1%) |
Education in Northwood
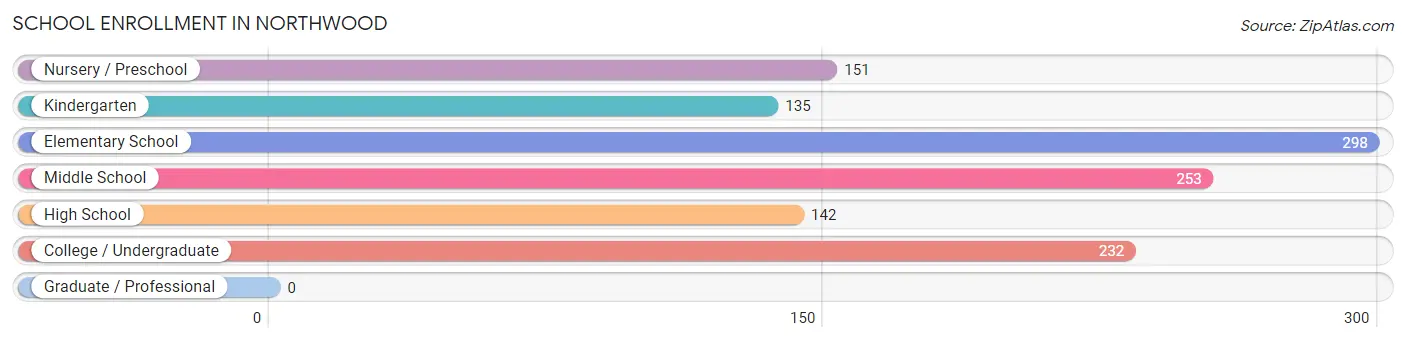
School Enrollment in Northwood
The most common levels of schooling among the 1,211 students in Northwood are elementary school (298 | 24.6%), middle school (253 | 20.9%), and college / undergraduate (232 | 19.2%).
| School Level | # Students | % Students |
| Nursery / Preschool | 151 | 12.5% |
| Kindergarten | 135 | 11.2% |
| Elementary School | 298 | 24.6% |
| Middle School | 253 | 20.9% |
| High School | 142 | 11.7% |
| College / Undergraduate | 232 | 19.2% |
| Graduate / Professional | 0 | 0.0% |
| Total | 1,211 | 100.0% |
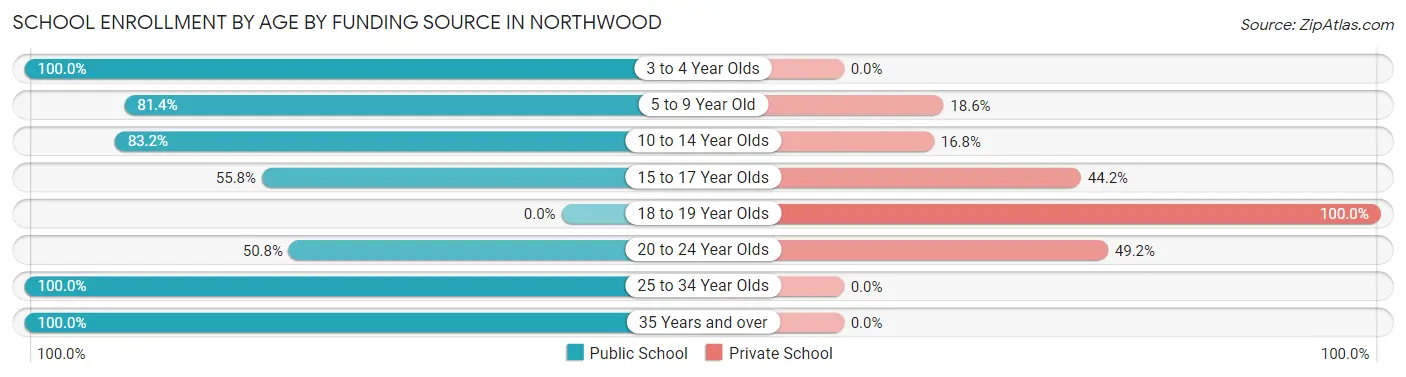
School Enrollment by Age by Funding Source in Northwood
Out of a total of 1,211 students who are enrolled in schools in Northwood, 265 (21.9%) attend a private institution, while the remaining 946 (78.1%) are enrolled in public schools. The age group of 18 to 19 year olds has the highest likelihood of being enrolled in private schools, with 35 (100.0% in the age bracket) enrolled. Conversely, the age group of 3 to 4 year olds has the lowest likelihood of being enrolled in a private school, with 132 (100.0% in the age bracket) attending a public institution.
| Age Bracket | Public School | Private School |
| 3 to 4 Year Olds | 132 (100.0%) | 0 (0.0%) |
| 5 to 9 Year Old | 368 (81.4%) | 84 (18.6%) |
| 10 to 14 Year Olds | 228 (83.2%) | 46 (16.8%) |
| 15 to 17 Year Olds | 48 (55.8%) | 38 (44.2%) |
| 18 to 19 Year Olds | 0 (0.0%) | 35 (100.0%) |
| 20 to 24 Year Olds | 64 (50.8%) | 62 (49.2%) |
| 25 to 34 Year Olds | 37 (100.0%) | 0 (0.0%) |
| 35 Years and over | 69 (100.0%) | 0 (0.0%) |
| Total | 946 (78.1%) | 265 (21.9%) |
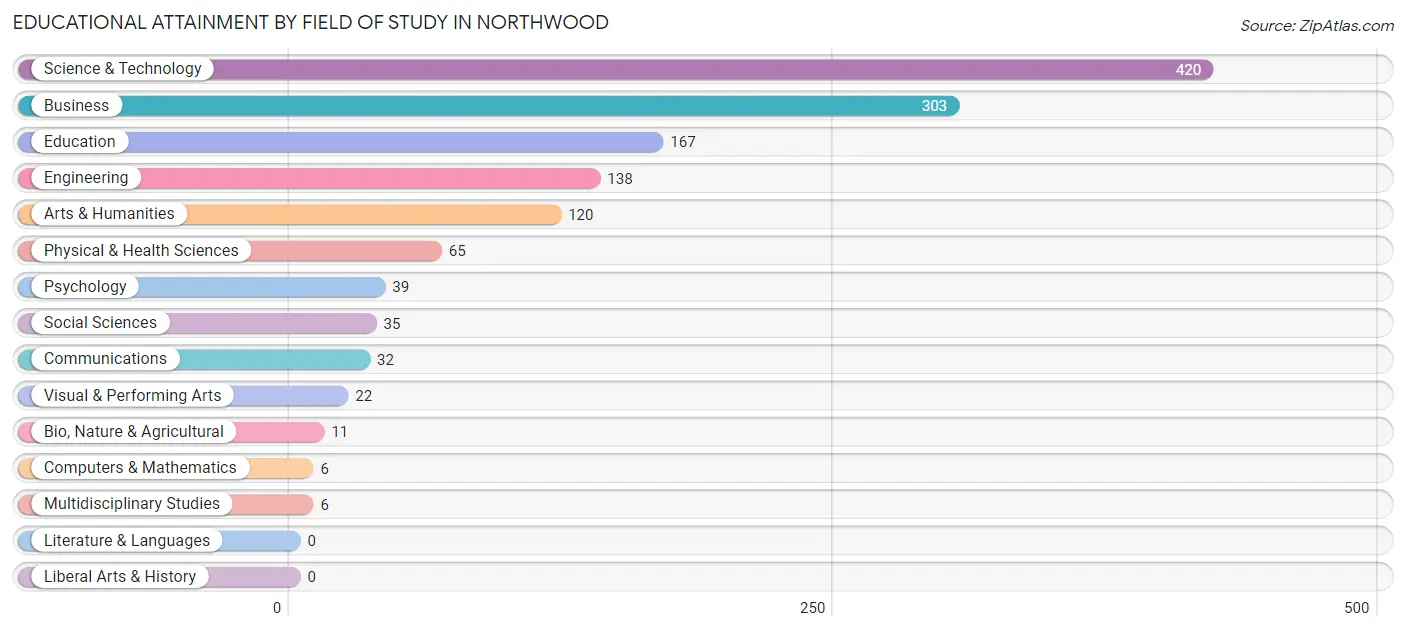
Educational Attainment by Field of Study in Northwood
Science & technology (420 | 30.8%), business (303 | 22.2%), education (167 | 12.2%), engineering (138 | 10.1%), and arts & humanities (120 | 8.8%) are the most common fields of study among 1,364 individuals in Northwood who have obtained a bachelor's degree or higher.
| Field of Study | # Graduates | % Graduates |
| Computers & Mathematics | 6 | 0.4% |
| Bio, Nature & Agricultural | 11 | 0.8% |
| Physical & Health Sciences | 65 | 4.8% |
| Psychology | 39 | 2.9% |
| Social Sciences | 35 | 2.6% |
| Engineering | 138 | 10.1% |
| Multidisciplinary Studies | 6 | 0.4% |
| Science & Technology | 420 | 30.8% |
| Business | 303 | 22.2% |
| Education | 167 | 12.2% |
| Literature & Languages | 0 | 0.0% |
| Liberal Arts & History | 0 | 0.0% |
| Visual & Performing Arts | 22 | 1.6% |
| Communications | 32 | 2.4% |
| Arts & Humanities | 120 | 8.8% |
| Total | 1,364 | 100.0% |
Transportation & Commute in Northwood
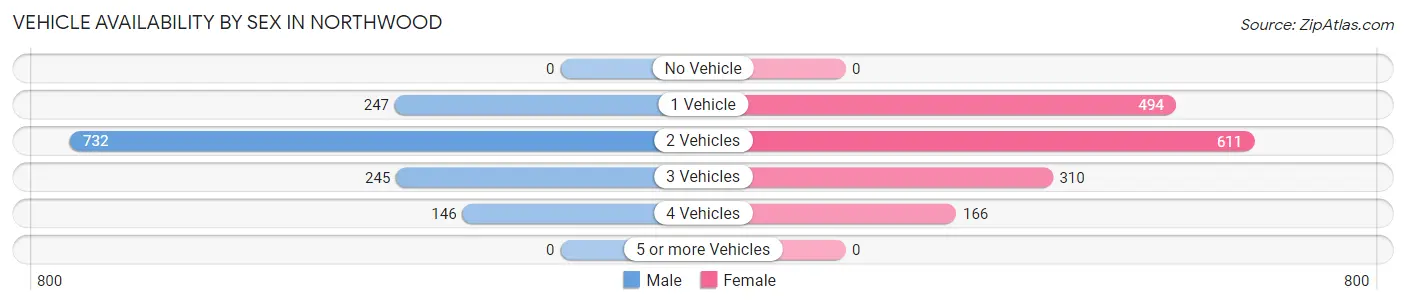
Vehicle Availability by Sex in Northwood
The most prevalent vehicle ownership categories in Northwood are males with 2 vehicles (732, accounting for 53.4%) and females with 2 vehicles (611, making up 46.3%).
| Vehicles Available | Male | Female |
| No Vehicle | 0 (0.0%) | 0 (0.0%) |
| 1 Vehicle | 247 (18.0%) | 494 (31.2%) |
| 2 Vehicles | 732 (53.4%) | 611 (38.7%) |
| 3 Vehicles | 245 (17.9%) | 310 (19.6%) |
| 4 Vehicles | 146 (10.7%) | 166 (10.5%) |
| 5 or more Vehicles | 0 (0.0%) | 0 (0.0%) |
| Total | 1,370 (100.0%) | 1,581 (100.0%) |
Commute Time in Northwood
The most frequently occuring commute durations in Northwood are 15 to 19 minutes (708 commuters, 24.6%), 5 to 9 minutes (602 commuters, 20.9%), and 20 to 24 minutes (556 commuters, 19.4%).
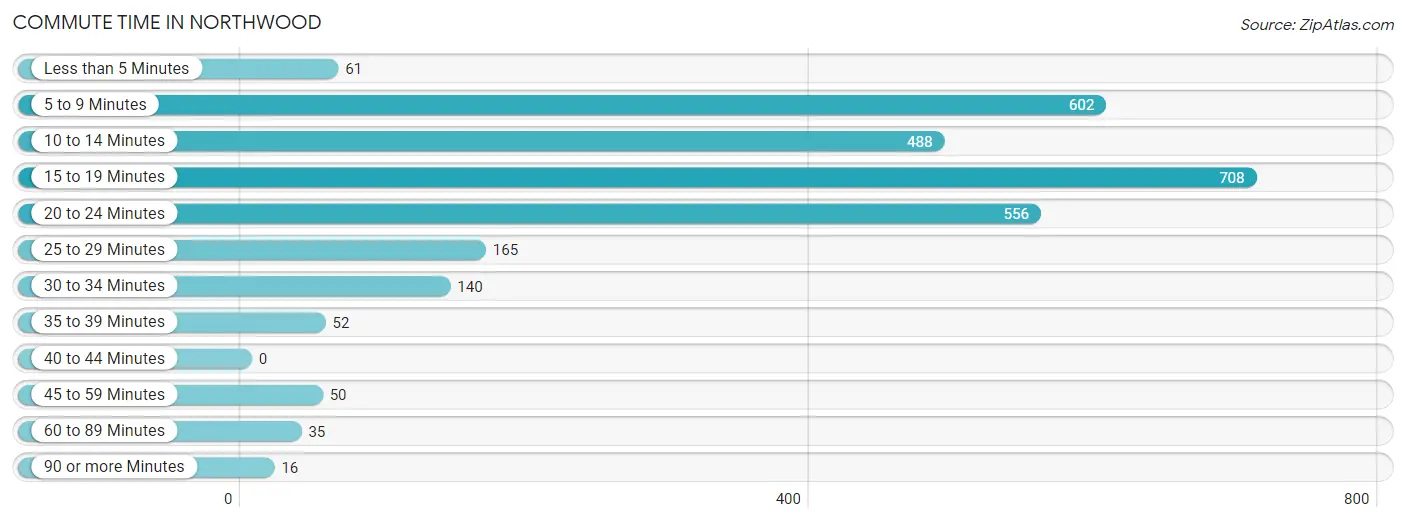
| Commute Time | # Commuters | % Commuters |
| Less than 5 Minutes | 61 | 2.1% |
| 5 to 9 Minutes | 602 | 20.9% |
| 10 to 14 Minutes | 488 | 17.0% |
| 15 to 19 Minutes | 708 | 24.6% |
| 20 to 24 Minutes | 556 | 19.4% |
| 25 to 29 Minutes | 165 | 5.7% |
| 30 to 34 Minutes | 140 | 4.9% |
| 35 to 39 Minutes | 52 | 1.8% |
| 40 to 44 Minutes | 0 | 0.0% |
| 45 to 59 Minutes | 50 | 1.7% |
| 60 to 89 Minutes | 35 | 1.2% |
| 90 or more Minutes | 16 | 0.6% |
Commute Time by Sex in Northwood
The most common commute times in Northwood are 15 to 19 minutes (301 commuters, 22.7%) for males and 15 to 19 minutes (407 commuters, 26.4%) for females.
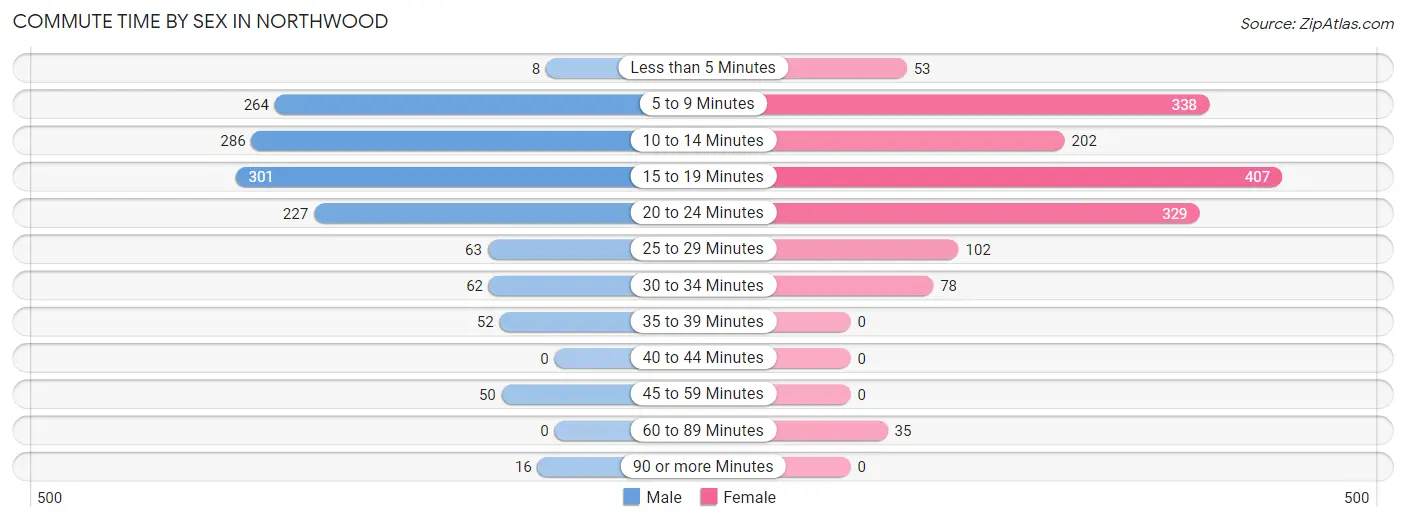
| Commute Time | Male | Female |
| Less than 5 Minutes | 8 (0.6%) | 53 (3.4%) |
| 5 to 9 Minutes | 264 (19.9%) | 338 (21.9%) |
| 10 to 14 Minutes | 286 (21.5%) | 202 (13.1%) |
| 15 to 19 Minutes | 301 (22.7%) | 407 (26.4%) |
| 20 to 24 Minutes | 227 (17.1%) | 329 (21.3%) |
| 25 to 29 Minutes | 63 (4.7%) | 102 (6.6%) |
| 30 to 34 Minutes | 62 (4.7%) | 78 (5.1%) |
| 35 to 39 Minutes | 52 (3.9%) | 0 (0.0%) |
| 40 to 44 Minutes | 0 (0.0%) | 0 (0.0%) |
| 45 to 59 Minutes | 50 (3.8%) | 0 (0.0%) |
| 60 to 89 Minutes | 0 (0.0%) | 35 (2.3%) |
| 90 or more Minutes | 16 (1.2%) | 0 (0.0%) |
Time of Departure to Work by Sex in Northwood
The most frequent times of departure to work in Northwood are 6:30 AM to 6:59 AM (324, 24.4%) for males and 6:30 AM to 6:59 AM (307, 19.9%) for females.
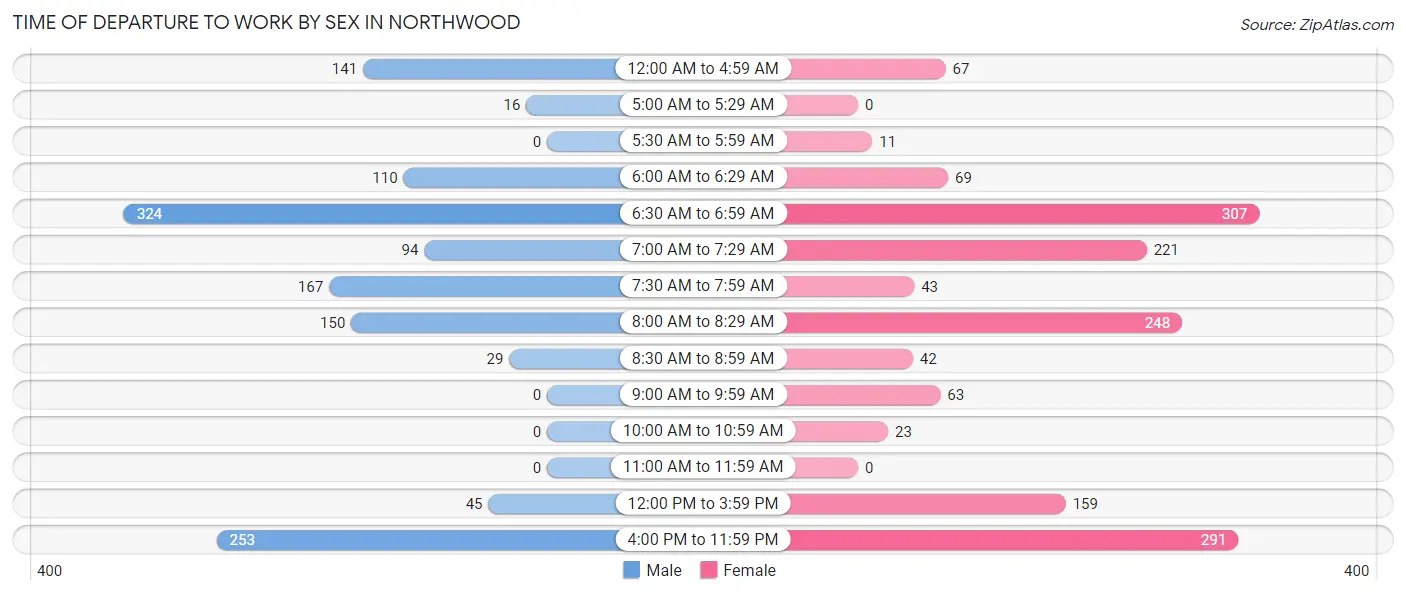
| Time of Departure | Male | Female |
| 12:00 AM to 4:59 AM | 141 (10.6%) | 67 (4.3%) |
| 5:00 AM to 5:29 AM | 16 (1.2%) | 0 (0.0%) |
| 5:30 AM to 5:59 AM | 0 (0.0%) | 11 (0.7%) |
| 6:00 AM to 6:29 AM | 110 (8.3%) | 69 (4.5%) |
| 6:30 AM to 6:59 AM | 324 (24.4%) | 307 (19.9%) |
| 7:00 AM to 7:29 AM | 94 (7.1%) | 221 (14.3%) |
| 7:30 AM to 7:59 AM | 167 (12.6%) | 43 (2.8%) |
| 8:00 AM to 8:29 AM | 150 (11.3%) | 248 (16.1%) |
| 8:30 AM to 8:59 AM | 29 (2.2%) | 42 (2.7%) |
| 9:00 AM to 9:59 AM | 0 (0.0%) | 63 (4.1%) |
| 10:00 AM to 10:59 AM | 0 (0.0%) | 23 (1.5%) |
| 11:00 AM to 11:59 AM | 0 (0.0%) | 0 (0.0%) |
| 12:00 PM to 3:59 PM | 45 (3.4%) | 159 (10.3%) |
| 4:00 PM to 11:59 PM | 253 (19.0%) | 291 (18.9%) |
| Total | 1,329 (100.0%) | 1,544 (100.0%) |
Housing Occupancy in Northwood
Occupancy by Ownership in Northwood
Of the total 2,318 dwellings in Northwood, owner-occupied units account for 1,895 (81.8%), while renter-occupied units make up 423 (18.2%).
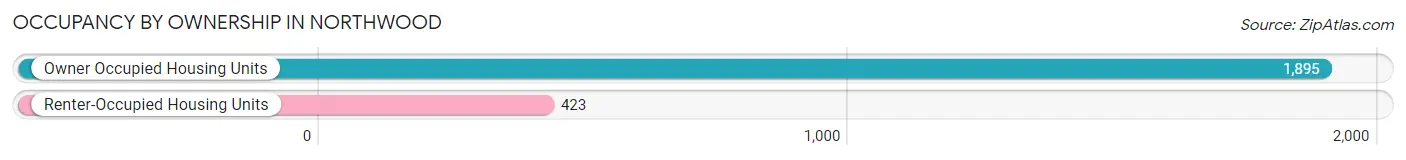
| Occupancy | # Housing Units | % Housing Units |
| Owner Occupied Housing Units | 1,895 | 81.8% |
| Renter-Occupied Housing Units | 423 | 18.2% |
| Total Occupied Housing Units | 2,318 | 100.0% |
Occupancy by Household Size in Northwood
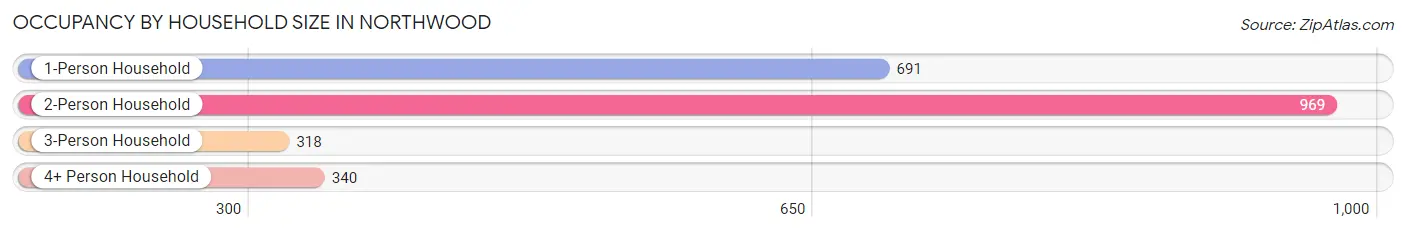
| Household Size | # Housing Units | % Housing Units |
| 1-Person Household | 691 | 29.8% |
| 2-Person Household | 969 | 41.8% |
| 3-Person Household | 318 | 13.7% |
| 4+ Person Household | 340 | 14.7% |
| Total Housing Units | 2,318 | 100.0% |
Occupancy by Ownership by Household Size in Northwood
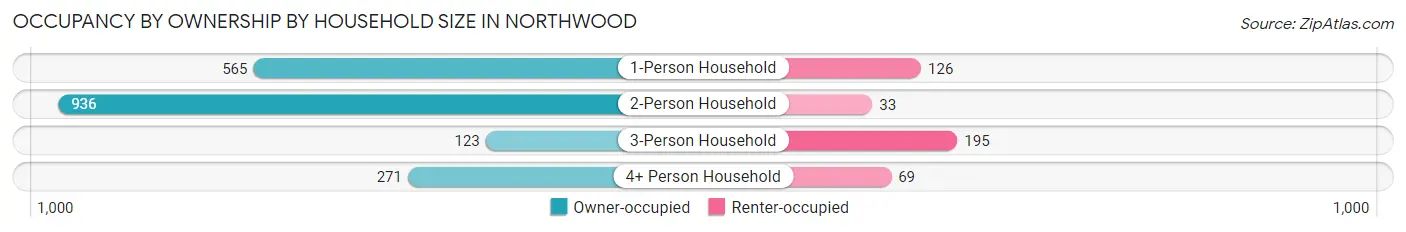
| Household Size | Owner-occupied | Renter-occupied |
| 1-Person Household | 565 (81.8%) | 126 (18.2%) |
| 2-Person Household | 936 (96.6%) | 33 (3.4%) |
| 3-Person Household | 123 (38.7%) | 195 (61.3%) |
| 4+ Person Household | 271 (79.7%) | 69 (20.3%) |
| Total Housing Units | 1,895 (81.8%) | 423 (18.2%) |
Occupancy by Educational Attainment in Northwood
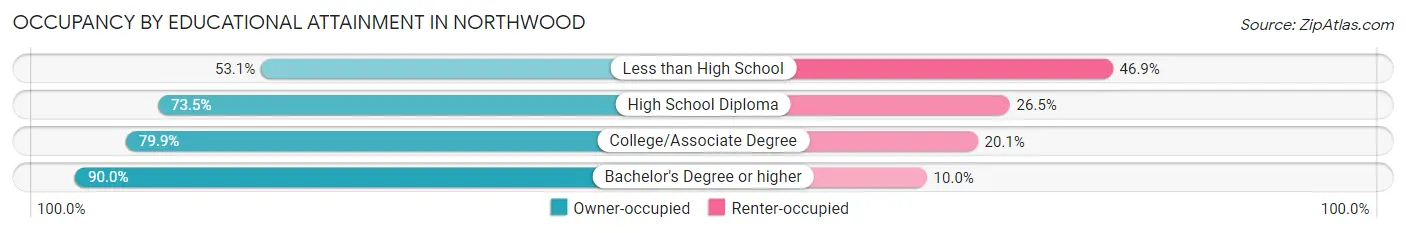
| Household Size | Owner-occupied | Renter-occupied |
| Less than High School | 17 (53.1%) | 15 (46.9%) |
| High School Diploma | 489 (73.5%) | 176 (26.5%) |
| College/Associate Degree | 553 (79.9%) | 139 (20.1%) |
| Bachelor's Degree or higher | 836 (90.0%) | 93 (10.0%) |
Occupancy by Age of Householder in Northwood
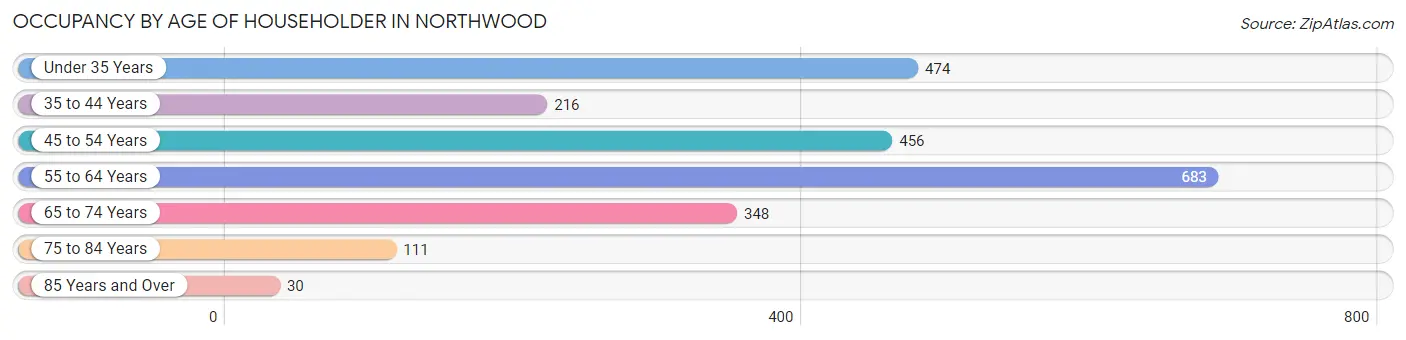
| Age Bracket | # Households | % Households |
| Under 35 Years | 474 | 20.4% |
| 35 to 44 Years | 216 | 9.3% |
| 45 to 54 Years | 456 | 19.7% |
| 55 to 64 Years | 683 | 29.5% |
| 65 to 74 Years | 348 | 15.0% |
| 75 to 84 Years | 111 | 4.8% |
| 85 Years and Over | 30 | 1.3% |
| Total | 2,318 | 100.0% |
Housing Finances in Northwood
Median Income by Occupancy in Northwood
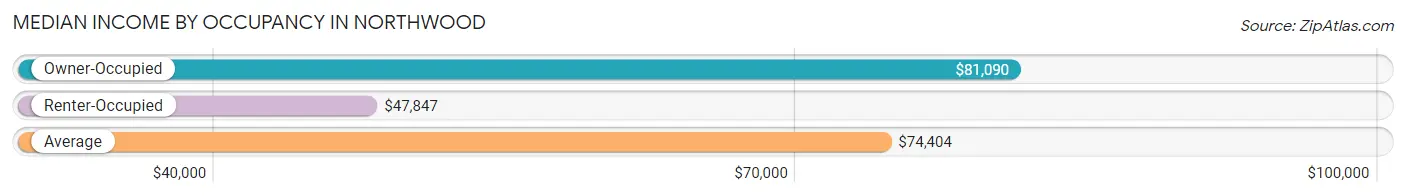
| Occupancy Type | # Households | Median Income |
| Owner-Occupied | 1,895 (81.8%) | $81,090 |
| Renter-Occupied | 423 (18.2%) | $47,847 |
| Average | 2,318 (100.0%) | $74,404 |
Occupancy by Householder Income Bracket in Northwood
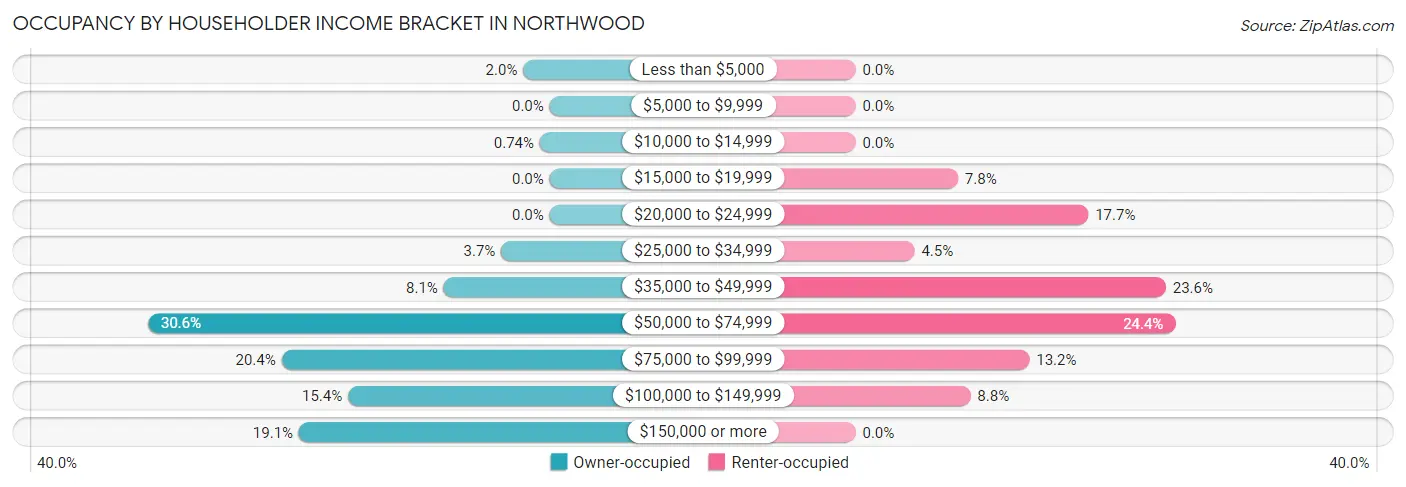
| Income Bracket | Owner-occupied | Renter-occupied |
| Less than $5,000 | 38 (2.0%) | 0 (0.0%) |
| $5,000 to $9,999 | 0 (0.0%) | 0 (0.0%) |
| $10,000 to $14,999 | 14 (0.7%) | 0 (0.0%) |
| $15,000 to $19,999 | 0 (0.0%) | 33 (7.8%) |
| $20,000 to $24,999 | 0 (0.0%) | 75 (17.7%) |
| $25,000 to $34,999 | 70 (3.7%) | 19 (4.5%) |
| $35,000 to $49,999 | 153 (8.1%) | 100 (23.6%) |
| $50,000 to $74,999 | 580 (30.6%) | 103 (24.3%) |
| $75,000 to $99,999 | 387 (20.4%) | 56 (13.2%) |
| $100,000 to $149,999 | 291 (15.4%) | 37 (8.7%) |
| $150,000 or more | 362 (19.1%) | 0 (0.0%) |
| Total | 1,895 (100.0%) | 423 (100.0%) |
Monthly Housing Cost Tiers in Northwood
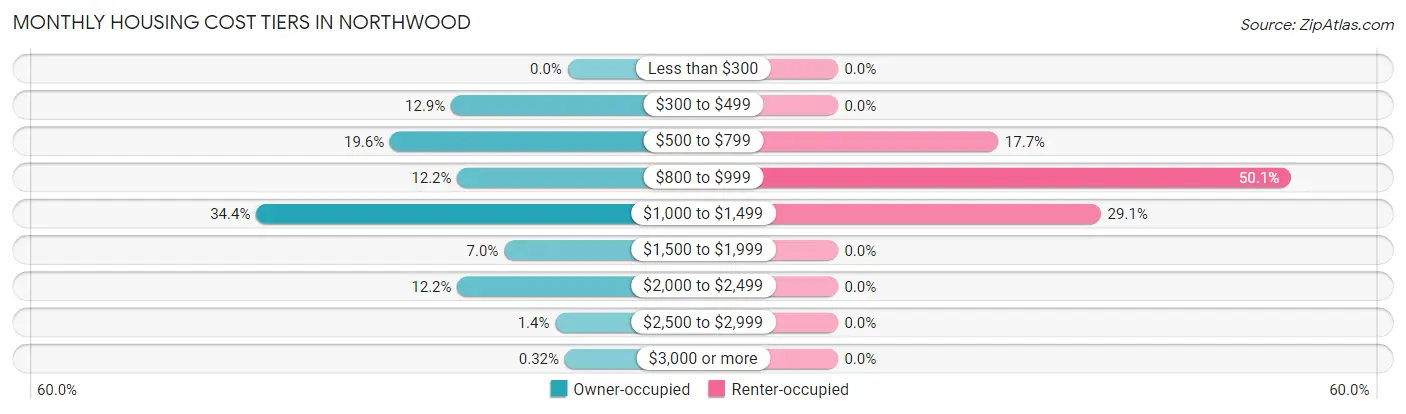
| Monthly Cost | Owner-occupied | Renter-occupied |
| Less than $300 | 0 (0.0%) | 0 (0.0%) |
| $300 to $499 | 244 (12.9%) | 0 (0.0%) |
| $500 to $799 | 372 (19.6%) | 75 (17.7%) |
| $800 to $999 | 231 (12.2%) | 212 (50.1%) |
| $1,000 to $1,499 | 652 (34.4%) | 123 (29.1%) |
| $1,500 to $1,999 | 133 (7.0%) | 0 (0.0%) |
| $2,000 to $2,499 | 231 (12.2%) | 0 (0.0%) |
| $2,500 to $2,999 | 26 (1.4%) | 0 (0.0%) |
| $3,000 or more | 6 (0.3%) | 0 (0.0%) |
| Total | 1,895 (100.0%) | 423 (100.0%) |
Physical Housing Characteristics in Northwood
Housing Structures in Northwood
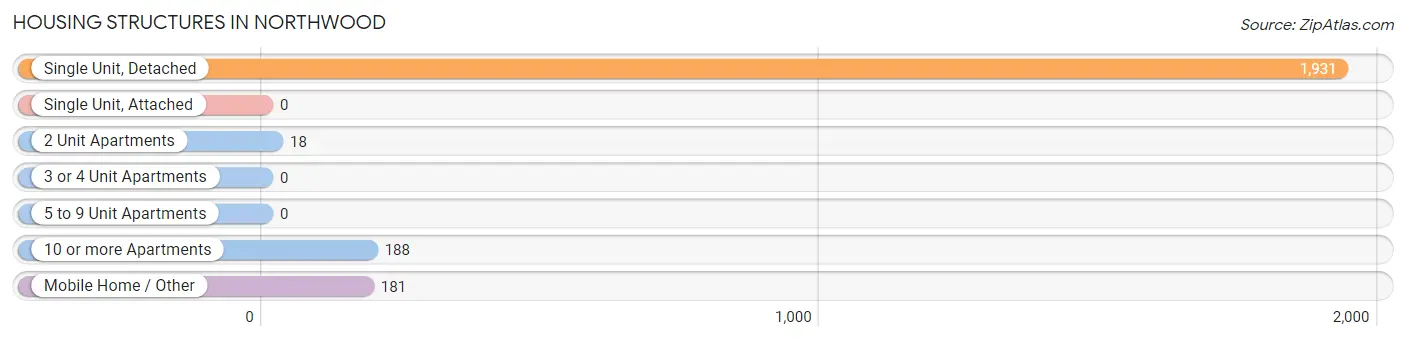
| Structure Type | # Housing Units | % Housing Units |
| Single Unit, Detached | 1,931 | 83.3% |
| Single Unit, Attached | 0 | 0.0% |
| 2 Unit Apartments | 18 | 0.8% |
| 3 or 4 Unit Apartments | 0 | 0.0% |
| 5 to 9 Unit Apartments | 0 | 0.0% |
| 10 or more Apartments | 188 | 8.1% |
| Mobile Home / Other | 181 | 7.8% |
| Total | 2,318 | 100.0% |
Housing Structures by Occupancy in Northwood
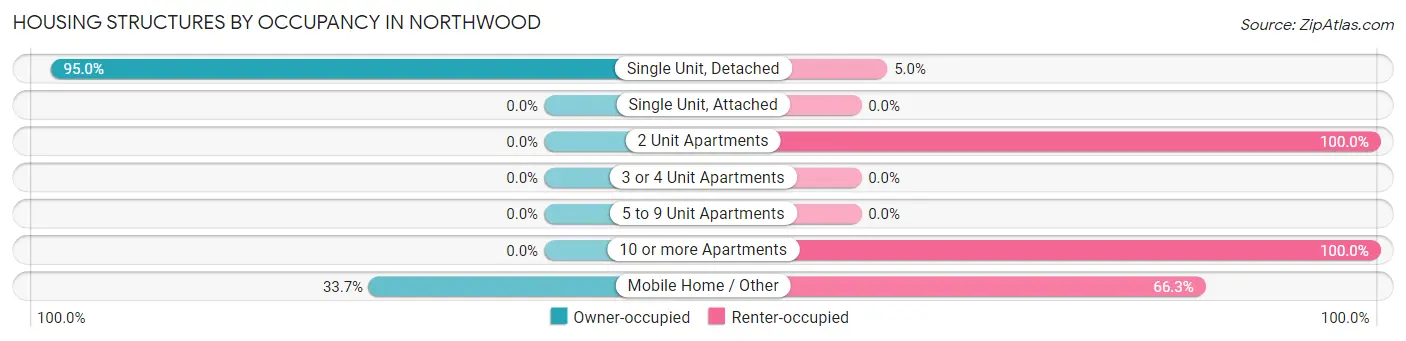
| Structure Type | Owner-occupied | Renter-occupied |
| Single Unit, Detached | 1,834 (95.0%) | 97 (5.0%) |
| Single Unit, Attached | 0 (0.0%) | 0 (0.0%) |
| 2 Unit Apartments | 0 (0.0%) | 18 (100.0%) |
| 3 or 4 Unit Apartments | 0 (0.0%) | 0 (0.0%) |
| 5 to 9 Unit Apartments | 0 (0.0%) | 0 (0.0%) |
| 10 or more Apartments | 0 (0.0%) | 188 (100.0%) |
| Mobile Home / Other | 61 (33.7%) | 120 (66.3%) |
| Total | 1,895 (81.8%) | 423 (18.2%) |
Housing Structures by Number of Rooms in Northwood
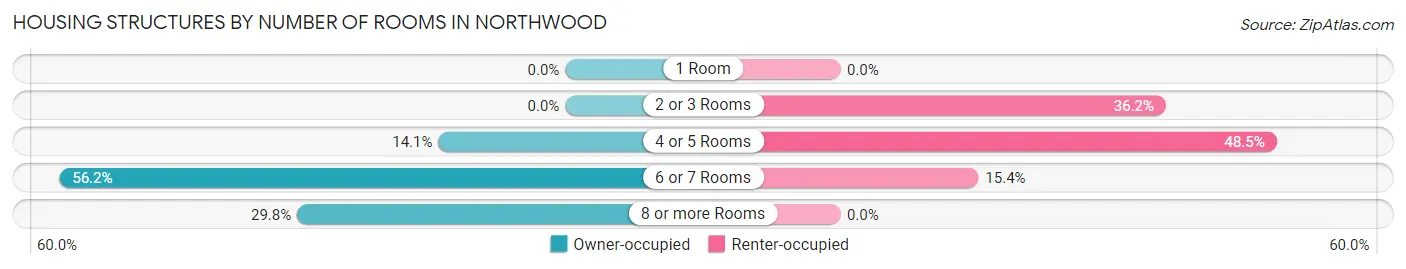
| Number of Rooms | Owner-occupied | Renter-occupied |
| 1 Room | 0 (0.0%) | 0 (0.0%) |
| 2 or 3 Rooms | 0 (0.0%) | 153 (36.2%) |
| 4 or 5 Rooms | 267 (14.1%) | 205 (48.5%) |
| 6 or 7 Rooms | 1,064 (56.1%) | 65 (15.4%) |
| 8 or more Rooms | 564 (29.8%) | 0 (0.0%) |
| Total | 1,895 (100.0%) | 423 (100.0%) |
Housing Structure by Heating Type in Northwood

| Heating Type | Owner-occupied | Renter-occupied |
| Utility Gas | 1,576 (83.2%) | 150 (35.5%) |
| Bottled, Tank, or LP Gas | 0 (0.0%) | 0 (0.0%) |
| Electricity | 319 (16.8%) | 254 (60.1%) |
| Fuel Oil or Kerosene | 0 (0.0%) | 0 (0.0%) |
| Coal or Coke | 0 (0.0%) | 0 (0.0%) |
| All other Fuels | 0 (0.0%) | 0 (0.0%) |
| No Fuel Used | 0 (0.0%) | 19 (4.5%) |
| Total | 1,895 (100.0%) | 423 (100.0%) |
Household Vehicle Usage in Northwood
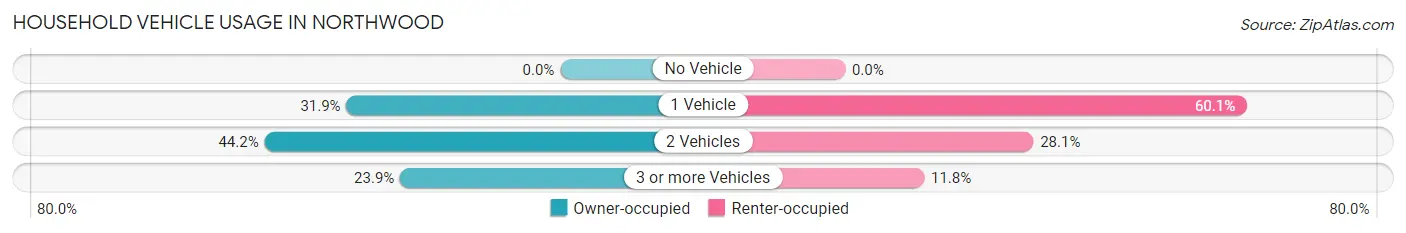
| Vehicles per Household | Owner-occupied | Renter-occupied |
| No Vehicle | 0 (0.0%) | 0 (0.0%) |
| 1 Vehicle | 605 (31.9%) | 254 (60.1%) |
| 2 Vehicles | 837 (44.2%) | 119 (28.1%) |
| 3 or more Vehicles | 453 (23.9%) | 50 (11.8%) |
| Total | 1,895 (100.0%) | 423 (100.0%) |
Real Estate & Mortgages in Northwood
Real Estate and Mortgage Overview in Northwood
| Characteristic | Without Mortgage | With Mortgage |
| Housing Units | 646 | 1,249 |
| Median Property Value | $115,500 | $167,700 |
| Median Household Income | $74,857 | $317 |
| Monthly Housing Costs | $561 | $6 |
| Real Estate Taxes | $2,077 | $36 |
Property Value by Mortgage Status in Northwood
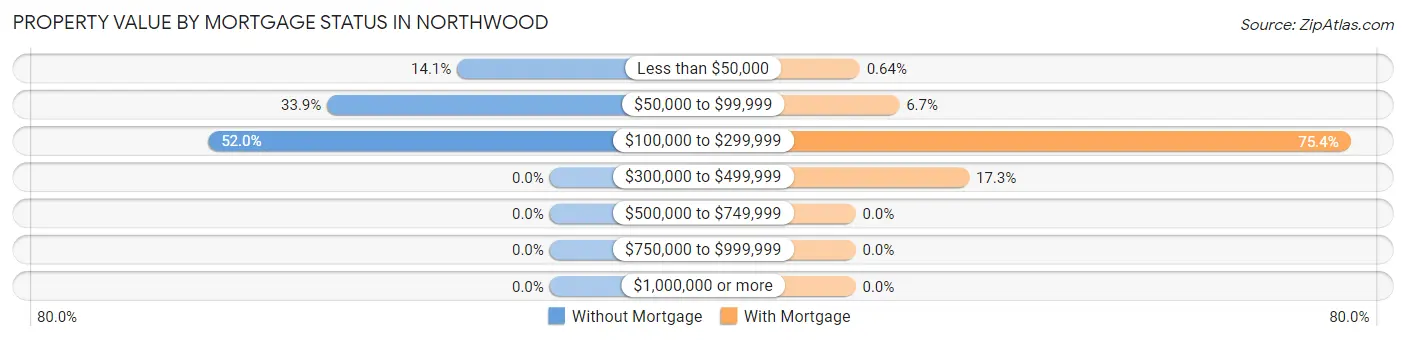
| Property Value | Without Mortgage | With Mortgage |
| Less than $50,000 | 91 (14.1%) | 8 (0.6%) |
| $50,000 to $99,999 | 219 (33.9%) | 83 (6.7%) |
| $100,000 to $299,999 | 336 (52.0%) | 942 (75.4%) |
| $300,000 to $499,999 | 0 (0.0%) | 216 (17.3%) |
| $500,000 to $749,999 | 0 (0.0%) | 0 (0.0%) |
| $750,000 to $999,999 | 0 (0.0%) | 0 (0.0%) |
| $1,000,000 or more | 0 (0.0%) | 0 (0.0%) |
| Total | 646 (100.0%) | 1,249 (100.0%) |
Household Income by Mortgage Status in Northwood
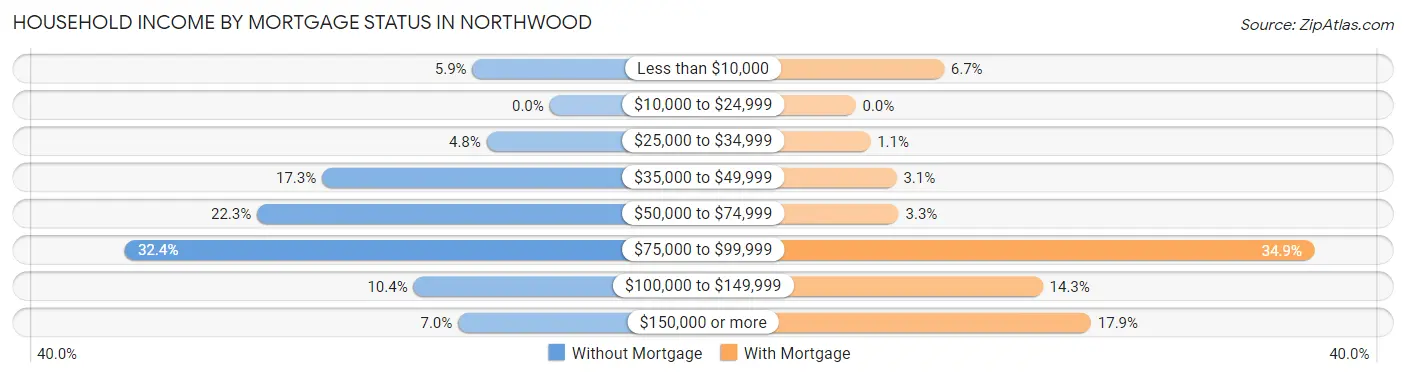
| Household Income | Without Mortgage | With Mortgage |
| Less than $10,000 | 38 (5.9%) | 84 (6.7%) |
| $10,000 to $24,999 | 0 (0.0%) | 0 (0.0%) |
| $25,000 to $34,999 | 31 (4.8%) | 14 (1.1%) |
| $35,000 to $49,999 | 112 (17.3%) | 39 (3.1%) |
| $50,000 to $74,999 | 144 (22.3%) | 41 (3.3%) |
| $75,000 to $99,999 | 209 (32.4%) | 436 (34.9%) |
| $100,000 to $149,999 | 67 (10.4%) | 178 (14.2%) |
| $150,000 or more | 45 (7.0%) | 224 (17.9%) |
| Total | 646 (100.0%) | 1,249 (100.0%) |
Property Value to Household Income Ratio in Northwood
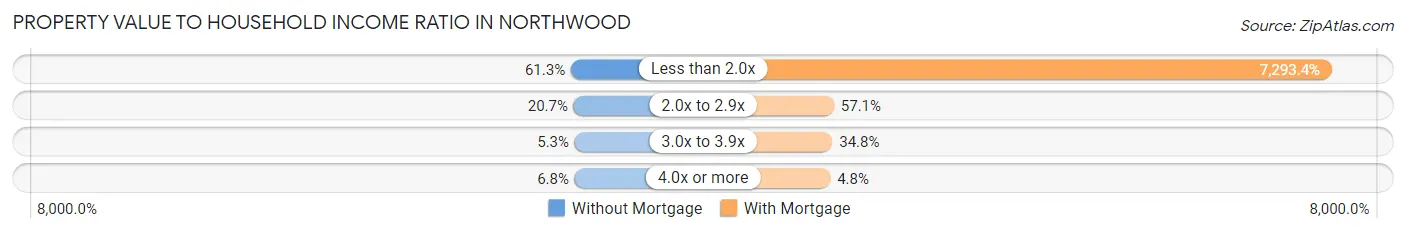
| Value-to-Income Ratio | Without Mortgage | With Mortgage |
| Less than 2.0x | 396 (61.3%) | 91,094 (7,293.3%) |
| 2.0x to 2.9x | 134 (20.7%) | 713 (57.1%) |
| 3.0x to 3.9x | 34 (5.3%) | 434 (34.7%) |
| 4.0x or more | 44 (6.8%) | 60 (4.8%) |
| Total | 646 (100.0%) | 1,249 (100.0%) |
Real Estate Taxes by Mortgage Status in Northwood
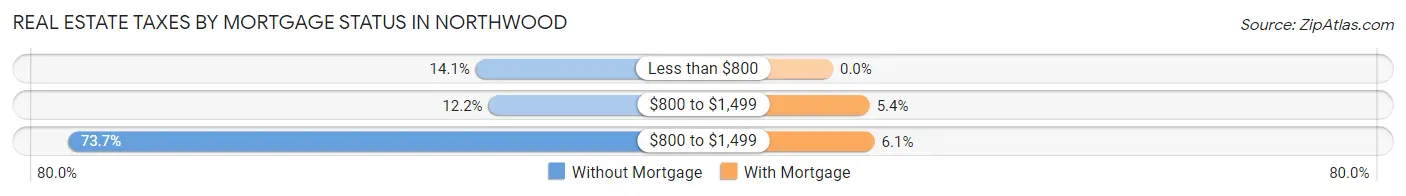
| Property Taxes | Without Mortgage | With Mortgage |
| Less than $800 | 91 (14.1%) | 0 (0.0%) |
| $800 to $1,499 | 79 (12.2%) | 67 (5.4%) |
| $800 to $1,499 | 476 (73.7%) | 76 (6.1%) |
| Total | 646 (100.0%) | 1,249 (100.0%) |
Health & Disability in Northwood
Health Insurance Coverage by Age in Northwood
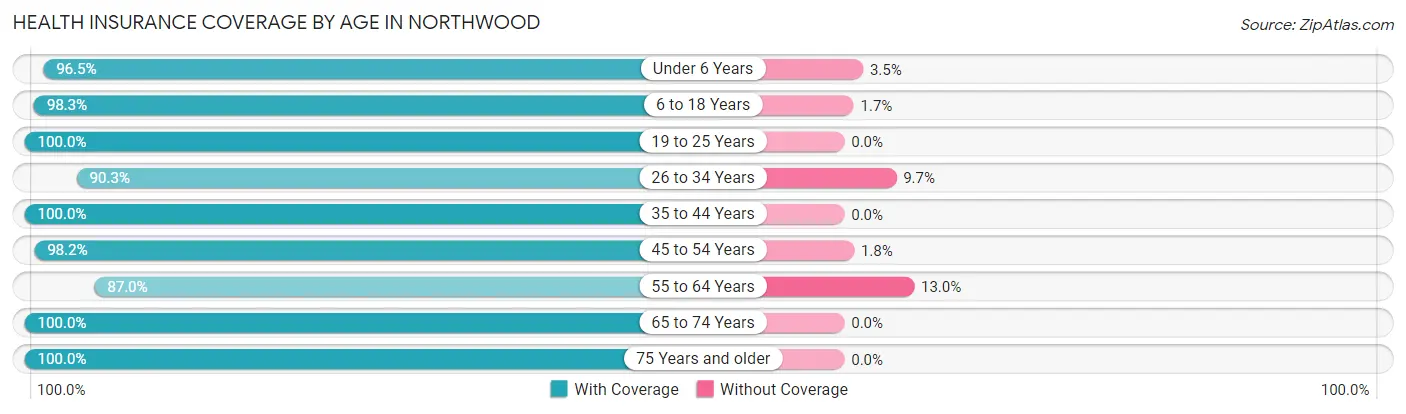
| Age Bracket | With Coverage | Without Coverage |
| Under 6 Years | 416 (96.5%) | 15 (3.5%) |
| 6 to 18 Years | 740 (98.3%) | 13 (1.7%) |
| 19 to 25 Years | 368 (100.0%) | 0 (0.0%) |
| 26 to 34 Years | 681 (90.3%) | 73 (9.7%) |
| 35 to 44 Years | 400 (100.0%) | 0 (0.0%) |
| 45 to 54 Years | 817 (98.2%) | 15 (1.8%) |
| 55 to 64 Years | 729 (87.0%) | 109 (13.0%) |
| 65 to 74 Years | 580 (100.0%) | 0 (0.0%) |
| 75 Years and older | 211 (100.0%) | 0 (0.0%) |
| Total | 4,942 (95.7%) | 225 (4.3%) |
Health Insurance Coverage by Citizenship Status in Northwood
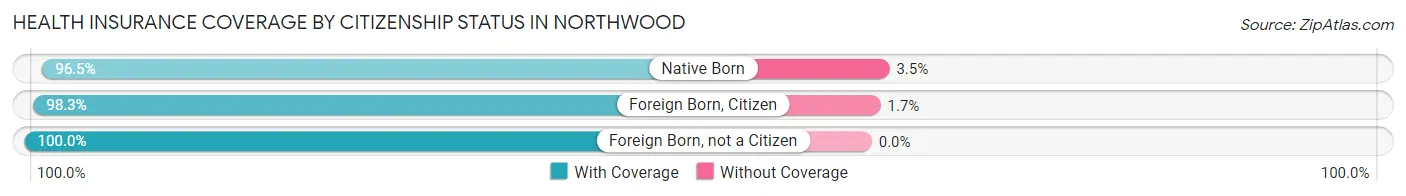
| Citizenship Status | With Coverage | Without Coverage |
| Native Born | 416 (96.5%) | 15 (3.5%) |
| Foreign Born, Citizen | 740 (98.3%) | 13 (1.7%) |
| Foreign Born, not a Citizen | 368 (100.0%) | 0 (0.0%) |
Health Insurance Coverage by Household Income in Northwood
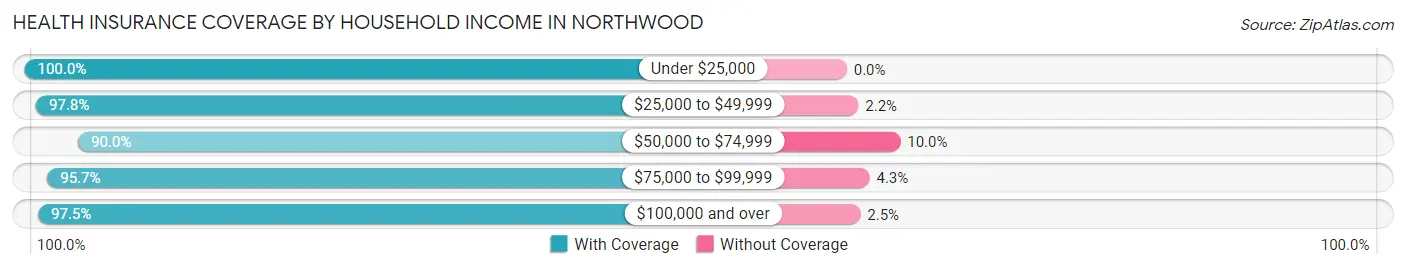
| Household Income | With Coverage | Without Coverage |
| Under $25,000 | 330 (100.0%) | 0 (0.0%) |
| $25,000 to $49,999 | 680 (97.8%) | 15 (2.2%) |
| $50,000 to $74,999 | 1,086 (90.0%) | 121 (10.0%) |
| $75,000 to $99,999 | 809 (95.7%) | 36 (4.3%) |
| $100,000 and over | 2,037 (97.5%) | 53 (2.5%) |
Public vs Private Health Insurance Coverage by Age in Northwood
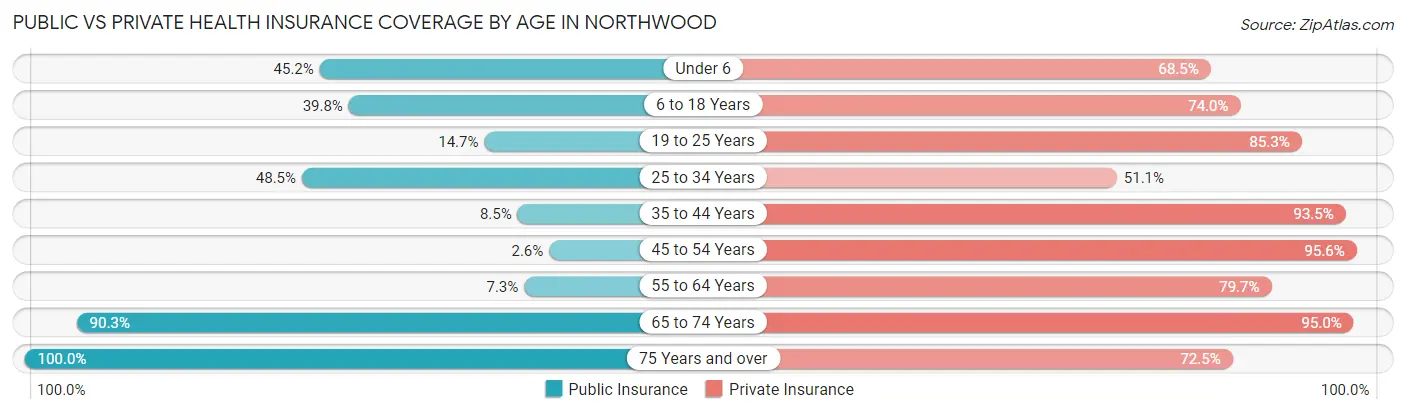
| Age Bracket | Public Insurance | Private Insurance |
| Under 6 | 195 (45.2%) | 295 (68.4%) |
| 6 to 18 Years | 300 (39.8%) | 557 (74.0%) |
| 19 to 25 Years | 54 (14.7%) | 314 (85.3%) |
| 25 to 34 Years | 366 (48.5%) | 385 (51.1%) |
| 35 to 44 Years | 34 (8.5%) | 374 (93.5%) |
| 45 to 54 Years | 22 (2.6%) | 795 (95.6%) |
| 55 to 64 Years | 61 (7.3%) | 668 (79.7%) |
| 65 to 74 Years | 524 (90.3%) | 551 (95.0%) |
| 75 Years and over | 211 (100.0%) | 153 (72.5%) |
| Total | 1,767 (34.2%) | 4,092 (79.2%) |
Disability Status by Sex by Age in Northwood
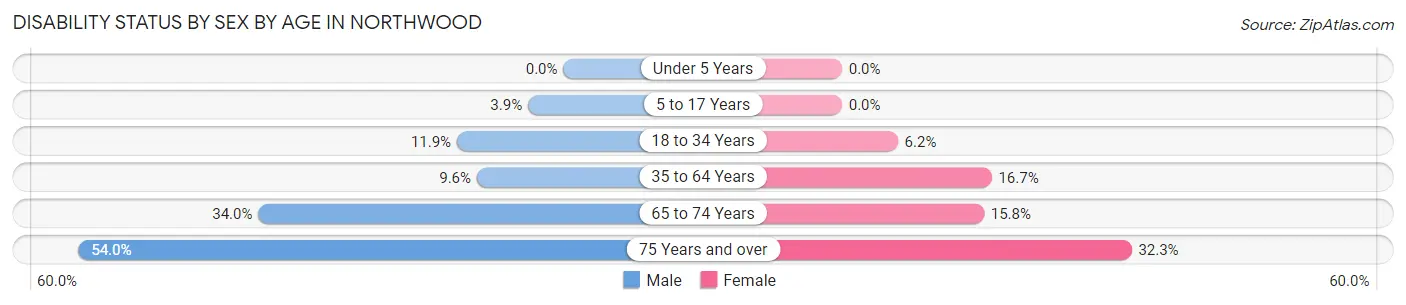
| Age Bracket | Male | Female |
| Under 5 Years | 0 (0.0%) | 0 (0.0%) |
| 5 to 17 Years | 16 (3.9%) | 0 (0.0%) |
| 18 to 34 Years | 66 (11.8%) | 38 (6.2%) |
| 35 to 64 Years | 93 (9.6%) | 184 (16.7%) |
| 65 to 74 Years | 124 (34.0%) | 34 (15.8%) |
| 75 Years and over | 47 (54.0%) | 40 (32.3%) |
Disability Class by Sex by Age in Northwood
Disability Class: Hearing Difficulty
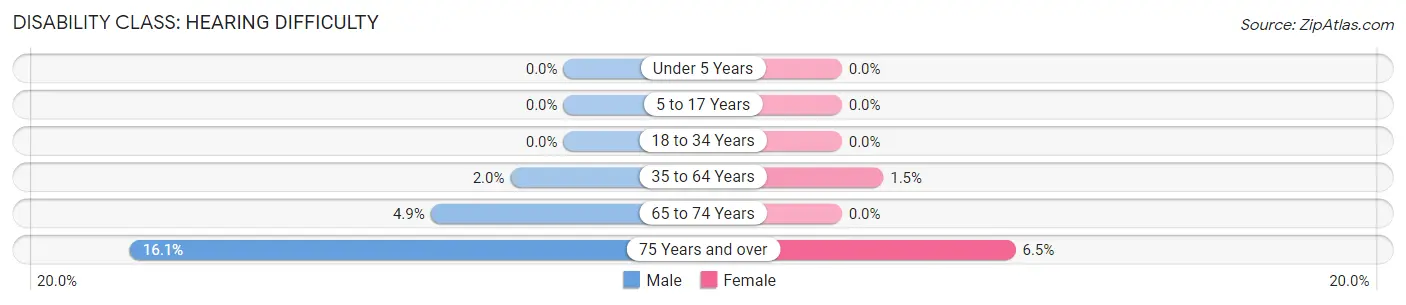
| Age Bracket | Male | Female |
| Under 5 Years | 0 (0.0%) | 0 (0.0%) |
| 5 to 17 Years | 0 (0.0%) | 0 (0.0%) |
| 18 to 34 Years | 0 (0.0%) | 0 (0.0%) |
| 35 to 64 Years | 19 (2.0%) | 17 (1.5%) |
| 65 to 74 Years | 18 (4.9%) | 0 (0.0%) |
| 75 Years and over | 14 (16.1%) | 8 (6.5%) |
Disability Class: Vision Difficulty
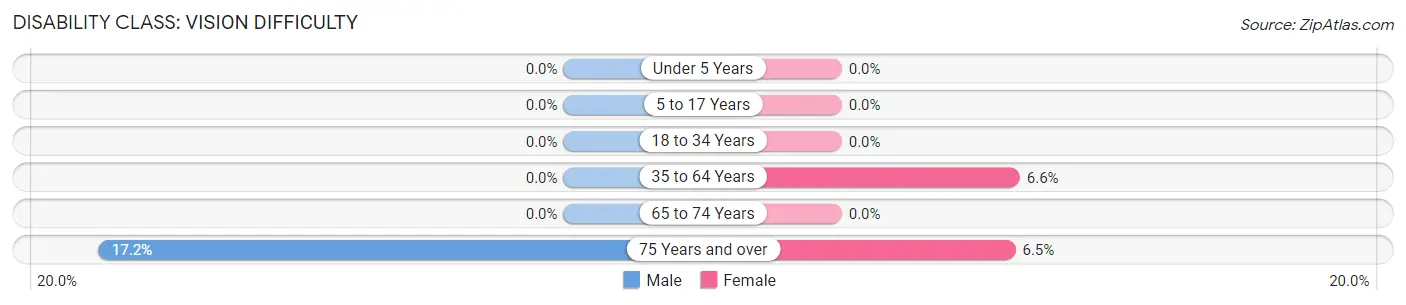
| Age Bracket | Male | Female |
| Under 5 Years | 0 (0.0%) | 0 (0.0%) |
| 5 to 17 Years | 0 (0.0%) | 0 (0.0%) |
| 18 to 34 Years | 0 (0.0%) | 0 (0.0%) |
| 35 to 64 Years | 0 (0.0%) | 73 (6.6%) |
| 65 to 74 Years | 0 (0.0%) | 0 (0.0%) |
| 75 Years and over | 15 (17.2%) | 8 (6.5%) |
Disability Class: Cognitive Difficulty
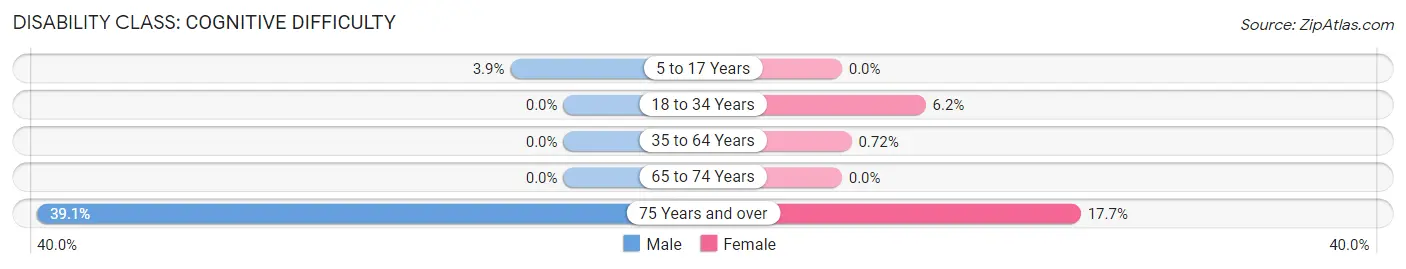
| Age Bracket | Male | Female |
| 5 to 17 Years | 16 (3.9%) | 0 (0.0%) |
| 18 to 34 Years | 0 (0.0%) | 38 (6.2%) |
| 35 to 64 Years | 0 (0.0%) | 8 (0.7%) |
| 65 to 74 Years | 0 (0.0%) | 0 (0.0%) |
| 75 Years and over | 34 (39.1%) | 22 (17.7%) |
Disability Class: Ambulatory Difficulty
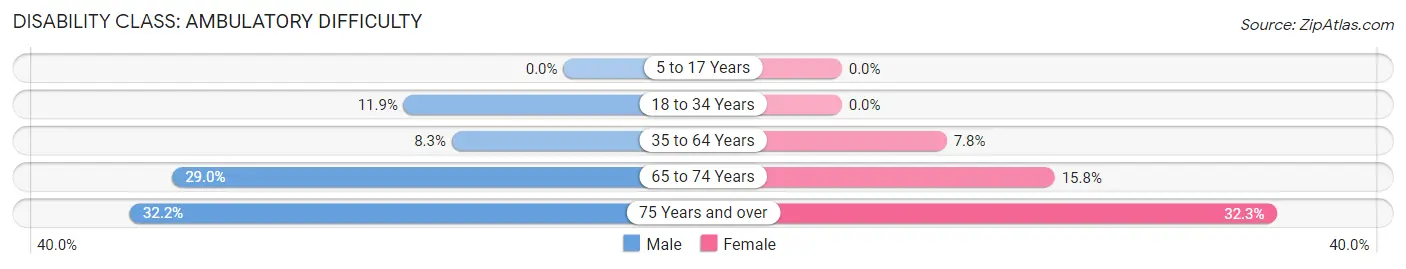
| Age Bracket | Male | Female |
| 5 to 17 Years | 0 (0.0%) | 0 (0.0%) |
| 18 to 34 Years | 66 (11.8%) | 0 (0.0%) |
| 35 to 64 Years | 80 (8.3%) | 86 (7.8%) |
| 65 to 74 Years | 106 (29.0%) | 34 (15.8%) |
| 75 Years and over | 28 (32.2%) | 40 (32.3%) |
Disability Class: Self-Care Difficulty
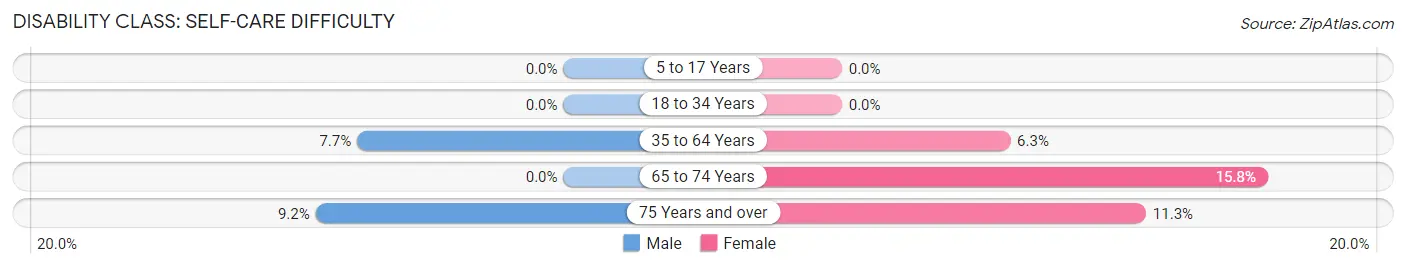
| Age Bracket | Male | Female |
| 5 to 17 Years | 0 (0.0%) | 0 (0.0%) |
| 18 to 34 Years | 0 (0.0%) | 0 (0.0%) |
| 35 to 64 Years | 74 (7.7%) | 69 (6.2%) |
| 65 to 74 Years | 0 (0.0%) | 34 (15.8%) |
| 75 Years and over | 8 (9.2%) | 14 (11.3%) |
Technology Access in Northwood
Computing Device Access in Northwood
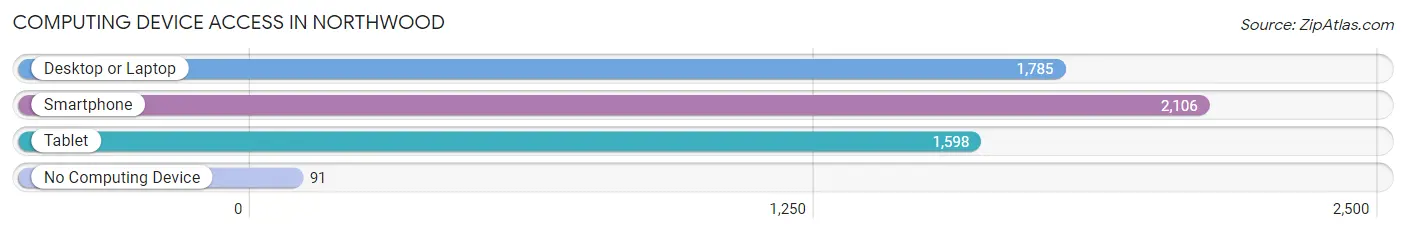
| Device Type | # Households | % Households |
| Desktop or Laptop | 1,785 | 77.0% |
| Smartphone | 2,106 | 90.8% |
| Tablet | 1,598 | 68.9% |
| No Computing Device | 91 | 3.9% |
| Total | 2,318 | 100.0% |
Internet Access in Northwood
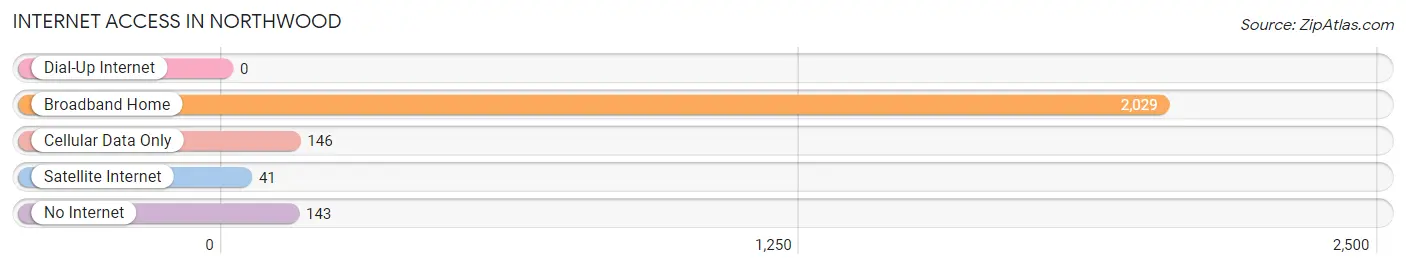
| Internet Type | # Households | % Households |
| Dial-Up Internet | 0 | 0.0% |
| Broadband Home | 2,029 | 87.5% |
| Cellular Data Only | 146 | 6.3% |
| Satellite Internet | 41 | 1.8% |
| No Internet | 143 | 6.2% |
| Total | 2,318 | 100.0% |
Northwood Summary
Northwood, Ohio is a small city located in Wood County, Ohio. It is situated on the banks of the Maumee River, approximately 10 miles east of Toledo. The city has a population of 5,717 as of the 2010 census, and is part of the Toledo Metropolitan Statistical Area.
History
Northwood was founded in 1867 by a group of settlers from New York. The city was originally known as “New York Mills”, but was later changed to Northwood in 1871. The name was chosen to reflect the city’s location on the northern edge of Wood County.
The city was incorporated in 1873 and quickly grew to become a thriving industrial center. The city’s economy was largely based on the production of glass, which was made from the abundant natural resources of the area. The city was also home to several other industries, including a brickyard, a sawmill, and a flour mill.
In the early 20th century, Northwood experienced a period of rapid growth. The city’s population increased from 1,000 in 1900 to over 5,000 by 1930. This growth was largely due to the city’s booming glass industry, which employed thousands of workers.
Geography
Northwood is located in Wood County, Ohio, approximately 10 miles east of Toledo. The city is situated on the banks of the Maumee River, and is bordered by the cities of Rossford and Walbridge to the north, and the townships of Lake and Troy to the south.
The city has a total area of 4.2 square miles, all of which is land. The terrain is mostly flat, with some rolling hills in the northern part of the city. The climate is humid continental, with hot summers and cold winters.
Economy
Northwood’s economy is largely based on manufacturing and retail. The city is home to several large manufacturing companies, including Owens Corning, Libbey Glass, and Northwood Industries. These companies employ thousands of workers and are the city’s largest employers.
The city is also home to several retail stores, including Walmart, Target, and Kohl’s. These stores provide employment for hundreds of people and are a major source of revenue for the city.
Demographics
As of the 2010 census, Northwood had a population of 5,717. The racial makeup of the city was 94.3% White, 1.7% African American, 0.3% Native American, 0.7% Asian, 0.1% Pacific Islander, 1.2% from other races, and 1.9% from two or more races. Hispanic or Latino of any race were 3.2% of the population.
The median household income in Northwood was $45,945, and the median family income was $54,945. The per capita income was $21,945. About 8.3% of families and 10.2% of the population were below the poverty line, including 14.2% of those under age 18 and 6.2% of those age 65 or over.
Northwood is a small city with a rich history and a diverse population. The city’s economy is largely based on manufacturing and retail, and the city is home to several large employers. The city has a median household income of $45,945 and a median family income of $54,945. Northwood is a great place to live, work, and raise a family.
Common Questions
What is Per Capita Income in Northwood?
Per Capita income in Northwood is $44,923.
What is the Median Family Income in Northwood?
Median Family Income in Northwood is $92,037.
What is the Median Household income in Northwood?
Median Household Income in Northwood is $74,404.
What is Income or Wage Gap in Northwood?
Income or Wage Gap in Northwood is 57.7%.
Women in Northwood earn 42.3 cents for every dollar earned by a man.
What is Inequality or Gini Index in Northwood?
Inequality or Gini Index in Northwood is 0.37.
What is the Total Population of Northwood?
Total Population of Northwood is 5,180.
What is the Total Male Population of Northwood?
Total Male Population of Northwood is 2,526.
What is the Total Female Population of Northwood?
Total Female Population of Northwood is 2,654.
What is the Ratio of Males per 100 Females in Northwood?
There are 95.18 Males per 100 Females in Northwood.
What is the Ratio of Females per 100 Males in Northwood?
There are 105.07 Females per 100 Males in Northwood.
What is the Median Population Age in Northwood?
Median Population Age in Northwood is 42.5 Years.
What is the Average Family Size in Northwood
Average Family Size in Northwood is 2.7 People.
What is the Average Household Size in Northwood
Average Household Size in Northwood is 2.2 People.
How Large is the Labor Force in Northwood?
There are 3,041 People in the Labor Forcein in Northwood.
What is the Percentage of People in the Labor Force in Northwood?
73.9% of People are in the Labor Force in Northwood.
What is the Unemployment Rate in Northwood?
Unemployment Rate in Northwood is 0.7%.