Fredericktown, OH Map & Demographics
Fredericktown Map
Fredericktown Overview
$31,626
PER CAPITA INCOME
$79,591
AVG FAMILY INCOME
$67,813
AVG HOUSEHOLD INCOME
19.6%
WAGE / INCOME GAP [ % ]
80.4¢/ $1
WAGE / INCOME GAP [ $ ]
0.32
INEQUALITY / GINI INDEX
2,642
TOTAL POPULATION
1,206
MALE POPULATION
1,436
FEMALE POPULATION
83.98
MALES / 100 FEMALES
119.07
FEMALES / 100 MALES
41.3
MEDIAN AGE
2.5
AVG FAMILY SIZE
2.2
AVG HOUSEHOLD SIZE
1,391
LABOR FORCE [ PEOPLE ]
63.7%
PERCENT IN LABOR FORCE
3.2%
UNEMPLOYMENT RATE
Fredericktown Zip Codes
Income in Fredericktown
Income Overview in Fredericktown
Per Capita Income in Fredericktown is $31,626, while median incomes of families and households are $79,591 and $67,813 respectively.
| Characteristic | Number | Measure |
| Per Capita Income | 2,642 | $31,626 |
| Median Family Income | 778 | $79,591 |
| Mean Family Income | 778 | $78,265 |
| Median Household Income | 1,214 | $67,813 |
| Mean Household Income | 1,214 | $69,483 |
| Income Deficit | 778 | $0 |
| Wage / Income Gap (%) | 2,642 | 19.59% |
| Wage / Income Gap ($) | 2,642 | 80.41¢ per $1 |
| Gini / Inequality Index | 2,642 | 0.32 |
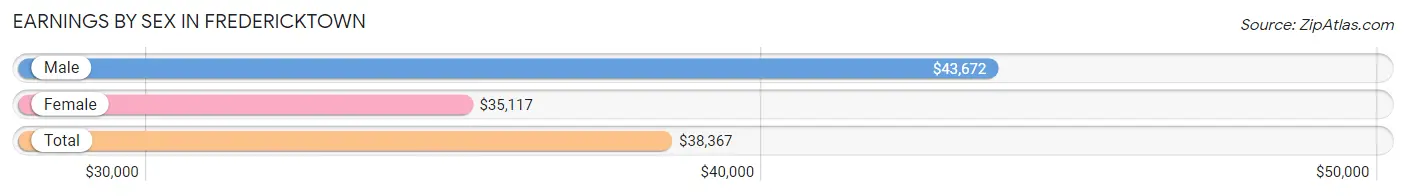
Earnings by Sex in Fredericktown
Average Earnings in Fredericktown are $38,367, $43,672 for men and $35,117 for women, a difference of 19.6%.
| Sex | Number | Average Earnings |
| Male | 787 (53.9%) | $43,672 |
| Female | 673 (46.1%) | $35,117 |
| Total | 1,460 (100.0%) | $38,367 |
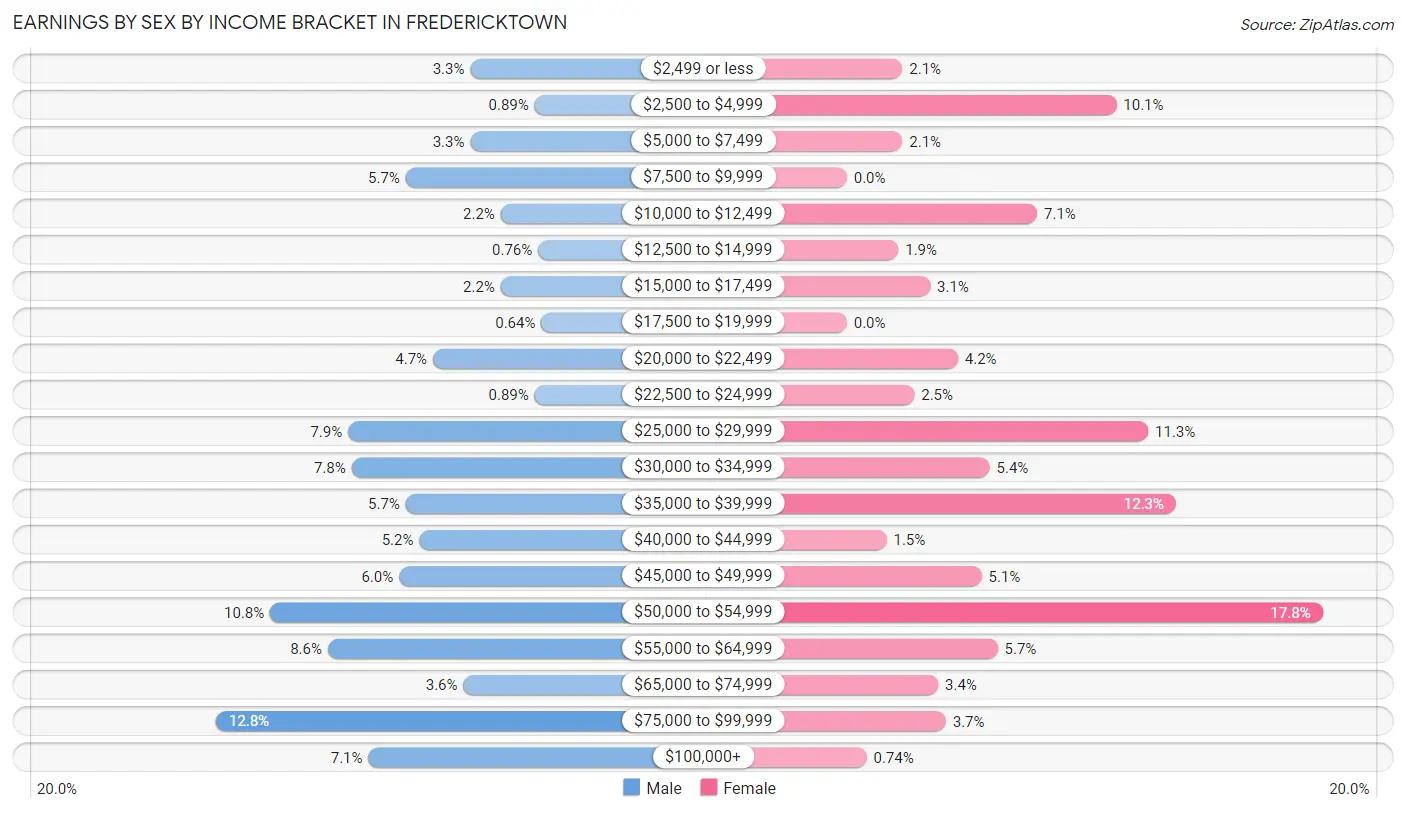
Earnings by Sex by Income Bracket in Fredericktown
The most common earnings brackets in Fredericktown are $75,000 to $99,999 for men (101 | 12.8%) and $50,000 to $54,999 for women (120 | 17.8%).
| Income | Male | Female |
| $2,499 or less | 26 (3.3%) | 14 (2.1%) |
| $2,500 to $4,999 | 7 (0.9%) | 68 (10.1%) |
| $5,000 to $7,499 | 26 (3.3%) | 14 (2.1%) |
| $7,500 to $9,999 | 45 (5.7%) | 0 (0.0%) |
| $10,000 to $12,499 | 17 (2.2%) | 48 (7.1%) |
| $12,500 to $14,999 | 6 (0.8%) | 13 (1.9%) |
| $15,000 to $17,499 | 17 (2.2%) | 21 (3.1%) |
| $17,500 to $19,999 | 5 (0.6%) | 0 (0.0%) |
| $20,000 to $22,499 | 37 (4.7%) | 28 (4.2%) |
| $22,500 to $24,999 | 7 (0.9%) | 17 (2.5%) |
| $25,000 to $29,999 | 62 (7.9%) | 76 (11.3%) |
| $30,000 to $34,999 | 61 (7.7%) | 36 (5.3%) |
| $35,000 to $39,999 | 45 (5.7%) | 83 (12.3%) |
| $40,000 to $44,999 | 41 (5.2%) | 10 (1.5%) |
| $45,000 to $49,999 | 47 (6.0%) | 34 (5.1%) |
| $50,000 to $54,999 | 85 (10.8%) | 120 (17.8%) |
| $55,000 to $64,999 | 68 (8.6%) | 38 (5.7%) |
| $65,000 to $74,999 | 28 (3.6%) | 23 (3.4%) |
| $75,000 to $99,999 | 101 (12.8%) | 25 (3.7%) |
| $100,000+ | 56 (7.1%) | 5 (0.7%) |
| Total | 787 (100.0%) | 673 (100.0%) |
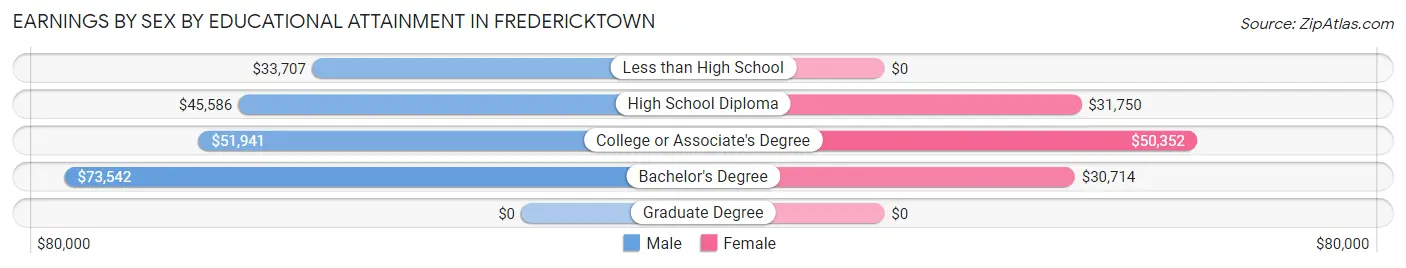
Earnings by Sex by Educational Attainment in Fredericktown
Average earnings in Fredericktown are $46,006 for men and $38,140 for women, a difference of 17.1%. Men with an educational attainment of bachelor's degree enjoy the highest average annual earnings of $73,542, while those with less than high school education earn the least with $33,707. Women with an educational attainment of college or associate's degree earn the most with the average annual earnings of $50,352, while those with bachelor's degree education have the smallest earnings of $30,714.
| Educational Attainment | Male Income | Female Income |
| Less than High School | $33,707 | $0 |
| High School Diploma | $45,586 | $31,750 |
| College or Associate's Degree | $51,941 | $50,352 |
| Bachelor's Degree | $73,542 | $30,714 |
| Graduate Degree | - | - |
| Total | $46,006 | $38,140 |
Family Income in Fredericktown
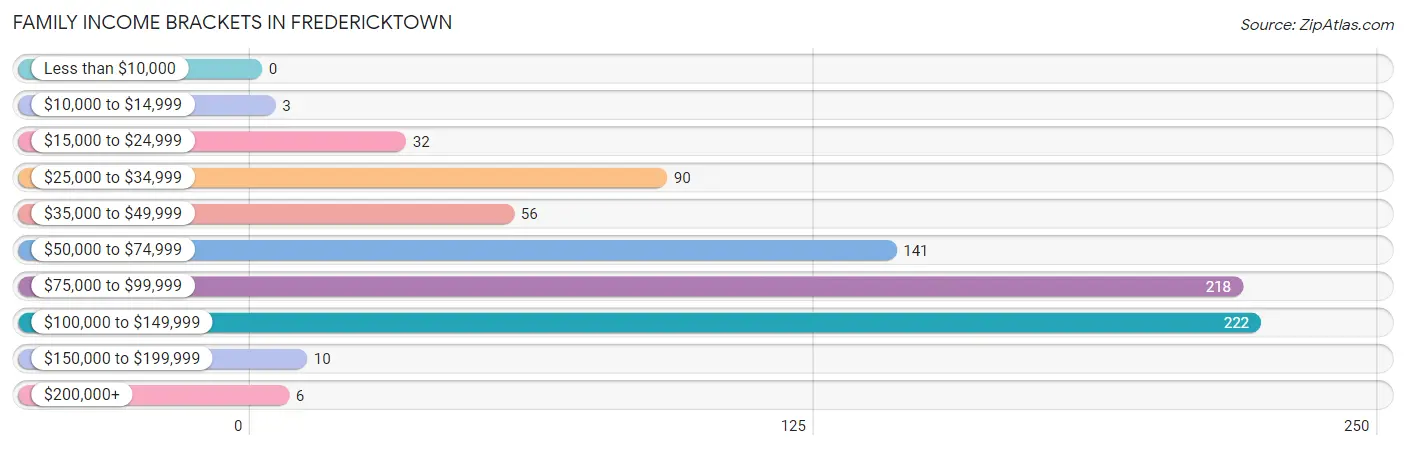
Family Income Brackets in Fredericktown
According to the Fredericktown family income data, there are 222 families falling into the $100,000 to $149,999 income range, which is the most common income bracket and makes up 28.5% of all families.
| Income Bracket | # Families | % Families |
| Less than $10,000 | 0 | 0.0% |
| $10,000 to $14,999 | 3 | 0.4% |
| $15,000 to $24,999 | 32 | 4.1% |
| $25,000 to $34,999 | 90 | 11.6% |
| $35,000 to $49,999 | 56 | 7.2% |
| $50,000 to $74,999 | 141 | 18.1% |
| $75,000 to $99,999 | 218 | 28.0% |
| $100,000 to $149,999 | 222 | 28.5% |
| $150,000 to $199,999 | 10 | 1.3% |
| $200,000+ | 6 | 0.8% |
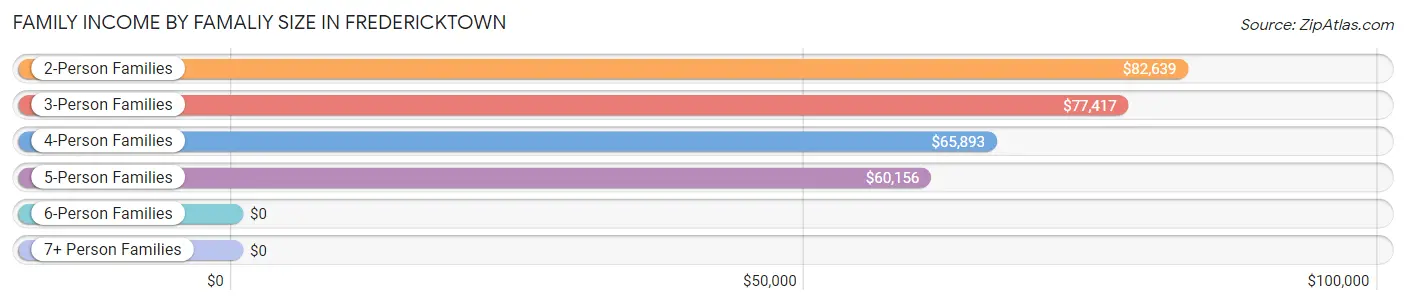
Family Income by Famaliy Size in Fredericktown
2-person families (529 | 68.0%) account for the highest median family income in Fredericktown with $82,639 per family, while 2-person families (529 | 68.0%) have the highest median income of $41,320 per family member.
| Income Bracket | # Families | Median Income |
| 2-Person Families | 529 (68.0%) | $82,639 |
| 3-Person Families | 137 (17.6%) | $77,417 |
| 4-Person Families | 85 (10.9%) | $65,893 |
| 5-Person Families | 27 (3.5%) | $60,156 |
| 6-Person Families | 0 (0.0%) | $0 |
| 7+ Person Families | 0 (0.0%) | $0 |
| Total | 778 (100.0%) | $79,591 |
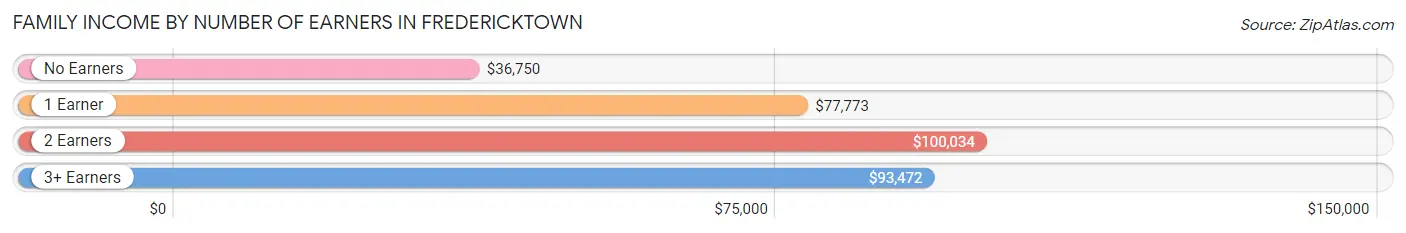
Family Income by Number of Earners in Fredericktown
The median family income in Fredericktown is $79,591, with families comprising 2 earners (365) having the highest median family income of $100,034, while families with no earners (85) have the lowest median family income of $36,750, accounting for 46.9% and 10.9% of families, respectively.
| Number of Earners | # Families | Median Income |
| No Earners | 85 (10.9%) | $36,750 |
| 1 Earner | 284 (36.5%) | $77,773 |
| 2 Earners | 365 (46.9%) | $100,034 |
| 3+ Earners | 44 (5.7%) | $93,472 |
| Total | 778 (100.0%) | $79,591 |
Household Income in Fredericktown
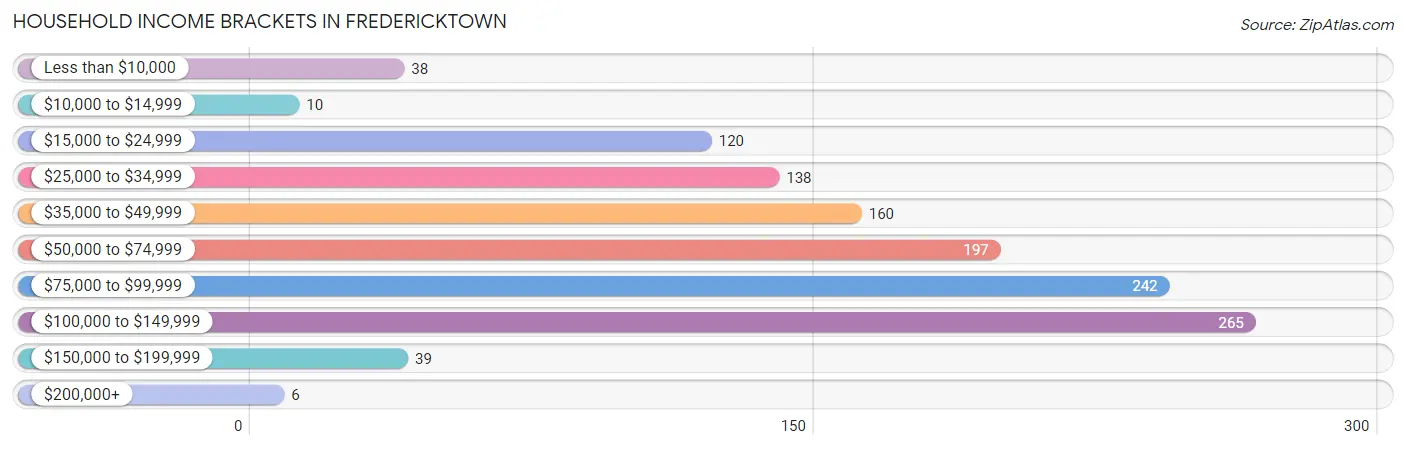
Household Income Brackets in Fredericktown
With 265 households falling in the category, the $100,000 to $149,999 income range is the most frequent in Fredericktown, accounting for 21.8% of all households. In contrast, only 6 households (0.5%) fall into the $200,000+ income bracket, making it the least populous group.
| Income Bracket | # Households | % Households |
| Less than $10,000 | 38 | 3.1% |
| $10,000 to $14,999 | 10 | 0.8% |
| $15,000 to $24,999 | 120 | 9.9% |
| $25,000 to $34,999 | 138 | 11.4% |
| $35,000 to $49,999 | 160 | 13.2% |
| $50,000 to $74,999 | 197 | 16.2% |
| $75,000 to $99,999 | 242 | 19.9% |
| $100,000 to $149,999 | 265 | 21.8% |
| $150,000 to $199,999 | 39 | 3.2% |
| $200,000+ | 6 | 0.5% |
Household Income by Householder Age in Fredericktown
The median household income in Fredericktown is $67,813, with the highest median household income of $78,237 found in the 45 to 64 years age bracket for the primary householder. A total of 375 households (30.9%) fall into this category. Meanwhile, the 65+ years age bracket for the primary householder has the lowest median household income of $37,404, with 371 households (30.6%) in this group.
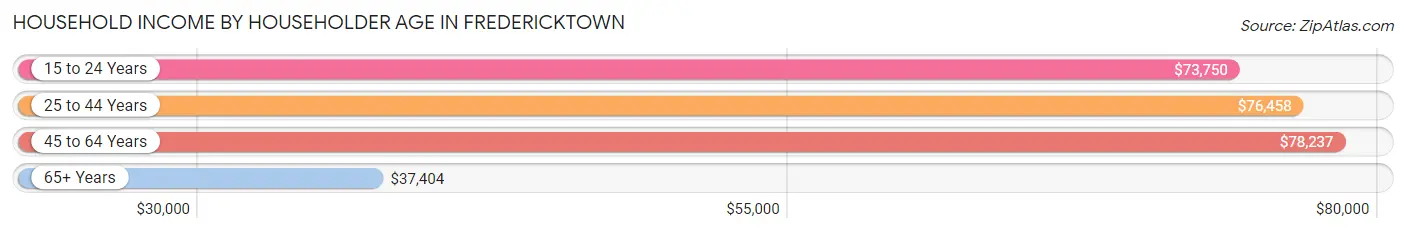
| Income Bracket | # Households | Median Income |
| 15 to 24 Years | 51 (4.2%) | $73,750 |
| 25 to 44 Years | 417 (34.4%) | $76,458 |
| 45 to 64 Years | 375 (30.9%) | $78,237 |
| 65+ Years | 371 (30.6%) | $37,404 |
| Total | 1,214 (100.0%) | $67,813 |
Poverty in Fredericktown
Income Below Poverty by Sex and Age in Fredericktown
With 7.1% poverty level for males and 15.3% for females among the residents of Fredericktown, 6 to 11 year old males and 18 to 24 year old females are the most vulnerable to poverty, with 26 males (45.6%) and 48 females (38.1%) in their respective age groups living below the poverty level.
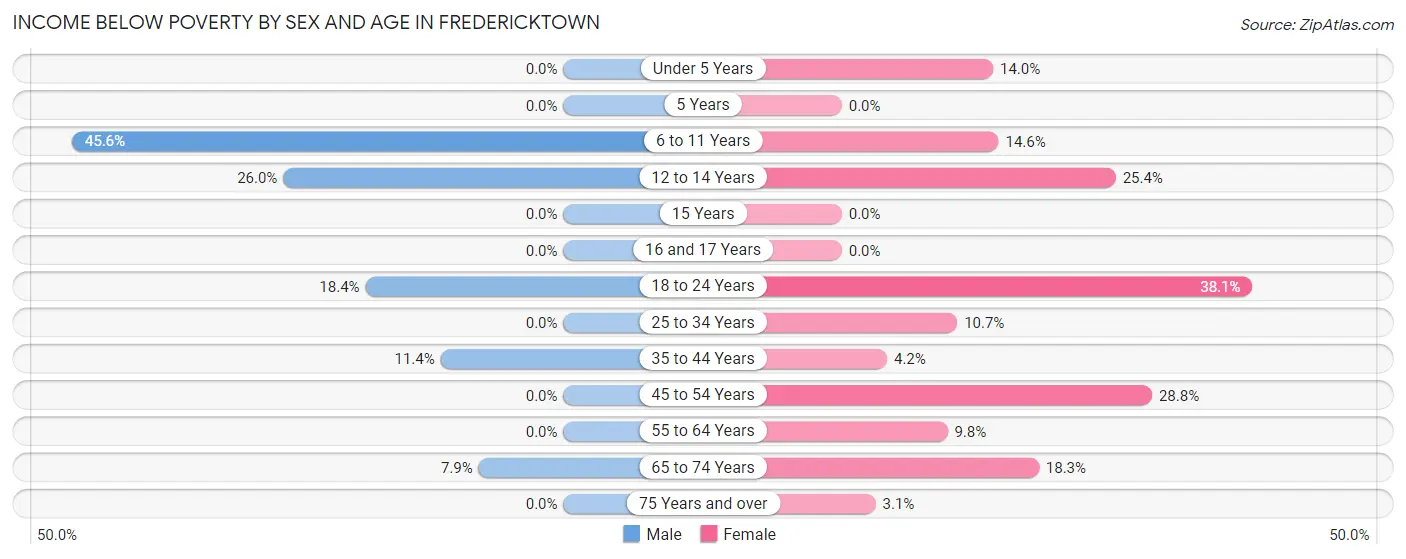
| Age Bracket | Male | Female |
| Under 5 Years | 0 (0.0%) | 8 (14.0%) |
| 5 Years | 0 (0.0%) | 0 (0.0%) |
| 6 to 11 Years | 26 (45.6%) | 8 (14.5%) |
| 12 to 14 Years | 13 (26.0%) | 30 (25.4%) |
| 15 Years | 0 (0.0%) | 0 (0.0%) |
| 16 and 17 Years | 0 (0.0%) | 0 (0.0%) |
| 18 to 24 Years | 18 (18.4%) | 48 (38.1%) |
| 25 to 34 Years | 0 (0.0%) | 21 (10.7%) |
| 35 to 44 Years | 22 (11.4%) | 5 (4.2%) |
| 45 to 54 Years | 0 (0.0%) | 38 (28.8%) |
| 55 to 64 Years | 0 (0.0%) | 26 (9.8%) |
| 65 to 74 Years | 7 (7.9%) | 30 (18.3%) |
| 75 Years and over | 0 (0.0%) | 5 (3.1%) |
| Total | 86 (7.1%) | 219 (15.3%) |
Income Above Poverty by Sex and Age in Fredericktown
According to the poverty statistics in Fredericktown, males aged under 5 years and females aged 5 years are the age groups that are most secure financially, with 100.0% of males and 100.0% of females in these age groups living above the poverty line.
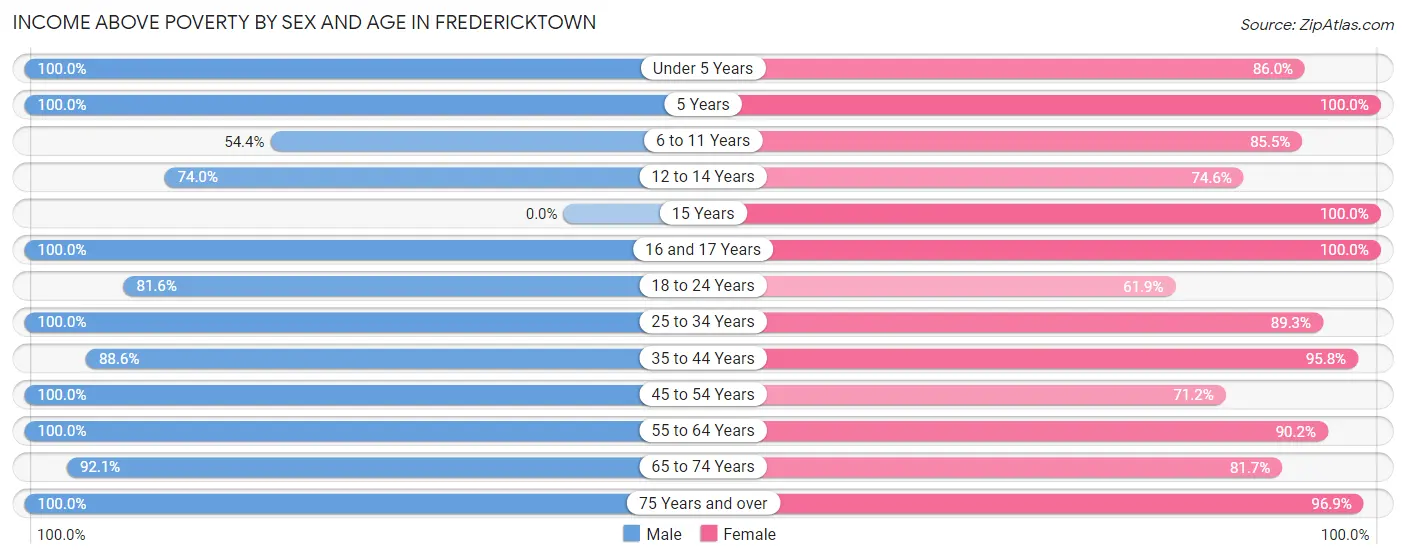
| Age Bracket | Male | Female |
| Under 5 Years | 86 (100.0%) | 49 (86.0%) |
| 5 Years | 13 (100.0%) | 9 (100.0%) |
| 6 to 11 Years | 31 (54.4%) | 47 (85.5%) |
| 12 to 14 Years | 37 (74.0%) | 88 (74.6%) |
| 15 Years | 0 (0.0%) | 9 (100.0%) |
| 16 and 17 Years | 32 (100.0%) | 22 (100.0%) |
| 18 to 24 Years | 80 (81.6%) | 78 (61.9%) |
| 25 to 34 Years | 207 (100.0%) | 175 (89.3%) |
| 35 to 44 Years | 171 (88.6%) | 114 (95.8%) |
| 45 to 54 Years | 116 (100.0%) | 94 (71.2%) |
| 55 to 64 Years | 190 (100.0%) | 239 (90.2%) |
| 65 to 74 Years | 82 (92.1%) | 134 (81.7%) |
| 75 Years and over | 75 (100.0%) | 154 (96.9%) |
| Total | 1,120 (92.9%) | 1,212 (84.7%) |
Income Below Poverty Among Married-Couple Families in Fredericktown
The poverty statistics for married-couple families in Fredericktown show that 2.0% or 11 of the total 552 families live below the poverty line. Families with 3 or 4 children have the highest poverty rate of 25.9%, comprising of 7 families. On the other hand, families with 1 or 2 children have the lowest poverty rate of 0.0%, which includes 0 families.
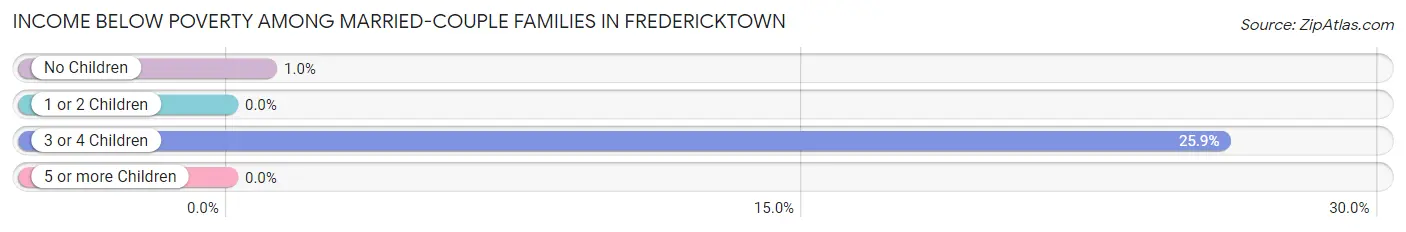
| Children | Above Poverty | Below Poverty |
| No Children | 390 (99.0%) | 4 (1.0%) |
| 1 or 2 Children | 131 (100.0%) | 0 (0.0%) |
| 3 or 4 Children | 20 (74.1%) | 7 (25.9%) |
| 5 or more Children | 0 (0.0%) | 0 (0.0%) |
| Total | 541 (98.0%) | 11 (2.0%) |
Income Below Poverty Among Single-Parent Households in Fredericktown
According to the poverty data in Fredericktown, 1.9% or 3 single-father households and 29.6% or 21 single-mother households are living below the poverty line. Among single-father households, those with 1 or 2 children have the highest poverty rate, with 3 households (3.4%) experiencing poverty. Likewise, among single-mother households, those with 3 or 4 children have the highest poverty rate, with 21 households (100.0%) falling below the poverty line.
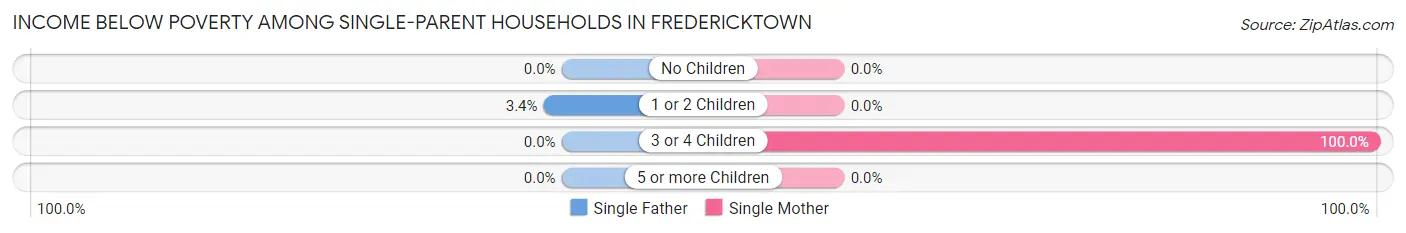
| Children | Single Father | Single Mother |
| No Children | 0 (0.0%) | 0 (0.0%) |
| 1 or 2 Children | 3 (3.4%) | 0 (0.0%) |
| 3 or 4 Children | 0 (0.0%) | 21 (100.0%) |
| 5 or more Children | 0 (0.0%) | 0 (0.0%) |
| Total | 3 (1.9%) | 21 (29.6%) |
Income Below Poverty Among Married-Couple vs Single-Parent Households in Fredericktown
The poverty data for Fredericktown shows that 11 of the married-couple family households (2.0%) and 24 of the single-parent households (10.6%) are living below the poverty level. Within the married-couple family households, those with 3 or 4 children have the highest poverty rate, with 7 households (25.9%) falling below the poverty line. Among the single-parent households, those with 3 or 4 children have the highest poverty rate, with 21 household (61.8%) living below poverty.
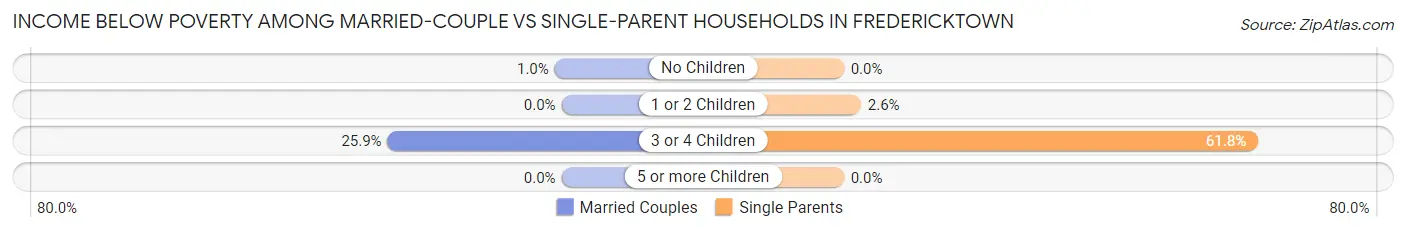
| Children | Married-Couple Families | Single-Parent Households |
| No Children | 4 (1.0%) | 0 (0.0%) |
| 1 or 2 Children | 0 (0.0%) | 3 (2.6%) |
| 3 or 4 Children | 7 (25.9%) | 21 (61.8%) |
| 5 or more Children | 0 (0.0%) | 0 (0.0%) |
| Total | 11 (2.0%) | 24 (10.6%) |
Race in Fredericktown
The most populous races in Fredericktown are White / Caucasian (2,574 | 97.4%), Two or more Races (54 | 2.0%), and Black / African American (9 | 0.3%).
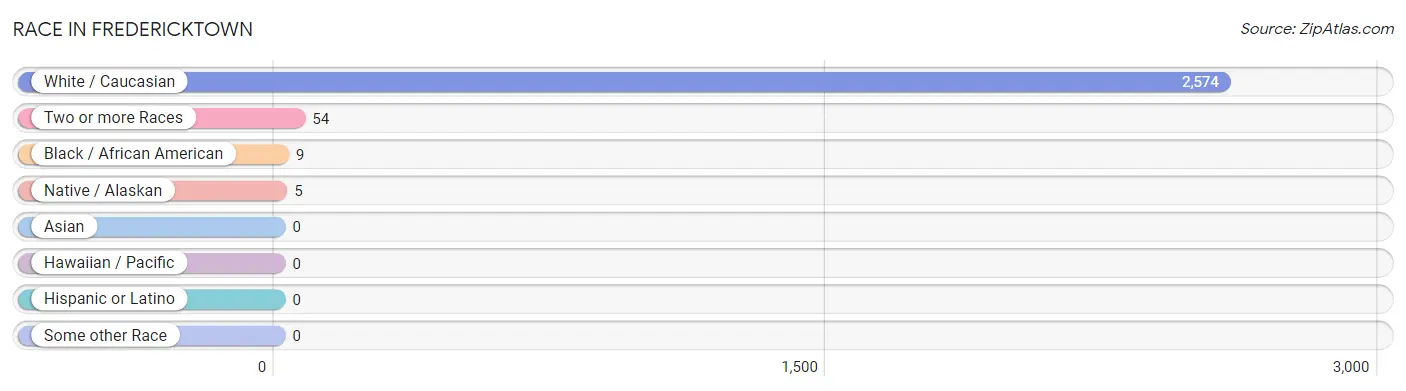
| Race | # Population | % Population |
| Asian | 0 | 0.0% |
| Black / African American | 9 | 0.3% |
| Hawaiian / Pacific | 0 | 0.0% |
| Hispanic or Latino | 0 | 0.0% |
| Native / Alaskan | 5 | 0.2% |
| White / Caucasian | 2,574 | 97.4% |
| Two or more Races | 54 | 2.0% |
| Some other Race | 0 | 0.0% |
| Total | 2,642 | 100.0% |
Ancestry in Fredericktown
The most populous ancestries reported in Fredericktown are German (590 | 22.3%), English (396 | 15.0%), Irish (319 | 12.1%), American (299 | 11.3%), and French (153 | 5.8%), together accounting for 66.5% of all Fredericktown residents.
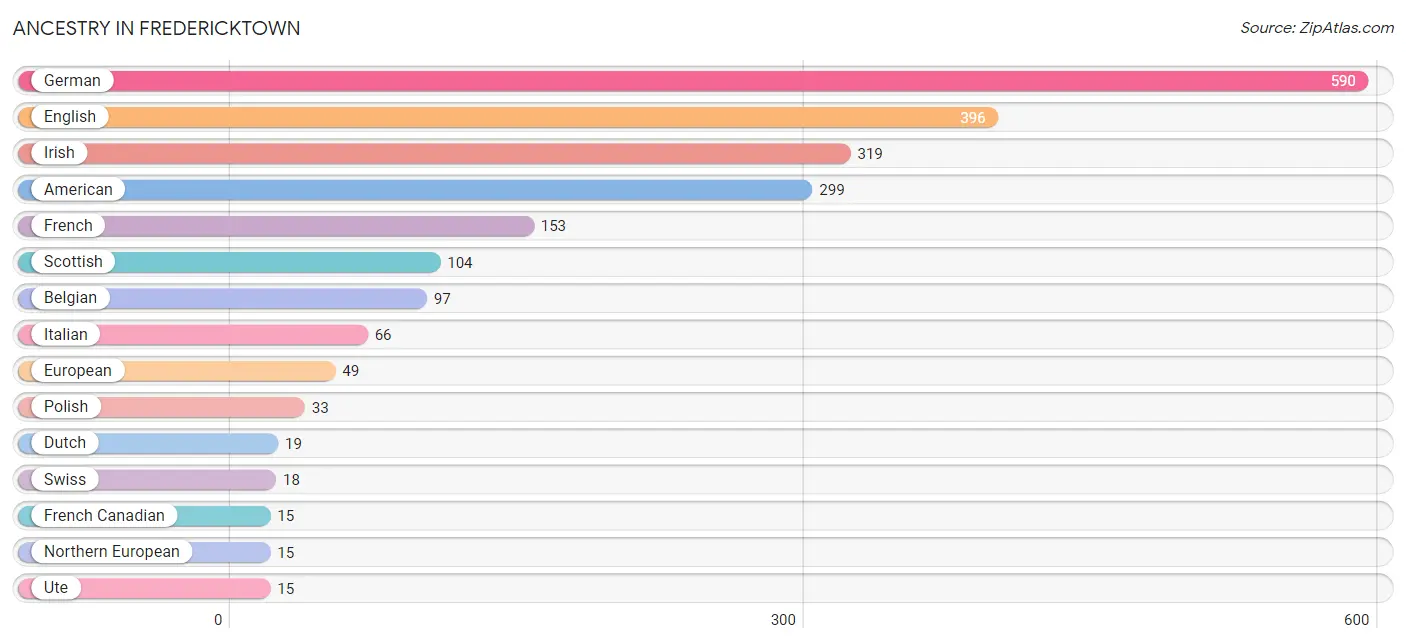
| Ancestry | # Population | % Population |
| American | 299 | 11.3% |
| Belgian | 97 | 3.7% |
| Bhutanese | 12 | 0.4% |
| Croatian | 6 | 0.2% |
| Czech | 4 | 0.2% |
| Czechoslovakian | 5 | 0.2% |
| Dutch | 19 | 0.7% |
| English | 396 | 15.0% |
| European | 49 | 1.8% |
| French | 153 | 5.8% |
| French Canadian | 15 | 0.6% |
| German | 590 | 22.3% |
| Hungarian | 11 | 0.4% |
| Irish | 319 | 12.1% |
| Italian | 66 | 2.5% |
| Lumbee | 5 | 0.2% |
| Northern European | 15 | 0.6% |
| Polish | 33 | 1.3% |
| Russian | 8 | 0.3% |
| Scandinavian | 4 | 0.2% |
| Scotch-Irish | 7 | 0.3% |
| Scottish | 104 | 3.9% |
| Slovene | 5 | 0.2% |
| Swedish | 14 | 0.5% |
| Swiss | 18 | 0.7% |
| Ukrainian | 8 | 0.3% |
| Ute | 15 | 0.6% |
| Welsh | 11 | 0.4% | View All 28 Rows |
Immigrants in Fredericktown
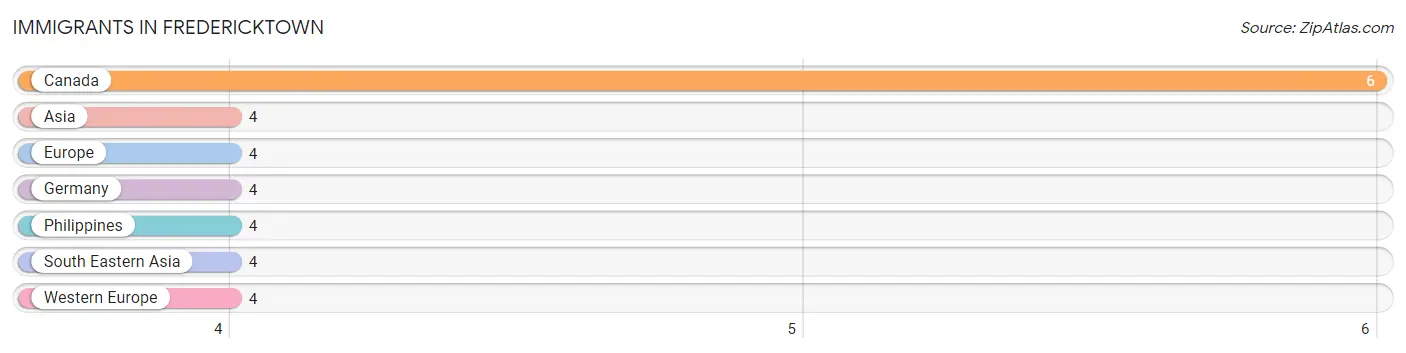
The most numerous immigrant groups reported in Fredericktown came from Canada (6 | 0.2%), Asia (4 | 0.2%), Europe (4 | 0.2%), Germany (4 | 0.2%), and Philippines (4 | 0.2%), together accounting for 0.8% of all Fredericktown residents.
| Immigration Origin | # Population | % Population |
| Asia | 4 | 0.2% |
| Canada | 6 | 0.2% |
| Europe | 4 | 0.2% |
| Germany | 4 | 0.2% |
| Philippines | 4 | 0.2% |
| South Eastern Asia | 4 | 0.2% |
| Western Europe | 4 | 0.2% | View All 7 Rows |
Sex and Age in Fredericktown
Sex and Age in Fredericktown
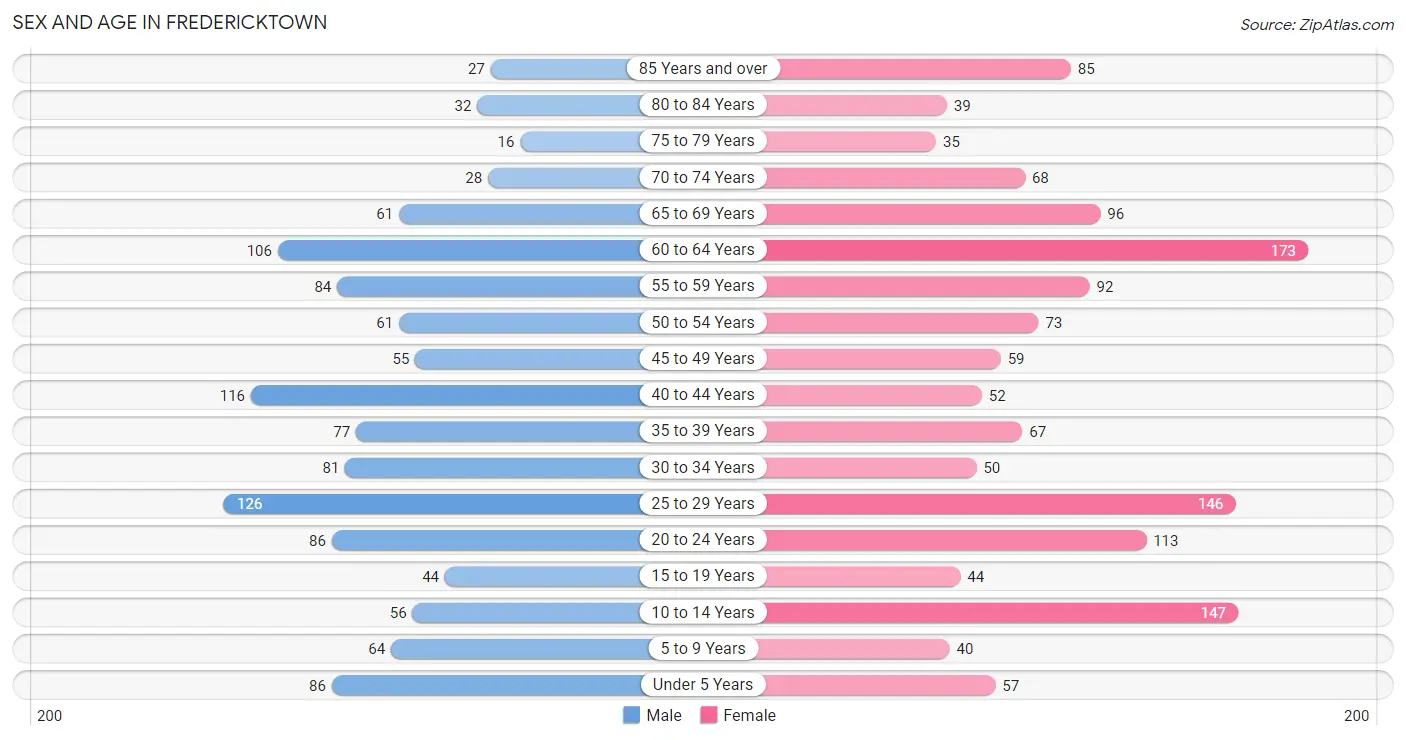
The most populous age groups in Fredericktown are 25 to 29 Years (126 | 10.4%) for men and 60 to 64 Years (173 | 12.0%) for women.
| Age Bracket | Male | Female |
| Under 5 Years | 86 (7.1%) | 57 (4.0%) |
| 5 to 9 Years | 64 (5.3%) | 40 (2.8%) |
| 10 to 14 Years | 56 (4.6%) | 147 (10.2%) |
| 15 to 19 Years | 44 (3.6%) | 44 (3.1%) |
| 20 to 24 Years | 86 (7.1%) | 113 (7.9%) |
| 25 to 29 Years | 126 (10.4%) | 146 (10.2%) |
| 30 to 34 Years | 81 (6.7%) | 50 (3.5%) |
| 35 to 39 Years | 77 (6.4%) | 67 (4.7%) |
| 40 to 44 Years | 116 (9.6%) | 52 (3.6%) |
| 45 to 49 Years | 55 (4.6%) | 59 (4.1%) |
| 50 to 54 Years | 61 (5.1%) | 73 (5.1%) |
| 55 to 59 Years | 84 (7.0%) | 92 (6.4%) |
| 60 to 64 Years | 106 (8.8%) | 173 (12.0%) |
| 65 to 69 Years | 61 (5.1%) | 96 (6.7%) |
| 70 to 74 Years | 28 (2.3%) | 68 (4.7%) |
| 75 to 79 Years | 16 (1.3%) | 35 (2.4%) |
| 80 to 84 Years | 32 (2.6%) | 39 (2.7%) |
| 85 Years and over | 27 (2.2%) | 85 (5.9%) |
| Total | 1,206 (100.0%) | 1,436 (100.0%) |
Families and Households in Fredericktown
Median Family Size in Fredericktown
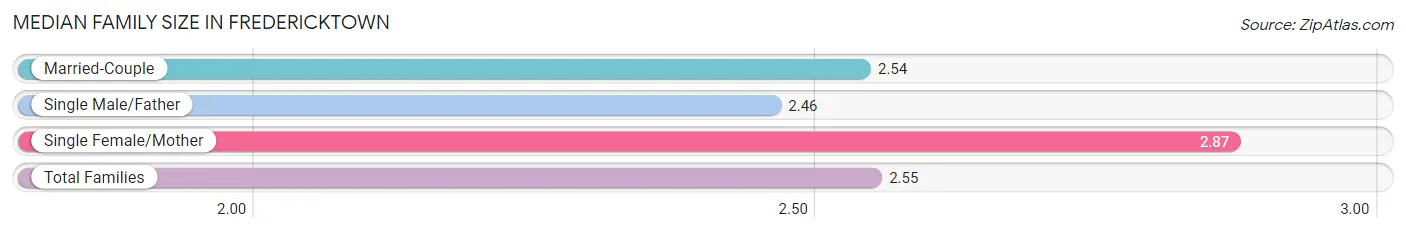
The median family size in Fredericktown is 2.55 persons per family, with single female/mother families (71 | 9.1%) accounting for the largest median family size of 2.87 persons per family. On the other hand, single male/father families (155 | 19.9%) represent the smallest median family size with 2.46 persons per family.
| Family Type | # Families | Family Size |
| Married-Couple | 552 (71.0%) | 2.54 |
| Single Male/Father | 155 (19.9%) | 2.46 |
| Single Female/Mother | 71 (9.1%) | 2.87 |
| Total Families | 778 (100.0%) | 2.55 |
Median Household Size in Fredericktown
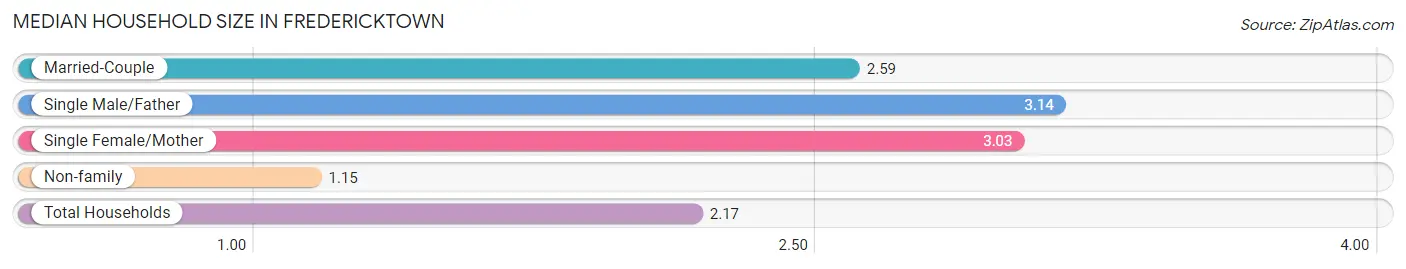
The median household size in Fredericktown is 2.17 persons per household, with single male/father households (155 | 12.8%) accounting for the largest median household size of 3.14 persons per household. non-family households (436 | 35.9%) represent the smallest median household size with 1.15 persons per household.
| Household Type | # Households | Household Size |
| Married-Couple | 552 (45.5%) | 2.59 |
| Single Male/Father | 155 (12.8%) | 3.14 |
| Single Female/Mother | 71 (5.9%) | 3.03 |
| Non-family | 436 (35.9%) | 1.15 |
| Total Households | 1,214 (100.0%) | 2.17 |
Household Size by Marriage Status in Fredericktown
Out of a total of 1,214 households in Fredericktown, 778 (64.1%) are family households, while 436 (35.9%) are nonfamily households. The most numerous type of family households are 2-person households, comprising 445, and the most common type of nonfamily households are 1-person households, comprising 372.
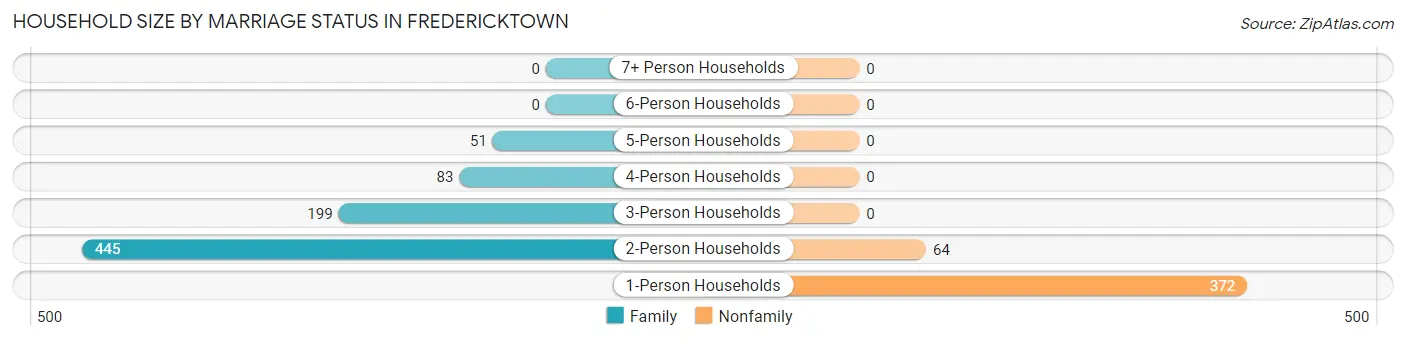
| Household Size | Family Households | Nonfamily Households |
| 1-Person Households | - | 372 (30.6%) |
| 2-Person Households | 445 (36.7%) | 64 (5.3%) |
| 3-Person Households | 199 (16.4%) | 0 (0.0%) |
| 4-Person Households | 83 (6.8%) | 0 (0.0%) |
| 5-Person Households | 51 (4.2%) | 0 (0.0%) |
| 6-Person Households | 0 (0.0%) | 0 (0.0%) |
| 7+ Person Households | 0 (0.0%) | 0 (0.0%) |
| Total | 778 (64.1%) | 436 (35.9%) |
Female Fertility in Fredericktown
Fertility by Age in Fredericktown
Average fertility rate in Fredericktown is 174.0 births per 1,000 women. Women in the age bracket of 20 to 34 years have the highest fertility rate with 282.0 births per 1,000 women. Women in the age bracket of 20 to 34 years acount for 92.5% of all women with births.
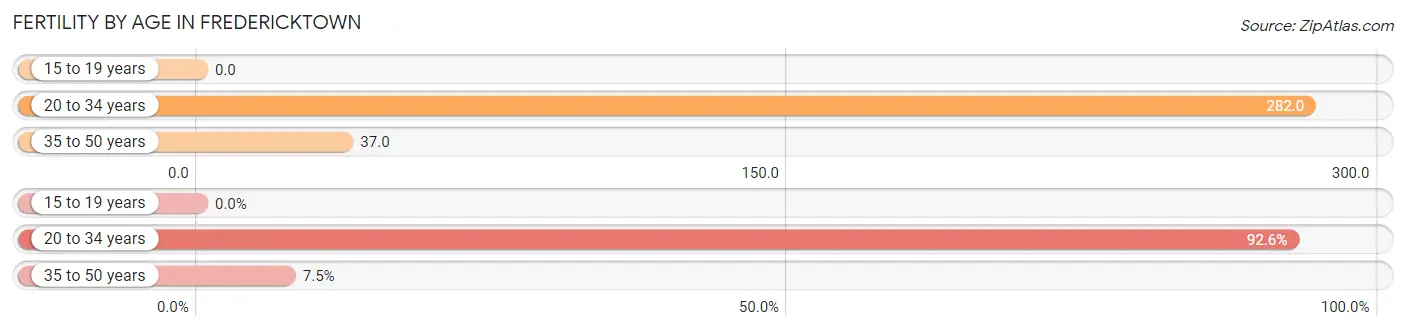
| Age Bracket | Women with Births | Births / 1,000 Women |
| 15 to 19 years | 0 (0.0%) | 0.0 |
| 20 to 34 years | 87 (92.5%) | 282.0 |
| 35 to 50 years | 7 (7.4%) | 37.0 |
| Total | 94 (100.0%) | 174.0 |
Fertility by Age by Marriage Status in Fredericktown
37.2% of women with births (94) in Fredericktown are married. The highest percentage of unmarried women with births falls into 35 to 50 years age bracket with 100.0% of them unmarried at the time of birth, while the lowest percentage of unmarried women with births belong to 20 to 34 years age bracket with 59.8% of them unmarried.
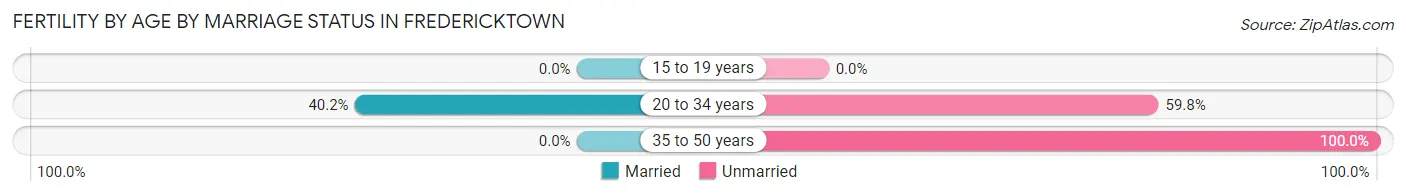
| Age Bracket | Married | Unmarried |
| 15 to 19 years | 0 (0.0%) | 0 (0.0%) |
| 20 to 34 years | 35 (40.2%) | 52 (59.8%) |
| 35 to 50 years | 0 (0.0%) | 7 (100.0%) |
| Total | 35 (37.2%) | 59 (62.8%) |
Fertility by Education in Fredericktown
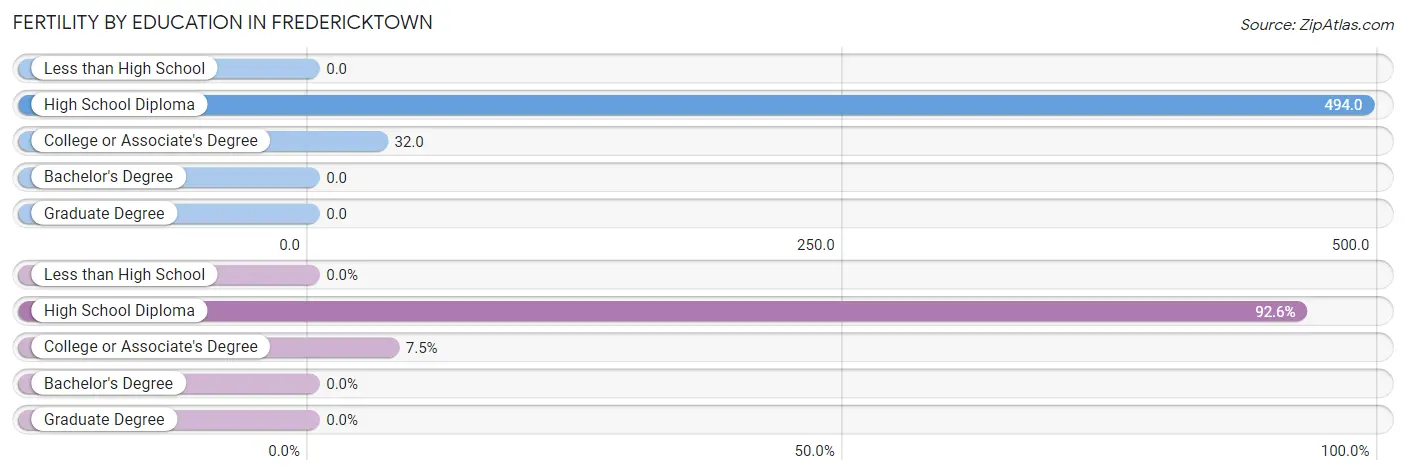
| Educational Attainment | Women with Births | Births / 1,000 Women |
| Less than High School | 0 (0.0%) | 0.0 |
| High School Diploma | 87 (92.5%) | 494.0 |
| College or Associate's Degree | 7 (7.4%) | 32.0 |
| Bachelor's Degree | 0 (0.0%) | 0.0 |
| Graduate Degree | 0 (0.0%) | 0.0 |
| Total | 94 (100.0%) | 174.0 |
Fertility by Education by Marriage Status in Fredericktown
62.8% of women with births in Fredericktown are unmarried. Women with the educational attainment of college or associate's degree are most likely to be married with 100.0% of them married at childbirth, while women with the educational attainment of high school diploma are least likely to be married with 67.8% of them unmarried at childbirth.
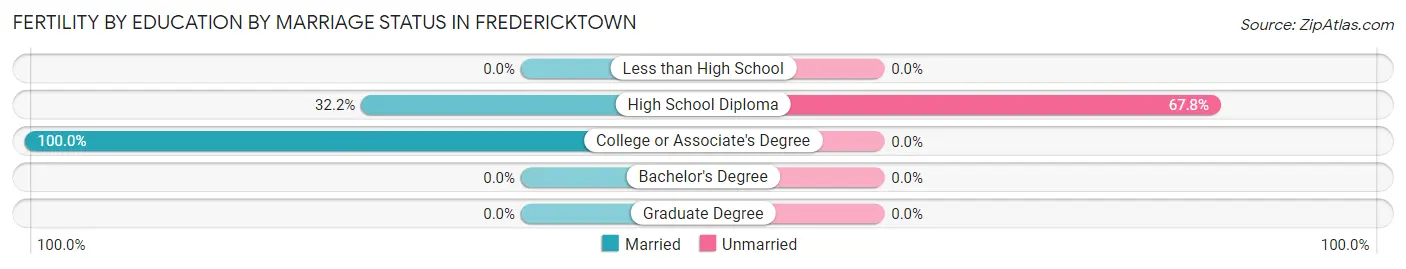
| Educational Attainment | Married | Unmarried |
| Less than High School | 0 (0.0%) | 0 (0.0%) |
| High School Diploma | 28 (32.2%) | 59 (67.8%) |
| College or Associate's Degree | 7 (100.0%) | 0 (0.0%) |
| Bachelor's Degree | 0 (0.0%) | 0 (0.0%) |
| Graduate Degree | 0 (0.0%) | 0 (0.0%) |
| Total | 35 (37.2%) | 59 (62.8%) |
Employment Characteristics in Fredericktown
Employment by Class of Employer in Fredericktown
Among the 1,332 employed individuals in Fredericktown, private company employees (990 | 74.3%), not-for-profit organizations (116 | 8.7%), and self-employed (not incorporated) (88 | 6.6%) make up the most common classes of employment.
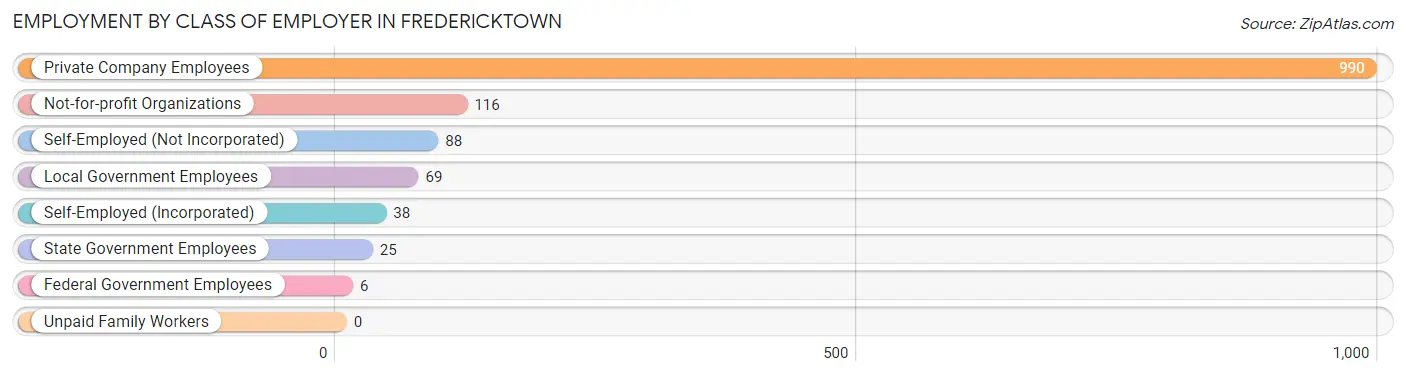
| Employer Class | # Employees | % Employees |
| Private Company Employees | 990 | 74.3% |
| Self-Employed (Incorporated) | 38 | 2.9% |
| Self-Employed (Not Incorporated) | 88 | 6.6% |
| Not-for-profit Organizations | 116 | 8.7% |
| Local Government Employees | 69 | 5.2% |
| State Government Employees | 25 | 1.9% |
| Federal Government Employees | 6 | 0.4% |
| Unpaid Family Workers | 0 | 0.0% |
| Total | 1,332 | 100.0% |
Employment Status by Age in Fredericktown
According to the labor force statistics for Fredericktown, out of the total population over 16 years of age (2,183), 63.7% or 1,391 individuals are in the labor force, with 3.2% or 45 of them unemployed. The age group with the highest labor force participation rate is 25 to 29 years, with 100.0% or 272 individuals in the labor force. Within the labor force, the 65 to 74 years age range has the highest percentage of unemployed individuals, with 37.0% or 17 of them being unemployed.
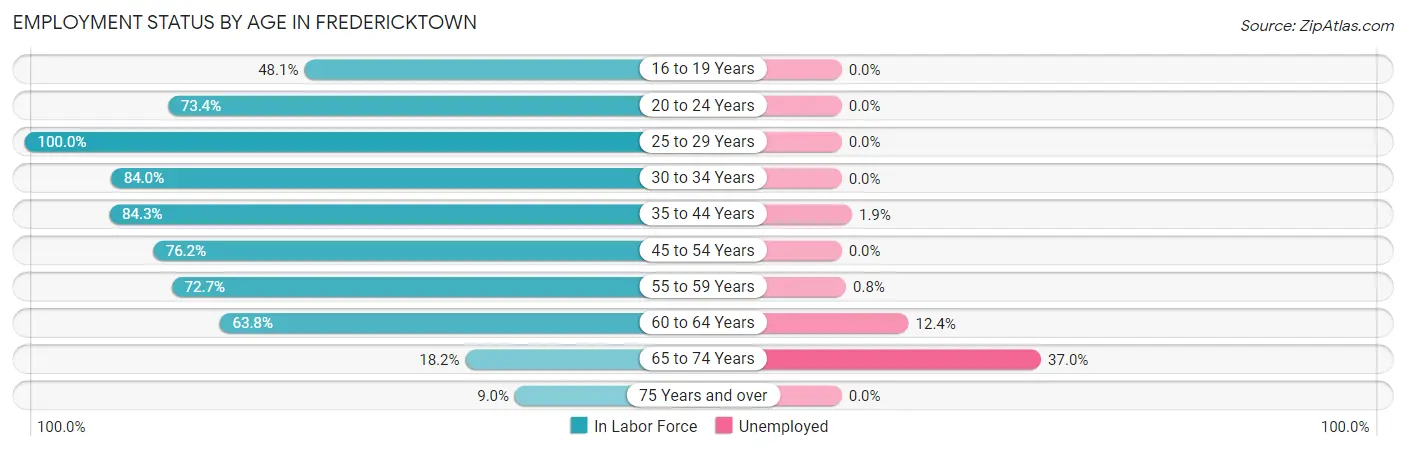
| Age Bracket | In Labor Force | Unemployed |
| 16 to 19 Years | 38 (48.1%) | 0 (0.0%) |
| 20 to 24 Years | 146 (73.4%) | 0 (0.0%) |
| 25 to 29 Years | 272 (100.0%) | 0 (0.0%) |
| 30 to 34 Years | 110 (84.0%) | 0 (0.0%) |
| 35 to 44 Years | 263 (84.3%) | 5 (1.9%) |
| 45 to 54 Years | 189 (76.2%) | 0 (0.0%) |
| 55 to 59 Years | 128 (72.7%) | 1 (0.8%) |
| 60 to 64 Years | 178 (63.8%) | 22 (12.4%) |
| 65 to 74 Years | 46 (18.2%) | 17 (37.0%) |
| 75 Years and over | 21 (9.0%) | 0 (0.0%) |
| Total | 1,391 (63.7%) | 45 (3.2%) |
Employment Status by Educational Attainment in Fredericktown
According to labor force statistics for Fredericktown, 80.4% of individuals (1,140) out of the total population between 25 and 64 years of age (1,418) are in the labor force, with 2.5% or 28 of them being unemployed. The group with the highest labor force participation rate are those with the educational attainment of college / associate degree, with 92.8% or 489 individuals in the labor force. Within the labor force, individuals with high school diploma education have the highest percentage of unemployment, with 5.9% or 23 of them being unemployed.
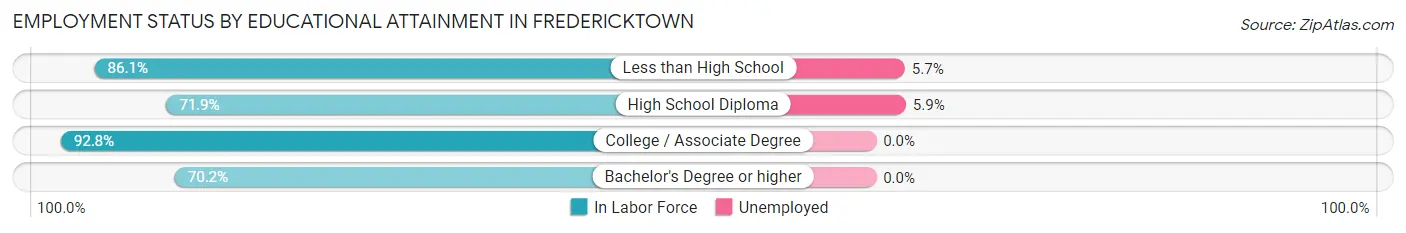
| Educational Attainment | In Labor Force | Unemployed |
| Less than High School | 87 (86.1%) | 6 (5.7%) |
| High School Diploma | 392 (71.9%) | 32 (5.9%) |
| College / Associate Degree | 489 (92.8%) | 0 (0.0%) |
| Bachelor's Degree or higher | 172 (70.2%) | 0 (0.0%) |
| Total | 1,140 (80.4%) | 35 (2.5%) |
Employment Occupations by Sex in Fredericktown
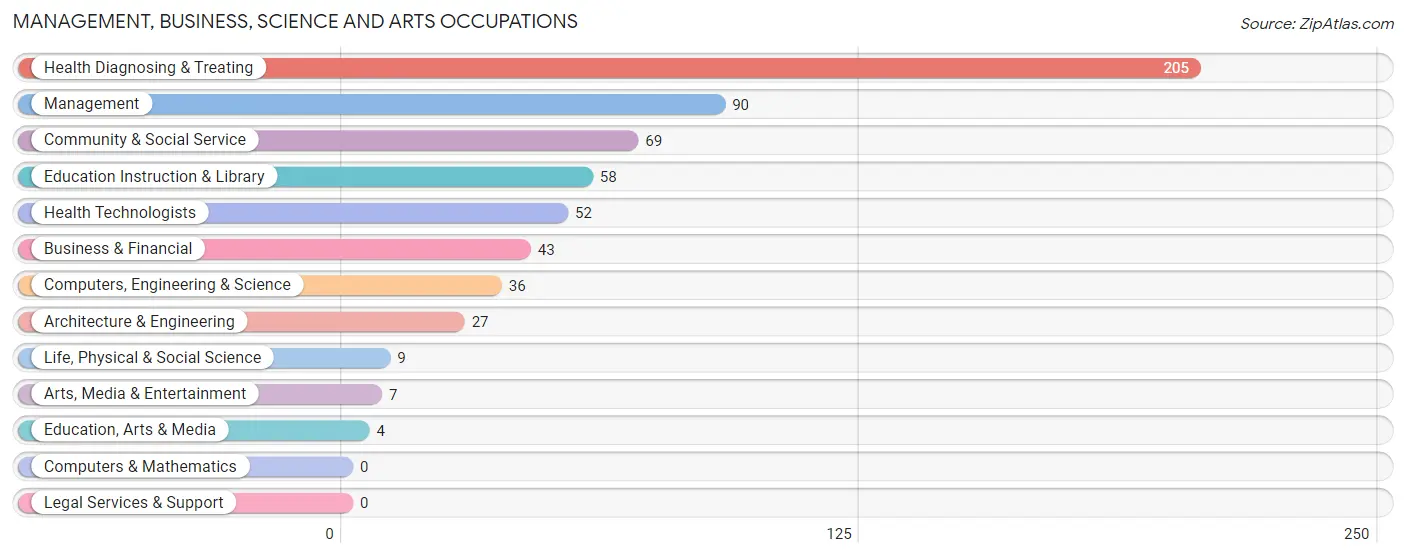
Management, Business, Science and Arts Occupations
The most common Management, Business, Science and Arts occupations in Fredericktown are Health Diagnosing & Treating (205 | 15.3%), Management (90 | 6.7%), Community & Social Service (69 | 5.1%), Education Instruction & Library (58 | 4.3%), and Health Technologists (52 | 3.9%).
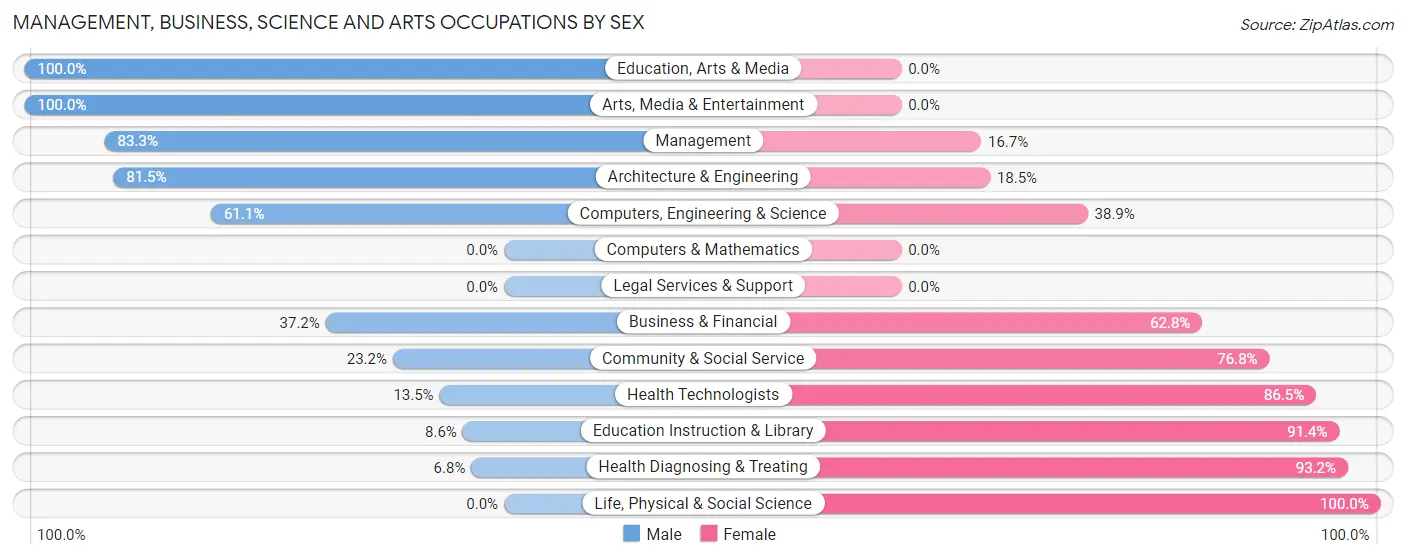
Management, Business, Science and Arts Occupations by Sex
Within the Management, Business, Science and Arts occupations in Fredericktown, the most male-oriented occupations are Education, Arts & Media (100.0%), Arts, Media & Entertainment (100.0%), and Management (83.3%), while the most female-oriented occupations are Life, Physical & Social Science (100.0%), Health Diagnosing & Treating (93.2%), and Education Instruction & Library (91.4%).
| Occupation | Male | Female |
| Management | 75 (83.3%) | 15 (16.7%) |
| Business & Financial | 16 (37.2%) | 27 (62.8%) |
| Computers, Engineering & Science | 22 (61.1%) | 14 (38.9%) |
| Computers & Mathematics | 0 (0.0%) | 0 (0.0%) |
| Architecture & Engineering | 22 (81.5%) | 5 (18.5%) |
| Life, Physical & Social Science | 0 (0.0%) | 9 (100.0%) |
| Community & Social Service | 16 (23.2%) | 53 (76.8%) |
| Education, Arts & Media | 4 (100.0%) | 0 (0.0%) |
| Legal Services & Support | 0 (0.0%) | 0 (0.0%) |
| Education Instruction & Library | 5 (8.6%) | 53 (91.4%) |
| Arts, Media & Entertainment | 7 (100.0%) | 0 (0.0%) |
| Health Diagnosing & Treating | 14 (6.8%) | 191 (93.2%) |
| Health Technologists | 7 (13.5%) | 45 (86.5%) |
| Total (Category) | 143 (32.3%) | 300 (67.7%) |
| Total (Overall) | 707 (52.8%) | 633 (47.2%) |
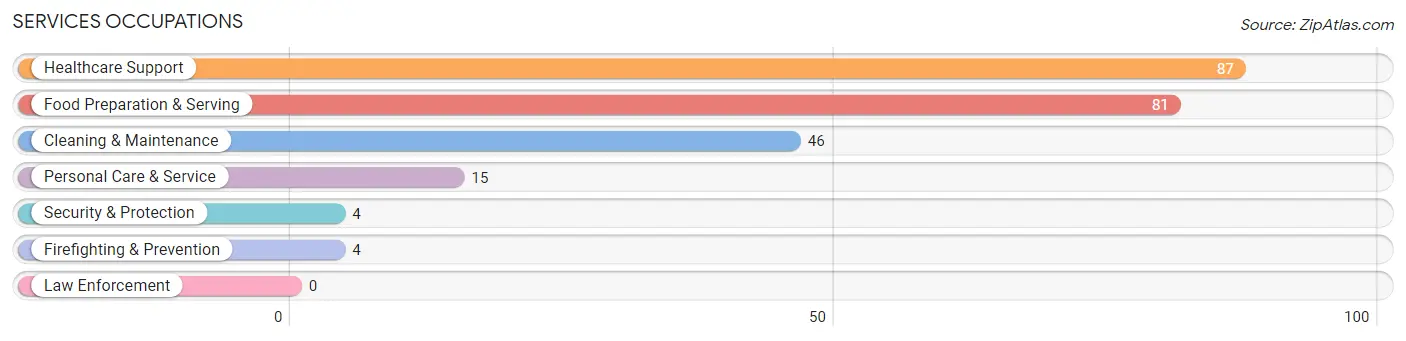
Services Occupations
The most common Services occupations in Fredericktown are Healthcare Support (87 | 6.5%), Food Preparation & Serving (81 | 6.0%), Cleaning & Maintenance (46 | 3.4%), Personal Care & Service (15 | 1.1%), and Security & Protection (4 | 0.3%).
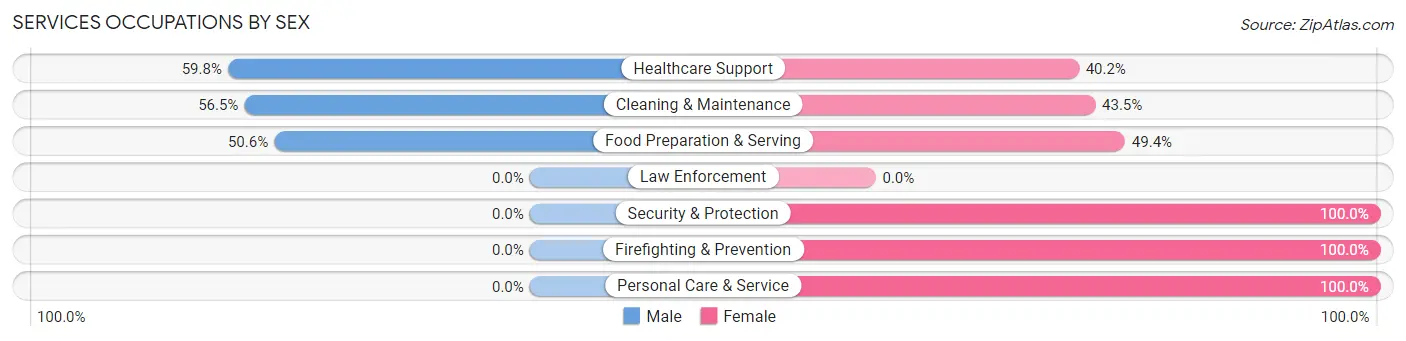
Services Occupations by Sex
Within the Services occupations in Fredericktown, the most male-oriented occupations are Healthcare Support (59.8%), Cleaning & Maintenance (56.5%), and Food Preparation & Serving (50.6%), while the most female-oriented occupations are Security & Protection (100.0%), Firefighting & Prevention (100.0%), and Personal Care & Service (100.0%).
| Occupation | Male | Female |
| Healthcare Support | 52 (59.8%) | 35 (40.2%) |
| Security & Protection | 0 (0.0%) | 4 (100.0%) |
| Firefighting & Prevention | 0 (0.0%) | 4 (100.0%) |
| Law Enforcement | 0 (0.0%) | 0 (0.0%) |
| Food Preparation & Serving | 41 (50.6%) | 40 (49.4%) |
| Cleaning & Maintenance | 26 (56.5%) | 20 (43.5%) |
| Personal Care & Service | 0 (0.0%) | 15 (100.0%) |
| Total (Category) | 119 (51.1%) | 114 (48.9%) |
| Total (Overall) | 707 (52.8%) | 633 (47.2%) |
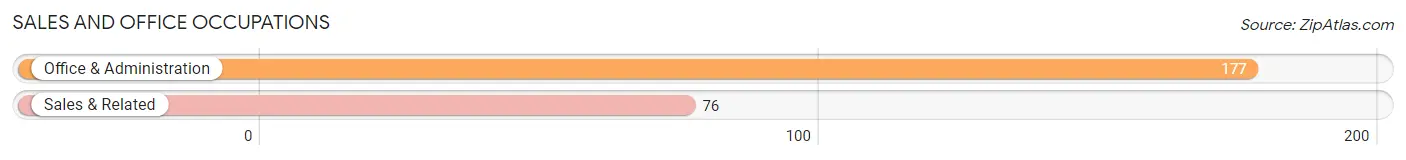
Sales and Office Occupations
The most common Sales and Office occupations in Fredericktown are Office & Administration (177 | 13.2%), and Sales & Related (76 | 5.7%).
Sales and Office Occupations by Sex
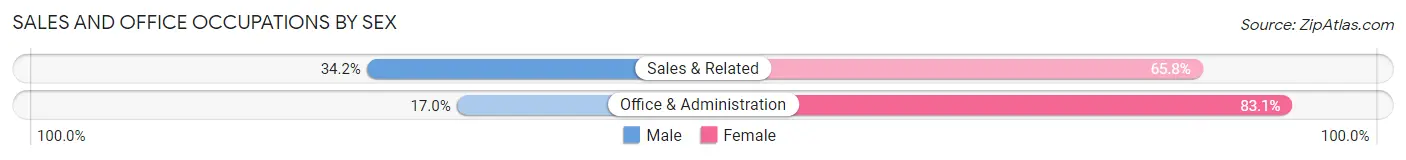
| Occupation | Male | Female |
| Sales & Related | 26 (34.2%) | 50 (65.8%) |
| Office & Administration | 30 (17.0%) | 147 (83.1%) |
| Total (Category) | 56 (22.1%) | 197 (77.9%) |
| Total (Overall) | 707 (52.8%) | 633 (47.2%) |
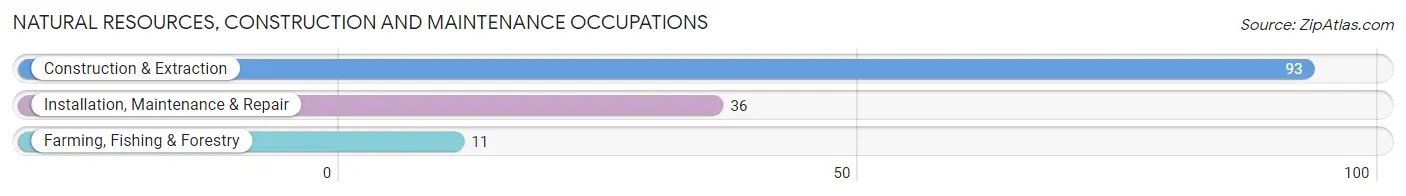
Natural Resources, Construction and Maintenance Occupations
The most common Natural Resources, Construction and Maintenance occupations in Fredericktown are Construction & Extraction (93 | 6.9%), Installation, Maintenance & Repair (36 | 2.7%), and Farming, Fishing & Forestry (11 | 0.8%).
Natural Resources, Construction and Maintenance Occupations by Sex
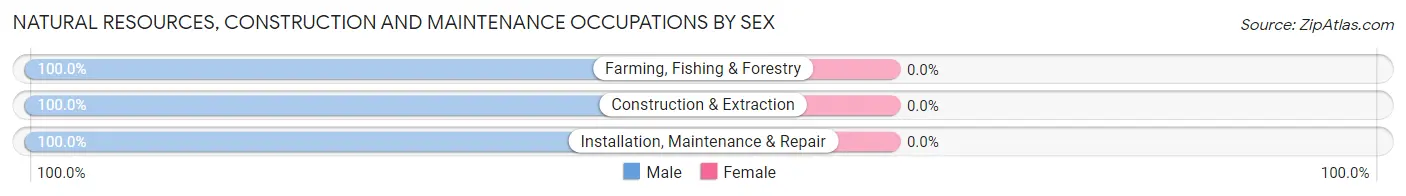
| Occupation | Male | Female |
| Farming, Fishing & Forestry | 11 (100.0%) | 0 (0.0%) |
| Construction & Extraction | 93 (100.0%) | 0 (0.0%) |
| Installation, Maintenance & Repair | 36 (100.0%) | 0 (0.0%) |
| Total (Category) | 140 (100.0%) | 0 (0.0%) |
| Total (Overall) | 707 (52.8%) | 633 (47.2%) |
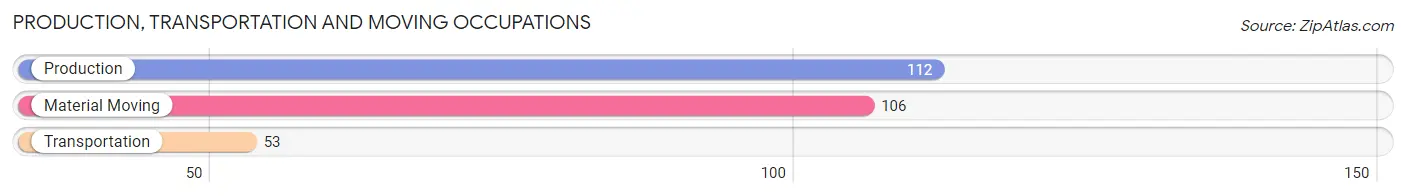
Production, Transportation and Moving Occupations
The most common Production, Transportation and Moving occupations in Fredericktown are Production (112 | 8.4%), Material Moving (106 | 7.9%), and Transportation (53 | 4.0%).
Production, Transportation and Moving Occupations by Sex
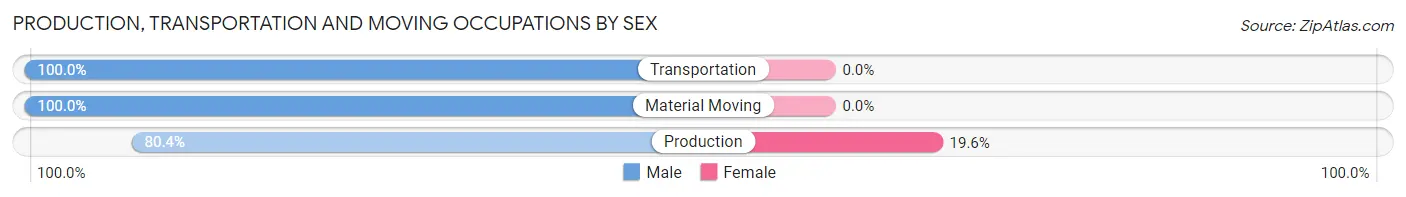
| Occupation | Male | Female |
| Production | 90 (80.4%) | 22 (19.6%) |
| Transportation | 53 (100.0%) | 0 (0.0%) |
| Material Moving | 106 (100.0%) | 0 (0.0%) |
| Total (Category) | 249 (91.9%) | 22 (8.1%) |
| Total (Overall) | 707 (52.8%) | 633 (47.2%) |
Employment Industries by Sex in Fredericktown
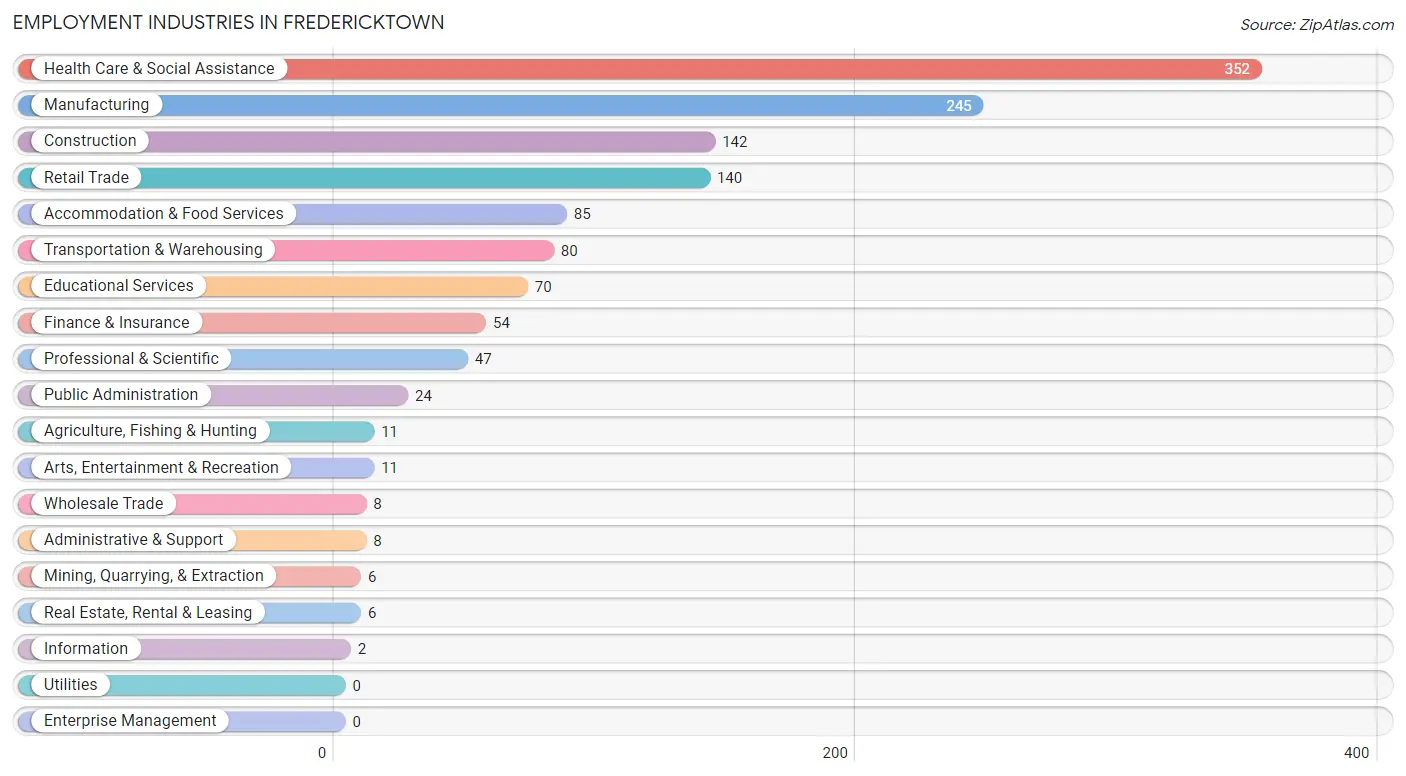
Employment Industries in Fredericktown
The major employment industries in Fredericktown include Health Care & Social Assistance (352 | 26.3%), Manufacturing (245 | 18.3%), Construction (142 | 10.6%), Retail Trade (140 | 10.4%), and Accommodation & Food Services (85 | 6.3%).
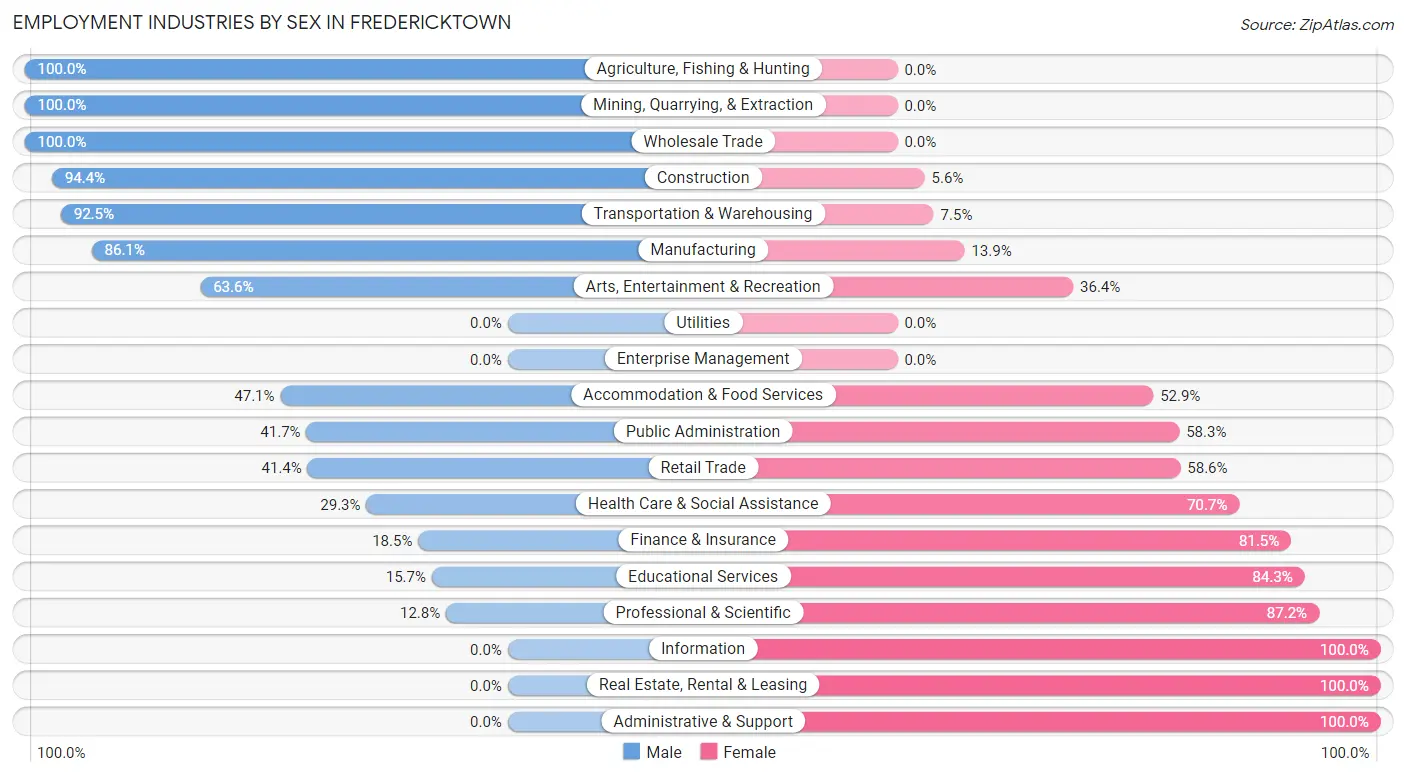
Employment Industries by Sex in Fredericktown
The Fredericktown industries that see more men than women are Agriculture, Fishing & Hunting (100.0%), Mining, Quarrying, & Extraction (100.0%), and Wholesale Trade (100.0%), whereas the industries that tend to have a higher number of women are Information (100.0%), Real Estate, Rental & Leasing (100.0%), and Administrative & Support (100.0%).
| Industry | Male | Female |
| Agriculture, Fishing & Hunting | 11 (100.0%) | 0 (0.0%) |
| Mining, Quarrying, & Extraction | 6 (100.0%) | 0 (0.0%) |
| Construction | 134 (94.4%) | 8 (5.6%) |
| Manufacturing | 211 (86.1%) | 34 (13.9%) |
| Wholesale Trade | 8 (100.0%) | 0 (0.0%) |
| Retail Trade | 58 (41.4%) | 82 (58.6%) |
| Transportation & Warehousing | 74 (92.5%) | 6 (7.5%) |
| Utilities | 0 (0.0%) | 0 (0.0%) |
| Information | 0 (0.0%) | 2 (100.0%) |
| Finance & Insurance | 10 (18.5%) | 44 (81.5%) |
| Real Estate, Rental & Leasing | 0 (0.0%) | 6 (100.0%) |
| Professional & Scientific | 6 (12.8%) | 41 (87.2%) |
| Enterprise Management | 0 (0.0%) | 0 (0.0%) |
| Administrative & Support | 0 (0.0%) | 8 (100.0%) |
| Educational Services | 11 (15.7%) | 59 (84.3%) |
| Health Care & Social Assistance | 103 (29.3%) | 249 (70.7%) |
| Arts, Entertainment & Recreation | 7 (63.6%) | 4 (36.4%) |
| Accommodation & Food Services | 40 (47.1%) | 45 (52.9%) |
| Public Administration | 10 (41.7%) | 14 (58.3%) |
| Total | 707 (52.8%) | 633 (47.2%) |
Education in Fredericktown
School Enrollment in Fredericktown
The most common levels of schooling among the 459 students in Fredericktown are middle school (161 | 35.1%), high school (97 | 21.1%), and elementary school (93 | 20.3%).
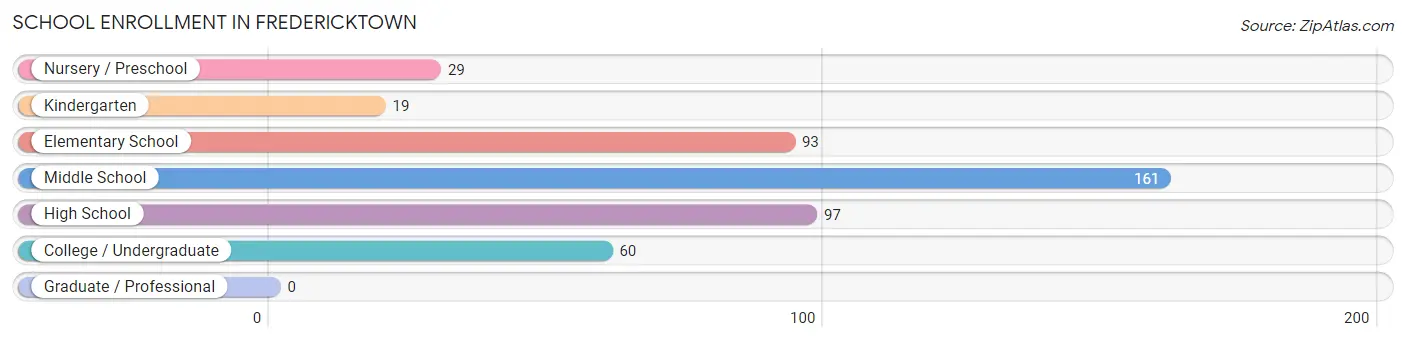
| School Level | # Students | % Students |
| Nursery / Preschool | 29 | 6.3% |
| Kindergarten | 19 | 4.1% |
| Elementary School | 93 | 20.3% |
| Middle School | 161 | 35.1% |
| High School | 97 | 21.1% |
| College / Undergraduate | 60 | 13.1% |
| Graduate / Professional | 0 | 0.0% |
| Total | 459 | 100.0% |
School Enrollment by Age by Funding Source in Fredericktown
Out of a total of 459 students who are enrolled in schools in Fredericktown, 69 (15.0%) attend a private institution, while the remaining 390 (85.0%) are enrolled in public schools. The age group of 20 to 24 year olds has the highest likelihood of being enrolled in private schools, with 28 (100.0% in the age bracket) enrolled. Conversely, the age group of 3 to 4 year olds has the lowest likelihood of being enrolled in a private school, with 20 (100.0% in the age bracket) attending a public institution.
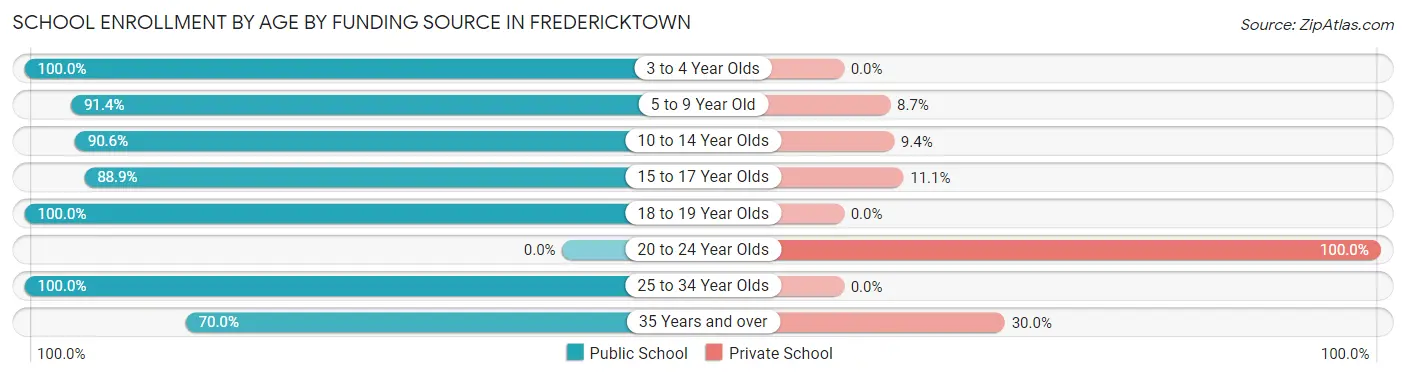
| Age Bracket | Public School | Private School |
| 3 to 4 Year Olds | 20 (100.0%) | 0 (0.0%) |
| 5 to 9 Year Old | 95 (91.3%) | 9 (8.6%) |
| 10 to 14 Year Olds | 184 (90.6%) | 19 (9.4%) |
| 15 to 17 Year Olds | 56 (88.9%) | 7 (11.1%) |
| 18 to 19 Year Olds | 13 (100.0%) | 0 (0.0%) |
| 20 to 24 Year Olds | 0 (0.0%) | 28 (100.0%) |
| 25 to 34 Year Olds | 8 (100.0%) | 0 (0.0%) |
| 35 Years and over | 14 (70.0%) | 6 (30.0%) |
| Total | 390 (85.0%) | 69 (15.0%) |
Educational Attainment by Field of Study in Fredericktown
Science & technology (87 | 26.4%), education (68 | 20.6%), business (42 | 12.7%), liberal arts & history (27 | 8.2%), and arts & humanities (21 | 6.4%) are the most common fields of study among 330 individuals in Fredericktown who have obtained a bachelor's degree or higher.
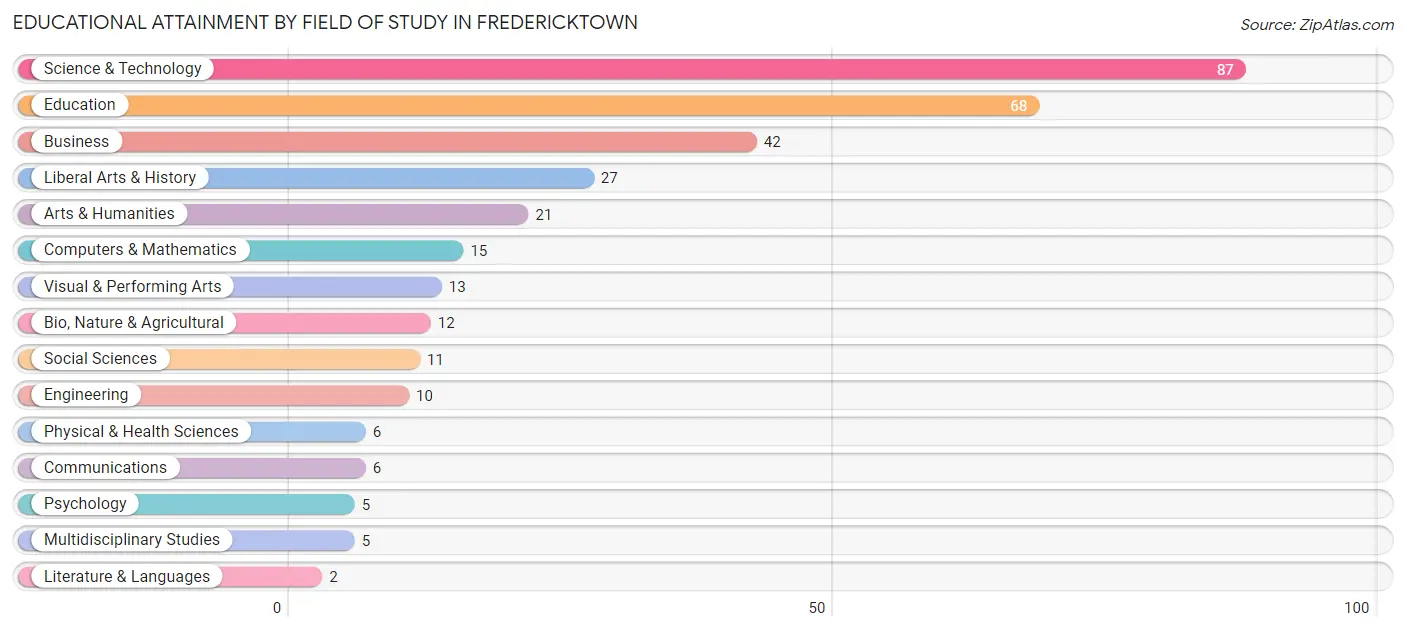
| Field of Study | # Graduates | % Graduates |
| Computers & Mathematics | 15 | 4.5% |
| Bio, Nature & Agricultural | 12 | 3.6% |
| Physical & Health Sciences | 6 | 1.8% |
| Psychology | 5 | 1.5% |
| Social Sciences | 11 | 3.3% |
| Engineering | 10 | 3.0% |
| Multidisciplinary Studies | 5 | 1.5% |
| Science & Technology | 87 | 26.4% |
| Business | 42 | 12.7% |
| Education | 68 | 20.6% |
| Literature & Languages | 2 | 0.6% |
| Liberal Arts & History | 27 | 8.2% |
| Visual & Performing Arts | 13 | 3.9% |
| Communications | 6 | 1.8% |
| Arts & Humanities | 21 | 6.4% |
| Total | 330 | 100.0% |
Transportation & Commute in Fredericktown
Vehicle Availability by Sex in Fredericktown
The most prevalent vehicle ownership categories in Fredericktown are males with 2 vehicles (336, accounting for 47.9%) and females with 2 vehicles (277, making up 53.7%).
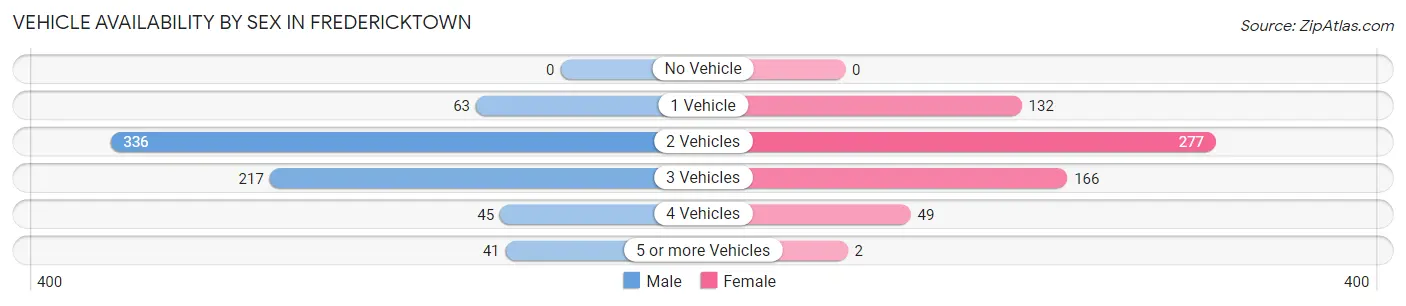
| Vehicles Available | Male | Female |
| No Vehicle | 0 (0.0%) | 0 (0.0%) |
| 1 Vehicle | 63 (9.0%) | 132 (21.1%) |
| 2 Vehicles | 336 (47.9%) | 277 (44.3%) |
| 3 Vehicles | 217 (30.9%) | 166 (26.5%) |
| 4 Vehicles | 45 (6.4%) | 49 (7.8%) |
| 5 or more Vehicles | 41 (5.8%) | 2 (0.3%) |
| Total | 702 (100.0%) | 626 (100.0%) |
Commute Time in Fredericktown
The most frequently occuring commute durations in Fredericktown are 15 to 19 minutes (191 commuters, 15.1%), 20 to 24 minutes (174 commuters, 13.7%), and 45 to 59 minutes (167 commuters, 13.2%).
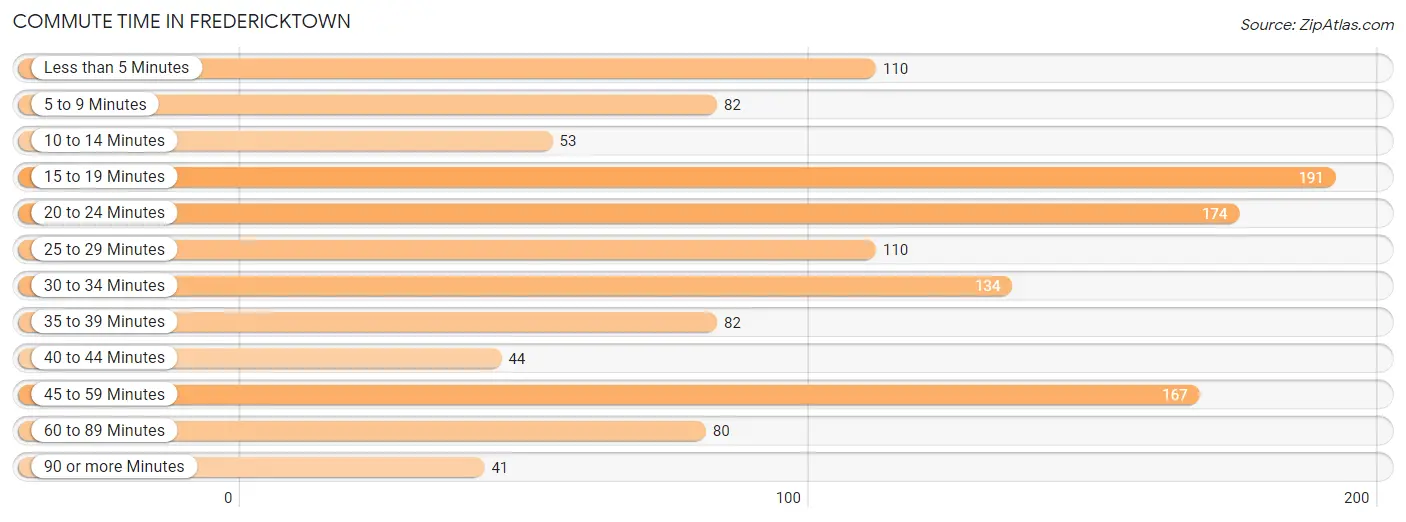
| Commute Time | # Commuters | % Commuters |
| Less than 5 Minutes | 110 | 8.7% |
| 5 to 9 Minutes | 82 | 6.5% |
| 10 to 14 Minutes | 53 | 4.2% |
| 15 to 19 Minutes | 191 | 15.1% |
| 20 to 24 Minutes | 174 | 13.7% |
| 25 to 29 Minutes | 110 | 8.7% |
| 30 to 34 Minutes | 134 | 10.6% |
| 35 to 39 Minutes | 82 | 6.5% |
| 40 to 44 Minutes | 44 | 3.5% |
| 45 to 59 Minutes | 167 | 13.2% |
| 60 to 89 Minutes | 80 | 6.3% |
| 90 or more Minutes | 41 | 3.2% |
Commute Time by Sex in Fredericktown
The most common commute times in Fredericktown are 20 to 24 minutes (138 commuters, 20.3%) for males and 15 to 19 minutes (139 commuters, 23.7%) for females.
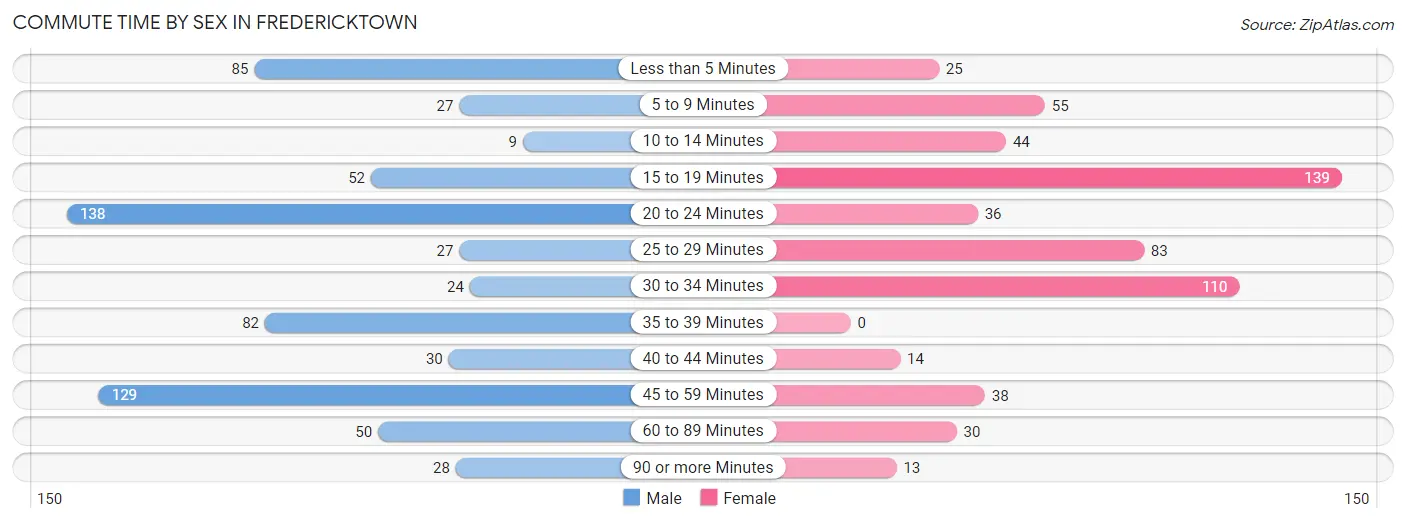
| Commute Time | Male | Female |
| Less than 5 Minutes | 85 (12.5%) | 25 (4.3%) |
| 5 to 9 Minutes | 27 (4.0%) | 55 (9.4%) |
| 10 to 14 Minutes | 9 (1.3%) | 44 (7.5%) |
| 15 to 19 Minutes | 52 (7.6%) | 139 (23.7%) |
| 20 to 24 Minutes | 138 (20.3%) | 36 (6.1%) |
| 25 to 29 Minutes | 27 (4.0%) | 83 (14.1%) |
| 30 to 34 Minutes | 24 (3.5%) | 110 (18.7%) |
| 35 to 39 Minutes | 82 (12.0%) | 0 (0.0%) |
| 40 to 44 Minutes | 30 (4.4%) | 14 (2.4%) |
| 45 to 59 Minutes | 129 (18.9%) | 38 (6.5%) |
| 60 to 89 Minutes | 50 (7.3%) | 30 (5.1%) |
| 90 or more Minutes | 28 (4.1%) | 13 (2.2%) |
Time of Departure to Work by Sex in Fredericktown
The most frequent times of departure to work in Fredericktown are 12:00 AM to 4:59 AM (129, 18.9%) for males and 5:00 AM to 5:29 AM (116, 19.8%) for females.
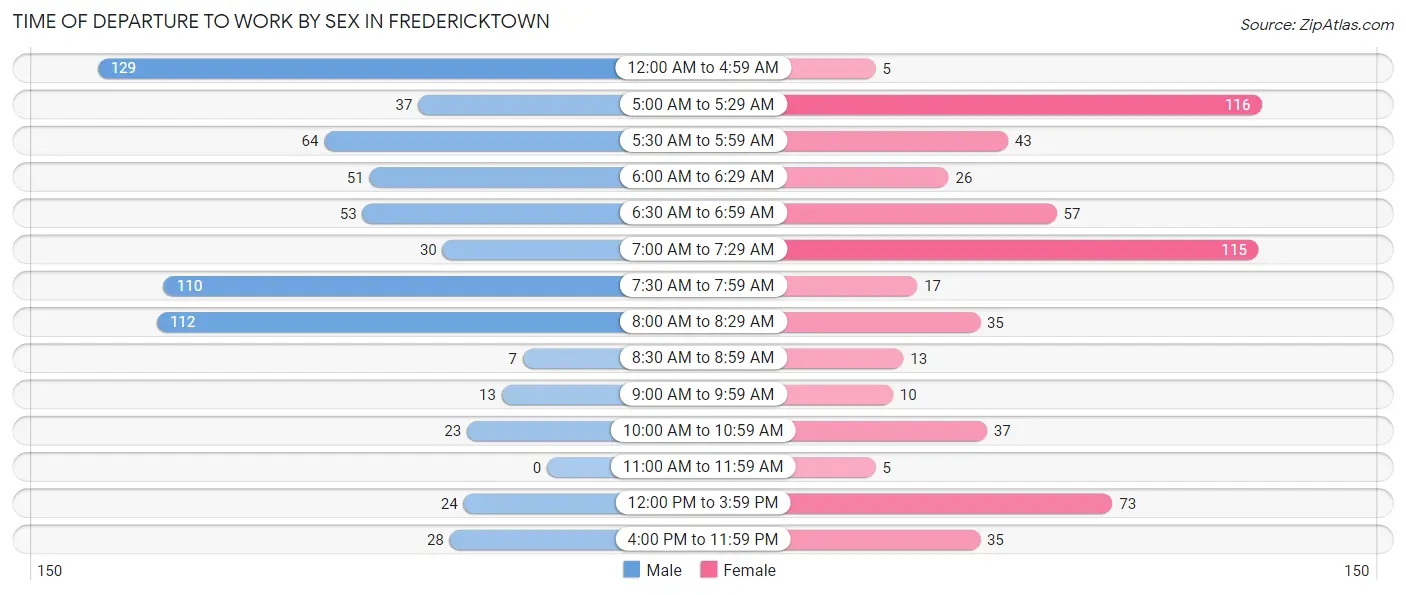
| Time of Departure | Male | Female |
| 12:00 AM to 4:59 AM | 129 (18.9%) | 5 (0.9%) |
| 5:00 AM to 5:29 AM | 37 (5.4%) | 116 (19.8%) |
| 5:30 AM to 5:59 AM | 64 (9.4%) | 43 (7.3%) |
| 6:00 AM to 6:29 AM | 51 (7.5%) | 26 (4.4%) |
| 6:30 AM to 6:59 AM | 53 (7.8%) | 57 (9.7%) |
| 7:00 AM to 7:29 AM | 30 (4.4%) | 115 (19.6%) |
| 7:30 AM to 7:59 AM | 110 (16.2%) | 17 (2.9%) |
| 8:00 AM to 8:29 AM | 112 (16.5%) | 35 (6.0%) |
| 8:30 AM to 8:59 AM | 7 (1.0%) | 13 (2.2%) |
| 9:00 AM to 9:59 AM | 13 (1.9%) | 10 (1.7%) |
| 10:00 AM to 10:59 AM | 23 (3.4%) | 37 (6.3%) |
| 11:00 AM to 11:59 AM | 0 (0.0%) | 5 (0.9%) |
| 12:00 PM to 3:59 PM | 24 (3.5%) | 73 (12.4%) |
| 4:00 PM to 11:59 PM | 28 (4.1%) | 35 (6.0%) |
| Total | 681 (100.0%) | 587 (100.0%) |
Housing Occupancy in Fredericktown
Occupancy by Ownership in Fredericktown
Of the total 1,214 dwellings in Fredericktown, owner-occupied units account for 934 (76.9%), while renter-occupied units make up 280 (23.1%).
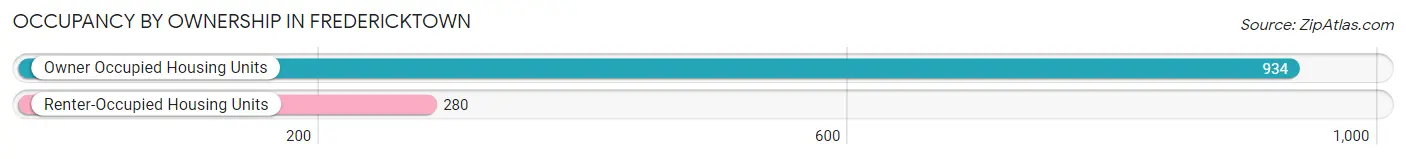
| Occupancy | # Housing Units | % Housing Units |
| Owner Occupied Housing Units | 934 | 76.9% |
| Renter-Occupied Housing Units | 280 | 23.1% |
| Total Occupied Housing Units | 1,214 | 100.0% |
Occupancy by Household Size in Fredericktown
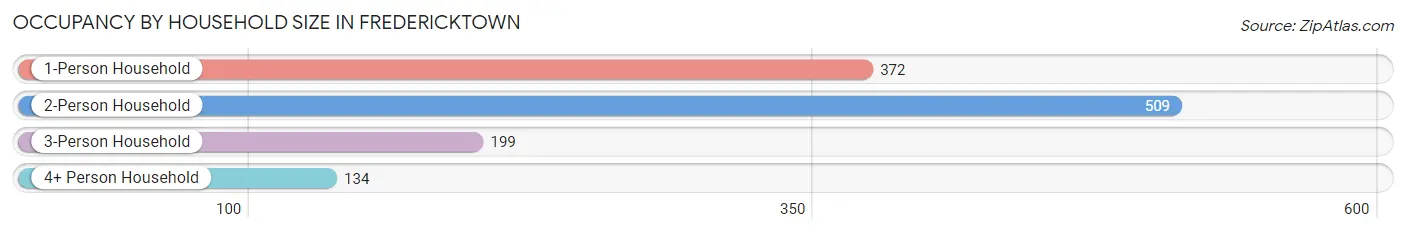
| Household Size | # Housing Units | % Housing Units |
| 1-Person Household | 372 | 30.6% |
| 2-Person Household | 509 | 41.9% |
| 3-Person Household | 199 | 16.4% |
| 4+ Person Household | 134 | 11.0% |
| Total Housing Units | 1,214 | 100.0% |
Occupancy by Ownership by Household Size in Fredericktown
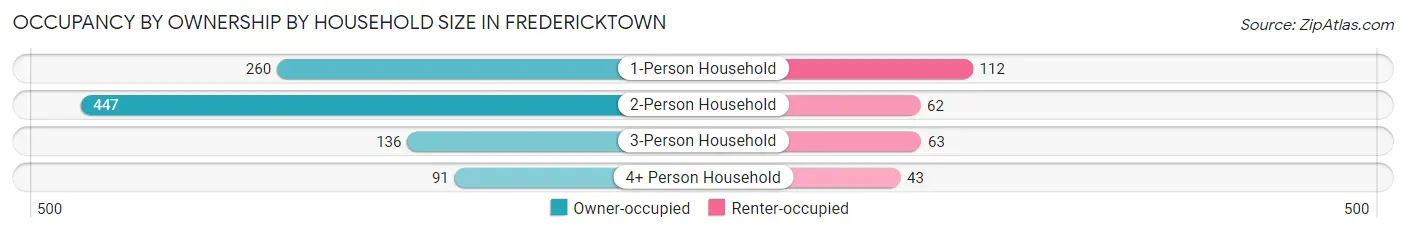
| Household Size | Owner-occupied | Renter-occupied |
| 1-Person Household | 260 (69.9%) | 112 (30.1%) |
| 2-Person Household | 447 (87.8%) | 62 (12.2%) |
| 3-Person Household | 136 (68.3%) | 63 (31.7%) |
| 4+ Person Household | 91 (67.9%) | 43 (32.1%) |
| Total Housing Units | 934 (76.9%) | 280 (23.1%) |
Occupancy by Educational Attainment in Fredericktown
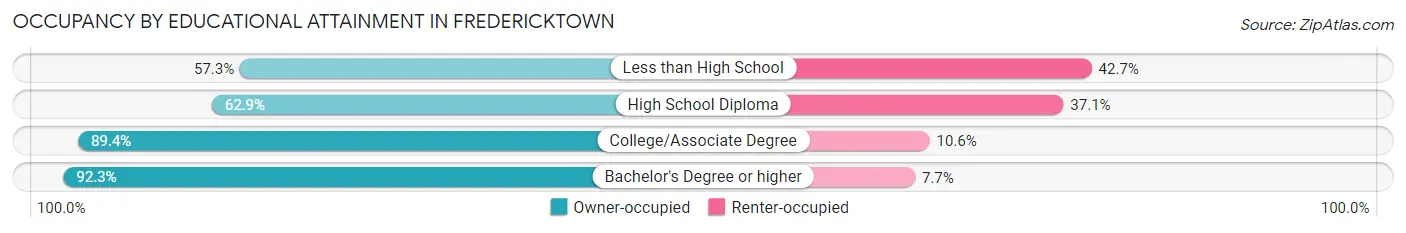
| Household Size | Owner-occupied | Renter-occupied |
| Less than High School | 59 (57.3%) | 44 (42.7%) |
| High School Diploma | 293 (62.9%) | 173 (37.1%) |
| College/Associate Degree | 414 (89.4%) | 49 (10.6%) |
| Bachelor's Degree or higher | 168 (92.3%) | 14 (7.7%) |
Occupancy by Age of Householder in Fredericktown
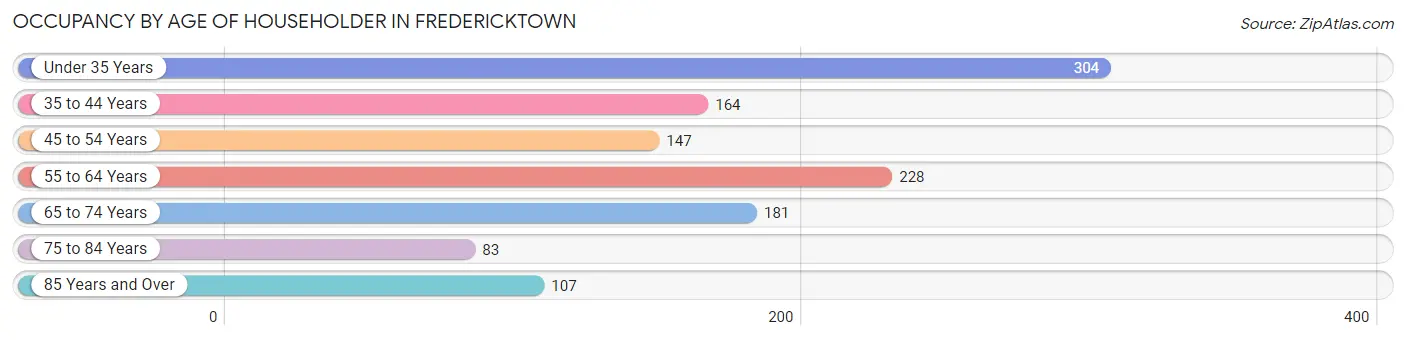
| Age Bracket | # Households | % Households |
| Under 35 Years | 304 | 25.0% |
| 35 to 44 Years | 164 | 13.5% |
| 45 to 54 Years | 147 | 12.1% |
| 55 to 64 Years | 228 | 18.8% |
| 65 to 74 Years | 181 | 14.9% |
| 75 to 84 Years | 83 | 6.8% |
| 85 Years and Over | 107 | 8.8% |
| Total | 1,214 | 100.0% |
Housing Finances in Fredericktown
Median Income by Occupancy in Fredericktown
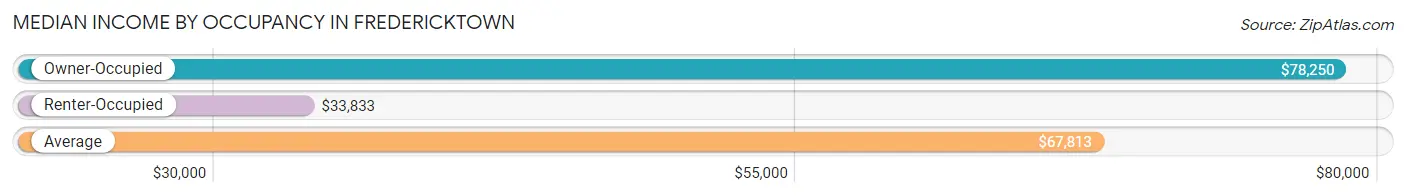
| Occupancy Type | # Households | Median Income |
| Owner-Occupied | 934 (76.9%) | $78,250 |
| Renter-Occupied | 280 (23.1%) | $33,833 |
| Average | 1,214 (100.0%) | $67,813 |
Occupancy by Householder Income Bracket in Fredericktown
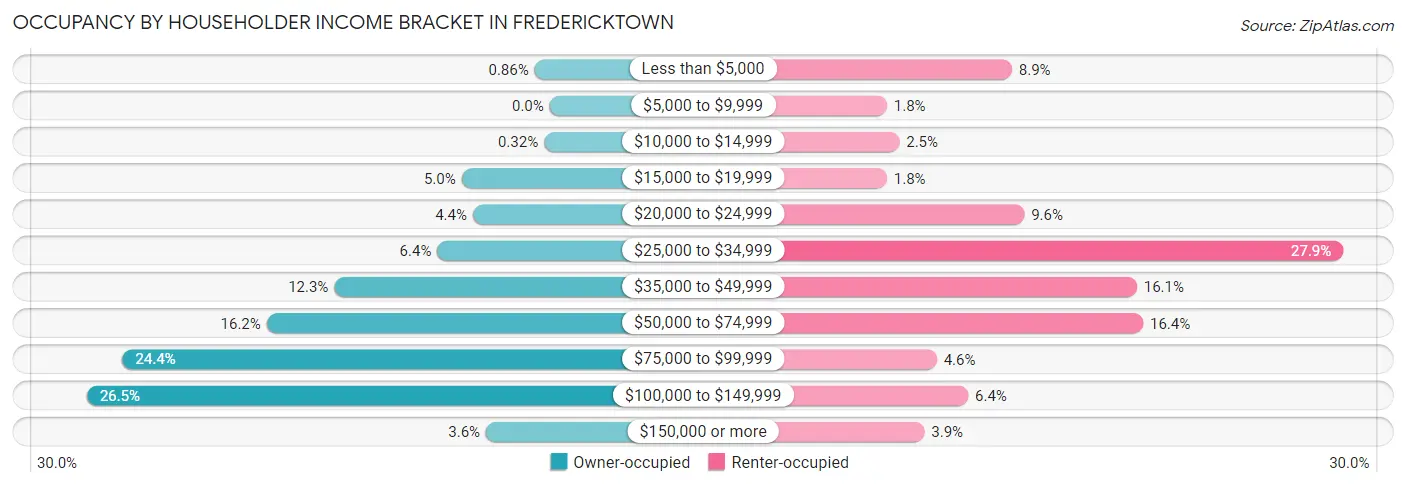
| Income Bracket | Owner-occupied | Renter-occupied |
| Less than $5,000 | 8 (0.9%) | 25 (8.9%) |
| $5,000 to $9,999 | 0 (0.0%) | 5 (1.8%) |
| $10,000 to $14,999 | 3 (0.3%) | 7 (2.5%) |
| $15,000 to $19,999 | 47 (5.0%) | 5 (1.8%) |
| $20,000 to $24,999 | 41 (4.4%) | 27 (9.6%) |
| $25,000 to $34,999 | 60 (6.4%) | 78 (27.9%) |
| $35,000 to $49,999 | 115 (12.3%) | 45 (16.1%) |
| $50,000 to $74,999 | 151 (16.2%) | 46 (16.4%) |
| $75,000 to $99,999 | 228 (24.4%) | 13 (4.6%) |
| $100,000 to $149,999 | 247 (26.5%) | 18 (6.4%) |
| $150,000 or more | 34 (3.6%) | 11 (3.9%) |
| Total | 934 (100.0%) | 280 (100.0%) |
Monthly Housing Cost Tiers in Fredericktown
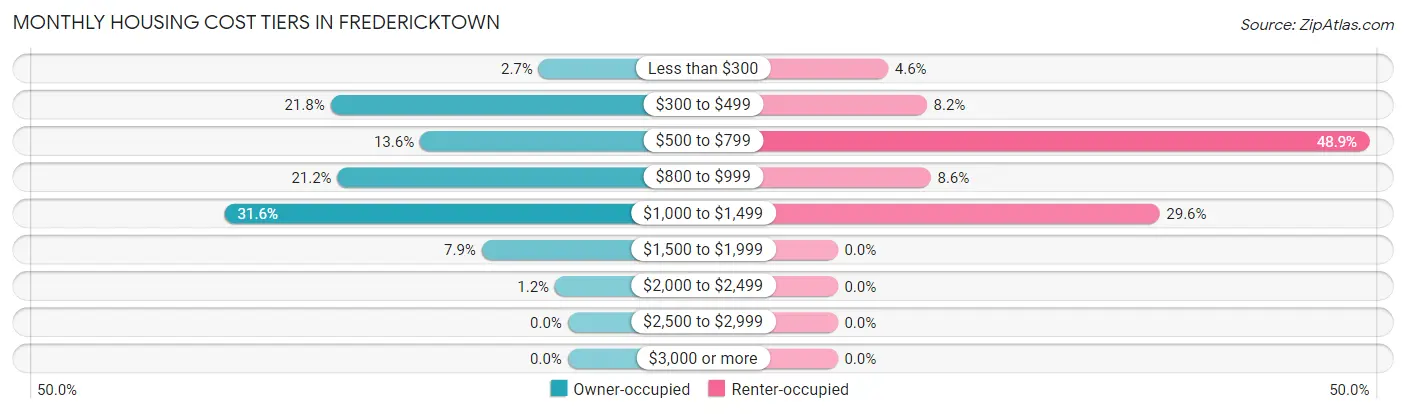
| Monthly Cost | Owner-occupied | Renter-occupied |
| Less than $300 | 25 (2.7%) | 13 (4.6%) |
| $300 to $499 | 204 (21.8%) | 23 (8.2%) |
| $500 to $799 | 127 (13.6%) | 137 (48.9%) |
| $800 to $999 | 198 (21.2%) | 24 (8.6%) |
| $1,000 to $1,499 | 295 (31.6%) | 83 (29.6%) |
| $1,500 to $1,999 | 74 (7.9%) | 0 (0.0%) |
| $2,000 to $2,499 | 11 (1.2%) | 0 (0.0%) |
| $2,500 to $2,999 | 0 (0.0%) | 0 (0.0%) |
| $3,000 or more | 0 (0.0%) | 0 (0.0%) |
| Total | 934 (100.0%) | 280 (100.0%) |
Physical Housing Characteristics in Fredericktown
Housing Structures in Fredericktown
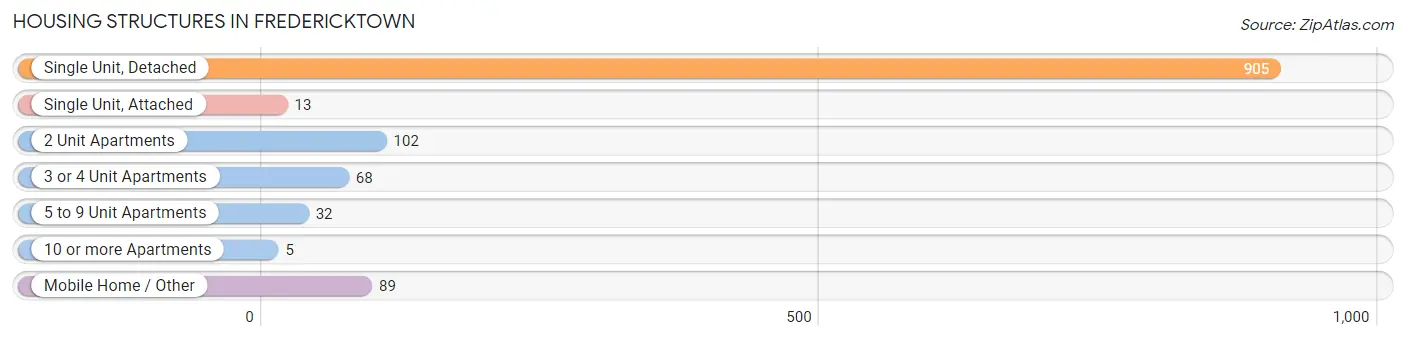
| Structure Type | # Housing Units | % Housing Units |
| Single Unit, Detached | 905 | 74.6% |
| Single Unit, Attached | 13 | 1.1% |
| 2 Unit Apartments | 102 | 8.4% |
| 3 or 4 Unit Apartments | 68 | 5.6% |
| 5 to 9 Unit Apartments | 32 | 2.6% |
| 10 or more Apartments | 5 | 0.4% |
| Mobile Home / Other | 89 | 7.3% |
| Total | 1,214 | 100.0% |
Housing Structures by Occupancy in Fredericktown
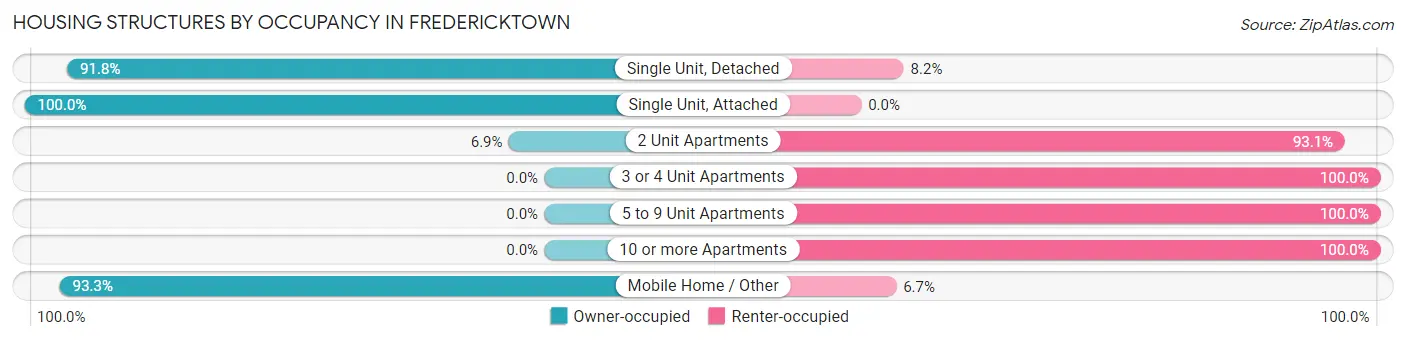
| Structure Type | Owner-occupied | Renter-occupied |
| Single Unit, Detached | 831 (91.8%) | 74 (8.2%) |
| Single Unit, Attached | 13 (100.0%) | 0 (0.0%) |
| 2 Unit Apartments | 7 (6.9%) | 95 (93.1%) |
| 3 or 4 Unit Apartments | 0 (0.0%) | 68 (100.0%) |
| 5 to 9 Unit Apartments | 0 (0.0%) | 32 (100.0%) |
| 10 or more Apartments | 0 (0.0%) | 5 (100.0%) |
| Mobile Home / Other | 83 (93.3%) | 6 (6.7%) |
| Total | 934 (76.9%) | 280 (23.1%) |
Housing Structures by Number of Rooms in Fredericktown
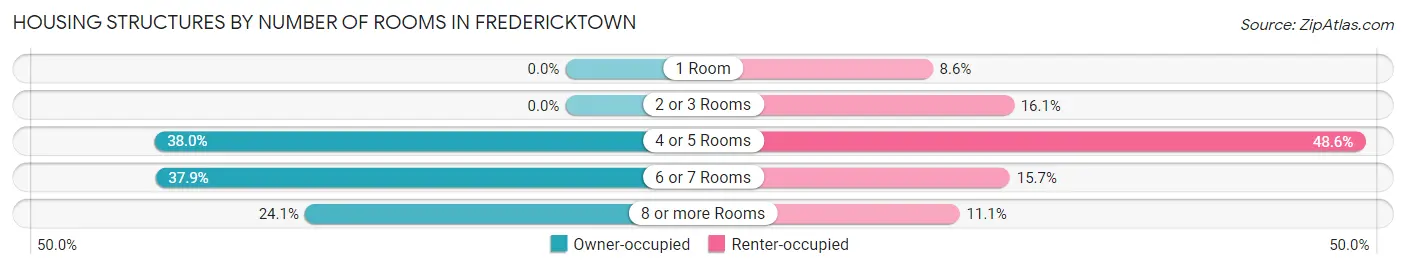
| Number of Rooms | Owner-occupied | Renter-occupied |
| 1 Room | 0 (0.0%) | 24 (8.6%) |
| 2 or 3 Rooms | 0 (0.0%) | 45 (16.1%) |
| 4 or 5 Rooms | 355 (38.0%) | 136 (48.6%) |
| 6 or 7 Rooms | 354 (37.9%) | 44 (15.7%) |
| 8 or more Rooms | 225 (24.1%) | 31 (11.1%) |
| Total | 934 (100.0%) | 280 (100.0%) |
Housing Structure by Heating Type in Fredericktown
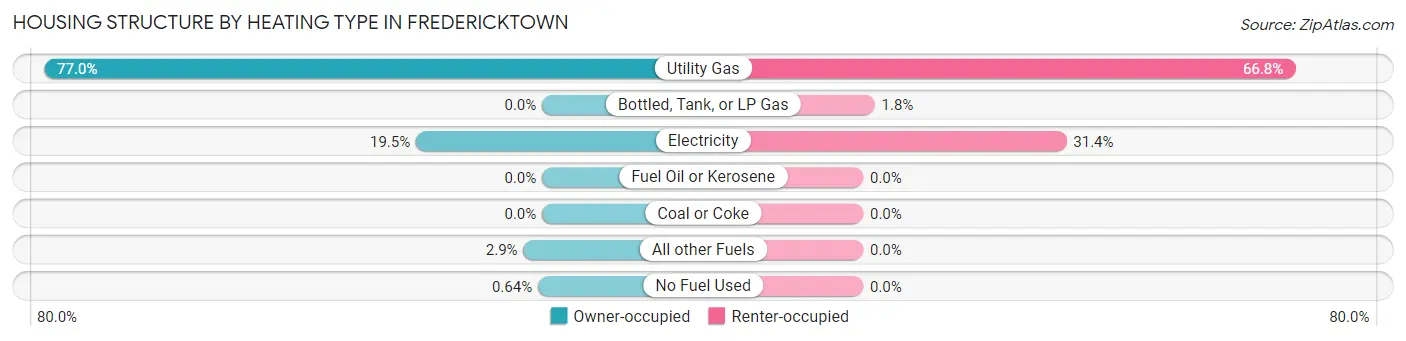
| Heating Type | Owner-occupied | Renter-occupied |
| Utility Gas | 719 (77.0%) | 187 (66.8%) |
| Bottled, Tank, or LP Gas | 0 (0.0%) | 5 (1.8%) |
| Electricity | 182 (19.5%) | 88 (31.4%) |
| Fuel Oil or Kerosene | 0 (0.0%) | 0 (0.0%) |
| Coal or Coke | 0 (0.0%) | 0 (0.0%) |
| All other Fuels | 27 (2.9%) | 0 (0.0%) |
| No Fuel Used | 6 (0.6%) | 0 (0.0%) |
| Total | 934 (100.0%) | 280 (100.0%) |
Household Vehicle Usage in Fredericktown
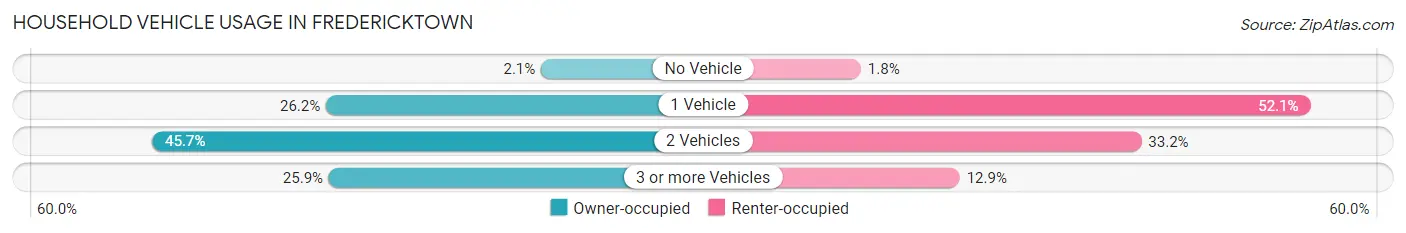
| Vehicles per Household | Owner-occupied | Renter-occupied |
| No Vehicle | 20 (2.1%) | 5 (1.8%) |
| 1 Vehicle | 245 (26.2%) | 146 (52.1%) |
| 2 Vehicles | 427 (45.7%) | 93 (33.2%) |
| 3 or more Vehicles | 242 (25.9%) | 36 (12.9%) |
| Total | 934 (100.0%) | 280 (100.0%) |
Real Estate & Mortgages in Fredericktown
Real Estate and Mortgage Overview in Fredericktown
| Characteristic | Without Mortgage | With Mortgage |
| Housing Units | 392 | 542 |
| Median Property Value | $150,000 | $145,700 |
| Median Household Income | $50,227 | $15 |
| Monthly Housing Costs | $471 | $0 |
| Real Estate Taxes | $1,510 | $6 |
Property Value by Mortgage Status in Fredericktown
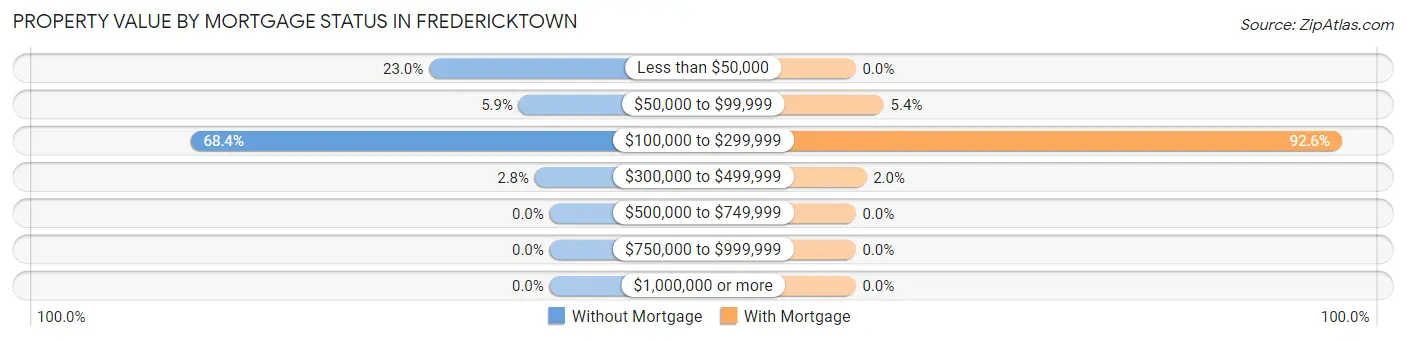
| Property Value | Without Mortgage | With Mortgage |
| Less than $50,000 | 90 (23.0%) | 0 (0.0%) |
| $50,000 to $99,999 | 23 (5.9%) | 29 (5.3%) |
| $100,000 to $299,999 | 268 (68.4%) | 502 (92.6%) |
| $300,000 to $499,999 | 11 (2.8%) | 11 (2.0%) |
| $500,000 to $749,999 | 0 (0.0%) | 0 (0.0%) |
| $750,000 to $999,999 | 0 (0.0%) | 0 (0.0%) |
| $1,000,000 or more | 0 (0.0%) | 0 (0.0%) |
| Total | 392 (100.0%) | 542 (100.0%) |
Household Income by Mortgage Status in Fredericktown
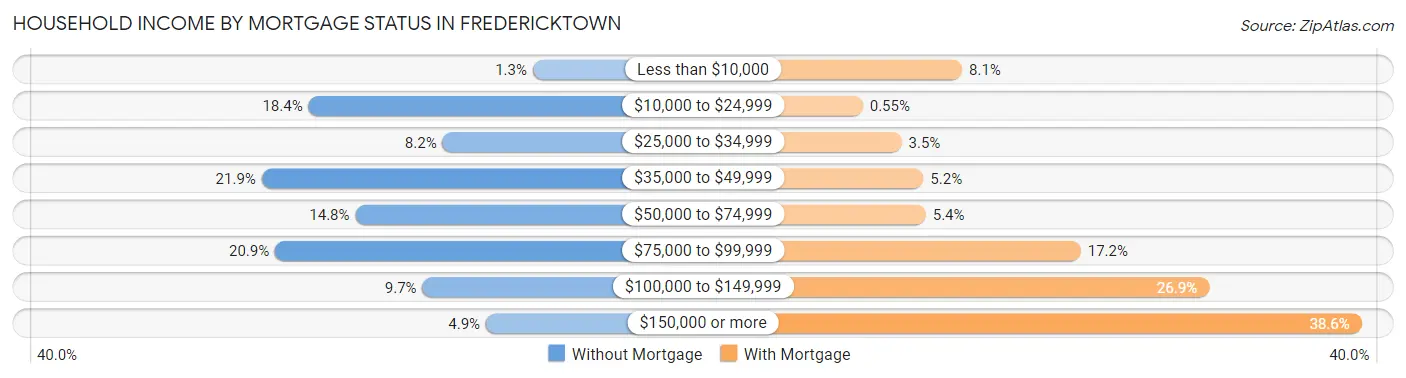
| Household Income | Without Mortgage | With Mortgage |
| Less than $10,000 | 5 (1.3%) | 44 (8.1%) |
| $10,000 to $24,999 | 72 (18.4%) | 3 (0.5%) |
| $25,000 to $34,999 | 32 (8.2%) | 19 (3.5%) |
| $35,000 to $49,999 | 86 (21.9%) | 28 (5.2%) |
| $50,000 to $74,999 | 58 (14.8%) | 29 (5.3%) |
| $75,000 to $99,999 | 82 (20.9%) | 93 (17.2%) |
| $100,000 to $149,999 | 38 (9.7%) | 146 (26.9%) |
| $150,000 or more | 19 (4.9%) | 209 (38.6%) |
| Total | 392 (100.0%) | 542 (100.0%) |
Property Value to Household Income Ratio in Fredericktown
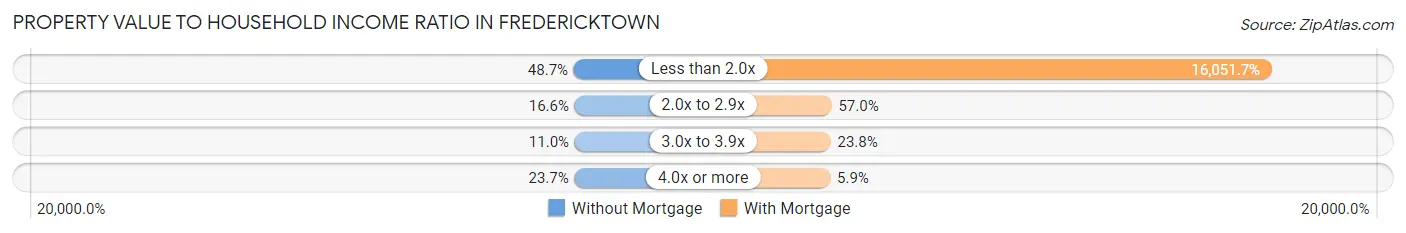
| Value-to-Income Ratio | Without Mortgage | With Mortgage |
| Less than 2.0x | 191 (48.7%) | 87,000 (16,051.7%) |
| 2.0x to 2.9x | 65 (16.6%) | 309 (57.0%) |
| 3.0x to 3.9x | 43 (11.0%) | 129 (23.8%) |
| 4.0x or more | 93 (23.7%) | 32 (5.9%) |
| Total | 392 (100.0%) | 542 (100.0%) |
Real Estate Taxes by Mortgage Status in Fredericktown
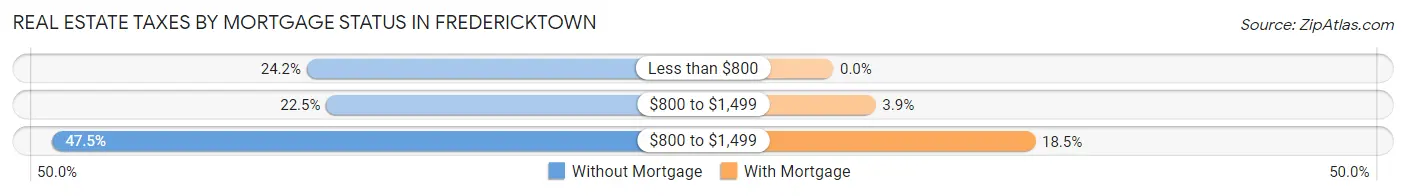
| Property Taxes | Without Mortgage | With Mortgage |
| Less than $800 | 95 (24.2%) | 0 (0.0%) |
| $800 to $1,499 | 88 (22.5%) | 21 (3.9%) |
| $800 to $1,499 | 186 (47.4%) | 100 (18.4%) |
| Total | 392 (100.0%) | 542 (100.0%) |
Health & Disability in Fredericktown
Health Insurance Coverage by Age in Fredericktown
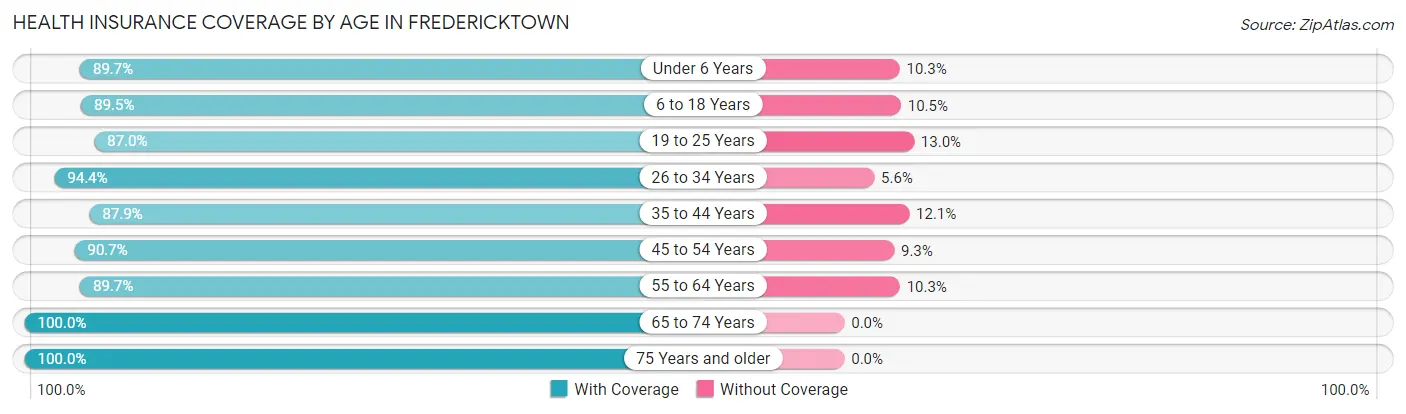
| Age Bracket | With Coverage | Without Coverage |
| Under 6 Years | 148 (89.7%) | 17 (10.3%) |
| 6 to 18 Years | 323 (89.5%) | 38 (10.5%) |
| 19 to 25 Years | 315 (87.0%) | 47 (13.0%) |
| 26 to 34 Years | 238 (94.4%) | 14 (5.6%) |
| 35 to 44 Years | 269 (87.9%) | 37 (12.1%) |
| 45 to 54 Years | 225 (90.7%) | 23 (9.3%) |
| 55 to 64 Years | 408 (89.7%) | 47 (10.3%) |
| 65 to 74 Years | 253 (100.0%) | 0 (0.0%) |
| 75 Years and older | 234 (100.0%) | 0 (0.0%) |
| Total | 2,413 (91.5%) | 223 (8.5%) |
Health Insurance Coverage by Citizenship Status in Fredericktown
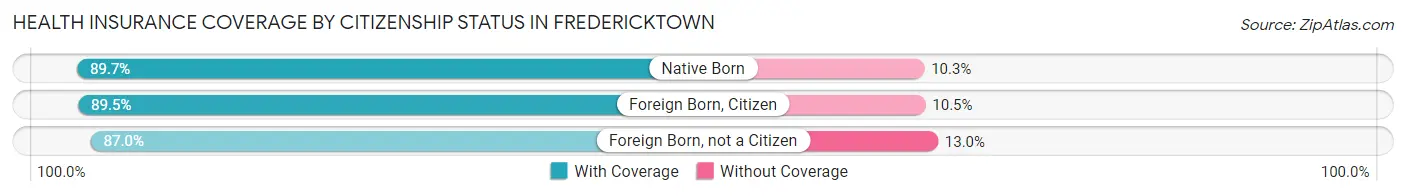
| Citizenship Status | With Coverage | Without Coverage |
| Native Born | 148 (89.7%) | 17 (10.3%) |
| Foreign Born, Citizen | 323 (89.5%) | 38 (10.5%) |
| Foreign Born, not a Citizen | 315 (87.0%) | 47 (13.0%) |
Health Insurance Coverage by Household Income in Fredericktown
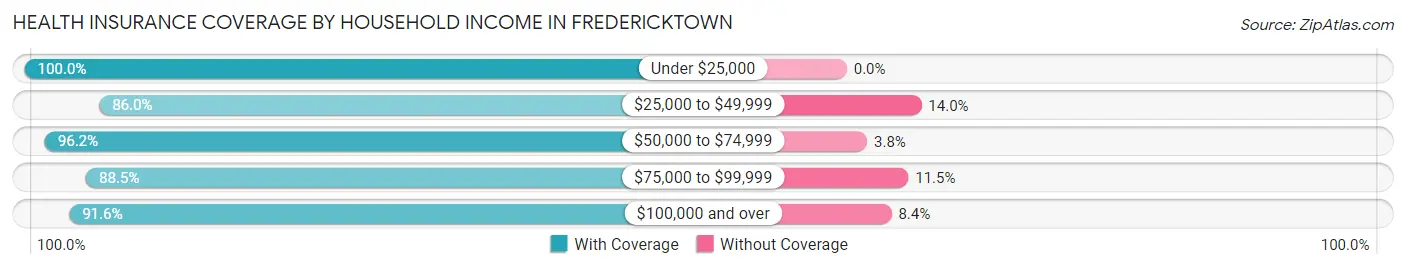
| Household Income | With Coverage | Without Coverage |
| Under $25,000 | 292 (100.0%) | 0 (0.0%) |
| $25,000 to $49,999 | 443 (86.0%) | 72 (14.0%) |
| $50,000 to $74,999 | 456 (96.2%) | 18 (3.8%) |
| $75,000 to $99,999 | 537 (88.5%) | 70 (11.5%) |
| $100,000 and over | 679 (91.6%) | 62 (8.4%) |
Public vs Private Health Insurance Coverage by Age in Fredericktown
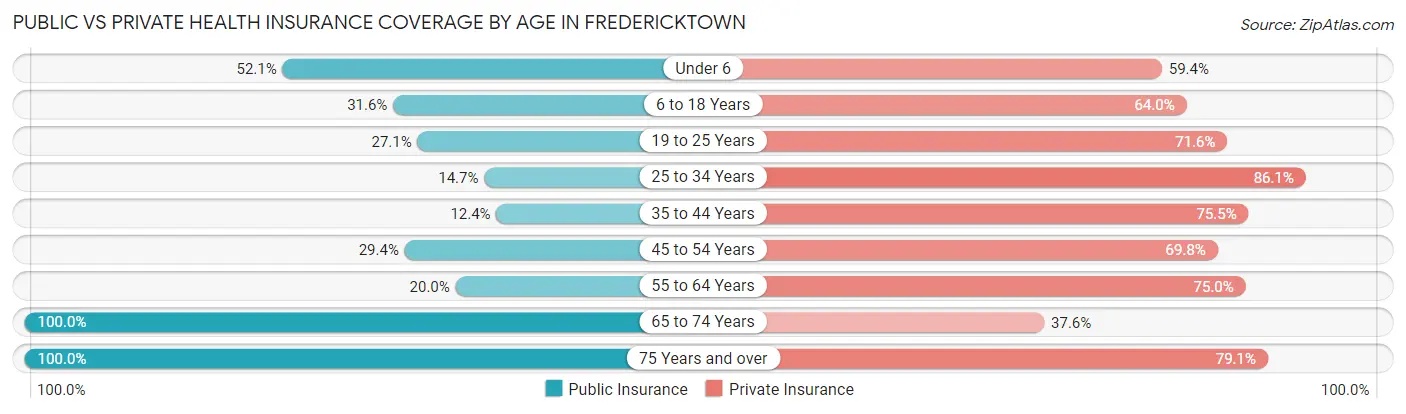
| Age Bracket | Public Insurance | Private Insurance |
| Under 6 | 86 (52.1%) | 98 (59.4%) |
| 6 to 18 Years | 114 (31.6%) | 231 (64.0%) |
| 19 to 25 Years | 98 (27.1%) | 259 (71.6%) |
| 25 to 34 Years | 37 (14.7%) | 217 (86.1%) |
| 35 to 44 Years | 38 (12.4%) | 231 (75.5%) |
| 45 to 54 Years | 73 (29.4%) | 173 (69.8%) |
| 55 to 64 Years | 91 (20.0%) | 341 (75.0%) |
| 65 to 74 Years | 253 (100.0%) | 95 (37.6%) |
| 75 Years and over | 234 (100.0%) | 185 (79.1%) |
| Total | 1,024 (38.9%) | 1,830 (69.4%) |
Disability Status by Sex by Age in Fredericktown
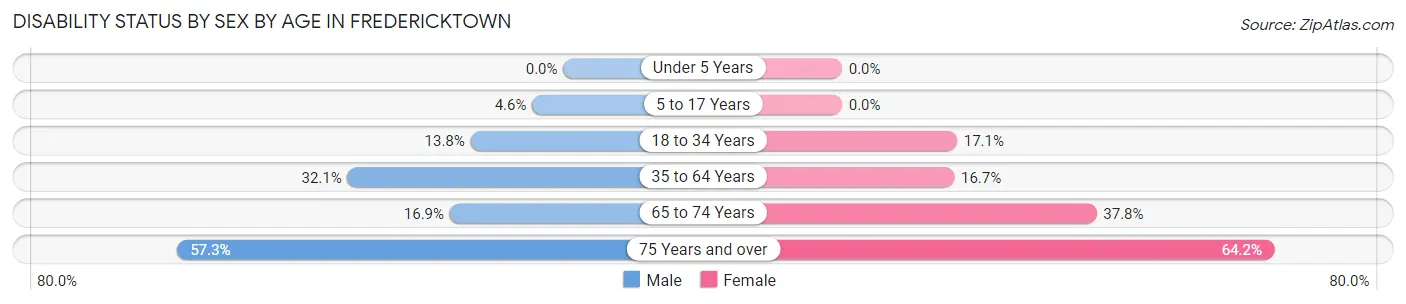
| Age Bracket | Male | Female |
| Under 5 Years | 0 (0.0%) | 0 (0.0%) |
| 5 to 17 Years | 7 (4.6%) | 0 (0.0%) |
| 18 to 34 Years | 42 (13.8%) | 55 (17.1%) |
| 35 to 64 Years | 158 (32.1%) | 86 (16.7%) |
| 65 to 74 Years | 15 (16.9%) | 62 (37.8%) |
| 75 Years and over | 43 (57.3%) | 102 (64.1%) |
Disability Class by Sex by Age in Fredericktown
Disability Class: Hearing Difficulty
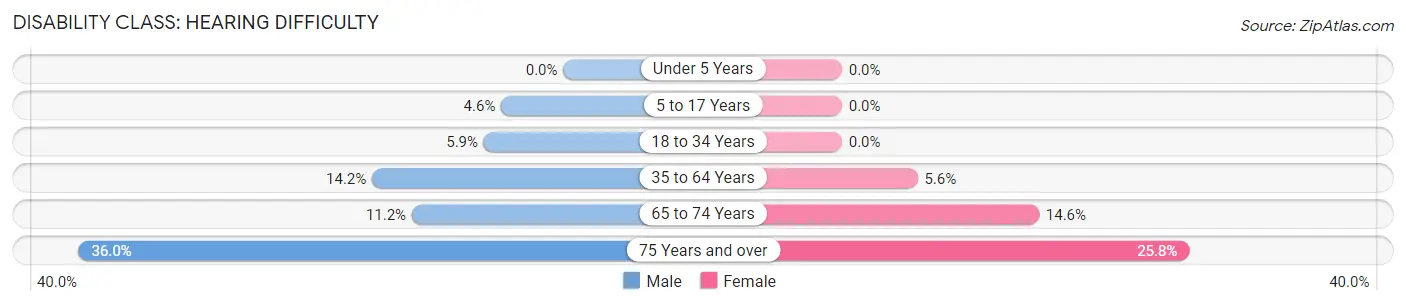
| Age Bracket | Male | Female |
| Under 5 Years | 0 (0.0%) | 0 (0.0%) |
| 5 to 17 Years | 7 (4.6%) | 0 (0.0%) |
| 18 to 34 Years | 18 (5.9%) | 0 (0.0%) |
| 35 to 64 Years | 70 (14.2%) | 29 (5.6%) |
| 65 to 74 Years | 10 (11.2%) | 24 (14.6%) |
| 75 Years and over | 27 (36.0%) | 41 (25.8%) |
Disability Class: Vision Difficulty
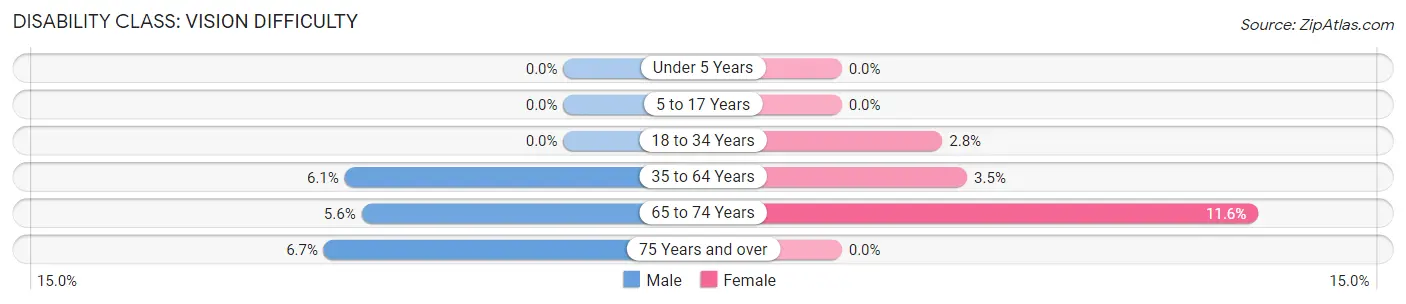
| Age Bracket | Male | Female |
| Under 5 Years | 0 (0.0%) | 0 (0.0%) |
| 5 to 17 Years | 0 (0.0%) | 0 (0.0%) |
| 18 to 34 Years | 0 (0.0%) | 9 (2.8%) |
| 35 to 64 Years | 30 (6.1%) | 18 (3.5%) |
| 65 to 74 Years | 5 (5.6%) | 19 (11.6%) |
| 75 Years and over | 5 (6.7%) | 0 (0.0%) |
Disability Class: Cognitive Difficulty
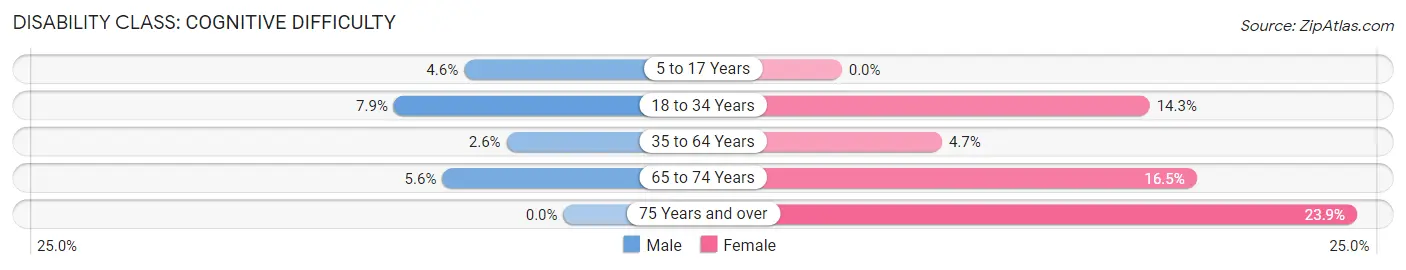
| Age Bracket | Male | Female |
| 5 to 17 Years | 7 (4.6%) | 0 (0.0%) |
| 18 to 34 Years | 24 (7.9%) | 46 (14.3%) |
| 35 to 64 Years | 13 (2.6%) | 24 (4.6%) |
| 65 to 74 Years | 5 (5.6%) | 27 (16.5%) |
| 75 Years and over | 0 (0.0%) | 38 (23.9%) |
Disability Class: Ambulatory Difficulty
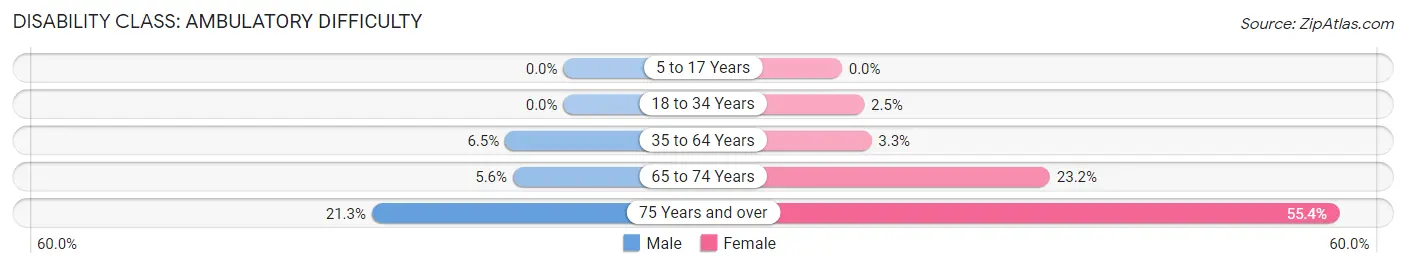
| Age Bracket | Male | Female |
| 5 to 17 Years | 0 (0.0%) | 0 (0.0%) |
| 18 to 34 Years | 0 (0.0%) | 8 (2.5%) |
| 35 to 64 Years | 32 (6.5%) | 17 (3.3%) |
| 65 to 74 Years | 5 (5.6%) | 38 (23.2%) |
| 75 Years and over | 16 (21.3%) | 88 (55.3%) |
Disability Class: Self-Care Difficulty
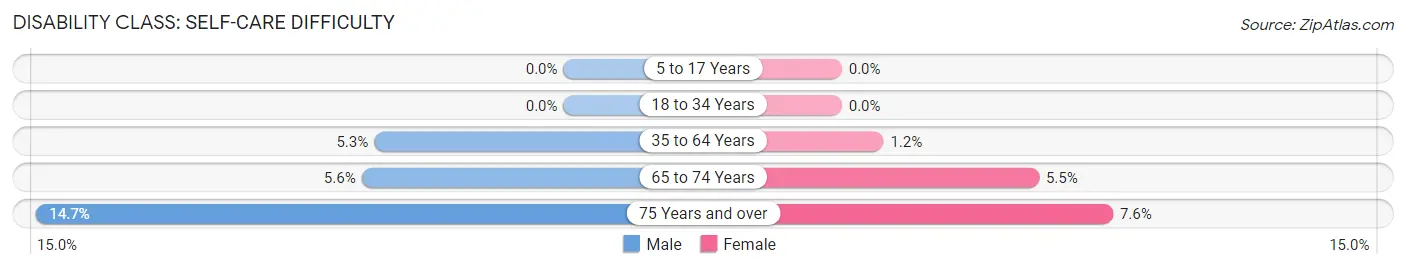
| Age Bracket | Male | Female |
| 5 to 17 Years | 0 (0.0%) | 0 (0.0%) |
| 18 to 34 Years | 0 (0.0%) | 0 (0.0%) |
| 35 to 64 Years | 26 (5.3%) | 6 (1.2%) |
| 65 to 74 Years | 5 (5.6%) | 9 (5.5%) |
| 75 Years and over | 11 (14.7%) | 12 (7.5%) |
Technology Access in Fredericktown
Computing Device Access in Fredericktown
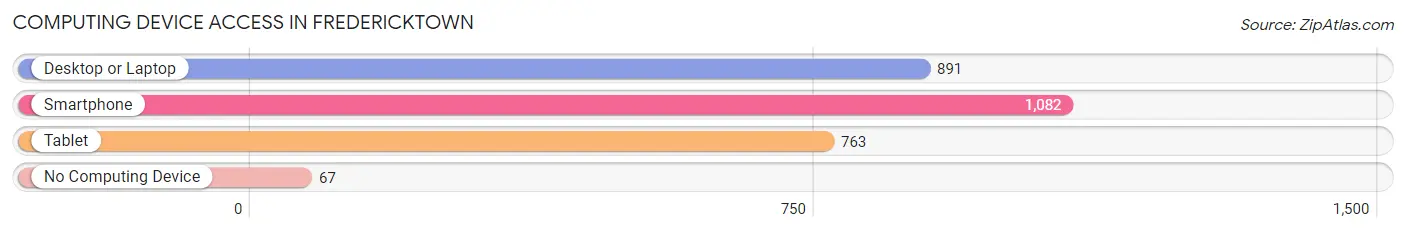
| Device Type | # Households | % Households |
| Desktop or Laptop | 891 | 73.4% |
| Smartphone | 1,082 | 89.1% |
| Tablet | 763 | 62.8% |
| No Computing Device | 67 | 5.5% |
| Total | 1,214 | 100.0% |
Internet Access in Fredericktown
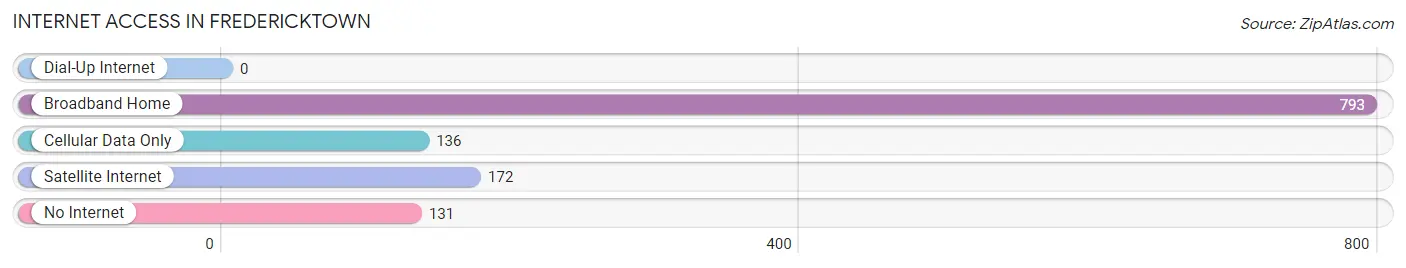
| Internet Type | # Households | % Households |
| Dial-Up Internet | 0 | 0.0% |
| Broadband Home | 793 | 65.3% |
| Cellular Data Only | 136 | 11.2% |
| Satellite Internet | 172 | 14.2% |
| No Internet | 131 | 10.8% |
| Total | 1,214 | 100.0% |
Fredericktown Summary
Fredericktown, Ohio is a small village located in Knox County, Ohio. It is situated in the foothills of the Appalachian Mountains, approximately 40 miles northeast of Columbus. The village has a population of approximately 2,500 people and is part of the Mount Vernon Micropolitan Statistical Area.
History
Fredericktown was founded in 1817 by a group of settlers from Fredericktown, Maryland. The village was named after the Maryland town, which was named after Frederick, Prince of Wales. The village was incorporated in 1837 and was the first village in Knox County to be incorporated.
The village was an important stop on the Underground Railroad, with many of the local residents helping to hide and transport escaped slaves. The village was also home to a number of prominent abolitionists, including John Rankin and the Reverend John Rankin Jr.
Geography
Fredericktown is located in the foothills of the Appalachian Mountains, approximately 40 miles northeast of Columbus. The village is situated on the banks of the Kokosing River, which flows through the village. The village is surrounded by rolling hills and farmland.
The village has a total area of 1.2 square miles, all of which is land. The village is located at an elevation of 1,068 feet above sea level.
Economy
The economy of Fredericktown is largely based on agriculture and manufacturing. The village is home to a number of small businesses, including a number of restaurants, retail stores, and service providers. The village is also home to a number of small manufacturing companies, including a number of furniture manufacturers.
The village is also home to a number of small farms, which produce a variety of crops, including corn, soybeans, and wheat. The village is also home to a number of wineries, which produce a variety of wines.
Demographics
As of the 2010 census, the village had a population of 2,500 people. The racial makeup of the village was 97.2% White, 0.8% African American, 0.4% Native American, 0.4% Asian, and 0.8% from other races. Hispanic or Latino of any race were 1.2% of the population.
The median household income in the village was $41,250, and the median family income was $50,000. The per capita income in the village was $20,000. About 10.2% of families and 12.2% of the population were below the poverty line, including 16.2% of those under age 18 and 8.2% of those age 65 or over.
Common Questions
What is Per Capita Income in Fredericktown?
Per Capita income in Fredericktown is $31,626.
What is the Median Family Income in Fredericktown?
Median Family Income in Fredericktown is $79,591.
What is the Median Household income in Fredericktown?
Median Household Income in Fredericktown is $67,813.
What is Income or Wage Gap in Fredericktown?
Income or Wage Gap in Fredericktown is 19.6%.
Women in Fredericktown earn 80.4 cents for every dollar earned by a man.
What is Inequality or Gini Index in Fredericktown?
Inequality or Gini Index in Fredericktown is 0.32.
What is the Total Population of Fredericktown?
Total Population of Fredericktown is 2,642.
What is the Total Male Population of Fredericktown?
Total Male Population of Fredericktown is 1,206.
What is the Total Female Population of Fredericktown?
Total Female Population of Fredericktown is 1,436.
What is the Ratio of Males per 100 Females in Fredericktown?
There are 83.98 Males per 100 Females in Fredericktown.
What is the Ratio of Females per 100 Males in Fredericktown?
There are 119.07 Females per 100 Males in Fredericktown.
What is the Median Population Age in Fredericktown?
Median Population Age in Fredericktown is 41.3 Years.
What is the Average Family Size in Fredericktown
Average Family Size in Fredericktown is 2.5 People.
What is the Average Household Size in Fredericktown
Average Household Size in Fredericktown is 2.2 People.
How Large is the Labor Force in Fredericktown?
There are 1,391 People in the Labor Forcein in Fredericktown.
What is the Percentage of People in the Labor Force in Fredericktown?
63.7% of People are in the Labor Force in Fredericktown.
What is the Unemployment Rate in Fredericktown?
Unemployment Rate in Fredericktown is 3.2%.