Zip Codes with the Highest Percentage of Population Employed in Health Care & Social Assistance in Bowling Green, OH
RELATED REPORTS & OPTIONS
Health Care & Social Assistance
Bowling Green
Compare Zip Codes
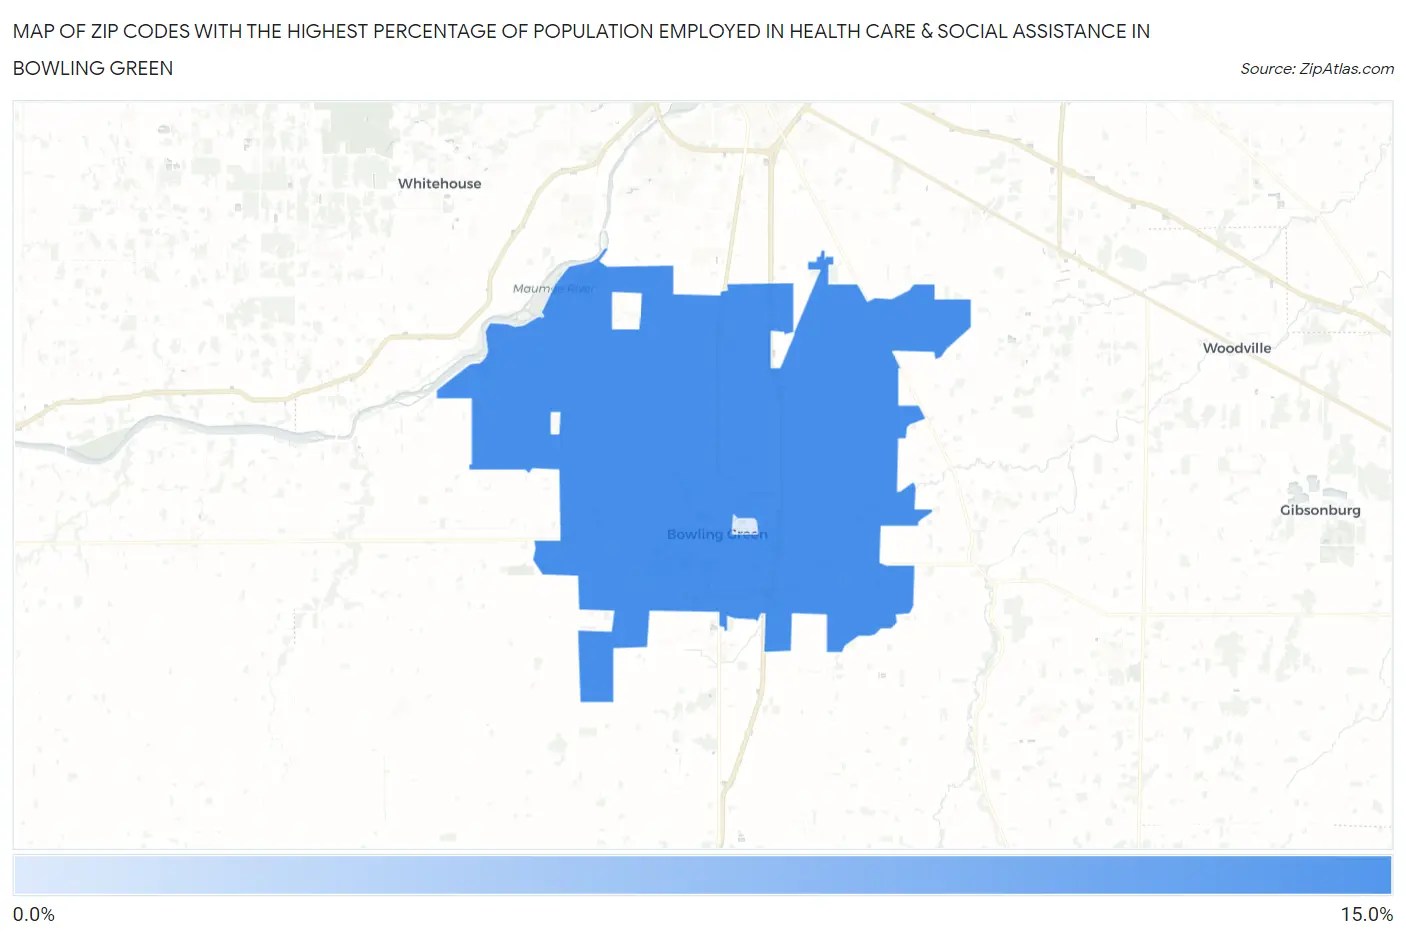
Map of Zip Codes with the Highest Percentage of Population Employed in Health Care & Social Assistance in Bowling Green
4.0%
12.4%
Zip Codes with the Highest Percentage of Population Employed in Health Care & Social Assistance in Bowling Green, OH
| Zip Code | % Employed | vs State | vs National | |
| 1. | 43402 | 12.4% | 15.7%(-3.30)#811 | 13.9%(-1.56)#18,171 |
| 2. | 43403 | 4.0% | 15.7%(-11.7)#1,138 | 13.9%(-9.97)#29,620 |
1
Common Questions
What are the Top Zip Codes with the Highest Percentage of Population Employed in Health Care & Social Assistance in Bowling Green, OH?
Top Zip Codes with the Highest Percentage of Population Employed in Health Care & Social Assistance in Bowling Green, OH are:
What zip code has the Highest Percentage of Population Employed in Health Care & Social Assistance in Bowling Green, OH?
43402 has the Highest Percentage of Population Employed in Health Care & Social Assistance in Bowling Green, OH with 12.4%.
What is the Percentage of Population Employed in Health Care & Social Assistance in Bowling Green, OH?
Percentage of Population Employed in Health Care & Social Assistance in Bowling Green is 11.6%.
What is the Percentage of Population Employed in Health Care & Social Assistance in Ohio?
Percentage of Population Employed in Health Care & Social Assistance in Ohio is 15.7%.
What is the Percentage of Population Employed in Health Care & Social Assistance in the United States?
Percentage of Population Employed in Health Care & Social Assistance in the United States is 13.9%.