Williston, OH Map & Demographics
Williston Map
Williston Overview
$26,552
PER CAPITA INCOME
$90,769
AVG FAMILY INCOME
$61,971
AVG HOUSEHOLD INCOME
41.3%
WAGE / INCOME GAP [ % ]
58.7¢/ $1
WAGE / INCOME GAP [ $ ]
0.26
INEQUALITY / GINI INDEX
356
TOTAL POPULATION
178
MALE POPULATION
178
FEMALE POPULATION
100.00
MALES / 100 FEMALES
100.00
FEMALES / 100 MALES
63.4
MEDIAN AGE
2.9
AVG FAMILY SIZE
2.3
AVG HOUSEHOLD SIZE
92
LABOR FORCE [ PEOPLE ]
30.8%
PERCENT IN LABOR FORCE
Williston Zip Codes
Williston Area Codes
Income in Williston
Income Overview in Williston
Per Capita Income in Williston is $26,552, while median incomes of families and households are $90,769 and $61,971 respectively.
| Characteristic | Number | Measure |
| Per Capita Income | 356 | $26,552 |
| Median Family Income | 76 | $90,769 |
| Mean Family Income | 76 | $80,255 |
| Median Household Income | 113 | $61,971 |
| Mean Household Income | 113 | $70,992 |
| Income Deficit | 76 | $0 |
| Wage / Income Gap (%) | 356 | 41.33% |
| Wage / Income Gap ($) | 356 | 58.67¢ per $1 |
| Gini / Inequality Index | 356 | 0.26 |
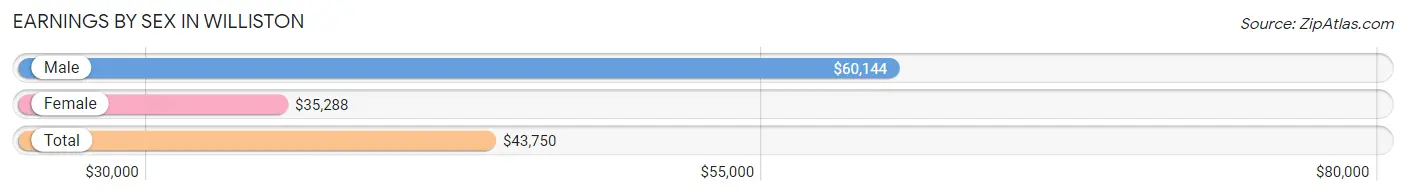
Earnings by Sex in Williston
Average Earnings in Williston are $43,750, $60,144 for men and $35,288 for women, a difference of 41.3%.
| Sex | Number | Average Earnings |
| Male | 67 (59.8%) | $60,144 |
| Female | 45 (40.2%) | $35,288 |
| Total | 112 (100.0%) | $43,750 |
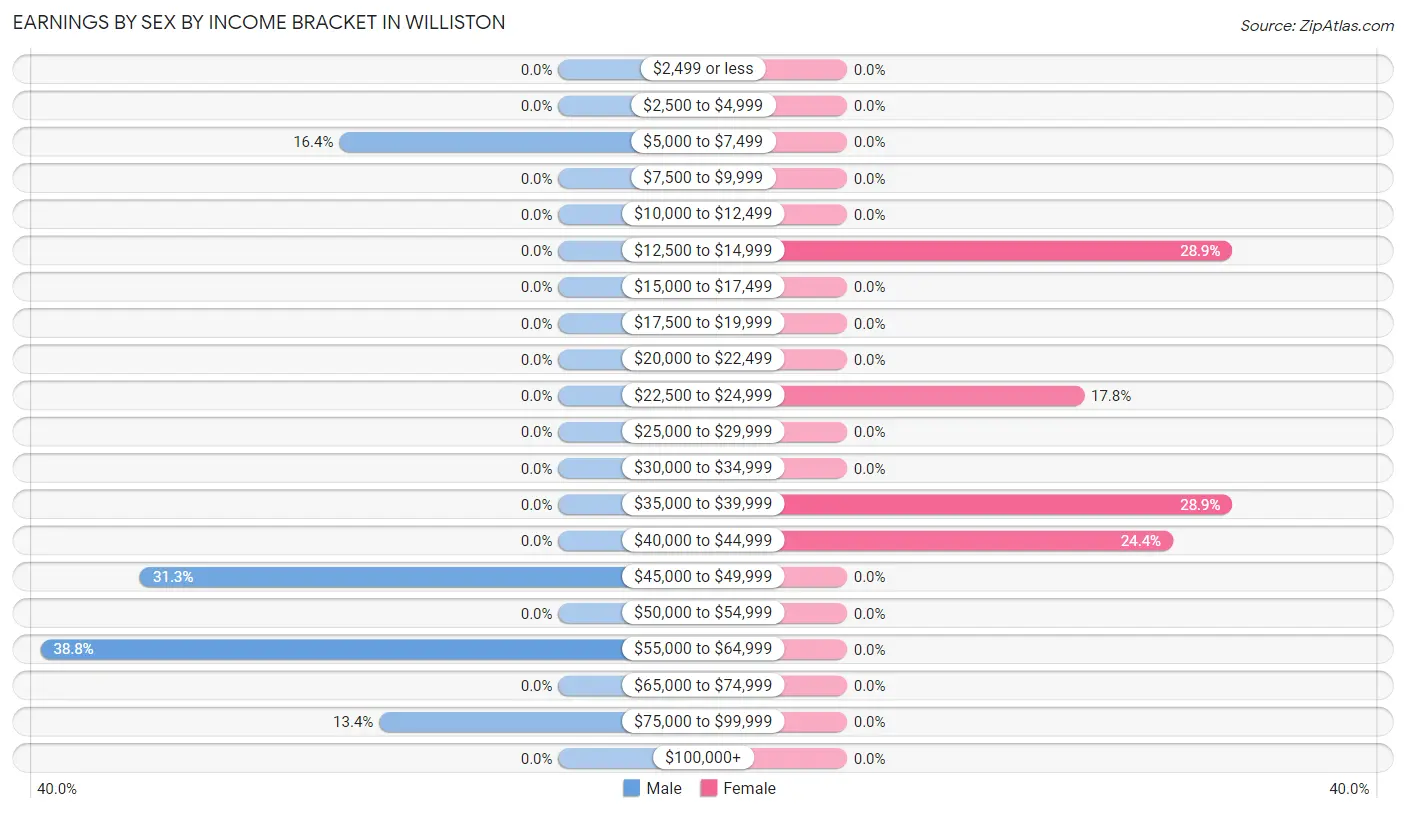
Earnings by Sex by Income Bracket in Williston
The most common earnings brackets in Williston are $55,000 to $64,999 for men (26 | 38.8%) and $12,500 to $14,999 for women (13 | 28.9%).
| Income | Male | Female |
| $2,499 or less | 0 (0.0%) | 0 (0.0%) |
| $2,500 to $4,999 | 0 (0.0%) | 0 (0.0%) |
| $5,000 to $7,499 | 11 (16.4%) | 0 (0.0%) |
| $7,500 to $9,999 | 0 (0.0%) | 0 (0.0%) |
| $10,000 to $12,499 | 0 (0.0%) | 0 (0.0%) |
| $12,500 to $14,999 | 0 (0.0%) | 13 (28.9%) |
| $15,000 to $17,499 | 0 (0.0%) | 0 (0.0%) |
| $17,500 to $19,999 | 0 (0.0%) | 0 (0.0%) |
| $20,000 to $22,499 | 0 (0.0%) | 0 (0.0%) |
| $22,500 to $24,999 | 0 (0.0%) | 8 (17.8%) |
| $25,000 to $29,999 | 0 (0.0%) | 0 (0.0%) |
| $30,000 to $34,999 | 0 (0.0%) | 0 (0.0%) |
| $35,000 to $39,999 | 0 (0.0%) | 13 (28.9%) |
| $40,000 to $44,999 | 0 (0.0%) | 11 (24.4%) |
| $45,000 to $49,999 | 21 (31.3%) | 0 (0.0%) |
| $50,000 to $54,999 | 0 (0.0%) | 0 (0.0%) |
| $55,000 to $64,999 | 26 (38.8%) | 0 (0.0%) |
| $65,000 to $74,999 | 0 (0.0%) | 0 (0.0%) |
| $75,000 to $99,999 | 9 (13.4%) | 0 (0.0%) |
| $100,000+ | 0 (0.0%) | 0 (0.0%) |
| Total | 67 (100.0%) | 45 (100.0%) |
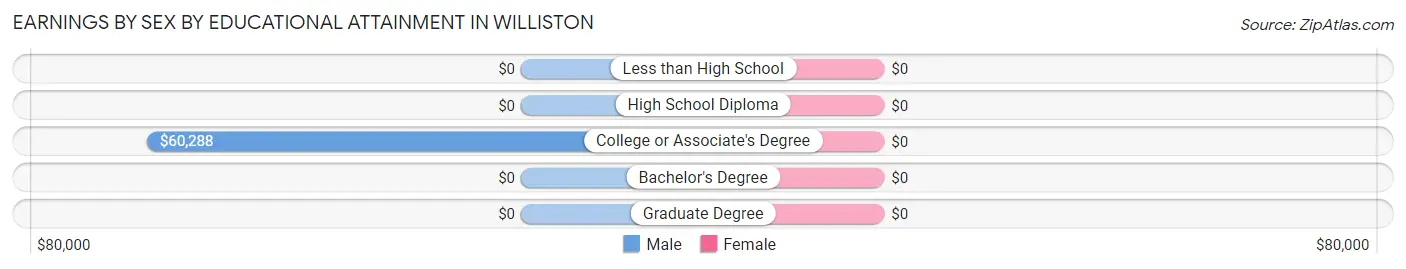
Earnings by Sex by Educational Attainment in Williston
| Educational Attainment | Male Income | Female Income |
| Less than High School | - | - |
| High School Diploma | - | - |
| College or Associate's Degree | $60,288 | $0 |
| Bachelor's Degree | - | - |
| Graduate Degree | - | - |
| Total | $60,144 | $35,288 |
Family Income in Williston
Family Income Brackets in Williston
According to the Williston family income data, there are 32 families falling into the $75,000 to $99,999 income range, which is the most common income bracket and makes up 42.1% of all families.
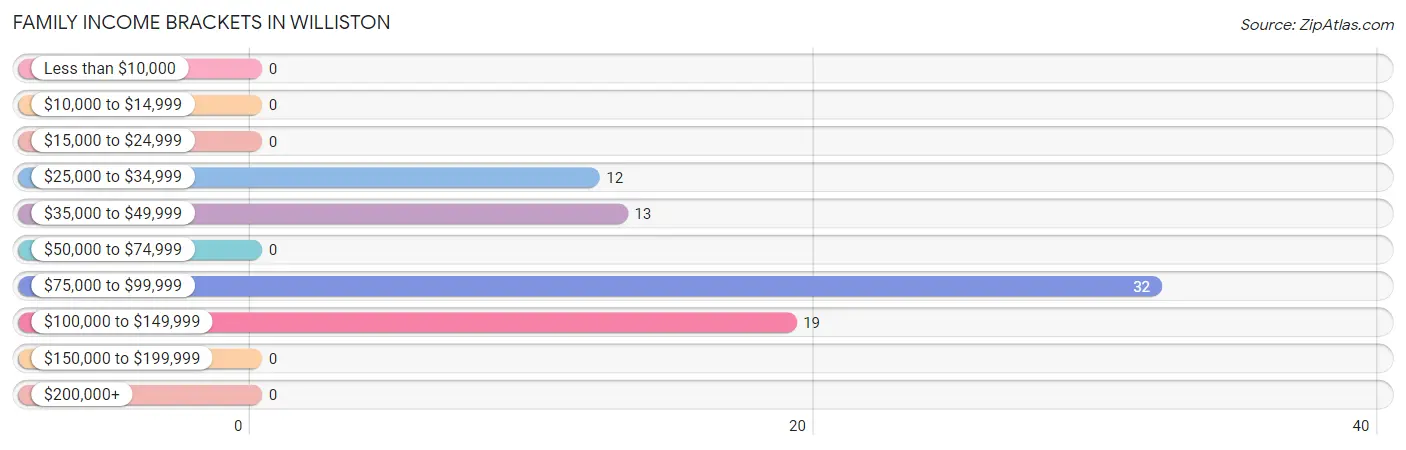
| Income Bracket | # Families | % Families |
| Less than $10,000 | 0 | 0.0% |
| $10,000 to $14,999 | 0 | 0.0% |
| $15,000 to $24,999 | 0 | 0.0% |
| $25,000 to $34,999 | 12 | 15.8% |
| $35,000 to $49,999 | 13 | 17.1% |
| $50,000 to $74,999 | 0 | 0.0% |
| $75,000 to $99,999 | 32 | 42.1% |
| $100,000 to $149,999 | 19 | 25.0% |
| $150,000 to $199,999 | 0 | 0.0% |
| $200,000+ | 0 | 0.0% |
Family Income by Famaliy Size in Williston
2-person families (45 | 59.2%) account for the highest median family income in Williston with $92,019 per family, while 2-person families (45 | 59.2%) have the highest median income of $46,010 per family member.
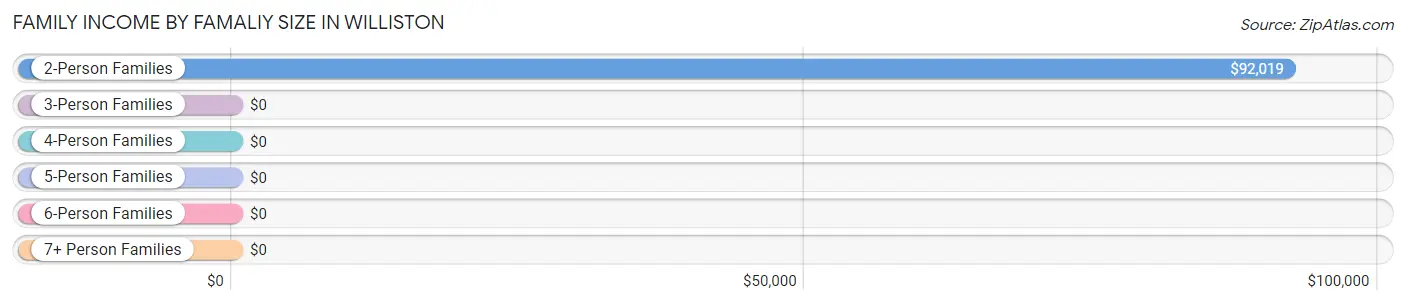
| Income Bracket | # Families | Median Income |
| 2-Person Families | 45 (59.2%) | $92,019 |
| 3-Person Families | 13 (17.1%) | $0 |
| 4-Person Families | 0 (0.0%) | $0 |
| 5-Person Families | 18 (23.7%) | $0 |
| 6-Person Families | 0 (0.0%) | $0 |
| 7+ Person Families | 0 (0.0%) | $0 |
| Total | 76 (100.0%) | $90,769 |
Family Income by Number of Earners in Williston
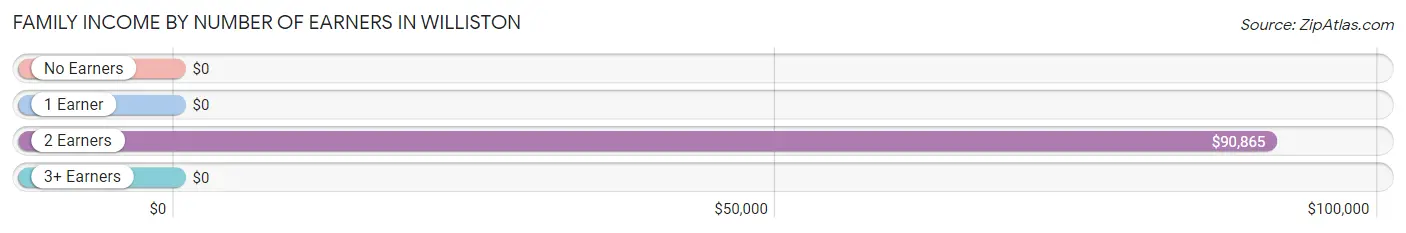
| Number of Earners | # Families | Median Income |
| No Earners | 22 (28.9%) | $0 |
| 1 Earner | 19 (25.0%) | $0 |
| 2 Earners | 35 (46.1%) | $90,865 |
| 3+ Earners | 0 (0.0%) | $0 |
| Total | 76 (100.0%) | $90,769 |
Household Income in Williston
Household Income Brackets in Williston
With 32 households falling in the category, the $75,000 to $99,999 income range is the most frequent in Williston, accounting for 28.3% of all households.
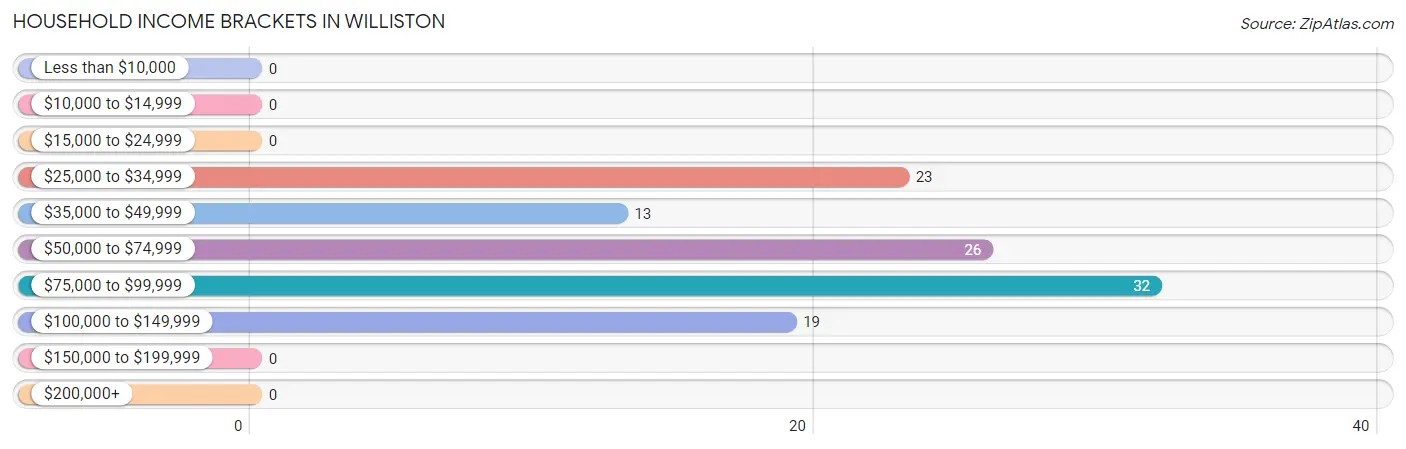
| Income Bracket | # Households | % Households |
| Less than $10,000 | 0 | 0.0% |
| $10,000 to $14,999 | 0 | 0.0% |
| $15,000 to $24,999 | 0 | 0.0% |
| $25,000 to $34,999 | 23 | 20.4% |
| $35,000 to $49,999 | 13 | 11.5% |
| $50,000 to $74,999 | 26 | 23.0% |
| $75,000 to $99,999 | 32 | 28.3% |
| $100,000 to $149,999 | 19 | 16.8% |
| $150,000 to $199,999 | 0 | 0.0% |
| $200,000+ | 0 | 0.0% |
Household Income by Householder Age in Williston
The median household income in Williston is $61,971, with the highest median household income of $61,058 found in the 45 to 64 years age bracket for the primary householder. A total of 48 households (42.5%) fall into this category.
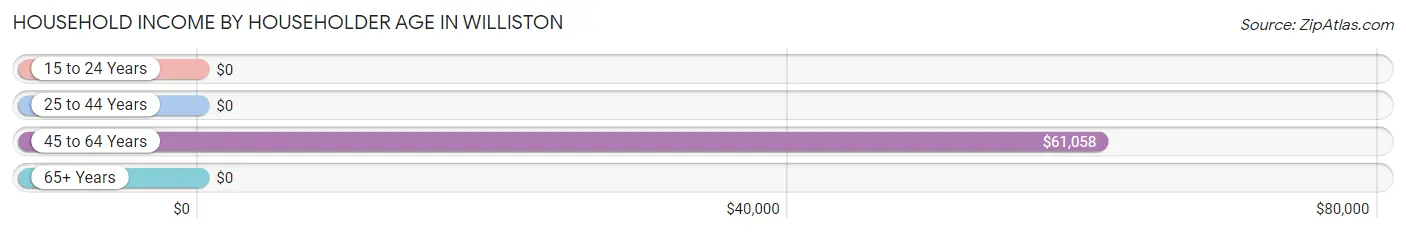
| Income Bracket | # Households | Median Income |
| 15 to 24 Years | 0 (0.0%) | $0 |
| 25 to 44 Years | 22 (19.5%) | $0 |
| 45 to 64 Years | 48 (42.5%) | $61,058 |
| 65+ Years | 43 (38.1%) | $0 |
| Total | 113 (100.0%) | $61,971 |
Poverty in Williston
Income Below Poverty by Sex and Age in Williston
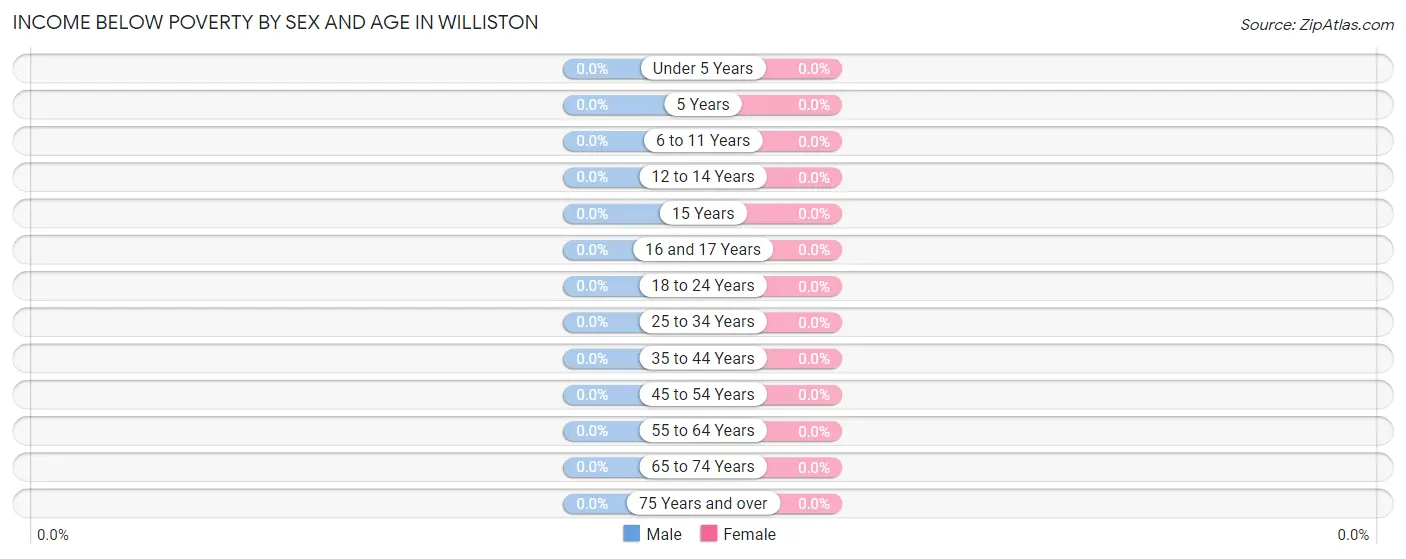
| Age Bracket | Male | Female |
| Under 5 Years | 0 (0.0%) | 0 (0.0%) |
| 5 Years | 0 (0.0%) | 0 (0.0%) |
| 6 to 11 Years | 0 (0.0%) | 0 (0.0%) |
| 12 to 14 Years | 0 (0.0%) | 0 (0.0%) |
| 15 Years | 0 (0.0%) | 0 (0.0%) |
| 16 and 17 Years | 0 (0.0%) | 0 (0.0%) |
| 18 to 24 Years | 0 (0.0%) | 0 (0.0%) |
| 25 to 34 Years | 0 (0.0%) | 0 (0.0%) |
| 35 to 44 Years | 0 (0.0%) | 0 (0.0%) |
| 45 to 54 Years | 0 (0.0%) | 0 (0.0%) |
| 55 to 64 Years | 0 (0.0%) | 0 (0.0%) |
| 65 to 74 Years | 0 (0.0%) | 0 (0.0%) |
| 75 Years and over | 0 (0.0%) | 0 (0.0%) |
| Total | 0 (0.0%) | 0 (0.0%) |
Income Above Poverty by Sex and Age in Williston
According to the poverty statistics in Williston, males aged under 5 years and females aged under 5 years are the age groups that are most secure financially, with 100.0% of males and 100.0% of females in these age groups living above the poverty line.
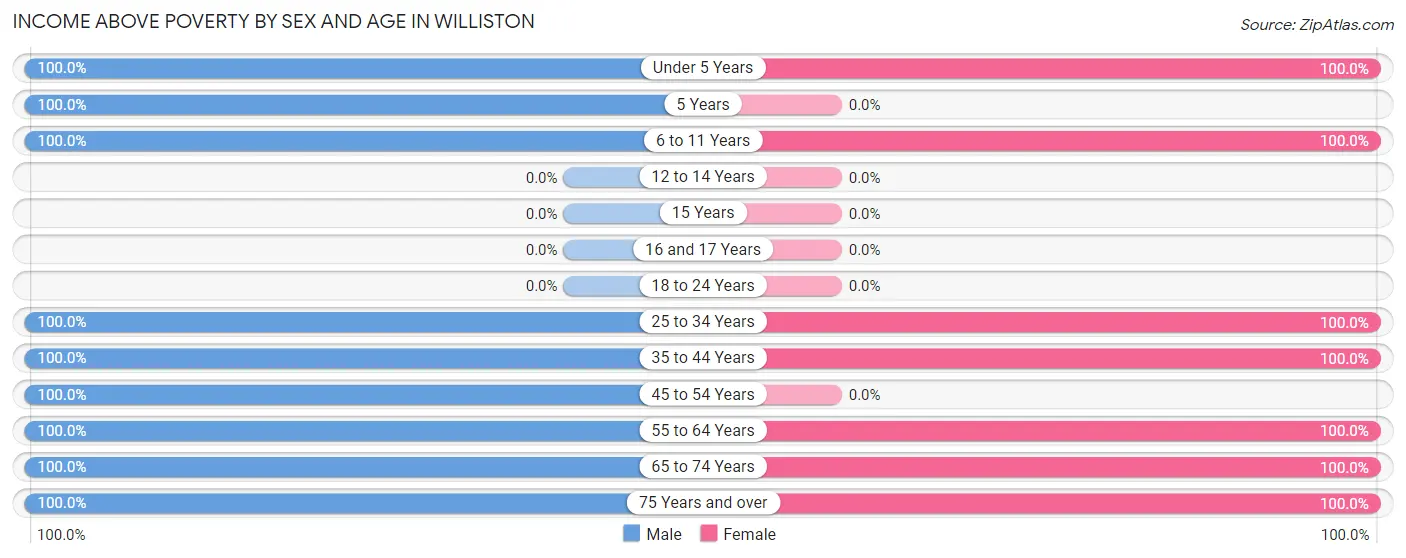
| Age Bracket | Male | Female |
| Under 5 Years | 20 (100.0%) | 10 (100.0%) |
| 5 Years | 9 (100.0%) | 0 (0.0%) |
| 6 to 11 Years | 10 (100.0%) | 8 (100.0%) |
| 12 to 14 Years | 0 (0.0%) | 0 (0.0%) |
| 15 Years | 0 (0.0%) | 0 (0.0%) |
| 16 and 17 Years | 0 (0.0%) | 0 (0.0%) |
| 18 to 24 Years | 0 (0.0%) | 0 (0.0%) |
| 25 to 34 Years | 9 (100.0%) | 12 (100.0%) |
| 35 to 44 Years | 12 (100.0%) | 13 (100.0%) |
| 45 to 54 Years | 26 (100.0%) | 0 (0.0%) |
| 55 to 64 Years | 20 (100.0%) | 45 (100.0%) |
| 65 to 74 Years | 20 (100.0%) | 12 (100.0%) |
| 75 Years and over | 11 (100.0%) | 19 (100.0%) |
| Total | 137 (100.0%) | 119 (100.0%) |
Income Below Poverty Among Married-Couple Families in Williston
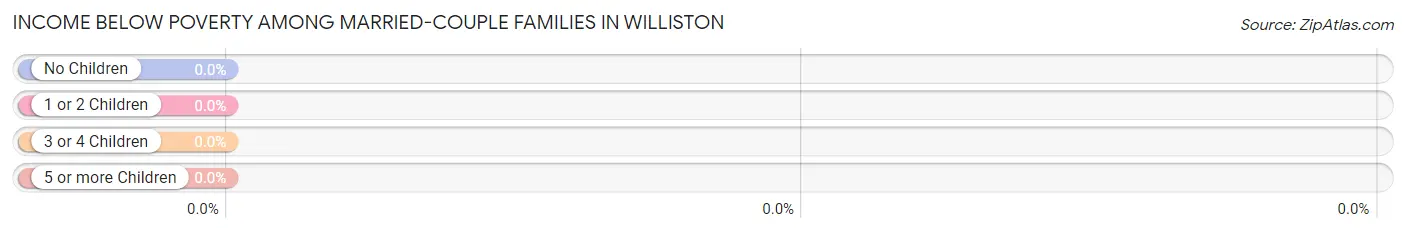
| Children | Above Poverty | Below Poverty |
| No Children | 58 (100.0%) | 0 (0.0%) |
| 1 or 2 Children | 9 (100.0%) | 0 (0.0%) |
| 3 or 4 Children | 9 (100.0%) | 0 (0.0%) |
| 5 or more Children | 0 (0.0%) | 0 (0.0%) |
| Total | 76 (100.0%) | 0 (0.0%) |
Income Below Poverty Among Single-Parent Households in Williston
| Children | Single Father | Single Mother |
| No Children | 0 (0.0%) | 0 (0.0%) |
| 1 or 2 Children | 0 (0.0%) | 0 (0.0%) |
| 3 or 4 Children | 0 (0.0%) | 0 (0.0%) |
| 5 or more Children | 0 (0.0%) | 0 (0.0%) |
| Total | 0 (0.0%) | 0 (0.0%) |
Income Below Poverty Among Married-Couple vs Single-Parent Households in Williston
| Children | Married-Couple Families | Single-Parent Households |
| No Children | 0 (0.0%) | 0 (0.0%) |
| 1 or 2 Children | 0 (0.0%) | 0 (0.0%) |
| 3 or 4 Children | 0 (0.0%) | 0 (0.0%) |
| 5 or more Children | 0 (0.0%) | 0 (0.0%) |
| Total | 0 (0.0%) | 0 (0.0%) |
Race in Williston
The most populous races in Williston are , and White / Caucasian (356 | 100.0%).
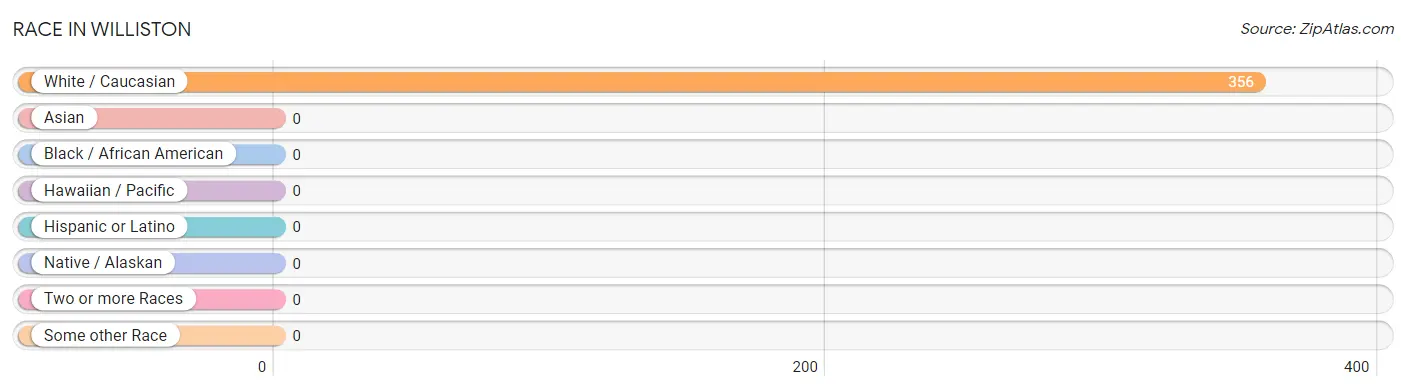
| Race | # Population | % Population |
| Asian | 0 | 0.0% |
| Black / African American | 0 | 0.0% |
| Hawaiian / Pacific | 0 | 0.0% |
| Hispanic or Latino | 0 | 0.0% |
| Native / Alaskan | 0 | 0.0% |
| White / Caucasian | 356 | 100.0% |
| Two or more Races | 0 | 0.0% |
| Some other Race | 0 | 0.0% |
| Total | 356 | 100.0% |
Ancestry in Williston
The most populous ancestries reported in Williston are German (142 | 39.9%), American (52 | 14.6%), Hungarian (36 | 10.1%), Irish (36 | 10.1%), and English (28 | 7.9%), together accounting for 82.6% of all Williston residents.
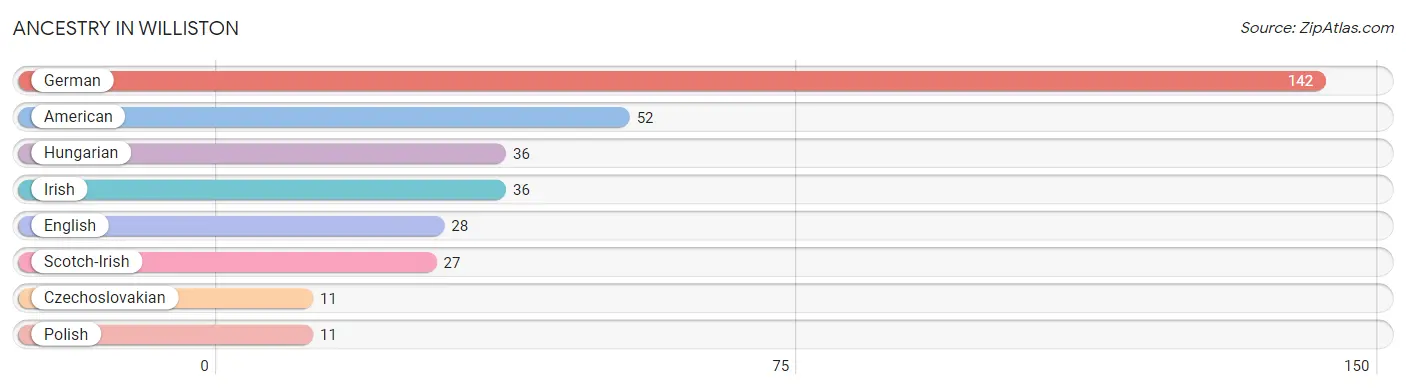
| Ancestry | # Population | % Population |
| American | 52 | 14.6% |
| Czechoslovakian | 11 | 3.1% |
| English | 28 | 7.9% |
| German | 142 | 39.9% |
| Hungarian | 36 | 10.1% |
| Irish | 36 | 10.1% |
| Polish | 11 | 3.1% |
| Scotch-Irish | 27 | 7.6% | View All 8 Rows |
Immigrants in Williston

| Immigration Origin | # Population | % Population | View All 0 Rows |
Sex and Age in Williston
Sex and Age in Williston
The most populous age groups in Williston are 45 to 49 Years (26 | 14.6%) for men and 60 to 64 Years (40 | 22.5%) for women.
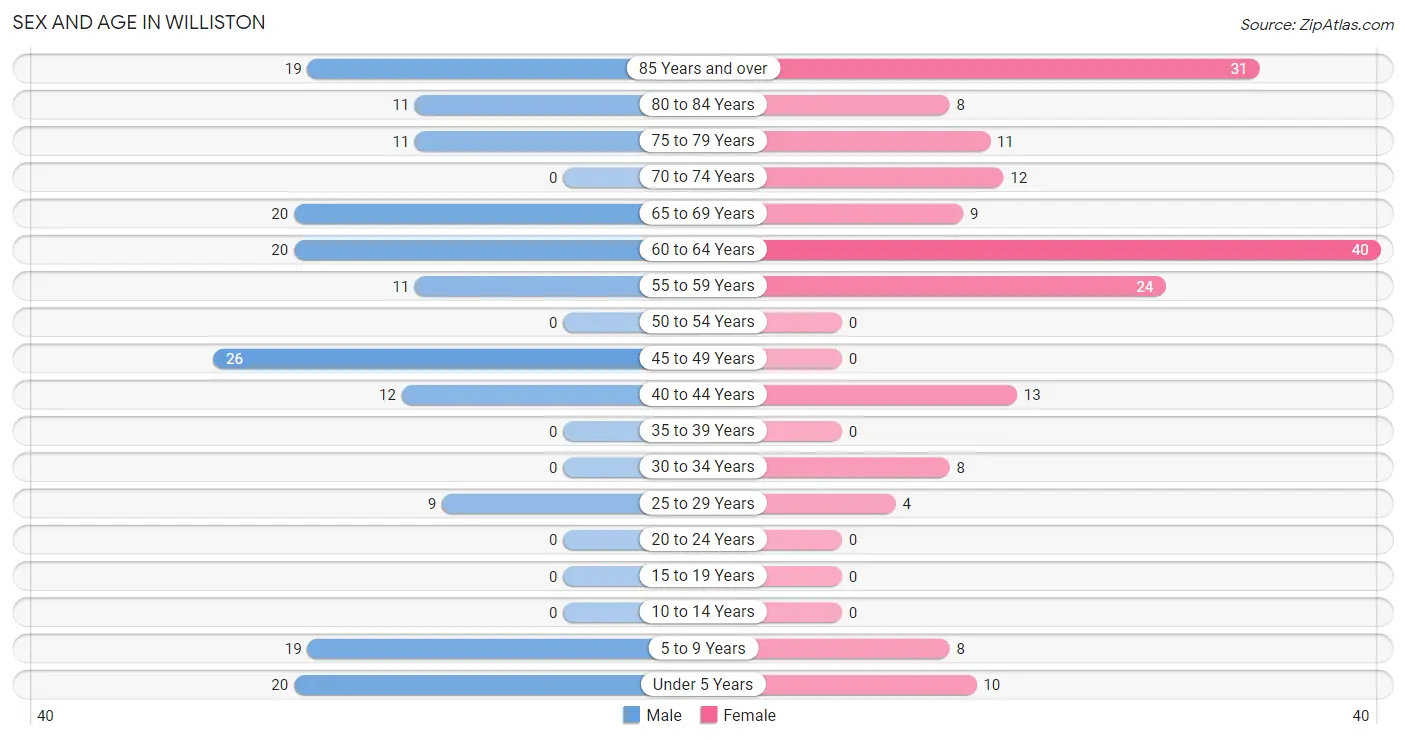
| Age Bracket | Male | Female |
| Under 5 Years | 20 (11.2%) | 10 (5.6%) |
| 5 to 9 Years | 19 (10.7%) | 8 (4.5%) |
| 10 to 14 Years | 0 (0.0%) | 0 (0.0%) |
| 15 to 19 Years | 0 (0.0%) | 0 (0.0%) |
| 20 to 24 Years | 0 (0.0%) | 0 (0.0%) |
| 25 to 29 Years | 9 (5.1%) | 4 (2.2%) |
| 30 to 34 Years | 0 (0.0%) | 8 (4.5%) |
| 35 to 39 Years | 0 (0.0%) | 0 (0.0%) |
| 40 to 44 Years | 12 (6.7%) | 13 (7.3%) |
| 45 to 49 Years | 26 (14.6%) | 0 (0.0%) |
| 50 to 54 Years | 0 (0.0%) | 0 (0.0%) |
| 55 to 59 Years | 11 (6.2%) | 24 (13.5%) |
| 60 to 64 Years | 20 (11.2%) | 40 (22.5%) |
| 65 to 69 Years | 20 (11.2%) | 9 (5.1%) |
| 70 to 74 Years | 0 (0.0%) | 12 (6.7%) |
| 75 to 79 Years | 11 (6.2%) | 11 (6.2%) |
| 80 to 84 Years | 11 (6.2%) | 8 (4.5%) |
| 85 Years and over | 19 (10.7%) | 31 (17.4%) |
| Total | 178 (100.0%) | 178 (100.0%) |
Families and Households in Williston
Median Family Size in Williston
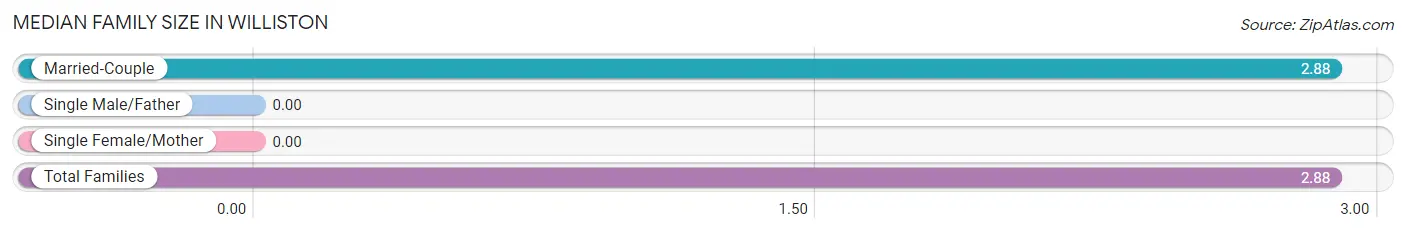
| Family Type | # Families | Family Size |
| Married-Couple | 76 (100.0%) | 2.88 |
| Single Male/Father | 0 (0.0%) | - |
| Single Female/Mother | 0 (0.0%) | - |
| Total Families | 76 (100.0%) | 2.88 |
Median Household Size in Williston
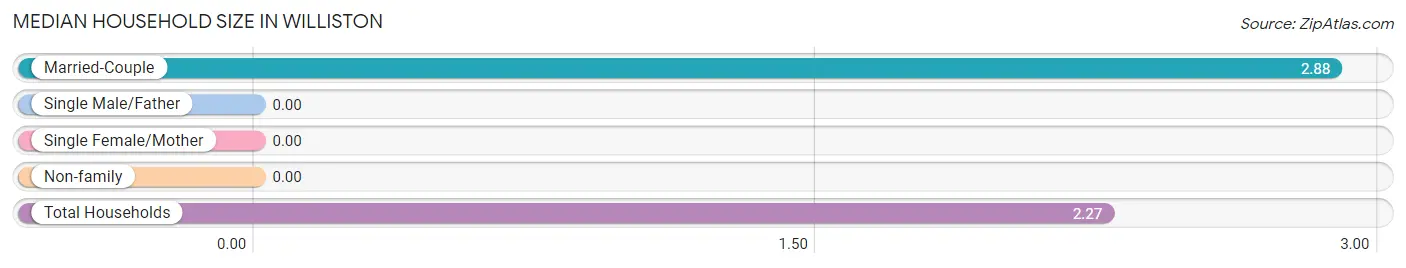
| Household Type | # Households | Household Size |
| Married-Couple | 76 (67.3%) | 2.88 |
| Single Male/Father | 0 (0.0%) | - |
| Single Female/Mother | 0 (0.0%) | - |
| Non-family | 37 (32.7%) | - |
| Total Households | 113 (100.0%) | 2.27 |
Household Size by Marriage Status in Williston
Out of a total of 113 households in Williston, 76 (67.3%) are family households, while 37 (32.7%) are nonfamily households. The most numerous type of family households are 2-person households, comprising 45, and the most common type of nonfamily households are 1-person households, comprising 37.
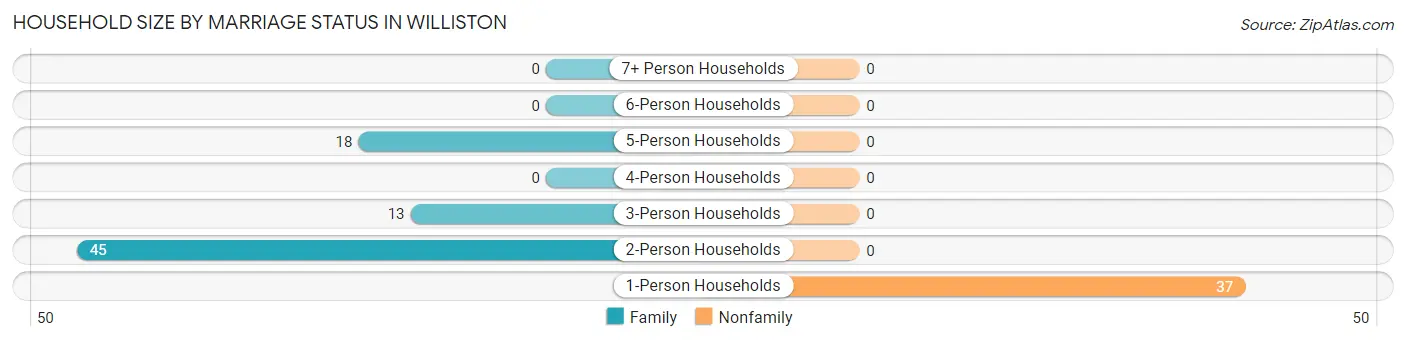
| Household Size | Family Households | Nonfamily Households |
| 1-Person Households | - | 37 (32.7%) |
| 2-Person Households | 45 (39.8%) | 0 (0.0%) |
| 3-Person Households | 13 (11.5%) | 0 (0.0%) |
| 4-Person Households | 0 (0.0%) | 0 (0.0%) |
| 5-Person Households | 18 (15.9%) | 0 (0.0%) |
| 6-Person Households | 0 (0.0%) | 0 (0.0%) |
| 7+ Person Households | 0 (0.0%) | 0 (0.0%) |
| Total | 76 (67.3%) | 37 (32.7%) |
Female Fertility in Williston
Fertility by Age in Williston
| Age Bracket | Women with Births | Births / 1,000 Women |
| 15 to 19 years | 0 (0.0%) | 0.0 |
| 20 to 34 years | 0 (0.0%) | 0.0 |
| 35 to 50 years | 0 (0.0%) | 0.0 |
| Total | 0 (0.0%) | 0.0 |
Fertility by Age by Marriage Status in Williston
| Age Bracket | Married | Unmarried |
| 15 to 19 years | 0 (0.0%) | 0 (0.0%) |
| 20 to 34 years | 0 (0.0%) | 0 (0.0%) |
| 35 to 50 years | 0 (0.0%) | 0 (0.0%) |
| Total | 0 (0.0%) | 0 (0.0%) |
Fertility by Education in Williston
| Educational Attainment | Women with Births | Births / 1,000 Women |
| Less than High School | 0 (0.0%) | 0.0 |
| High School Diploma | 0 (0.0%) | 0.0 |
| College or Associate's Degree | 0 (0.0%) | 0.0 |
| Bachelor's Degree | 0 (0.0%) | 0.0 |
| Graduate Degree | 0 (0.0%) | 0.0 |
| Total | 0 (0.0%) | 0.0 |
Fertility by Education by Marriage Status in Williston
| Educational Attainment | Married | Unmarried |
| Less than High School | 0 (0.0%) | 0 (0.0%) |
| High School Diploma | 0 (0.0%) | 0 (0.0%) |
| College or Associate's Degree | 0 (0.0%) | 0 (0.0%) |
| Bachelor's Degree | 0 (0.0%) | 0 (0.0%) |
| Graduate Degree | 0 (0.0%) | 0 (0.0%) |
| Total | 0 (0.0%) | 0 (0.0%) |
Employment Characteristics in Williston
Employment by Class of Employer in Williston
Among the 92 employed individuals in Williston, private company employees (58 | 63.0%), self-employed (not incorporated) (13 | 14.1%), and local government employees (12 | 13.0%) make up the most common classes of employment.
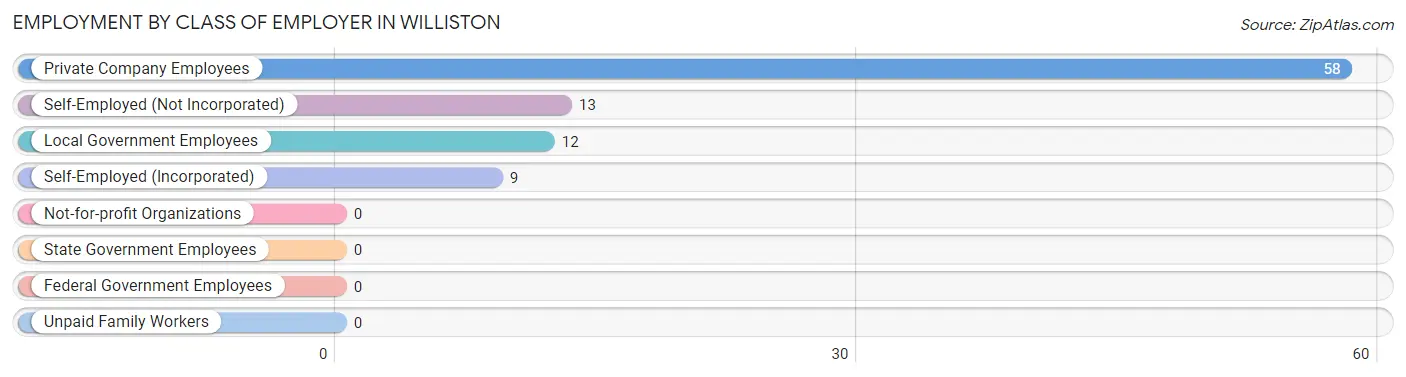
| Employer Class | # Employees | % Employees |
| Private Company Employees | 58 | 63.0% |
| Self-Employed (Incorporated) | 9 | 9.8% |
| Self-Employed (Not Incorporated) | 13 | 14.1% |
| Not-for-profit Organizations | 0 | 0.0% |
| Local Government Employees | 12 | 13.0% |
| State Government Employees | 0 | 0.0% |
| Federal Government Employees | 0 | 0.0% |
| Unpaid Family Workers | 0 | 0.0% |
| Total | 92 | 100.0% |
Employment Status by Age in Williston
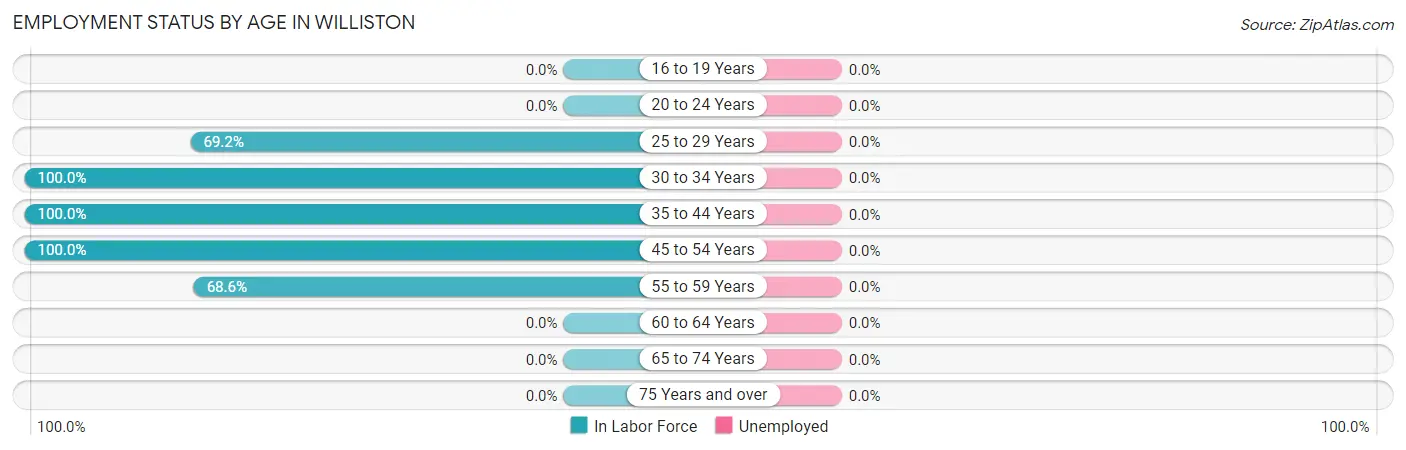
| Age Bracket | In Labor Force | Unemployed |
| 16 to 19 Years | 0 (0.0%) | 0 (0.0%) |
| 20 to 24 Years | 0 (0.0%) | 0 (0.0%) |
| 25 to 29 Years | 9 (69.2%) | 0 (0.0%) |
| 30 to 34 Years | 8 (100.0%) | 0 (0.0%) |
| 35 to 44 Years | 25 (100.0%) | 0 (0.0%) |
| 45 to 54 Years | 26 (100.0%) | 0 (0.0%) |
| 55 to 59 Years | 24 (68.6%) | 0 (0.0%) |
| 60 to 64 Years | 0 (0.0%) | 0 (0.0%) |
| 65 to 74 Years | 0 (0.0%) | 0 (0.0%) |
| 75 Years and over | 0 (0.0%) | 0 (0.0%) |
| Total | 92 (30.8%) | 0 (0.0%) |
Employment Status by Educational Attainment in Williston
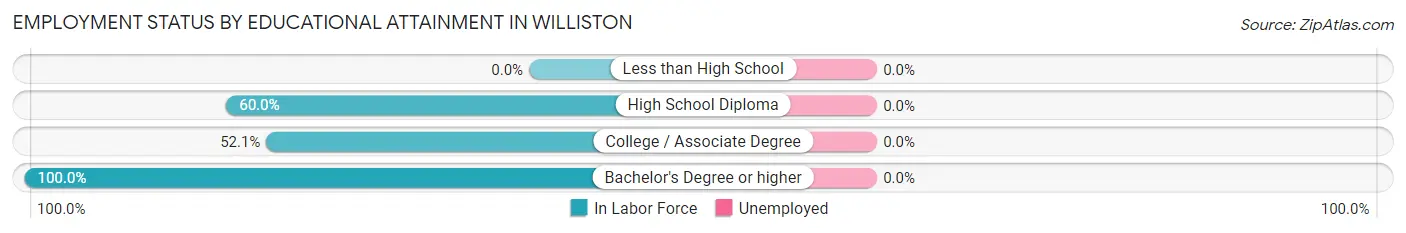
| Educational Attainment | In Labor Force | Unemployed |
| Less than High School | 0 (0.0%) | 0 (0.0%) |
| High School Diploma | 33 (60.0%) | 0 (0.0%) |
| College / Associate Degree | 37 (52.1%) | 0 (0.0%) |
| Bachelor's Degree or higher | 22 (100.0%) | 0 (0.0%) |
| Total | 92 (55.1%) | 0 (0.0%) |
Employment Occupations by Sex in Williston
Management, Business, Science and Arts Occupations
The most common Management, Business, Science and Arts occupations in Williston are Health Diagnosing & Treating (13 | 14.1%), Health Technologists (13 | 14.1%), and Management (9 | 9.8%).
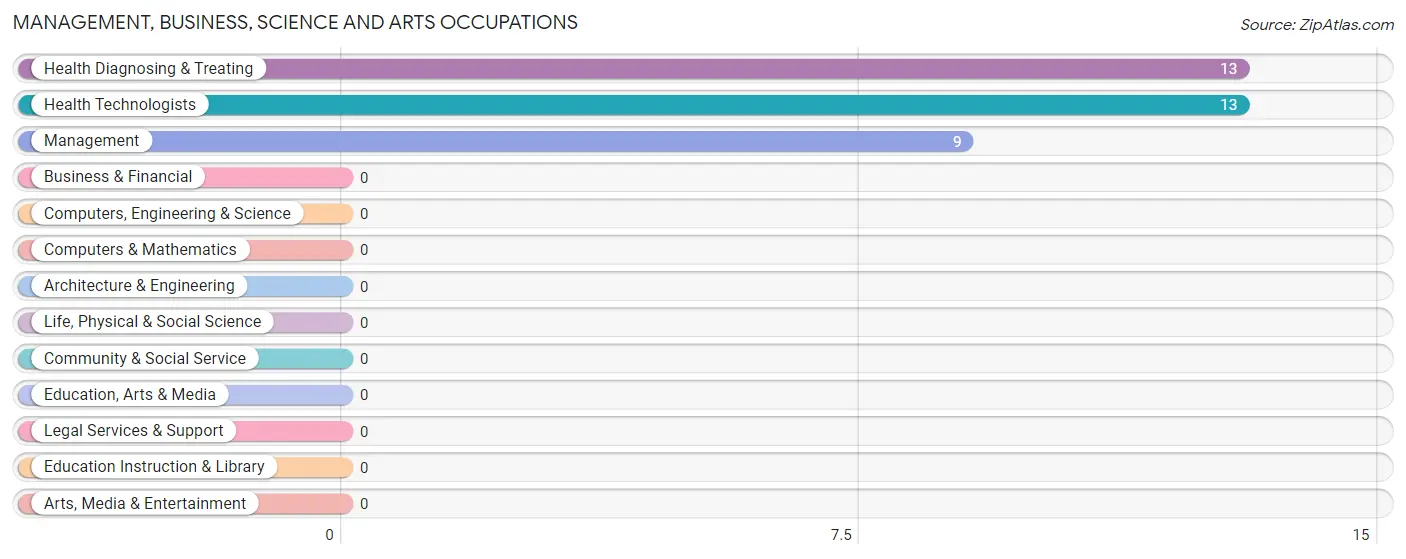
Management, Business, Science and Arts Occupations by Sex
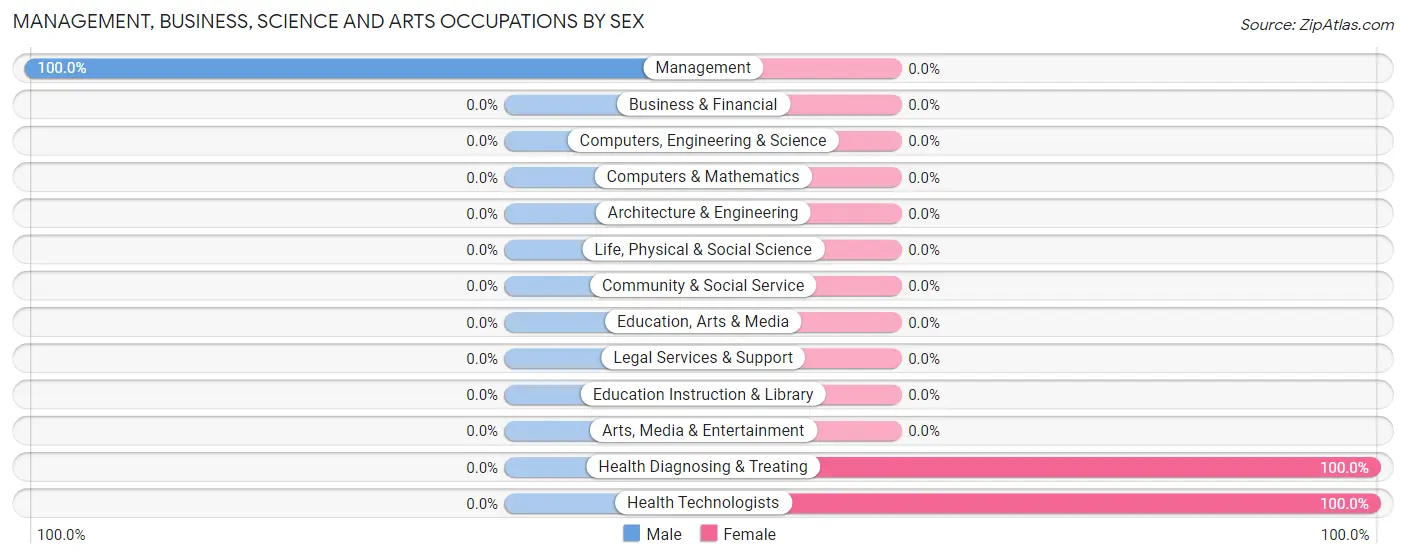
| Occupation | Male | Female |
| Management | 9 (100.0%) | 0 (0.0%) |
| Business & Financial | 0 (0.0%) | 0 (0.0%) |
| Computers, Engineering & Science | 0 (0.0%) | 0 (0.0%) |
| Computers & Mathematics | 0 (0.0%) | 0 (0.0%) |
| Architecture & Engineering | 0 (0.0%) | 0 (0.0%) |
| Life, Physical & Social Science | 0 (0.0%) | 0 (0.0%) |
| Community & Social Service | 0 (0.0%) | 0 (0.0%) |
| Education, Arts & Media | 0 (0.0%) | 0 (0.0%) |
| Legal Services & Support | 0 (0.0%) | 0 (0.0%) |
| Education Instruction & Library | 0 (0.0%) | 0 (0.0%) |
| Arts, Media & Entertainment | 0 (0.0%) | 0 (0.0%) |
| Health Diagnosing & Treating | 0 (0.0%) | 13 (100.0%) |
| Health Technologists | 0 (0.0%) | 13 (100.0%) |
| Total (Category) | 9 (40.9%) | 13 (59.1%) |
| Total (Overall) | 47 (51.1%) | 45 (48.9%) |
Services Occupations
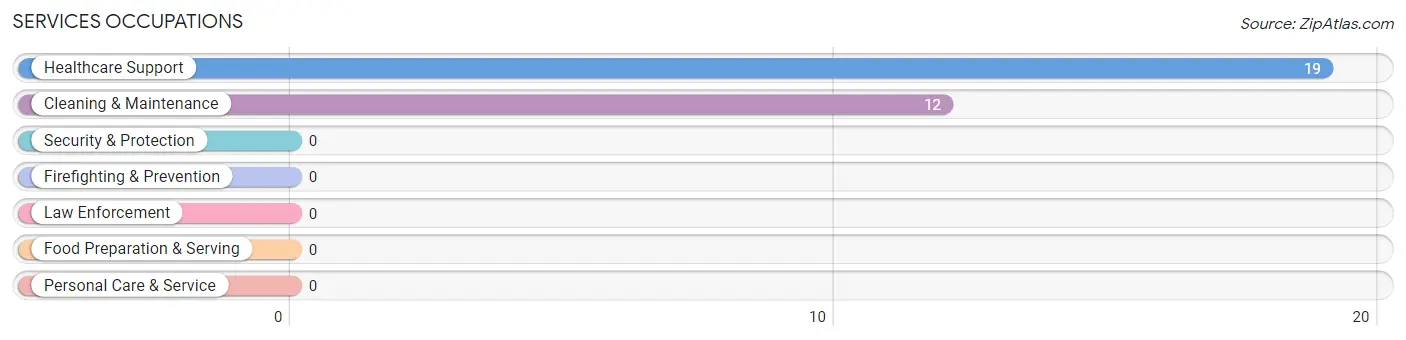
The most common Services occupations in Williston are Healthcare Support (19 | 20.6%), and Cleaning & Maintenance (12 | 13.0%).
Services Occupations by Sex
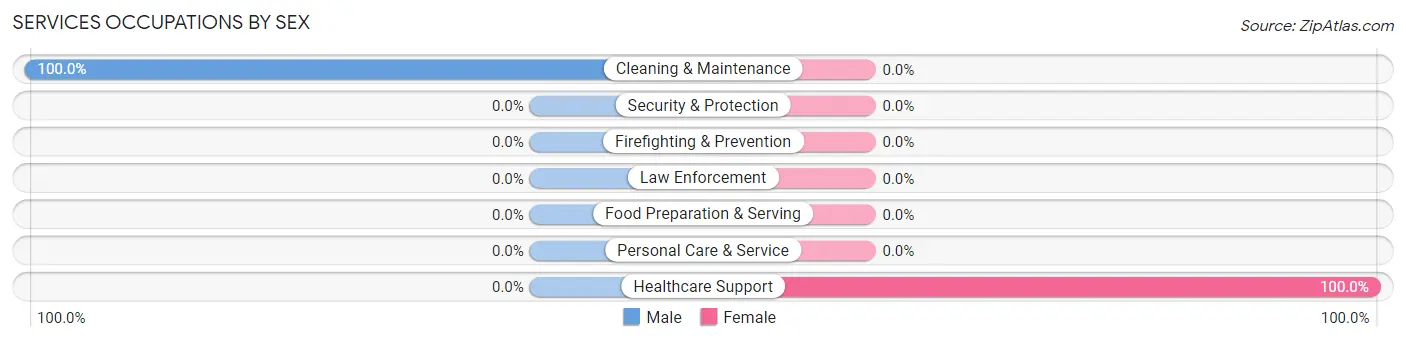
| Occupation | Male | Female |
| Healthcare Support | 0 (0.0%) | 19 (100.0%) |
| Security & Protection | 0 (0.0%) | 0 (0.0%) |
| Firefighting & Prevention | 0 (0.0%) | 0 (0.0%) |
| Law Enforcement | 0 (0.0%) | 0 (0.0%) |
| Food Preparation & Serving | 0 (0.0%) | 0 (0.0%) |
| Cleaning & Maintenance | 12 (100.0%) | 0 (0.0%) |
| Personal Care & Service | 0 (0.0%) | 0 (0.0%) |
| Total (Category) | 12 (38.7%) | 19 (61.3%) |
| Total (Overall) | 47 (51.1%) | 45 (48.9%) |
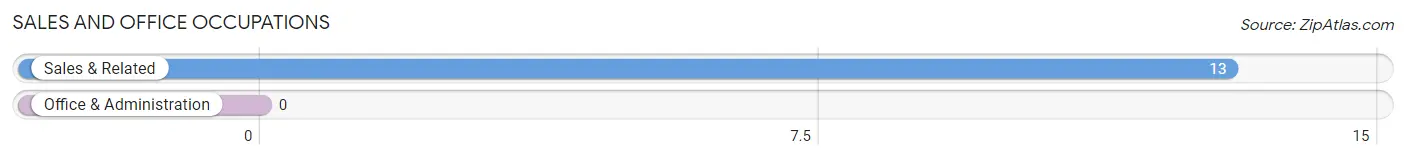
Sales and Office Occupations
The most common Sales and Office occupations in Williston are , and Sales & Related (13 | 14.1%).
Sales and Office Occupations by Sex
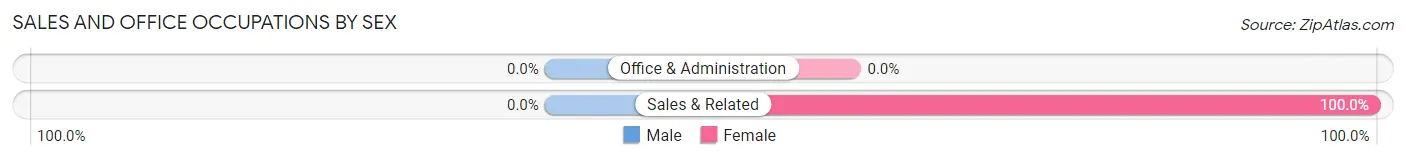
| Occupation | Male | Female |
| Sales & Related | 0 (0.0%) | 13 (100.0%) |
| Office & Administration | 0 (0.0%) | 0 (0.0%) |
| Total (Category) | 0 (0.0%) | 13 (100.0%) |
| Total (Overall) | 47 (51.1%) | 45 (48.9%) |
Natural Resources, Construction and Maintenance Occupations
The most common Natural Resources, Construction and Maintenance occupations in Williston are , and Construction & Extraction (26 | 28.3%).
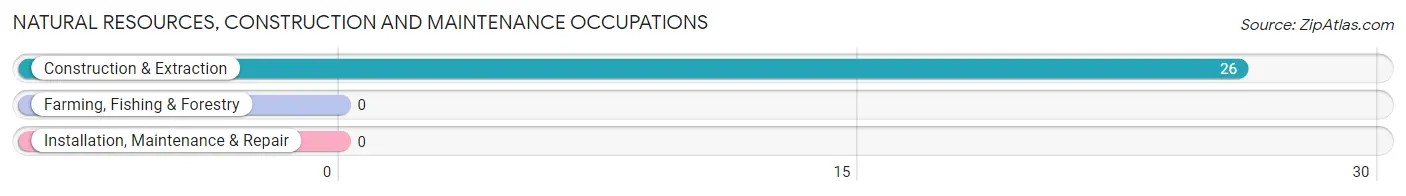
Natural Resources, Construction and Maintenance Occupations by Sex
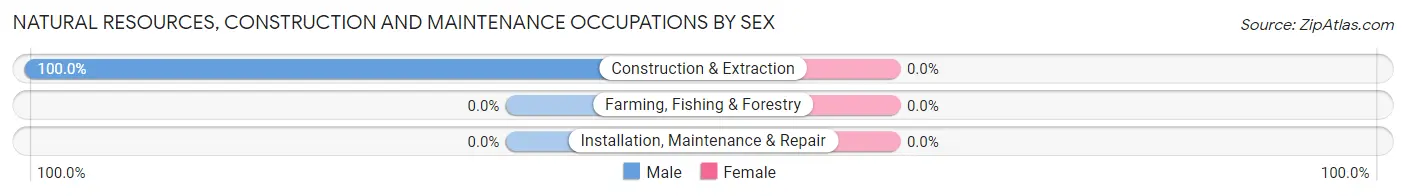
| Occupation | Male | Female |
| Farming, Fishing & Forestry | 0 (0.0%) | 0 (0.0%) |
| Construction & Extraction | 26 (100.0%) | 0 (0.0%) |
| Installation, Maintenance & Repair | 0 (0.0%) | 0 (0.0%) |
| Total (Category) | 26 (100.0%) | 0 (0.0%) |
| Total (Overall) | 47 (51.1%) | 45 (48.9%) |
Production, Transportation and Moving Occupations
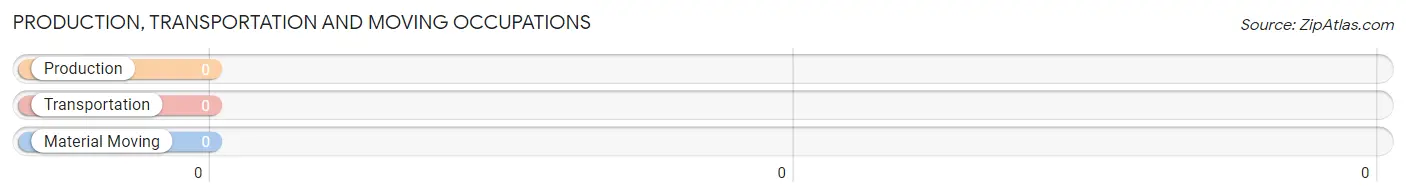
Production, Transportation and Moving Occupations by Sex
| Occupation | Male | Female |
| Production | 0 (0.0%) | 0 (0.0%) |
| Transportation | 0 (0.0%) | 0 (0.0%) |
| Material Moving | 0 (0.0%) | 0 (0.0%) |
| Total (Category) | 0 (0.0%) | 0 (0.0%) |
| Total (Overall) | 47 (51.1%) | 45 (48.9%) |
Employment Industries by Sex in Williston
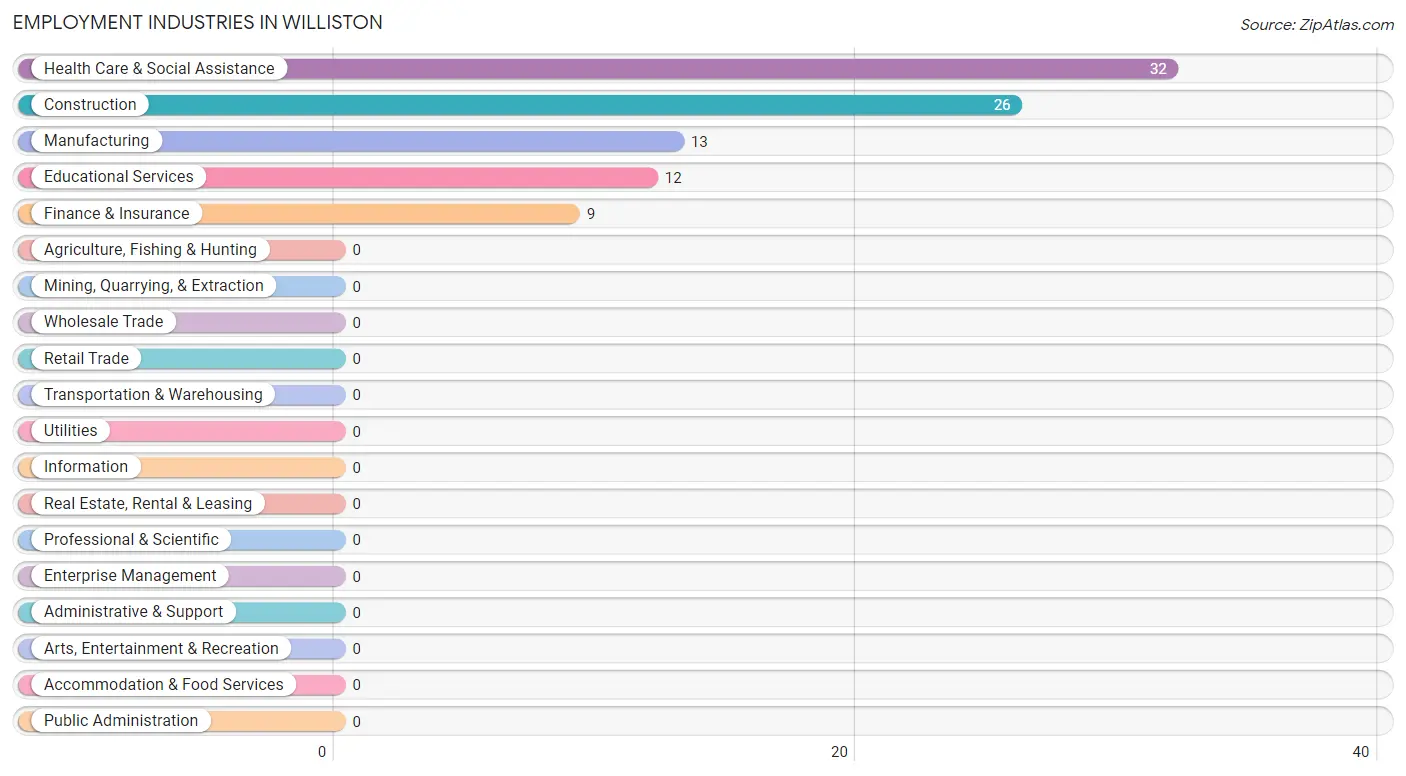
Employment Industries in Williston
The major employment industries in Williston include Health Care & Social Assistance (32 | 34.8%), Construction (26 | 28.3%), Manufacturing (13 | 14.1%), Educational Services (12 | 13.0%), and Finance & Insurance (9 | 9.8%).
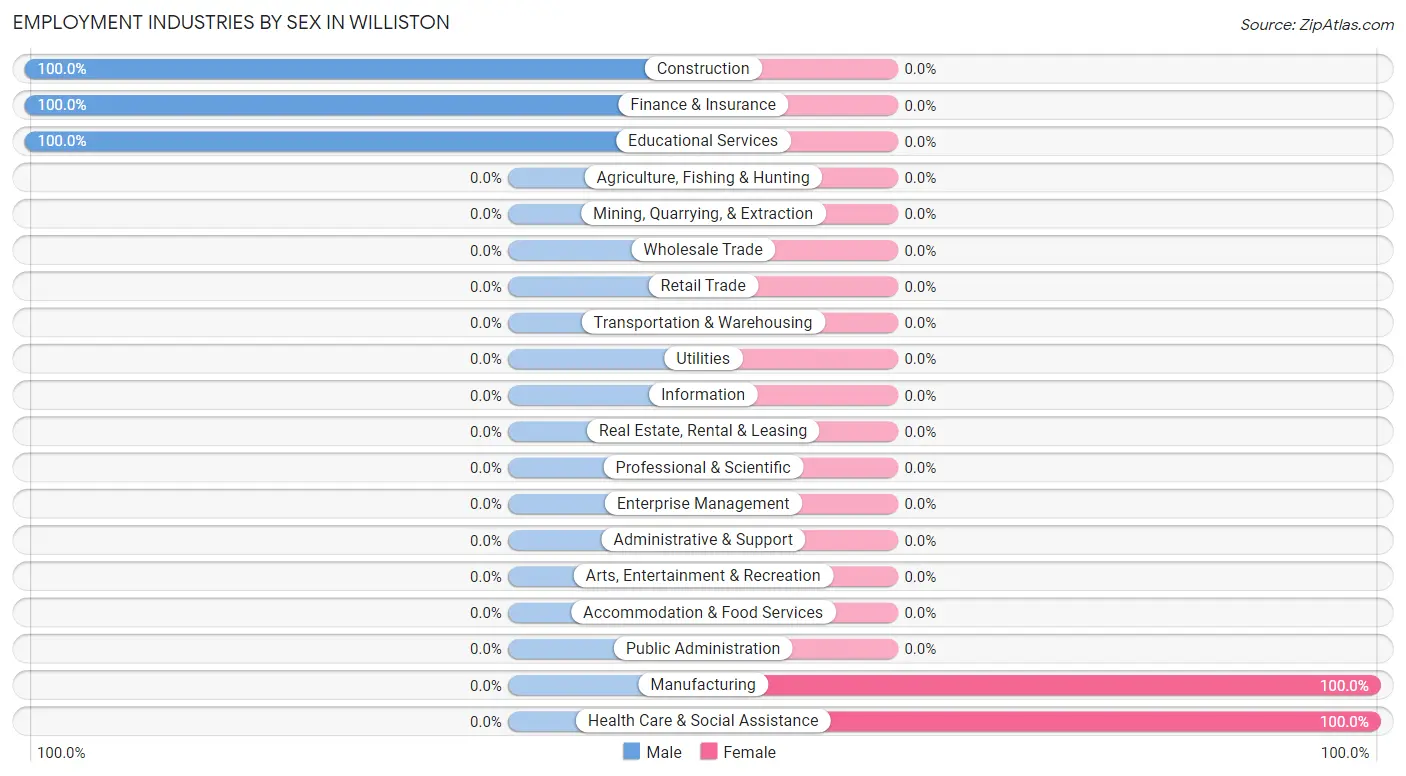
Employment Industries by Sex in Williston
The Williston industries that see more men than women are Construction (100.0%), Finance & Insurance (100.0%), and Educational Services (100.0%), whereas the industries that tend to have a higher number of women are Manufacturing (100.0%), and Health Care & Social Assistance (100.0%).
| Industry | Male | Female |
| Agriculture, Fishing & Hunting | 0 (0.0%) | 0 (0.0%) |
| Mining, Quarrying, & Extraction | 0 (0.0%) | 0 (0.0%) |
| Construction | 26 (100.0%) | 0 (0.0%) |
| Manufacturing | 0 (0.0%) | 13 (100.0%) |
| Wholesale Trade | 0 (0.0%) | 0 (0.0%) |
| Retail Trade | 0 (0.0%) | 0 (0.0%) |
| Transportation & Warehousing | 0 (0.0%) | 0 (0.0%) |
| Utilities | 0 (0.0%) | 0 (0.0%) |
| Information | 0 (0.0%) | 0 (0.0%) |
| Finance & Insurance | 9 (100.0%) | 0 (0.0%) |
| Real Estate, Rental & Leasing | 0 (0.0%) | 0 (0.0%) |
| Professional & Scientific | 0 (0.0%) | 0 (0.0%) |
| Enterprise Management | 0 (0.0%) | 0 (0.0%) |
| Administrative & Support | 0 (0.0%) | 0 (0.0%) |
| Educational Services | 12 (100.0%) | 0 (0.0%) |
| Health Care & Social Assistance | 0 (0.0%) | 32 (100.0%) |
| Arts, Entertainment & Recreation | 0 (0.0%) | 0 (0.0%) |
| Accommodation & Food Services | 0 (0.0%) | 0 (0.0%) |
| Public Administration | 0 (0.0%) | 0 (0.0%) |
| Total | 47 (51.1%) | 45 (48.9%) |
Education in Williston
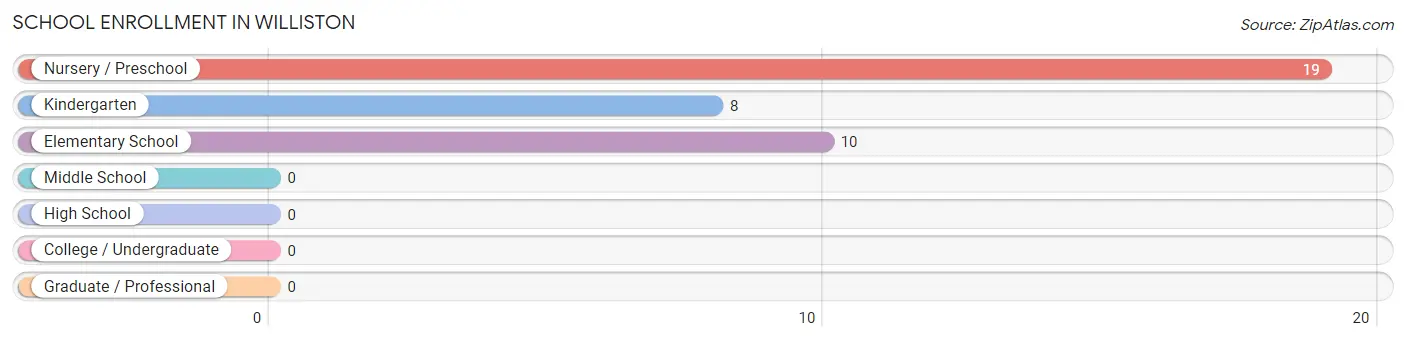
School Enrollment in Williston
The most common levels of schooling among the 37 students in Williston are nursery / preschool (19 | 51.3%), elementary school (10 | 27.0%), and kindergarten (8 | 21.6%).
| School Level | # Students | % Students |
| Nursery / Preschool | 19 | 51.3% |
| Kindergarten | 8 | 21.6% |
| Elementary School | 10 | 27.0% |
| Middle School | 0 | 0.0% |
| High School | 0 | 0.0% |
| College / Undergraduate | 0 | 0.0% |
| Graduate / Professional | 0 | 0.0% |
| Total | 37 | 100.0% |
School Enrollment by Age by Funding Source in Williston
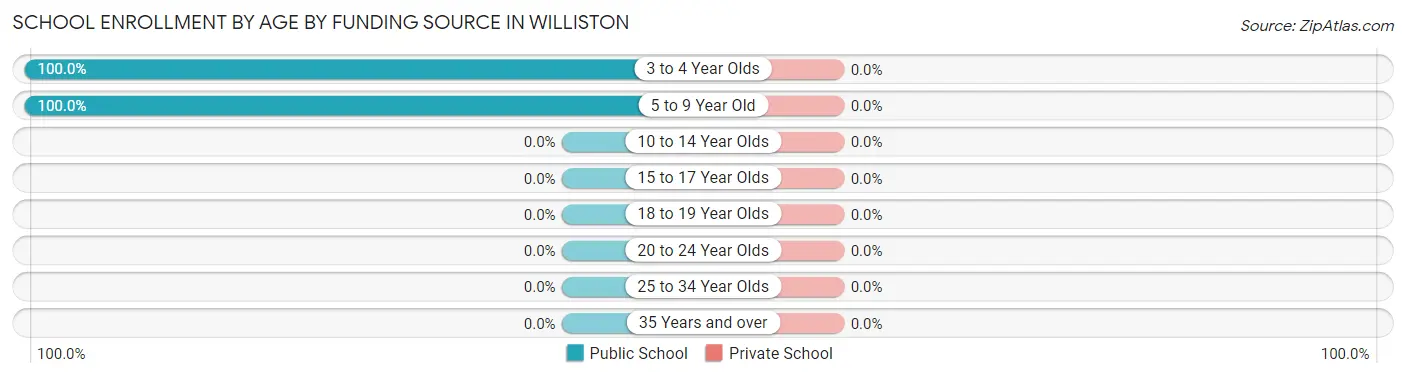
| Age Bracket | Public School | Private School |
| 3 to 4 Year Olds | 10 (100.0%) | 0 (0.0%) |
| 5 to 9 Year Old | 27 (100.0%) | 0 (0.0%) |
| 10 to 14 Year Olds | 0 (0.0%) | 0 (0.0%) |
| 15 to 17 Year Olds | 0 (0.0%) | 0 (0.0%) |
| 18 to 19 Year Olds | 0 (0.0%) | 0 (0.0%) |
| 20 to 24 Year Olds | 0 (0.0%) | 0 (0.0%) |
| 25 to 34 Year Olds | 0 (0.0%) | 0 (0.0%) |
| 35 Years and over | 0 (0.0%) | 0 (0.0%) |
| Total | 37 (100.0%) | 0 (0.0%) |
Educational Attainment by Field of Study in Williston
Physical & health sciences (13 | 43.3%), business (9 | 30.0%), and education (8 | 26.7%) are the most common fields of study among 30 individuals in Williston who have obtained a bachelor's degree or higher.
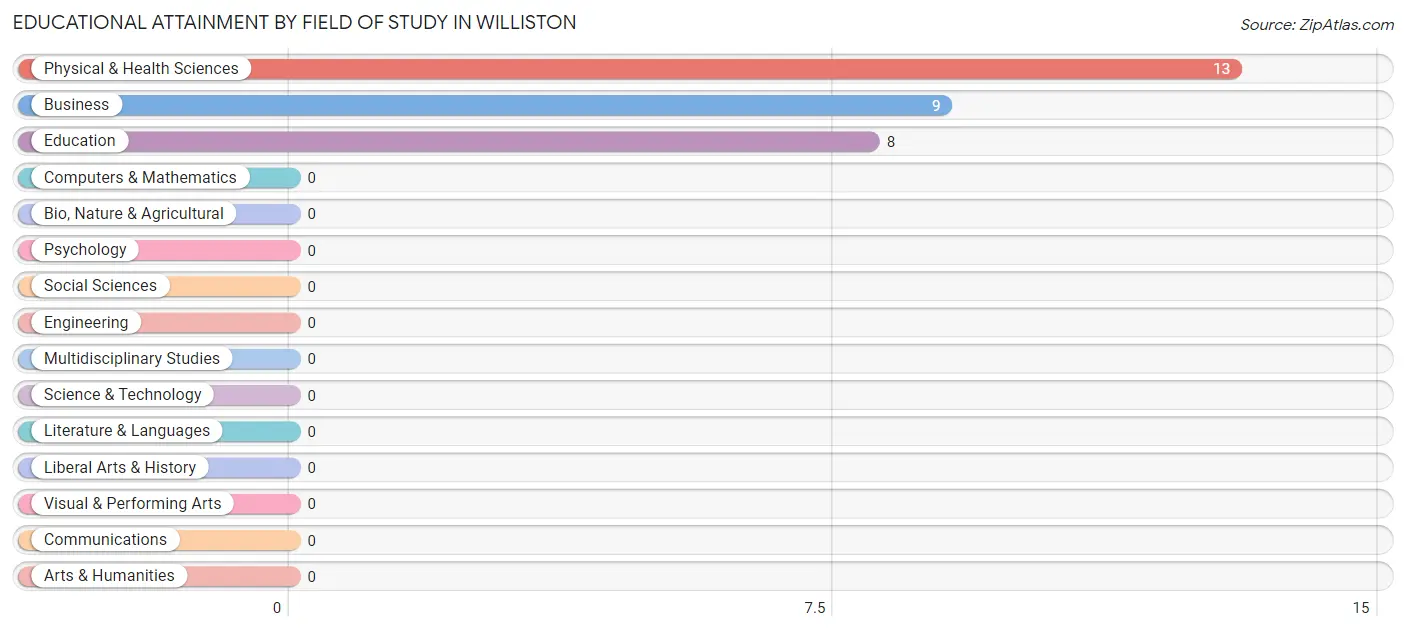
| Field of Study | # Graduates | % Graduates |
| Computers & Mathematics | 0 | 0.0% |
| Bio, Nature & Agricultural | 0 | 0.0% |
| Physical & Health Sciences | 13 | 43.3% |
| Psychology | 0 | 0.0% |
| Social Sciences | 0 | 0.0% |
| Engineering | 0 | 0.0% |
| Multidisciplinary Studies | 0 | 0.0% |
| Science & Technology | 0 | 0.0% |
| Business | 9 | 30.0% |
| Education | 8 | 26.7% |
| Literature & Languages | 0 | 0.0% |
| Liberal Arts & History | 0 | 0.0% |
| Visual & Performing Arts | 0 | 0.0% |
| Communications | 0 | 0.0% |
| Arts & Humanities | 0 | 0.0% |
| Total | 30 | 100.0% |
Transportation & Commute in Williston
Vehicle Availability by Sex in Williston
The most prevalent vehicle ownership categories in Williston are males with 3 vehicles (26, accounting for 55.3%) and females with 3 vehicles (21, making up 57.8%).
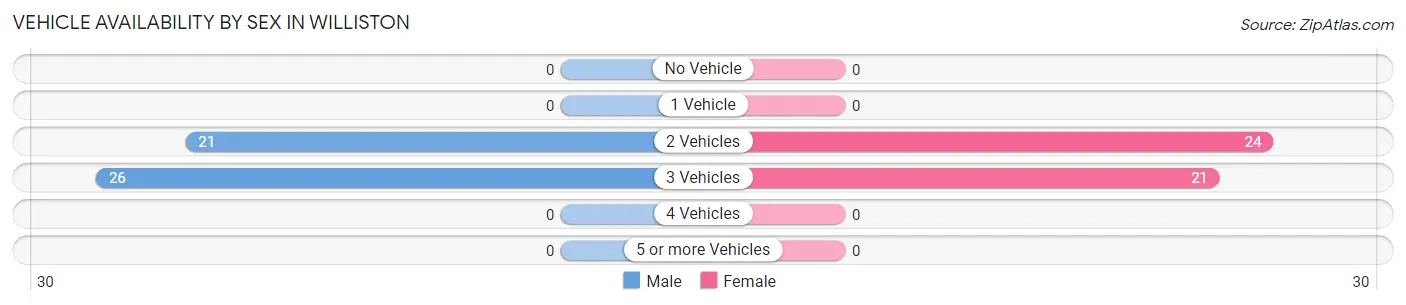
| Vehicles Available | Male | Female |
| No Vehicle | 0 (0.0%) | 0 (0.0%) |
| 1 Vehicle | 0 (0.0%) | 0 (0.0%) |
| 2 Vehicles | 21 (44.7%) | 24 (53.3%) |
| 3 Vehicles | 26 (55.3%) | 21 (46.7%) |
| 4 Vehicles | 0 (0.0%) | 0 (0.0%) |
| 5 or more Vehicles | 0 (0.0%) | 0 (0.0%) |
| Total | 47 (100.0%) | 45 (100.0%) |
Commute Time in Williston
The most frequently occuring commute durations in Williston are 20 to 24 minutes (45 commuters, 48.9%), 15 to 19 minutes (38 commuters, 41.3%), and 25 to 29 minutes (9 commuters, 9.8%).
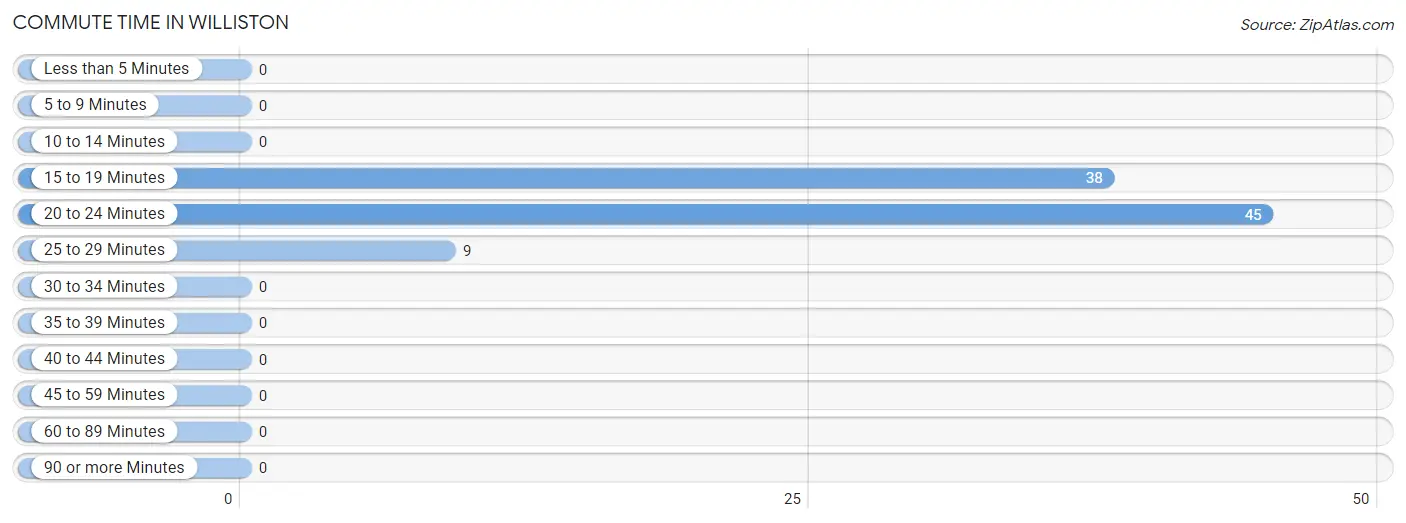
| Commute Time | # Commuters | % Commuters |
| Less than 5 Minutes | 0 | 0.0% |
| 5 to 9 Minutes | 0 | 0.0% |
| 10 to 14 Minutes | 0 | 0.0% |
| 15 to 19 Minutes | 38 | 41.3% |
| 20 to 24 Minutes | 45 | 48.9% |
| 25 to 29 Minutes | 9 | 9.8% |
| 30 to 34 Minutes | 0 | 0.0% |
| 35 to 39 Minutes | 0 | 0.0% |
| 40 to 44 Minutes | 0 | 0.0% |
| 45 to 59 Minutes | 0 | 0.0% |
| 60 to 89 Minutes | 0 | 0.0% |
| 90 or more Minutes | 0 | 0.0% |
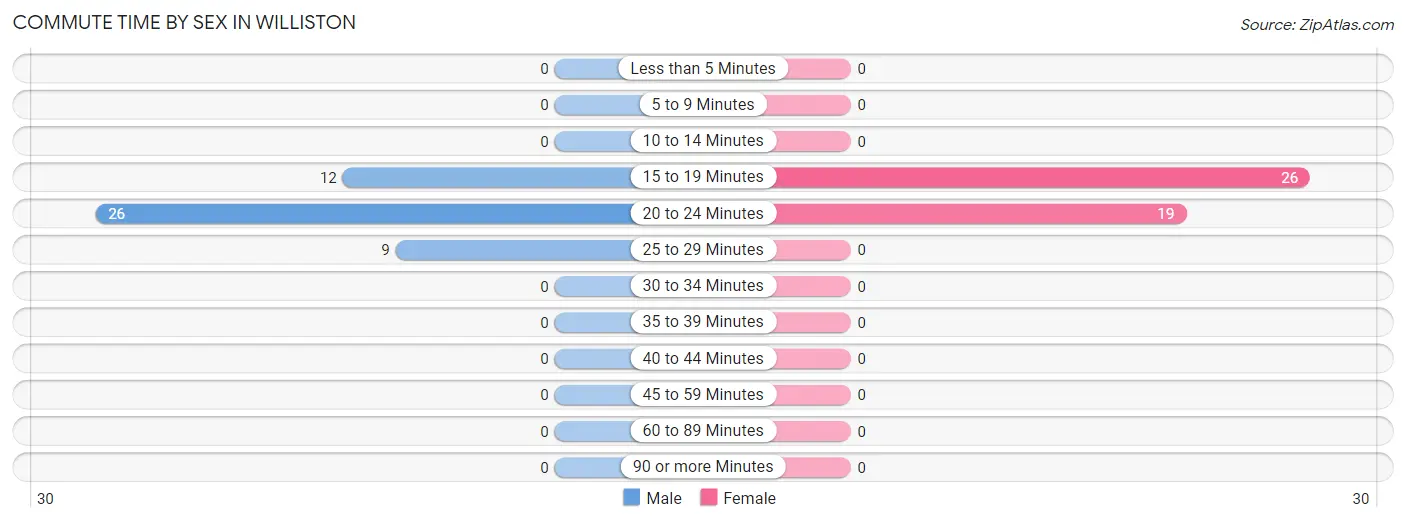
Commute Time by Sex in Williston
The most common commute times in Williston are 20 to 24 minutes (26 commuters, 55.3%) for males and 15 to 19 minutes (26 commuters, 57.8%) for females.
| Commute Time | Male | Female |
| Less than 5 Minutes | 0 (0.0%) | 0 (0.0%) |
| 5 to 9 Minutes | 0 (0.0%) | 0 (0.0%) |
| 10 to 14 Minutes | 0 (0.0%) | 0 (0.0%) |
| 15 to 19 Minutes | 12 (25.5%) | 26 (57.8%) |
| 20 to 24 Minutes | 26 (55.3%) | 19 (42.2%) |
| 25 to 29 Minutes | 9 (19.2%) | 0 (0.0%) |
| 30 to 34 Minutes | 0 (0.0%) | 0 (0.0%) |
| 35 to 39 Minutes | 0 (0.0%) | 0 (0.0%) |
| 40 to 44 Minutes | 0 (0.0%) | 0 (0.0%) |
| 45 to 59 Minutes | 0 (0.0%) | 0 (0.0%) |
| 60 to 89 Minutes | 0 (0.0%) | 0 (0.0%) |
| 90 or more Minutes | 0 (0.0%) | 0 (0.0%) |
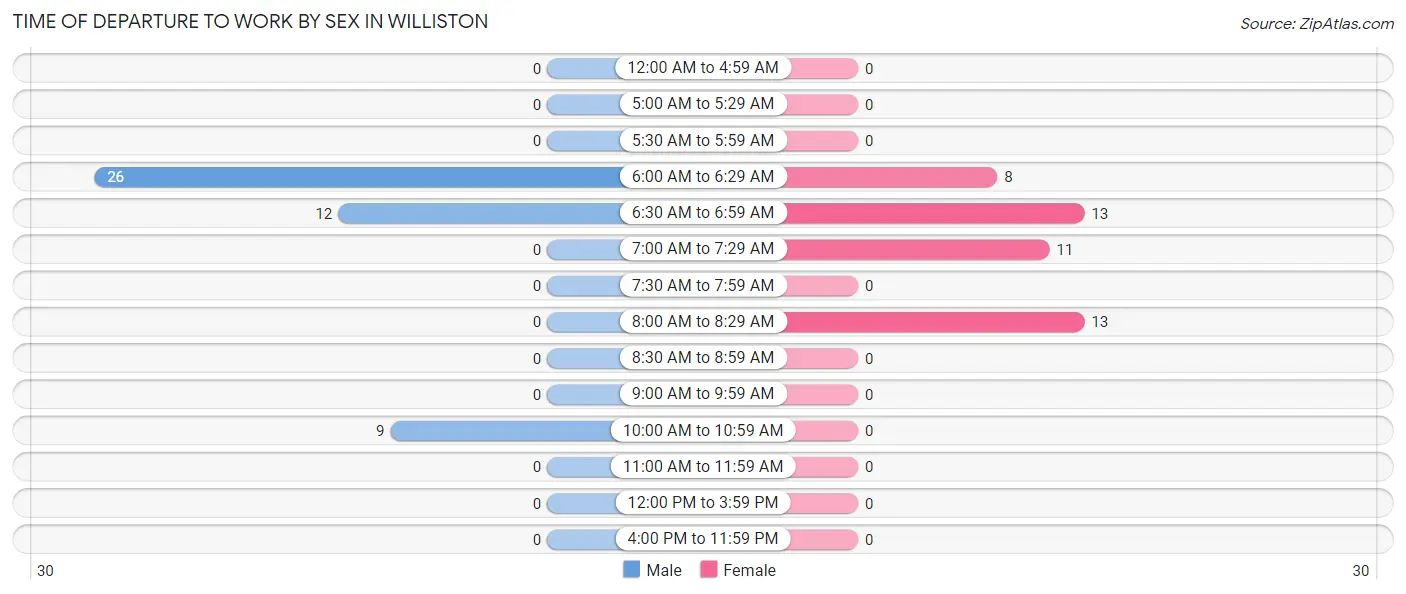
Time of Departure to Work by Sex in Williston
The most frequent times of departure to work in Williston are 6:00 AM to 6:29 AM (26, 55.3%) for males and 6:30 AM to 6:59 AM (13, 28.9%) for females.
| Time of Departure | Male | Female |
| 12:00 AM to 4:59 AM | 0 (0.0%) | 0 (0.0%) |
| 5:00 AM to 5:29 AM | 0 (0.0%) | 0 (0.0%) |
| 5:30 AM to 5:59 AM | 0 (0.0%) | 0 (0.0%) |
| 6:00 AM to 6:29 AM | 26 (55.3%) | 8 (17.8%) |
| 6:30 AM to 6:59 AM | 12 (25.5%) | 13 (28.9%) |
| 7:00 AM to 7:29 AM | 0 (0.0%) | 11 (24.4%) |
| 7:30 AM to 7:59 AM | 0 (0.0%) | 0 (0.0%) |
| 8:00 AM to 8:29 AM | 0 (0.0%) | 13 (28.9%) |
| 8:30 AM to 8:59 AM | 0 (0.0%) | 0 (0.0%) |
| 9:00 AM to 9:59 AM | 0 (0.0%) | 0 (0.0%) |
| 10:00 AM to 10:59 AM | 9 (19.2%) | 0 (0.0%) |
| 11:00 AM to 11:59 AM | 0 (0.0%) | 0 (0.0%) |
| 12:00 PM to 3:59 PM | 0 (0.0%) | 0 (0.0%) |
| 4:00 PM to 11:59 PM | 0 (0.0%) | 0 (0.0%) |
| Total | 47 (100.0%) | 45 (100.0%) |
Housing Occupancy in Williston
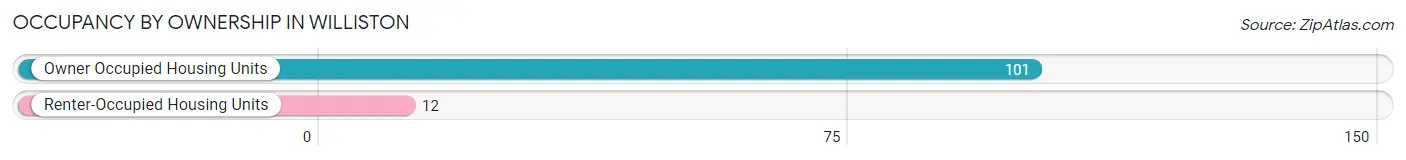
Occupancy by Ownership in Williston
Of the total 113 dwellings in Williston, owner-occupied units account for 101 (89.4%), while renter-occupied units make up 12 (10.6%).
| Occupancy | # Housing Units | % Housing Units |
| Owner Occupied Housing Units | 101 | 89.4% |
| Renter-Occupied Housing Units | 12 | 10.6% |
| Total Occupied Housing Units | 113 | 100.0% |
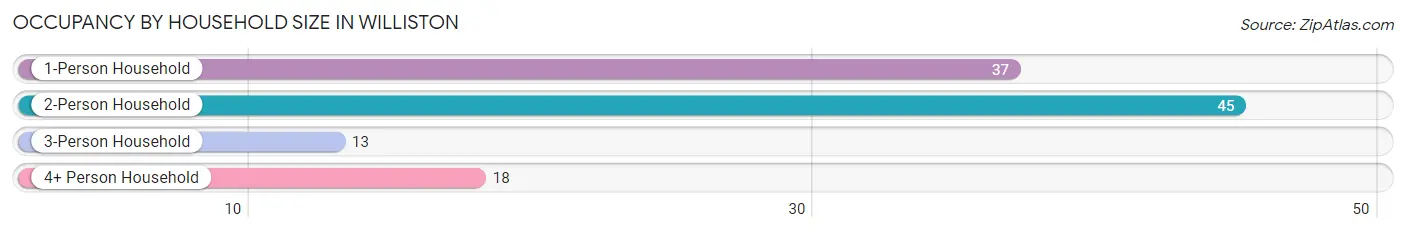
Occupancy by Household Size in Williston
| Household Size | # Housing Units | % Housing Units |
| 1-Person Household | 37 | 32.7% |
| 2-Person Household | 45 | 39.8% |
| 3-Person Household | 13 | 11.5% |
| 4+ Person Household | 18 | 15.9% |
| Total Housing Units | 113 | 100.0% |
Occupancy by Ownership by Household Size in Williston
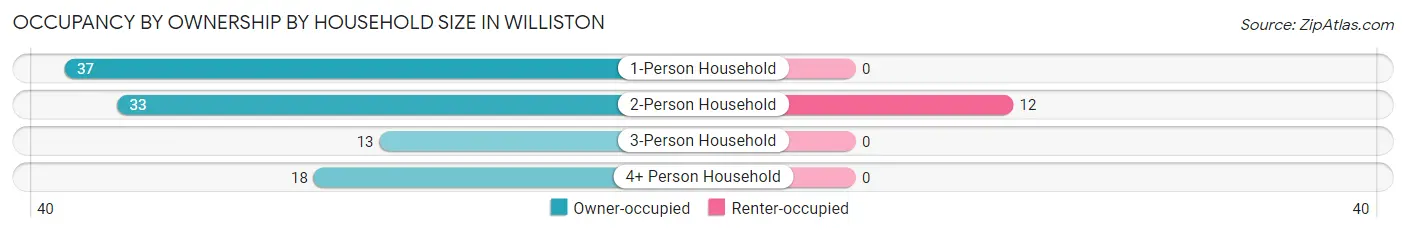
| Household Size | Owner-occupied | Renter-occupied |
| 1-Person Household | 37 (100.0%) | 0 (0.0%) |
| 2-Person Household | 33 (73.3%) | 12 (26.7%) |
| 3-Person Household | 13 (100.0%) | 0 (0.0%) |
| 4+ Person Household | 18 (100.0%) | 0 (0.0%) |
| Total Housing Units | 101 (89.4%) | 12 (10.6%) |
Occupancy by Educational Attainment in Williston
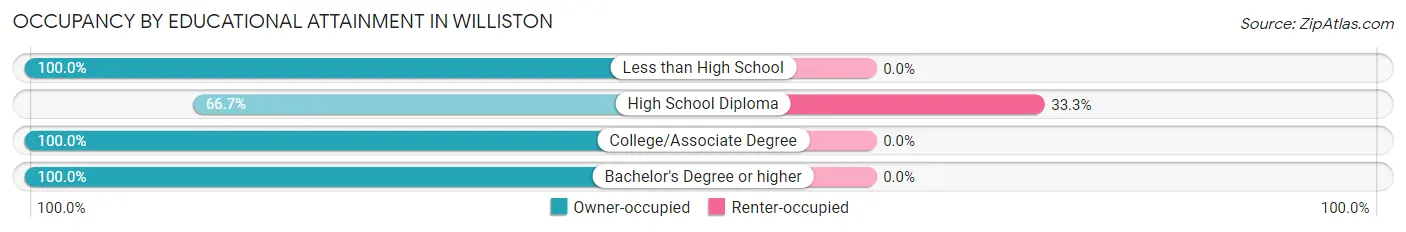
| Household Size | Owner-occupied | Renter-occupied |
| Less than High School | 10 (100.0%) | 0 (0.0%) |
| High School Diploma | 24 (66.7%) | 12 (33.3%) |
| College/Associate Degree | 45 (100.0%) | 0 (0.0%) |
| Bachelor's Degree or higher | 22 (100.0%) | 0 (0.0%) |
Occupancy by Age of Householder in Williston
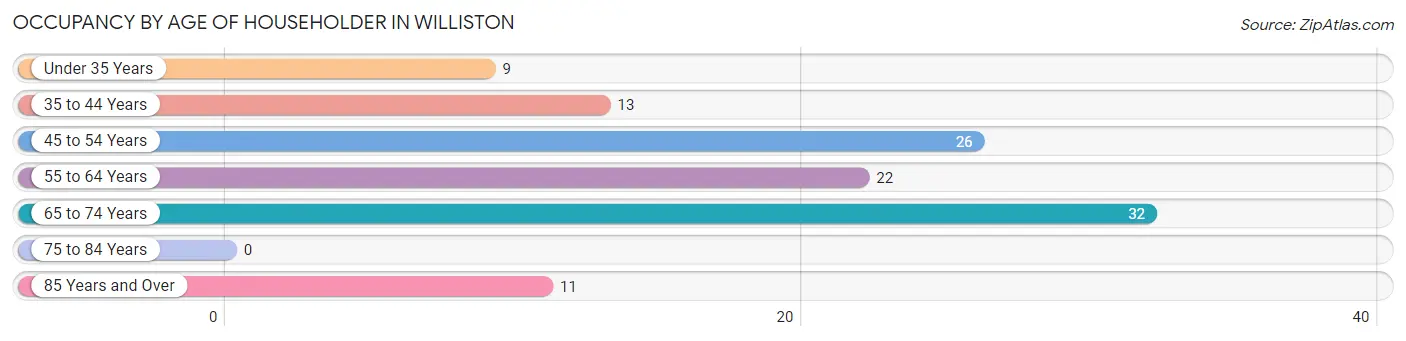
| Age Bracket | # Households | % Households |
| Under 35 Years | 9 | 8.0% |
| 35 to 44 Years | 13 | 11.5% |
| 45 to 54 Years | 26 | 23.0% |
| 55 to 64 Years | 22 | 19.5% |
| 65 to 74 Years | 32 | 28.3% |
| 75 to 84 Years | 0 | 0.0% |
| 85 Years and Over | 11 | 9.7% |
| Total | 113 | 100.0% |
Housing Finances in Williston
Median Income by Occupancy in Williston
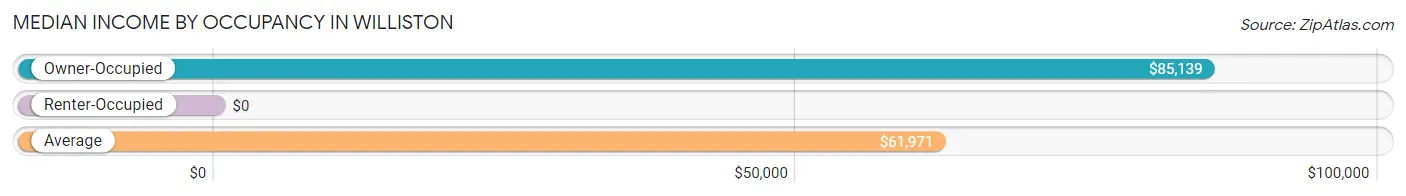
| Occupancy Type | # Households | Median Income |
| Owner-Occupied | 101 (89.4%) | $85,139 |
| Renter-Occupied | 12 (10.6%) | $0 |
| Average | 113 (100.0%) | $61,971 |
Occupancy by Householder Income Bracket in Williston
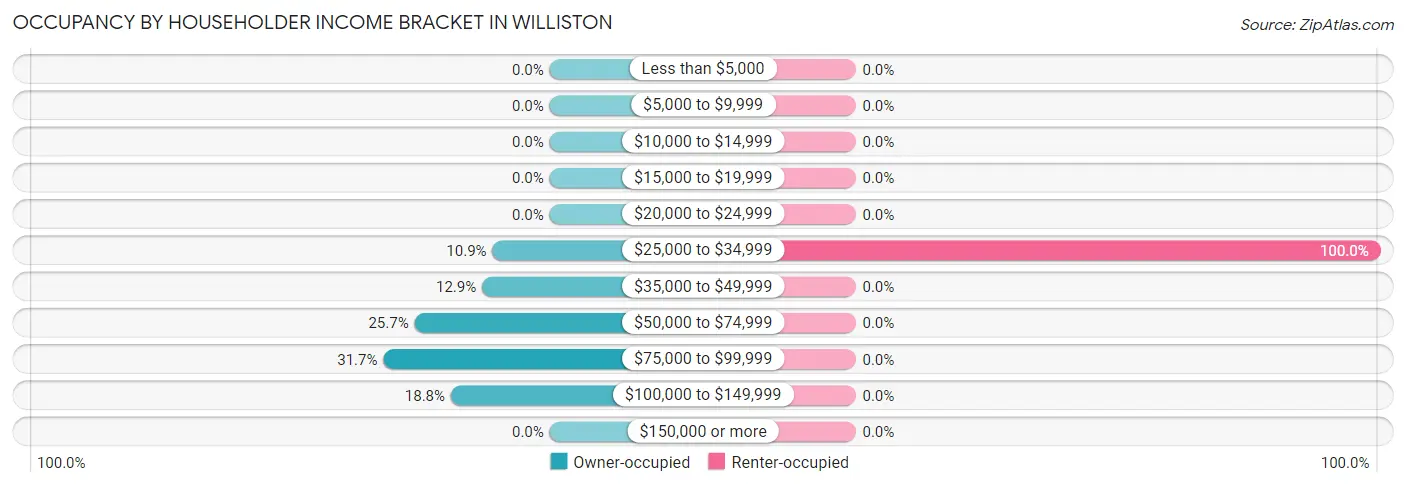
| Income Bracket | Owner-occupied | Renter-occupied |
| Less than $5,000 | 0 (0.0%) | 0 (0.0%) |
| $5,000 to $9,999 | 0 (0.0%) | 0 (0.0%) |
| $10,000 to $14,999 | 0 (0.0%) | 0 (0.0%) |
| $15,000 to $19,999 | 0 (0.0%) | 0 (0.0%) |
| $20,000 to $24,999 | 0 (0.0%) | 0 (0.0%) |
| $25,000 to $34,999 | 11 (10.9%) | 12 (100.0%) |
| $35,000 to $49,999 | 13 (12.9%) | 0 (0.0%) |
| $50,000 to $74,999 | 26 (25.7%) | 0 (0.0%) |
| $75,000 to $99,999 | 32 (31.7%) | 0 (0.0%) |
| $100,000 to $149,999 | 19 (18.8%) | 0 (0.0%) |
| $150,000 or more | 0 (0.0%) | 0 (0.0%) |
| Total | 101 (100.0%) | 12 (100.0%) |
Monthly Housing Cost Tiers in Williston
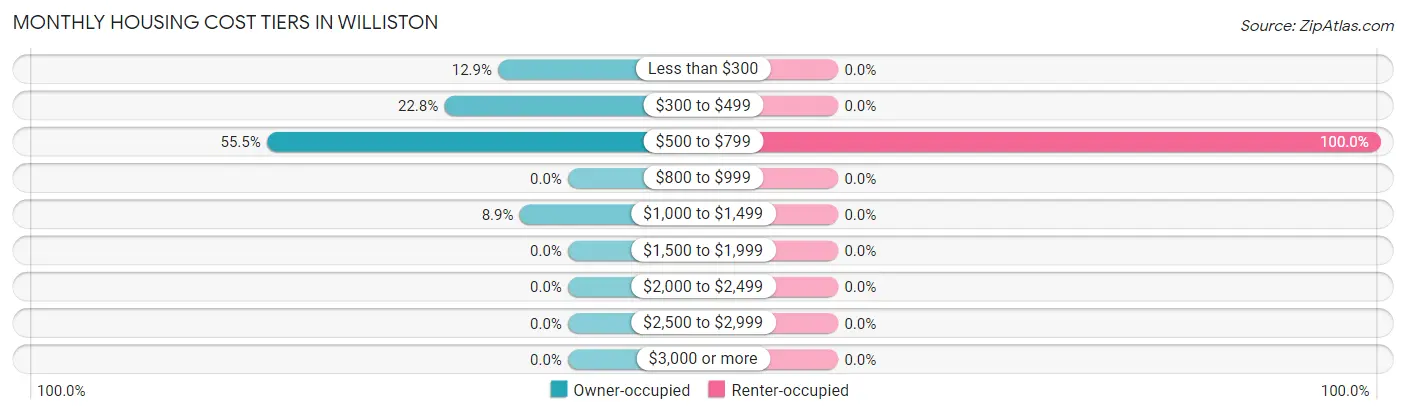
| Monthly Cost | Owner-occupied | Renter-occupied |
| Less than $300 | 13 (12.9%) | 0 (0.0%) |
| $300 to $499 | 23 (22.8%) | 0 (0.0%) |
| $500 to $799 | 56 (55.4%) | 12 (100.0%) |
| $800 to $999 | 0 (0.0%) | 0 (0.0%) |
| $1,000 to $1,499 | 9 (8.9%) | 0 (0.0%) |
| $1,500 to $1,999 | 0 (0.0%) | 0 (0.0%) |
| $2,000 to $2,499 | 0 (0.0%) | 0 (0.0%) |
| $2,500 to $2,999 | 0 (0.0%) | 0 (0.0%) |
| $3,000 or more | 0 (0.0%) | 0 (0.0%) |
| Total | 101 (100.0%) | 12 (100.0%) |
Physical Housing Characteristics in Williston
Housing Structures in Williston
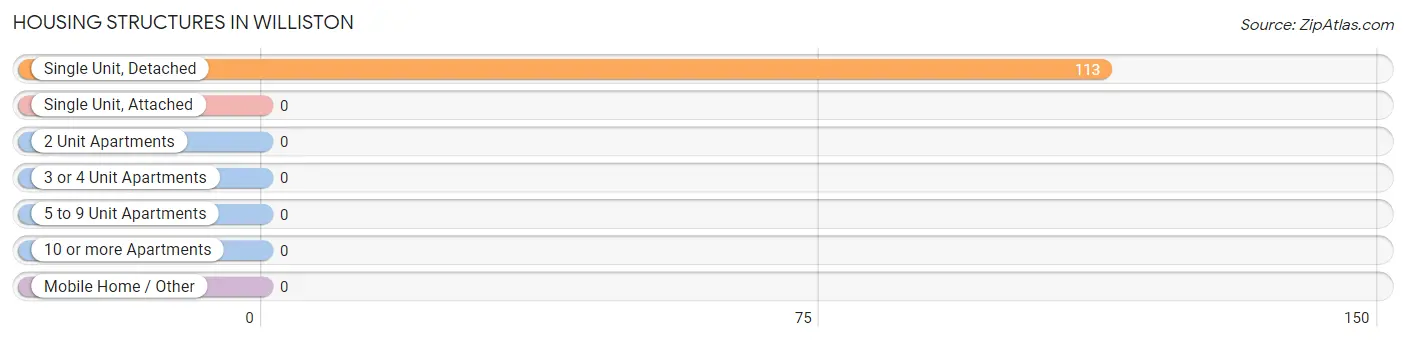
| Structure Type | # Housing Units | % Housing Units |
| Single Unit, Detached | 113 | 100.0% |
| Single Unit, Attached | 0 | 0.0% |
| 2 Unit Apartments | 0 | 0.0% |
| 3 or 4 Unit Apartments | 0 | 0.0% |
| 5 to 9 Unit Apartments | 0 | 0.0% |
| 10 or more Apartments | 0 | 0.0% |
| Mobile Home / Other | 0 | 0.0% |
| Total | 113 | 100.0% |
Housing Structures by Occupancy in Williston
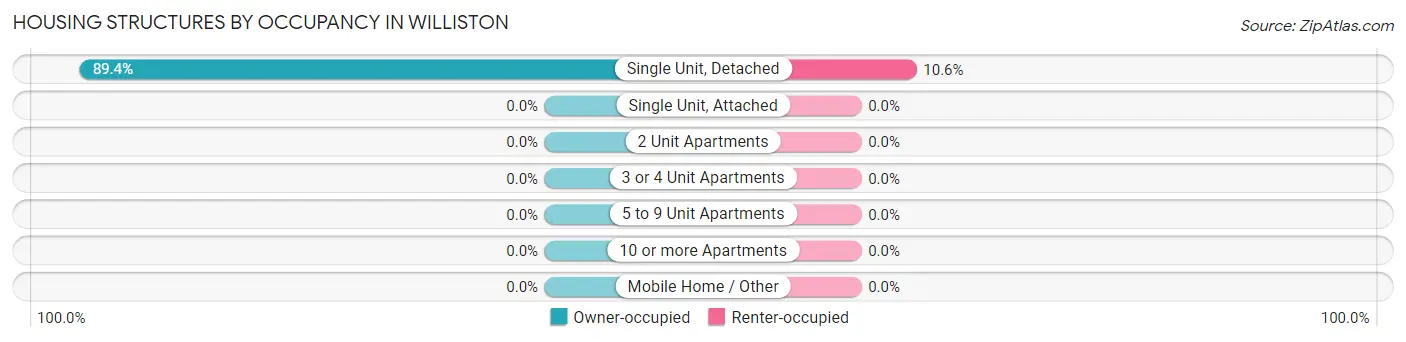
| Structure Type | Owner-occupied | Renter-occupied |
| Single Unit, Detached | 101 (89.4%) | 12 (10.6%) |
| Single Unit, Attached | 0 (0.0%) | 0 (0.0%) |
| 2 Unit Apartments | 0 (0.0%) | 0 (0.0%) |
| 3 or 4 Unit Apartments | 0 (0.0%) | 0 (0.0%) |
| 5 to 9 Unit Apartments | 0 (0.0%) | 0 (0.0%) |
| 10 or more Apartments | 0 (0.0%) | 0 (0.0%) |
| Mobile Home / Other | 0 (0.0%) | 0 (0.0%) |
| Total | 101 (89.4%) | 12 (10.6%) |
Housing Structures by Number of Rooms in Williston
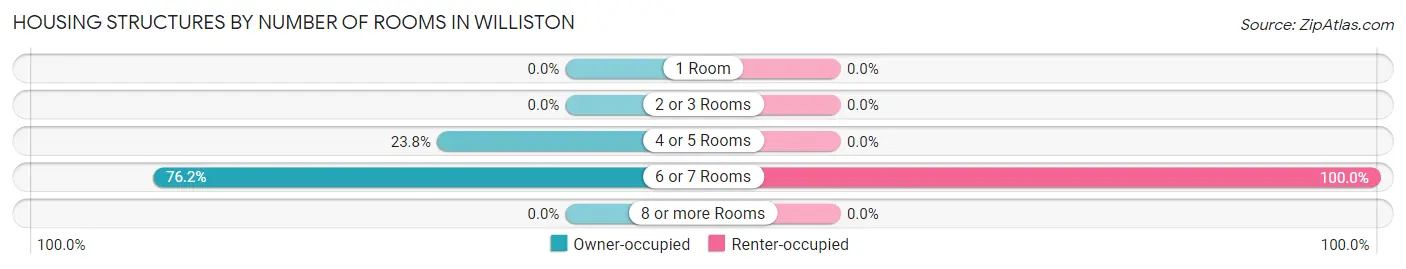
| Number of Rooms | Owner-occupied | Renter-occupied |
| 1 Room | 0 (0.0%) | 0 (0.0%) |
| 2 or 3 Rooms | 0 (0.0%) | 0 (0.0%) |
| 4 or 5 Rooms | 24 (23.8%) | 0 (0.0%) |
| 6 or 7 Rooms | 77 (76.2%) | 12 (100.0%) |
| 8 or more Rooms | 0 (0.0%) | 0 (0.0%) |
| Total | 101 (100.0%) | 12 (100.0%) |
Housing Structure by Heating Type in Williston
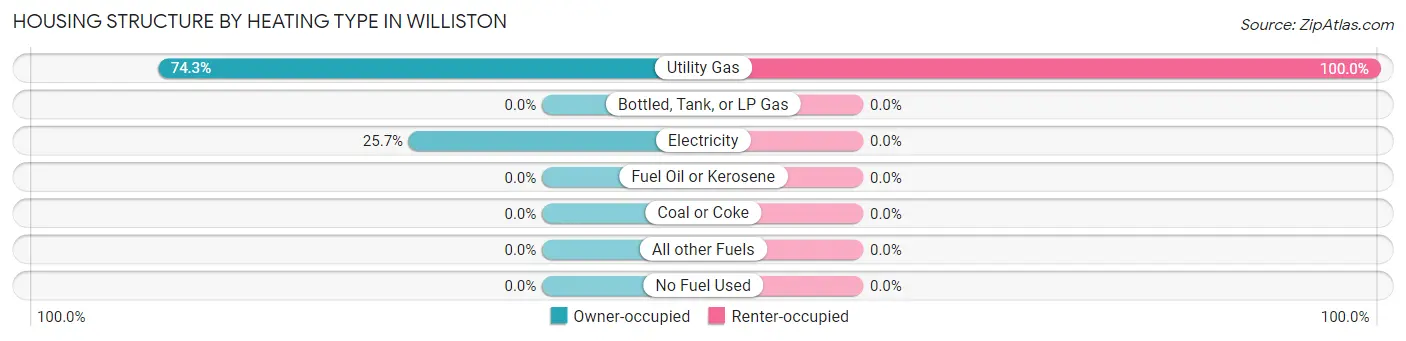
| Heating Type | Owner-occupied | Renter-occupied |
| Utility Gas | 75 (74.3%) | 12 (100.0%) |
| Bottled, Tank, or LP Gas | 0 (0.0%) | 0 (0.0%) |
| Electricity | 26 (25.7%) | 0 (0.0%) |
| Fuel Oil or Kerosene | 0 (0.0%) | 0 (0.0%) |
| Coal or Coke | 0 (0.0%) | 0 (0.0%) |
| All other Fuels | 0 (0.0%) | 0 (0.0%) |
| No Fuel Used | 0 (0.0%) | 0 (0.0%) |
| Total | 101 (100.0%) | 12 (100.0%) |
Household Vehicle Usage in Williston
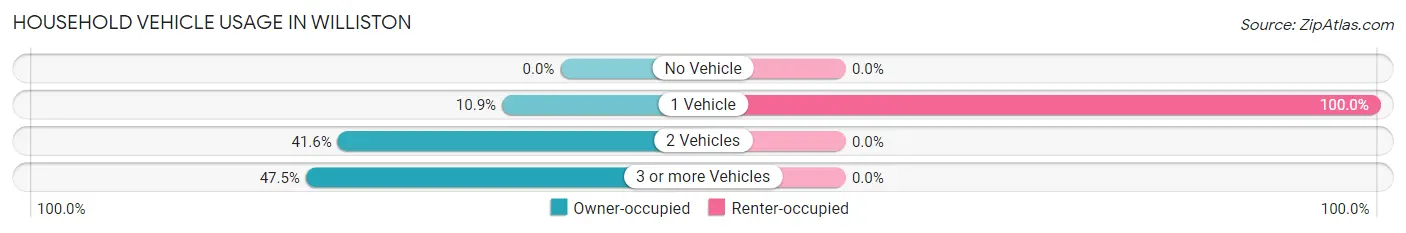
| Vehicles per Household | Owner-occupied | Renter-occupied |
| No Vehicle | 0 (0.0%) | 0 (0.0%) |
| 1 Vehicle | 11 (10.9%) | 12 (100.0%) |
| 2 Vehicles | 42 (41.6%) | 0 (0.0%) |
| 3 or more Vehicles | 48 (47.5%) | 0 (0.0%) |
| Total | 101 (100.0%) | 12 (100.0%) |
Real Estate & Mortgages in Williston
Real Estate and Mortgage Overview in Williston
| Characteristic | Without Mortgage | With Mortgage |
| Housing Units | 56 | 45 |
| Median Property Value | $140,600 | $0 |
| Median Household Income | $90,769 | $0 |
| Monthly Housing Costs | $465 | $0 |
| Real Estate Taxes | $1,654 | $0 |
Property Value by Mortgage Status in Williston
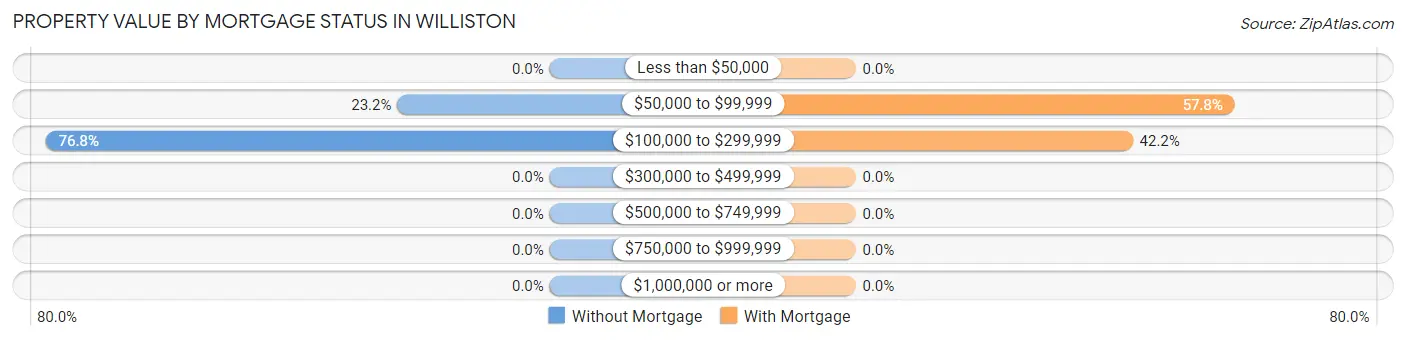
| Property Value | Without Mortgage | With Mortgage |
| Less than $50,000 | 0 (0.0%) | 0 (0.0%) |
| $50,000 to $99,999 | 13 (23.2%) | 26 (57.8%) |
| $100,000 to $299,999 | 43 (76.8%) | 19 (42.2%) |
| $300,000 to $499,999 | 0 (0.0%) | 0 (0.0%) |
| $500,000 to $749,999 | 0 (0.0%) | 0 (0.0%) |
| $750,000 to $999,999 | 0 (0.0%) | 0 (0.0%) |
| $1,000,000 or more | 0 (0.0%) | 0 (0.0%) |
| Total | 56 (100.0%) | 45 (100.0%) |
Household Income by Mortgage Status in Williston
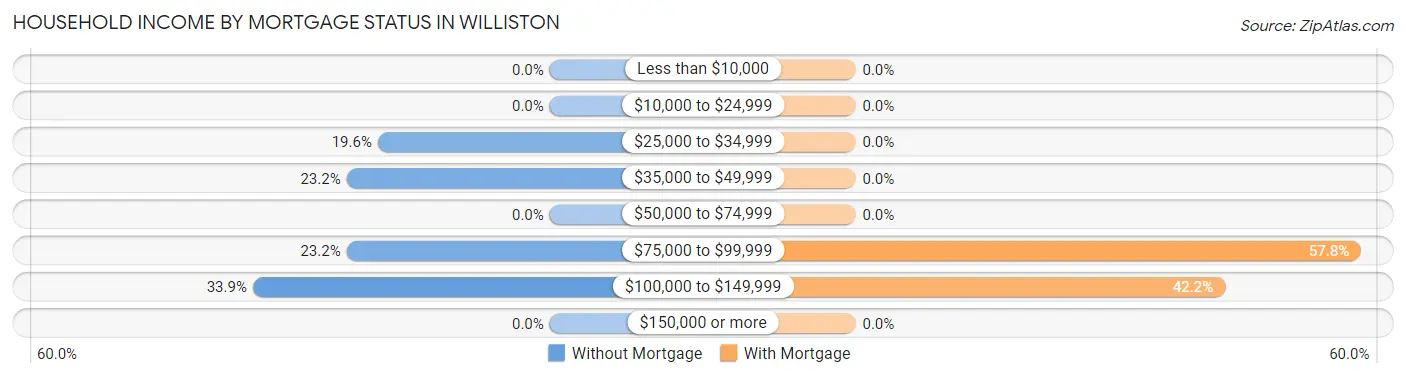
| Household Income | Without Mortgage | With Mortgage |
| Less than $10,000 | 0 (0.0%) | 0 (0.0%) |
| $10,000 to $24,999 | 0 (0.0%) | 0 (0.0%) |
| $25,000 to $34,999 | 11 (19.6%) | 0 (0.0%) |
| $35,000 to $49,999 | 13 (23.2%) | 0 (0.0%) |
| $50,000 to $74,999 | 0 (0.0%) | 0 (0.0%) |
| $75,000 to $99,999 | 13 (23.2%) | 26 (57.8%) |
| $100,000 to $149,999 | 19 (33.9%) | 19 (42.2%) |
| $150,000 or more | 0 (0.0%) | 0 (0.0%) |
| Total | 56 (100.0%) | 45 (100.0%) |
Property Value to Household Income Ratio in Williston
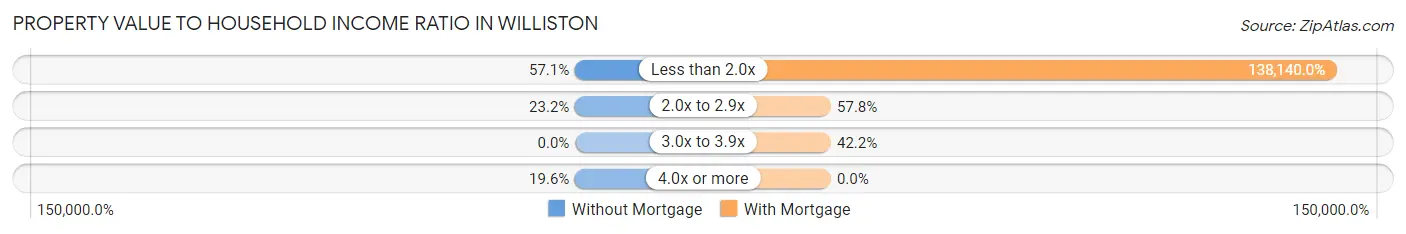
| Value-to-Income Ratio | Without Mortgage | With Mortgage |
| Less than 2.0x | 32 (57.1%) | 62,163 (138,140.0%) |
| 2.0x to 2.9x | 13 (23.2%) | 26 (57.8%) |
| 3.0x to 3.9x | 0 (0.0%) | 19 (42.2%) |
| 4.0x or more | 11 (19.6%) | 0 (0.0%) |
| Total | 56 (100.0%) | 45 (100.0%) |
Real Estate Taxes by Mortgage Status in Williston
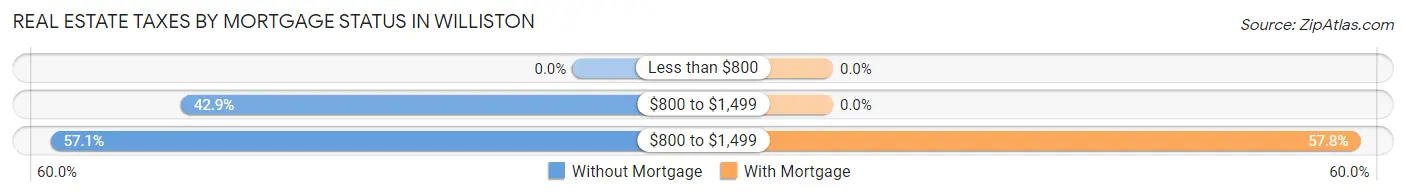
| Property Taxes | Without Mortgage | With Mortgage |
| Less than $800 | 0 (0.0%) | 0 (0.0%) |
| $800 to $1,499 | 24 (42.9%) | 0 (0.0%) |
| $800 to $1,499 | 32 (57.1%) | 26 (57.8%) |
| Total | 56 (100.0%) | 45 (100.0%) |
Health & Disability in Williston
Health Insurance Coverage by Age in Williston
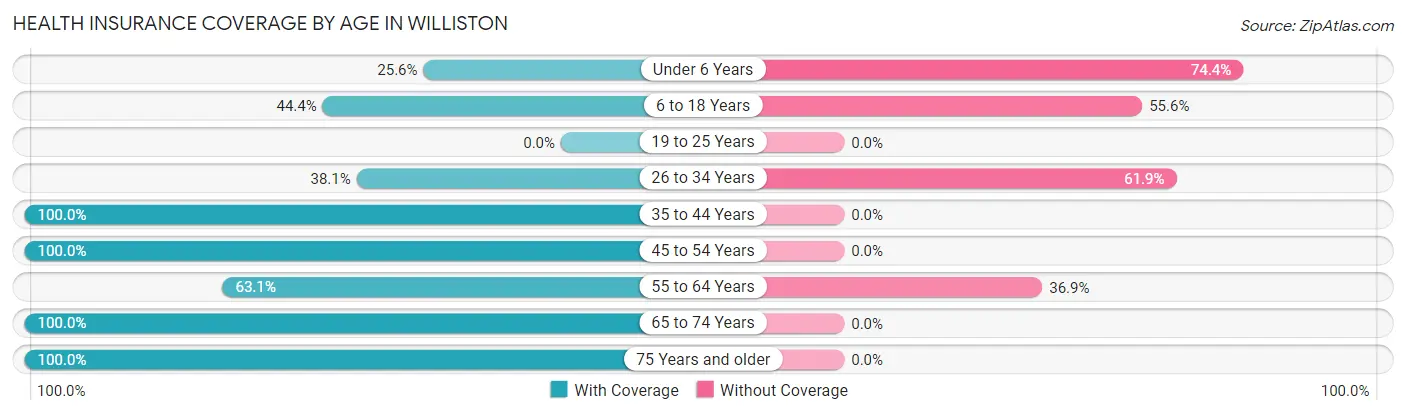
| Age Bracket | With Coverage | Without Coverage |
| Under 6 Years | 10 (25.6%) | 29 (74.4%) |
| 6 to 18 Years | 8 (44.4%) | 10 (55.6%) |
| 19 to 25 Years | 0 (0.0%) | 0 (0.0%) |
| 26 to 34 Years | 8 (38.1%) | 13 (61.9%) |
| 35 to 44 Years | 25 (100.0%) | 0 (0.0%) |
| 45 to 54 Years | 26 (100.0%) | 0 (0.0%) |
| 55 to 64 Years | 41 (63.1%) | 24 (36.9%) |
| 65 to 74 Years | 32 (100.0%) | 0 (0.0%) |
| 75 Years and older | 30 (100.0%) | 0 (0.0%) |
| Total | 180 (70.3%) | 76 (29.7%) |
Health Insurance Coverage by Citizenship Status in Williston
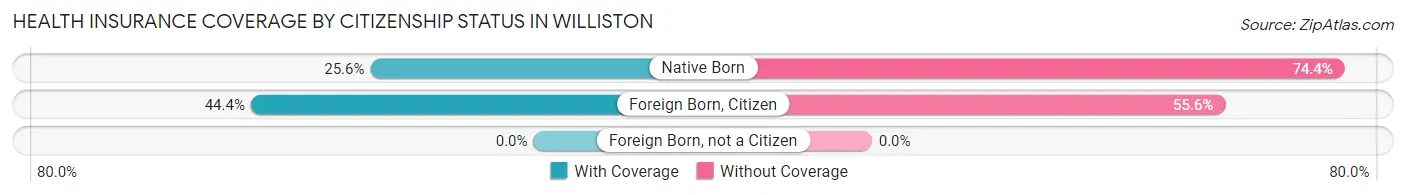
| Citizenship Status | With Coverage | Without Coverage |
| Native Born | 10 (25.6%) | 29 (74.4%) |
| Foreign Born, Citizen | 8 (44.4%) | 10 (55.6%) |
| Foreign Born, not a Citizen | 0 (0.0%) | 0 (0.0%) |
Health Insurance Coverage by Household Income in Williston
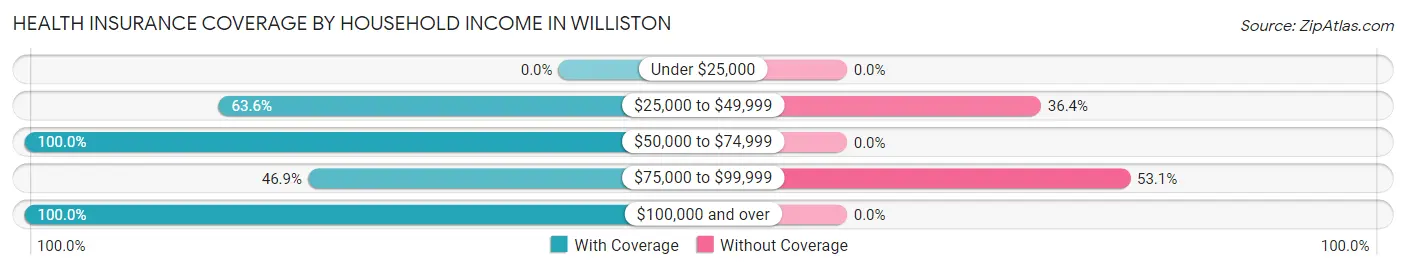
| Household Income | With Coverage | Without Coverage |
| Under $25,000 | 0 (0.0%) | 0 (0.0%) |
| $25,000 to $49,999 | 42 (63.6%) | 24 (36.4%) |
| $50,000 to $74,999 | 26 (100.0%) | 0 (0.0%) |
| $75,000 to $99,999 | 46 (46.9%) | 52 (53.1%) |
| $100,000 and over | 66 (100.0%) | 0 (0.0%) |
Public vs Private Health Insurance Coverage by Age in Williston
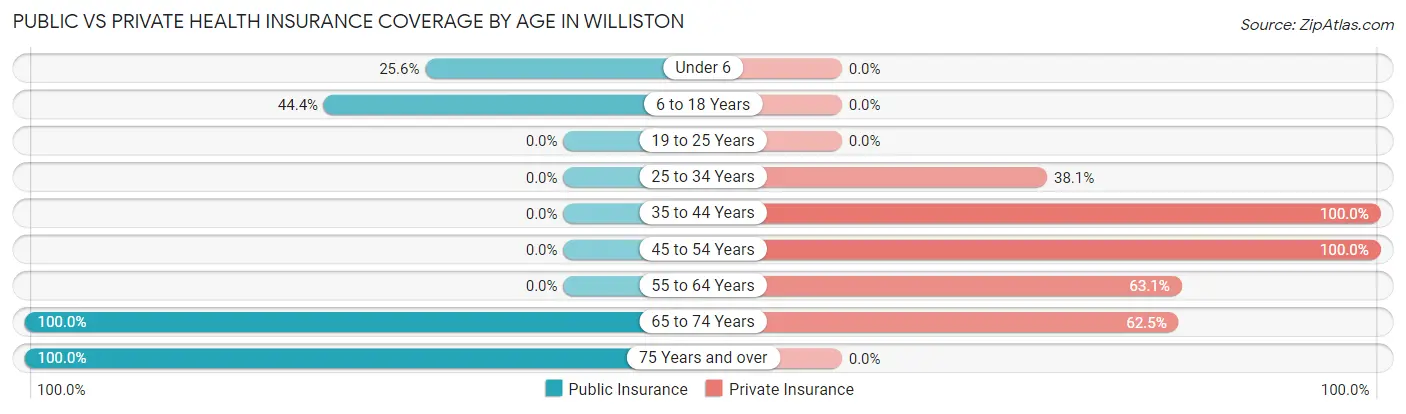
| Age Bracket | Public Insurance | Private Insurance |
| Under 6 | 10 (25.6%) | 0 (0.0%) |
| 6 to 18 Years | 8 (44.4%) | 0 (0.0%) |
| 19 to 25 Years | 0 (0.0%) | 0 (0.0%) |
| 25 to 34 Years | 0 (0.0%) | 8 (38.1%) |
| 35 to 44 Years | 0 (0.0%) | 25 (100.0%) |
| 45 to 54 Years | 0 (0.0%) | 26 (100.0%) |
| 55 to 64 Years | 0 (0.0%) | 41 (63.1%) |
| 65 to 74 Years | 32 (100.0%) | 20 (62.5%) |
| 75 Years and over | 30 (100.0%) | 0 (0.0%) |
| Total | 80 (31.2%) | 120 (46.9%) |
Disability Status by Sex by Age in Williston
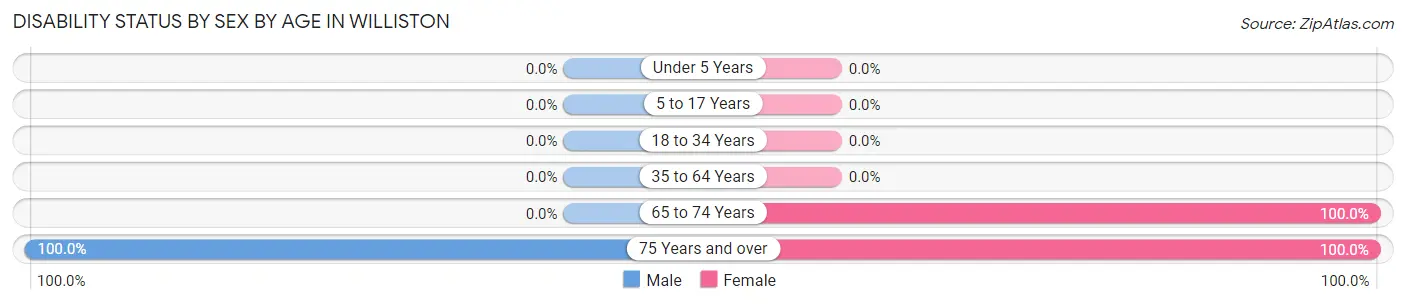
| Age Bracket | Male | Female |
| Under 5 Years | 0 (0.0%) | 0 (0.0%) |
| 5 to 17 Years | 0 (0.0%) | 0 (0.0%) |
| 18 to 34 Years | 0 (0.0%) | 0 (0.0%) |
| 35 to 64 Years | 0 (0.0%) | 0 (0.0%) |
| 65 to 74 Years | 0 (0.0%) | 12 (100.0%) |
| 75 Years and over | 11 (100.0%) | 19 (100.0%) |
Disability Class by Sex by Age in Williston
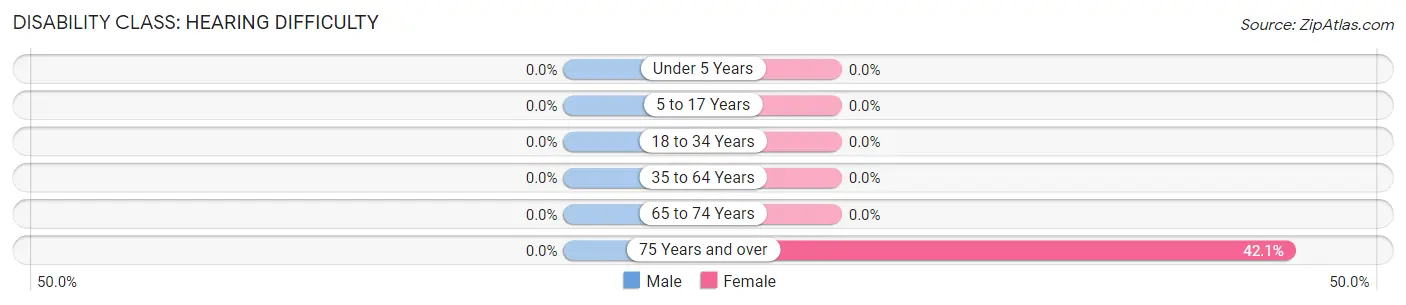
Disability Class: Hearing Difficulty
| Age Bracket | Male | Female |
| Under 5 Years | 0 (0.0%) | 0 (0.0%) |
| 5 to 17 Years | 0 (0.0%) | 0 (0.0%) |
| 18 to 34 Years | 0 (0.0%) | 0 (0.0%) |
| 35 to 64 Years | 0 (0.0%) | 0 (0.0%) |
| 65 to 74 Years | 0 (0.0%) | 0 (0.0%) |
| 75 Years and over | 0 (0.0%) | 8 (42.1%) |
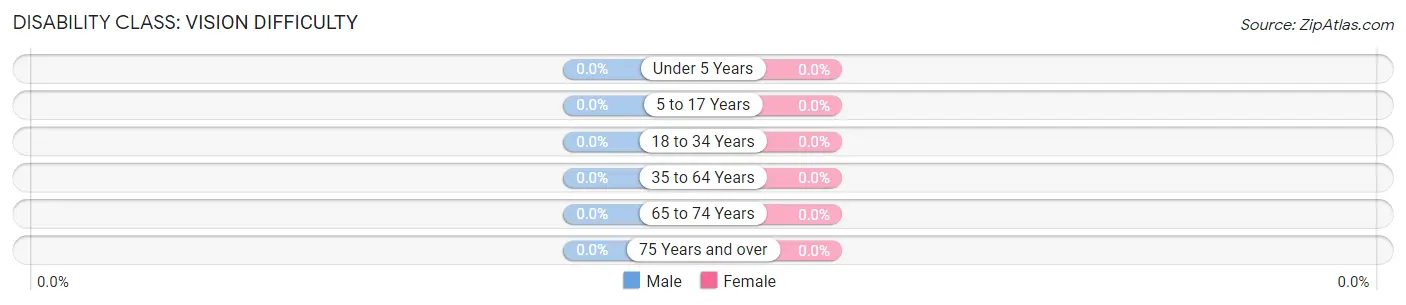
Disability Class: Vision Difficulty
| Age Bracket | Male | Female |
| Under 5 Years | 0 (0.0%) | 0 (0.0%) |
| 5 to 17 Years | 0 (0.0%) | 0 (0.0%) |
| 18 to 34 Years | 0 (0.0%) | 0 (0.0%) |
| 35 to 64 Years | 0 (0.0%) | 0 (0.0%) |
| 65 to 74 Years | 0 (0.0%) | 0 (0.0%) |
| 75 Years and over | 0 (0.0%) | 0 (0.0%) |
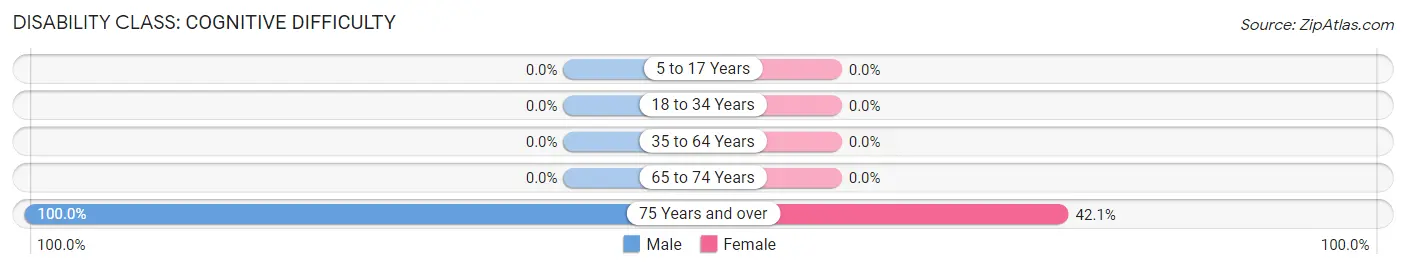
Disability Class: Cognitive Difficulty
| Age Bracket | Male | Female |
| 5 to 17 Years | 0 (0.0%) | 0 (0.0%) |
| 18 to 34 Years | 0 (0.0%) | 0 (0.0%) |
| 35 to 64 Years | 0 (0.0%) | 0 (0.0%) |
| 65 to 74 Years | 0 (0.0%) | 0 (0.0%) |
| 75 Years and over | 11 (100.0%) | 8 (42.1%) |
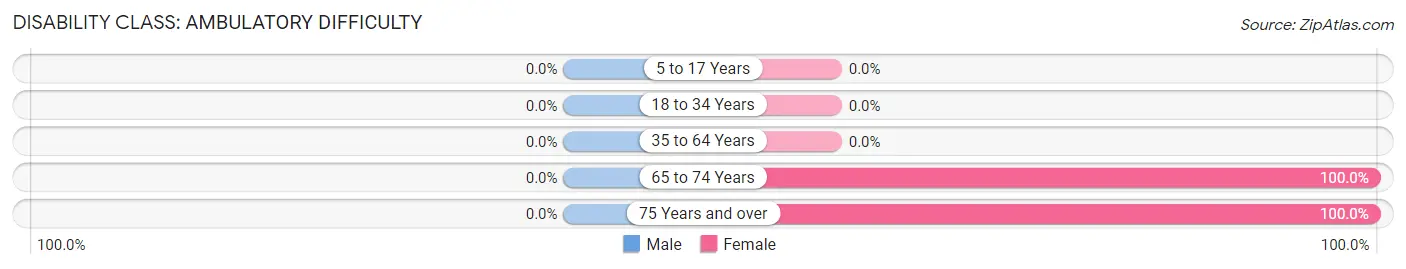
Disability Class: Ambulatory Difficulty
| Age Bracket | Male | Female |
| 5 to 17 Years | 0 (0.0%) | 0 (0.0%) |
| 18 to 34 Years | 0 (0.0%) | 0 (0.0%) |
| 35 to 64 Years | 0 (0.0%) | 0 (0.0%) |
| 65 to 74 Years | 0 (0.0%) | 12 (100.0%) |
| 75 Years and over | 0 (0.0%) | 19 (100.0%) |
Disability Class: Self-Care Difficulty
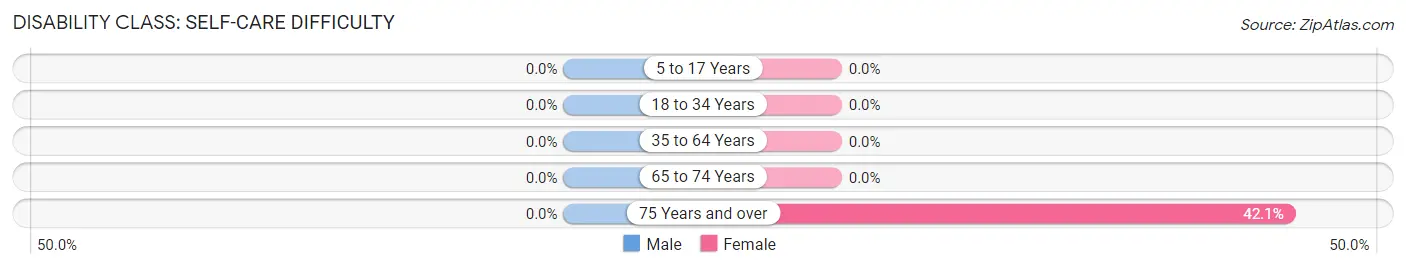
| Age Bracket | Male | Female |
| 5 to 17 Years | 0 (0.0%) | 0 (0.0%) |
| 18 to 34 Years | 0 (0.0%) | 0 (0.0%) |
| 35 to 64 Years | 0 (0.0%) | 0 (0.0%) |
| 65 to 74 Years | 0 (0.0%) | 0 (0.0%) |
| 75 Years and over | 0 (0.0%) | 8 (42.1%) |
Technology Access in Williston
Computing Device Access in Williston
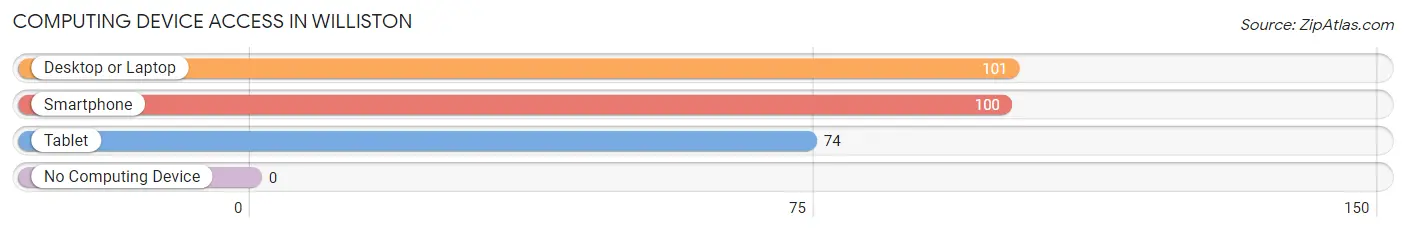
| Device Type | # Households | % Households |
| Desktop or Laptop | 101 | 89.4% |
| Smartphone | 100 | 88.5% |
| Tablet | 74 | 65.5% |
| No Computing Device | 0 | 0.0% |
| Total | 113 | 100.0% |
Internet Access in Williston
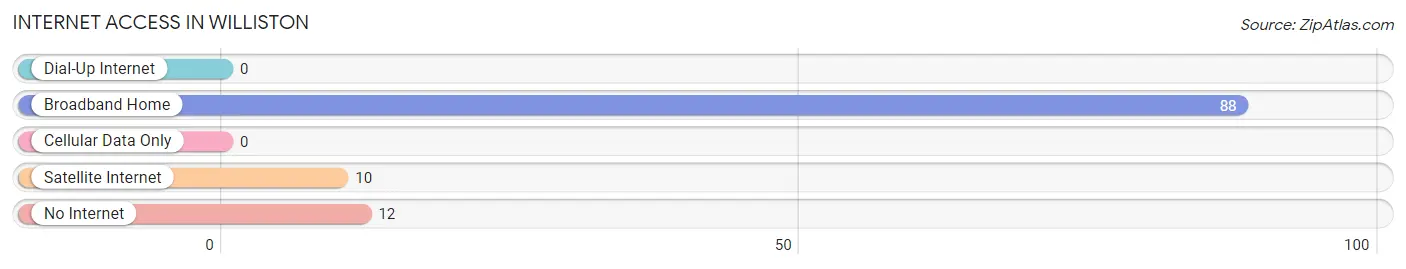
| Internet Type | # Households | % Households |
| Dial-Up Internet | 0 | 0.0% |
| Broadband Home | 88 | 77.9% |
| Cellular Data Only | 0 | 0.0% |
| Satellite Internet | 10 | 8.8% |
| No Internet | 12 | 10.6% |
| Total | 113 | 100.0% |
Williston Summary
Williston, Ohio is a small village located in the northwest corner of Williams County, Ohio. It is situated on the banks of the Maumee River, and is part of the Toledo Metropolitan Statistical Area. The village has a population of approximately 1,000 people, and is home to a variety of businesses, including a grocery store, a hardware store, a bank, and a post office.
History
Williston was founded in 1837 by a group of settlers from New York. The village was named after the first settler, William Williston. The settlers were attracted to the area due to its fertile soil and abundant natural resources. The village quickly grew and by 1845, it had a population of over 500 people.
In the late 19th century, Williston was a thriving agricultural community. The village was home to several grain mills, a sawmill, a grist mill, and a woolen mill. The village also had a variety of stores, including a general store, a drug store, and a hardware store.
In the early 20th century, Williston experienced a period of decline. The village’s population decreased as people moved away in search of better economic opportunities. The decline was exacerbated by the Great Depression, which caused many businesses to close.
Geography
Williston is located in the northwest corner of Williams County, Ohio. The village is situated on the banks of the Maumee River, and is part of the Toledo Metropolitan Statistical Area. The village is located approximately 25 miles west of Toledo and 40 miles east of Fort Wayne, Indiana.
The village is surrounded by rolling hills and farmland. The terrain is mostly flat, with some areas of higher elevation. The village is located in a humid continental climate zone, with hot summers and cold winters.
Economy
Williston’s economy is largely based on agriculture. The village is home to several farms, which produce a variety of crops, including corn, soybeans, wheat, and hay. The village also has a variety of businesses, including a grocery store, a hardware store, a bank, and a post office.
The village is also home to a variety of manufacturing businesses, including a furniture factory, a metal fabrication plant, and a plastics factory. The village is also home to a variety of service businesses, including a gas station, a restaurant, and a barber shop.
Demographics
As of the 2010 census, Williston had a population of 1,000 people. The village is predominantly white, with a small African American population. The median household income is $37,000, and the median home value is $90,000. The village has a high school graduation rate of 85%, and a poverty rate of 15%.
Common Questions
What is Per Capita Income in Williston?
Per Capita income in Williston is $26,552.
What is the Median Family Income in Williston?
Median Family Income in Williston is $90,769.
What is the Median Household income in Williston?
Median Household Income in Williston is $61,971.
What is Income or Wage Gap in Williston?
Income or Wage Gap in Williston is 41.3%.
Women in Williston earn 58.7 cents for every dollar earned by a man.
What is Inequality or Gini Index in Williston?
Inequality or Gini Index in Williston is 0.26.
What is the Total Population of Williston?
Total Population of Williston is 356.
What is the Total Male Population of Williston?
Total Male Population of Williston is 178.
What is the Total Female Population of Williston?
Total Female Population of Williston is 178.
What is the Ratio of Males per 100 Females in Williston?
There are 100.00 Males per 100 Females in Williston.
What is the Ratio of Females per 100 Males in Williston?
There are 100.00 Females per 100 Males in Williston.
What is the Median Population Age in Williston?
Median Population Age in Williston is 63.4 Years.
What is the Average Family Size in Williston
Average Family Size in Williston is 2.9 People.
What is the Average Household Size in Williston
Average Household Size in Williston is 2.3 People.
How Large is the Labor Force in Williston?
There are 92 People in the Labor Forcein in Williston.
What is the Percentage of People in the Labor Force in Williston?
30.8% of People are in the Labor Force in Williston.