Richmond, OH Map & Demographics
Richmond Map
Richmond Overview
$31,168
PER CAPITA INCOME
$80,625
AVG FAMILY INCOME
$56,667
AVG HOUSEHOLD INCOME
43.5%
WAGE / INCOME GAP [ % ]
56.5¢/ $1
WAGE / INCOME GAP [ $ ]
0.38
INEQUALITY / GINI INDEX
555
TOTAL POPULATION
243
MALE POPULATION
312
FEMALE POPULATION
77.88
MALES / 100 FEMALES
128.40
FEMALES / 100 MALES
52.2
MEDIAN AGE
2.9
AVG FAMILY SIZE
2.3
AVG HOUSEHOLD SIZE
252
LABOR FORCE [ PEOPLE ]
53.6%
PERCENT IN LABOR FORCE
2.4%
UNEMPLOYMENT RATE
Richmond Zip Codes
Richmond Area Codes
Income in Richmond
Income Overview in Richmond
Per Capita Income in Richmond is $31,168, while median incomes of families and households are $80,625 and $56,667 respectively.
| Characteristic | Number | Measure |
| Per Capita Income | 555 | $31,168 |
| Median Family Income | 160 | $80,625 |
| Mean Family Income | 160 | $83,509 |
| Median Household Income | 240 | $56,667 |
| Mean Household Income | 240 | $70,620 |
| Income Deficit | 160 | $0 |
| Wage / Income Gap (%) | 555 | 43.51% |
| Wage / Income Gap ($) | 555 | 56.49¢ per $1 |
| Gini / Inequality Index | 555 | 0.38 |
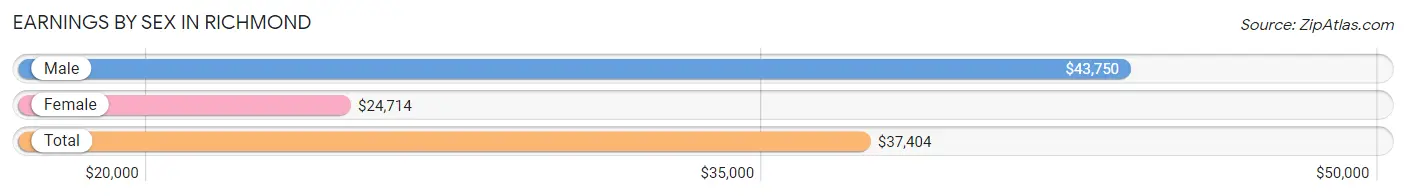
Earnings by Sex in Richmond
Average Earnings in Richmond are $37,404, $43,750 for men and $24,714 for women, a difference of 43.5%.
| Sex | Number | Average Earnings |
| Male | 123 (48.2%) | $43,750 |
| Female | 132 (51.8%) | $24,714 |
| Total | 255 (100.0%) | $37,404 |
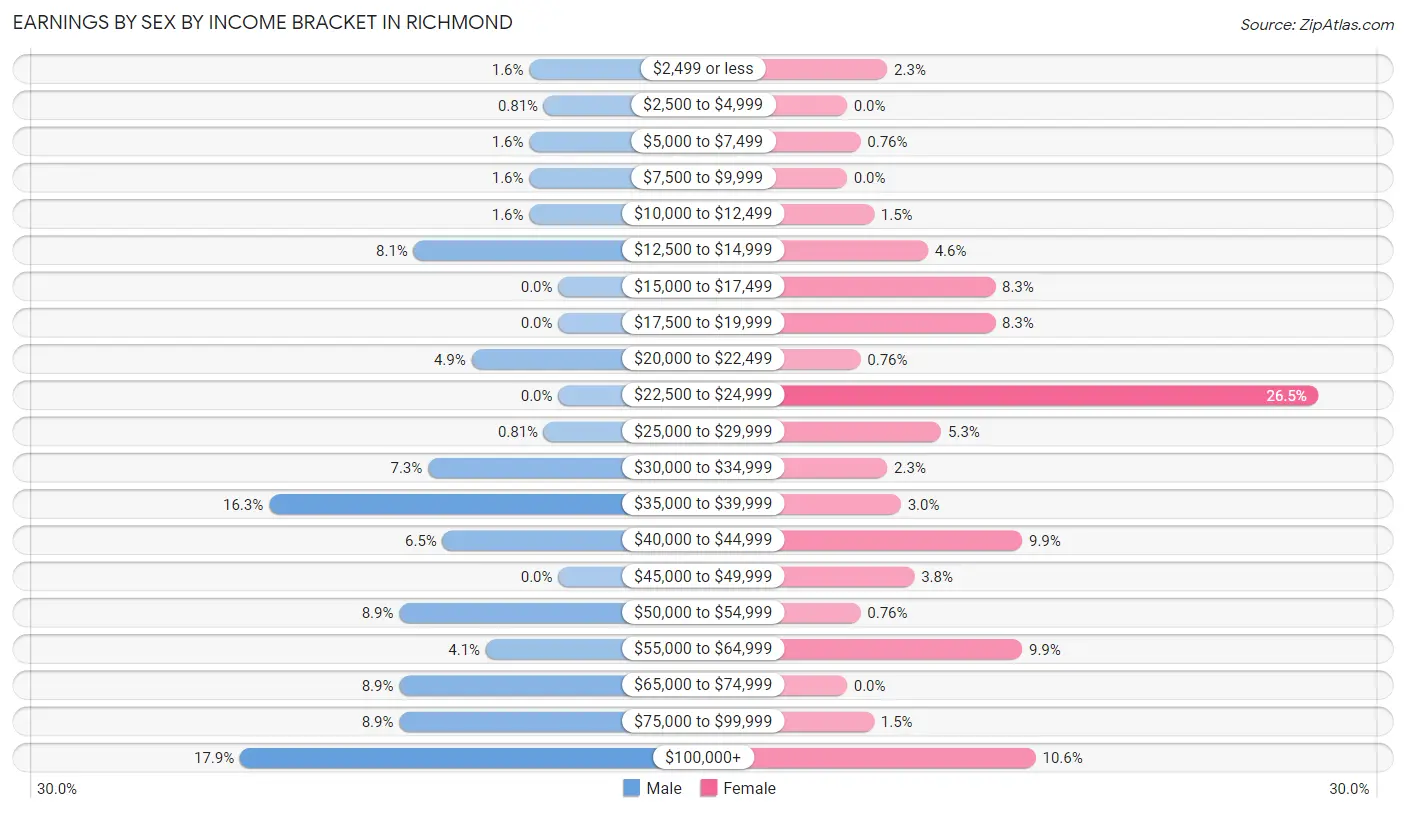
Earnings by Sex by Income Bracket in Richmond
The most common earnings brackets in Richmond are $100,000+ for men (22 | 17.9%) and $22,500 to $24,999 for women (35 | 26.5%).
| Income | Male | Female |
| $2,499 or less | 2 (1.6%) | 3 (2.3%) |
| $2,500 to $4,999 | 1 (0.8%) | 0 (0.0%) |
| $5,000 to $7,499 | 2 (1.6%) | 1 (0.8%) |
| $7,500 to $9,999 | 2 (1.6%) | 0 (0.0%) |
| $10,000 to $12,499 | 2 (1.6%) | 2 (1.5%) |
| $12,500 to $14,999 | 10 (8.1%) | 6 (4.5%) |
| $15,000 to $17,499 | 0 (0.0%) | 11 (8.3%) |
| $17,500 to $19,999 | 0 (0.0%) | 11 (8.3%) |
| $20,000 to $22,499 | 6 (4.9%) | 1 (0.8%) |
| $22,500 to $24,999 | 0 (0.0%) | 35 (26.5%) |
| $25,000 to $29,999 | 1 (0.8%) | 7 (5.3%) |
| $30,000 to $34,999 | 9 (7.3%) | 3 (2.3%) |
| $35,000 to $39,999 | 20 (16.3%) | 4 (3.0%) |
| $40,000 to $44,999 | 8 (6.5%) | 13 (9.9%) |
| $45,000 to $49,999 | 0 (0.0%) | 5 (3.8%) |
| $50,000 to $54,999 | 11 (8.9%) | 1 (0.8%) |
| $55,000 to $64,999 | 5 (4.1%) | 13 (9.9%) |
| $65,000 to $74,999 | 11 (8.9%) | 0 (0.0%) |
| $75,000 to $99,999 | 11 (8.9%) | 2 (1.5%) |
| $100,000+ | 22 (17.9%) | 14 (10.6%) |
| Total | 123 (100.0%) | 132 (100.0%) |
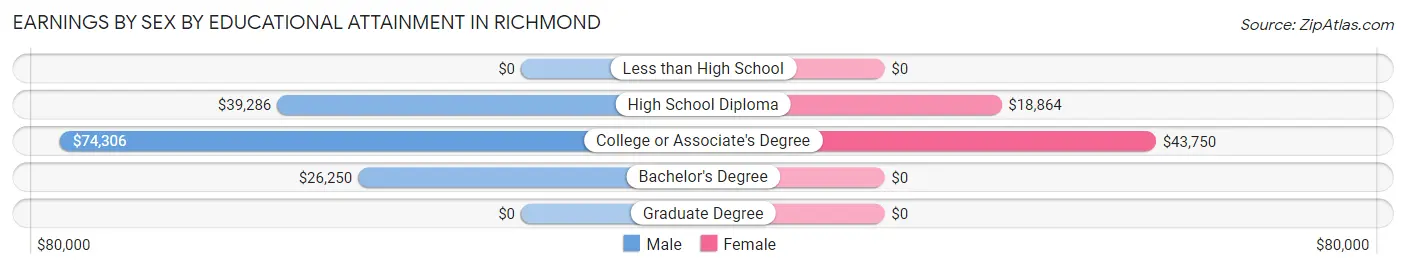
Earnings by Sex by Educational Attainment in Richmond
Average earnings in Richmond are $52,083 for men and $42,500 for women, a difference of 18.4%. Men with an educational attainment of college or associate's degree enjoy the highest average annual earnings of $74,306, while those with bachelor's degree education earn the least with $26,250. Women with an educational attainment of college or associate's degree earn the most with the average annual earnings of $43,750, while those with high school diploma education have the smallest earnings of $18,864.
| Educational Attainment | Male Income | Female Income |
| Less than High School | - | - |
| High School Diploma | $39,286 | $18,864 |
| College or Associate's Degree | $74,306 | $43,750 |
| Bachelor's Degree | $26,250 | $0 |
| Graduate Degree | - | - |
| Total | $52,083 | $42,500 |
Family Income in Richmond
Family Income Brackets in Richmond
According to the Richmond family income data, there are 47 families falling into the $75,000 to $99,999 income range, which is the most common income bracket and makes up 29.4% of all families.
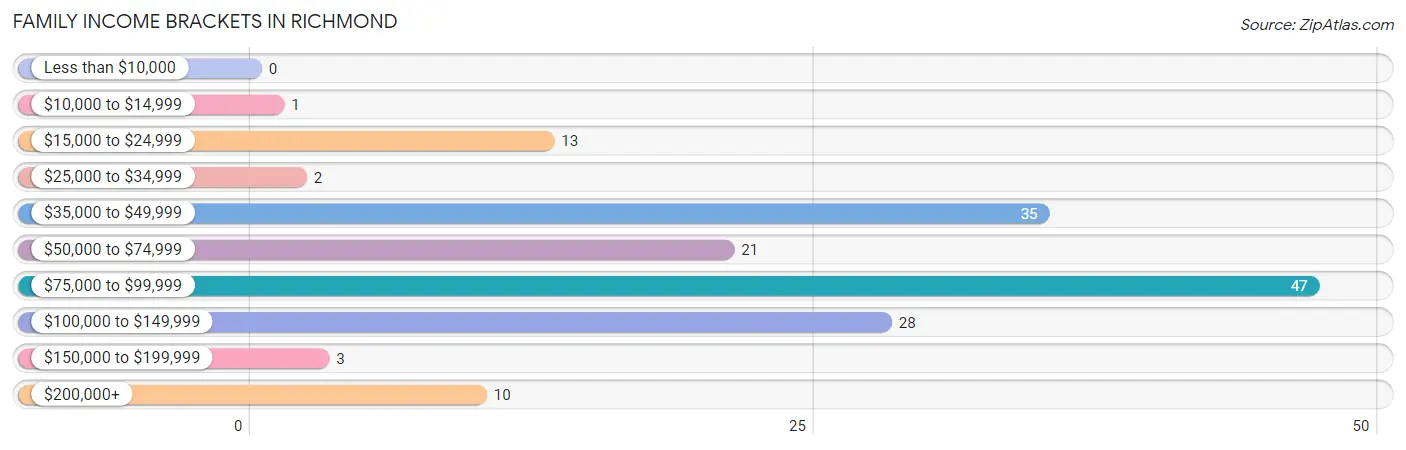
| Income Bracket | # Families | % Families |
| Less than $10,000 | 0 | 0.0% |
| $10,000 to $14,999 | 1 | 0.6% |
| $15,000 to $24,999 | 13 | 8.1% |
| $25,000 to $34,999 | 2 | 1.3% |
| $35,000 to $49,999 | 35 | 21.9% |
| $50,000 to $74,999 | 21 | 13.1% |
| $75,000 to $99,999 | 47 | 29.4% |
| $100,000 to $149,999 | 28 | 17.5% |
| $150,000 to $199,999 | 3 | 1.9% |
| $200,000+ | 10 | 6.3% |
Family Income by Famaliy Size in Richmond
3-person families (56 | 35.0%) account for the highest median family income in Richmond with $83,375 per family, while 3-person families (56 | 35.0%) have the highest median income of $27,792 per family member.
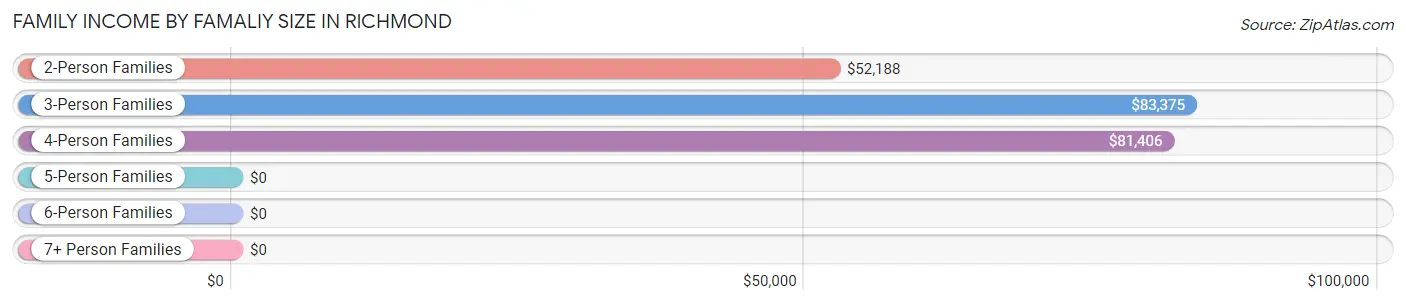
| Income Bracket | # Families | Median Income |
| 2-Person Families | 82 (51.2%) | $52,188 |
| 3-Person Families | 56 (35.0%) | $83,375 |
| 4-Person Families | 15 (9.4%) | $81,406 |
| 5-Person Families | 5 (3.1%) | $0 |
| 6-Person Families | 0 (0.0%) | $0 |
| 7+ Person Families | 2 (1.3%) | $0 |
| Total | 160 (100.0%) | $80,625 |
Family Income by Number of Earners in Richmond
The median family income in Richmond is $80,625, with families comprising 3+ earners (14) having the highest median family income of $250,001, while families with no earners (37) have the lowest median family income of $43,393, accounting for 8.7% and 23.1% of families, respectively.
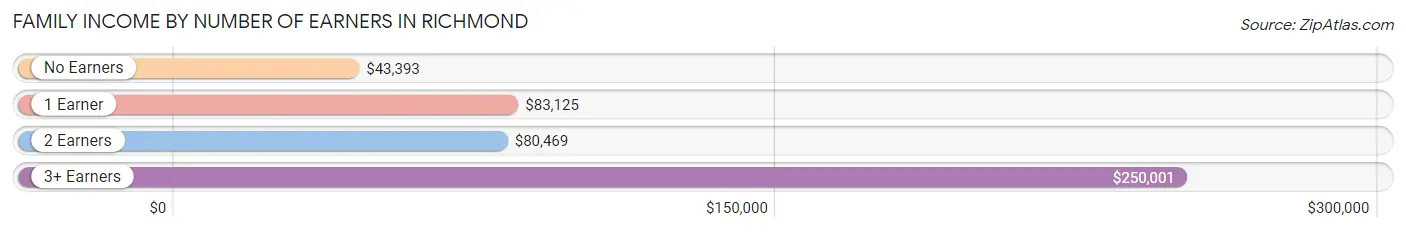
| Number of Earners | # Families | Median Income |
| No Earners | 37 (23.1%) | $43,393 |
| 1 Earner | 70 (43.8%) | $83,125 |
| 2 Earners | 39 (24.4%) | $80,469 |
| 3+ Earners | 14 (8.7%) | $250,001 |
| Total | 160 (100.0%) | $80,625 |
Household Income in Richmond
Household Income Brackets in Richmond
With 49 households falling in the category, the $75,000 to $99,999 income range is the most frequent in Richmond, accounting for 20.4% of all households. In contrast, only 1 households (0.4%) fall into the $10,000 to $14,999 income bracket, making it the least populous group.
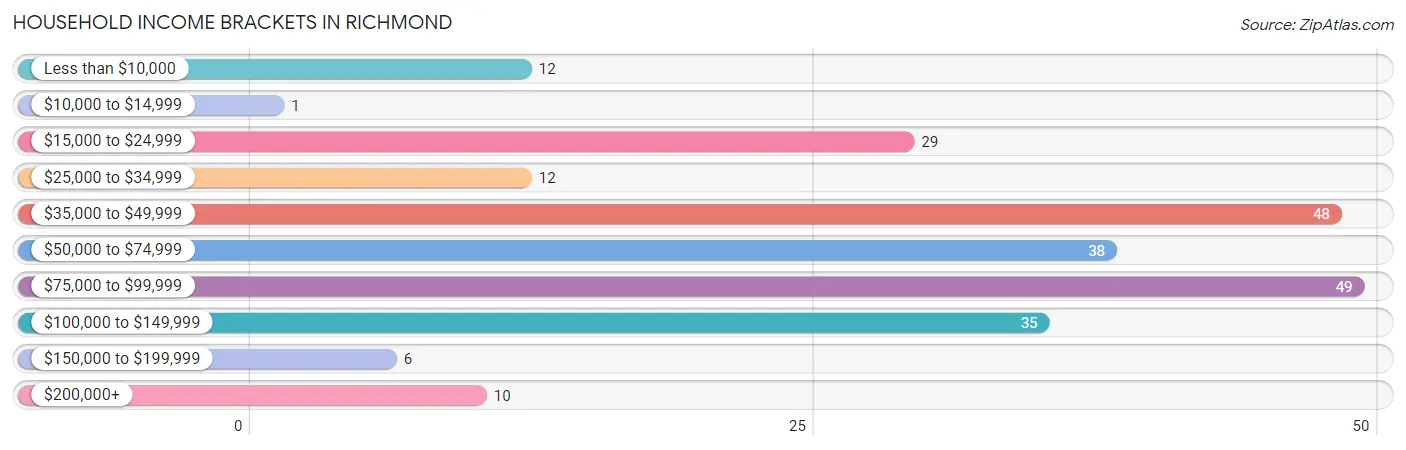
| Income Bracket | # Households | % Households |
| Less than $10,000 | 12 | 5.0% |
| $10,000 to $14,999 | 1 | 0.4% |
| $15,000 to $24,999 | 29 | 12.1% |
| $25,000 to $34,999 | 12 | 5.0% |
| $35,000 to $49,999 | 48 | 20.0% |
| $50,000 to $74,999 | 38 | 15.8% |
| $75,000 to $99,999 | 49 | 20.4% |
| $100,000 to $149,999 | 35 | 14.6% |
| $150,000 to $199,999 | 6 | 2.5% |
| $200,000+ | 10 | 4.2% |
Household Income by Householder Age in Richmond
The median household income in Richmond is $56,667, with the highest median household income of $86,250 found in the 45 to 64 years age bracket for the primary householder. A total of 85 households (35.4%) fall into this category. Meanwhile, the 15 to 24 years age bracket for the primary householder has the lowest median household income of $0, with 8 households (3.3%) in this group.
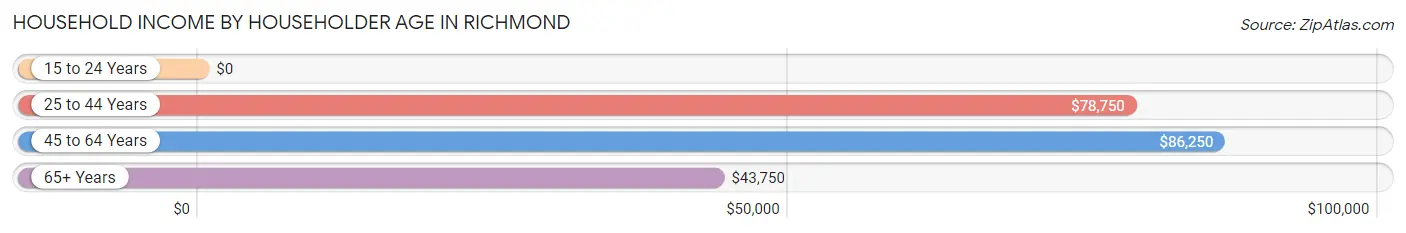
| Income Bracket | # Households | Median Income |
| 15 to 24 Years | 8 (3.3%) | $0 |
| 25 to 44 Years | 48 (20.0%) | $78,750 |
| 45 to 64 Years | 85 (35.4%) | $86,250 |
| 65+ Years | 99 (41.2%) | $43,750 |
| Total | 240 (100.0%) | $56,667 |
Poverty in Richmond
Income Below Poverty by Sex and Age in Richmond
With 1.7% poverty level for males and 12.8% for females among the residents of Richmond, 35 to 44 year old males and 12 to 14 year old females are the most vulnerable to poverty, with 2 males (15.4%) and 8 females (72.7%) in their respective age groups living below the poverty level.
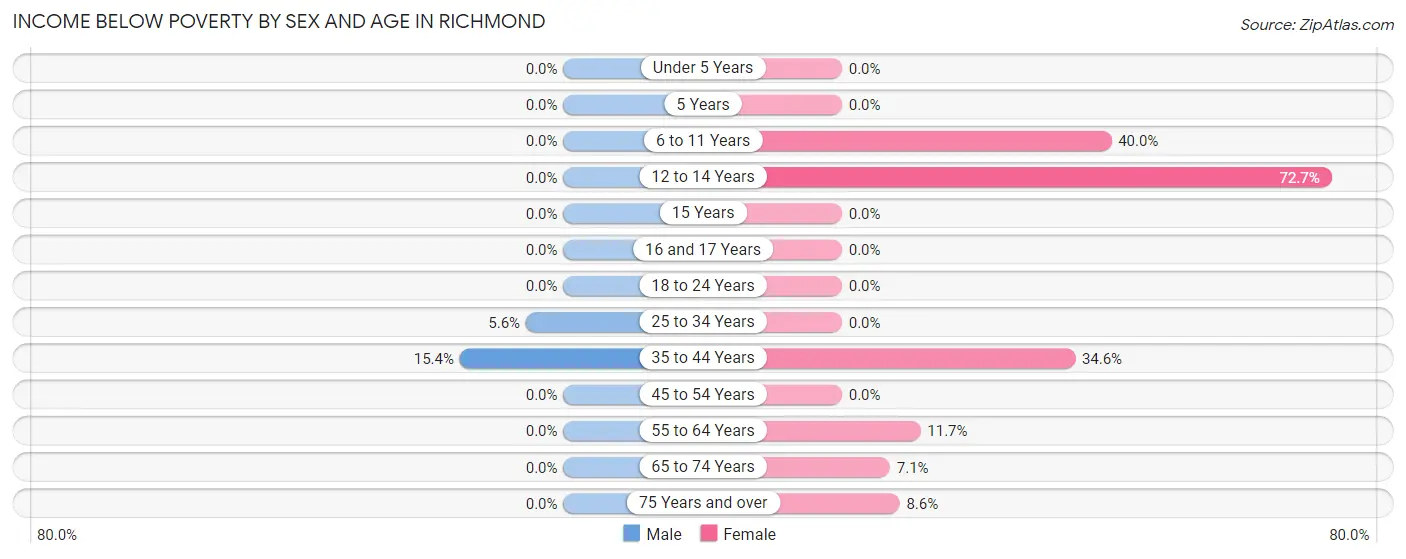
| Age Bracket | Male | Female |
| Under 5 Years | 0 (0.0%) | 0 (0.0%) |
| 5 Years | 0 (0.0%) | 0 (0.0%) |
| 6 to 11 Years | 0 (0.0%) | 10 (40.0%) |
| 12 to 14 Years | 0 (0.0%) | 8 (72.7%) |
| 15 Years | 0 (0.0%) | 0 (0.0%) |
| 16 and 17 Years | 0 (0.0%) | 0 (0.0%) |
| 18 to 24 Years | 0 (0.0%) | 0 (0.0%) |
| 25 to 34 Years | 2 (5.6%) | 0 (0.0%) |
| 35 to 44 Years | 2 (15.4%) | 9 (34.6%) |
| 45 to 54 Years | 0 (0.0%) | 0 (0.0%) |
| 55 to 64 Years | 0 (0.0%) | 7 (11.7%) |
| 65 to 74 Years | 0 (0.0%) | 3 (7.1%) |
| 75 Years and over | 0 (0.0%) | 3 (8.6%) |
| Total | 4 (1.7%) | 40 (12.8%) |
Income Above Poverty by Sex and Age in Richmond
According to the poverty statistics in Richmond, males aged under 5 years and females aged under 5 years are the age groups that are most secure financially, with 100.0% of males and 100.0% of females in these age groups living above the poverty line.
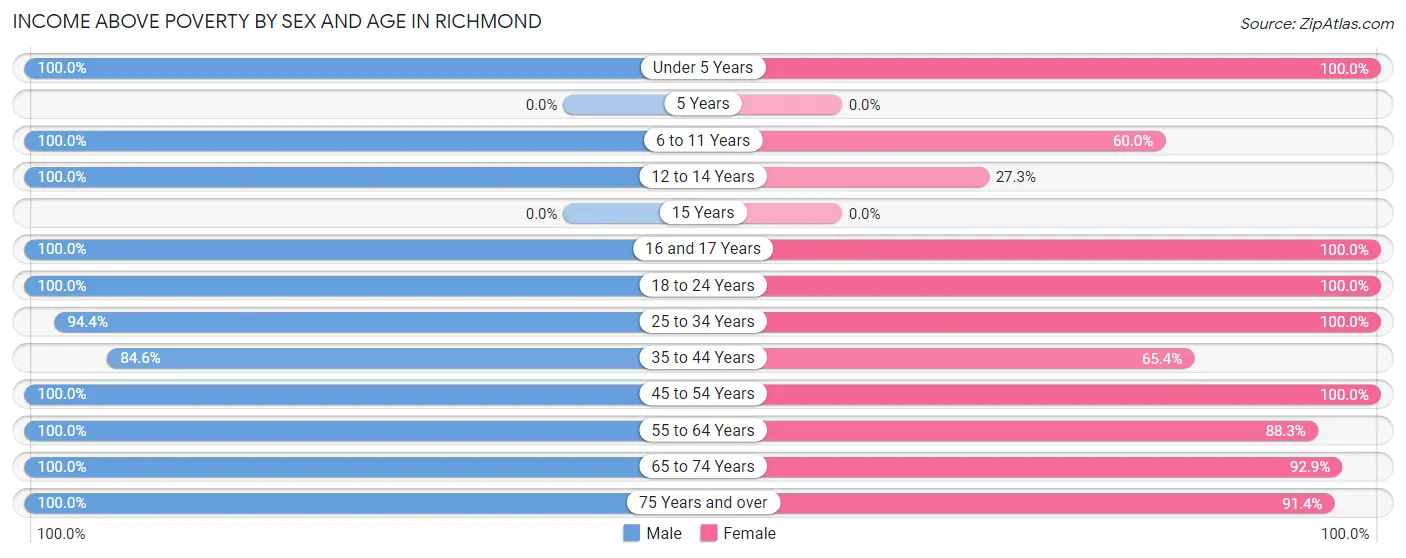
| Age Bracket | Male | Female |
| Under 5 Years | 16 (100.0%) | 9 (100.0%) |
| 5 Years | 0 (0.0%) | 0 (0.0%) |
| 6 to 11 Years | 20 (100.0%) | 15 (60.0%) |
| 12 to 14 Years | 4 (100.0%) | 3 (27.3%) |
| 15 Years | 0 (0.0%) | 0 (0.0%) |
| 16 and 17 Years | 1 (100.0%) | 3 (100.0%) |
| 18 to 24 Years | 7 (100.0%) | 52 (100.0%) |
| 25 to 34 Years | 34 (94.4%) | 9 (100.0%) |
| 35 to 44 Years | 11 (84.6%) | 17 (65.4%) |
| 45 to 54 Years | 22 (100.0%) | 40 (100.0%) |
| 55 to 64 Years | 45 (100.0%) | 53 (88.3%) |
| 65 to 74 Years | 52 (100.0%) | 39 (92.9%) |
| 75 Years and over | 27 (100.0%) | 32 (91.4%) |
| Total | 239 (98.4%) | 272 (87.2%) |
Income Below Poverty Among Married-Couple Families in Richmond
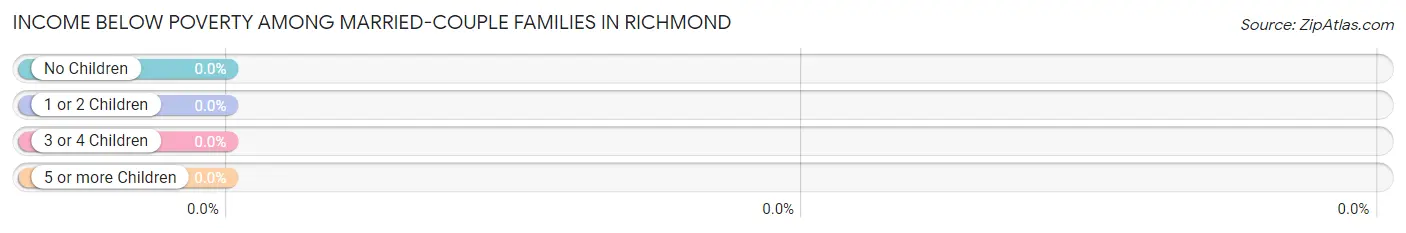
| Children | Above Poverty | Below Poverty |
| No Children | 116 (100.0%) | 0 (0.0%) |
| 1 or 2 Children | 21 (100.0%) | 0 (0.0%) |
| 3 or 4 Children | 2 (100.0%) | 0 (0.0%) |
| 5 or more Children | 2 (100.0%) | 0 (0.0%) |
| Total | 141 (100.0%) | 0 (0.0%) |
Income Below Poverty Among Single-Parent Households in Richmond
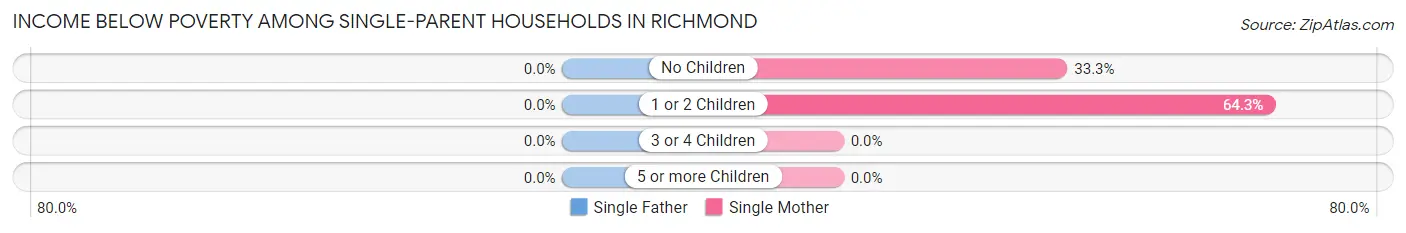
| Children | Single Father | Single Mother |
| No Children | 0 (0.0%) | 1 (33.3%) |
| 1 or 2 Children | 0 (0.0%) | 9 (64.3%) |
| 3 or 4 Children | 0 (0.0%) | 0 (0.0%) |
| 5 or more Children | 0 (0.0%) | 0 (0.0%) |
| Total | 0 (0.0%) | 10 (58.8%) |
Income Below Poverty Among Married-Couple vs Single-Parent Households in Richmond
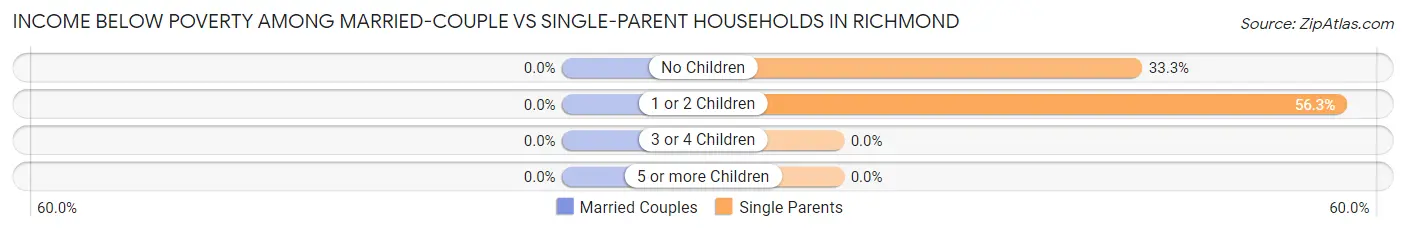
| Children | Married-Couple Families | Single-Parent Households |
| No Children | 0 (0.0%) | 1 (33.3%) |
| 1 or 2 Children | 0 (0.0%) | 9 (56.2%) |
| 3 or 4 Children | 0 (0.0%) | 0 (0.0%) |
| 5 or more Children | 0 (0.0%) | 0 (0.0%) |
| Total | 0 (0.0%) | 10 (52.6%) |
Race in Richmond
The most populous races in Richmond are White / Caucasian (536 | 96.6%), Two or more Races (13 | 2.3%), and Some other Race (6 | 1.1%).
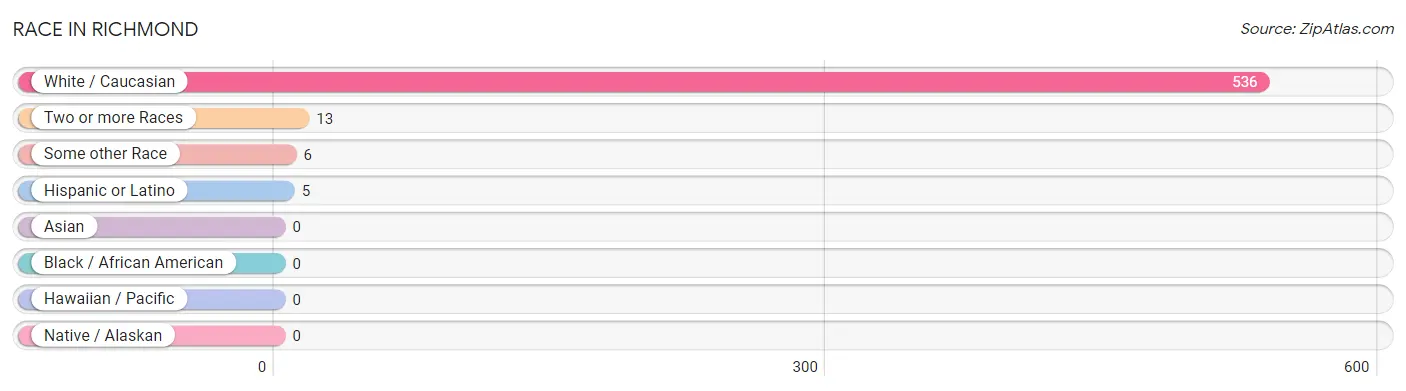
| Race | # Population | % Population |
| Asian | 0 | 0.0% |
| Black / African American | 0 | 0.0% |
| Hawaiian / Pacific | 0 | 0.0% |
| Hispanic or Latino | 5 | 0.9% |
| Native / Alaskan | 0 | 0.0% |
| White / Caucasian | 536 | 96.6% |
| Two or more Races | 13 | 2.3% |
| Some other Race | 6 | 1.1% |
| Total | 555 | 100.0% |
Ancestry in Richmond
The most populous ancestries reported in Richmond are German (164 | 29.5%), Irish (99 | 17.8%), Italian (82 | 14.8%), English (74 | 13.3%), and Polish (28 | 5.1%), together accounting for 80.5% of all Richmond residents.
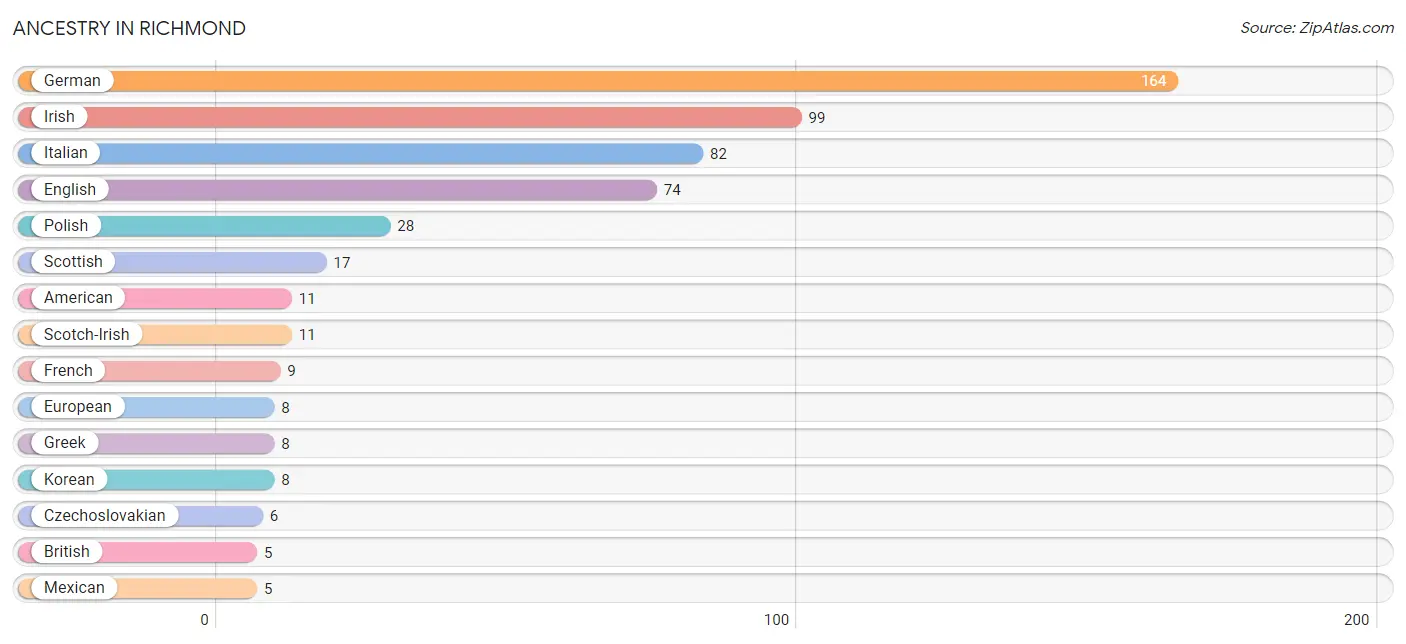
| Ancestry | # Population | % Population |
| American | 11 | 2.0% |
| British | 5 | 0.9% |
| Czech | 2 | 0.4% |
| Czechoslovakian | 6 | 1.1% |
| Dutch | 4 | 0.7% |
| English | 74 | 13.3% |
| European | 8 | 1.4% |
| French | 9 | 1.6% |
| German | 164 | 29.5% |
| Greek | 8 | 1.4% |
| Hungarian | 3 | 0.5% |
| Irish | 99 | 17.8% |
| Italian | 82 | 14.8% |
| Korean | 8 | 1.4% |
| Mexican | 5 | 0.9% |
| Polish | 28 | 5.1% |
| Russian | 2 | 0.4% |
| Scotch-Irish | 11 | 2.0% |
| Scottish | 17 | 3.1% |
| Serbian | 1 | 0.2% |
| Slovak | 2 | 0.4% |
| Swedish | 1 | 0.2% |
| Welsh | 2 | 0.4% | View All 23 Rows |
Immigrants in Richmond

| Immigration Origin | # Population | % Population | View All 0 Rows |
Sex and Age in Richmond
Sex and Age in Richmond
The most populous age groups in Richmond are 65 to 69 Years (35 | 14.4%) for men and 20 to 24 Years (52 | 16.7%) for women.
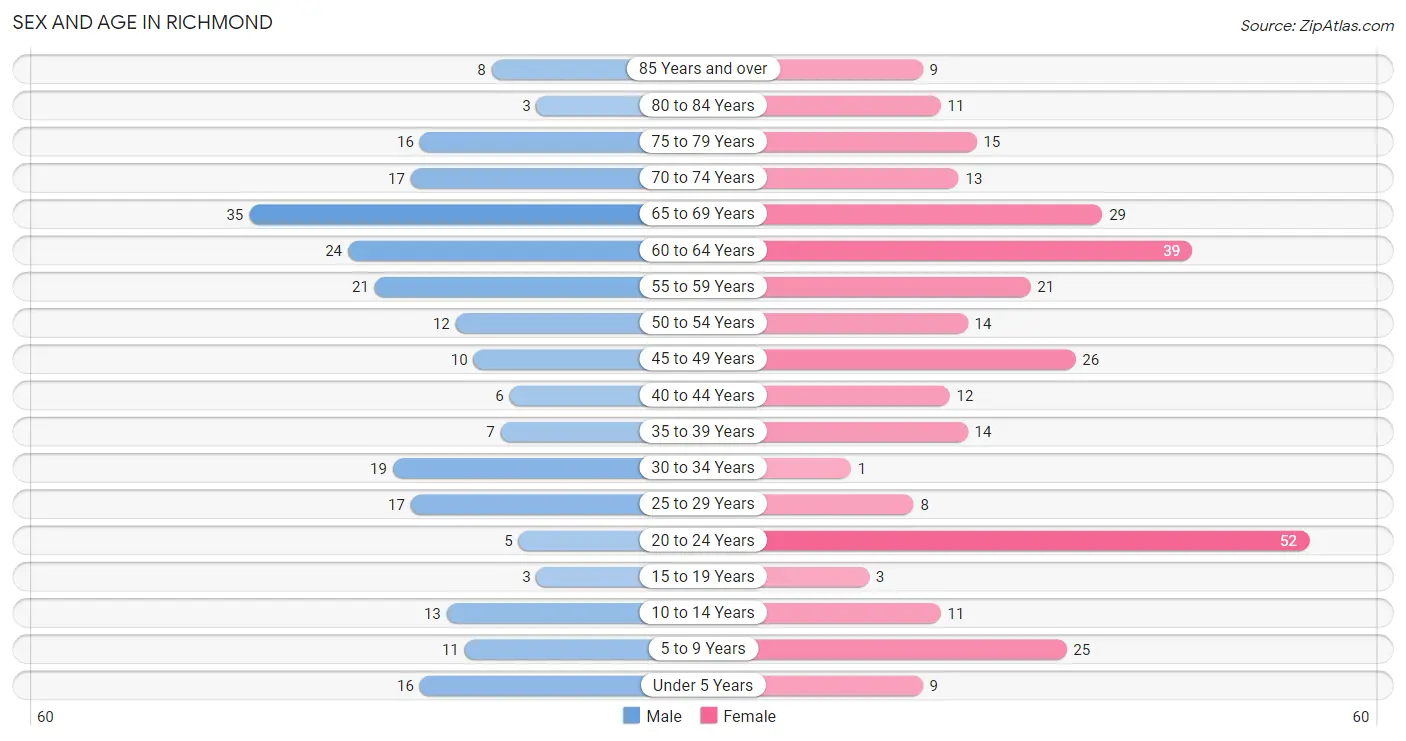
| Age Bracket | Male | Female |
| Under 5 Years | 16 (6.6%) | 9 (2.9%) |
| 5 to 9 Years | 11 (4.5%) | 25 (8.0%) |
| 10 to 14 Years | 13 (5.3%) | 11 (3.5%) |
| 15 to 19 Years | 3 (1.2%) | 3 (1.0%) |
| 20 to 24 Years | 5 (2.1%) | 52 (16.7%) |
| 25 to 29 Years | 17 (7.0%) | 8 (2.6%) |
| 30 to 34 Years | 19 (7.8%) | 1 (0.3%) |
| 35 to 39 Years | 7 (2.9%) | 14 (4.5%) |
| 40 to 44 Years | 6 (2.5%) | 12 (3.8%) |
| 45 to 49 Years | 10 (4.1%) | 26 (8.3%) |
| 50 to 54 Years | 12 (4.9%) | 14 (4.5%) |
| 55 to 59 Years | 21 (8.6%) | 21 (6.7%) |
| 60 to 64 Years | 24 (9.9%) | 39 (12.5%) |
| 65 to 69 Years | 35 (14.4%) | 29 (9.3%) |
| 70 to 74 Years | 17 (7.0%) | 13 (4.2%) |
| 75 to 79 Years | 16 (6.6%) | 15 (4.8%) |
| 80 to 84 Years | 3 (1.2%) | 11 (3.5%) |
| 85 Years and over | 8 (3.3%) | 9 (2.9%) |
| Total | 243 (100.0%) | 312 (100.0%) |
Families and Households in Richmond
Median Family Size in Richmond
The median family size in Richmond is 2.94 persons per family, with single female/mother families (17 | 10.6%) accounting for the largest median family size of 3.06 persons per family. On the other hand, single male/father families (2 | 1.3%) represent the smallest median family size with 2.50 persons per family.
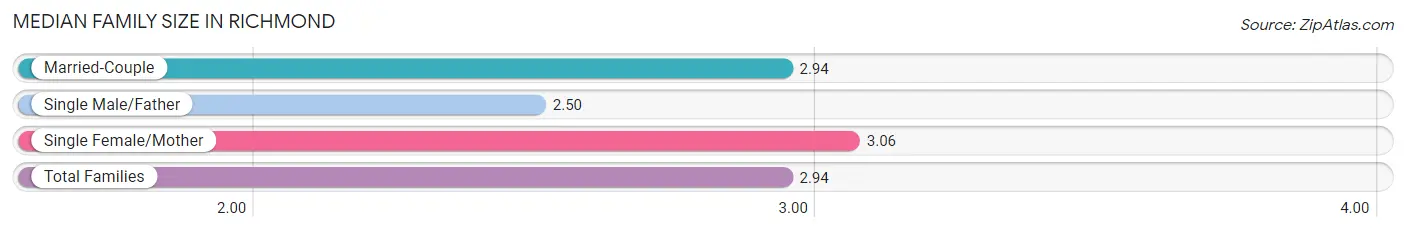
| Family Type | # Families | Family Size |
| Married-Couple | 141 (88.1%) | 2.94 |
| Single Male/Father | 2 (1.3%) | 2.50 |
| Single Female/Mother | 17 (10.6%) | 3.06 |
| Total Families | 160 (100.0%) | 2.94 |
Median Household Size in Richmond
The median household size in Richmond is 2.31 persons per household, with single female/mother households (17 | 7.1%) accounting for the largest median household size of 3.06 persons per household. non-family households (80 | 33.3%) represent the smallest median household size with 1.05 persons per household.
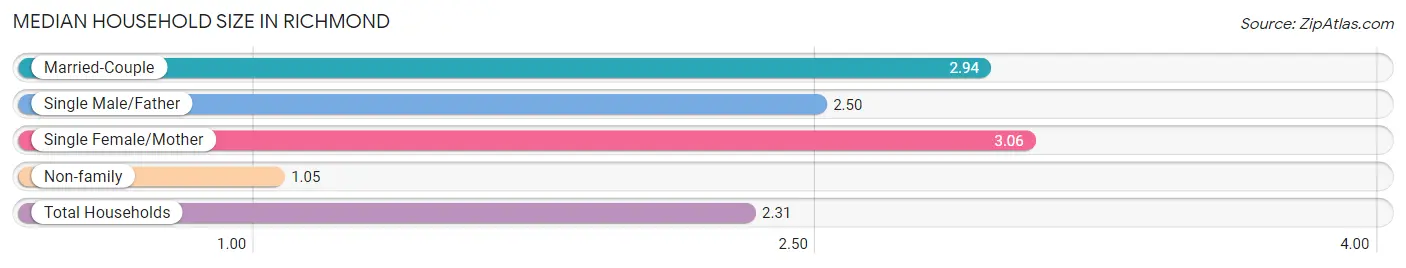
| Household Type | # Households | Household Size |
| Married-Couple | 141 (58.8%) | 2.94 |
| Single Male/Father | 2 (0.8%) | 2.50 |
| Single Female/Mother | 17 (7.1%) | 3.06 |
| Non-family | 80 (33.3%) | 1.05 |
| Total Households | 240 (100.0%) | 2.31 |
Household Size by Marriage Status in Richmond
Out of a total of 240 households in Richmond, 160 (66.7%) are family households, while 80 (33.3%) are nonfamily households. The most numerous type of family households are 2-person households, comprising 82, and the most common type of nonfamily households are 1-person households, comprising 74.
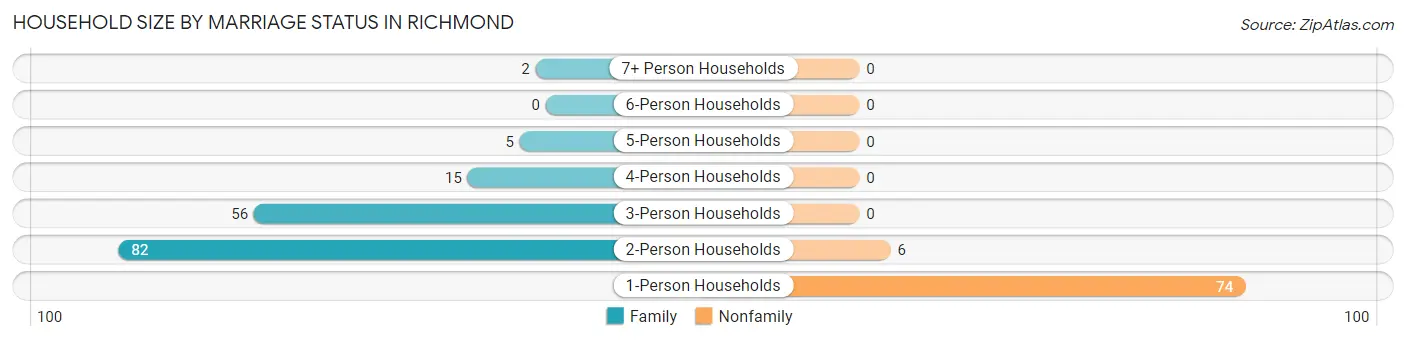
| Household Size | Family Households | Nonfamily Households |
| 1-Person Households | - | 74 (30.8%) |
| 2-Person Households | 82 (34.2%) | 6 (2.5%) |
| 3-Person Households | 56 (23.3%) | 0 (0.0%) |
| 4-Person Households | 15 (6.2%) | 0 (0.0%) |
| 5-Person Households | 5 (2.1%) | 0 (0.0%) |
| 6-Person Households | 0 (0.0%) | 0 (0.0%) |
| 7+ Person Households | 2 (0.8%) | 0 (0.0%) |
| Total | 160 (66.7%) | 80 (33.3%) |
Female Fertility in Richmond
Fertility by Age in Richmond
Average fertility rate in Richmond is 103.0 births per 1,000 women. Women in the age bracket of 20 to 34 years have the highest fertility rate with 197.0 births per 1,000 women. Women in the age bracket of 20 to 34 years acount for 100.0% of all women with births.
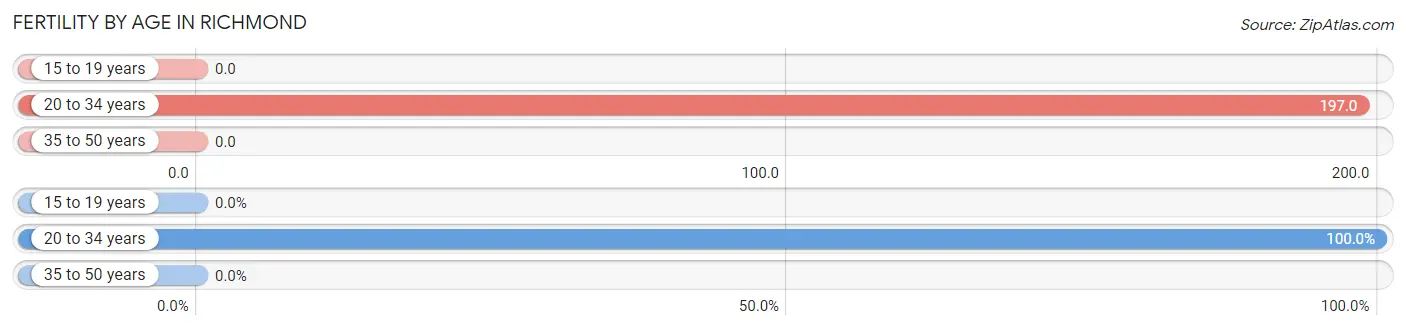
| Age Bracket | Women with Births | Births / 1,000 Women |
| 15 to 19 years | 0 (0.0%) | 0.0 |
| 20 to 34 years | 12 (100.0%) | 197.0 |
| 35 to 50 years | 0 (0.0%) | 0.0 |
| Total | 12 (100.0%) | 103.0 |
Fertility by Age by Marriage Status in Richmond
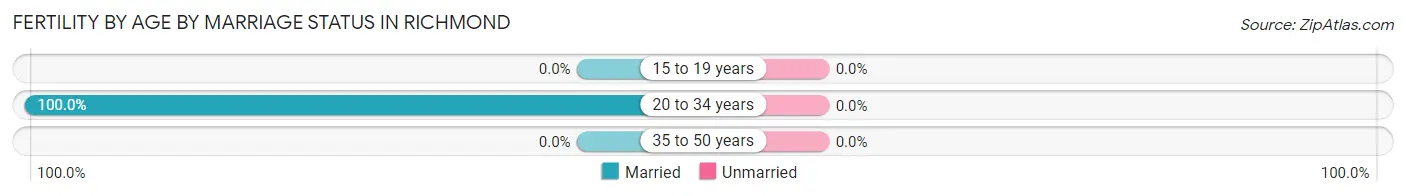
| Age Bracket | Married | Unmarried |
| 15 to 19 years | 0 (0.0%) | 0 (0.0%) |
| 20 to 34 years | 12 (100.0%) | 0 (0.0%) |
| 35 to 50 years | 0 (0.0%) | 0 (0.0%) |
| Total | 12 (100.0%) | 0 (0.0%) |
Fertility by Education in Richmond
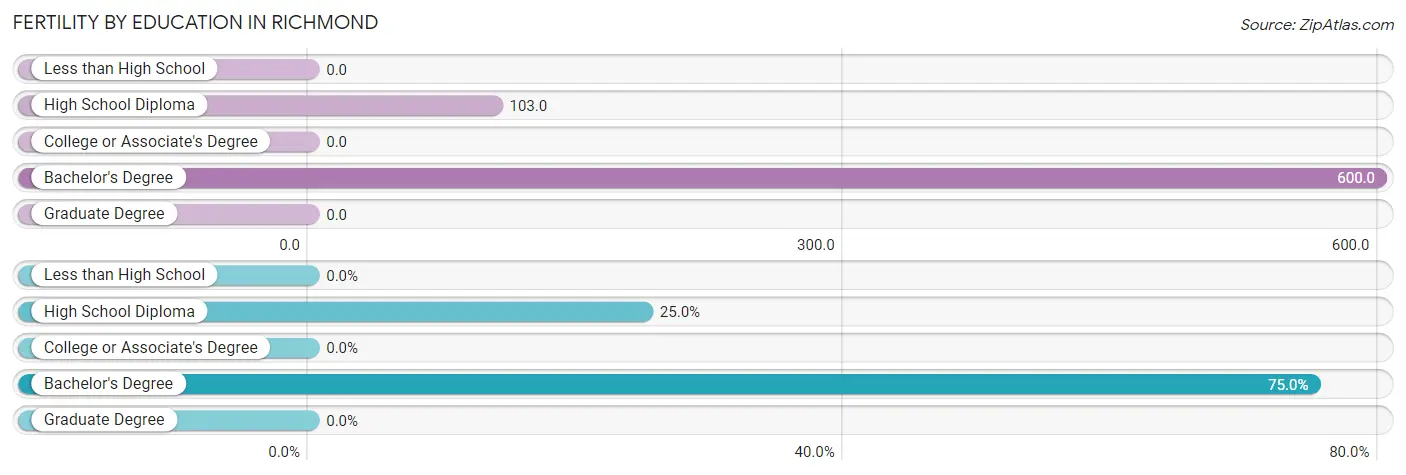
| Educational Attainment | Women with Births | Births / 1,000 Women |
| Less than High School | 0 (0.0%) | 0.0 |
| High School Diploma | 3 (25.0%) | 103.0 |
| College or Associate's Degree | 0 (0.0%) | 0.0 |
| Bachelor's Degree | 9 (75.0%) | 600.0 |
| Graduate Degree | 0 (0.0%) | 0.0 |
| Total | 12 (100.0%) | 103.0 |
Fertility by Education by Marriage Status in Richmond
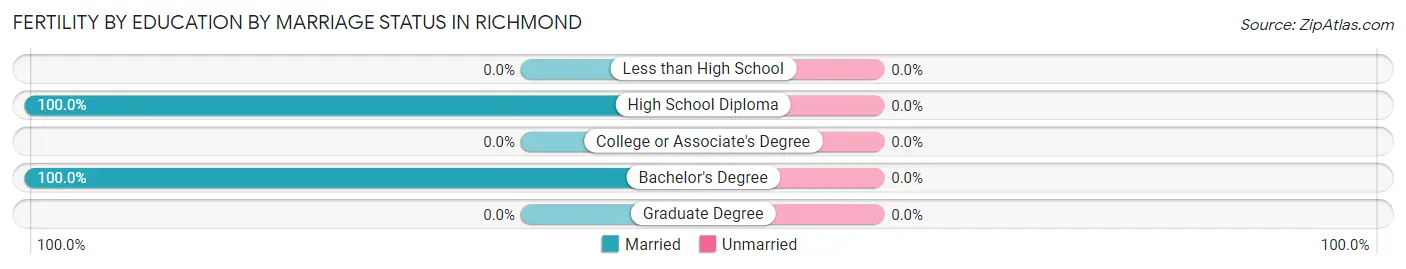
| Educational Attainment | Married | Unmarried |
| Less than High School | 0 (0.0%) | 0 (0.0%) |
| High School Diploma | 3 (100.0%) | 0 (0.0%) |
| College or Associate's Degree | 0 (0.0%) | 0 (0.0%) |
| Bachelor's Degree | 9 (100.0%) | 0 (0.0%) |
| Graduate Degree | 0 (0.0%) | 0 (0.0%) |
| Total | 12 (100.0%) | 0 (0.0%) |
Employment Characteristics in Richmond
Employment by Class of Employer in Richmond
Among the 233 employed individuals in Richmond, private company employees (175 | 75.1%), not-for-profit organizations (24 | 10.3%), and local government employees (18 | 7.7%) make up the most common classes of employment.
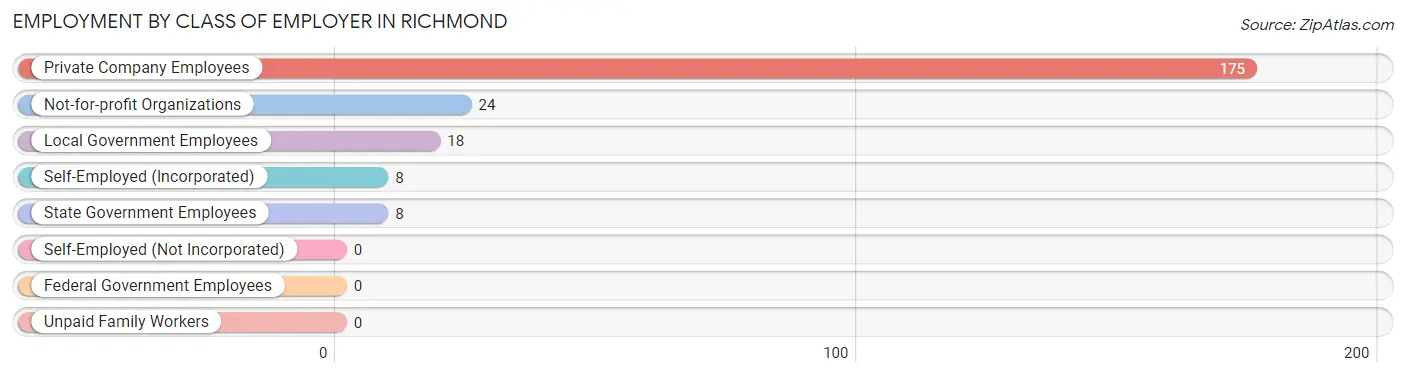
| Employer Class | # Employees | % Employees |
| Private Company Employees | 175 | 75.1% |
| Self-Employed (Incorporated) | 8 | 3.4% |
| Self-Employed (Not Incorporated) | 0 | 0.0% |
| Not-for-profit Organizations | 24 | 10.3% |
| Local Government Employees | 18 | 7.7% |
| State Government Employees | 8 | 3.4% |
| Federal Government Employees | 0 | 0.0% |
| Unpaid Family Workers | 0 | 0.0% |
| Total | 233 | 100.0% |
Employment Status by Age in Richmond
According to the labor force statistics for Richmond, out of the total population over 16 years of age (470), 53.6% or 252 individuals are in the labor force, with 2.4% or 6 of them unemployed. The age group with the highest labor force participation rate is 25 to 29 years, with 100.0% or 25 individuals in the labor force. Within the labor force, the 60 to 64 years age range has the highest percentage of unemployed individuals, with 8.8% or 3 of them being unemployed.
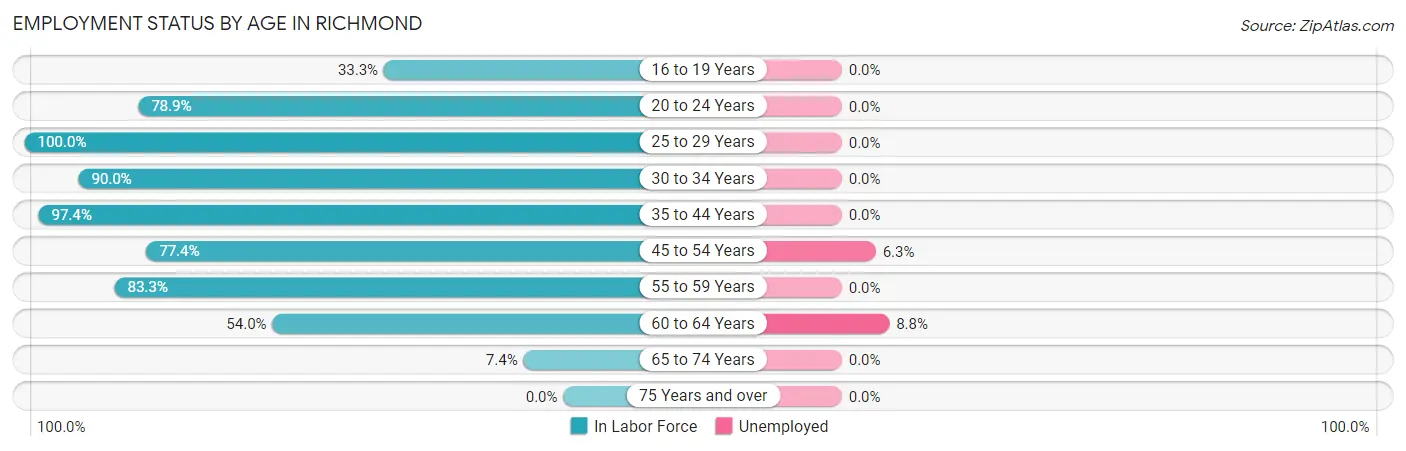
| Age Bracket | In Labor Force | Unemployed |
| 16 to 19 Years | 2 (33.3%) | 0 (0.0%) |
| 20 to 24 Years | 45 (78.9%) | 0 (0.0%) |
| 25 to 29 Years | 25 (100.0%) | 0 (0.0%) |
| 30 to 34 Years | 18 (90.0%) | 0 (0.0%) |
| 35 to 44 Years | 38 (97.4%) | 0 (0.0%) |
| 45 to 54 Years | 48 (77.4%) | 3 (6.3%) |
| 55 to 59 Years | 35 (83.3%) | 0 (0.0%) |
| 60 to 64 Years | 34 (54.0%) | 3 (8.8%) |
| 65 to 74 Years | 7 (7.4%) | 0 (0.0%) |
| 75 Years and over | 0 (0.0%) | 0 (0.0%) |
| Total | 252 (53.6%) | 6 (2.4%) |
Employment Status by Educational Attainment in Richmond
According to labor force statistics for Richmond, 78.9% of individuals (198) out of the total population between 25 and 64 years of age (251) are in the labor force, with 3.0% or 6 of them being unemployed. The group with the highest labor force participation rate are those with the educational attainment of bachelor's degree or higher, with 100.0% or 34 individuals in the labor force. Within the labor force, individuals with bachelor's degree or higher education have the highest percentage of unemployment, with 17.6% or 6 of them being unemployed.
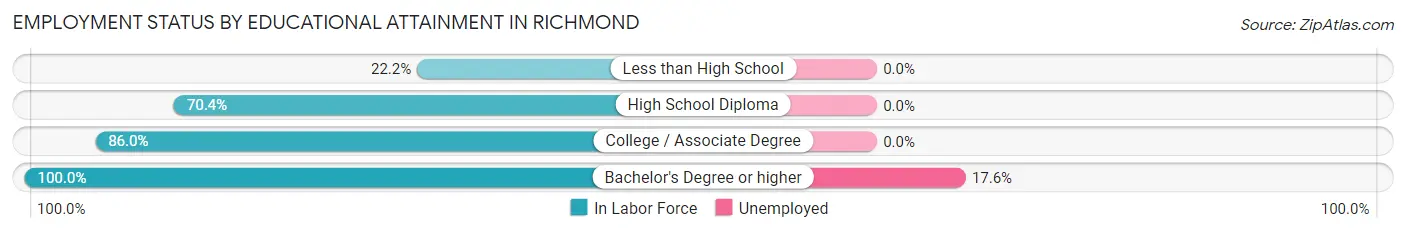
| Educational Attainment | In Labor Force | Unemployed |
| Less than High School | 2 (22.2%) | 0 (0.0%) |
| High School Diploma | 76 (70.4%) | 0 (0.0%) |
| College / Associate Degree | 86 (86.0%) | 0 (0.0%) |
| Bachelor's Degree or higher | 34 (100.0%) | 6 (17.6%) |
| Total | 198 (78.9%) | 8 (3.0%) |
Employment Occupations by Sex in Richmond
Management, Business, Science and Arts Occupations
The most common Management, Business, Science and Arts occupations in Richmond are Health Diagnosing & Treating (37 | 15.0%), Community & Social Service (27 | 11.0%), Health Technologists (26 | 10.6%), Education Instruction & Library (21 | 8.5%), and Management (6 | 2.4%).
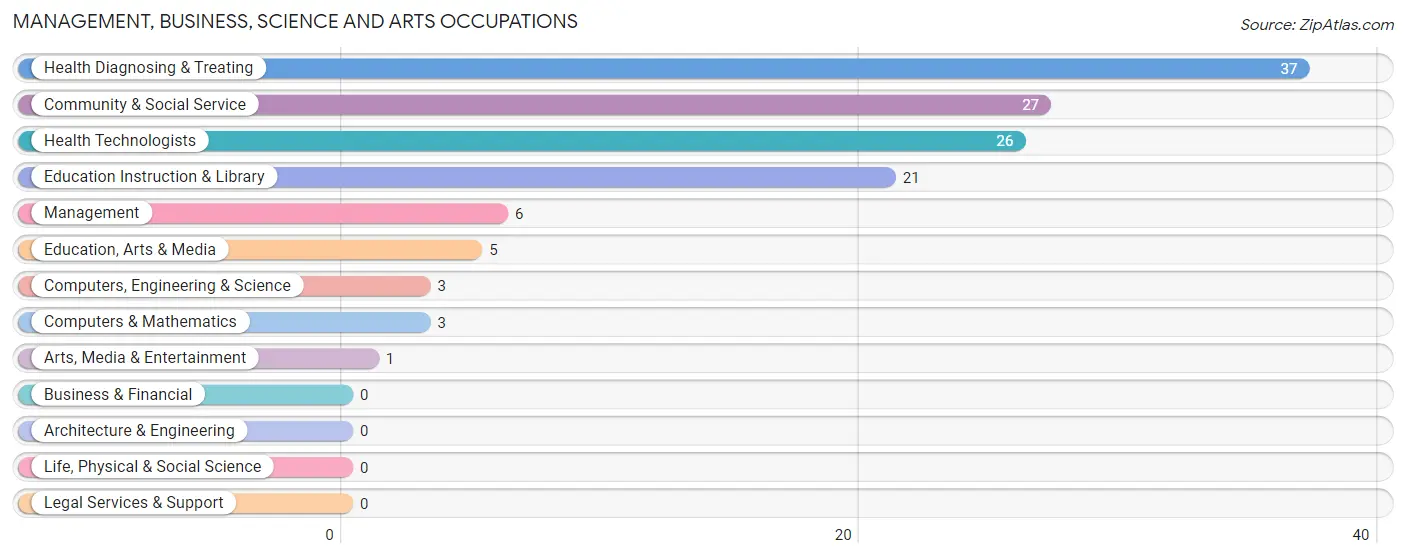
Management, Business, Science and Arts Occupations by Sex
Within the Management, Business, Science and Arts occupations in Richmond, the most male-oriented occupations are Computers, Engineering & Science (100.0%), Computers & Mathematics (100.0%), and Education, Arts & Media (100.0%), while the most female-oriented occupations are Arts, Media & Entertainment (100.0%), Health Diagnosing & Treating (97.3%), and Health Technologists (96.2%).
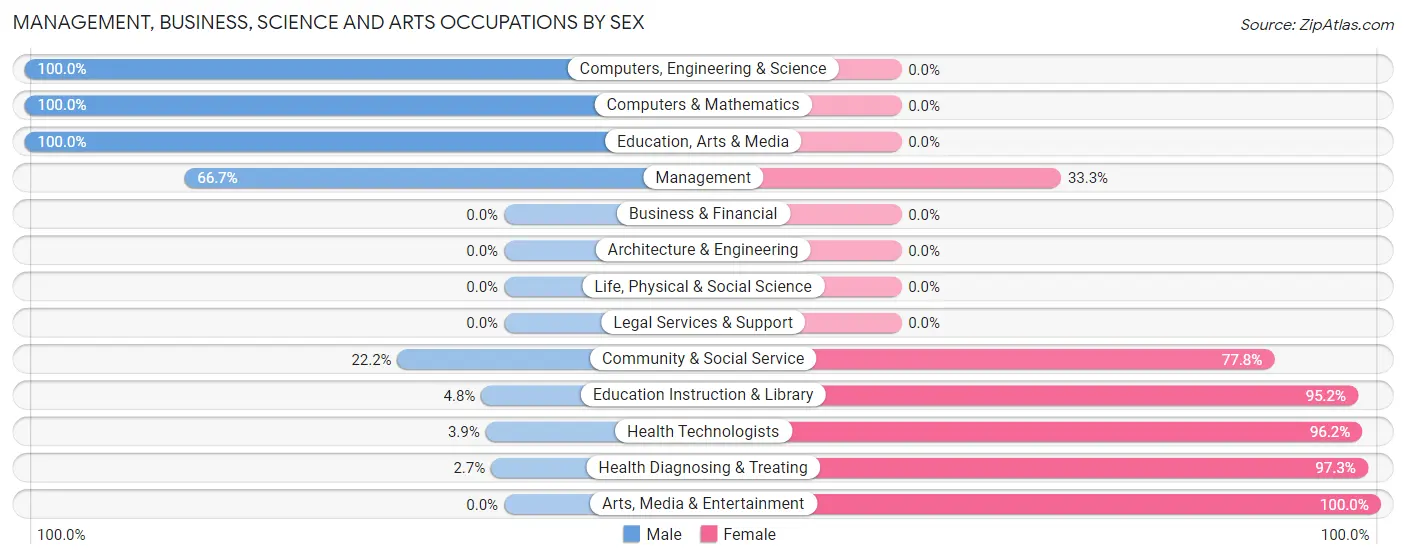
| Occupation | Male | Female |
| Management | 4 (66.7%) | 2 (33.3%) |
| Business & Financial | 0 (0.0%) | 0 (0.0%) |
| Computers, Engineering & Science | 3 (100.0%) | 0 (0.0%) |
| Computers & Mathematics | 3 (100.0%) | 0 (0.0%) |
| Architecture & Engineering | 0 (0.0%) | 0 (0.0%) |
| Life, Physical & Social Science | 0 (0.0%) | 0 (0.0%) |
| Community & Social Service | 6 (22.2%) | 21 (77.8%) |
| Education, Arts & Media | 5 (100.0%) | 0 (0.0%) |
| Legal Services & Support | 0 (0.0%) | 0 (0.0%) |
| Education Instruction & Library | 1 (4.8%) | 20 (95.2%) |
| Arts, Media & Entertainment | 0 (0.0%) | 1 (100.0%) |
| Health Diagnosing & Treating | 1 (2.7%) | 36 (97.3%) |
| Health Technologists | 1 (3.8%) | 25 (96.2%) |
| Total (Category) | 14 (19.2%) | 59 (80.8%) |
| Total (Overall) | 114 (46.3%) | 132 (53.7%) |
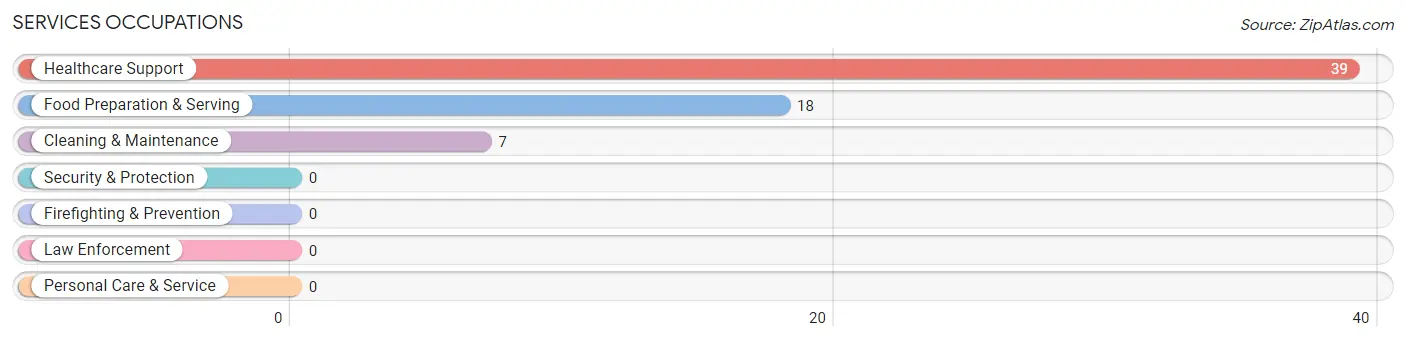
Services Occupations
The most common Services occupations in Richmond are Healthcare Support (39 | 15.9%), Food Preparation & Serving (18 | 7.3%), and Cleaning & Maintenance (7 | 2.9%).
Services Occupations by Sex
Within the Services occupations in Richmond, the most male-oriented occupations are Cleaning & Maintenance (71.4%), Food Preparation & Serving (27.8%), and Healthcare Support (5.1%), while the most female-oriented occupations are Healthcare Support (94.9%), Food Preparation & Serving (72.2%), and Cleaning & Maintenance (28.6%).
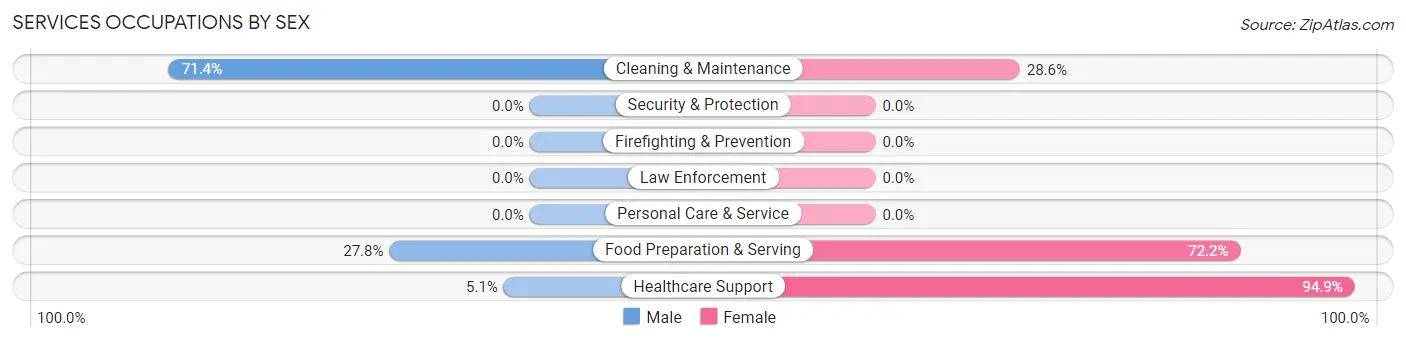
| Occupation | Male | Female |
| Healthcare Support | 2 (5.1%) | 37 (94.9%) |
| Security & Protection | 0 (0.0%) | 0 (0.0%) |
| Firefighting & Prevention | 0 (0.0%) | 0 (0.0%) |
| Law Enforcement | 0 (0.0%) | 0 (0.0%) |
| Food Preparation & Serving | 5 (27.8%) | 13 (72.2%) |
| Cleaning & Maintenance | 5 (71.4%) | 2 (28.6%) |
| Personal Care & Service | 0 (0.0%) | 0 (0.0%) |
| Total (Category) | 12 (18.8%) | 52 (81.2%) |
| Total (Overall) | 114 (46.3%) | 132 (53.7%) |
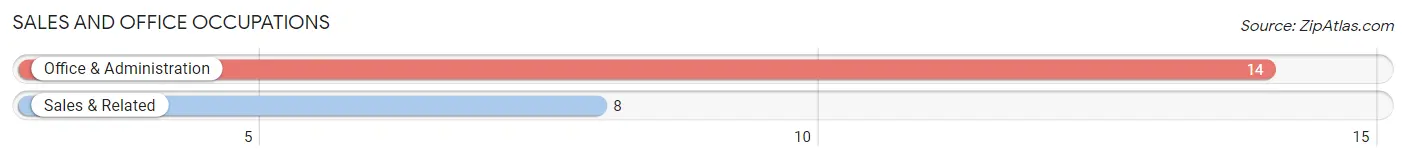
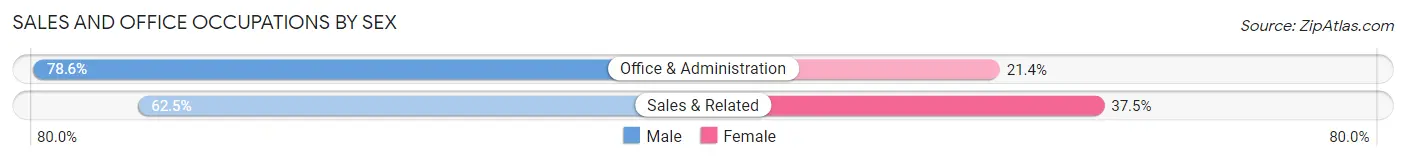
Sales and Office Occupations
The most common Sales and Office occupations in Richmond are Office & Administration (14 | 5.7%), and Sales & Related (8 | 3.3%).
Sales and Office Occupations by Sex
| Occupation | Male | Female |
| Sales & Related | 5 (62.5%) | 3 (37.5%) |
| Office & Administration | 11 (78.6%) | 3 (21.4%) |
| Total (Category) | 16 (72.7%) | 6 (27.3%) |
| Total (Overall) | 114 (46.3%) | 132 (53.7%) |
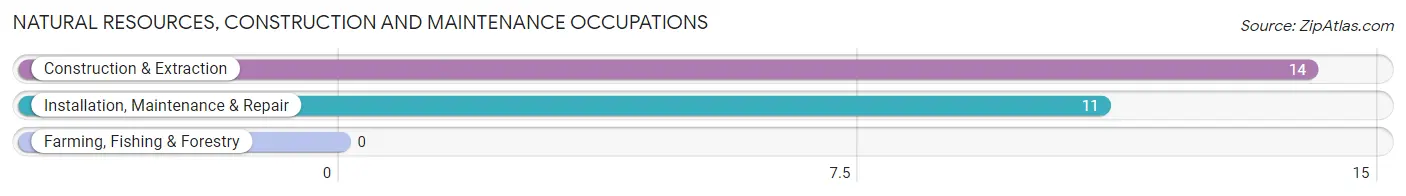
Natural Resources, Construction and Maintenance Occupations
The most common Natural Resources, Construction and Maintenance occupations in Richmond are Construction & Extraction (14 | 5.7%), and Installation, Maintenance & Repair (11 | 4.5%).
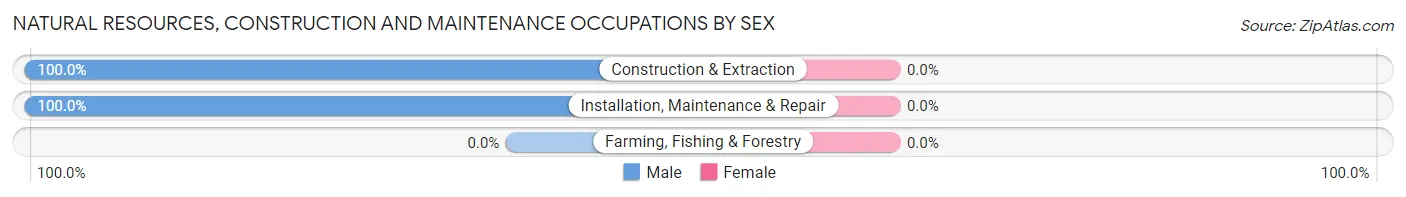
Natural Resources, Construction and Maintenance Occupations by Sex
| Occupation | Male | Female |
| Farming, Fishing & Forestry | 0 (0.0%) | 0 (0.0%) |
| Construction & Extraction | 14 (100.0%) | 0 (0.0%) |
| Installation, Maintenance & Repair | 11 (100.0%) | 0 (0.0%) |
| Total (Category) | 25 (100.0%) | 0 (0.0%) |
| Total (Overall) | 114 (46.3%) | 132 (53.7%) |
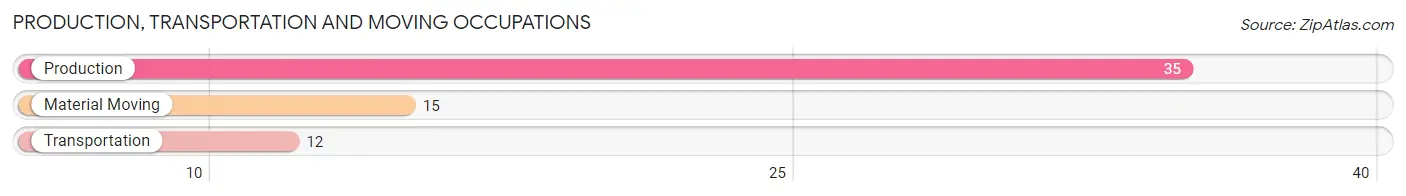
Production, Transportation and Moving Occupations
The most common Production, Transportation and Moving occupations in Richmond are Production (35 | 14.2%), Material Moving (15 | 6.1%), and Transportation (12 | 4.9%).
Production, Transportation and Moving Occupations by Sex
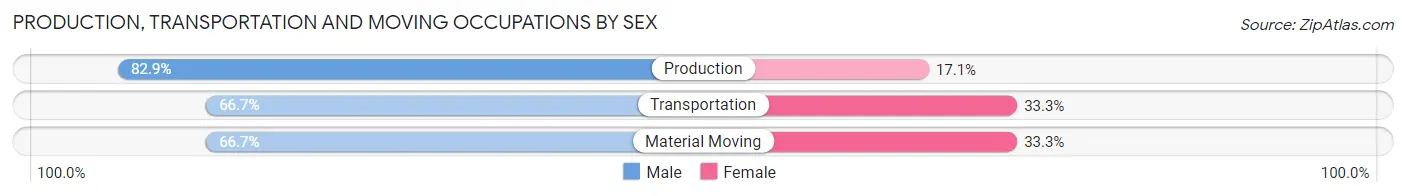
| Occupation | Male | Female |
| Production | 29 (82.9%) | 6 (17.1%) |
| Transportation | 8 (66.7%) | 4 (33.3%) |
| Material Moving | 10 (66.7%) | 5 (33.3%) |
| Total (Category) | 47 (75.8%) | 15 (24.2%) |
| Total (Overall) | 114 (46.3%) | 132 (53.7%) |
Employment Industries by Sex in Richmond
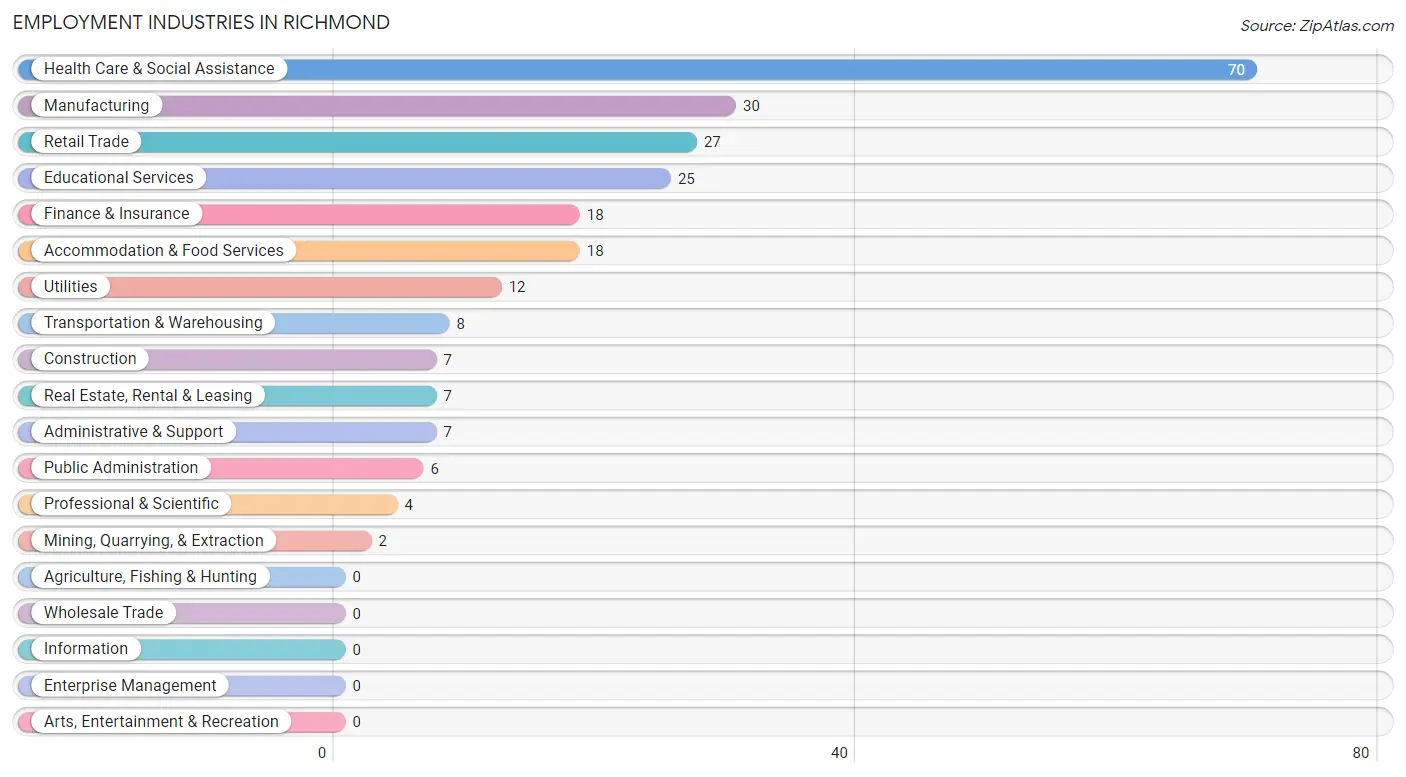
Employment Industries in Richmond
The major employment industries in Richmond include Health Care & Social Assistance (70 | 28.5%), Manufacturing (30 | 12.2%), Retail Trade (27 | 11.0%), Educational Services (25 | 10.2%), and Finance & Insurance (18 | 7.3%).
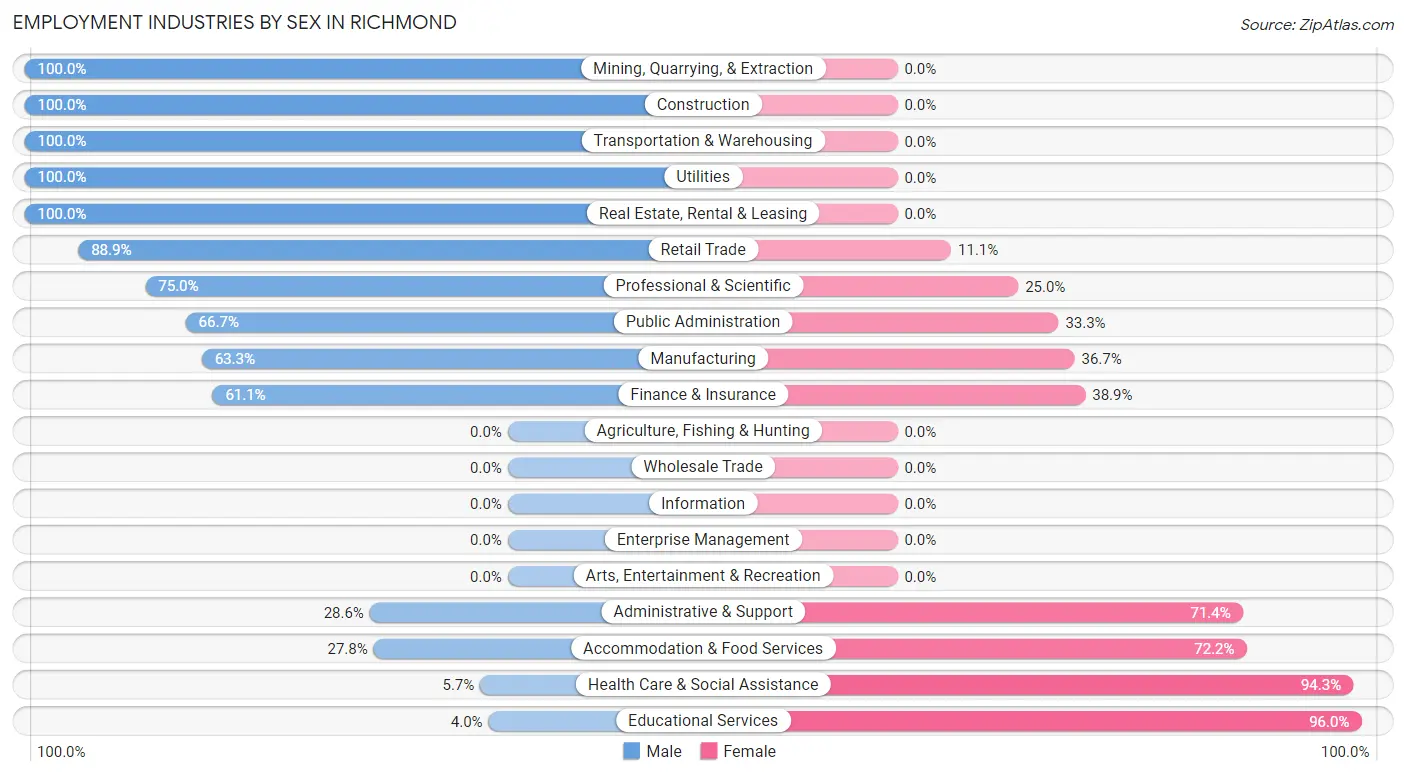
Employment Industries by Sex in Richmond
The Richmond industries that see more men than women are Mining, Quarrying, & Extraction (100.0%), Construction (100.0%), and Transportation & Warehousing (100.0%), whereas the industries that tend to have a higher number of women are Educational Services (96.0%), Health Care & Social Assistance (94.3%), and Accommodation & Food Services (72.2%).
| Industry | Male | Female |
| Agriculture, Fishing & Hunting | 0 (0.0%) | 0 (0.0%) |
| Mining, Quarrying, & Extraction | 2 (100.0%) | 0 (0.0%) |
| Construction | 7 (100.0%) | 0 (0.0%) |
| Manufacturing | 19 (63.3%) | 11 (36.7%) |
| Wholesale Trade | 0 (0.0%) | 0 (0.0%) |
| Retail Trade | 24 (88.9%) | 3 (11.1%) |
| Transportation & Warehousing | 8 (100.0%) | 0 (0.0%) |
| Utilities | 12 (100.0%) | 0 (0.0%) |
| Information | 0 (0.0%) | 0 (0.0%) |
| Finance & Insurance | 11 (61.1%) | 7 (38.9%) |
| Real Estate, Rental & Leasing | 7 (100.0%) | 0 (0.0%) |
| Professional & Scientific | 3 (75.0%) | 1 (25.0%) |
| Enterprise Management | 0 (0.0%) | 0 (0.0%) |
| Administrative & Support | 2 (28.6%) | 5 (71.4%) |
| Educational Services | 1 (4.0%) | 24 (96.0%) |
| Health Care & Social Assistance | 4 (5.7%) | 66 (94.3%) |
| Arts, Entertainment & Recreation | 0 (0.0%) | 0 (0.0%) |
| Accommodation & Food Services | 5 (27.8%) | 13 (72.2%) |
| Public Administration | 4 (66.7%) | 2 (33.3%) |
| Total | 114 (46.3%) | 132 (53.7%) |
Education in Richmond
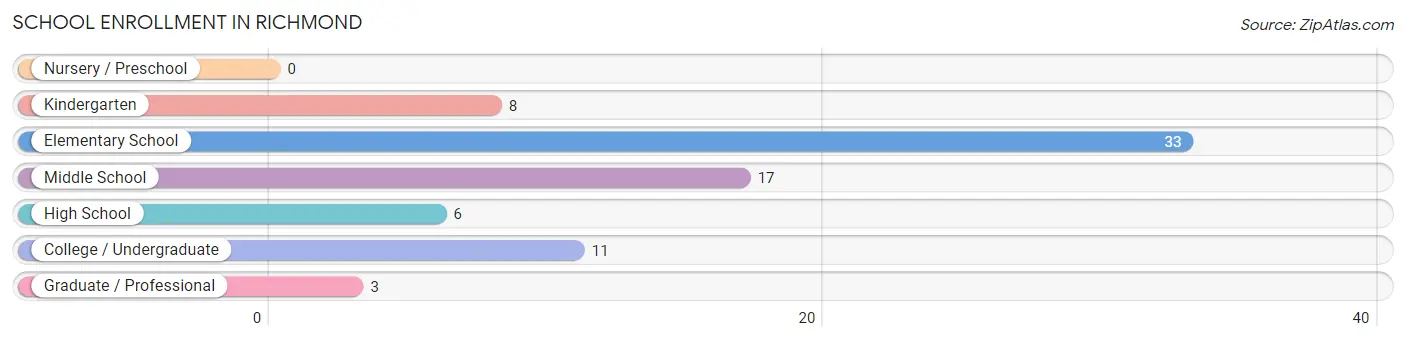
School Enrollment in Richmond
The most common levels of schooling among the 78 students in Richmond are elementary school (33 | 42.3%), middle school (17 | 21.8%), and college / undergraduate (11 | 14.1%).
| School Level | # Students | % Students |
| Nursery / Preschool | 0 | 0.0% |
| Kindergarten | 8 | 10.3% |
| Elementary School | 33 | 42.3% |
| Middle School | 17 | 21.8% |
| High School | 6 | 7.7% |
| College / Undergraduate | 11 | 14.1% |
| Graduate / Professional | 3 | 3.8% |
| Total | 78 | 100.0% |
School Enrollment by Age by Funding Source in Richmond
Out of a total of 78 students who are enrolled in schools in Richmond, 12 (15.4%) attend a private institution, while the remaining 66 (84.6%) are enrolled in public schools. The age group of 15 to 17 year olds has the highest likelihood of being enrolled in private schools, with 3 (75.0% in the age bracket) enrolled. Conversely, the age group of 5 to 9 year old has the lowest likelihood of being enrolled in a private school, with 34 (94.4% in the age bracket) attending a public institution.
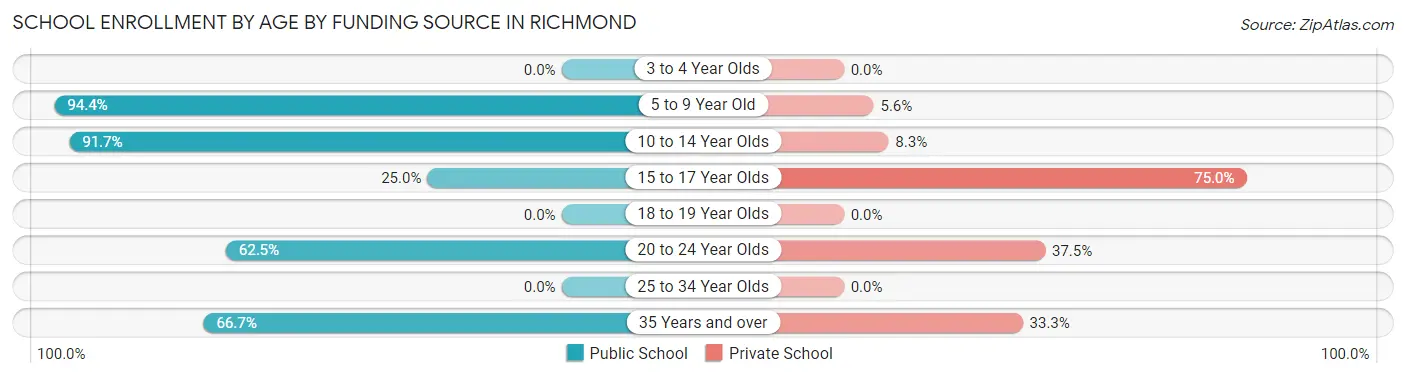
| Age Bracket | Public School | Private School |
| 3 to 4 Year Olds | 0 (0.0%) | 0 (0.0%) |
| 5 to 9 Year Old | 34 (94.4%) | 2 (5.6%) |
| 10 to 14 Year Olds | 22 (91.7%) | 2 (8.3%) |
| 15 to 17 Year Olds | 1 (25.0%) | 3 (75.0%) |
| 18 to 19 Year Olds | 0 (0.0%) | 0 (0.0%) |
| 20 to 24 Year Olds | 5 (62.5%) | 3 (37.5%) |
| 25 to 34 Year Olds | 0 (0.0%) | 0 (0.0%) |
| 35 Years and over | 4 (66.7%) | 2 (33.3%) |
| Total | 66 (84.6%) | 12 (15.4%) |
Educational Attainment by Field of Study in Richmond
Education (15 | 23.4%), liberal arts & history (14 | 21.9%), communications (7 | 10.9%), computers & mathematics (5 | 7.8%), and science & technology (5 | 7.8%) are the most common fields of study among 64 individuals in Richmond who have obtained a bachelor's degree or higher.
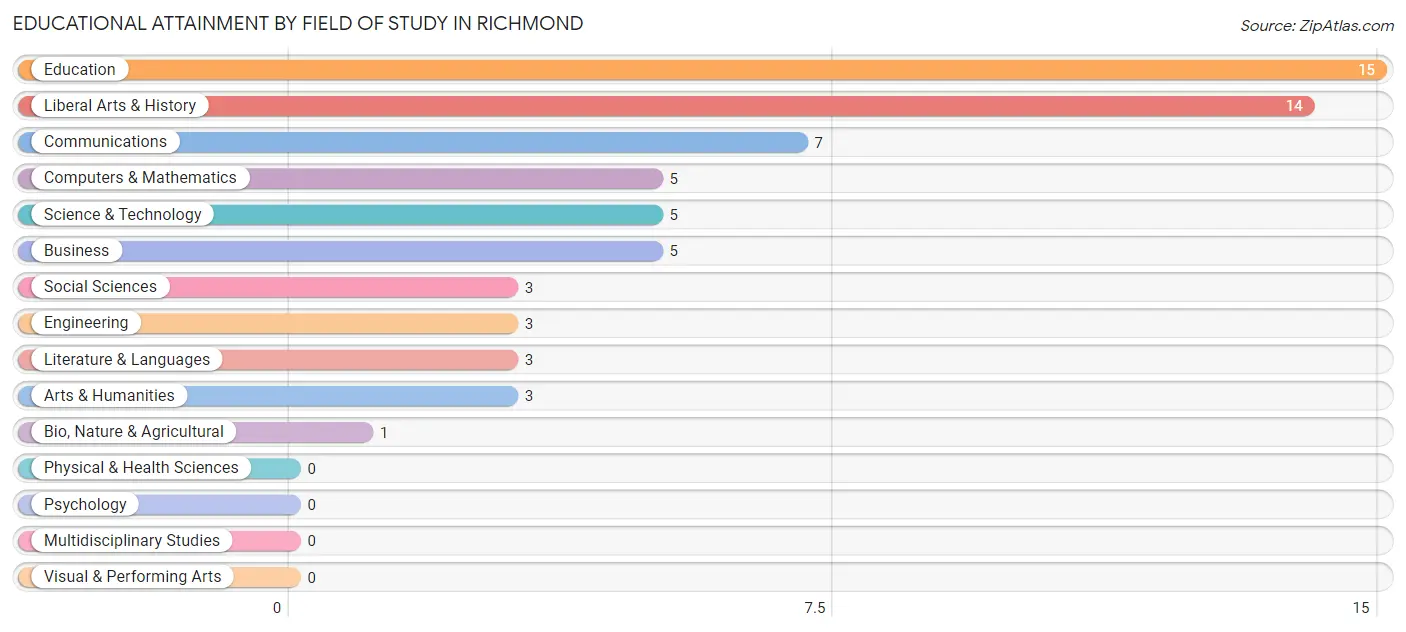
| Field of Study | # Graduates | % Graduates |
| Computers & Mathematics | 5 | 7.8% |
| Bio, Nature & Agricultural | 1 | 1.6% |
| Physical & Health Sciences | 0 | 0.0% |
| Psychology | 0 | 0.0% |
| Social Sciences | 3 | 4.7% |
| Engineering | 3 | 4.7% |
| Multidisciplinary Studies | 0 | 0.0% |
| Science & Technology | 5 | 7.8% |
| Business | 5 | 7.8% |
| Education | 15 | 23.4% |
| Literature & Languages | 3 | 4.7% |
| Liberal Arts & History | 14 | 21.9% |
| Visual & Performing Arts | 0 | 0.0% |
| Communications | 7 | 10.9% |
| Arts & Humanities | 3 | 4.7% |
| Total | 64 | 100.0% |
Transportation & Commute in Richmond
Vehicle Availability by Sex in Richmond
The most prevalent vehicle ownership categories in Richmond are males with 3 vehicles (44, accounting for 41.1%) and females with 3 vehicles (63, making up 34.9%).
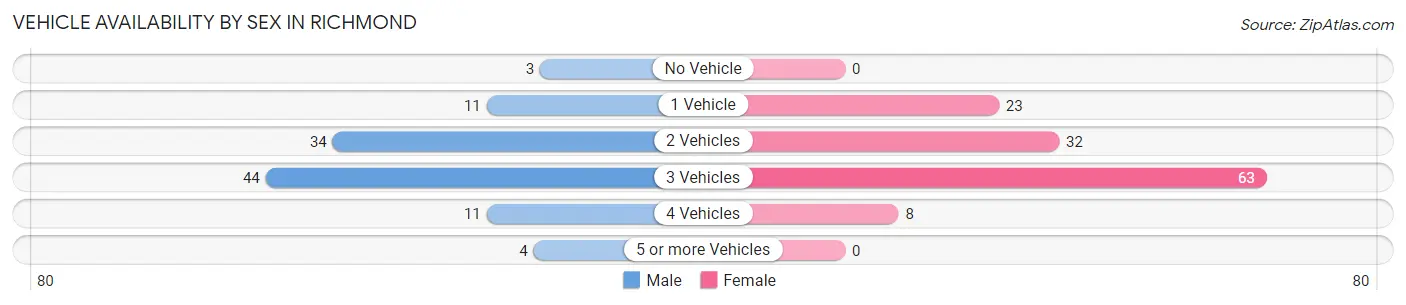
| Vehicles Available | Male | Female |
| No Vehicle | 3 (2.8%) | 0 (0.0%) |
| 1 Vehicle | 11 (10.3%) | 23 (18.2%) |
| 2 Vehicles | 34 (31.8%) | 32 (25.4%) |
| 3 Vehicles | 44 (41.1%) | 63 (50.0%) |
| 4 Vehicles | 11 (10.3%) | 8 (6.4%) |
| 5 or more Vehicles | 4 (3.7%) | 0 (0.0%) |
| Total | 107 (100.0%) | 126 (100.0%) |
Commute Time in Richmond
The most frequently occuring commute durations in Richmond are 20 to 24 minutes (82 commuters, 36.3%), 15 to 19 minutes (36 commuters, 15.9%), and less than 5 minutes (22 commuters, 9.7%).
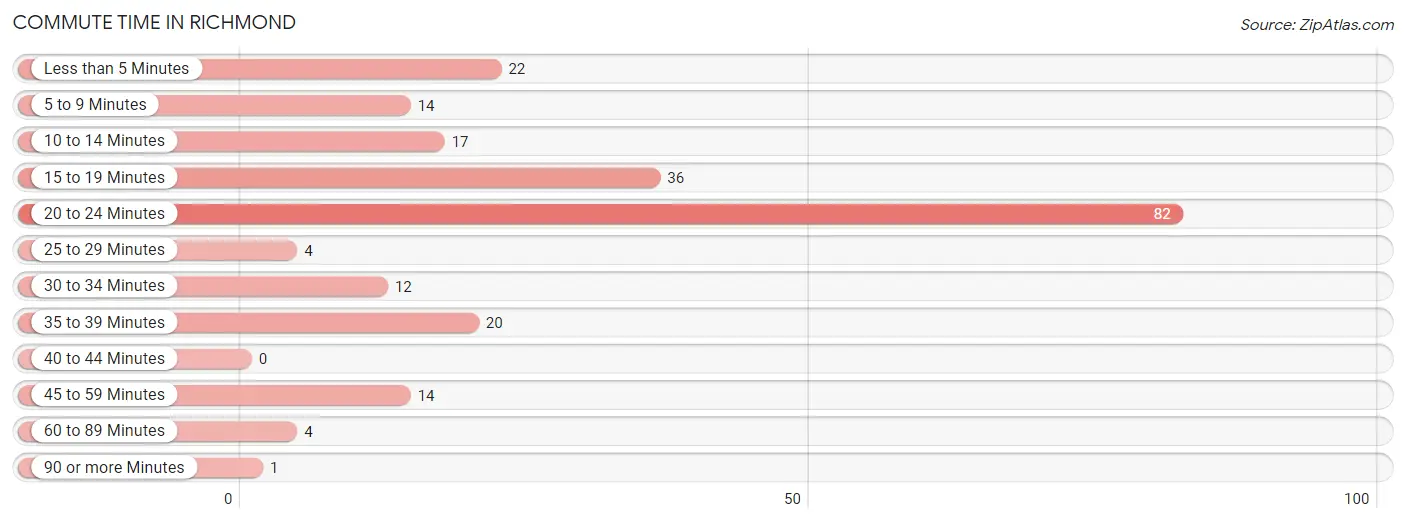
| Commute Time | # Commuters | % Commuters |
| Less than 5 Minutes | 22 | 9.7% |
| 5 to 9 Minutes | 14 | 6.2% |
| 10 to 14 Minutes | 17 | 7.5% |
| 15 to 19 Minutes | 36 | 15.9% |
| 20 to 24 Minutes | 82 | 36.3% |
| 25 to 29 Minutes | 4 | 1.8% |
| 30 to 34 Minutes | 12 | 5.3% |
| 35 to 39 Minutes | 20 | 8.8% |
| 40 to 44 Minutes | 0 | 0.0% |
| 45 to 59 Minutes | 14 | 6.2% |
| 60 to 89 Minutes | 4 | 1.8% |
| 90 or more Minutes | 1 | 0.4% |
Commute Time by Sex in Richmond
The most common commute times in Richmond are 20 to 24 minutes (28 commuters, 26.2%) for males and 20 to 24 minutes (54 commuters, 45.4%) for females.
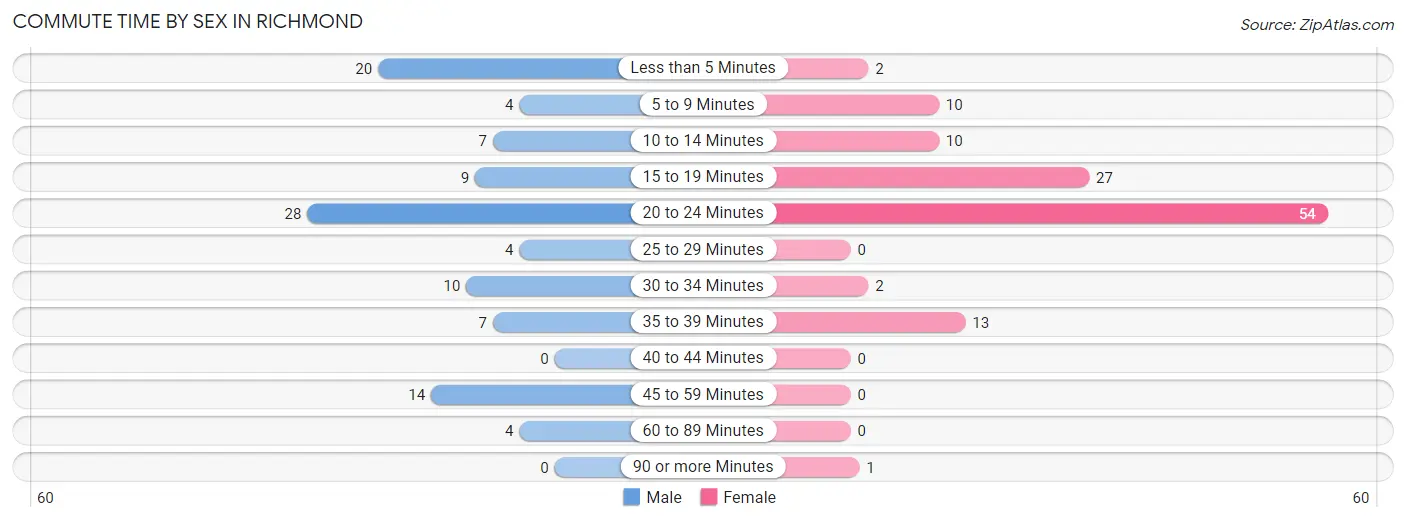
| Commute Time | Male | Female |
| Less than 5 Minutes | 20 (18.7%) | 2 (1.7%) |
| 5 to 9 Minutes | 4 (3.7%) | 10 (8.4%) |
| 10 to 14 Minutes | 7 (6.5%) | 10 (8.4%) |
| 15 to 19 Minutes | 9 (8.4%) | 27 (22.7%) |
| 20 to 24 Minutes | 28 (26.2%) | 54 (45.4%) |
| 25 to 29 Minutes | 4 (3.7%) | 0 (0.0%) |
| 30 to 34 Minutes | 10 (9.3%) | 2 (1.7%) |
| 35 to 39 Minutes | 7 (6.5%) | 13 (10.9%) |
| 40 to 44 Minutes | 0 (0.0%) | 0 (0.0%) |
| 45 to 59 Minutes | 14 (13.1%) | 0 (0.0%) |
| 60 to 89 Minutes | 4 (3.7%) | 0 (0.0%) |
| 90 or more Minutes | 0 (0.0%) | 1 (0.8%) |
Time of Departure to Work by Sex in Richmond
The most frequent times of departure to work in Richmond are 8:00 AM to 8:29 AM (26, 24.3%) for males and 4:00 PM to 11:59 PM (31, 26.1%) for females.
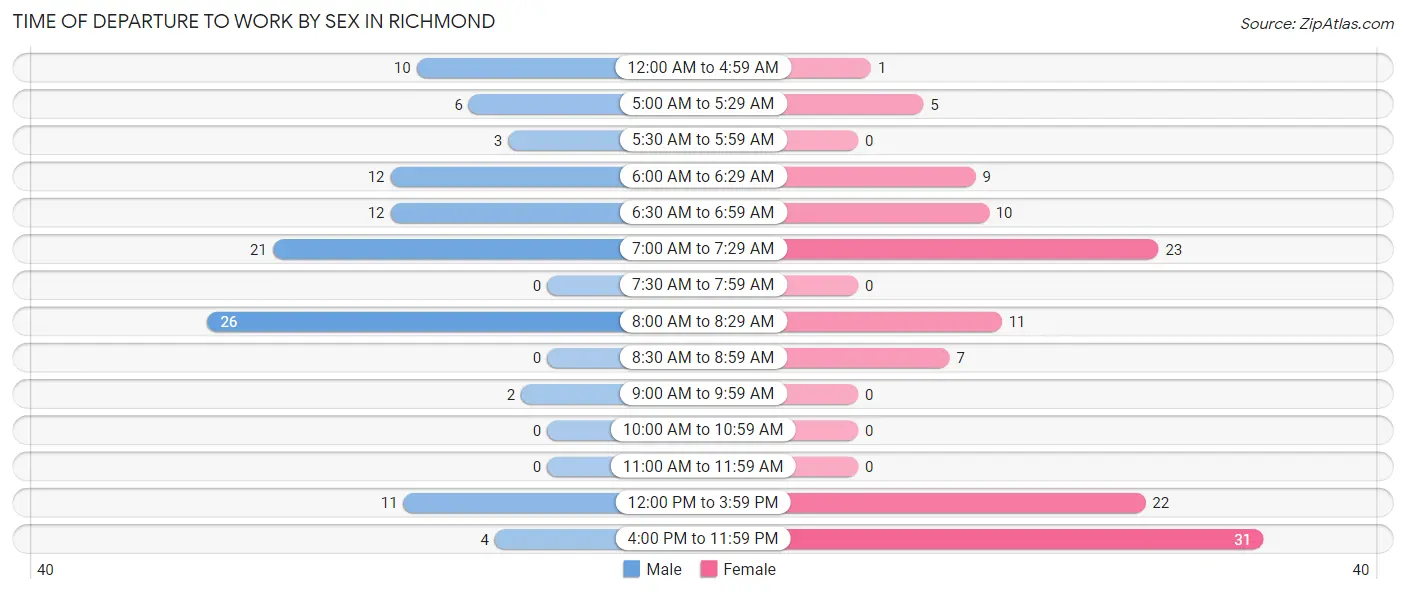
| Time of Departure | Male | Female |
| 12:00 AM to 4:59 AM | 10 (9.3%) | 1 (0.8%) |
| 5:00 AM to 5:29 AM | 6 (5.6%) | 5 (4.2%) |
| 5:30 AM to 5:59 AM | 3 (2.8%) | 0 (0.0%) |
| 6:00 AM to 6:29 AM | 12 (11.2%) | 9 (7.6%) |
| 6:30 AM to 6:59 AM | 12 (11.2%) | 10 (8.4%) |
| 7:00 AM to 7:29 AM | 21 (19.6%) | 23 (19.3%) |
| 7:30 AM to 7:59 AM | 0 (0.0%) | 0 (0.0%) |
| 8:00 AM to 8:29 AM | 26 (24.3%) | 11 (9.2%) |
| 8:30 AM to 8:59 AM | 0 (0.0%) | 7 (5.9%) |
| 9:00 AM to 9:59 AM | 2 (1.9%) | 0 (0.0%) |
| 10:00 AM to 10:59 AM | 0 (0.0%) | 0 (0.0%) |
| 11:00 AM to 11:59 AM | 0 (0.0%) | 0 (0.0%) |
| 12:00 PM to 3:59 PM | 11 (10.3%) | 22 (18.5%) |
| 4:00 PM to 11:59 PM | 4 (3.7%) | 31 (26.1%) |
| Total | 107 (100.0%) | 119 (100.0%) |
Housing Occupancy in Richmond
Occupancy by Ownership in Richmond
Of the total 240 dwellings in Richmond, owner-occupied units account for 162 (67.5%), while renter-occupied units make up 78 (32.5%).
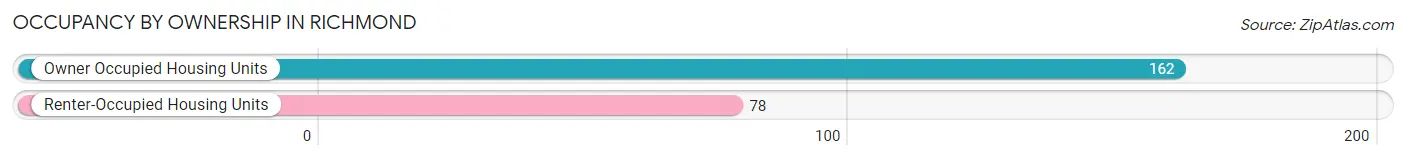
| Occupancy | # Housing Units | % Housing Units |
| Owner Occupied Housing Units | 162 | 67.5% |
| Renter-Occupied Housing Units | 78 | 32.5% |
| Total Occupied Housing Units | 240 | 100.0% |
Occupancy by Household Size in Richmond
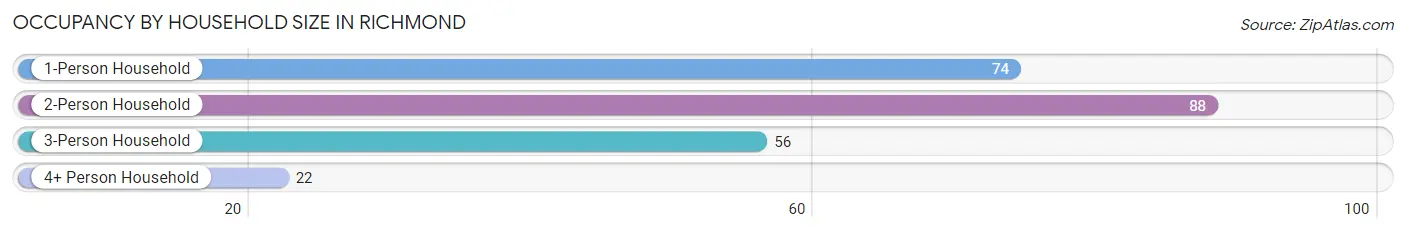
| Household Size | # Housing Units | % Housing Units |
| 1-Person Household | 74 | 30.8% |
| 2-Person Household | 88 | 36.7% |
| 3-Person Household | 56 | 23.3% |
| 4+ Person Household | 22 | 9.2% |
| Total Housing Units | 240 | 100.0% |
Occupancy by Ownership by Household Size in Richmond
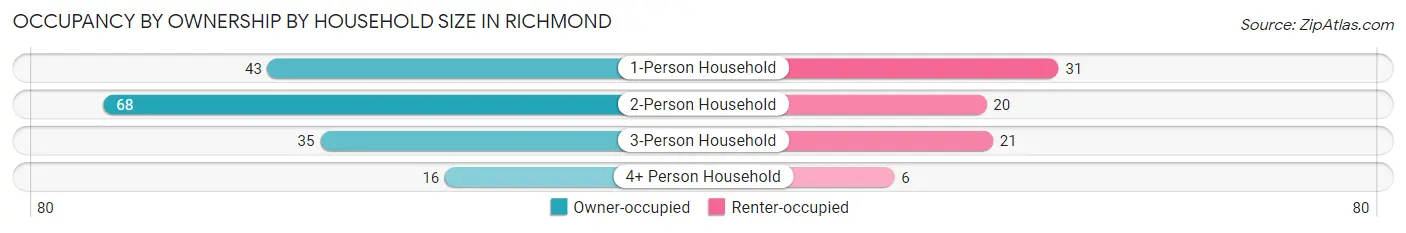
| Household Size | Owner-occupied | Renter-occupied |
| 1-Person Household | 43 (58.1%) | 31 (41.9%) |
| 2-Person Household | 68 (77.3%) | 20 (22.7%) |
| 3-Person Household | 35 (62.5%) | 21 (37.5%) |
| 4+ Person Household | 16 (72.7%) | 6 (27.3%) |
| Total Housing Units | 162 (67.5%) | 78 (32.5%) |
Occupancy by Educational Attainment in Richmond
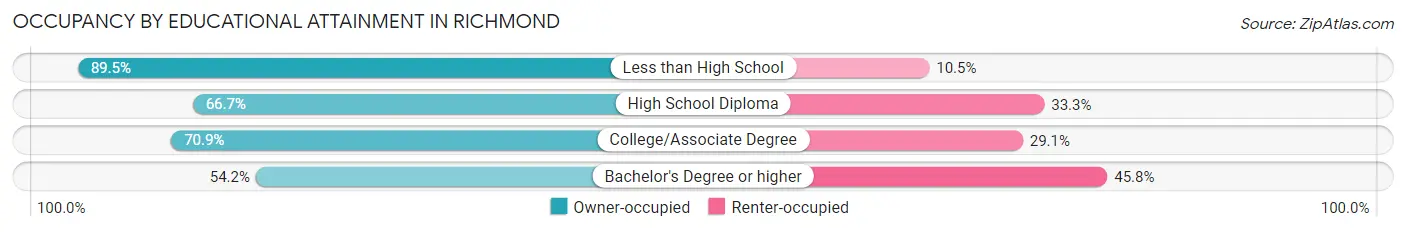
| Household Size | Owner-occupied | Renter-occupied |
| Less than High School | 17 (89.5%) | 2 (10.5%) |
| High School Diploma | 58 (66.7%) | 29 (33.3%) |
| College/Associate Degree | 61 (70.9%) | 25 (29.1%) |
| Bachelor's Degree or higher | 26 (54.2%) | 22 (45.8%) |
Occupancy by Age of Householder in Richmond
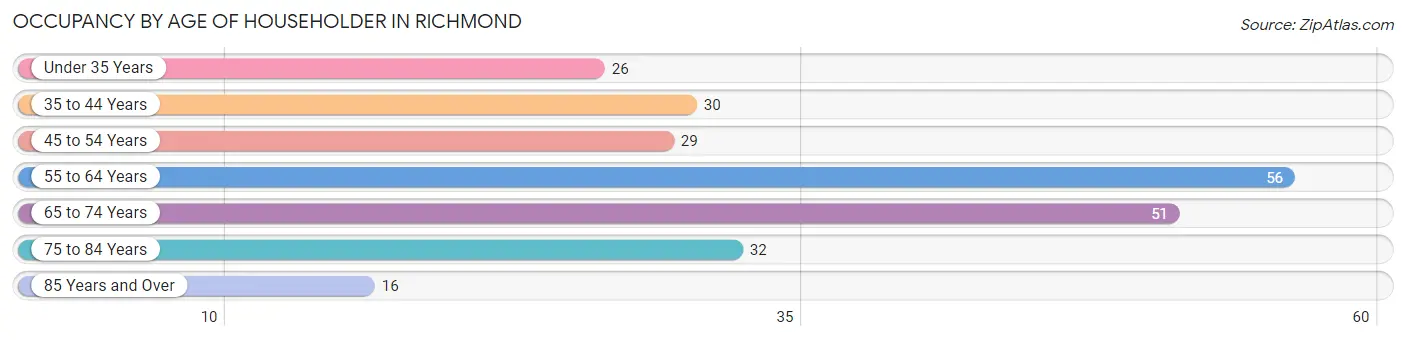
| Age Bracket | # Households | % Households |
| Under 35 Years | 26 | 10.8% |
| 35 to 44 Years | 30 | 12.5% |
| 45 to 54 Years | 29 | 12.1% |
| 55 to 64 Years | 56 | 23.3% |
| 65 to 74 Years | 51 | 21.2% |
| 75 to 84 Years | 32 | 13.3% |
| 85 Years and Over | 16 | 6.7% |
| Total | 240 | 100.0% |
Housing Finances in Richmond
Median Income by Occupancy in Richmond
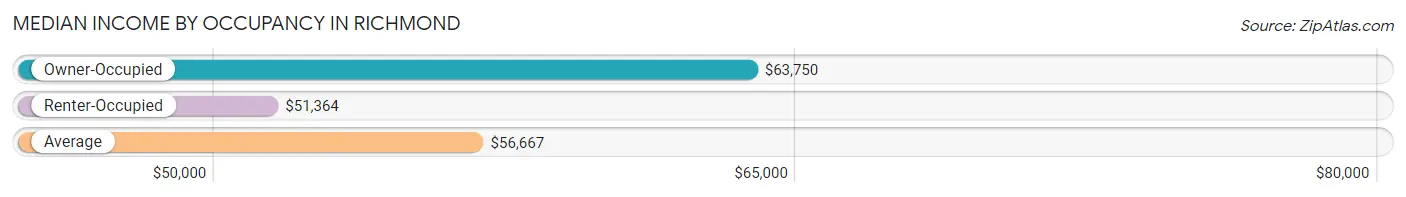
| Occupancy Type | # Households | Median Income |
| Owner-Occupied | 162 (67.5%) | $63,750 |
| Renter-Occupied | 78 (32.5%) | $51,364 |
| Average | 240 (100.0%) | $56,667 |
Occupancy by Householder Income Bracket in Richmond
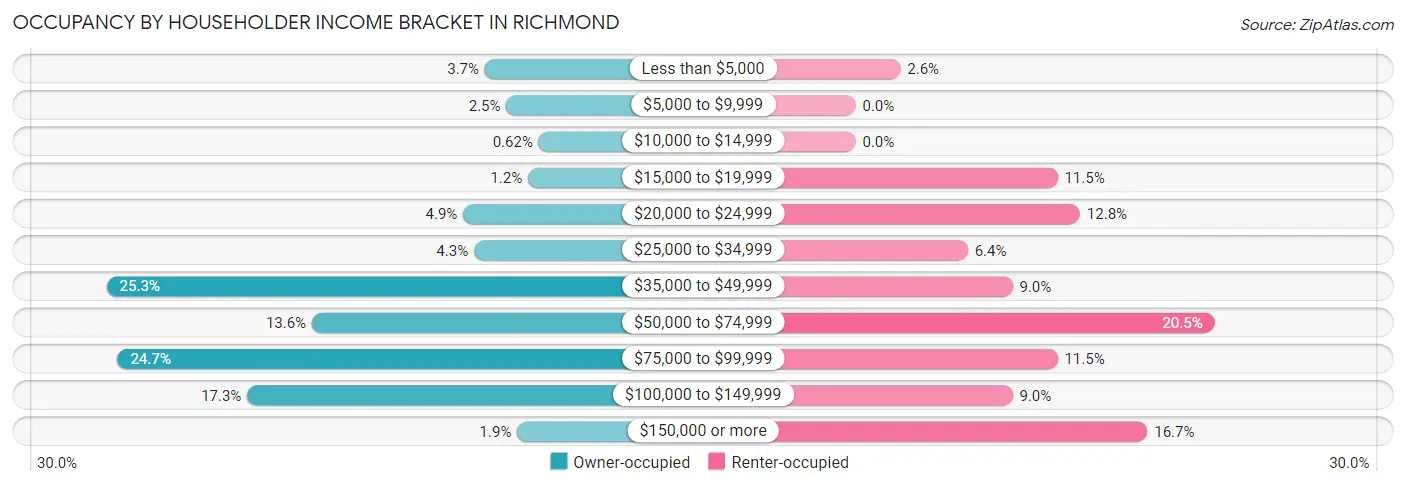
| Income Bracket | Owner-occupied | Renter-occupied |
| Less than $5,000 | 6 (3.7%) | 2 (2.6%) |
| $5,000 to $9,999 | 4 (2.5%) | 0 (0.0%) |
| $10,000 to $14,999 | 1 (0.6%) | 0 (0.0%) |
| $15,000 to $19,999 | 2 (1.2%) | 9 (11.5%) |
| $20,000 to $24,999 | 8 (4.9%) | 10 (12.8%) |
| $25,000 to $34,999 | 7 (4.3%) | 5 (6.4%) |
| $35,000 to $49,999 | 41 (25.3%) | 7 (9.0%) |
| $50,000 to $74,999 | 22 (13.6%) | 16 (20.5%) |
| $75,000 to $99,999 | 40 (24.7%) | 9 (11.5%) |
| $100,000 to $149,999 | 28 (17.3%) | 7 (9.0%) |
| $150,000 or more | 3 (1.8%) | 13 (16.7%) |
| Total | 162 (100.0%) | 78 (100.0%) |
Monthly Housing Cost Tiers in Richmond
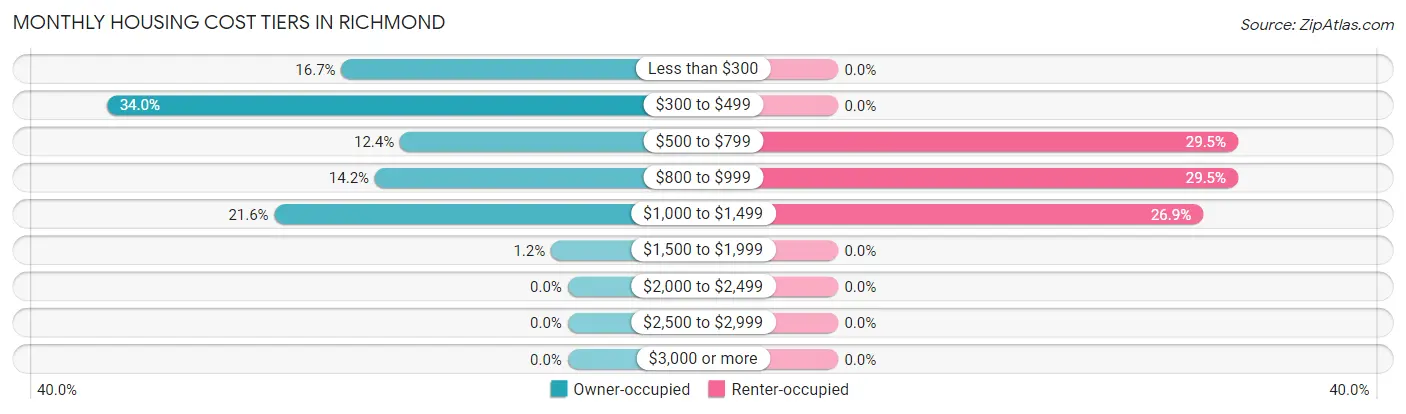
| Monthly Cost | Owner-occupied | Renter-occupied |
| Less than $300 | 27 (16.7%) | 0 (0.0%) |
| $300 to $499 | 55 (34.0%) | 0 (0.0%) |
| $500 to $799 | 20 (12.3%) | 23 (29.5%) |
| $800 to $999 | 23 (14.2%) | 23 (29.5%) |
| $1,000 to $1,499 | 35 (21.6%) | 21 (26.9%) |
| $1,500 to $1,999 | 2 (1.2%) | 0 (0.0%) |
| $2,000 to $2,499 | 0 (0.0%) | 0 (0.0%) |
| $2,500 to $2,999 | 0 (0.0%) | 0 (0.0%) |
| $3,000 or more | 0 (0.0%) | 0 (0.0%) |
| Total | 162 (100.0%) | 78 (100.0%) |
Physical Housing Characteristics in Richmond
Housing Structures in Richmond
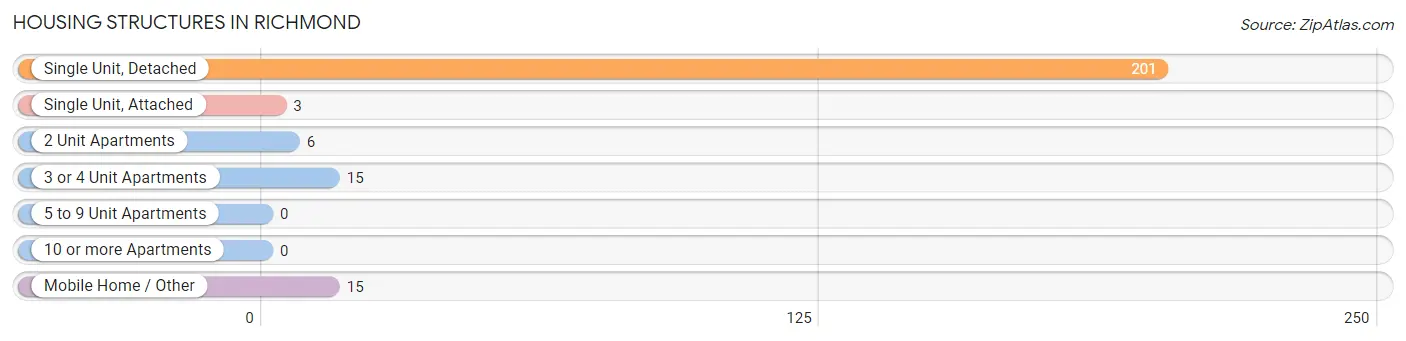
| Structure Type | # Housing Units | % Housing Units |
| Single Unit, Detached | 201 | 83.8% |
| Single Unit, Attached | 3 | 1.3% |
| 2 Unit Apartments | 6 | 2.5% |
| 3 or 4 Unit Apartments | 15 | 6.2% |
| 5 to 9 Unit Apartments | 0 | 0.0% |
| 10 or more Apartments | 0 | 0.0% |
| Mobile Home / Other | 15 | 6.2% |
| Total | 240 | 100.0% |
Housing Structures by Occupancy in Richmond
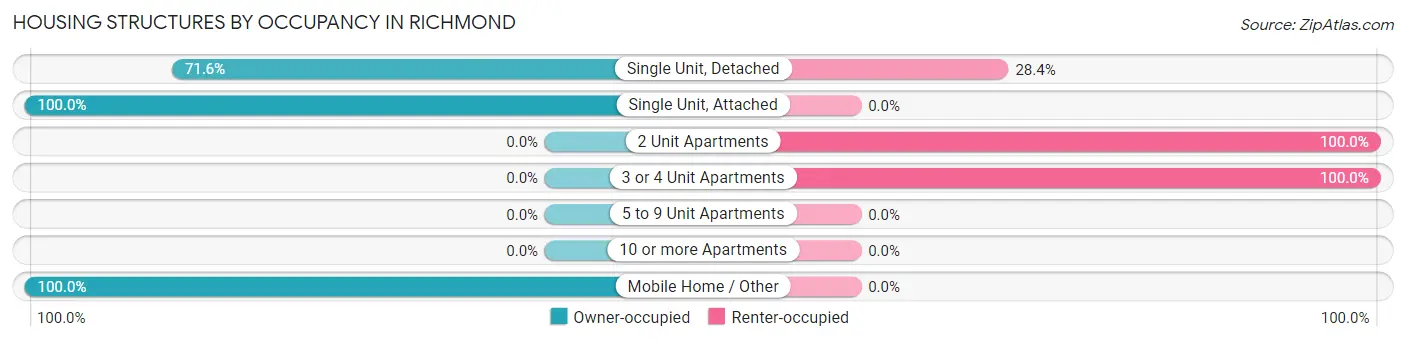
| Structure Type | Owner-occupied | Renter-occupied |
| Single Unit, Detached | 144 (71.6%) | 57 (28.4%) |
| Single Unit, Attached | 3 (100.0%) | 0 (0.0%) |
| 2 Unit Apartments | 0 (0.0%) | 6 (100.0%) |
| 3 or 4 Unit Apartments | 0 (0.0%) | 15 (100.0%) |
| 5 to 9 Unit Apartments | 0 (0.0%) | 0 (0.0%) |
| 10 or more Apartments | 0 (0.0%) | 0 (0.0%) |
| Mobile Home / Other | 15 (100.0%) | 0 (0.0%) |
| Total | 162 (67.5%) | 78 (32.5%) |
Housing Structures by Number of Rooms in Richmond
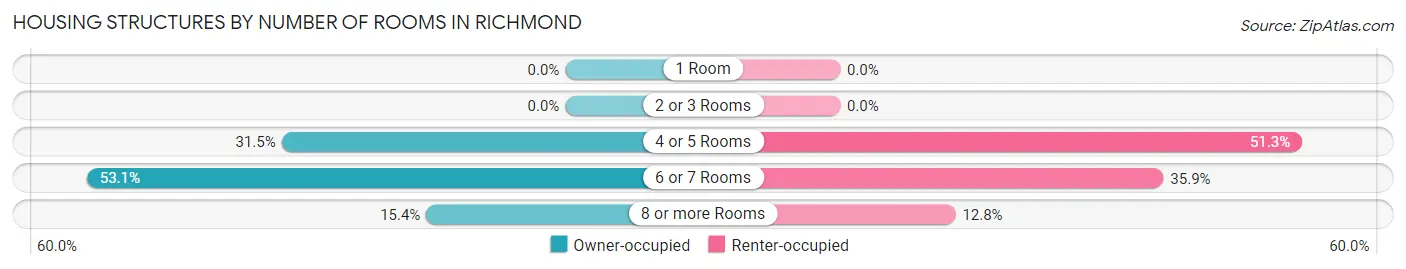
| Number of Rooms | Owner-occupied | Renter-occupied |
| 1 Room | 0 (0.0%) | 0 (0.0%) |
| 2 or 3 Rooms | 0 (0.0%) | 0 (0.0%) |
| 4 or 5 Rooms | 51 (31.5%) | 40 (51.3%) |
| 6 or 7 Rooms | 86 (53.1%) | 28 (35.9%) |
| 8 or more Rooms | 25 (15.4%) | 10 (12.8%) |
| Total | 162 (100.0%) | 78 (100.0%) |
Housing Structure by Heating Type in Richmond
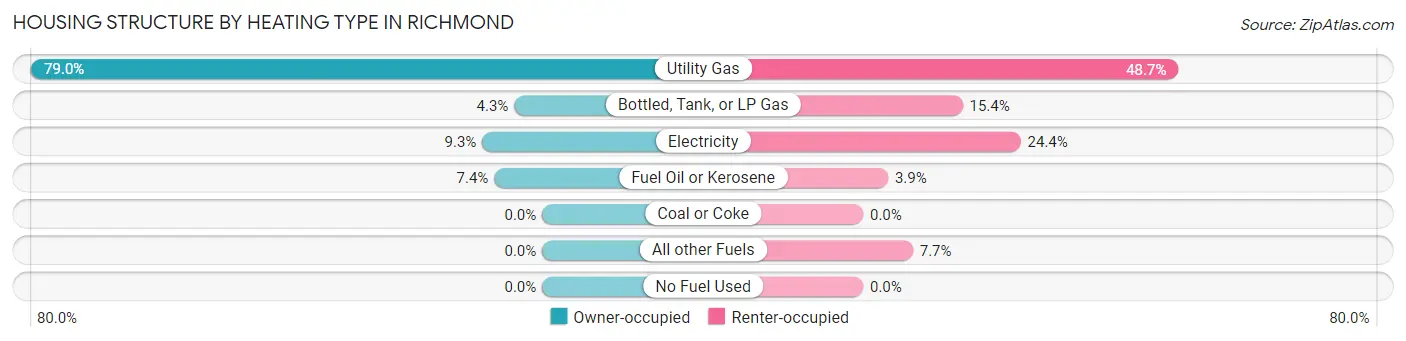
| Heating Type | Owner-occupied | Renter-occupied |
| Utility Gas | 128 (79.0%) | 38 (48.7%) |
| Bottled, Tank, or LP Gas | 7 (4.3%) | 12 (15.4%) |
| Electricity | 15 (9.3%) | 19 (24.4%) |
| Fuel Oil or Kerosene | 12 (7.4%) | 3 (3.8%) |
| Coal or Coke | 0 (0.0%) | 0 (0.0%) |
| All other Fuels | 0 (0.0%) | 6 (7.7%) |
| No Fuel Used | 0 (0.0%) | 0 (0.0%) |
| Total | 162 (100.0%) | 78 (100.0%) |
Household Vehicle Usage in Richmond
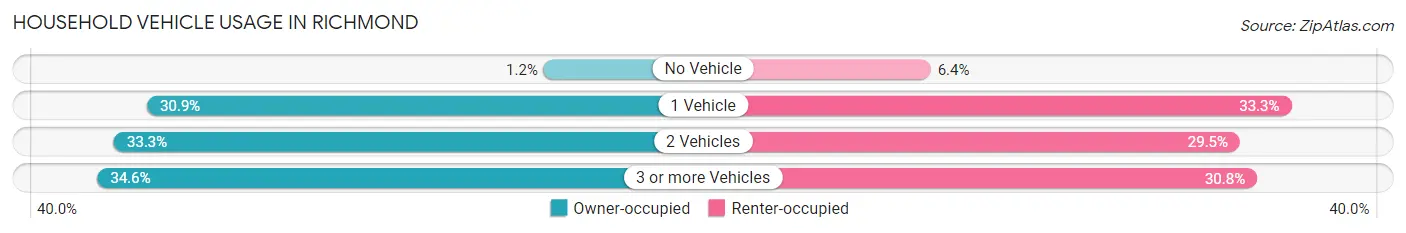
| Vehicles per Household | Owner-occupied | Renter-occupied |
| No Vehicle | 2 (1.2%) | 5 (6.4%) |
| 1 Vehicle | 50 (30.9%) | 26 (33.3%) |
| 2 Vehicles | 54 (33.3%) | 23 (29.5%) |
| 3 or more Vehicles | 56 (34.6%) | 24 (30.8%) |
| Total | 162 (100.0%) | 78 (100.0%) |
Real Estate & Mortgages in Richmond
Real Estate and Mortgage Overview in Richmond
| Characteristic | Without Mortgage | With Mortgage |
| Housing Units | 89 | 73 |
| Median Property Value | $122,300 | $109,000 |
| Median Household Income | $44,821 | $3 |
| Monthly Housing Costs | $414 | $0 |
| Real Estate Taxes | $1,150 | $3 |
Property Value by Mortgage Status in Richmond
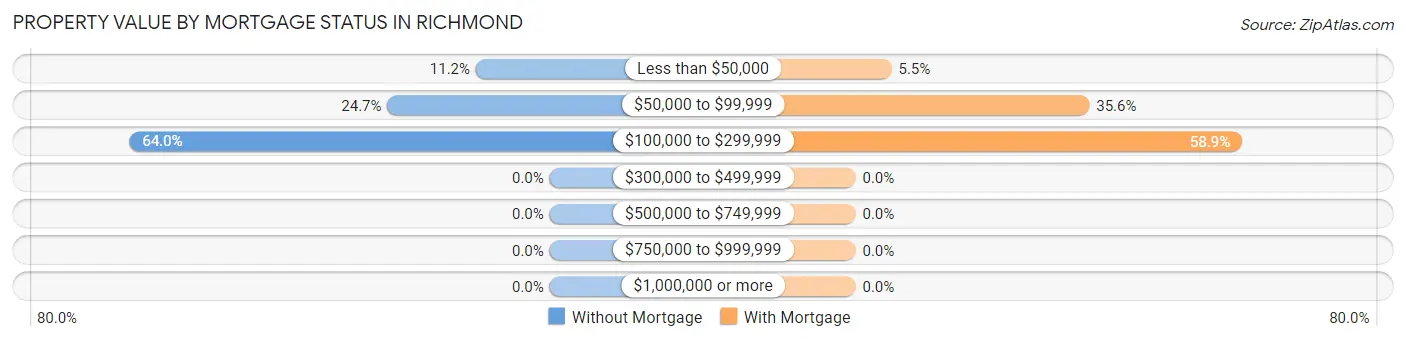
| Property Value | Without Mortgage | With Mortgage |
| Less than $50,000 | 10 (11.2%) | 4 (5.5%) |
| $50,000 to $99,999 | 22 (24.7%) | 26 (35.6%) |
| $100,000 to $299,999 | 57 (64.0%) | 43 (58.9%) |
| $300,000 to $499,999 | 0 (0.0%) | 0 (0.0%) |
| $500,000 to $749,999 | 0 (0.0%) | 0 (0.0%) |
| $750,000 to $999,999 | 0 (0.0%) | 0 (0.0%) |
| $1,000,000 or more | 0 (0.0%) | 0 (0.0%) |
| Total | 89 (100.0%) | 73 (100.0%) |
Household Income by Mortgage Status in Richmond
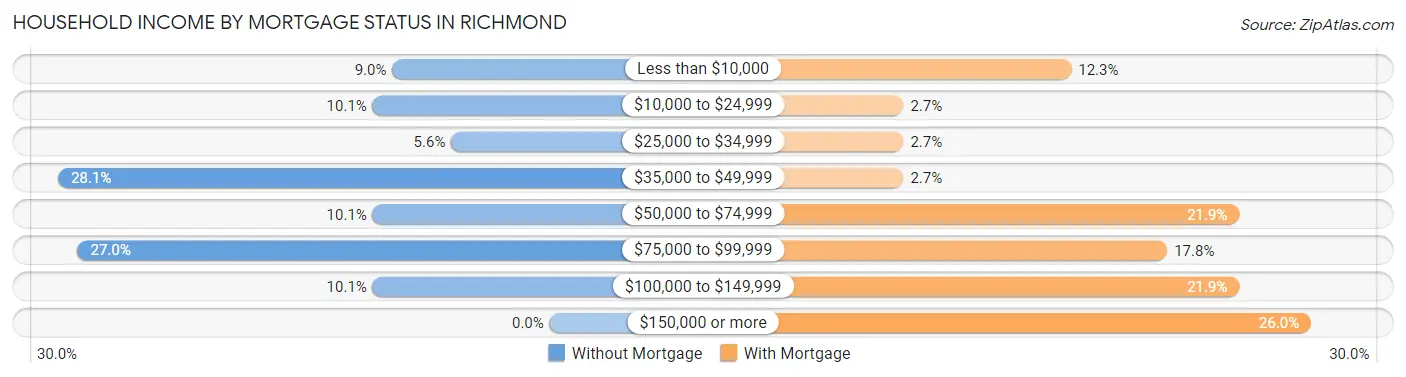
| Household Income | Without Mortgage | With Mortgage |
| Less than $10,000 | 8 (9.0%) | 9 (12.3%) |
| $10,000 to $24,999 | 9 (10.1%) | 2 (2.7%) |
| $25,000 to $34,999 | 5 (5.6%) | 2 (2.7%) |
| $35,000 to $49,999 | 25 (28.1%) | 2 (2.7%) |
| $50,000 to $74,999 | 9 (10.1%) | 16 (21.9%) |
| $75,000 to $99,999 | 24 (27.0%) | 13 (17.8%) |
| $100,000 to $149,999 | 9 (10.1%) | 16 (21.9%) |
| $150,000 or more | 0 (0.0%) | 19 (26.0%) |
| Total | 89 (100.0%) | 73 (100.0%) |
Property Value to Household Income Ratio in Richmond
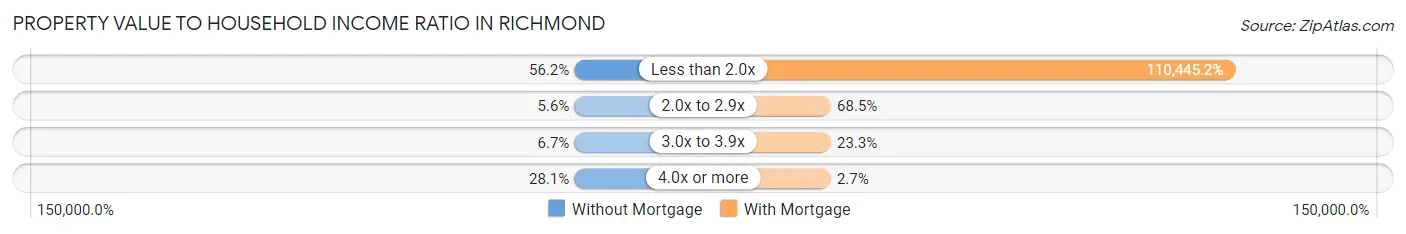
| Value-to-Income Ratio | Without Mortgage | With Mortgage |
| Less than 2.0x | 50 (56.2%) | 80,625 (110,445.2%) |
| 2.0x to 2.9x | 5 (5.6%) | 50 (68.5%) |
| 3.0x to 3.9x | 6 (6.7%) | 17 (23.3%) |
| 4.0x or more | 25 (28.1%) | 2 (2.7%) |
| Total | 89 (100.0%) | 73 (100.0%) |
Real Estate Taxes by Mortgage Status in Richmond
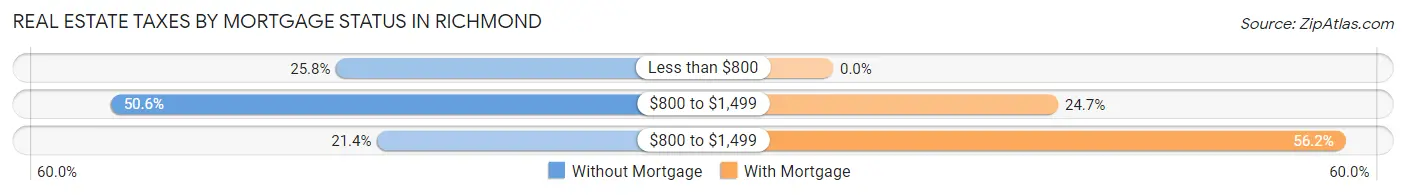
| Property Taxes | Without Mortgage | With Mortgage |
| Less than $800 | 23 (25.8%) | 0 (0.0%) |
| $800 to $1,499 | 45 (50.6%) | 18 (24.7%) |
| $800 to $1,499 | 19 (21.3%) | 41 (56.2%) |
| Total | 89 (100.0%) | 73 (100.0%) |
Health & Disability in Richmond
Health Insurance Coverage by Age in Richmond
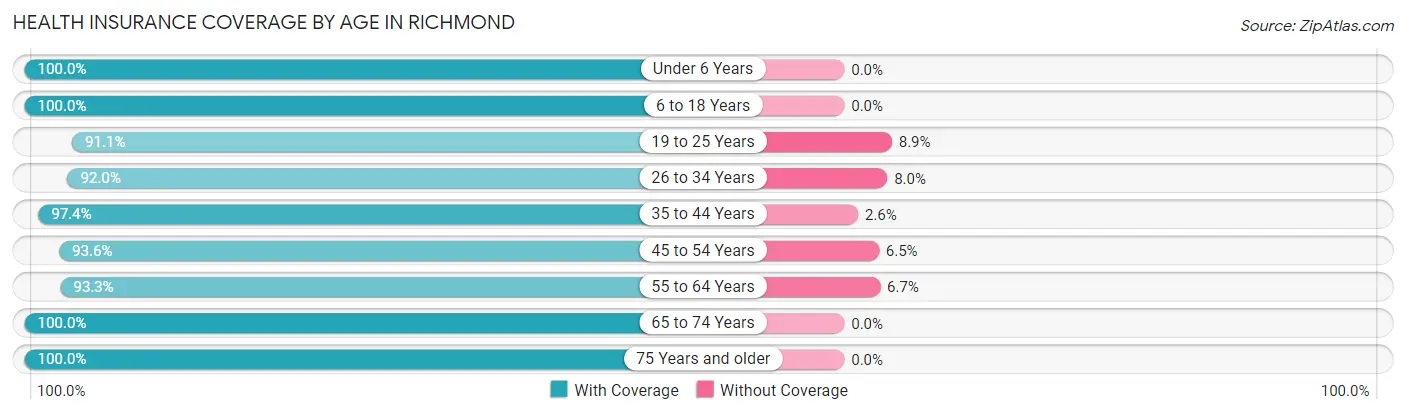
| Age Bracket | With Coverage | Without Coverage |
| Under 6 Years | 25 (100.0%) | 0 (0.0%) |
| 6 to 18 Years | 64 (100.0%) | 0 (0.0%) |
| 19 to 25 Years | 72 (91.1%) | 7 (8.9%) |
| 26 to 34 Years | 23 (92.0%) | 2 (8.0%) |
| 35 to 44 Years | 38 (97.4%) | 1 (2.6%) |
| 45 to 54 Years | 58 (93.5%) | 4 (6.5%) |
| 55 to 64 Years | 98 (93.3%) | 7 (6.7%) |
| 65 to 74 Years | 94 (100.0%) | 0 (0.0%) |
| 75 Years and older | 62 (100.0%) | 0 (0.0%) |
| Total | 534 (96.2%) | 21 (3.8%) |
Health Insurance Coverage by Citizenship Status in Richmond
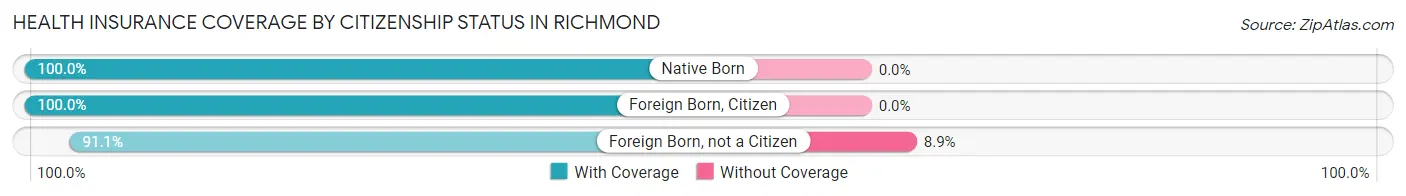
| Citizenship Status | With Coverage | Without Coverage |
| Native Born | 25 (100.0%) | 0 (0.0%) |
| Foreign Born, Citizen | 64 (100.0%) | 0 (0.0%) |
| Foreign Born, not a Citizen | 72 (91.1%) | 7 (8.9%) |
Health Insurance Coverage by Household Income in Richmond
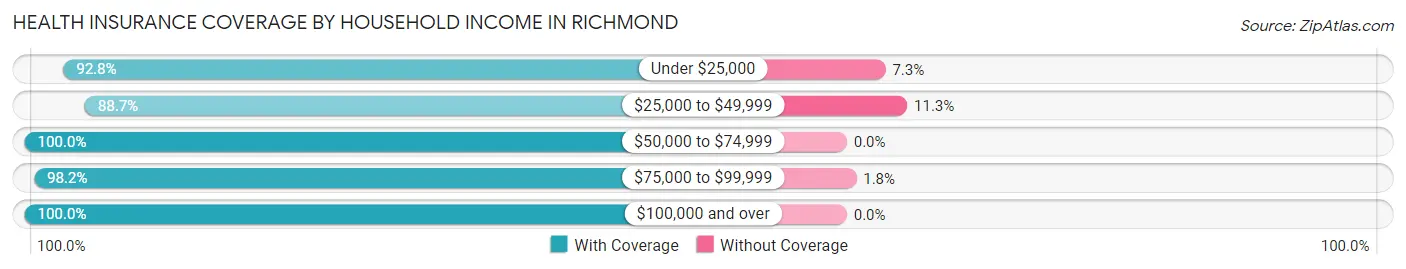
| Household Income | With Coverage | Without Coverage |
| Under $25,000 | 64 (92.7%) | 5 (7.2%) |
| $25,000 to $49,999 | 102 (88.7%) | 13 (11.3%) |
| $50,000 to $74,999 | 68 (100.0%) | 0 (0.0%) |
| $75,000 to $99,999 | 166 (98.2%) | 3 (1.8%) |
| $100,000 and over | 134 (100.0%) | 0 (0.0%) |
Public vs Private Health Insurance Coverage by Age in Richmond
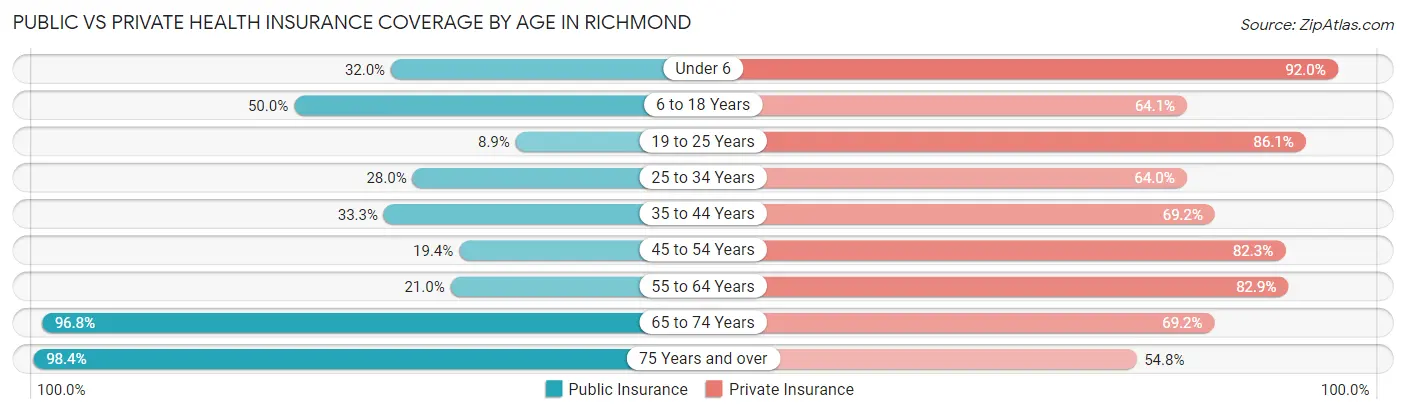
| Age Bracket | Public Insurance | Private Insurance |
| Under 6 | 8 (32.0%) | 23 (92.0%) |
| 6 to 18 Years | 32 (50.0%) | 41 (64.1%) |
| 19 to 25 Years | 7 (8.9%) | 68 (86.1%) |
| 25 to 34 Years | 7 (28.0%) | 16 (64.0%) |
| 35 to 44 Years | 13 (33.3%) | 27 (69.2%) |
| 45 to 54 Years | 12 (19.4%) | 51 (82.3%) |
| 55 to 64 Years | 22 (20.9%) | 87 (82.9%) |
| 65 to 74 Years | 91 (96.8%) | 65 (69.2%) |
| 75 Years and over | 61 (98.4%) | 34 (54.8%) |
| Total | 253 (45.6%) | 412 (74.2%) |
Disability Status by Sex by Age in Richmond
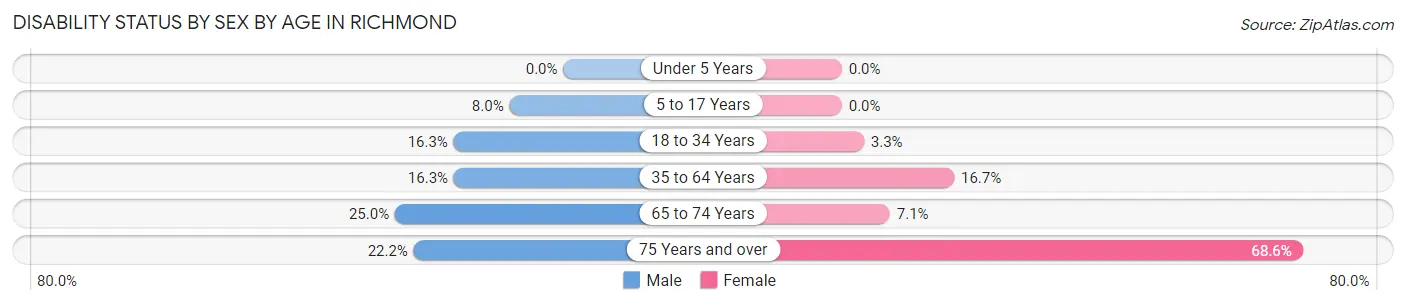
| Age Bracket | Male | Female |
| Under 5 Years | 0 (0.0%) | 0 (0.0%) |
| 5 to 17 Years | 2 (8.0%) | 0 (0.0%) |
| 18 to 34 Years | 7 (16.3%) | 2 (3.3%) |
| 35 to 64 Years | 13 (16.3%) | 21 (16.7%) |
| 65 to 74 Years | 13 (25.0%) | 3 (7.1%) |
| 75 Years and over | 6 (22.2%) | 24 (68.6%) |
Disability Class by Sex by Age in Richmond
Disability Class: Hearing Difficulty
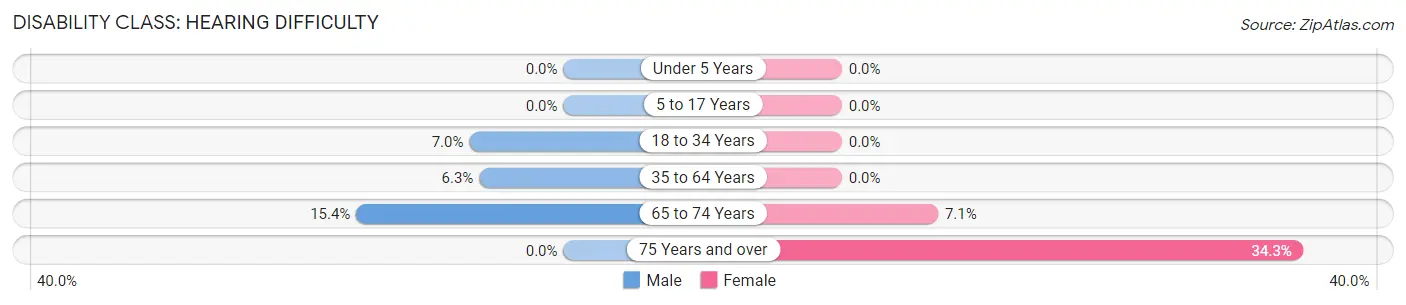
| Age Bracket | Male | Female |
| Under 5 Years | 0 (0.0%) | 0 (0.0%) |
| 5 to 17 Years | 0 (0.0%) | 0 (0.0%) |
| 18 to 34 Years | 3 (7.0%) | 0 (0.0%) |
| 35 to 64 Years | 5 (6.2%) | 0 (0.0%) |
| 65 to 74 Years | 8 (15.4%) | 3 (7.1%) |
| 75 Years and over | 0 (0.0%) | 12 (34.3%) |
Disability Class: Vision Difficulty
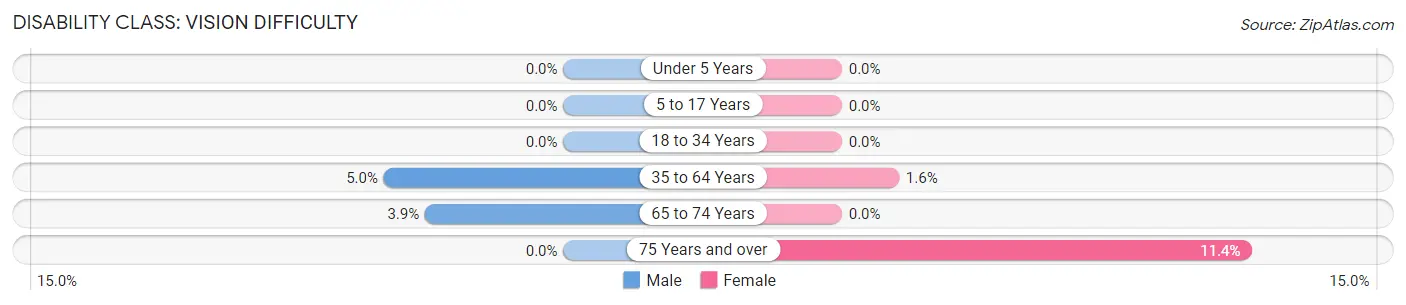
| Age Bracket | Male | Female |
| Under 5 Years | 0 (0.0%) | 0 (0.0%) |
| 5 to 17 Years | 0 (0.0%) | 0 (0.0%) |
| 18 to 34 Years | 0 (0.0%) | 0 (0.0%) |
| 35 to 64 Years | 4 (5.0%) | 2 (1.6%) |
| 65 to 74 Years | 2 (3.8%) | 0 (0.0%) |
| 75 Years and over | 0 (0.0%) | 4 (11.4%) |
Disability Class: Cognitive Difficulty
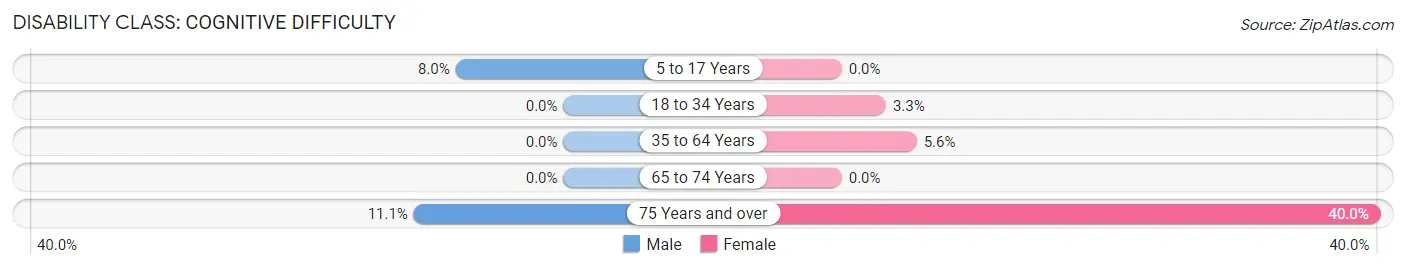
| Age Bracket | Male | Female |
| 5 to 17 Years | 2 (8.0%) | 0 (0.0%) |
| 18 to 34 Years | 0 (0.0%) | 2 (3.3%) |
| 35 to 64 Years | 0 (0.0%) | 7 (5.6%) |
| 65 to 74 Years | 0 (0.0%) | 0 (0.0%) |
| 75 Years and over | 3 (11.1%) | 14 (40.0%) |
Disability Class: Ambulatory Difficulty
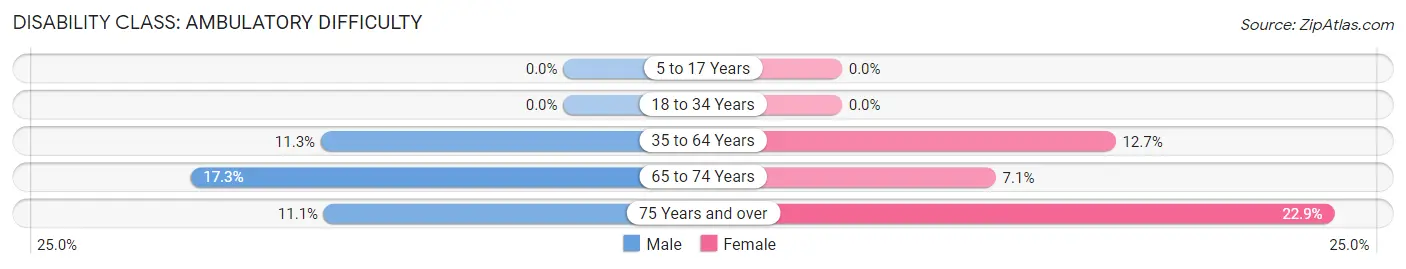
| Age Bracket | Male | Female |
| 5 to 17 Years | 0 (0.0%) | 0 (0.0%) |
| 18 to 34 Years | 0 (0.0%) | 0 (0.0%) |
| 35 to 64 Years | 9 (11.3%) | 16 (12.7%) |
| 65 to 74 Years | 9 (17.3%) | 3 (7.1%) |
| 75 Years and over | 3 (11.1%) | 8 (22.9%) |
Disability Class: Self-Care Difficulty
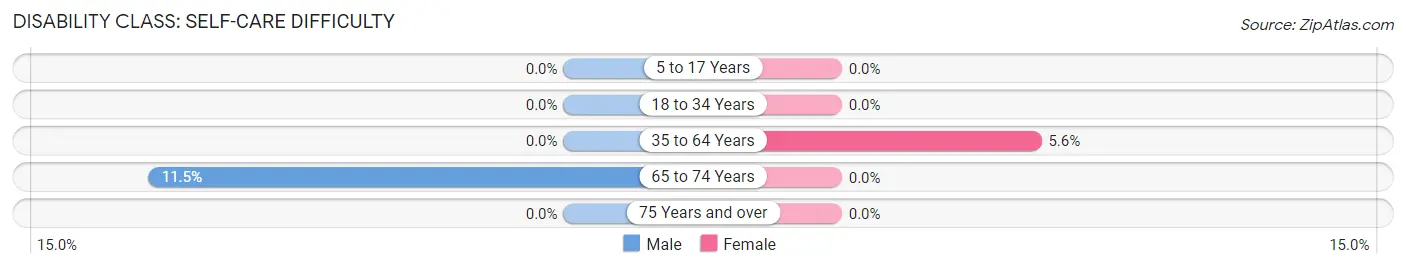
| Age Bracket | Male | Female |
| 5 to 17 Years | 0 (0.0%) | 0 (0.0%) |
| 18 to 34 Years | 0 (0.0%) | 0 (0.0%) |
| 35 to 64 Years | 0 (0.0%) | 7 (5.6%) |
| 65 to 74 Years | 6 (11.5%) | 0 (0.0%) |
| 75 Years and over | 0 (0.0%) | 0 (0.0%) |
Technology Access in Richmond
Computing Device Access in Richmond
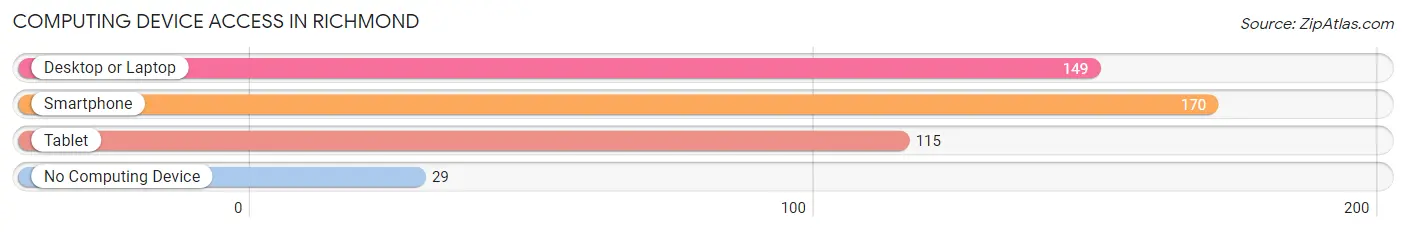
| Device Type | # Households | % Households |
| Desktop or Laptop | 149 | 62.1% |
| Smartphone | 170 | 70.8% |
| Tablet | 115 | 47.9% |
| No Computing Device | 29 | 12.1% |
| Total | 240 | 100.0% |
Internet Access in Richmond
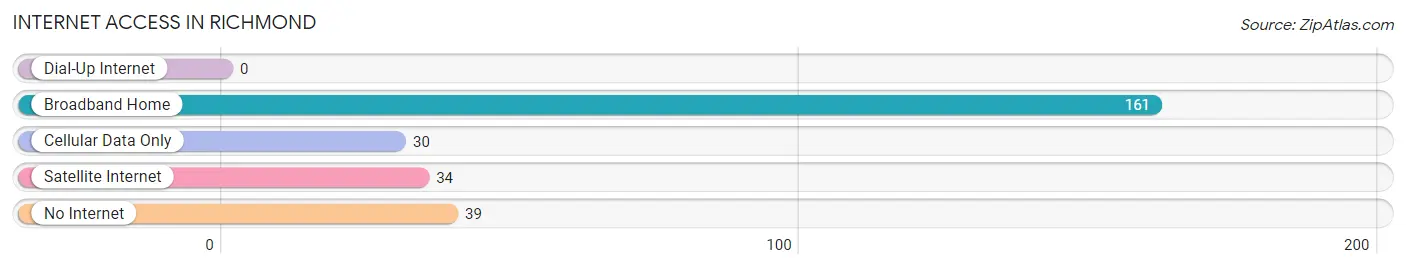
| Internet Type | # Households | % Households |
| Dial-Up Internet | 0 | 0.0% |
| Broadband Home | 161 | 67.1% |
| Cellular Data Only | 30 | 12.5% |
| Satellite Internet | 34 | 14.2% |
| No Internet | 39 | 16.3% |
| Total | 240 | 100.0% |
Richmond Summary
Richmond, Ohio is a small city located in Jefferson County, Ohio. It is situated on the banks of the Ohio River, approximately 30 miles east of Steubenville. The city has a population of 8,637 as of the 2010 census, making it the second-largest city in Jefferson County.
Richmond was founded in 1817 by William Richmond, a Revolutionary War veteran. The city was originally known as Richmondtown, but the name was changed to Richmond in 1819. The city was incorporated in 1834.
Richmond is located in the Appalachian Plateau region of Ohio. The city is situated on the banks of the Ohio River, and is surrounded by rolling hills and forests. The climate is humid continental, with hot summers and cold winters.
The economy of Richmond is largely based on manufacturing and agriculture. The city is home to several manufacturing plants, including a steel mill, a paper mill, and a plastics plant. Agriculture is also important to the local economy, with corn, soybeans, and hay being the main crops.
The demographics of Richmond are largely white, with a small African American population. The median household income is $37,845, and the median home value is $90,000. The city has a high rate of poverty, with nearly one-third of the population living below the poverty line.
Richmond is served by the Jefferson County Public Schools system. The city is home to two public high schools, Richmond High School and Jefferson High School. The city also has several private schools, including St. Mary's Catholic School and Richmond Christian Academy.
Richmond is home to several parks and recreational facilities, including the Richmond Municipal Park, the Richmond Community Pool, and the Richmond Skate Park. The city also has several museums, including the Richmond Museum of History and the Richmond Art Museum.
Richmond is served by the Jefferson County Public Library system, which has two branches in the city. The city is also home to several churches, including the First United Methodist Church, the First Presbyterian Church, and the St. Mary's Catholic Church.
Richmond is a small city with a rich history and a diverse economy. It is home to several manufacturing plants, agricultural operations, and recreational facilities. The city has a diverse population, with a median household income of $37,845 and a median home value of $90,000. Richmond is served by the Jefferson County Public Schools system, and is home to several churches and museums.
Common Questions
What is Per Capita Income in Richmond?
Per Capita income in Richmond is $31,168.
What is the Median Family Income in Richmond?
Median Family Income in Richmond is $80,625.
What is the Median Household income in Richmond?
Median Household Income in Richmond is $56,667.
What is Income or Wage Gap in Richmond?
Income or Wage Gap in Richmond is 43.5%.
Women in Richmond earn 56.5 cents for every dollar earned by a man.
What is Inequality or Gini Index in Richmond?
Inequality or Gini Index in Richmond is 0.38.
What is the Total Population of Richmond?
Total Population of Richmond is 555.
What is the Total Male Population of Richmond?
Total Male Population of Richmond is 243.
What is the Total Female Population of Richmond?
Total Female Population of Richmond is 312.
What is the Ratio of Males per 100 Females in Richmond?
There are 77.88 Males per 100 Females in Richmond.
What is the Ratio of Females per 100 Males in Richmond?
There are 128.40 Females per 100 Males in Richmond.
What is the Median Population Age in Richmond?
Median Population Age in Richmond is 52.2 Years.
What is the Average Family Size in Richmond
Average Family Size in Richmond is 2.9 People.
What is the Average Household Size in Richmond
Average Household Size in Richmond is 2.3 People.
How Large is the Labor Force in Richmond?
There are 252 People in the Labor Forcein in Richmond.
What is the Percentage of People in the Labor Force in Richmond?
53.6% of People are in the Labor Force in Richmond.
What is the Unemployment Rate in Richmond?
Unemployment Rate in Richmond is 2.4%.