Mcconnelsville, OH Map & Demographics
Mcconnelsville Map
Mcconnelsville Overview
$22,074
PER CAPITA INCOME
$66,065
AVG FAMILY INCOME
$46,875
AVG HOUSEHOLD INCOME
2.4%
WAGE / INCOME GAP [ % ]
97.6¢/ $1
WAGE / INCOME GAP [ $ ]
0.41
INEQUALITY / GINI INDEX
2,197
TOTAL POPULATION
1,061
MALE POPULATION
1,136
FEMALE POPULATION
93.40
MALES / 100 FEMALES
107.07
FEMALES / 100 MALES
40.0
MEDIAN AGE
3.4
AVG FAMILY SIZE
2.4
AVG HOUSEHOLD SIZE
915
LABOR FORCE [ PEOPLE ]
52.9%
PERCENT IN LABOR FORCE
4.4%
UNEMPLOYMENT RATE
Mcconnelsville Zip Codes
Mcconnelsville Area Codes
Income in Mcconnelsville
Income Overview in Mcconnelsville
Per Capita Income in Mcconnelsville is $22,074, while median incomes of families and households are $66,065 and $46,875 respectively.
| Characteristic | Number | Measure |
| Per Capita Income | 2,197 | $22,074 |
| Median Family Income | 479 | $66,065 |
| Mean Family Income | 479 | $70,899 |
| Median Household Income | 858 | $46,875 |
| Mean Household Income | 858 | $54,530 |
| Income Deficit | 479 | $0 |
| Wage / Income Gap (%) | 2,197 | 2.42% |
| Wage / Income Gap ($) | 2,197 | 97.58¢ per $1 |
| Gini / Inequality Index | 2,197 | 0.41 |
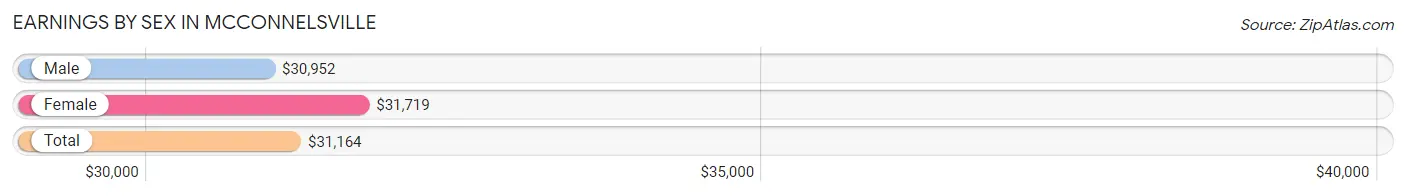
Earnings by Sex in Mcconnelsville
Average Earnings in Mcconnelsville are $31,164, $30,952 for men and $31,719 for women, a difference of 2.4%.
| Sex | Number | Average Earnings |
| Male | 466 (48.0%) | $30,952 |
| Female | 505 (52.0%) | $31,719 |
| Total | 971 (100.0%) | $31,164 |
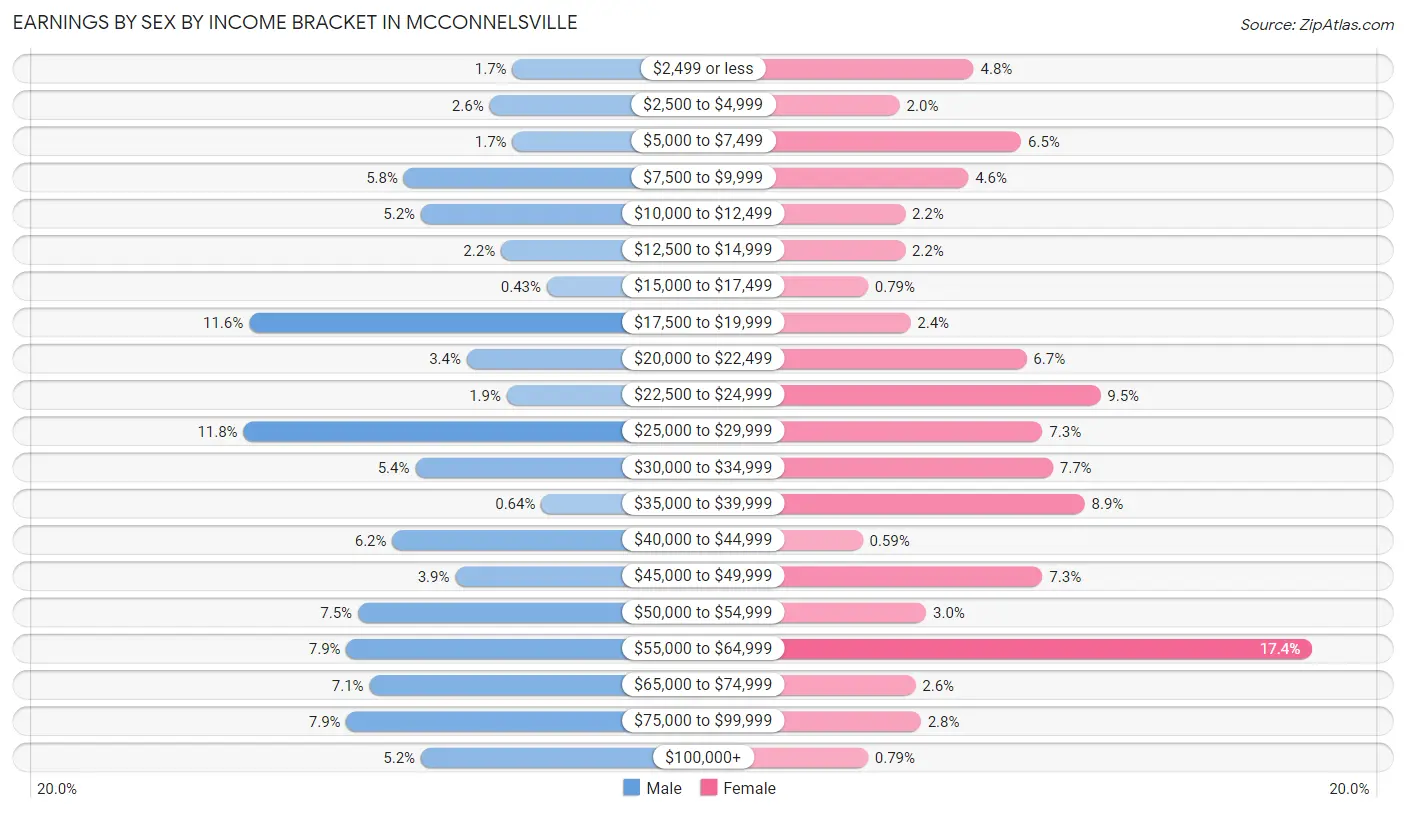
Earnings by Sex by Income Bracket in Mcconnelsville
The most common earnings brackets in Mcconnelsville are $25,000 to $29,999 for men (55 | 11.8%) and $55,000 to $64,999 for women (88 | 17.4%).
| Income | Male | Female |
| $2,499 or less | 8 (1.7%) | 24 (4.8%) |
| $2,500 to $4,999 | 12 (2.6%) | 10 (2.0%) |
| $5,000 to $7,499 | 8 (1.7%) | 33 (6.5%) |
| $7,500 to $9,999 | 27 (5.8%) | 23 (4.5%) |
| $10,000 to $12,499 | 24 (5.1%) | 11 (2.2%) |
| $12,500 to $14,999 | 10 (2.1%) | 11 (2.2%) |
| $15,000 to $17,499 | 2 (0.4%) | 4 (0.8%) |
| $17,500 to $19,999 | 54 (11.6%) | 12 (2.4%) |
| $20,000 to $22,499 | 16 (3.4%) | 34 (6.7%) |
| $22,500 to $24,999 | 9 (1.9%) | 48 (9.5%) |
| $25,000 to $29,999 | 55 (11.8%) | 37 (7.3%) |
| $30,000 to $34,999 | 25 (5.4%) | 39 (7.7%) |
| $35,000 to $39,999 | 3 (0.6%) | 45 (8.9%) |
| $40,000 to $44,999 | 29 (6.2%) | 3 (0.6%) |
| $45,000 to $49,999 | 18 (3.9%) | 37 (7.3%) |
| $50,000 to $54,999 | 35 (7.5%) | 15 (3.0%) |
| $55,000 to $64,999 | 37 (7.9%) | 88 (17.4%) |
| $65,000 to $74,999 | 33 (7.1%) | 13 (2.6%) |
| $75,000 to $99,999 | 37 (7.9%) | 14 (2.8%) |
| $100,000+ | 24 (5.1%) | 4 (0.8%) |
| Total | 466 (100.0%) | 505 (100.0%) |
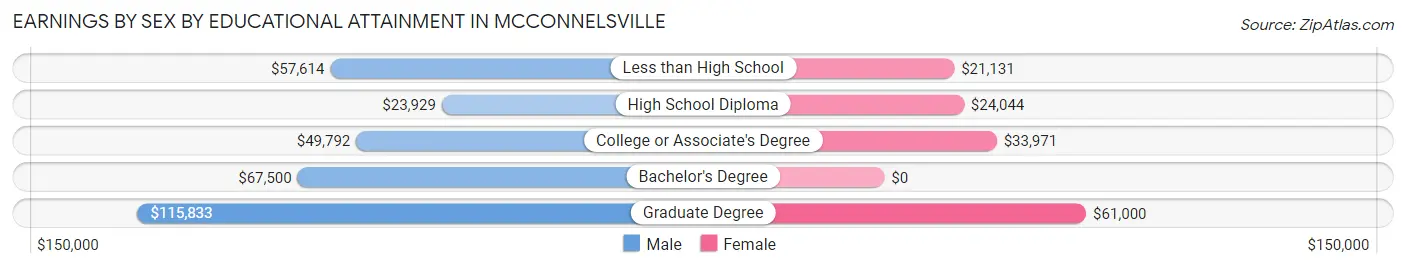
Earnings by Sex by Educational Attainment in Mcconnelsville
Average earnings in Mcconnelsville are $32,202 for men and $32,740 for women, a difference of 1.6%. Men with an educational attainment of graduate degree enjoy the highest average annual earnings of $115,833, while those with high school diploma education earn the least with $23,929. Women with an educational attainment of graduate degree earn the most with the average annual earnings of $61,000, while those with less than high school education have the smallest earnings of $21,131.
| Educational Attainment | Male Income | Female Income |
| Less than High School | $57,614 | $21,131 |
| High School Diploma | $23,929 | $24,044 |
| College or Associate's Degree | $49,792 | $33,971 |
| Bachelor's Degree | $67,500 | $0 |
| Graduate Degree | $115,833 | $61,000 |
| Total | $32,202 | $32,740 |
Family Income in Mcconnelsville
Family Income Brackets in Mcconnelsville
According to the Mcconnelsville family income data, there are 138 families falling into the $75,000 to $99,999 income range, which is the most common income bracket and makes up 28.8% of all families. Conversely, the $10,000 to $14,999 income bracket is the least frequent group with only 6 families (1.3%) belonging to this category.
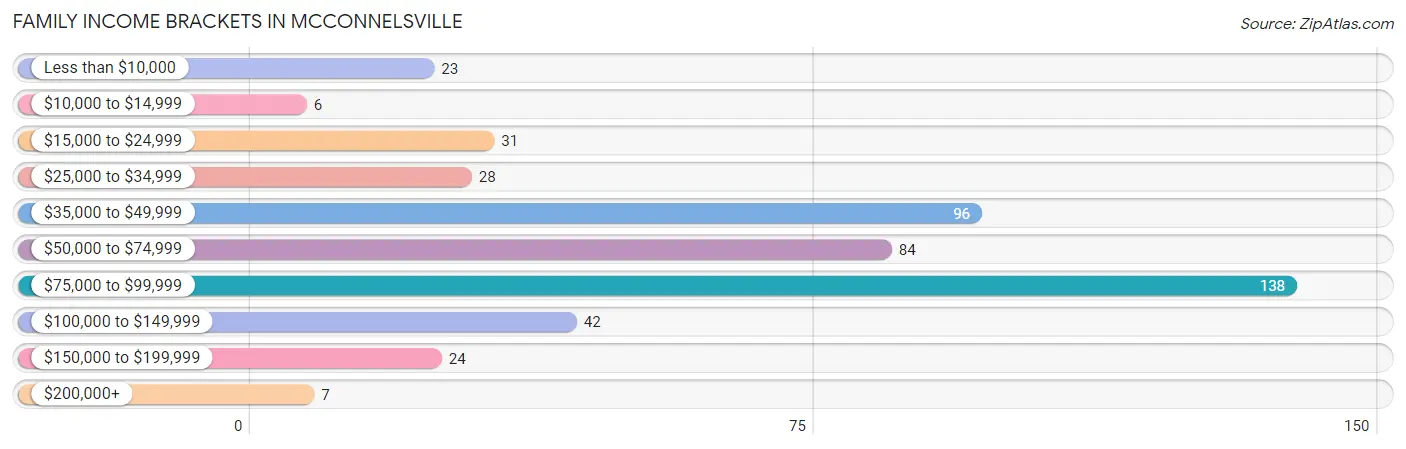
| Income Bracket | # Families | % Families |
| Less than $10,000 | 23 | 4.8% |
| $10,000 to $14,999 | 6 | 1.3% |
| $15,000 to $24,999 | 31 | 6.5% |
| $25,000 to $34,999 | 28 | 5.8% |
| $35,000 to $49,999 | 96 | 20.0% |
| $50,000 to $74,999 | 84 | 17.5% |
| $75,000 to $99,999 | 138 | 28.8% |
| $100,000 to $149,999 | 42 | 8.8% |
| $150,000 to $199,999 | 24 | 5.0% |
| $200,000+ | 7 | 1.5% |
Family Income by Famaliy Size in Mcconnelsville
5-person families (65 | 13.6%) account for the highest median family income in Mcconnelsville with $85,956 per family, while 2-person families (203 | 42.4%) have the highest median income of $22,864 per family member.
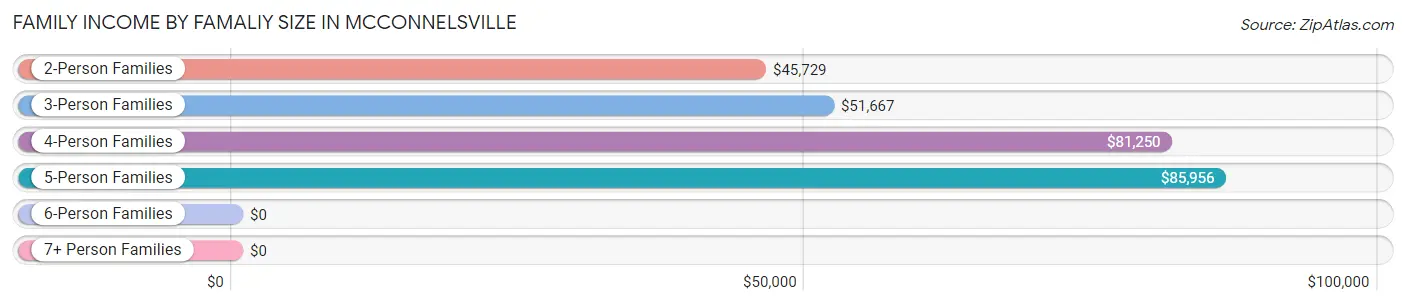
| Income Bracket | # Families | Median Income |
| 2-Person Families | 203 (42.4%) | $45,729 |
| 3-Person Families | 128 (26.7%) | $51,667 |
| 4-Person Families | 68 (14.2%) | $81,250 |
| 5-Person Families | 65 (13.6%) | $85,956 |
| 6-Person Families | 5 (1.0%) | $0 |
| 7+ Person Families | 10 (2.1%) | $0 |
| Total | 479 (100.0%) | $66,065 |
Family Income by Number of Earners in Mcconnelsville
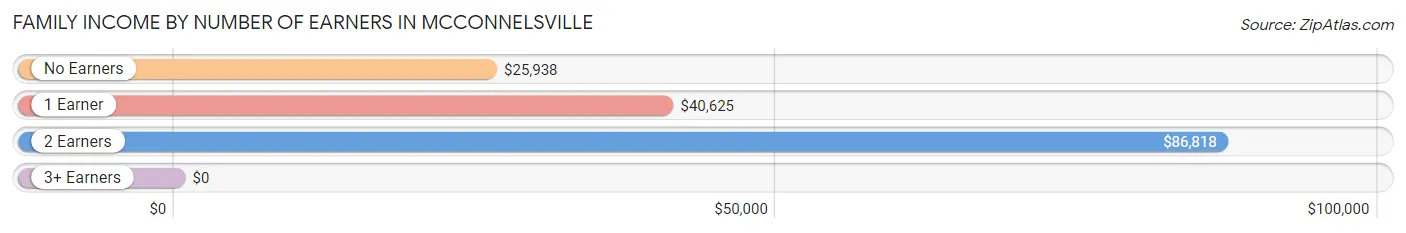
| Number of Earners | # Families | Median Income |
| No Earners | 47 (9.8%) | $25,938 |
| 1 Earner | 177 (36.9%) | $40,625 |
| 2 Earners | 238 (49.7%) | $86,818 |
| 3+ Earners | 17 (3.5%) | $0 |
| Total | 479 (100.0%) | $66,065 |
Household Income in Mcconnelsville
Household Income Brackets in Mcconnelsville
With 161 households falling in the category, the $50,000 to $74,999 income range is the most frequent in Mcconnelsville, accounting for 18.8% of all households. In contrast, only 7 households (0.8%) fall into the $200,000+ income bracket, making it the least populous group.
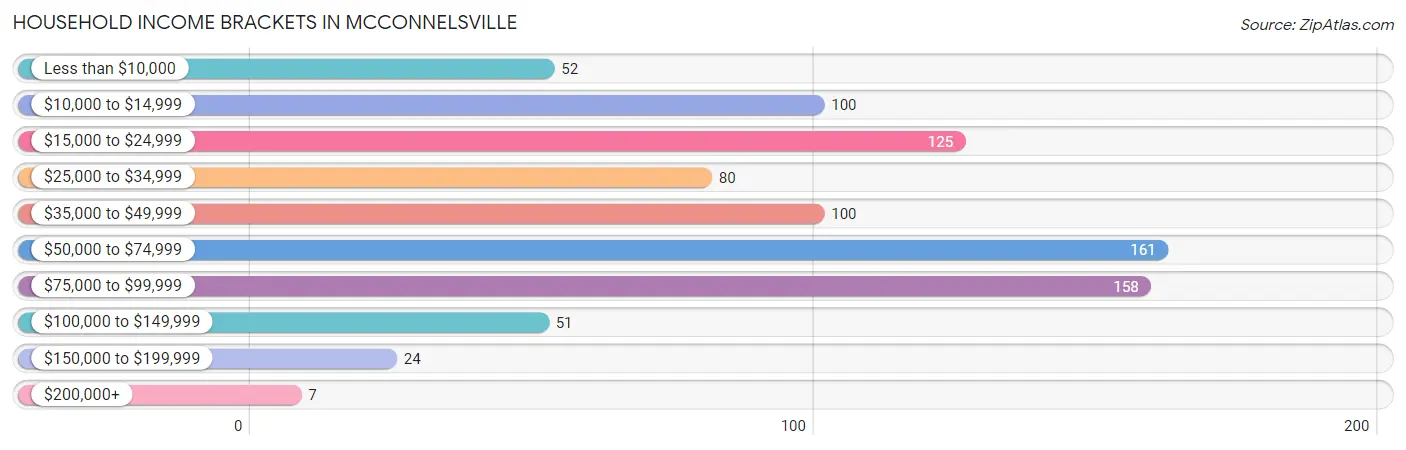
| Income Bracket | # Households | % Households |
| Less than $10,000 | 52 | 6.1% |
| $10,000 to $14,999 | 100 | 11.7% |
| $15,000 to $24,999 | 125 | 14.6% |
| $25,000 to $34,999 | 80 | 9.3% |
| $35,000 to $49,999 | 100 | 11.7% |
| $50,000 to $74,999 | 161 | 18.8% |
| $75,000 to $99,999 | 158 | 18.4% |
| $100,000 to $149,999 | 51 | 5.9% |
| $150,000 to $199,999 | 24 | 2.8% |
| $200,000+ | 7 | 0.8% |
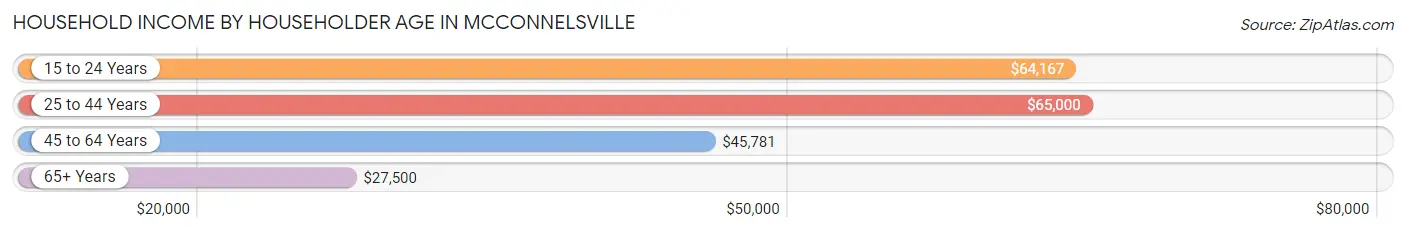
Household Income by Householder Age in Mcconnelsville
The median household income in Mcconnelsville is $46,875, with the highest median household income of $65,000 found in the 25 to 44 years age bracket for the primary householder. A total of 326 households (38.0%) fall into this category. Meanwhile, the 65+ years age bracket for the primary householder has the lowest median household income of $27,500, with 252 households (29.4%) in this group.
| Income Bracket | # Households | Median Income |
| 15 to 24 Years | 18 (2.1%) | $64,167 |
| 25 to 44 Years | 326 (38.0%) | $65,000 |
| 45 to 64 Years | 262 (30.5%) | $45,781 |
| 65+ Years | 252 (29.4%) | $27,500 |
| Total | 858 (100.0%) | $46,875 |
Poverty in Mcconnelsville
Income Below Poverty by Sex and Age in Mcconnelsville
With 8.1% poverty level for males and 15.9% for females among the residents of Mcconnelsville, under 5 year old males and 55 to 64 year old females are the most vulnerable to poverty, with 3 males (50.0%) and 51 females (34.9%) in their respective age groups living below the poverty level.
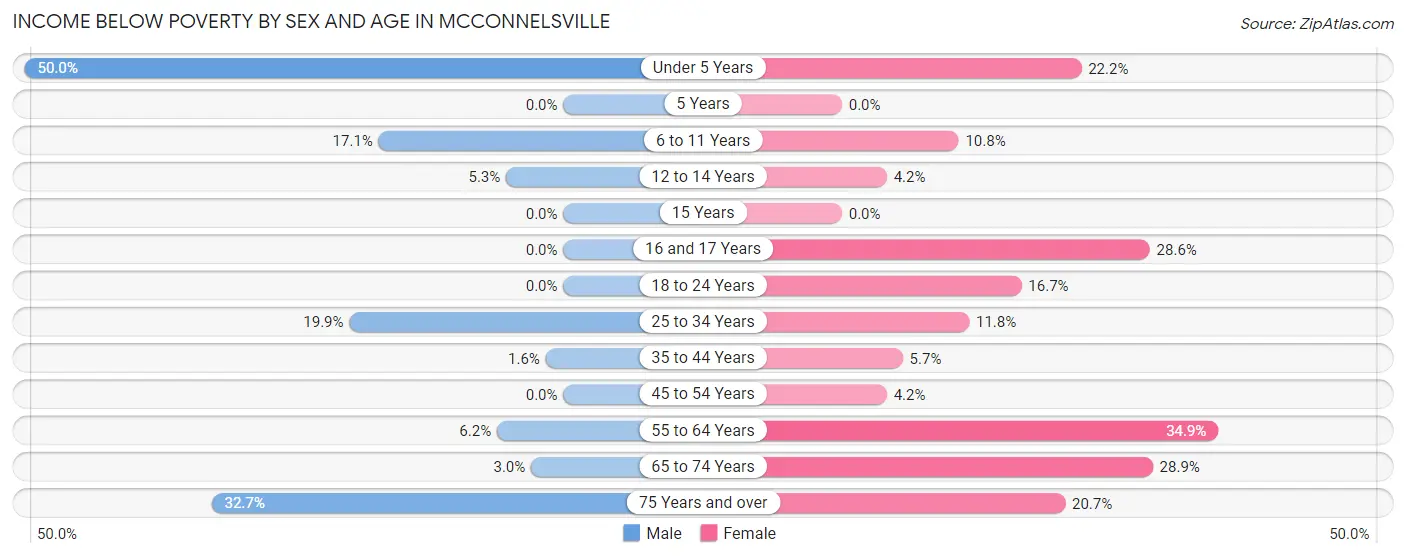
| Age Bracket | Male | Female |
| Under 5 Years | 3 (50.0%) | 4 (22.2%) |
| 5 Years | 0 (0.0%) | 0 (0.0%) |
| 6 to 11 Years | 12 (17.1%) | 13 (10.8%) |
| 12 to 14 Years | 6 (5.3%) | 5 (4.2%) |
| 15 Years | 0 (0.0%) | 0 (0.0%) |
| 16 and 17 Years | 0 (0.0%) | 12 (28.6%) |
| 18 to 24 Years | 0 (0.0%) | 5 (16.7%) |
| 25 to 34 Years | 28 (19.9%) | 15 (11.8%) |
| 35 to 44 Years | 2 (1.6%) | 10 (5.7%) |
| 45 to 54 Years | 0 (0.0%) | 3 (4.2%) |
| 55 to 64 Years | 13 (6.2%) | 51 (34.9%) |
| 65 to 74 Years | 2 (3.0%) | 30 (28.8%) |
| 75 Years and over | 16 (32.7%) | 23 (20.7%) |
| Total | 82 (8.1%) | 171 (15.9%) |
Income Above Poverty by Sex and Age in Mcconnelsville
According to the poverty statistics in Mcconnelsville, males aged 5 years and females aged 15 years are the age groups that are most secure financially, with 100.0% of males and 100.0% of females in these age groups living above the poverty line.
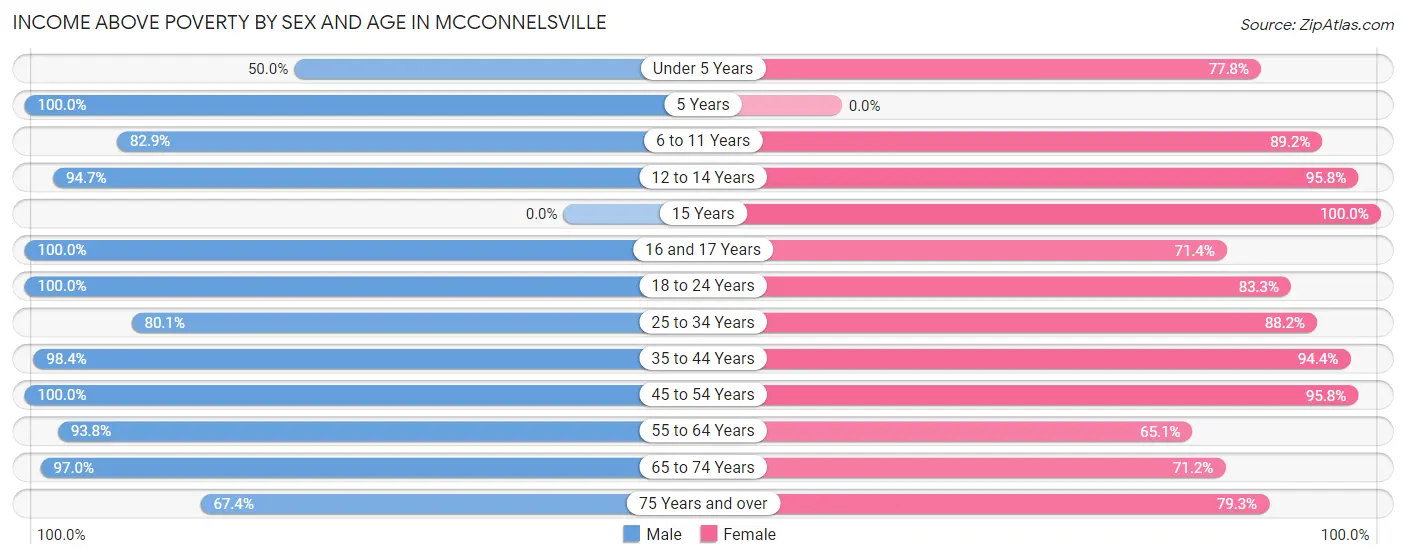
| Age Bracket | Male | Female |
| Under 5 Years | 3 (50.0%) | 14 (77.8%) |
| 5 Years | 12 (100.0%) | 0 (0.0%) |
| 6 to 11 Years | 58 (82.9%) | 107 (89.2%) |
| 12 to 14 Years | 107 (94.7%) | 115 (95.8%) |
| 15 Years | 0 (0.0%) | 8 (100.0%) |
| 16 and 17 Years | 44 (100.0%) | 30 (71.4%) |
| 18 to 24 Years | 70 (100.0%) | 25 (83.3%) |
| 25 to 34 Years | 113 (80.1%) | 112 (88.2%) |
| 35 to 44 Years | 120 (98.4%) | 167 (94.4%) |
| 45 to 54 Years | 107 (100.0%) | 69 (95.8%) |
| 55 to 64 Years | 198 (93.8%) | 95 (65.1%) |
| 65 to 74 Years | 65 (97.0%) | 74 (71.2%) |
| 75 Years and over | 33 (67.3%) | 88 (79.3%) |
| Total | 930 (91.9%) | 904 (84.1%) |
Income Below Poverty Among Married-Couple Families in Mcconnelsville
The poverty statistics for married-couple families in Mcconnelsville show that 0.7% or 2 of the total 289 families live below the poverty line. Families with no children have the highest poverty rate of 1.4%, comprising of 2 families. On the other hand, families with 1 or 2 children have the lowest poverty rate of 0.0%, which includes 0 families.
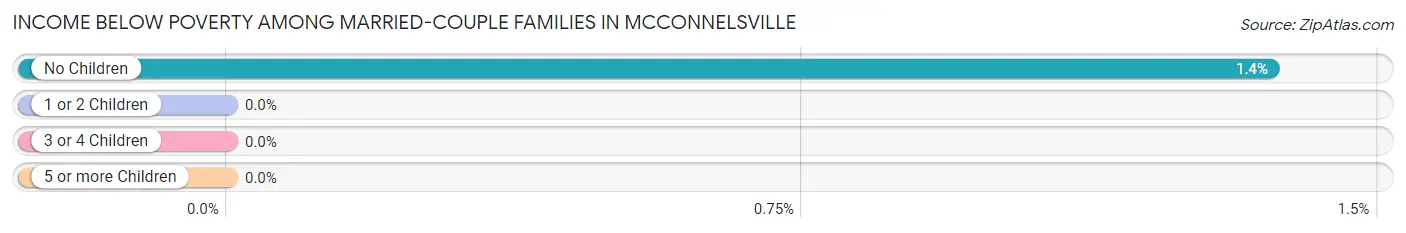
| Children | Above Poverty | Below Poverty |
| No Children | 145 (98.6%) | 2 (1.4%) |
| 1 or 2 Children | 123 (100.0%) | 0 (0.0%) |
| 3 or 4 Children | 19 (100.0%) | 0 (0.0%) |
| 5 or more Children | 0 (0.0%) | 0 (0.0%) |
| Total | 287 (99.3%) | 2 (0.7%) |
Income Below Poverty Among Single-Parent Households in Mcconnelsville
According to the poverty data in Mcconnelsville, 16.7% or 4 single-father households and 18.7% or 31 single-mother households are living below the poverty line. Among single-father households, those with 1 or 2 children have the highest poverty rate, with 4 households (36.4%) experiencing poverty. Likewise, among single-mother households, those with 3 or 4 children have the highest poverty rate, with 10 households (100.0%) falling below the poverty line.
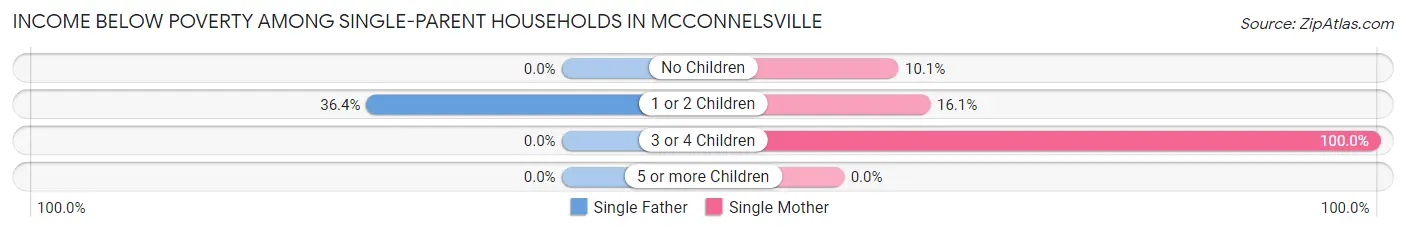
| Children | Single Father | Single Mother |
| No Children | 0 (0.0%) | 7 (10.1%) |
| 1 or 2 Children | 4 (36.4%) | 14 (16.1%) |
| 3 or 4 Children | 0 (0.0%) | 10 (100.0%) |
| 5 or more Children | 0 (0.0%) | 0 (0.0%) |
| Total | 4 (16.7%) | 31 (18.7%) |
Income Below Poverty Among Married-Couple vs Single-Parent Households in Mcconnelsville
The poverty data for Mcconnelsville shows that 2 of the married-couple family households (0.7%) and 35 of the single-parent households (18.4%) are living below the poverty level. Within the married-couple family households, those with no children have the highest poverty rate, with 2 households (1.4%) falling below the poverty line. Among the single-parent households, those with 3 or 4 children have the highest poverty rate, with 10 household (52.6%) living below poverty.
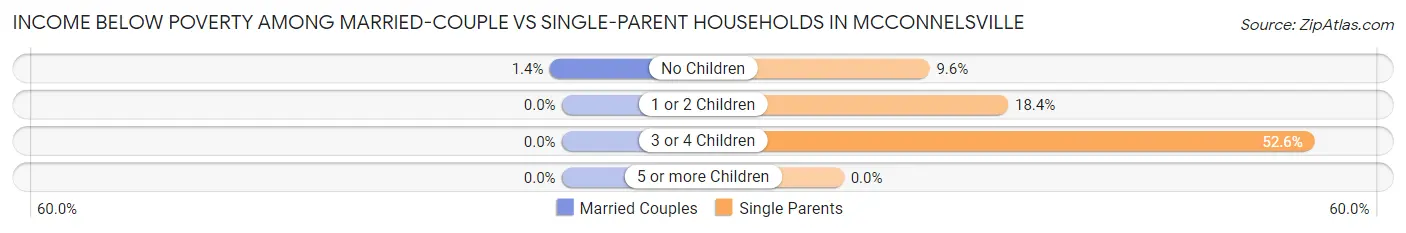
| Children | Married-Couple Families | Single-Parent Households |
| No Children | 2 (1.4%) | 7 (9.6%) |
| 1 or 2 Children | 0 (0.0%) | 18 (18.4%) |
| 3 or 4 Children | 0 (0.0%) | 10 (52.6%) |
| 5 or more Children | 0 (0.0%) | 0 (0.0%) |
| Total | 2 (0.7%) | 35 (18.4%) |
Race in Mcconnelsville
The most populous races in Mcconnelsville are White / Caucasian (1,946 | 88.6%), Black / African American (94 | 4.3%), and Two or more Races (88 | 4.0%).
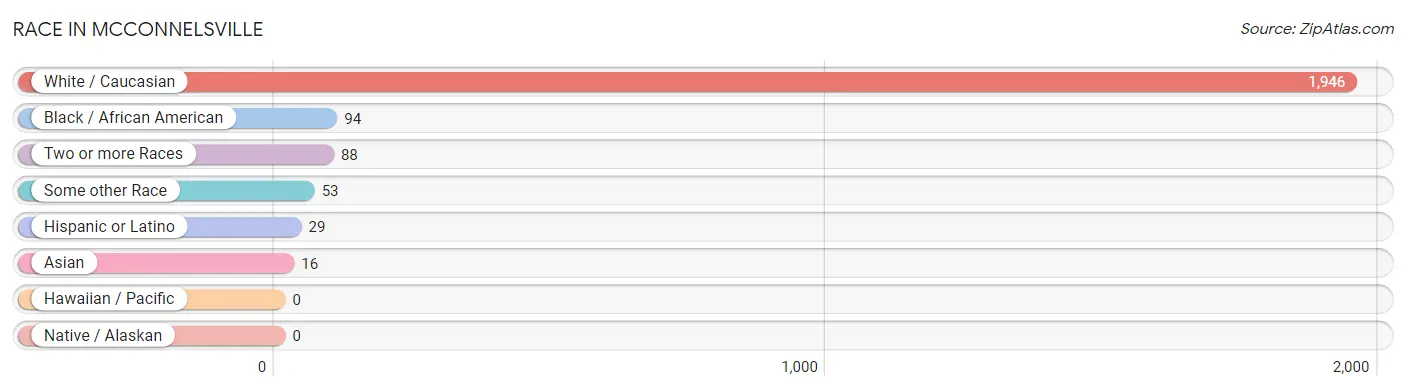
| Race | # Population | % Population |
| Asian | 16 | 0.7% |
| Black / African American | 94 | 4.3% |
| Hawaiian / Pacific | 0 | 0.0% |
| Hispanic or Latino | 29 | 1.3% |
| Native / Alaskan | 0 | 0.0% |
| White / Caucasian | 1,946 | 88.6% |
| Two or more Races | 88 | 4.0% |
| Some other Race | 53 | 2.4% |
| Total | 2,197 | 100.0% |
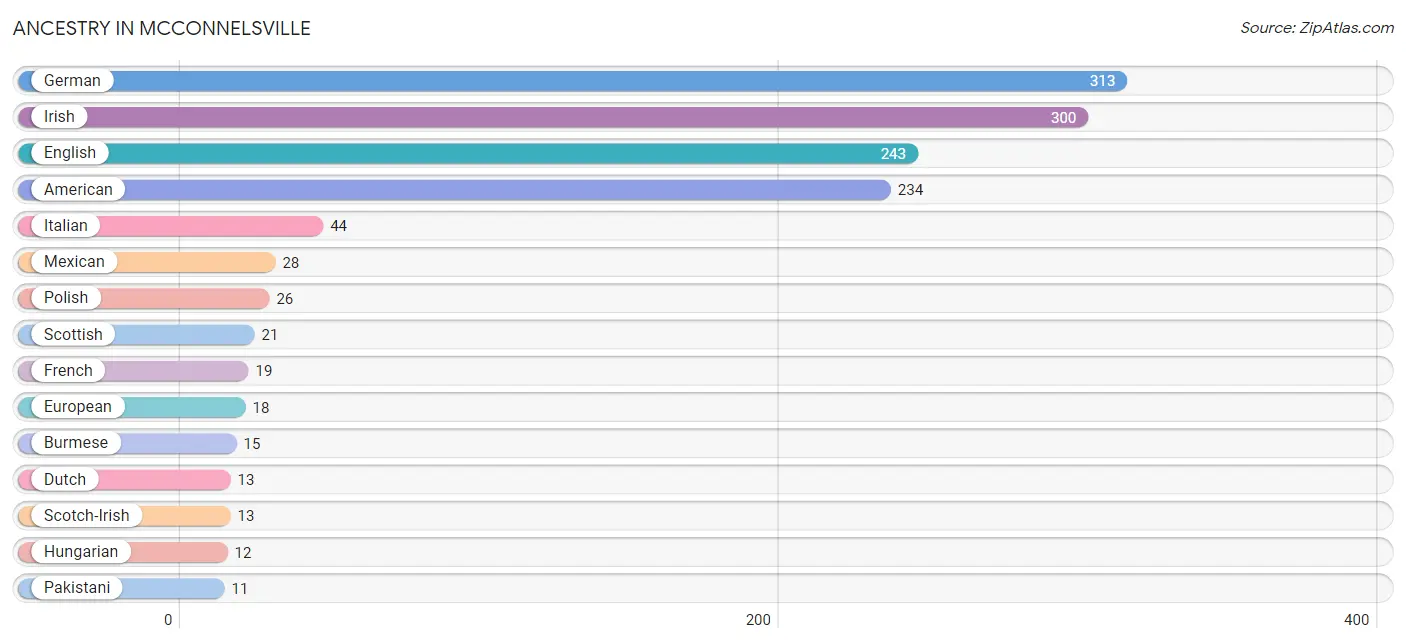
Ancestry in Mcconnelsville
The most populous ancestries reported in Mcconnelsville are German (313 | 14.2%), Irish (300 | 13.7%), English (243 | 11.1%), American (234 | 10.6%), and Italian (44 | 2.0%), together accounting for 51.6% of all Mcconnelsville residents.
| Ancestry | # Population | % Population |
| African | 7 | 0.3% |
| American | 234 | 10.6% |
| British | 3 | 0.1% |
| Burmese | 15 | 0.7% |
| Cuban | 1 | 0.1% |
| Dutch | 13 | 0.6% |
| English | 243 | 11.1% |
| European | 18 | 0.8% |
| French | 19 | 0.9% |
| French Canadian | 2 | 0.1% |
| German | 313 | 14.2% |
| Hungarian | 12 | 0.5% |
| Indian (Asian) | 5 | 0.2% |
| Irish | 300 | 13.7% |
| Italian | 44 | 2.0% |
| Mexican | 28 | 1.3% |
| Norwegian | 4 | 0.2% |
| Pakistani | 11 | 0.5% |
| Polish | 26 | 1.2% |
| Scandinavian | 4 | 0.2% |
| Scotch-Irish | 13 | 0.6% |
| Scottish | 21 | 1.0% |
| Subsaharan African | 7 | 0.3% |
| Swedish | 8 | 0.4% |
| Welsh | 7 | 0.3% | View All 25 Rows |
Immigrants in Mcconnelsville
The most numerous immigrant groups reported in Mcconnelsville came from Asia (16 | 0.7%), South Eastern Asia (11 | 0.5%), Thailand (11 | 0.5%), Europe (8 | 0.4%), and China (5 | 0.2%), together accounting for 2.3% of all Mcconnelsville residents.
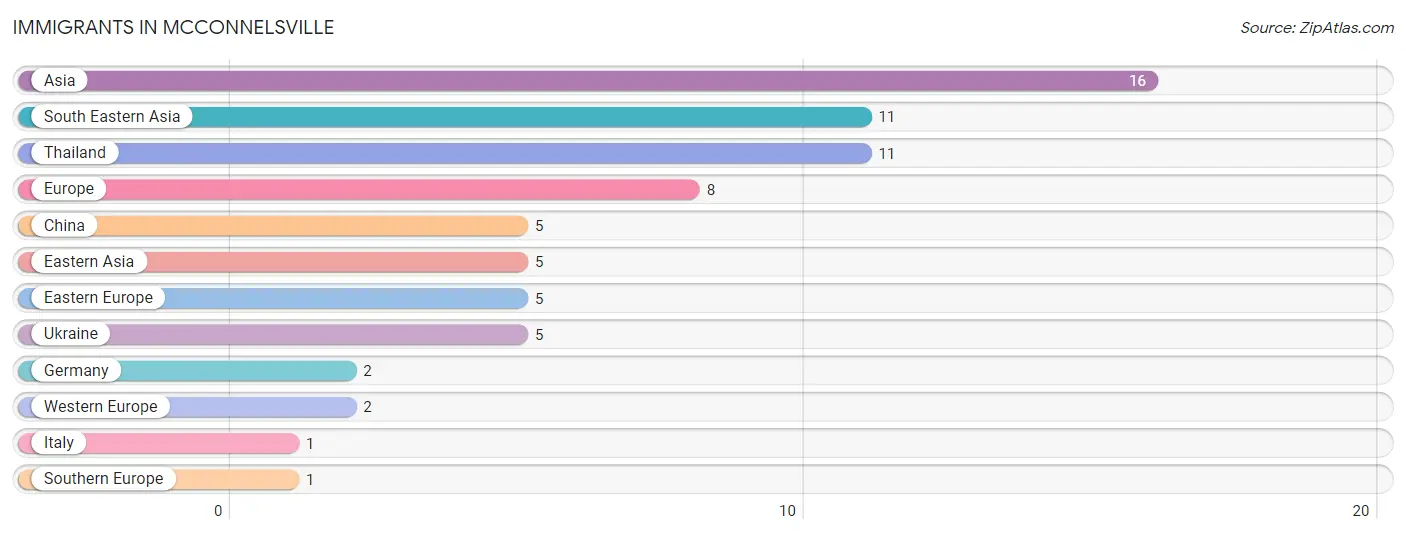
| Immigration Origin | # Population | % Population |
| Asia | 16 | 0.7% |
| China | 5 | 0.2% |
| Eastern Asia | 5 | 0.2% |
| Eastern Europe | 5 | 0.2% |
| Europe | 8 | 0.4% |
| Germany | 2 | 0.1% |
| Italy | 1 | 0.1% |
| South Eastern Asia | 11 | 0.5% |
| Southern Europe | 1 | 0.1% |
| Thailand | 11 | 0.5% |
| Ukraine | 5 | 0.2% |
| Western Europe | 2 | 0.1% | View All 12 Rows |
Sex and Age in Mcconnelsville
Sex and Age in Mcconnelsville
The most populous age groups in Mcconnelsville are 60 to 64 Years (155 | 14.6%) for men and 10 to 14 Years (198 | 17.4%) for women.
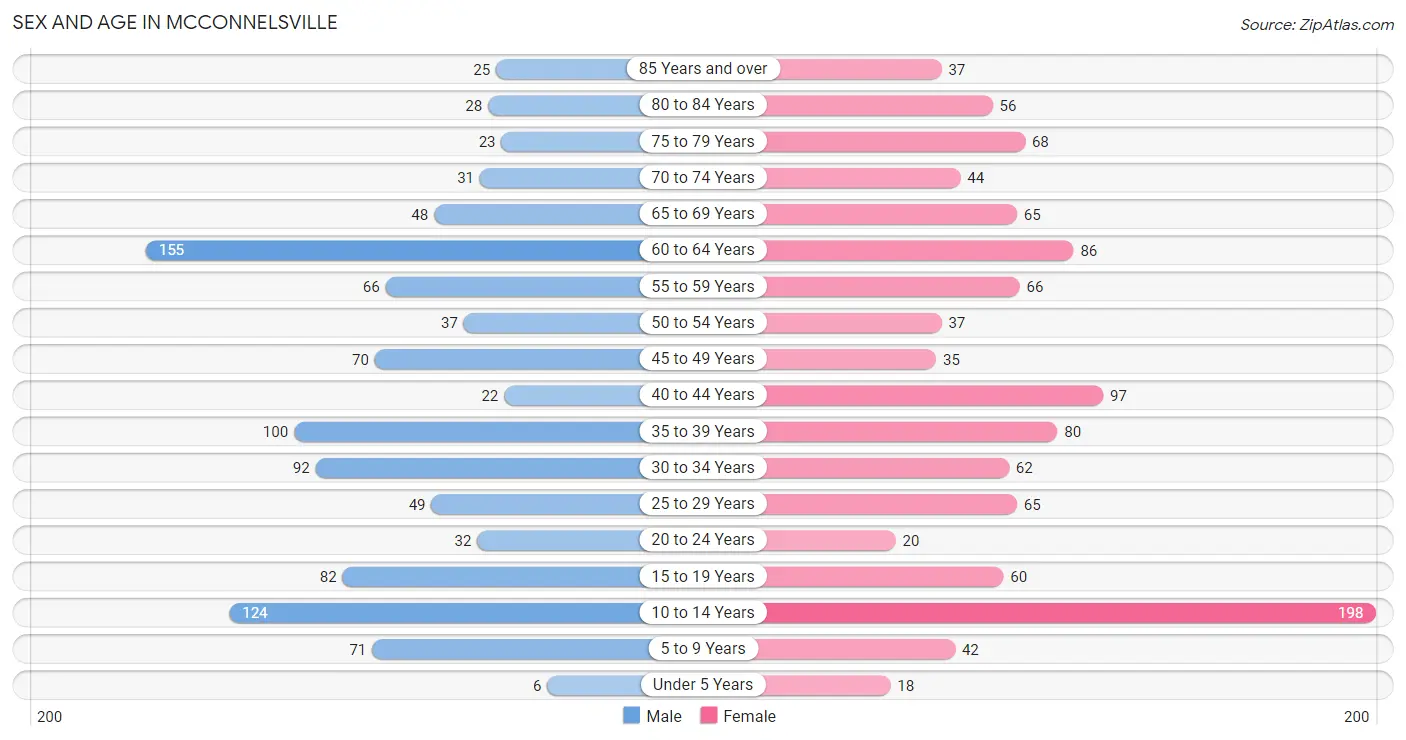
| Age Bracket | Male | Female |
| Under 5 Years | 6 (0.6%) | 18 (1.6%) |
| 5 to 9 Years | 71 (6.7%) | 42 (3.7%) |
| 10 to 14 Years | 124 (11.7%) | 198 (17.4%) |
| 15 to 19 Years | 82 (7.7%) | 60 (5.3%) |
| 20 to 24 Years | 32 (3.0%) | 20 (1.8%) |
| 25 to 29 Years | 49 (4.6%) | 65 (5.7%) |
| 30 to 34 Years | 92 (8.7%) | 62 (5.5%) |
| 35 to 39 Years | 100 (9.4%) | 80 (7.0%) |
| 40 to 44 Years | 22 (2.1%) | 97 (8.5%) |
| 45 to 49 Years | 70 (6.6%) | 35 (3.1%) |
| 50 to 54 Years | 37 (3.5%) | 37 (3.3%) |
| 55 to 59 Years | 66 (6.2%) | 66 (5.8%) |
| 60 to 64 Years | 155 (14.6%) | 86 (7.6%) |
| 65 to 69 Years | 48 (4.5%) | 65 (5.7%) |
| 70 to 74 Years | 31 (2.9%) | 44 (3.9%) |
| 75 to 79 Years | 23 (2.2%) | 68 (6.0%) |
| 80 to 84 Years | 28 (2.6%) | 56 (4.9%) |
| 85 Years and over | 25 (2.4%) | 37 (3.3%) |
| Total | 1,061 (100.0%) | 1,136 (100.0%) |
Families and Households in Mcconnelsville
Median Family Size in Mcconnelsville
The median family size in Mcconnelsville is 3.41 persons per family, with married-couple families (289 | 60.3%) accounting for the largest median family size of 3.76 persons per family. On the other hand, single female/mother families (166 | 34.7%) represent the smallest median family size with 2.78 persons per family.
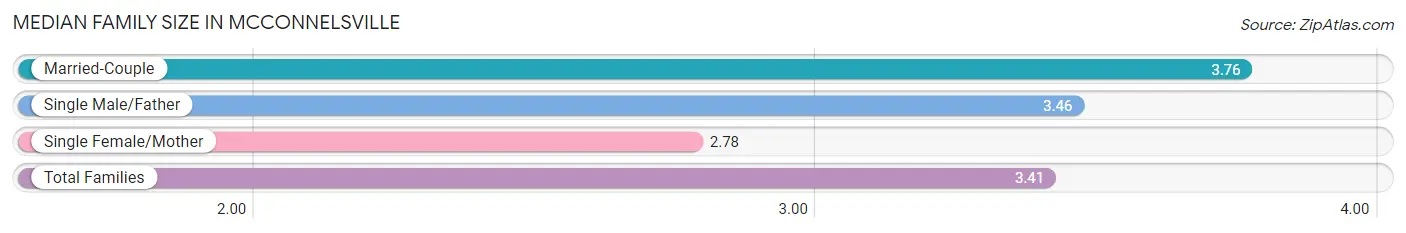
| Family Type | # Families | Family Size |
| Married-Couple | 289 (60.3%) | 3.76 |
| Single Male/Father | 24 (5.0%) | 3.46 |
| Single Female/Mother | 166 (34.7%) | 2.78 |
| Total Families | 479 (100.0%) | 3.41 |
Median Household Size in Mcconnelsville
The median household size in Mcconnelsville is 2.43 persons per household, with married-couple households (289 | 33.7%) accounting for the largest median household size of 3.77 persons per household. non-family households (379 | 44.2%) represent the smallest median household size with 1.07 persons per household.
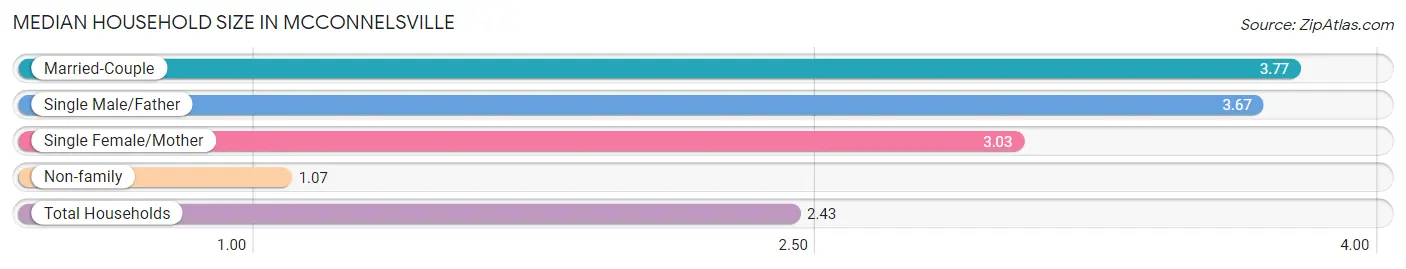
| Household Type | # Households | Household Size |
| Married-Couple | 289 (33.7%) | 3.77 |
| Single Male/Father | 24 (2.8%) | 3.67 |
| Single Female/Mother | 166 (19.4%) | 3.03 |
| Non-family | 379 (44.2%) | 1.07 |
| Total Households | 858 (100.0%) | 2.43 |
Household Size by Marriage Status in Mcconnelsville
Out of a total of 858 households in Mcconnelsville, 479 (55.8%) are family households, while 379 (44.2%) are nonfamily households. The most numerous type of family households are 2-person households, comprising 195, and the most common type of nonfamily households are 1-person households, comprising 350.
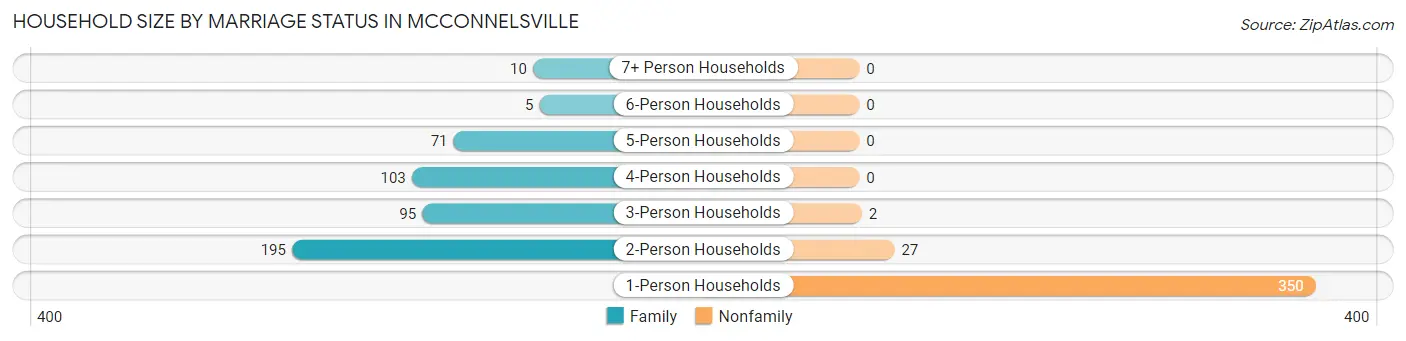
| Household Size | Family Households | Nonfamily Households |
| 1-Person Households | - | 350 (40.8%) |
| 2-Person Households | 195 (22.7%) | 27 (3.2%) |
| 3-Person Households | 95 (11.1%) | 2 (0.2%) |
| 4-Person Households | 103 (12.0%) | 0 (0.0%) |
| 5-Person Households | 71 (8.3%) | 0 (0.0%) |
| 6-Person Households | 5 (0.6%) | 0 (0.0%) |
| 7+ Person Households | 10 (1.2%) | 0 (0.0%) |
| Total | 479 (55.8%) | 379 (44.2%) |
Female Fertility in Mcconnelsville
Fertility by Age in Mcconnelsville
Average fertility rate in Mcconnelsville is 7.0 births per 1,000 women. Women in the age bracket of 20 to 34 years have the highest fertility rate with 20.0 births per 1,000 women. Women in the age bracket of 20 to 34 years acount for 100.0% of all women with births.
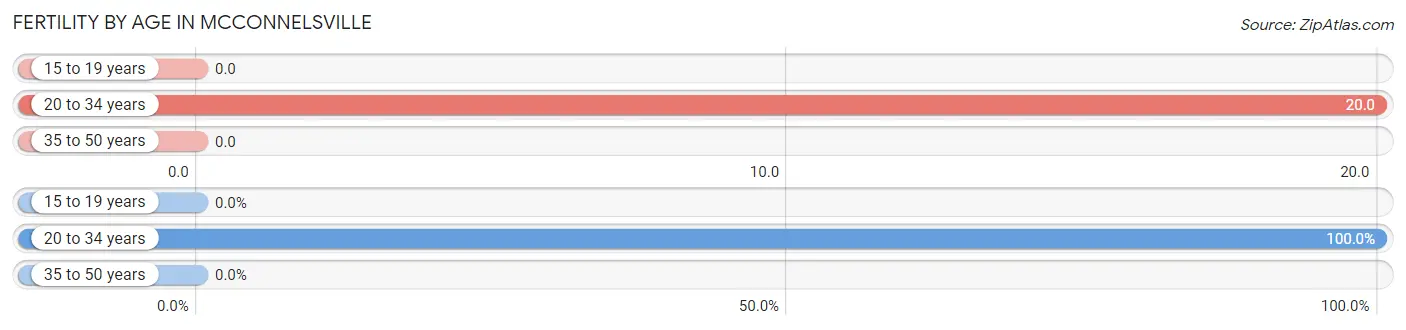
| Age Bracket | Women with Births | Births / 1,000 Women |
| 15 to 19 years | 0 (0.0%) | 0.0 |
| 20 to 34 years | 3 (100.0%) | 20.0 |
| 35 to 50 years | 0 (0.0%) | 0.0 |
| Total | 3 (100.0%) | 7.0 |
Fertility by Age by Marriage Status in Mcconnelsville
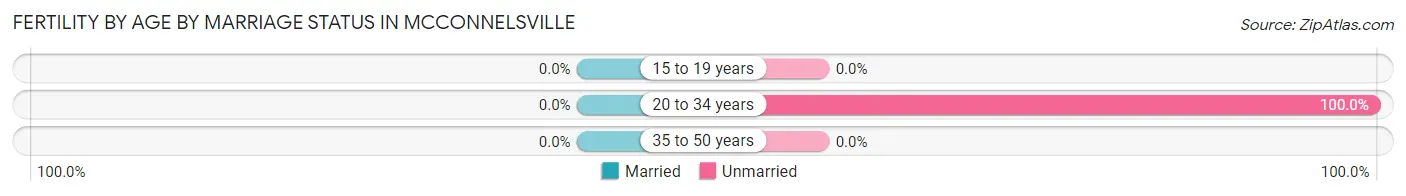
| Age Bracket | Married | Unmarried |
| 15 to 19 years | 0 (0.0%) | 0 (0.0%) |
| 20 to 34 years | 0 (0.0%) | 3 (100.0%) |
| 35 to 50 years | 0 (0.0%) | 0 (0.0%) |
| Total | 0 (0.0%) | 3 (100.0%) |
Fertility by Education in Mcconnelsville
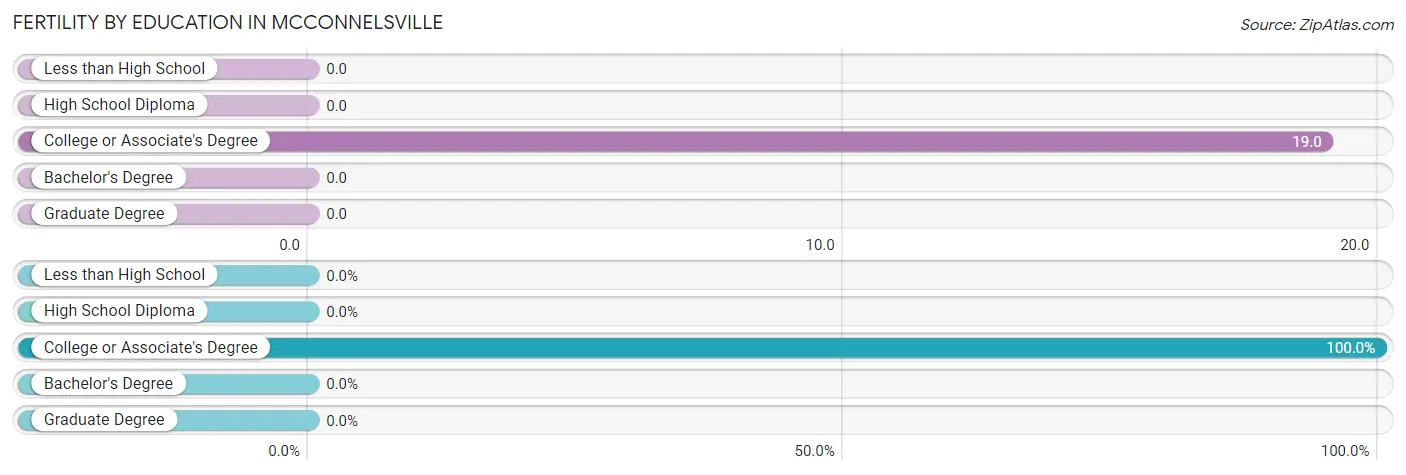
| Educational Attainment | Women with Births | Births / 1,000 Women |
| Less than High School | 0 (0.0%) | 0.0 |
| High School Diploma | 0 (0.0%) | 0.0 |
| College or Associate's Degree | 3 (100.0%) | 19.0 |
| Bachelor's Degree | 0 (0.0%) | 0.0 |
| Graduate Degree | 0 (0.0%) | 0.0 |
| Total | 3 (100.0%) | 7.0 |
Fertility by Education by Marriage Status in Mcconnelsville
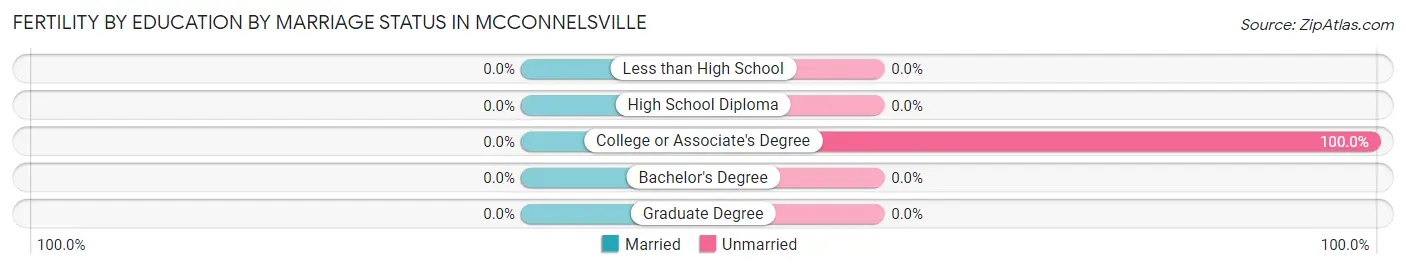
| Educational Attainment | Married | Unmarried |
| Less than High School | 0 (0.0%) | 0 (0.0%) |
| High School Diploma | 0 (0.0%) | 0 (0.0%) |
| College or Associate's Degree | 0 (0.0%) | 3 (100.0%) |
| Bachelor's Degree | 0 (0.0%) | 0 (0.0%) |
| Graduate Degree | 0 (0.0%) | 0 (0.0%) |
| Total | 0 (0.0%) | 3 (100.0%) |
Employment Characteristics in Mcconnelsville
Employment by Class of Employer in Mcconnelsville
Among the 865 employed individuals in Mcconnelsville, private company employees (636 | 73.5%), local government employees (90 | 10.4%), and state government employees (46 | 5.3%) make up the most common classes of employment.
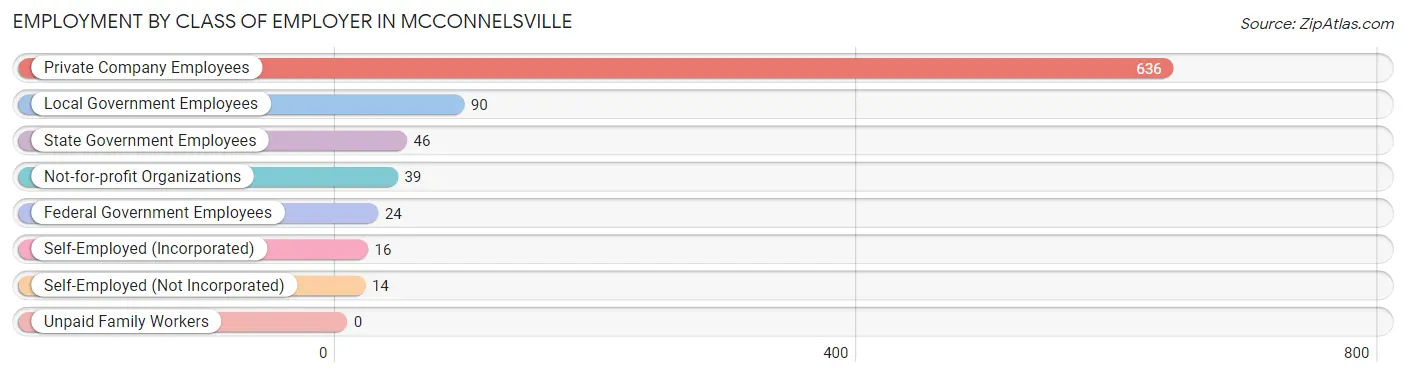
| Employer Class | # Employees | % Employees |
| Private Company Employees | 636 | 73.5% |
| Self-Employed (Incorporated) | 16 | 1.8% |
| Self-Employed (Not Incorporated) | 14 | 1.6% |
| Not-for-profit Organizations | 39 | 4.5% |
| Local Government Employees | 90 | 10.4% |
| State Government Employees | 46 | 5.3% |
| Federal Government Employees | 24 | 2.8% |
| Unpaid Family Workers | 0 | 0.0% |
| Total | 865 | 100.0% |
Employment Status by Age in Mcconnelsville
According to the labor force statistics for Mcconnelsville, out of the total population over 16 years of age (1,730), 52.9% or 915 individuals are in the labor force, with 4.4% or 40 of them unemployed. The age group with the highest labor force participation rate is 20 to 24 years, with 100.0% or 52 individuals in the labor force. Within the labor force, the 20 to 24 years age range has the highest percentage of unemployed individuals, with 21.2% or 11 of them being unemployed.
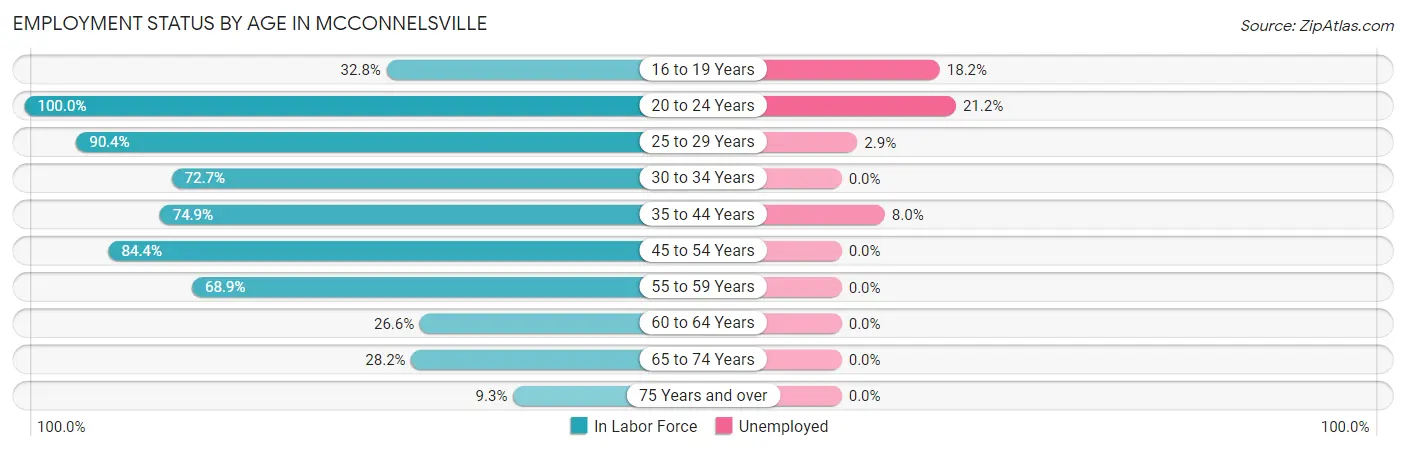
| Age Bracket | In Labor Force | Unemployed |
| 16 to 19 Years | 44 (32.8%) | 8 (18.2%) |
| 20 to 24 Years | 52 (100.0%) | 11 (21.2%) |
| 25 to 29 Years | 103 (90.4%) | 3 (2.9%) |
| 30 to 34 Years | 112 (72.7%) | 0 (0.0%) |
| 35 to 44 Years | 224 (74.9%) | 18 (8.0%) |
| 45 to 54 Years | 151 (84.4%) | 0 (0.0%) |
| 55 to 59 Years | 91 (68.9%) | 0 (0.0%) |
| 60 to 64 Years | 64 (26.6%) | 0 (0.0%) |
| 65 to 74 Years | 53 (28.2%) | 0 (0.0%) |
| 75 Years and over | 22 (9.3%) | 0 (0.0%) |
| Total | 915 (52.9%) | 40 (4.4%) |
Employment Status by Educational Attainment in Mcconnelsville
According to labor force statistics for Mcconnelsville, 66.6% of individuals (745) out of the total population between 25 and 64 years of age (1,119) are in the labor force, with 2.8% or 21 of them being unemployed. The group with the highest labor force participation rate are those with the educational attainment of college / associate degree, with 87.5% or 300 individuals in the labor force. Within the labor force, individuals with less than high school education have the highest percentage of unemployment, with 18.3% or 11 of them being unemployed.
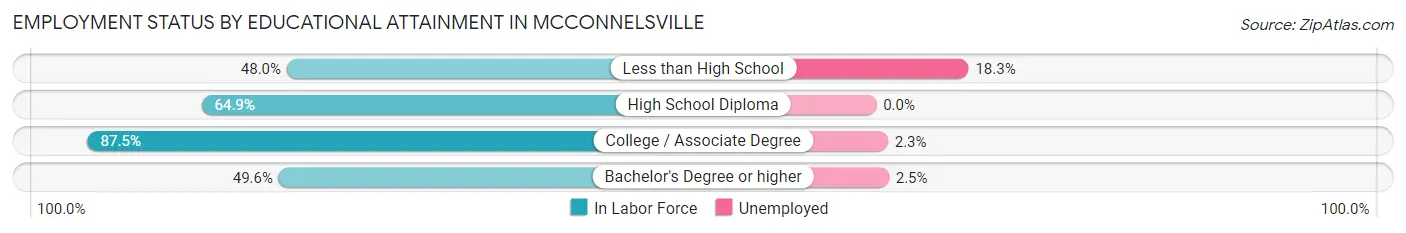
| Educational Attainment | In Labor Force | Unemployed |
| Less than High School | 60 (48.0%) | 23 (18.3%) |
| High School Diploma | 263 (64.9%) | 0 (0.0%) |
| College / Associate Degree | 300 (87.5%) | 8 (2.3%) |
| Bachelor's Degree or higher | 122 (49.6%) | 6 (2.5%) |
| Total | 745 (66.6%) | 31 (2.8%) |
Employment Occupations by Sex in Mcconnelsville
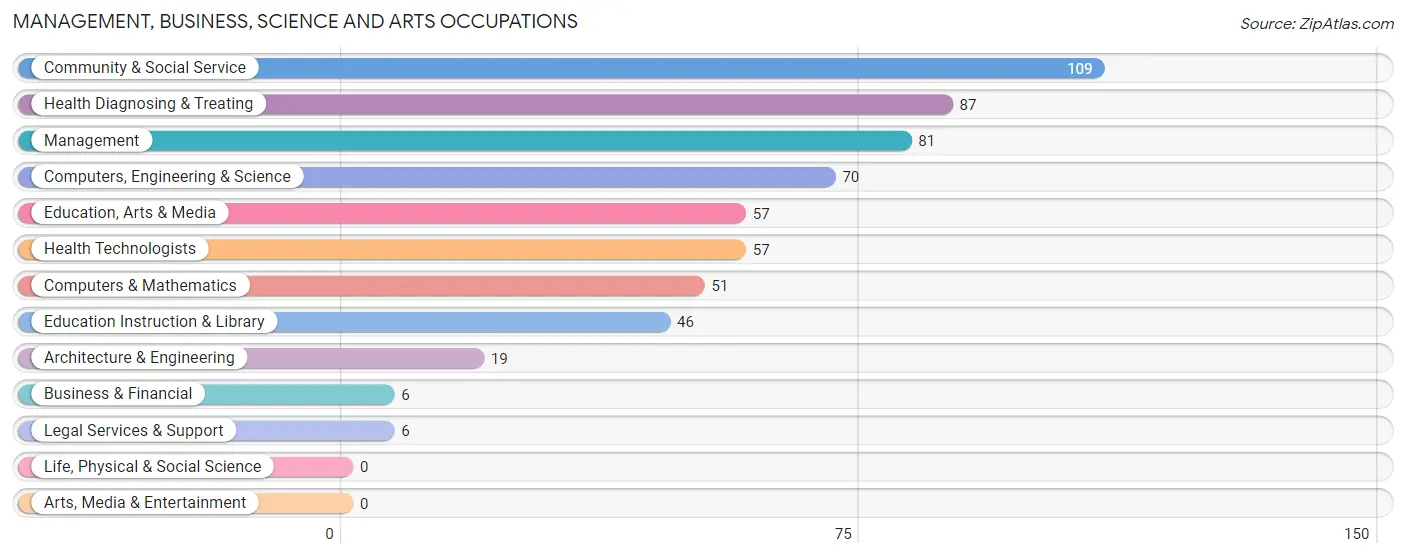
Management, Business, Science and Arts Occupations
The most common Management, Business, Science and Arts occupations in Mcconnelsville are Community & Social Service (109 | 12.4%), Health Diagnosing & Treating (87 | 9.9%), Management (81 | 9.2%), Computers, Engineering & Science (70 | 8.0%), and Education, Arts & Media (57 | 6.5%).
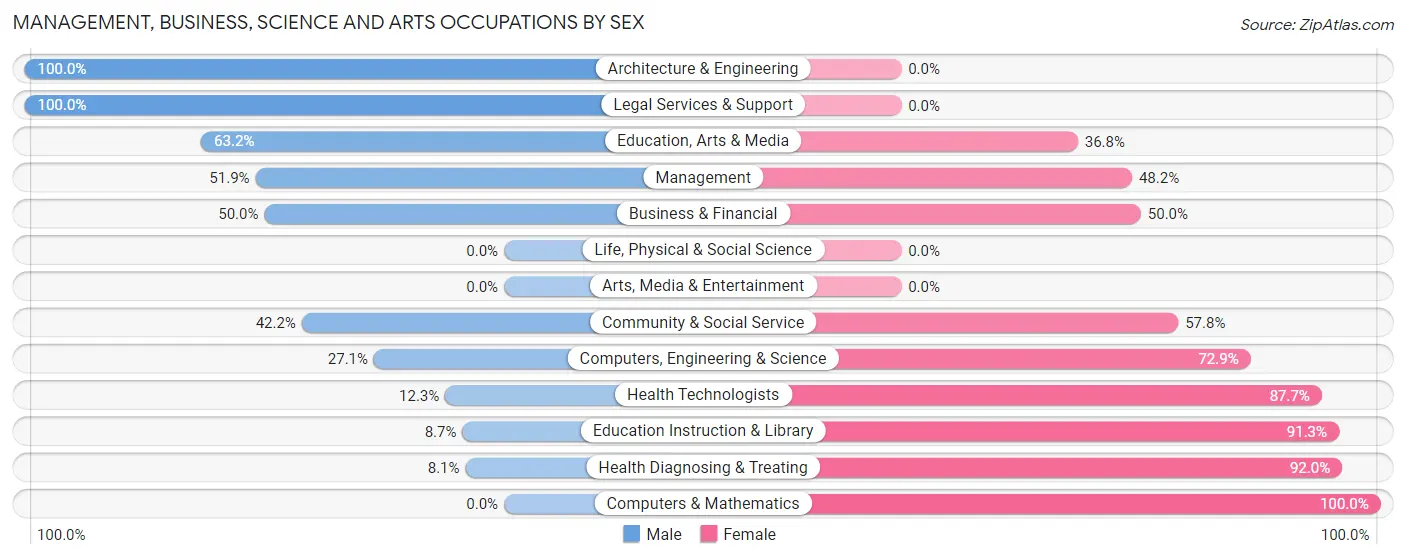
Management, Business, Science and Arts Occupations by Sex
Within the Management, Business, Science and Arts occupations in Mcconnelsville, the most male-oriented occupations are Architecture & Engineering (100.0%), Legal Services & Support (100.0%), and Education, Arts & Media (63.2%), while the most female-oriented occupations are Computers & Mathematics (100.0%), Health Diagnosing & Treating (91.9%), and Education Instruction & Library (91.3%).
| Occupation | Male | Female |
| Management | 42 (51.8%) | 39 (48.1%) |
| Business & Financial | 3 (50.0%) | 3 (50.0%) |
| Computers, Engineering & Science | 19 (27.1%) | 51 (72.9%) |
| Computers & Mathematics | 0 (0.0%) | 51 (100.0%) |
| Architecture & Engineering | 19 (100.0%) | 0 (0.0%) |
| Life, Physical & Social Science | 0 (0.0%) | 0 (0.0%) |
| Community & Social Service | 46 (42.2%) | 63 (57.8%) |
| Education, Arts & Media | 36 (63.2%) | 21 (36.8%) |
| Legal Services & Support | 6 (100.0%) | 0 (0.0%) |
| Education Instruction & Library | 4 (8.7%) | 42 (91.3%) |
| Arts, Media & Entertainment | 0 (0.0%) | 0 (0.0%) |
| Health Diagnosing & Treating | 7 (8.1%) | 80 (91.9%) |
| Health Technologists | 7 (12.3%) | 50 (87.7%) |
| Total (Category) | 117 (33.1%) | 236 (66.9%) |
| Total (Overall) | 377 (43.0%) | 499 (57.0%) |
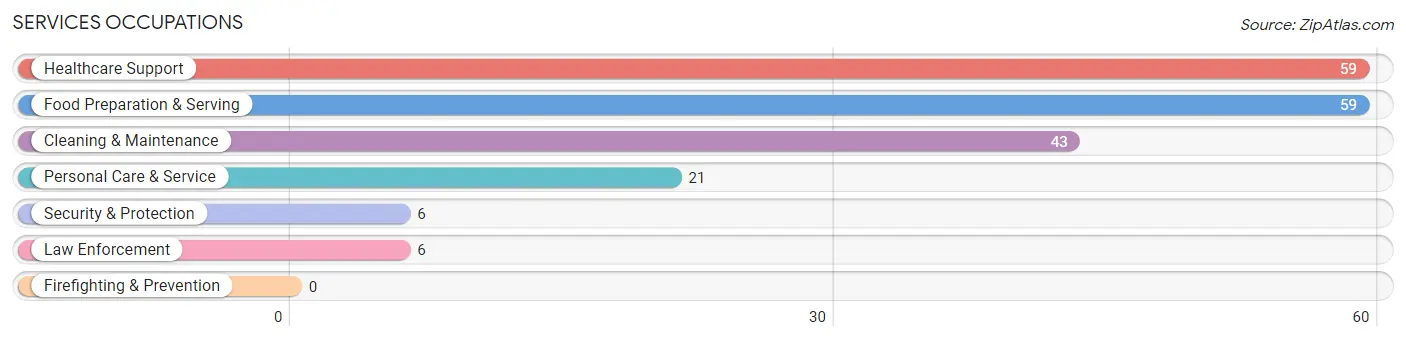
Services Occupations
The most common Services occupations in Mcconnelsville are Healthcare Support (59 | 6.7%), Food Preparation & Serving (59 | 6.7%), Cleaning & Maintenance (43 | 4.9%), Personal Care & Service (21 | 2.4%), and Security & Protection (6 | 0.7%).
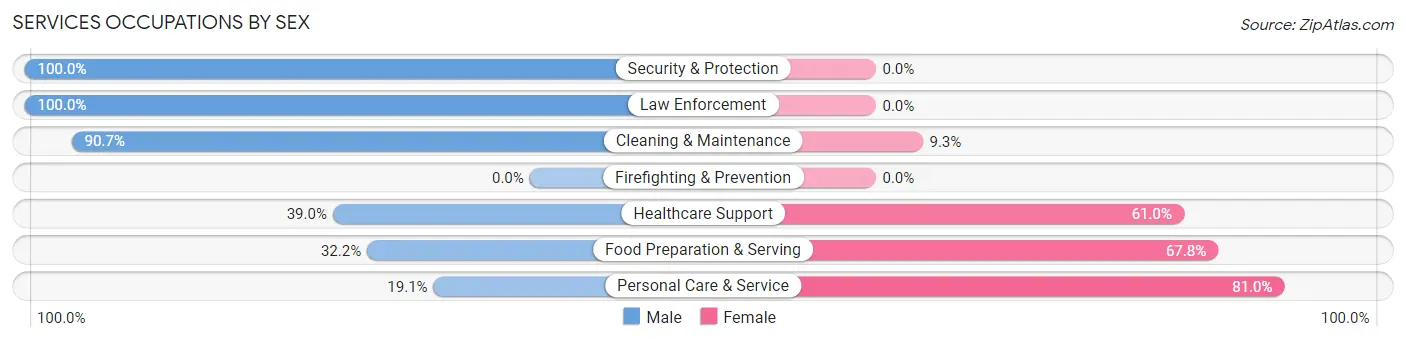
Services Occupations by Sex
Within the Services occupations in Mcconnelsville, the most male-oriented occupations are Security & Protection (100.0%), Law Enforcement (100.0%), and Cleaning & Maintenance (90.7%), while the most female-oriented occupations are Personal Care & Service (80.9%), Food Preparation & Serving (67.8%), and Healthcare Support (61.0%).
| Occupation | Male | Female |
| Healthcare Support | 23 (39.0%) | 36 (61.0%) |
| Security & Protection | 6 (100.0%) | 0 (0.0%) |
| Firefighting & Prevention | 0 (0.0%) | 0 (0.0%) |
| Law Enforcement | 6 (100.0%) | 0 (0.0%) |
| Food Preparation & Serving | 19 (32.2%) | 40 (67.8%) |
| Cleaning & Maintenance | 39 (90.7%) | 4 (9.3%) |
| Personal Care & Service | 4 (19.1%) | 17 (80.9%) |
| Total (Category) | 91 (48.4%) | 97 (51.6%) |
| Total (Overall) | 377 (43.0%) | 499 (57.0%) |
Sales and Office Occupations
The most common Sales and Office occupations in Mcconnelsville are Office & Administration (106 | 12.1%), and Sales & Related (45 | 5.1%).
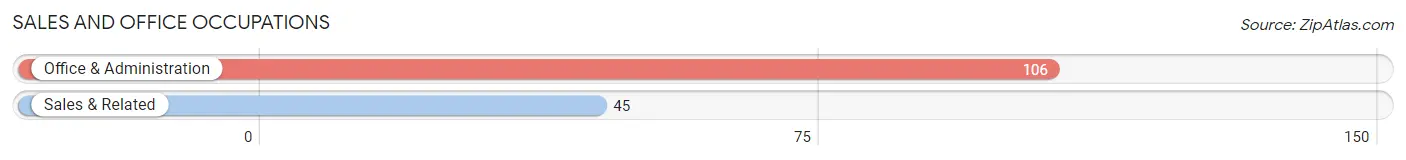
Sales and Office Occupations by Sex
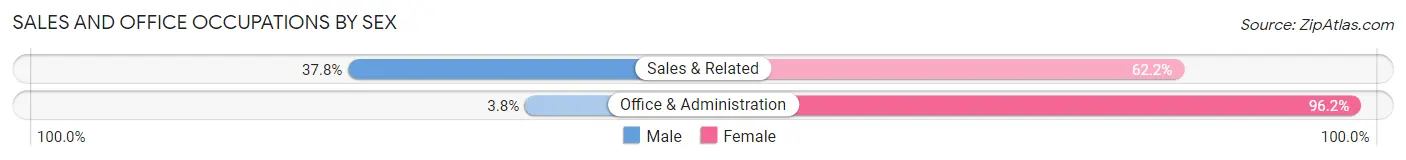
| Occupation | Male | Female |
| Sales & Related | 17 (37.8%) | 28 (62.2%) |
| Office & Administration | 4 (3.8%) | 102 (96.2%) |
| Total (Category) | 21 (13.9%) | 130 (86.1%) |
| Total (Overall) | 377 (43.0%) | 499 (57.0%) |
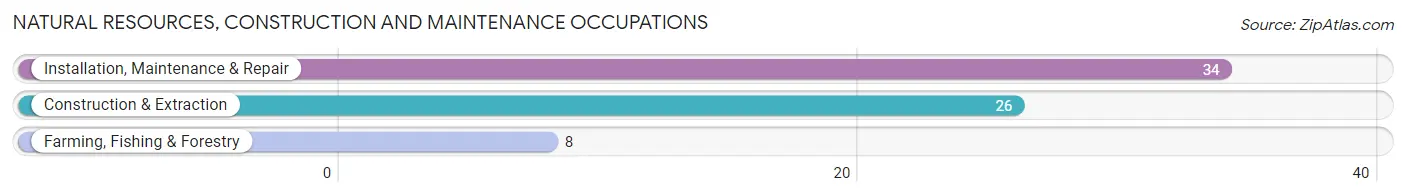
Natural Resources, Construction and Maintenance Occupations
The most common Natural Resources, Construction and Maintenance occupations in Mcconnelsville are Installation, Maintenance & Repair (34 | 3.9%), Construction & Extraction (26 | 3.0%), and Farming, Fishing & Forestry (8 | 0.9%).
Natural Resources, Construction and Maintenance Occupations by Sex
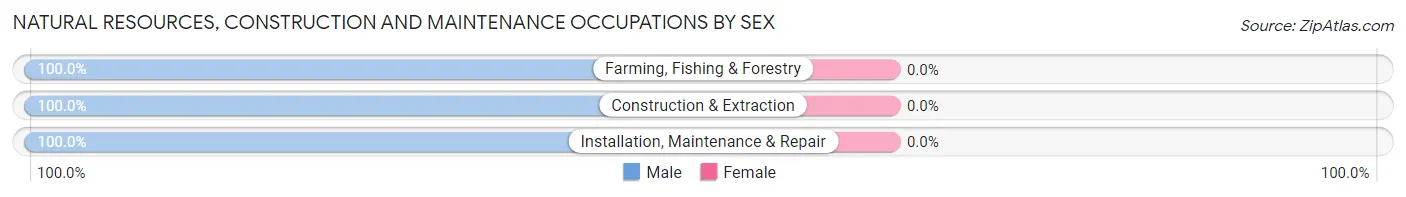
| Occupation | Male | Female |
| Farming, Fishing & Forestry | 8 (100.0%) | 0 (0.0%) |
| Construction & Extraction | 26 (100.0%) | 0 (0.0%) |
| Installation, Maintenance & Repair | 34 (100.0%) | 0 (0.0%) |
| Total (Category) | 68 (100.0%) | 0 (0.0%) |
| Total (Overall) | 377 (43.0%) | 499 (57.0%) |
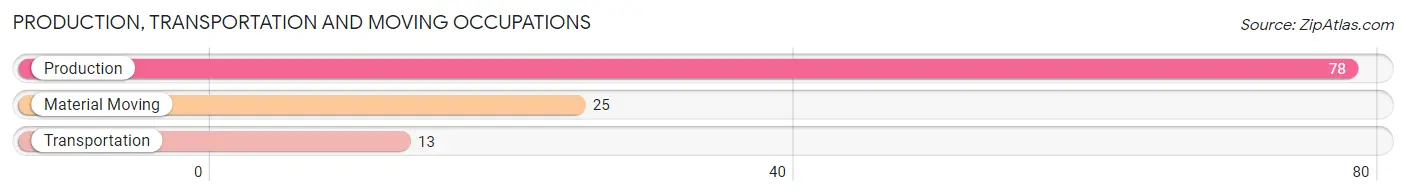
Production, Transportation and Moving Occupations
The most common Production, Transportation and Moving occupations in Mcconnelsville are Production (78 | 8.9%), Material Moving (25 | 2.9%), and Transportation (13 | 1.5%).
Production, Transportation and Moving Occupations by Sex
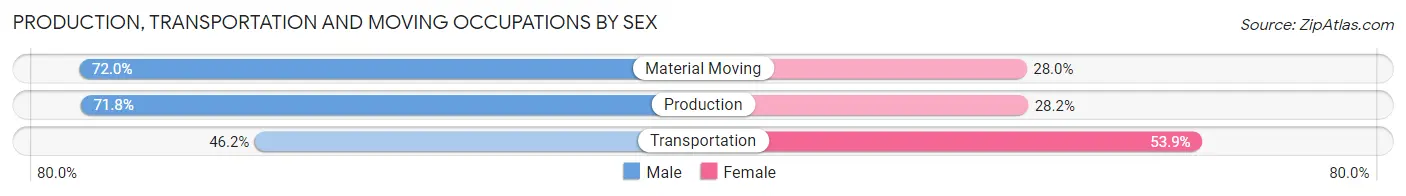
| Occupation | Male | Female |
| Production | 56 (71.8%) | 22 (28.2%) |
| Transportation | 6 (46.2%) | 7 (53.8%) |
| Material Moving | 18 (72.0%) | 7 (28.0%) |
| Total (Category) | 80 (69.0%) | 36 (31.0%) |
| Total (Overall) | 377 (43.0%) | 499 (57.0%) |
Employment Industries by Sex in Mcconnelsville
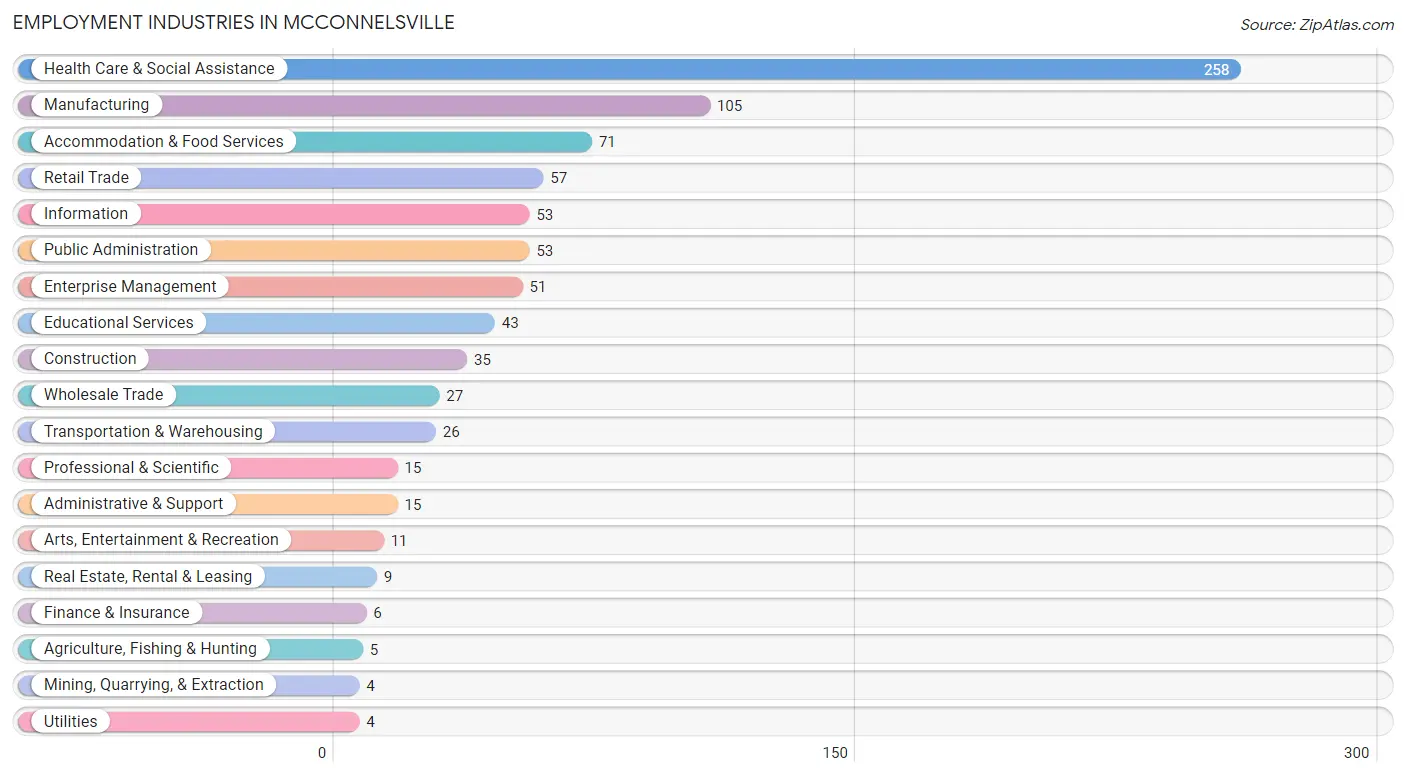
Employment Industries in Mcconnelsville
The major employment industries in Mcconnelsville include Health Care & Social Assistance (258 | 29.4%), Manufacturing (105 | 12.0%), Accommodation & Food Services (71 | 8.1%), Retail Trade (57 | 6.5%), and Information (53 | 6.0%).
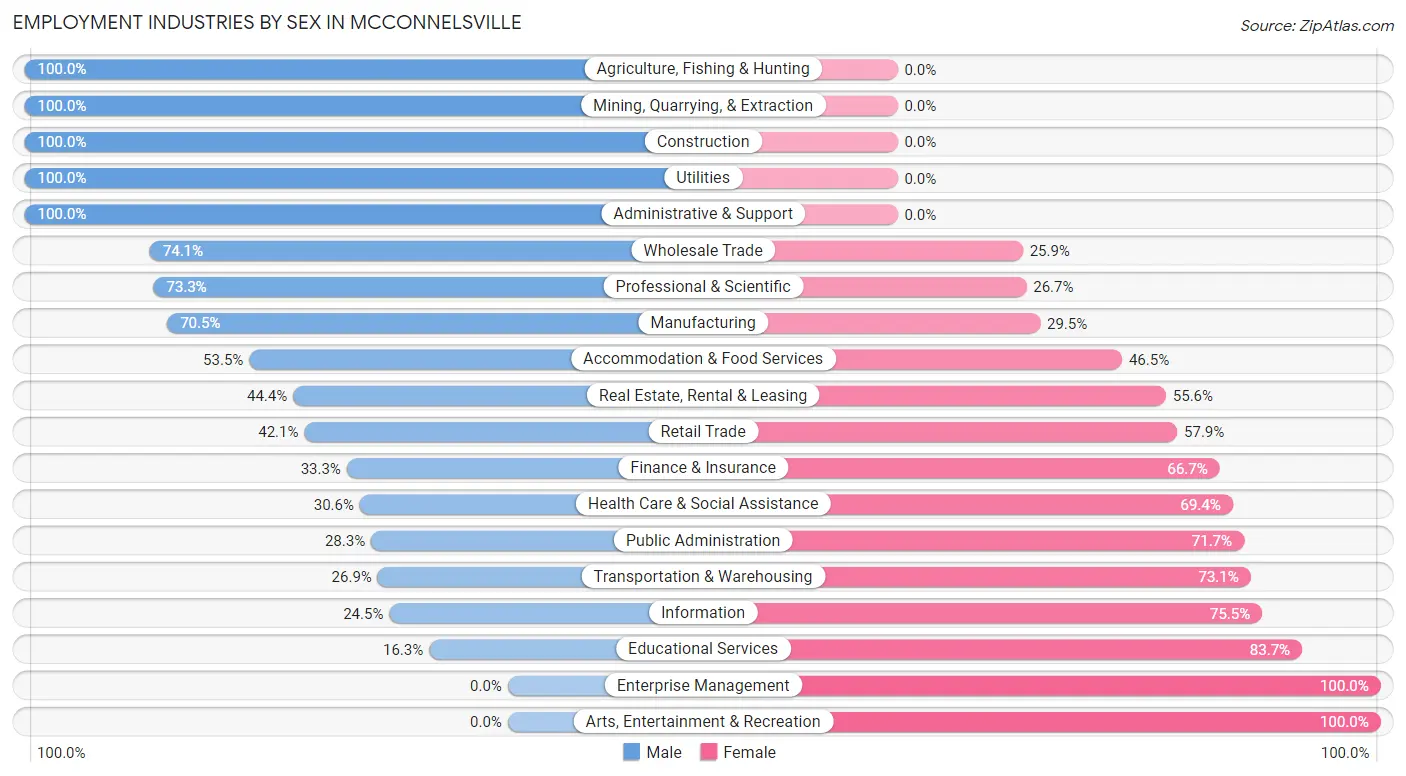
Employment Industries by Sex in Mcconnelsville
The Mcconnelsville industries that see more men than women are Agriculture, Fishing & Hunting (100.0%), Mining, Quarrying, & Extraction (100.0%), and Construction (100.0%), whereas the industries that tend to have a higher number of women are Enterprise Management (100.0%), Arts, Entertainment & Recreation (100.0%), and Educational Services (83.7%).
| Industry | Male | Female |
| Agriculture, Fishing & Hunting | 5 (100.0%) | 0 (0.0%) |
| Mining, Quarrying, & Extraction | 4 (100.0%) | 0 (0.0%) |
| Construction | 35 (100.0%) | 0 (0.0%) |
| Manufacturing | 74 (70.5%) | 31 (29.5%) |
| Wholesale Trade | 20 (74.1%) | 7 (25.9%) |
| Retail Trade | 24 (42.1%) | 33 (57.9%) |
| Transportation & Warehousing | 7 (26.9%) | 19 (73.1%) |
| Utilities | 4 (100.0%) | 0 (0.0%) |
| Information | 13 (24.5%) | 40 (75.5%) |
| Finance & Insurance | 2 (33.3%) | 4 (66.7%) |
| Real Estate, Rental & Leasing | 4 (44.4%) | 5 (55.6%) |
| Professional & Scientific | 11 (73.3%) | 4 (26.7%) |
| Enterprise Management | 0 (0.0%) | 51 (100.0%) |
| Administrative & Support | 15 (100.0%) | 0 (0.0%) |
| Educational Services | 7 (16.3%) | 36 (83.7%) |
| Health Care & Social Assistance | 79 (30.6%) | 179 (69.4%) |
| Arts, Entertainment & Recreation | 0 (0.0%) | 11 (100.0%) |
| Accommodation & Food Services | 38 (53.5%) | 33 (46.5%) |
| Public Administration | 15 (28.3%) | 38 (71.7%) |
| Total | 377 (43.0%) | 499 (57.0%) |
Education in Mcconnelsville
School Enrollment in Mcconnelsville
The most common levels of schooling among the 558 students in Mcconnelsville are middle school (216 | 38.7%), elementary school (159 | 28.5%), and high school (132 | 23.7%).
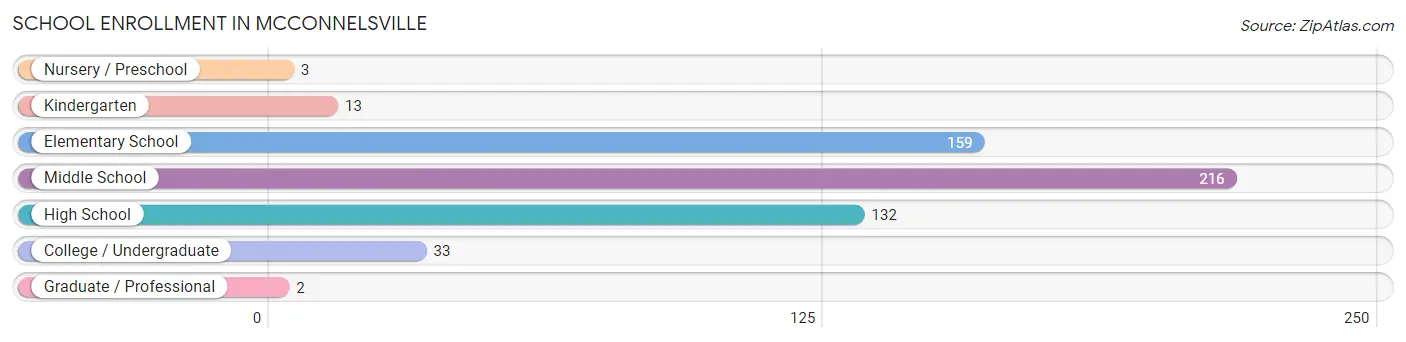
| School Level | # Students | % Students |
| Nursery / Preschool | 3 | 0.5% |
| Kindergarten | 13 | 2.3% |
| Elementary School | 159 | 28.5% |
| Middle School | 216 | 38.7% |
| High School | 132 | 23.7% |
| College / Undergraduate | 33 | 5.9% |
| Graduate / Professional | 2 | 0.4% |
| Total | 558 | 100.0% |
School Enrollment by Age by Funding Source in Mcconnelsville
Out of a total of 558 students who are enrolled in schools in Mcconnelsville, 25 (4.5%) attend a private institution, while the remaining 533 (95.5%) are enrolled in public schools. The age group of 5 to 9 year old has the highest likelihood of being enrolled in private schools, with 16 (15.8% in the age bracket) enrolled. Conversely, the age group of 3 to 4 year olds has the lowest likelihood of being enrolled in a private school, with 3 (100.0% in the age bracket) attending a public institution.
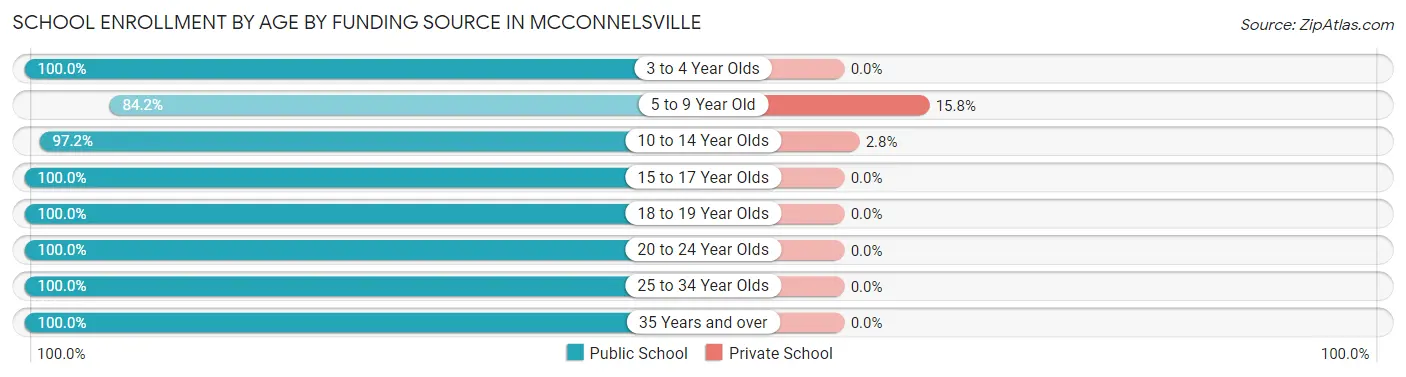
| Age Bracket | Public School | Private School |
| 3 to 4 Year Olds | 3 (100.0%) | 0 (0.0%) |
| 5 to 9 Year Old | 85 (84.2%) | 16 (15.8%) |
| 10 to 14 Year Olds | 313 (97.2%) | 9 (2.8%) |
| 15 to 17 Year Olds | 91 (100.0%) | 0 (0.0%) |
| 18 to 19 Year Olds | 8 (100.0%) | 0 (0.0%) |
| 20 to 24 Year Olds | 8 (100.0%) | 0 (0.0%) |
| 25 to 34 Year Olds | 8 (100.0%) | 0 (0.0%) |
| 35 Years and over | 17 (100.0%) | 0 (0.0%) |
| Total | 533 (95.5%) | 25 (4.5%) |
Educational Attainment by Field of Study in Mcconnelsville
Engineering (143 | 46.9%), science & technology (36 | 11.8%), business (34 | 11.2%), arts & humanities (33 | 10.8%), and education (26 | 8.5%) are the most common fields of study among 305 individuals in Mcconnelsville who have obtained a bachelor's degree or higher.
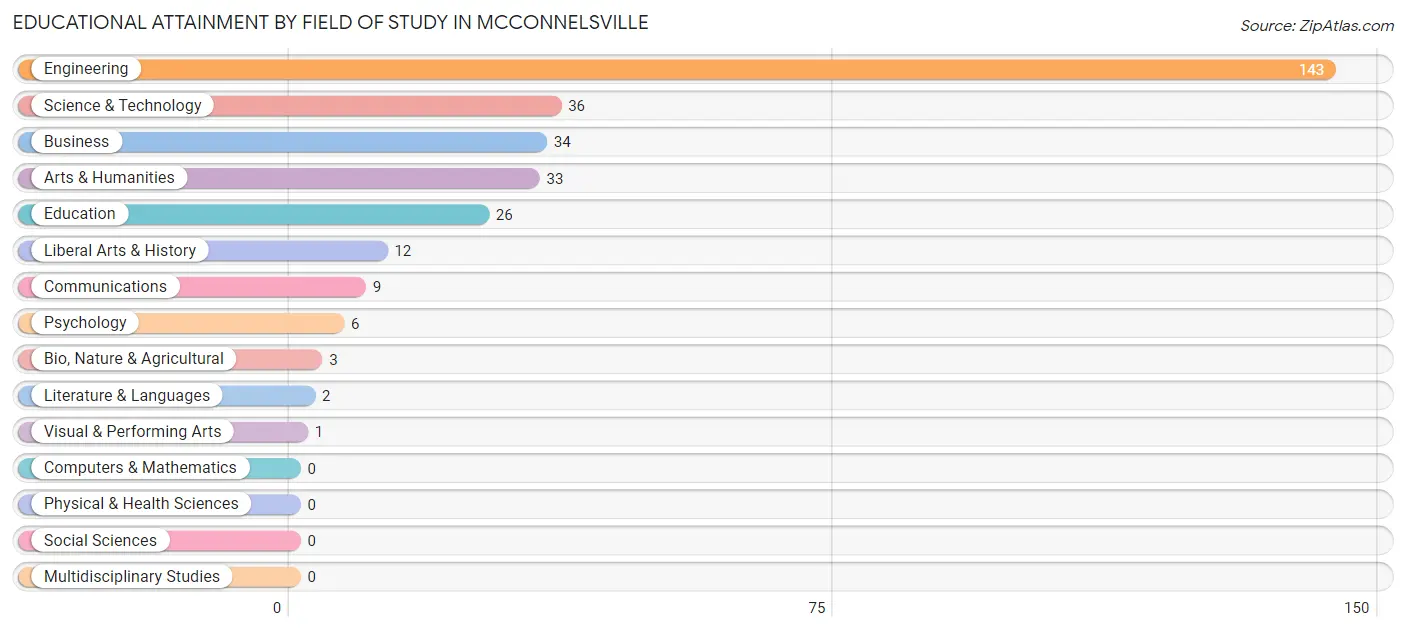
| Field of Study | # Graduates | % Graduates |
| Computers & Mathematics | 0 | 0.0% |
| Bio, Nature & Agricultural | 3 | 1.0% |
| Physical & Health Sciences | 0 | 0.0% |
| Psychology | 6 | 2.0% |
| Social Sciences | 0 | 0.0% |
| Engineering | 143 | 46.9% |
| Multidisciplinary Studies | 0 | 0.0% |
| Science & Technology | 36 | 11.8% |
| Business | 34 | 11.2% |
| Education | 26 | 8.5% |
| Literature & Languages | 2 | 0.7% |
| Liberal Arts & History | 12 | 3.9% |
| Visual & Performing Arts | 1 | 0.3% |
| Communications | 9 | 2.9% |
| Arts & Humanities | 33 | 10.8% |
| Total | 305 | 100.0% |
Transportation & Commute in Mcconnelsville
Vehicle Availability by Sex in Mcconnelsville
The most prevalent vehicle ownership categories in Mcconnelsville are males with 2 vehicles (171, accounting for 45.4%) and females with 2 vehicles (188, making up 35.0%).
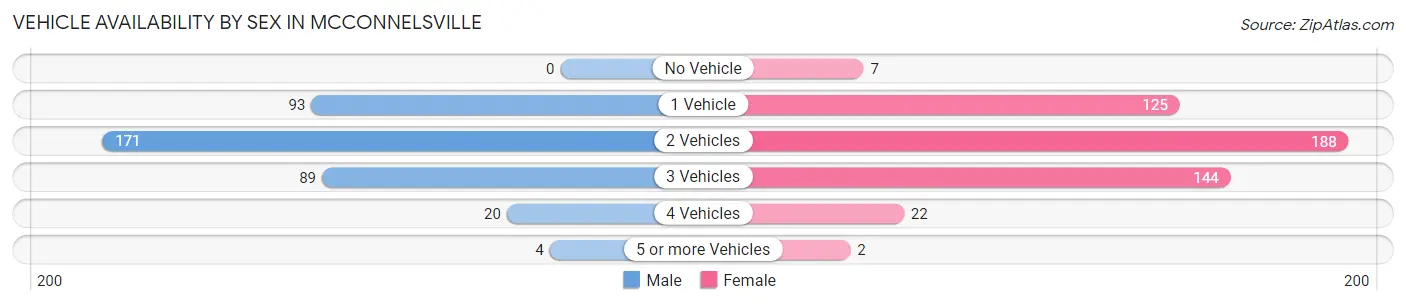
| Vehicles Available | Male | Female |
| No Vehicle | 0 (0.0%) | 7 (1.4%) |
| 1 Vehicle | 93 (24.7%) | 125 (25.6%) |
| 2 Vehicles | 171 (45.4%) | 188 (38.5%) |
| 3 Vehicles | 89 (23.6%) | 144 (29.5%) |
| 4 Vehicles | 20 (5.3%) | 22 (4.5%) |
| 5 or more Vehicles | 4 (1.1%) | 2 (0.4%) |
| Total | 377 (100.0%) | 488 (100.0%) |
Commute Time in Mcconnelsville
The most frequently occuring commute durations in Mcconnelsville are 5 to 9 minutes (272 commuters, 34.1%), 10 to 14 minutes (136 commuters, 17.0%), and less than 5 minutes (130 commuters, 16.3%).
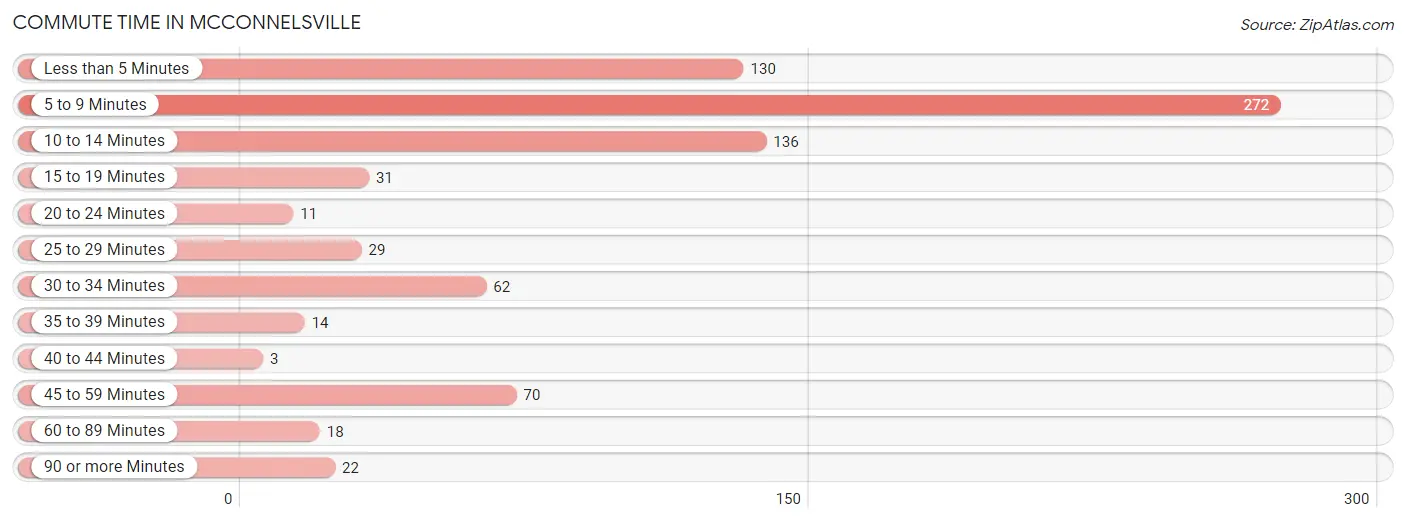
| Commute Time | # Commuters | % Commuters |
| Less than 5 Minutes | 130 | 16.3% |
| 5 to 9 Minutes | 272 | 34.1% |
| 10 to 14 Minutes | 136 | 17.0% |
| 15 to 19 Minutes | 31 | 3.9% |
| 20 to 24 Minutes | 11 | 1.4% |
| 25 to 29 Minutes | 29 | 3.6% |
| 30 to 34 Minutes | 62 | 7.8% |
| 35 to 39 Minutes | 14 | 1.8% |
| 40 to 44 Minutes | 3 | 0.4% |
| 45 to 59 Minutes | 70 | 8.8% |
| 60 to 89 Minutes | 18 | 2.3% |
| 90 or more Minutes | 22 | 2.8% |
Commute Time by Sex in Mcconnelsville
The most common commute times in Mcconnelsville are 5 to 9 minutes (127 commuters, 34.5%) for males and 5 to 9 minutes (145 commuters, 33.7%) for females.
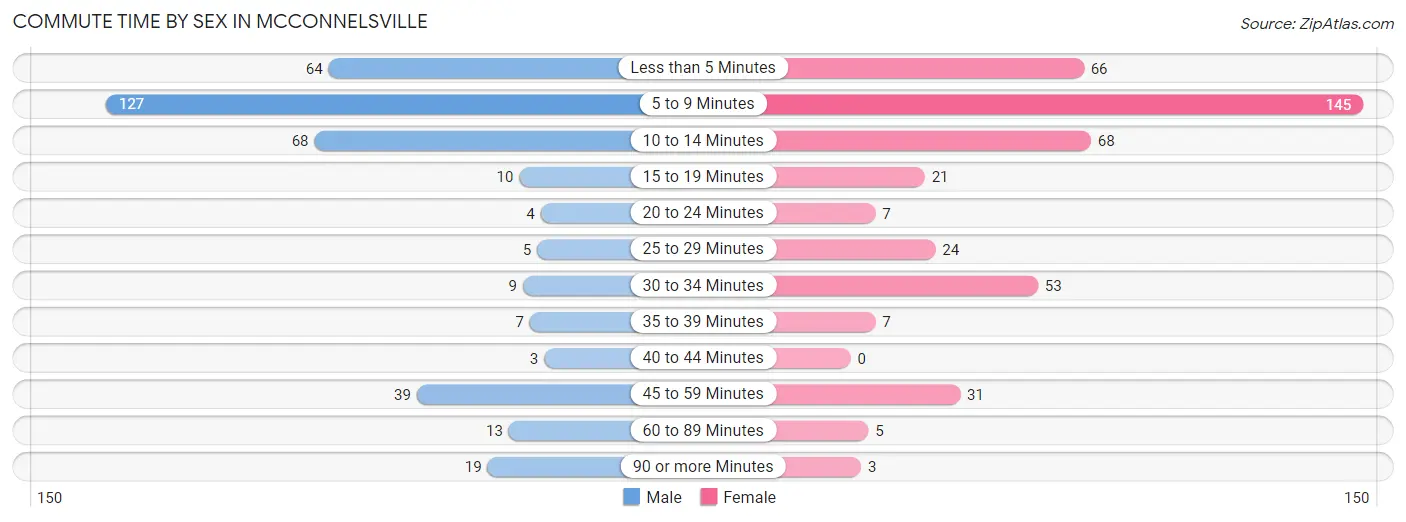
| Commute Time | Male | Female |
| Less than 5 Minutes | 64 (17.4%) | 66 (15.3%) |
| 5 to 9 Minutes | 127 (34.5%) | 145 (33.7%) |
| 10 to 14 Minutes | 68 (18.5%) | 68 (15.8%) |
| 15 to 19 Minutes | 10 (2.7%) | 21 (4.9%) |
| 20 to 24 Minutes | 4 (1.1%) | 7 (1.6%) |
| 25 to 29 Minutes | 5 (1.4%) | 24 (5.6%) |
| 30 to 34 Minutes | 9 (2.5%) | 53 (12.3%) |
| 35 to 39 Minutes | 7 (1.9%) | 7 (1.6%) |
| 40 to 44 Minutes | 3 (0.8%) | 0 (0.0%) |
| 45 to 59 Minutes | 39 (10.6%) | 31 (7.2%) |
| 60 to 89 Minutes | 13 (3.5%) | 5 (1.2%) |
| 90 or more Minutes | 19 (5.2%) | 3 (0.7%) |
Time of Departure to Work by Sex in Mcconnelsville
The most frequent times of departure to work in Mcconnelsville are 6:30 AM to 6:59 AM (65, 17.7%) for males and 7:00 AM to 7:29 AM (143, 33.3%) for females.
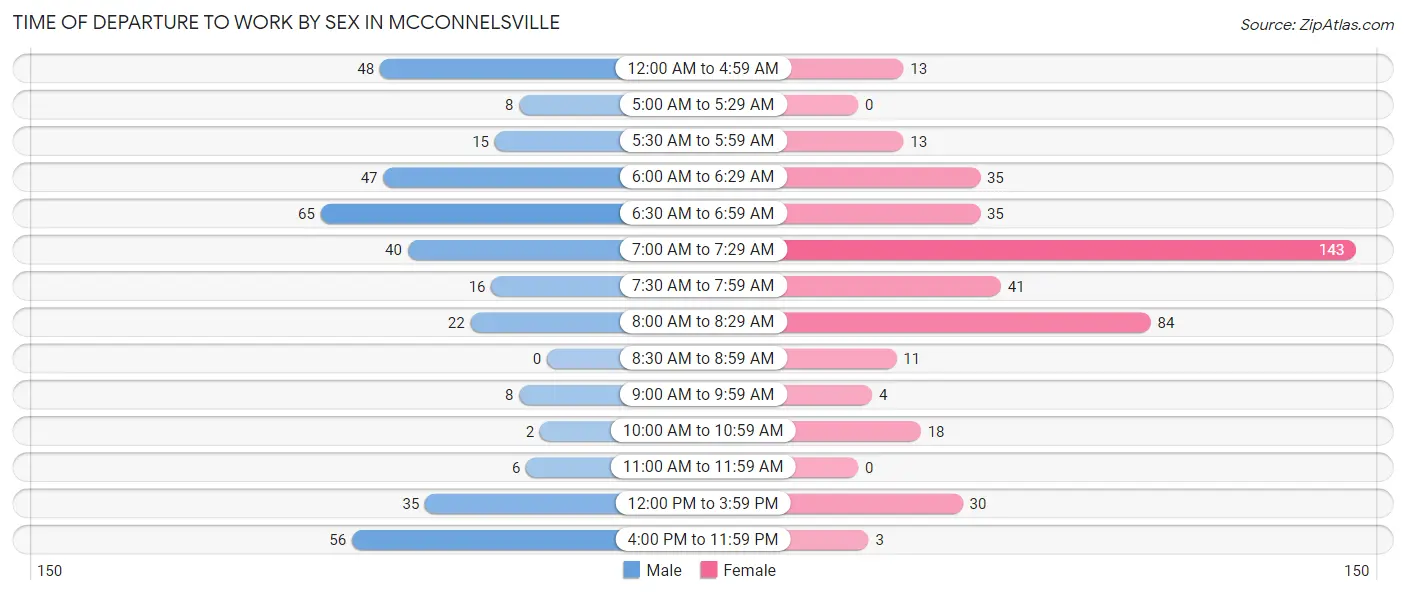
| Time of Departure | Male | Female |
| 12:00 AM to 4:59 AM | 48 (13.0%) | 13 (3.0%) |
| 5:00 AM to 5:29 AM | 8 (2.2%) | 0 (0.0%) |
| 5:30 AM to 5:59 AM | 15 (4.1%) | 13 (3.0%) |
| 6:00 AM to 6:29 AM | 47 (12.8%) | 35 (8.1%) |
| 6:30 AM to 6:59 AM | 65 (17.7%) | 35 (8.1%) |
| 7:00 AM to 7:29 AM | 40 (10.9%) | 143 (33.3%) |
| 7:30 AM to 7:59 AM | 16 (4.3%) | 41 (9.5%) |
| 8:00 AM to 8:29 AM | 22 (6.0%) | 84 (19.5%) |
| 8:30 AM to 8:59 AM | 0 (0.0%) | 11 (2.6%) |
| 9:00 AM to 9:59 AM | 8 (2.2%) | 4 (0.9%) |
| 10:00 AM to 10:59 AM | 2 (0.5%) | 18 (4.2%) |
| 11:00 AM to 11:59 AM | 6 (1.6%) | 0 (0.0%) |
| 12:00 PM to 3:59 PM | 35 (9.5%) | 30 (7.0%) |
| 4:00 PM to 11:59 PM | 56 (15.2%) | 3 (0.7%) |
| Total | 368 (100.0%) | 430 (100.0%) |
Housing Occupancy in Mcconnelsville
Occupancy by Ownership in Mcconnelsville
Of the total 858 dwellings in Mcconnelsville, owner-occupied units account for 438 (51.0%), while renter-occupied units make up 420 (48.9%).
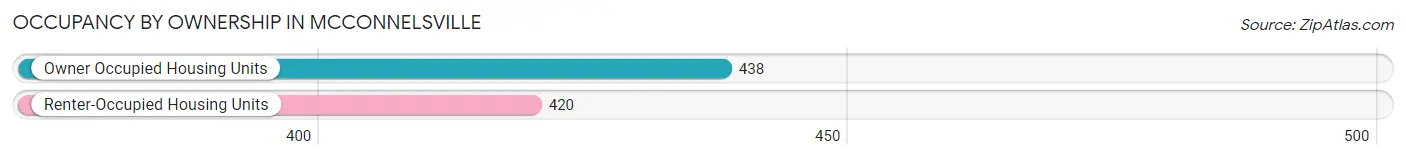
| Occupancy | # Housing Units | % Housing Units |
| Owner Occupied Housing Units | 438 | 51.0% |
| Renter-Occupied Housing Units | 420 | 48.9% |
| Total Occupied Housing Units | 858 | 100.0% |
Occupancy by Household Size in Mcconnelsville
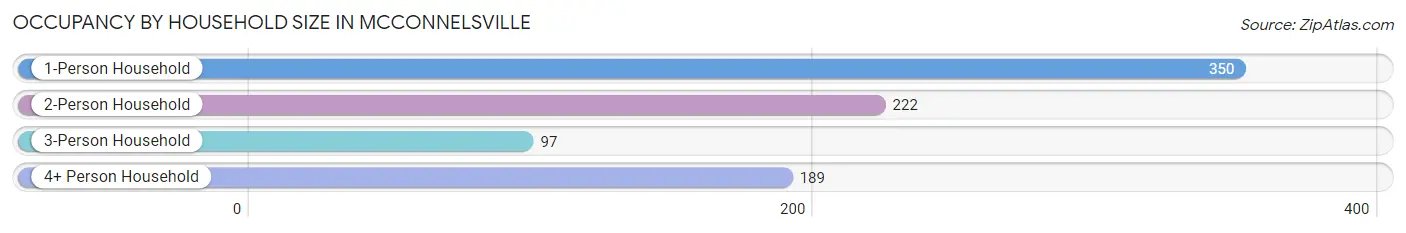
| Household Size | # Housing Units | % Housing Units |
| 1-Person Household | 350 | 40.8% |
| 2-Person Household | 222 | 25.9% |
| 3-Person Household | 97 | 11.3% |
| 4+ Person Household | 189 | 22.0% |
| Total Housing Units | 858 | 100.0% |
Occupancy by Ownership by Household Size in Mcconnelsville
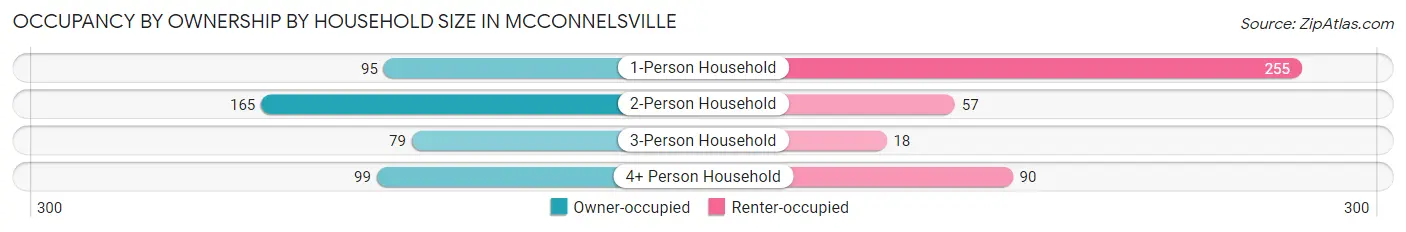
| Household Size | Owner-occupied | Renter-occupied |
| 1-Person Household | 95 (27.1%) | 255 (72.9%) |
| 2-Person Household | 165 (74.3%) | 57 (25.7%) |
| 3-Person Household | 79 (81.4%) | 18 (18.6%) |
| 4+ Person Household | 99 (52.4%) | 90 (47.6%) |
| Total Housing Units | 438 (51.0%) | 420 (48.9%) |
Occupancy by Educational Attainment in Mcconnelsville
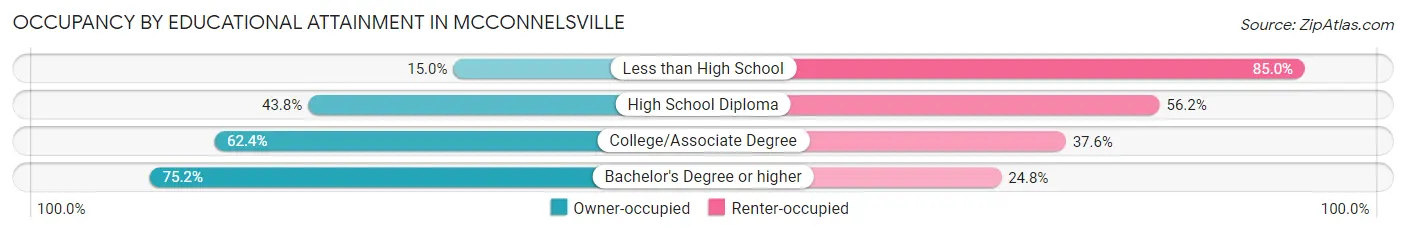
| Household Size | Owner-occupied | Renter-occupied |
| Less than High School | 18 (15.0%) | 102 (85.0%) |
| High School Diploma | 131 (43.8%) | 168 (56.2%) |
| College/Associate Degree | 201 (62.4%) | 121 (37.6%) |
| Bachelor's Degree or higher | 88 (75.2%) | 29 (24.8%) |
Occupancy by Age of Householder in Mcconnelsville
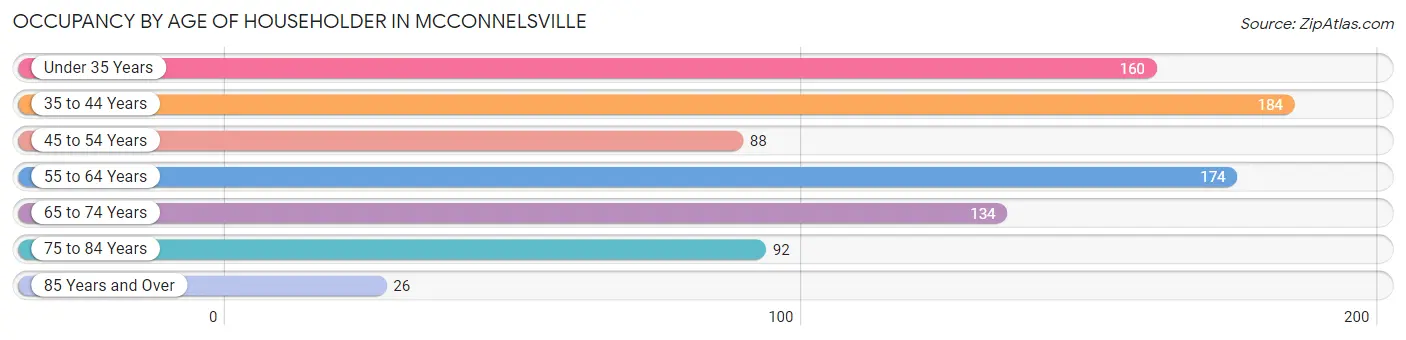
| Age Bracket | # Households | % Households |
| Under 35 Years | 160 | 18.6% |
| 35 to 44 Years | 184 | 21.4% |
| 45 to 54 Years | 88 | 10.3% |
| 55 to 64 Years | 174 | 20.3% |
| 65 to 74 Years | 134 | 15.6% |
| 75 to 84 Years | 92 | 10.7% |
| 85 Years and Over | 26 | 3.0% |
| Total | 858 | 100.0% |
Housing Finances in Mcconnelsville
Median Income by Occupancy in Mcconnelsville
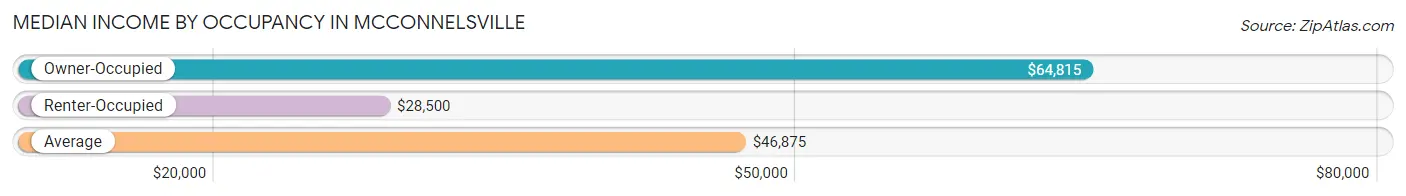
| Occupancy Type | # Households | Median Income |
| Owner-Occupied | 438 (51.0%) | $64,815 |
| Renter-Occupied | 420 (48.9%) | $28,500 |
| Average | 858 (100.0%) | $46,875 |
Occupancy by Householder Income Bracket in Mcconnelsville
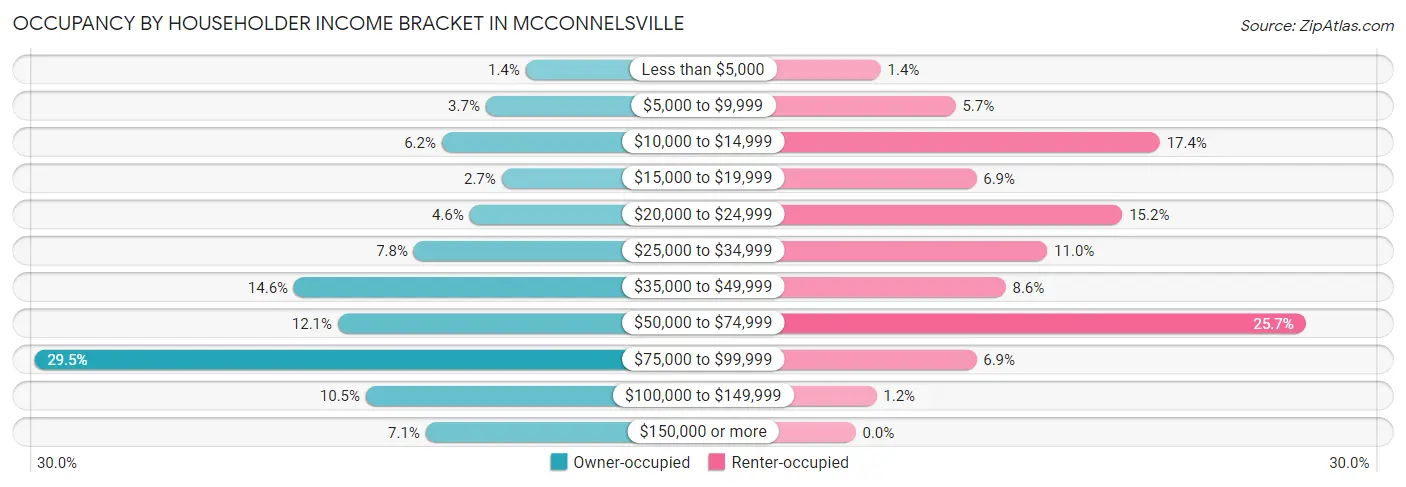
| Income Bracket | Owner-occupied | Renter-occupied |
| Less than $5,000 | 6 (1.4%) | 6 (1.4%) |
| $5,000 to $9,999 | 16 (3.6%) | 24 (5.7%) |
| $10,000 to $14,999 | 27 (6.2%) | 73 (17.4%) |
| $15,000 to $19,999 | 12 (2.7%) | 29 (6.9%) |
| $20,000 to $24,999 | 20 (4.6%) | 64 (15.2%) |
| $25,000 to $34,999 | 34 (7.8%) | 46 (11.0%) |
| $35,000 to $49,999 | 64 (14.6%) | 36 (8.6%) |
| $50,000 to $74,999 | 53 (12.1%) | 108 (25.7%) |
| $75,000 to $99,999 | 129 (29.4%) | 29 (6.9%) |
| $100,000 to $149,999 | 46 (10.5%) | 5 (1.2%) |
| $150,000 or more | 31 (7.1%) | 0 (0.0%) |
| Total | 438 (100.0%) | 420 (100.0%) |
Monthly Housing Cost Tiers in Mcconnelsville
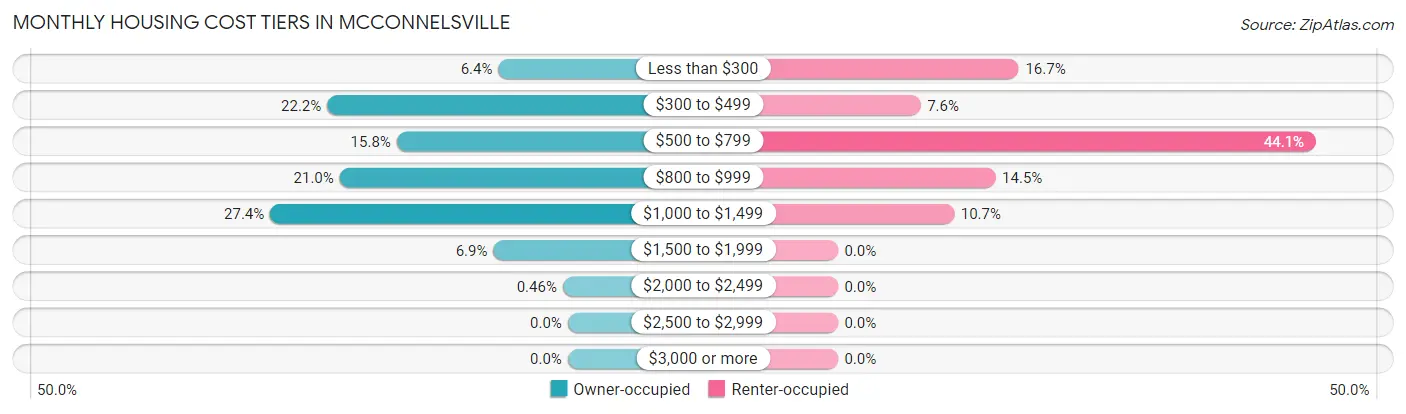
| Monthly Cost | Owner-occupied | Renter-occupied |
| Less than $300 | 28 (6.4%) | 70 (16.7%) |
| $300 to $499 | 97 (22.2%) | 32 (7.6%) |
| $500 to $799 | 69 (15.8%) | 185 (44.1%) |
| $800 to $999 | 92 (21.0%) | 61 (14.5%) |
| $1,000 to $1,499 | 120 (27.4%) | 45 (10.7%) |
| $1,500 to $1,999 | 30 (6.9%) | 0 (0.0%) |
| $2,000 to $2,499 | 2 (0.5%) | 0 (0.0%) |
| $2,500 to $2,999 | 0 (0.0%) | 0 (0.0%) |
| $3,000 or more | 0 (0.0%) | 0 (0.0%) |
| Total | 438 (100.0%) | 420 (100.0%) |
Physical Housing Characteristics in Mcconnelsville
Housing Structures in Mcconnelsville
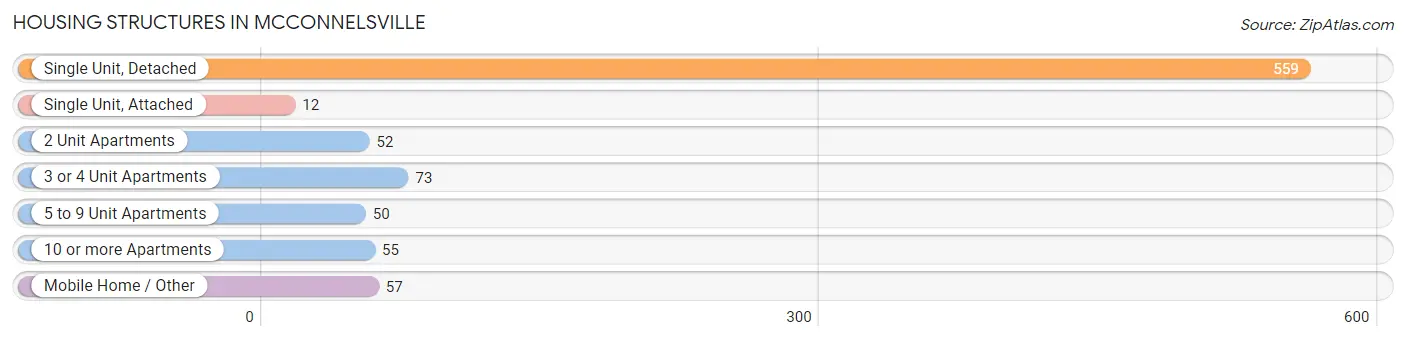
| Structure Type | # Housing Units | % Housing Units |
| Single Unit, Detached | 559 | 65.1% |
| Single Unit, Attached | 12 | 1.4% |
| 2 Unit Apartments | 52 | 6.1% |
| 3 or 4 Unit Apartments | 73 | 8.5% |
| 5 to 9 Unit Apartments | 50 | 5.8% |
| 10 or more Apartments | 55 | 6.4% |
| Mobile Home / Other | 57 | 6.6% |
| Total | 858 | 100.0% |
Housing Structures by Occupancy in Mcconnelsville
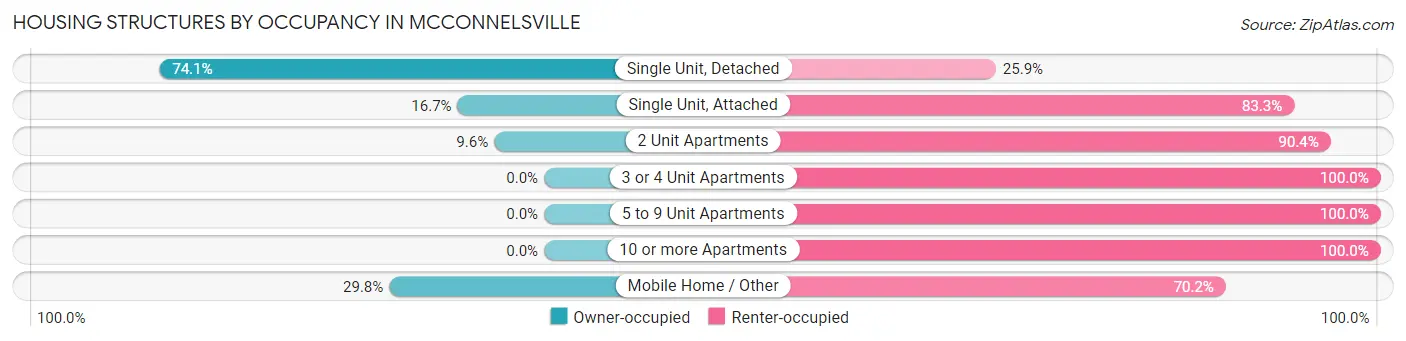
| Structure Type | Owner-occupied | Renter-occupied |
| Single Unit, Detached | 414 (74.1%) | 145 (25.9%) |
| Single Unit, Attached | 2 (16.7%) | 10 (83.3%) |
| 2 Unit Apartments | 5 (9.6%) | 47 (90.4%) |
| 3 or 4 Unit Apartments | 0 (0.0%) | 73 (100.0%) |
| 5 to 9 Unit Apartments | 0 (0.0%) | 50 (100.0%) |
| 10 or more Apartments | 0 (0.0%) | 55 (100.0%) |
| Mobile Home / Other | 17 (29.8%) | 40 (70.2%) |
| Total | 438 (51.0%) | 420 (48.9%) |
Housing Structures by Number of Rooms in Mcconnelsville
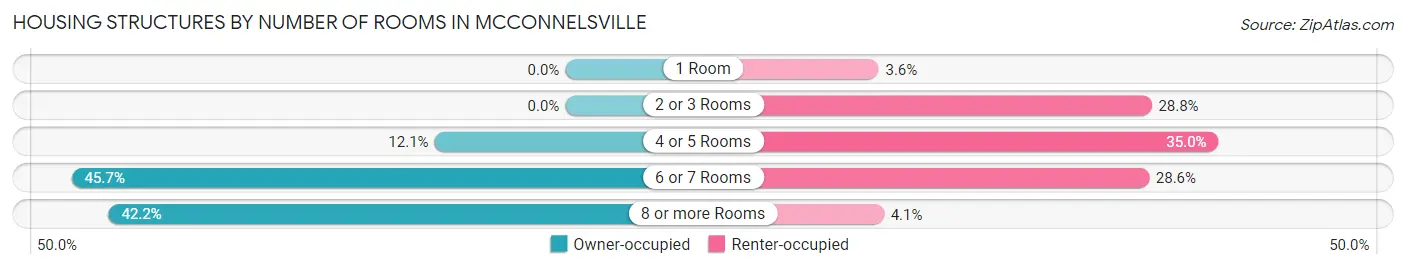
| Number of Rooms | Owner-occupied | Renter-occupied |
| 1 Room | 0 (0.0%) | 15 (3.6%) |
| 2 or 3 Rooms | 0 (0.0%) | 121 (28.8%) |
| 4 or 5 Rooms | 53 (12.1%) | 147 (35.0%) |
| 6 or 7 Rooms | 200 (45.7%) | 120 (28.6%) |
| 8 or more Rooms | 185 (42.2%) | 17 (4.1%) |
| Total | 438 (100.0%) | 420 (100.0%) |
Housing Structure by Heating Type in Mcconnelsville
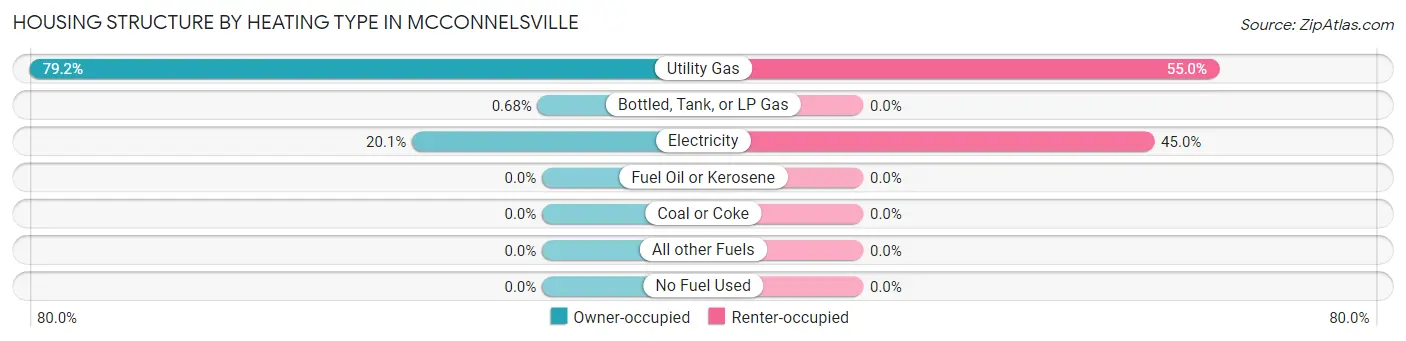
| Heating Type | Owner-occupied | Renter-occupied |
| Utility Gas | 347 (79.2%) | 231 (55.0%) |
| Bottled, Tank, or LP Gas | 3 (0.7%) | 0 (0.0%) |
| Electricity | 88 (20.1%) | 189 (45.0%) |
| Fuel Oil or Kerosene | 0 (0.0%) | 0 (0.0%) |
| Coal or Coke | 0 (0.0%) | 0 (0.0%) |
| All other Fuels | 0 (0.0%) | 0 (0.0%) |
| No Fuel Used | 0 (0.0%) | 0 (0.0%) |
| Total | 438 (100.0%) | 420 (100.0%) |
Household Vehicle Usage in Mcconnelsville
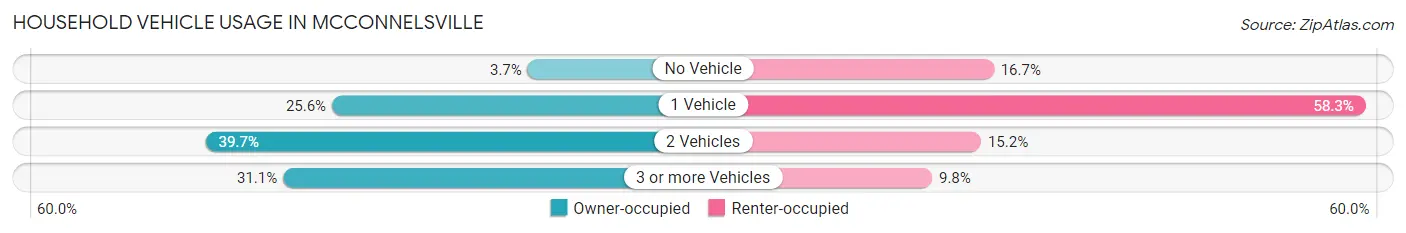
| Vehicles per Household | Owner-occupied | Renter-occupied |
| No Vehicle | 16 (3.6%) | 70 (16.7%) |
| 1 Vehicle | 112 (25.6%) | 245 (58.3%) |
| 2 Vehicles | 174 (39.7%) | 64 (15.2%) |
| 3 or more Vehicles | 136 (31.0%) | 41 (9.8%) |
| Total | 438 (100.0%) | 420 (100.0%) |
Real Estate & Mortgages in Mcconnelsville
Real Estate and Mortgage Overview in Mcconnelsville
| Characteristic | Without Mortgage | With Mortgage |
| Housing Units | 183 | 255 |
| Median Property Value | $102,800 | $99,600 |
| Median Household Income | $42,292 | $27 |
| Monthly Housing Costs | $429 | $0 |
| Real Estate Taxes | $850 | $0 |
Property Value by Mortgage Status in Mcconnelsville
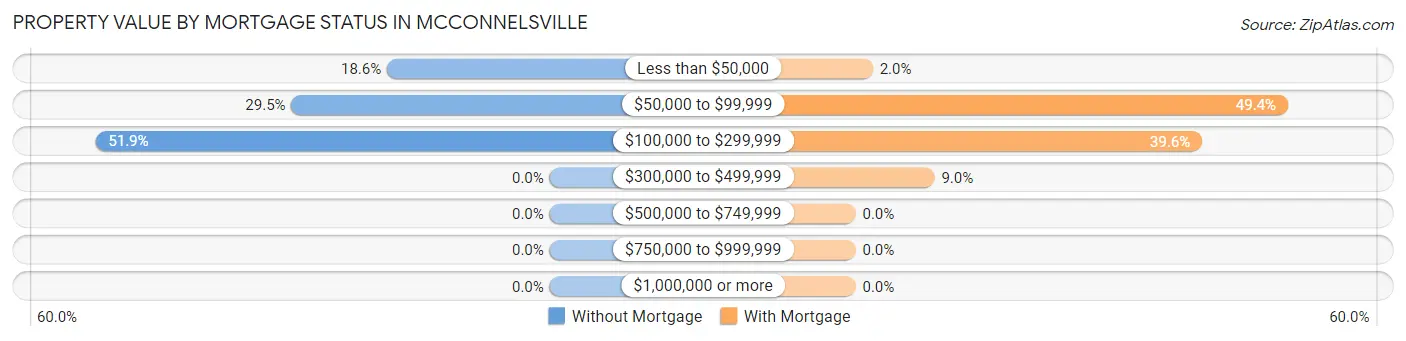
| Property Value | Without Mortgage | With Mortgage |
| Less than $50,000 | 34 (18.6%) | 5 (2.0%) |
| $50,000 to $99,999 | 54 (29.5%) | 126 (49.4%) |
| $100,000 to $299,999 | 95 (51.9%) | 101 (39.6%) |
| $300,000 to $499,999 | 0 (0.0%) | 23 (9.0%) |
| $500,000 to $749,999 | 0 (0.0%) | 0 (0.0%) |
| $750,000 to $999,999 | 0 (0.0%) | 0 (0.0%) |
| $1,000,000 or more | 0 (0.0%) | 0 (0.0%) |
| Total | 183 (100.0%) | 255 (100.0%) |
Household Income by Mortgage Status in Mcconnelsville
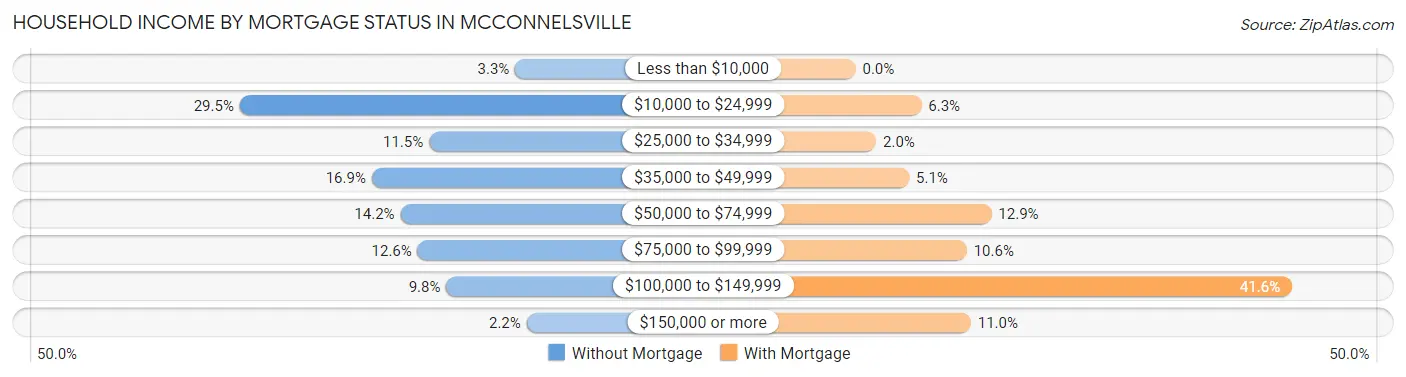
| Household Income | Without Mortgage | With Mortgage |
| Less than $10,000 | 6 (3.3%) | 0 (0.0%) |
| $10,000 to $24,999 | 54 (29.5%) | 16 (6.3%) |
| $25,000 to $34,999 | 21 (11.5%) | 5 (2.0%) |
| $35,000 to $49,999 | 31 (16.9%) | 13 (5.1%) |
| $50,000 to $74,999 | 26 (14.2%) | 33 (12.9%) |
| $75,000 to $99,999 | 23 (12.6%) | 27 (10.6%) |
| $100,000 to $149,999 | 18 (9.8%) | 106 (41.6%) |
| $150,000 or more | 4 (2.2%) | 28 (11.0%) |
| Total | 183 (100.0%) | 255 (100.0%) |
Property Value to Household Income Ratio in Mcconnelsville
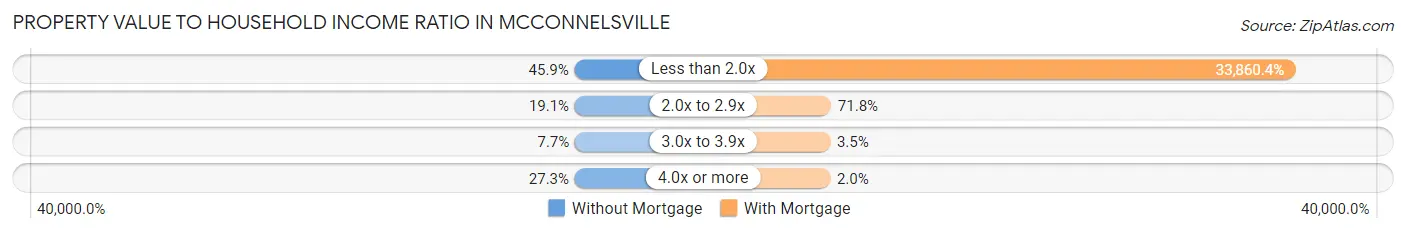
| Value-to-Income Ratio | Without Mortgage | With Mortgage |
| Less than 2.0x | 84 (45.9%) | 86,344 (33,860.4%) |
| 2.0x to 2.9x | 35 (19.1%) | 183 (71.8%) |
| 3.0x to 3.9x | 14 (7.6%) | 9 (3.5%) |
| 4.0x or more | 50 (27.3%) | 5 (2.0%) |
| Total | 183 (100.0%) | 255 (100.0%) |
Real Estate Taxes by Mortgage Status in Mcconnelsville
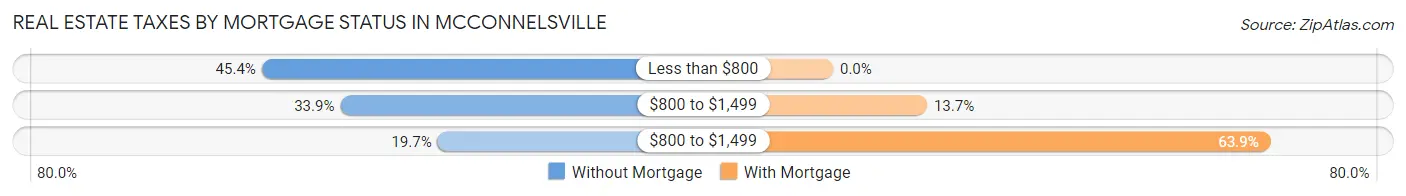
| Property Taxes | Without Mortgage | With Mortgage |
| Less than $800 | 83 (45.4%) | 0 (0.0%) |
| $800 to $1,499 | 62 (33.9%) | 35 (13.7%) |
| $800 to $1,499 | 36 (19.7%) | 163 (63.9%) |
| Total | 183 (100.0%) | 255 (100.0%) |
Health & Disability in Mcconnelsville
Health Insurance Coverage by Age in Mcconnelsville
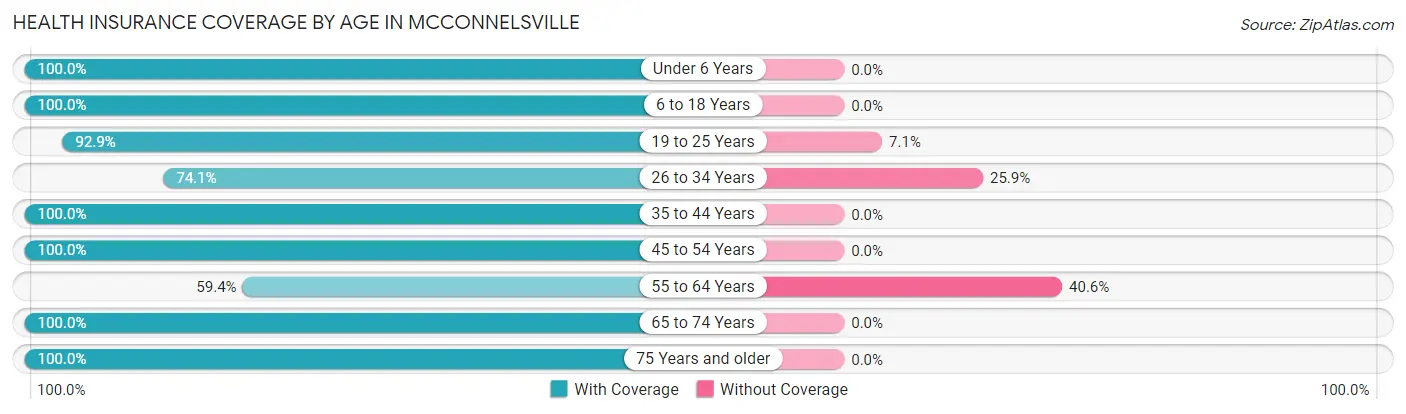
| Age Bracket | With Coverage | Without Coverage |
| Under 6 Years | 36 (100.0%) | 0 (0.0%) |
| 6 to 18 Years | 541 (100.0%) | 0 (0.0%) |
| 19 to 25 Years | 79 (92.9%) | 6 (7.1%) |
| 26 to 34 Years | 192 (74.1%) | 67 (25.9%) |
| 35 to 44 Years | 299 (100.0%) | 0 (0.0%) |
| 45 to 54 Years | 179 (100.0%) | 0 (0.0%) |
| 55 to 64 Years | 212 (59.4%) | 145 (40.6%) |
| 65 to 74 Years | 171 (100.0%) | 0 (0.0%) |
| 75 Years and older | 160 (100.0%) | 0 (0.0%) |
| Total | 1,869 (89.5%) | 218 (10.4%) |
Health Insurance Coverage by Citizenship Status in Mcconnelsville
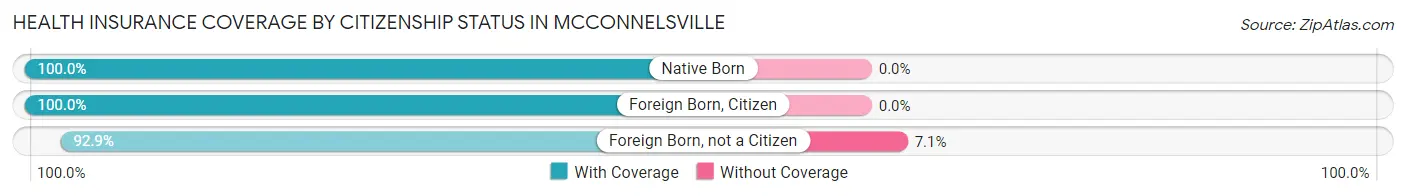
| Citizenship Status | With Coverage | Without Coverage |
| Native Born | 36 (100.0%) | 0 (0.0%) |
| Foreign Born, Citizen | 541 (100.0%) | 0 (0.0%) |
| Foreign Born, not a Citizen | 79 (92.9%) | 6 (7.1%) |
Health Insurance Coverage by Household Income in Mcconnelsville
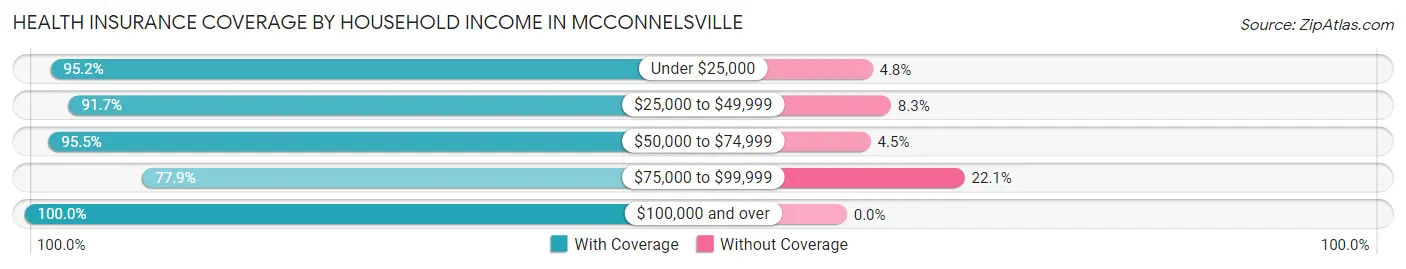
| Household Income | With Coverage | Without Coverage |
| Under $25,000 | 316 (95.2%) | 16 (4.8%) |
| $25,000 to $49,999 | 333 (91.7%) | 30 (8.3%) |
| $50,000 to $74,999 | 491 (95.5%) | 23 (4.5%) |
| $75,000 to $99,999 | 526 (77.9%) | 149 (22.1%) |
| $100,000 and over | 203 (100.0%) | 0 (0.0%) |
Public vs Private Health Insurance Coverage by Age in Mcconnelsville
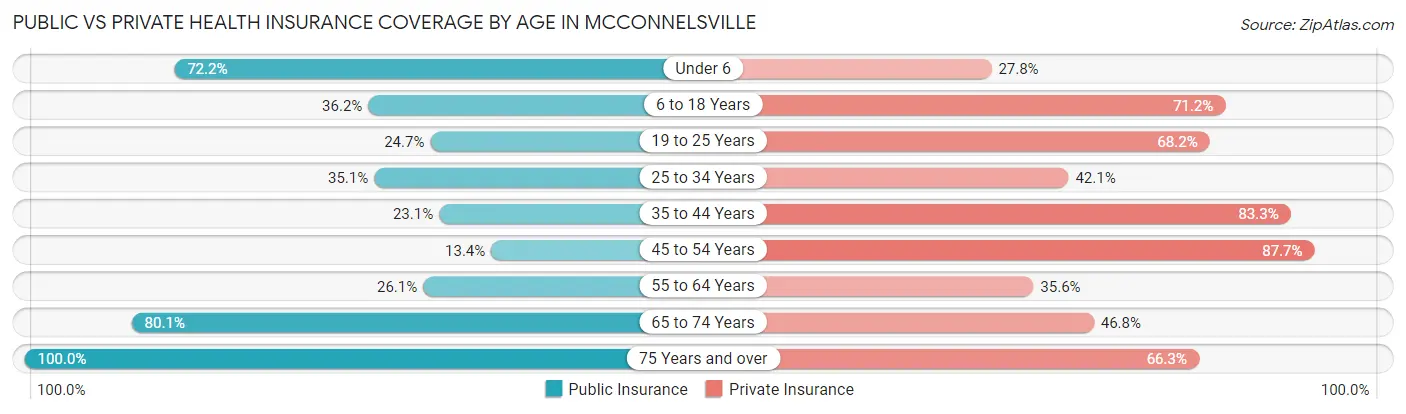
| Age Bracket | Public Insurance | Private Insurance |
| Under 6 | 26 (72.2%) | 10 (27.8%) |
| 6 to 18 Years | 196 (36.2%) | 385 (71.2%) |
| 19 to 25 Years | 21 (24.7%) | 58 (68.2%) |
| 25 to 34 Years | 91 (35.1%) | 109 (42.1%) |
| 35 to 44 Years | 69 (23.1%) | 249 (83.3%) |
| 45 to 54 Years | 24 (13.4%) | 157 (87.7%) |
| 55 to 64 Years | 93 (26.1%) | 127 (35.6%) |
| 65 to 74 Years | 137 (80.1%) | 80 (46.8%) |
| 75 Years and over | 160 (100.0%) | 106 (66.2%) |
| Total | 817 (39.2%) | 1,281 (61.4%) |
Disability Status by Sex by Age in Mcconnelsville
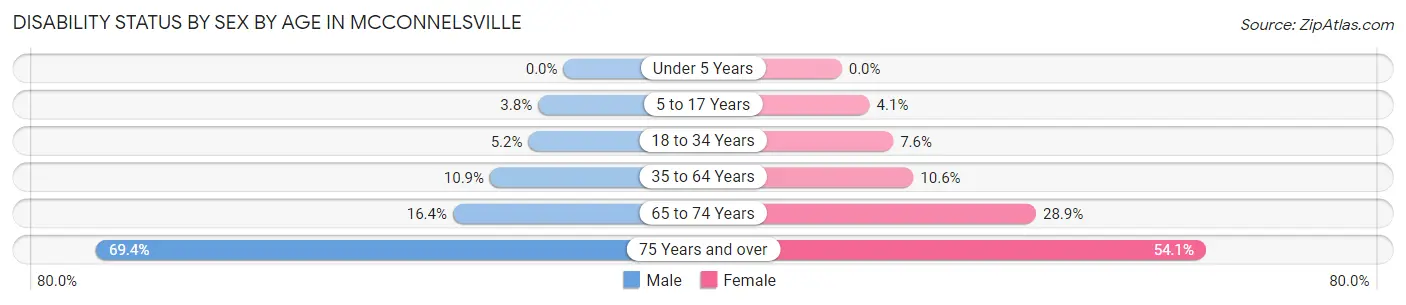
| Age Bracket | Male | Female |
| Under 5 Years | 0 (0.0%) | 0 (0.0%) |
| 5 to 17 Years | 9 (3.8%) | 12 (4.1%) |
| 18 to 34 Years | 11 (5.2%) | 12 (7.6%) |
| 35 to 64 Years | 48 (10.9%) | 42 (10.6%) |
| 65 to 74 Years | 11 (16.4%) | 30 (28.8%) |
| 75 Years and over | 34 (69.4%) | 60 (54.0%) |
Disability Class by Sex by Age in Mcconnelsville
Disability Class: Hearing Difficulty
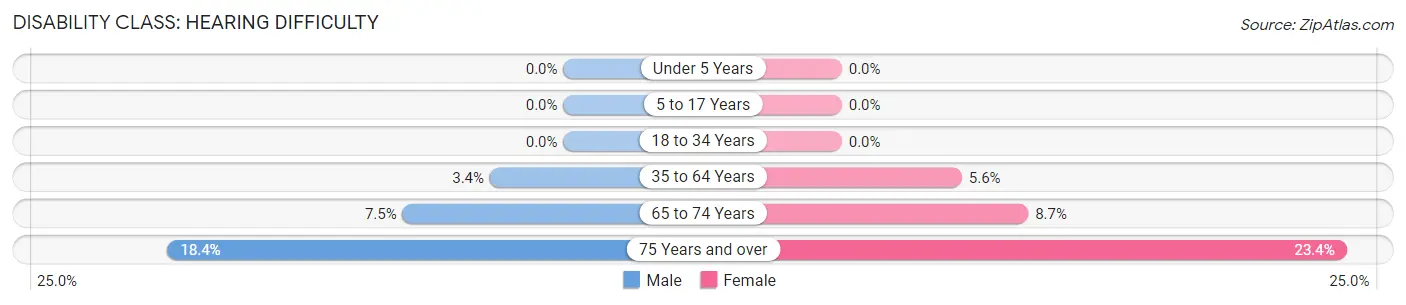
| Age Bracket | Male | Female |
| Under 5 Years | 0 (0.0%) | 0 (0.0%) |
| 5 to 17 Years | 0 (0.0%) | 0 (0.0%) |
| 18 to 34 Years | 0 (0.0%) | 0 (0.0%) |
| 35 to 64 Years | 15 (3.4%) | 22 (5.6%) |
| 65 to 74 Years | 5 (7.5%) | 9 (8.6%) |
| 75 Years and over | 9 (18.4%) | 26 (23.4%) |
Disability Class: Vision Difficulty
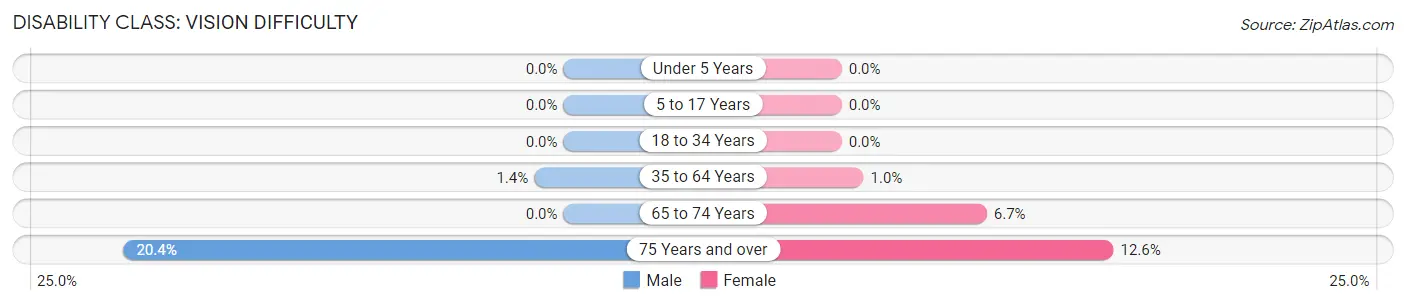
| Age Bracket | Male | Female |
| Under 5 Years | 0 (0.0%) | 0 (0.0%) |
| 5 to 17 Years | 0 (0.0%) | 0 (0.0%) |
| 18 to 34 Years | 0 (0.0%) | 0 (0.0%) |
| 35 to 64 Years | 6 (1.4%) | 4 (1.0%) |
| 65 to 74 Years | 0 (0.0%) | 7 (6.7%) |
| 75 Years and over | 10 (20.4%) | 14 (12.6%) |
Disability Class: Cognitive Difficulty
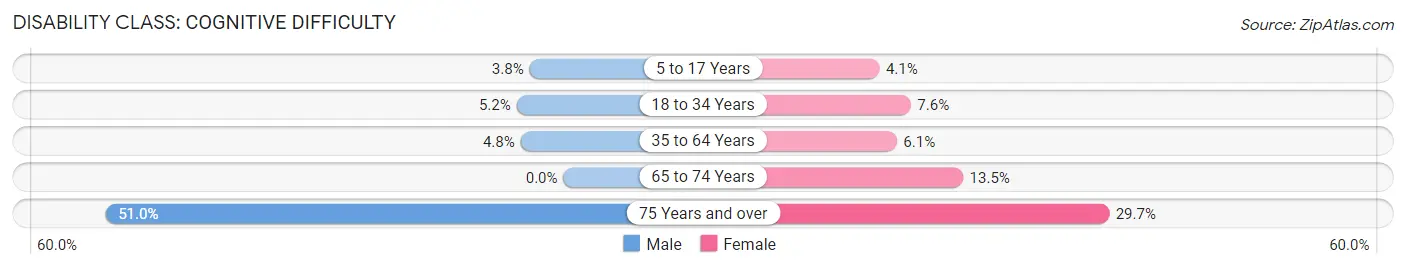
| Age Bracket | Male | Female |
| 5 to 17 Years | 9 (3.8%) | 12 (4.1%) |
| 18 to 34 Years | 11 (5.2%) | 12 (7.6%) |
| 35 to 64 Years | 21 (4.8%) | 24 (6.1%) |
| 65 to 74 Years | 0 (0.0%) | 14 (13.5%) |
| 75 Years and over | 25 (51.0%) | 33 (29.7%) |
Disability Class: Ambulatory Difficulty
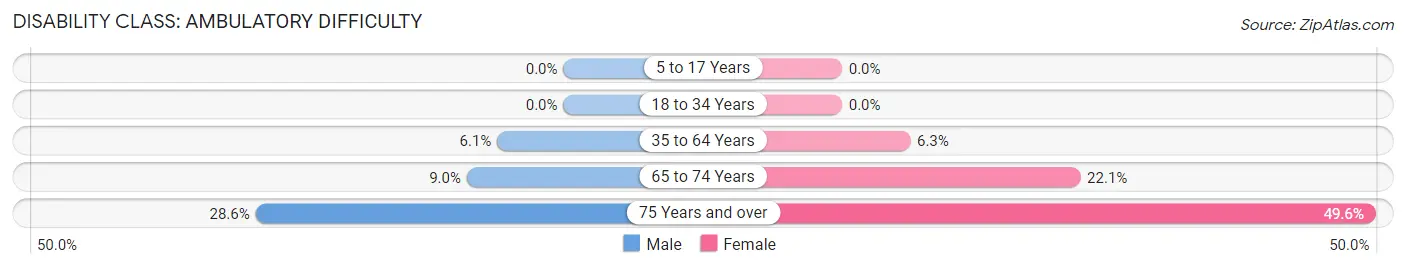
| Age Bracket | Male | Female |
| 5 to 17 Years | 0 (0.0%) | 0 (0.0%) |
| 18 to 34 Years | 0 (0.0%) | 0 (0.0%) |
| 35 to 64 Years | 27 (6.1%) | 25 (6.3%) |
| 65 to 74 Years | 6 (9.0%) | 23 (22.1%) |
| 75 Years and over | 14 (28.6%) | 55 (49.5%) |
Disability Class: Self-Care Difficulty
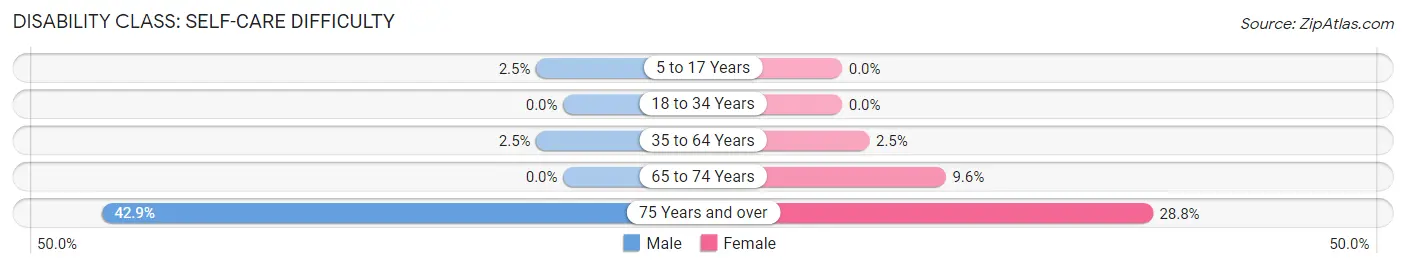
| Age Bracket | Male | Female |
| 5 to 17 Years | 6 (2.5%) | 0 (0.0%) |
| 18 to 34 Years | 0 (0.0%) | 0 (0.0%) |
| 35 to 64 Years | 11 (2.5%) | 10 (2.5%) |
| 65 to 74 Years | 0 (0.0%) | 10 (9.6%) |
| 75 Years and over | 21 (42.9%) | 32 (28.8%) |
Technology Access in Mcconnelsville
Computing Device Access in Mcconnelsville
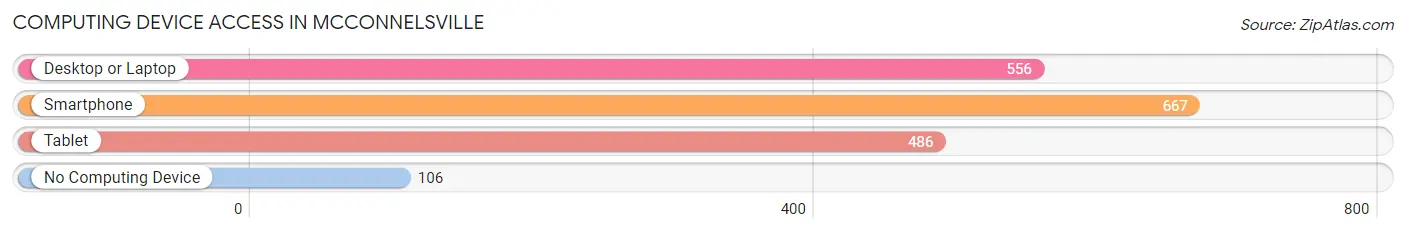
| Device Type | # Households | % Households |
| Desktop or Laptop | 556 | 64.8% |
| Smartphone | 667 | 77.7% |
| Tablet | 486 | 56.6% |
| No Computing Device | 106 | 12.3% |
| Total | 858 | 100.0% |
Internet Access in Mcconnelsville
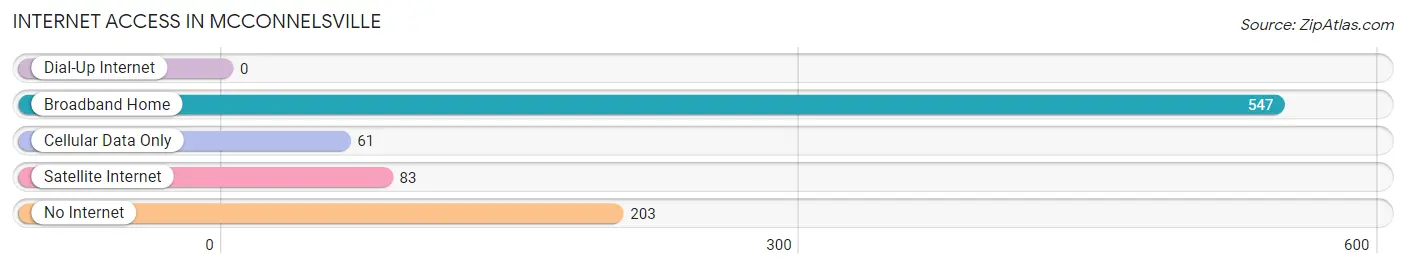
| Internet Type | # Households | % Households |
| Dial-Up Internet | 0 | 0.0% |
| Broadband Home | 547 | 63.7% |
| Cellular Data Only | 61 | 7.1% |
| Satellite Internet | 83 | 9.7% |
| No Internet | 203 | 23.7% |
| Total | 858 | 100.0% |
Mcconnelsville Summary
Mcconnelsville is a small village located in Morgan County, Ohio, United States. The village is situated along the Muskingum River, approximately 25 miles southeast of Zanesville. The population of Mcconnelsville was 1,845 at the 2010 census.
History
Mcconnelsville was founded in 1811 by John McConnell, a Revolutionary War veteran. The village was originally known as McConnellsville, but the name was changed to Mcconnelsville in 1817. The village was incorporated in 1837.
Mcconnelsville was an important stop on the Underground Railroad, with many runaway slaves passing through the village on their way to freedom. The village was also the site of a Civil War battle in 1863, when Confederate forces attempted to capture the village. The Union forces were able to repel the attack and the village remained in Union hands.
Geography
Mcconnelsville is located at 39°41'25" North, 81°51'45" West (39.690278, -81.862500). The village is situated along the Muskingum River, approximately 25 miles southeast of Zanesville.
The village has a total area of 1.2 square miles, all of which is land. The village is located in the Appalachian Plateau region of Ohio.
Economy
Mcconnelsville is a small village with a limited economy. The village is home to several small businesses, including a grocery store, a hardware store, a pharmacy, and a few restaurants. The village also has a few manufacturing companies, including a furniture factory and a plastics factory.
The village is also home to a branch of the Morgan County Library, which serves the residents of Mcconnelsville and the surrounding area.
Demographics
As of the 2010 census, there were 1,845 people, 745 households, and 486 families residing in the village. The population density was 1,539.2 people per square mile. The racial makeup of the village was 97.3% White, 0.7% African American, 0.2% Native American, 0.2% Asian, 0.1% from other races, and 1.5% from two or more races. Hispanic or Latino of any race were 0.7% of the population.
The median income for a household in the village was $35,938, and the median income for a family was $45,000. The per capita income for the village was $17,845. About 11.2% of families and 14.2% of the population were below the poverty line, including 18.2% of those under age 18 and 8.2% of those age 65 or over.
Common Questions
What is Per Capita Income in Mcconnelsville?
Per Capita income in Mcconnelsville is $22,074.
What is the Median Family Income in Mcconnelsville?
Median Family Income in Mcconnelsville is $66,065.
What is the Median Household income in Mcconnelsville?
Median Household Income in Mcconnelsville is $46,875.
What is Income or Wage Gap in Mcconnelsville?
Income or Wage Gap in Mcconnelsville is 2.4%.
Women in Mcconnelsville earn 97.6 cents for every dollar earned by a man.
What is Inequality or Gini Index in Mcconnelsville?
Inequality or Gini Index in Mcconnelsville is 0.41.
What is the Total Population of Mcconnelsville?
Total Population of Mcconnelsville is 2,197.
What is the Total Male Population of Mcconnelsville?
Total Male Population of Mcconnelsville is 1,061.
What is the Total Female Population of Mcconnelsville?
Total Female Population of Mcconnelsville is 1,136.
What is the Ratio of Males per 100 Females in Mcconnelsville?
There are 93.40 Males per 100 Females in Mcconnelsville.
What is the Ratio of Females per 100 Males in Mcconnelsville?
There are 107.07 Females per 100 Males in Mcconnelsville.
What is the Median Population Age in Mcconnelsville?
Median Population Age in Mcconnelsville is 40.0 Years.
What is the Average Family Size in Mcconnelsville
Average Family Size in Mcconnelsville is 3.4 People.
What is the Average Household Size in Mcconnelsville
Average Household Size in Mcconnelsville is 2.4 People.
How Large is the Labor Force in Mcconnelsville?
There are 915 People in the Labor Forcein in Mcconnelsville.
What is the Percentage of People in the Labor Force in Mcconnelsville?
52.9% of People are in the Labor Force in Mcconnelsville.
What is the Unemployment Rate in Mcconnelsville?
Unemployment Rate in Mcconnelsville is 4.4%.