Zip Codes with the Highest Percentage of Population Employed in Health Diagnosing & Treating in Lawrence, KS
RELATED REPORTS & OPTIONS
Health Diagnosing & Treating
Lawrence
Compare Zip Codes
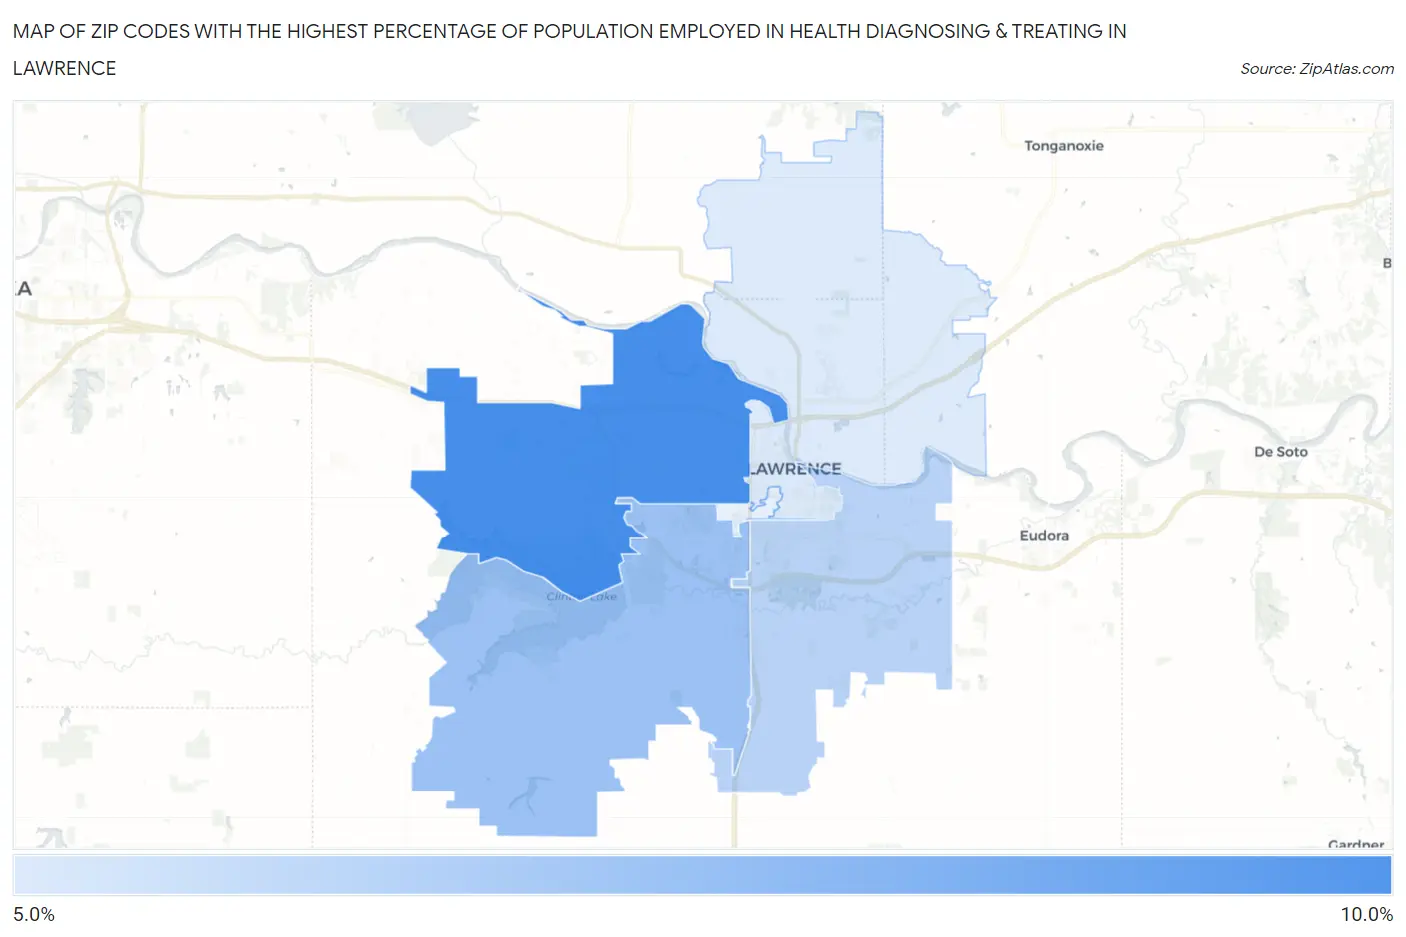
Map of Zip Codes with the Highest Percentage of Population Employed in Health Diagnosing & Treating in Lawrence
5.4%
8.3%
Zip Codes with the Highest Percentage of Population Employed in Health Diagnosing & Treating in Lawrence, KS
| Zip Code | % Employed | vs State | vs National | |
| 1. | 66049 | 8.3% | 6.6%(+1.70)#165 | 6.2%(+2.05)#6,792 |
| 2. | 66047 | 6.6% | 6.6%(+0.051)#244 | 6.2%(+0.402)#11,497 |
| 3. | 66046 | 6.1% | 6.6%(-0.484)#284 | 6.2%(-0.133)#13,486 |
| 4. | 66044 | 5.4% | 6.6%(-1.21)#335 | 6.2%(-0.855)#16,210 |
1
Common Questions
What are the Top 3 Zip Codes with the Highest Percentage of Population Employed in Health Diagnosing & Treating in Lawrence, KS?
Top 3 Zip Codes with the Highest Percentage of Population Employed in Health Diagnosing & Treating in Lawrence, KS are:
What zip code has the Highest Percentage of Population Employed in Health Diagnosing & Treating in Lawrence, KS?
66049 has the Highest Percentage of Population Employed in Health Diagnosing & Treating in Lawrence, KS with 8.3%.
What is the Percentage of Population Employed in Health Diagnosing & Treating in Lawrence, KS?
Percentage of Population Employed in Health Diagnosing & Treating in Lawrence is 6.6%.
What is the Percentage of Population Employed in Health Diagnosing & Treating in Kansas?
Percentage of Population Employed in Health Diagnosing & Treating in Kansas is 6.6%.
What is the Percentage of Population Employed in Health Diagnosing & Treating in the United States?
Percentage of Population Employed in Health Diagnosing & Treating in the United States is 6.2%.