Zip Codes with the Highest Percentage of Population Employed in Administrative & Support Services in Lawrence, KS
RELATED REPORTS & OPTIONS
Administrative & Support Services
Lawrence
Compare Zip Codes
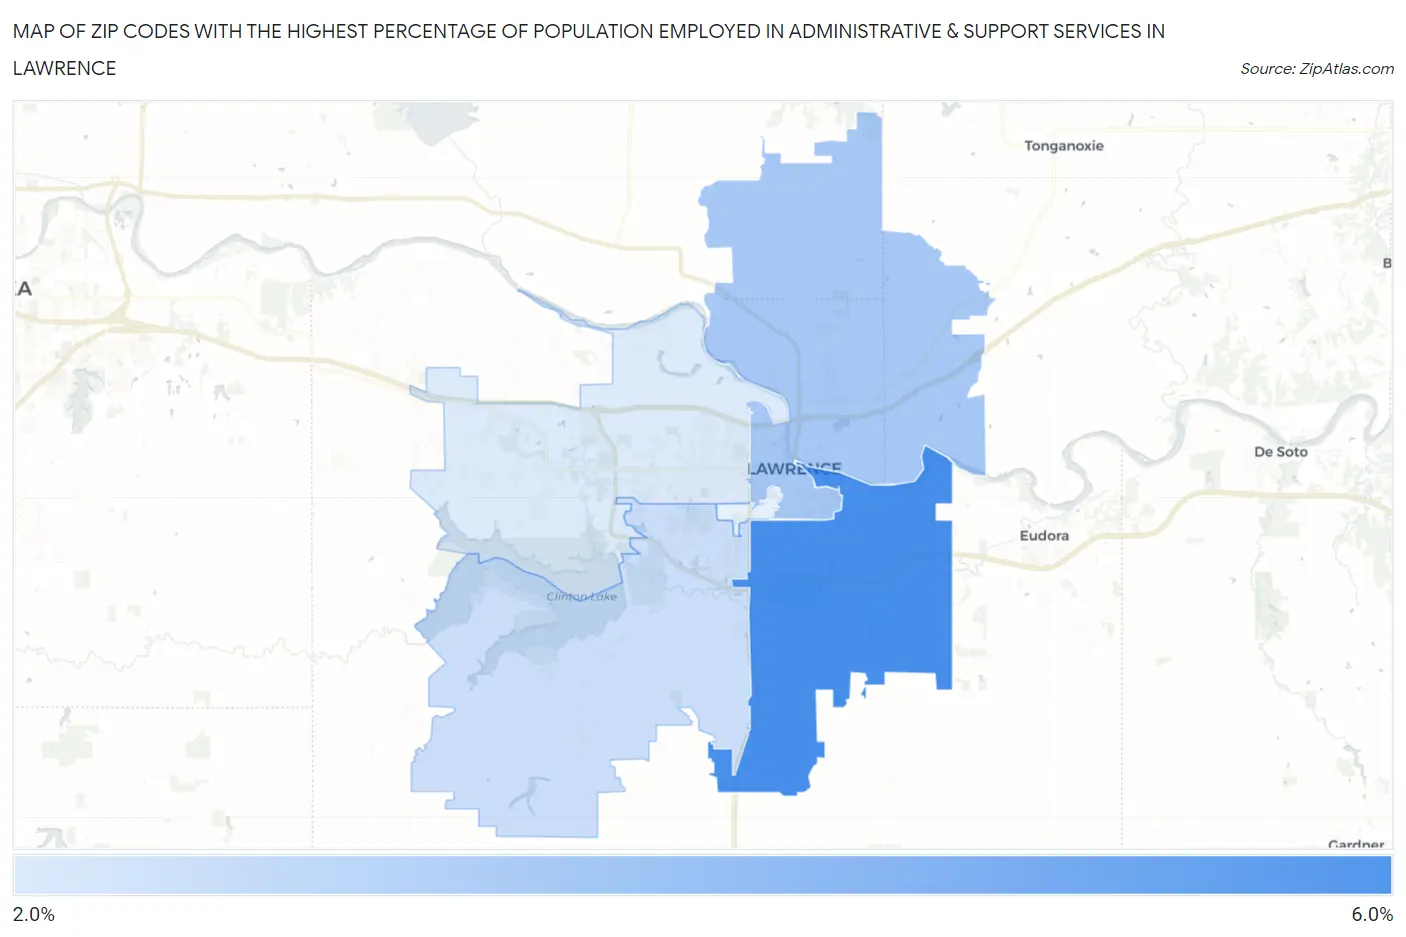
Map of Zip Codes with the Highest Percentage of Population Employed in Administrative & Support Services in Lawrence
2.7%
6.0%
Zip Codes with the Highest Percentage of Population Employed in Administrative & Support Services in Lawrence, KS
| Zip Code | % Employed | vs State | vs National | |
| 1. | 66046 | 6.0% | 3.2%(+2.81)#49 | 4.1%(+1.85)#4,784 |
| 2. | 66044 | 3.9% | 3.2%(+0.734)#123 | 4.1%(-0.229)#11,009 |
| 3. | 66047 | 3.1% | 3.2%(-0.046)#192 | 4.1%(-1.01)#14,791 |
| 4. | 66049 | 2.7% | 3.2%(-0.454)#231 | 4.1%(-1.42)#16,918 |
1
Common Questions
What are the Top 3 Zip Codes with the Highest Percentage of Population Employed in Administrative & Support Services in Lawrence, KS?
Top 3 Zip Codes with the Highest Percentage of Population Employed in Administrative & Support Services in Lawrence, KS are:
What zip code has the Highest Percentage of Population Employed in Administrative & Support Services in Lawrence, KS?
66046 has the Highest Percentage of Population Employed in Administrative & Support Services in Lawrence, KS with 6.0%.
What is the Percentage of Population Employed in Administrative & Support Services in Lawrence, KS?
Percentage of Population Employed in Administrative & Support Services in Lawrence is 3.8%.
What is the Percentage of Population Employed in Administrative & Support Services in Kansas?
Percentage of Population Employed in Administrative & Support Services in Kansas is 3.2%.
What is the Percentage of Population Employed in Administrative & Support Services in the United States?
Percentage of Population Employed in Administrative & Support Services in the United States is 4.1%.