Zip Codes with the Highest Percentage of Population Employed in Food Preparation & Serving in Lawrence, KS
RELATED REPORTS & OPTIONS
Food Preparation & Serving
Lawrence
Compare Zip Codes
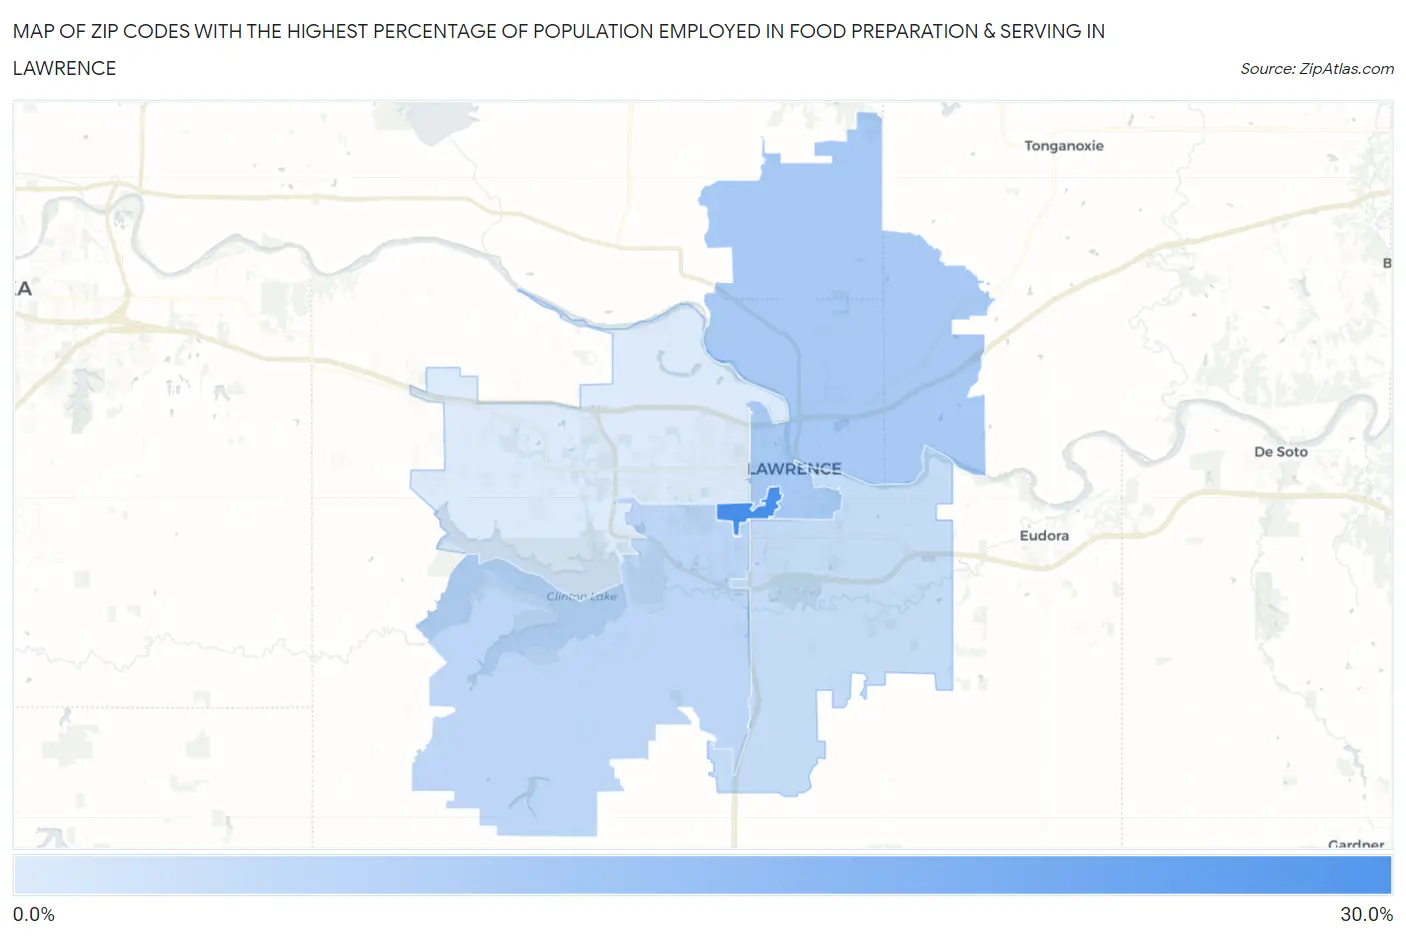
Map of Zip Codes with the Highest Percentage of Population Employed in Food Preparation & Serving in Lawrence
3.8%
27.0%
Zip Codes with the Highest Percentage of Population Employed in Food Preparation & Serving in Lawrence, KS
| Zip Code | % Employed | vs State | vs National | |
| 1. | 66045 | 27.0% | 5.2%(+21.8)#5 | 5.3%(+21.7)#265 |
| 2. | 66044 | 11.6% | 5.2%(+6.42)#30 | 5.3%(+6.33)#1,814 |
| 3. | 66047 | 8.3% | 5.2%(+3.11)#75 | 5.3%(+3.02)#4,320 |
| 4. | 66046 | 7.2% | 5.2%(+2.01)#99 | 5.3%(+1.92)#6,126 |
| 5. | 66049 | 3.8% | 5.2%(-1.43)#322 | 5.3%(-1.53)#18,083 |
1
Common Questions
What are the Top 3 Zip Codes with the Highest Percentage of Population Employed in Food Preparation & Serving in Lawrence, KS?
Top 3 Zip Codes with the Highest Percentage of Population Employed in Food Preparation & Serving in Lawrence, KS are:
What zip code has the Highest Percentage of Population Employed in Food Preparation & Serving in Lawrence, KS?
66045 has the Highest Percentage of Population Employed in Food Preparation & Serving in Lawrence, KS with 27.0%.
What is the Percentage of Population Employed in Food Preparation & Serving in Lawrence, KS?
Percentage of Population Employed in Food Preparation & Serving in Lawrence is 8.2%.
What is the Percentage of Population Employed in Food Preparation & Serving in Kansas?
Percentage of Population Employed in Food Preparation & Serving in Kansas is 5.2%.
What is the Percentage of Population Employed in Food Preparation & Serving in the United States?
Percentage of Population Employed in Food Preparation & Serving in the United States is 5.3%.