Zip Codes with the Highest Percentage of Population Employed in Education Instruction & Library in Lawrence, KS

RELATED REPORTS & OPTIONS

Education Instruction & Library
Population
Families and Households
Female Fertility
Female Fertility (Unmarried)
Race (Community Size)
Race (Percentage)
Ancestry (Community Size)
AfricanAmericanApacheArabArgentineanAustrianBelgianBhutaneseBlackfeetBrazilianBritishBurmeseCanadianCentral AmericanCentral American IndianCherokeeChickasawChippewaChoctawColombianComancheCosta RicanCreekCroatianCubanCzechCzechoslovakianDanishDelawareDutchEastern EuropeanEcuadorianEnglishEuropeanFilipinoFinnishFrenchFrench American IndianFrench CanadianGermanGerman RussianGreekHonduranHungarianIndian (Asian)IranianIrishIroquoisItalianJamaicanJordanianKoreanLebaneseLithuanianMalaysianMexicanMexican American IndianNative HawaiianNavajoNigerianNorthern EuropeanNorwegianPaiutePakistaniPanamanianPennsylvania GermanPeruvianPolishPortuguesePotawatomiPuebloPuerto RicanRomanianRussianSalvadoranScandinavianScotch-IrishScottishSeminoleSenegaleseSerbianShoshoneSiouxSlavicSloveneSouth AmericanSouth American IndianSpaniardSpanishSri LankanSubsaharan AfricanSwedishSwissSyrianThaiTohono O'OdhamTurkishUkrainianVenezuelanWelshYugoslavianYup'ik
Ancestry (Percentage)
AfricanAmericanApacheArabArgentineanAustrianBelgianBhutaneseBlackfeetBrazilianBritishBurmeseCanadianCentral AmericanCentral American IndianCherokeeChickasawChippewaChoctawColombianComancheCosta RicanCreekCroatianCubanCzechCzechoslovakianDanishDelawareDutchEastern EuropeanEcuadorianEnglishEuropeanFilipinoFinnishFrenchFrench American IndianFrench CanadianGermanGerman RussianGreekHonduranHungarianIndian (Asian)IranianIrishIroquoisItalianJamaicanJordanianKoreanLebaneseLithuanianMalaysianMexicanMexican American IndianNative HawaiianNavajoNigerianNorthern EuropeanNorwegianPaiutePakistaniPanamanianPennsylvania GermanPeruvianPolishPortuguesePotawatomiPuebloPuerto RicanRomanianRussianSalvadoranScandinavianScotch-IrishScottishSeminoleSenegaleseSerbianShoshoneSiouxSlavicSloveneSouth AmericanSouth American IndianSpaniardSpanishSri LankanSubsaharan AfricanSwedishSwissSyrianThaiTohono O'OdhamTurkishUkrainianVenezuelanWelshYugoslavianYup'ik
Immigrant Origin (Total)
Immigrant Origin (Percentage)
Income
Income (Families)
Income (Households)
Poverty
Poverty (Families)
Unemployment
Employment Occupations
Employment Industries
Employer Class
Commute Time
Commute Means
School Enrollment
Education by Degree Field
Occupancy
Finances
Physical Characteristics
Lawrence
Compare Zip Codes
Comparison Subject

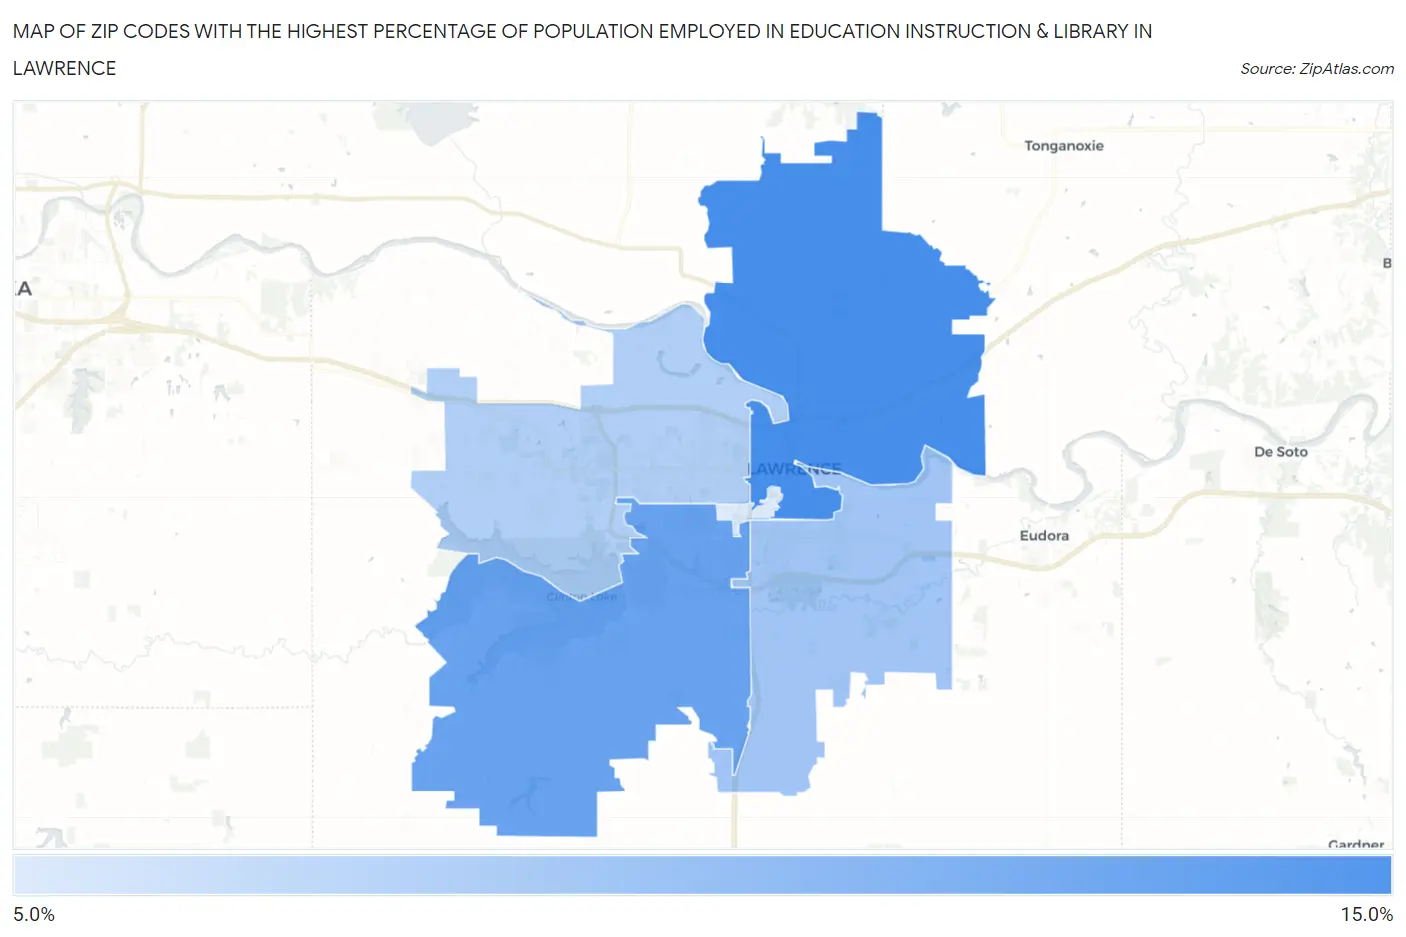
Map of Zip Codes with the Highest Percentage of Population Employed in Education Instruction & Library in Lawrence

0.0%
15.0%
Zip Codes with the Highest Percentage of Population Employed in Education Instruction & Library in Lawrence Map

Zip Codes with the Highest Percentage of Population Employed in Education Instruction & Library in Lawrence, KS

Zip Code % Employed vs State vs National
1.6604412.4%7.0%(+5.44)#746.2%(+6.25)#2,158
2.6604711.6%7.0%(+4.62)#986.2%(+5.42)#2,628
3.6604610.1%7.0%(+3.13)#1386.2%(+3.93)#3,811
4.660499.7%7.0%(+2.68)#1496.2%(+3.49)#4,319
5.660458.6%7.0%(+1.58)#2036.2%(+2.38)#5,989

Common Questions

What are the Top 3 Zip Codes with the Highest Percentage of Population Employed in Education Instruction & Library in Lawrence, KS?
Top 3 Zip Codes with the Highest Percentage of Population Employed in Education Instruction & Library in Lawrence, KS are:
#1
12.4%
#2
11.6%
#3
10.1%
What zip code has the Highest Percentage of Population Employed in Education Instruction & Library in Lawrence, KS?
66044 has the Highest Percentage of Population Employed in Education Instruction & Library in Lawrence, KS with 12.4%.
What is the Percentage of Population Employed in Education Instruction & Library in Lawrence, KS?
Percentage of Population Employed in Education Instruction & Library in Lawrence is 11.0%.
What is the Percentage of Population Employed in Education Instruction & Library in Kansas?
Percentage of Population Employed in Education Instruction & Library in Kansas is 7.0%.
What is the Percentage of Population Employed in Education Instruction & Library in the United States?
Percentage of Population Employed in Education Instruction & Library in the United States is 6.2%.