Zip Codes with the Highest Percentage of Population Employed in Legal Services & Support in Lawrence, KS
RELATED REPORTS & OPTIONS
Legal Services & Support
Lawrence
Compare Zip Codes
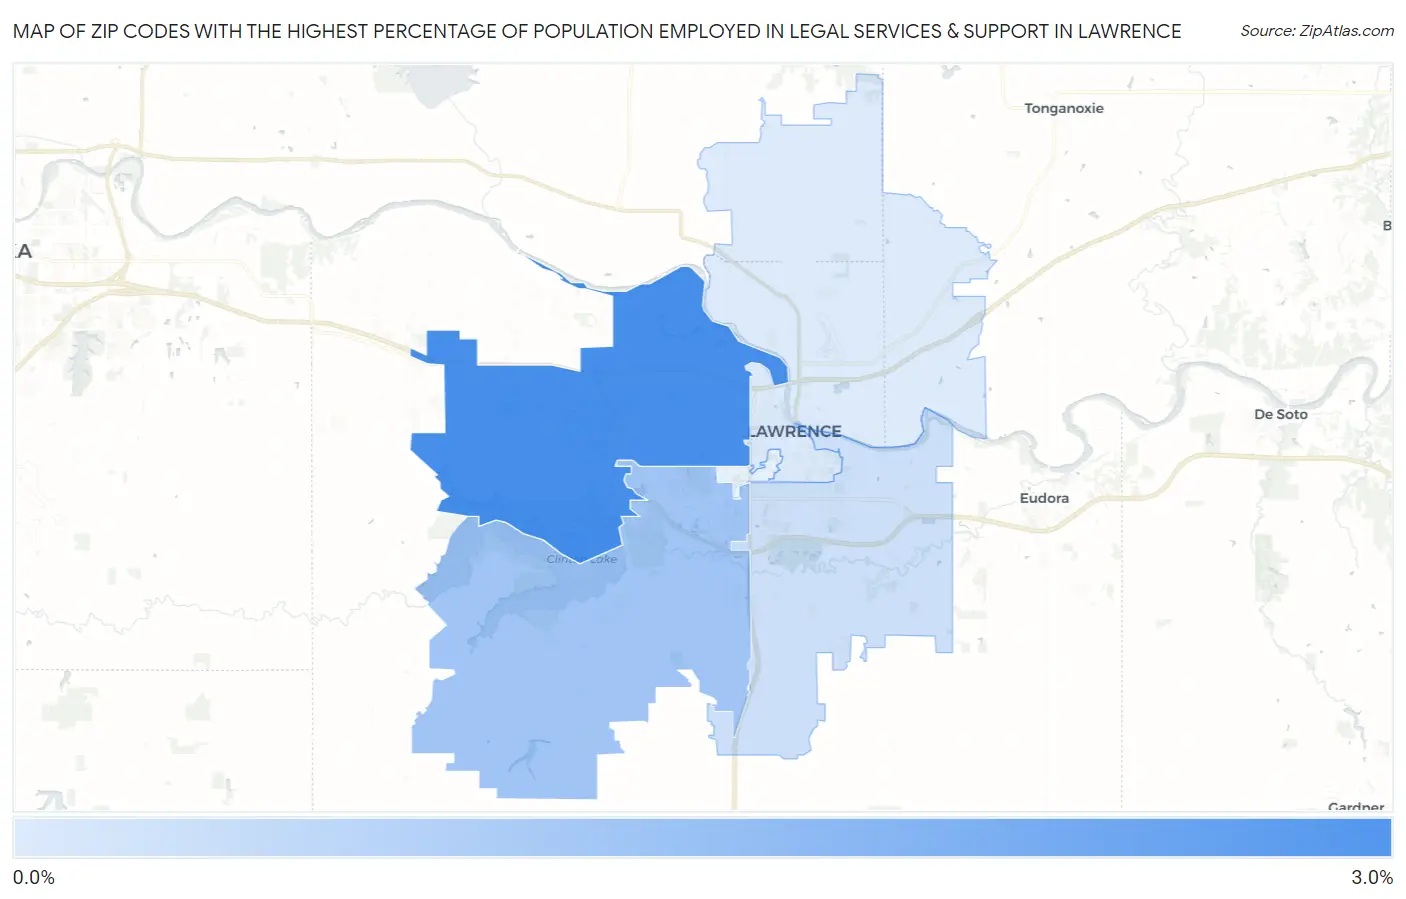
Map of Zip Codes with the Highest Percentage of Population Employed in Legal Services & Support in Lawrence
0.70%
2.5%
Zip Codes with the Highest Percentage of Population Employed in Legal Services & Support in Lawrence, KS
| Zip Code | % Employed | vs State | vs National | |
| 1. | 66049 | 2.5% | 0.90%(+1.65)#33 | 1.2%(+1.36)#2,439 |
| 2. | 66047 | 1.4% | 0.90%(+0.525)#62 | 1.2%(+0.242)#5,342 |
| 3. | 66046 | 0.91% | 0.90%(+0.009)#99 | 1.2%(-0.274)#8,510 |
| 4. | 66044 | 0.70% | 0.90%(-0.199)#125 | 1.2%(-0.482)#10,382 |
1
Common Questions
What are the Top 3 Zip Codes with the Highest Percentage of Population Employed in Legal Services & Support in Lawrence, KS?
Top 3 Zip Codes with the Highest Percentage of Population Employed in Legal Services & Support in Lawrence, KS are:
What zip code has the Highest Percentage of Population Employed in Legal Services & Support in Lawrence, KS?
66049 has the Highest Percentage of Population Employed in Legal Services & Support in Lawrence, KS with 2.5%.
What is the Percentage of Population Employed in Legal Services & Support in Lawrence, KS?
Percentage of Population Employed in Legal Services & Support in Lawrence is 1.5%.
What is the Percentage of Population Employed in Legal Services & Support in Kansas?
Percentage of Population Employed in Legal Services & Support in Kansas is 0.90%.
What is the Percentage of Population Employed in Legal Services & Support in the United States?
Percentage of Population Employed in Legal Services & Support in the United States is 1.2%.