Zip Codes with the Highest Percentage of Population Employed in Installation, Maintenance & Repair in Lawrence, KS
RELATED REPORTS & OPTIONS
Installation, Maintenance & Repair
Lawrence
Compare Zip Codes
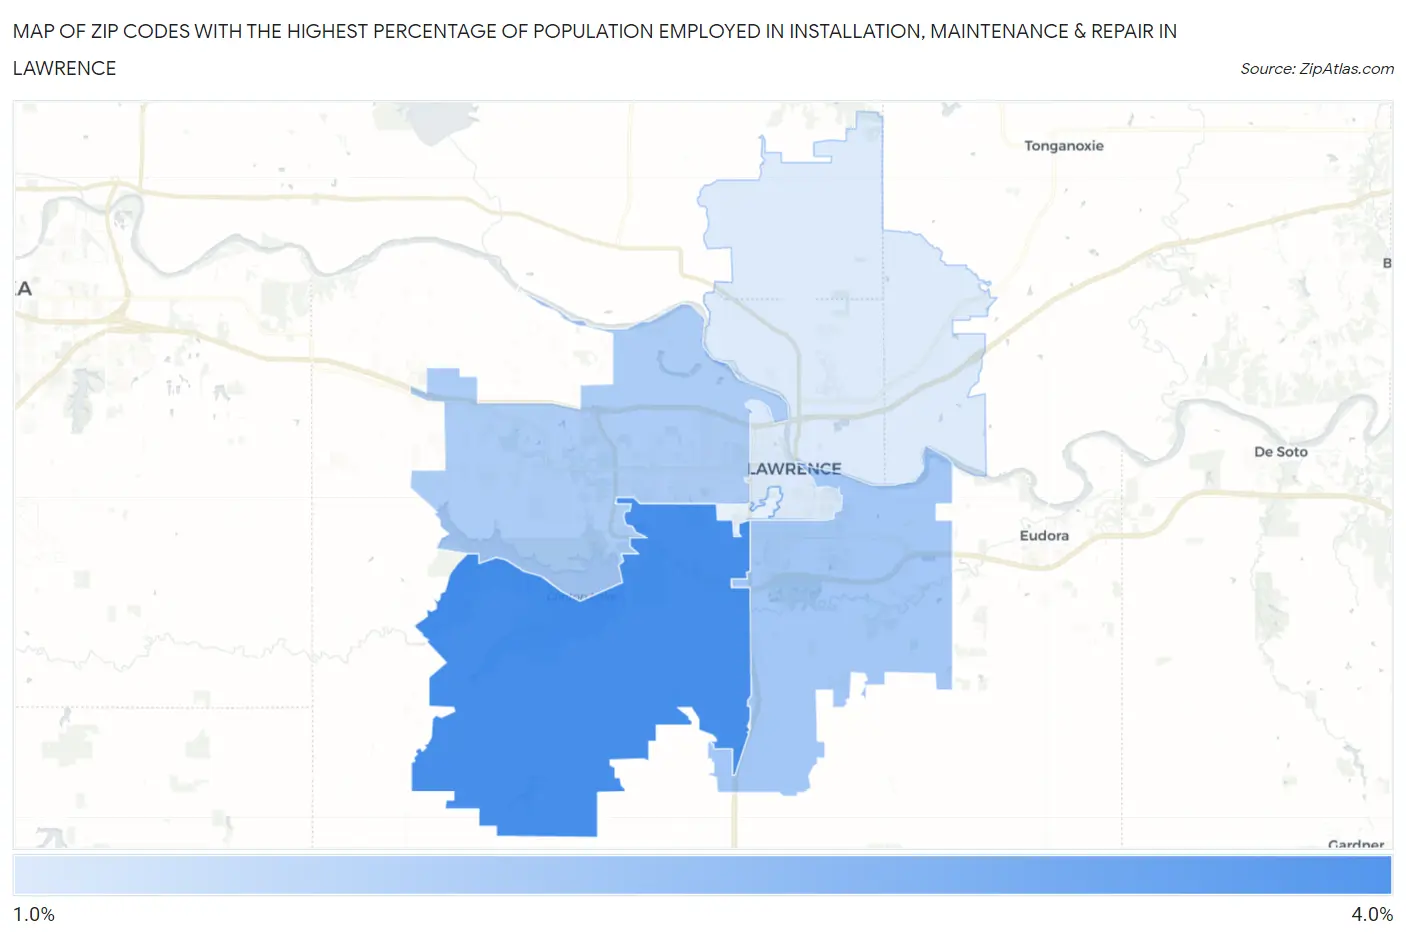
Map of Zip Codes with the Highest Percentage of Population Employed in Installation, Maintenance & Repair in Lawrence
1.0%
3.8%
Zip Codes with the Highest Percentage of Population Employed in Installation, Maintenance & Repair in Lawrence, KS
| Zip Code | % Employed | vs State | vs National | |
| 1. | 66047 | 3.8% | 3.6%(+0.175)#328 | 3.1%(+0.727)#13,250 |
| 2. | 66046 | 2.1% | 3.6%(-1.56)#481 | 3.1%(-1.00)#21,719 |
| 3. | 66049 | 1.9% | 3.6%(-1.70)#489 | 3.1%(-1.15)#22,402 |
| 4. | 66044 | 1.0% | 3.6%(-2.60)#559 | 3.1%(-2.05)#25,880 |
1
Common Questions
What are the Top 3 Zip Codes with the Highest Percentage of Population Employed in Installation, Maintenance & Repair in Lawrence, KS?
Top 3 Zip Codes with the Highest Percentage of Population Employed in Installation, Maintenance & Repair in Lawrence, KS are:
What zip code has the Highest Percentage of Population Employed in Installation, Maintenance & Repair in Lawrence, KS?
66047 has the Highest Percentage of Population Employed in Installation, Maintenance & Repair in Lawrence, KS with 3.8%.
What is the Percentage of Population Employed in Installation, Maintenance & Repair in Lawrence, KS?
Percentage of Population Employed in Installation, Maintenance & Repair in Lawrence is 2.0%.
What is the Percentage of Population Employed in Installation, Maintenance & Repair in Kansas?
Percentage of Population Employed in Installation, Maintenance & Repair in Kansas is 3.6%.
What is the Percentage of Population Employed in Installation, Maintenance & Repair in the United States?
Percentage of Population Employed in Installation, Maintenance & Repair in the United States is 3.1%.