Zip Codes with the Highest Percentage of Population Employed in Life, Physical & Social Science in Lawrence, KS
RELATED REPORTS & OPTIONS
Life, Physical & Social Science
Lawrence
Compare Zip Codes
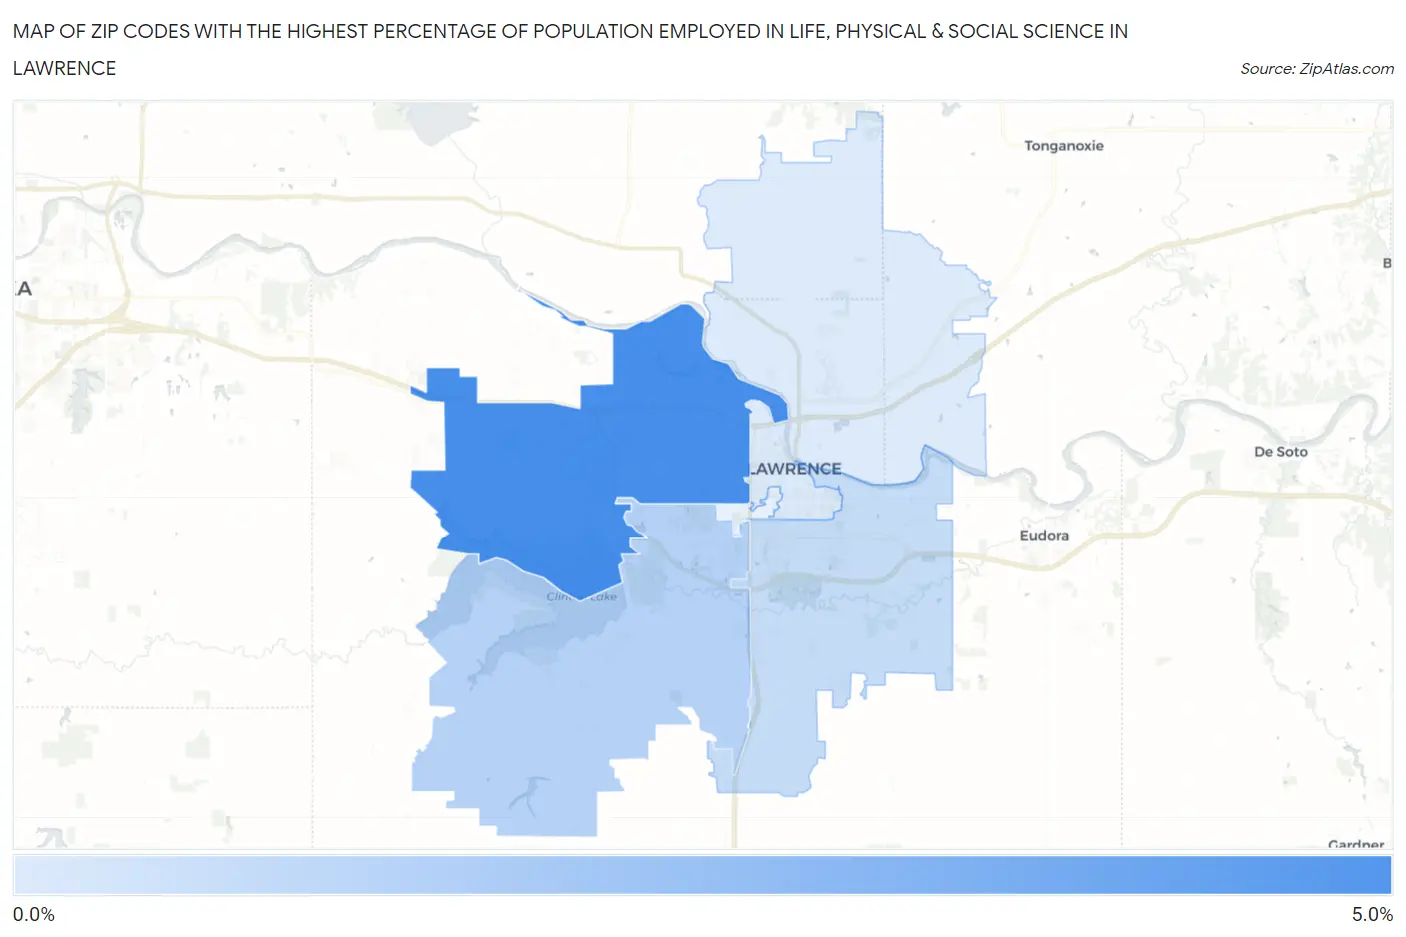
Map of Zip Codes with the Highest Percentage of Population Employed in Life, Physical & Social Science in Lawrence
0.77%
4.7%
Zip Codes with the Highest Percentage of Population Employed in Life, Physical & Social Science in Lawrence, KS
| Zip Code | % Employed | vs State | vs National | |
| 1. | 66049 | 4.7% | 0.94%(+3.81)#16 | 1.1%(+3.66)#832 |
| 2. | 66047 | 1.8% | 0.94%(+0.868)#70 | 1.1%(+0.717)#4,297 |
| 3. | 66046 | 1.4% | 0.94%(+0.429)#106 | 1.1%(+0.279)#6,355 |
| 4. | 66044 | 0.77% | 0.94%(-0.174)#181 | 1.1%(-0.324)#11,335 |
1
Common Questions
What are the Top 3 Zip Codes with the Highest Percentage of Population Employed in Life, Physical & Social Science in Lawrence, KS?
Top 3 Zip Codes with the Highest Percentage of Population Employed in Life, Physical & Social Science in Lawrence, KS are:
What zip code has the Highest Percentage of Population Employed in Life, Physical & Social Science in Lawrence, KS?
66049 has the Highest Percentage of Population Employed in Life, Physical & Social Science in Lawrence, KS with 4.7%.
What is the Percentage of Population Employed in Life, Physical & Social Science in Lawrence, KS?
Percentage of Population Employed in Life, Physical & Social Science in Lawrence is 2.3%.
What is the Percentage of Population Employed in Life, Physical & Social Science in Kansas?
Percentage of Population Employed in Life, Physical & Social Science in Kansas is 0.94%.
What is the Percentage of Population Employed in Life, Physical & Social Science in the United States?
Percentage of Population Employed in Life, Physical & Social Science in the United States is 1.1%.