Zip Codes with the Highest Percentage of Population with a Degree in Visual and Performing Arts in Lawrence, KS
RELATED REPORTS & OPTIONS
Visual and Performing Arts
Lawrence
Compare Zip Codes
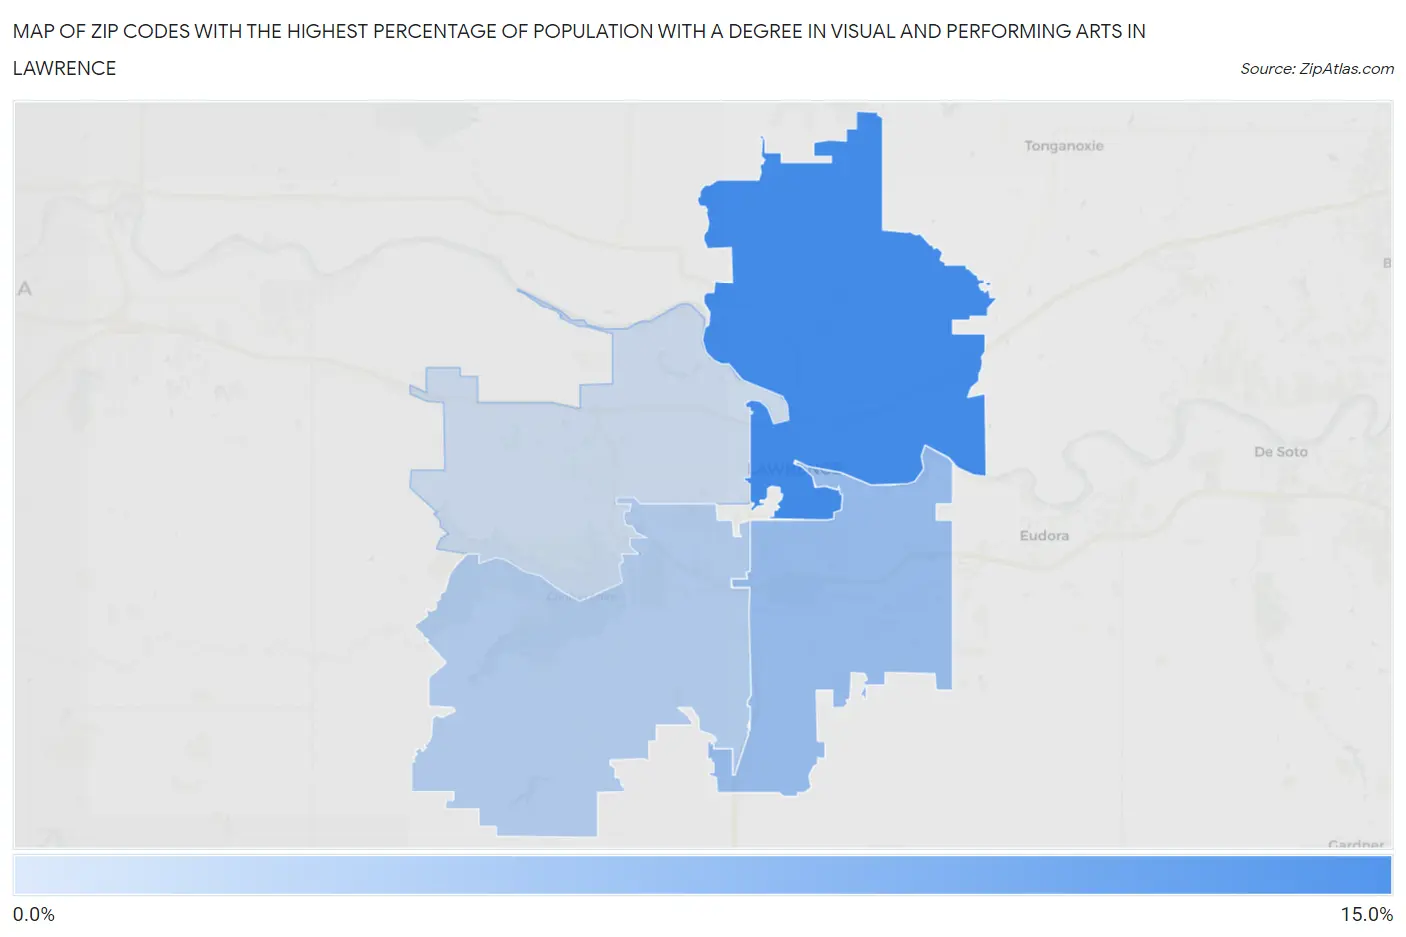
Map of Zip Codes with the Highest Percentage of Population with a Degree in Visual and Performing Arts in Lawrence
4.2%
12.3%
Zip Codes with the Highest Percentage of Population with a Degree in Visual and Performing Arts in Lawrence, KS
| Zip Code | % Graduates | vs State | vs National | |
| 1. | 66044 | 12.3% | 3.4%(+8.85)#25 | 4.3%(+8.01)#1,237 |
| 2. | 66046 | 7.3% | 3.4%(+3.85)#48 | 4.3%(+3.01)#3,414 |
| 3. | 66047 | 5.7% | 3.4%(+2.28)#70 | 4.3%(+1.44)#5,334 |
| 4. | 66049 | 4.2% | 3.4%(+0.798)#115 | 4.3%(-0.040)#8,589 |
1
Common Questions
What are the Top 3 Zip Codes with the Highest Percentage of Population with a Degree in Visual and Performing Arts in Lawrence, KS?
Top 3 Zip Codes with the Highest Percentage of Population with a Degree in Visual and Performing Arts in Lawrence, KS are:
What zip code has the Highest Percentage of Population with a Degree in Visual and Performing Arts in Lawrence, KS?
66044 has the Highest Percentage of Population with a Degree in Visual and Performing Arts in Lawrence, KS with 12.3%.
What is the Percentage of Population with a Degree in Visual and Performing Arts in Lawrence, KS?
Percentage of Population with a Degree in Visual and Performing Arts in Lawrence is 6.7%.
What is the Percentage of Population with a Degree in Visual and Performing Arts in Kansas?
Percentage of Population with a Degree in Visual and Performing Arts in Kansas is 3.4%.
What is the Percentage of Population with a Degree in Visual and Performing Arts in the United States?
Percentage of Population with a Degree in Visual and Performing Arts in the United States is 4.3%.