Zip Codes with the Highest Percentage of Immigrants from Eastern Europe in Lawrence, KS
RELATED REPORTS & OPTIONS
Eastern Europe
Lawrence
Compare Zip Codes
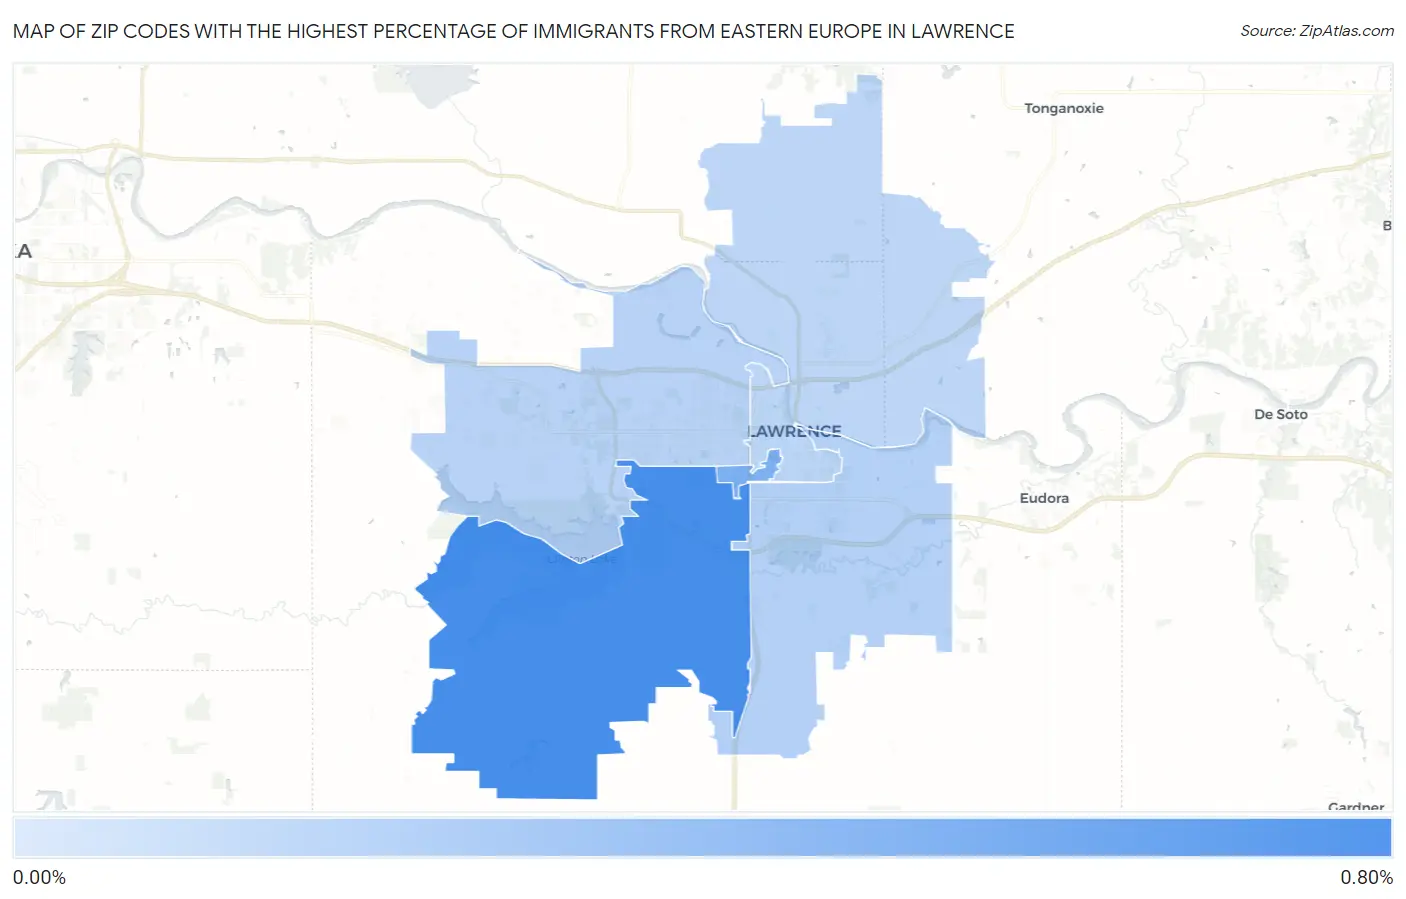
Map of Zip Codes with the Highest Percentage of Immigrants from Eastern Europe in Lawrence
0.14%
0.67%
Zip Codes with the Highest Percentage of Immigrants from Eastern Europe in Lawrence, KS
| Zip Code | Eastern Europe | vs State | vs National | |
| 1. | 66047 | 0.67% | 0.17%(+0.501)#21 | 0.67%(+0.004)#4,391 |
| 2. | 66045 | 0.42% | 0.17%(+0.249)#42 | 0.67%(-0.248)#6,186 |
| 3. | 66046 | 0.18% | 0.17%(+0.013)#76 | 0.67%(-0.484)#9,217 |
| 4. | 66049 | 0.16% | 0.17%(-0.009)#84 | 0.67%(-0.506)#9,606 |
| 5. | 66044 | 0.14% | 0.17%(-0.029)#88 | 0.67%(-0.526)#9,963 |
1
Common Questions
What are the Top 3 Zip Codes with the Highest Percentage of Immigrants from Eastern Europe in Lawrence, KS?
Top 3 Zip Codes with the Highest Percentage of Immigrants from Eastern Europe in Lawrence, KS are:
What zip code has the Highest Percentage of Immigrants from Eastern Europe in Lawrence, KS?
66047 has the Highest Percentage of Immigrants from Eastern Europe in Lawrence, KS with 0.67%.
What is the Percentage of Immigrants from Eastern Europe in Lawrence, KS?
Percentage of Immigrants from Eastern Europe in Lawrence is 0.28%.
What is the Percentage of Immigrants from Eastern Europe in Kansas?
Percentage of Immigrants from Eastern Europe in Kansas is 0.17%.
What is the Percentage of Immigrants from Eastern Europe in the United States?
Percentage of Immigrants from Eastern Europe in the United States is 0.67%.