Gosport, IN Map & Demographics
Gosport Map
Gosport Overview
$25,983
PER CAPITA INCOME
$64,231
AVG FAMILY INCOME
$59,219
AVG HOUSEHOLD INCOME
34.8%
WAGE / INCOME GAP [ % ]
65.2¢/ $1
WAGE / INCOME GAP [ $ ]
0.38
INEQUALITY / GINI INDEX
1,057
TOTAL POPULATION
596
MALE POPULATION
461
FEMALE POPULATION
129.28
MALES / 100 FEMALES
77.35
FEMALES / 100 MALES
49.2
MEDIAN AGE
3.8
AVG FAMILY SIZE
2.9
AVG HOUSEHOLD SIZE
451
LABOR FORCE [ PEOPLE ]
52.9%
PERCENT IN LABOR FORCE
5.5%
UNEMPLOYMENT RATE
Gosport Zip Codes
Gosport Area Codes
Income in Gosport
Income Overview in Gosport
Per Capita Income in Gosport is $25,983, while median incomes of families and households are $64,231 and $59,219 respectively.
| Characteristic | Number | Measure |
| Per Capita Income | 1,057 | $25,983 |
| Median Family Income | 206 | $64,231 |
| Mean Family Income | 206 | $83,096 |
| Median Household Income | 345 | $59,219 |
| Mean Household Income | 345 | $66,380 |
| Income Deficit | 206 | $0 |
| Wage / Income Gap (%) | 1,057 | 34.80% |
| Wage / Income Gap ($) | 1,057 | 65.20¢ per $1 |
| Gini / Inequality Index | 1,057 | 0.38 |
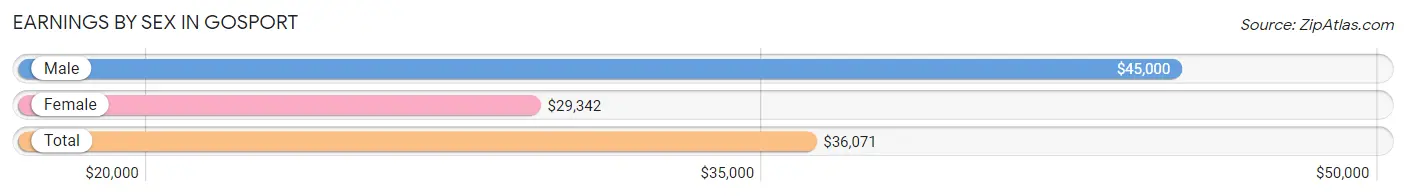
Earnings by Sex in Gosport
Average Earnings in Gosport are $36,071, $45,000 for men and $29,342 for women, a difference of 34.8%.
| Sex | Number | Average Earnings |
| Male | 216 (47.4%) | $45,000 |
| Female | 240 (52.6%) | $29,342 |
| Total | 456 (100.0%) | $36,071 |
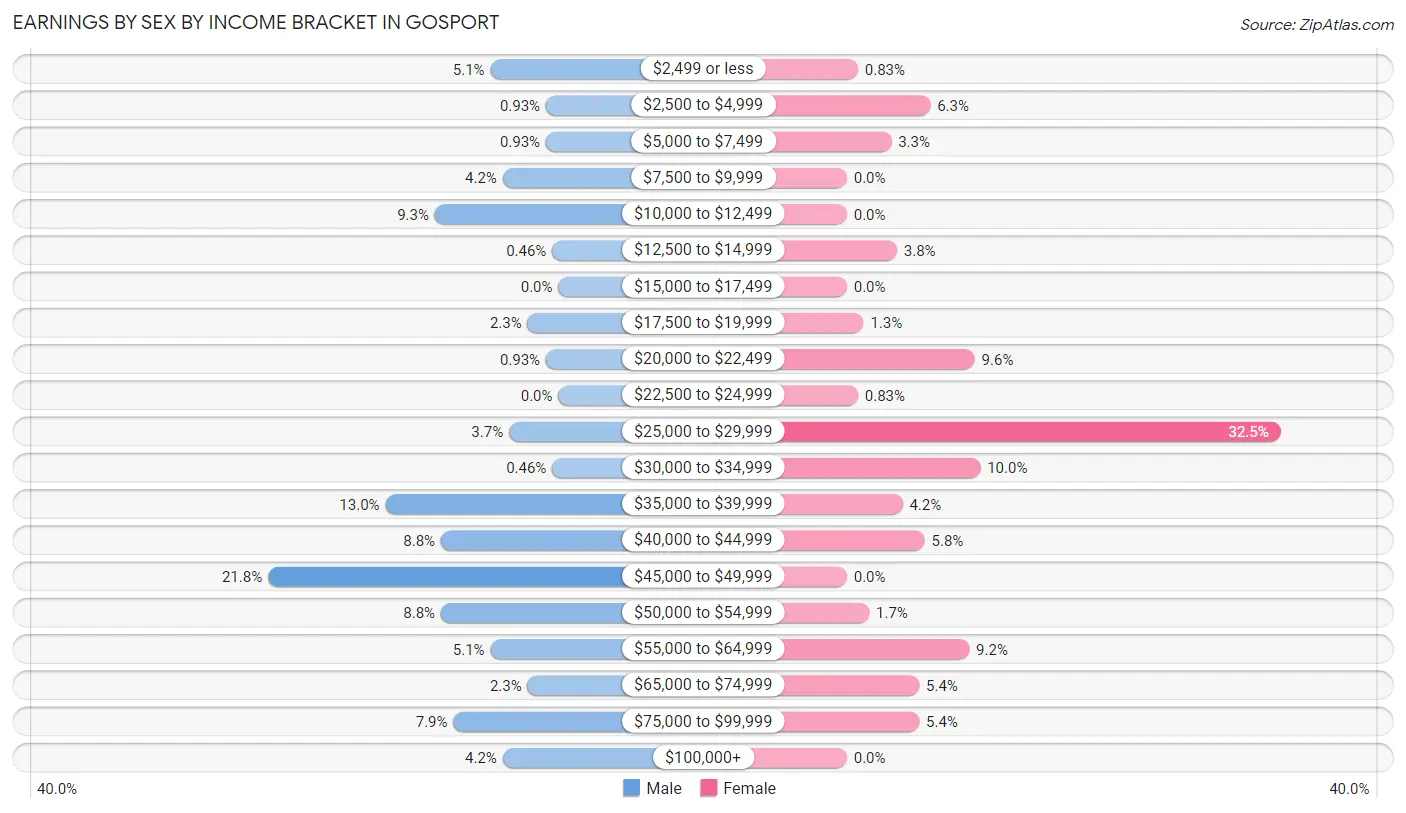
Earnings by Sex by Income Bracket in Gosport
The most common earnings brackets in Gosport are $45,000 to $49,999 for men (47 | 21.8%) and $25,000 to $29,999 for women (78 | 32.5%).
| Income | Male | Female |
| $2,499 or less | 11 (5.1%) | 2 (0.8%) |
| $2,500 to $4,999 | 2 (0.9%) | 15 (6.2%) |
| $5,000 to $7,499 | 2 (0.9%) | 8 (3.3%) |
| $7,500 to $9,999 | 9 (4.2%) | 0 (0.0%) |
| $10,000 to $12,499 | 20 (9.3%) | 0 (0.0%) |
| $12,500 to $14,999 | 1 (0.5%) | 9 (3.7%) |
| $15,000 to $17,499 | 0 (0.0%) | 0 (0.0%) |
| $17,500 to $19,999 | 5 (2.3%) | 3 (1.3%) |
| $20,000 to $22,499 | 2 (0.9%) | 23 (9.6%) |
| $22,500 to $24,999 | 0 (0.0%) | 2 (0.8%) |
| $25,000 to $29,999 | 8 (3.7%) | 78 (32.5%) |
| $30,000 to $34,999 | 1 (0.5%) | 24 (10.0%) |
| $35,000 to $39,999 | 28 (13.0%) | 10 (4.2%) |
| $40,000 to $44,999 | 19 (8.8%) | 14 (5.8%) |
| $45,000 to $49,999 | 47 (21.8%) | 0 (0.0%) |
| $50,000 to $54,999 | 19 (8.8%) | 4 (1.7%) |
| $55,000 to $64,999 | 11 (5.1%) | 22 (9.2%) |
| $65,000 to $74,999 | 5 (2.3%) | 13 (5.4%) |
| $75,000 to $99,999 | 17 (7.9%) | 13 (5.4%) |
| $100,000+ | 9 (4.2%) | 0 (0.0%) |
| Total | 216 (100.0%) | 240 (100.0%) |
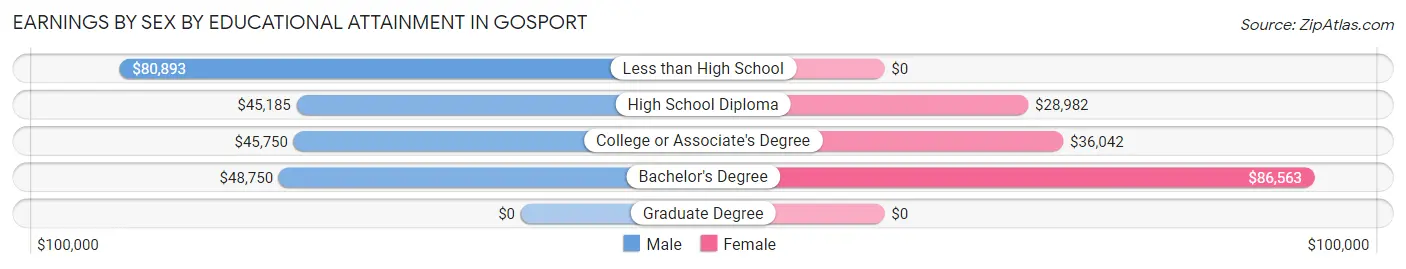
Earnings by Sex by Educational Attainment in Gosport
Average earnings in Gosport are $45,845 for men and $29,446 for women, a difference of 35.8%. Men with an educational attainment of less than high school enjoy the highest average annual earnings of $80,893, while those with high school diploma education earn the least with $45,185. Women with an educational attainment of bachelor's degree earn the most with the average annual earnings of $86,563, while those with high school diploma education have the smallest earnings of $28,982.
| Educational Attainment | Male Income | Female Income |
| Less than High School | $80,893 | $0 |
| High School Diploma | $45,185 | $28,982 |
| College or Associate's Degree | $45,750 | $36,042 |
| Bachelor's Degree | $48,750 | $86,563 |
| Graduate Degree | - | - |
| Total | $45,845 | $29,446 |
Family Income in Gosport
Family Income Brackets in Gosport
According to the Gosport family income data, there are 71 families falling into the $50,000 to $74,999 income range, which is the most common income bracket and makes up 34.5% of all families.
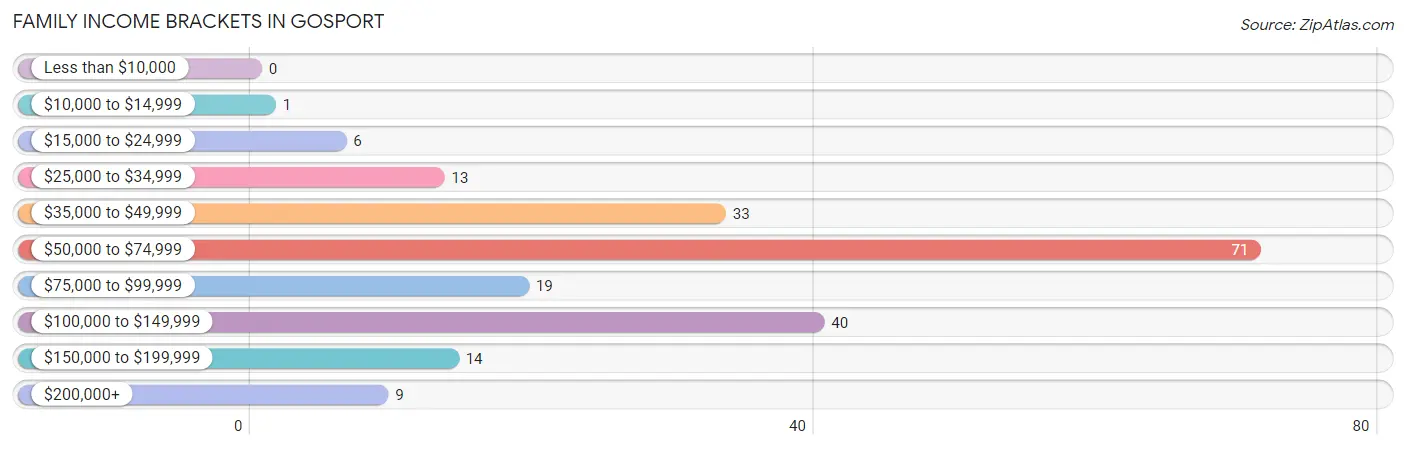
| Income Bracket | # Families | % Families |
| Less than $10,000 | 0 | 0.0% |
| $10,000 to $14,999 | 1 | 0.5% |
| $15,000 to $24,999 | 6 | 2.9% |
| $25,000 to $34,999 | 13 | 6.3% |
| $35,000 to $49,999 | 33 | 16.0% |
| $50,000 to $74,999 | 71 | 34.5% |
| $75,000 to $99,999 | 19 | 9.2% |
| $100,000 to $149,999 | 40 | 19.4% |
| $150,000 to $199,999 | 14 | 6.8% |
| $200,000+ | 9 | 4.4% |
Family Income by Famaliy Size in Gosport
2-person families (93 | 45.2%) account for the highest median family income in Gosport with $80,179 per family, while 2-person families (93 | 45.2%) have the highest median income of $40,090 per family member.
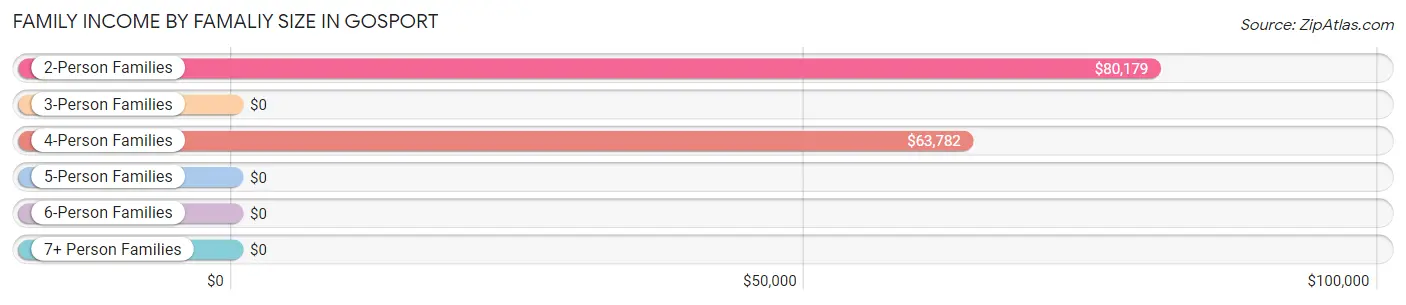
| Income Bracket | # Families | Median Income |
| 2-Person Families | 93 (45.2%) | $80,179 |
| 3-Person Families | 35 (17.0%) | $0 |
| 4-Person Families | 64 (31.1%) | $63,782 |
| 5-Person Families | 12 (5.8%) | $0 |
| 6-Person Families | 2 (1.0%) | $0 |
| 7+ Person Families | 0 (0.0%) | $0 |
| Total | 206 (100.0%) | $64,231 |
Family Income by Number of Earners in Gosport
The median family income in Gosport is $64,231, with families comprising 3+ earners (7) having the highest median family income of $156,875, while families with no earners (6) have the lowest median family income of $31,250, accounting for 3.4% and 2.9% of families, respectively.
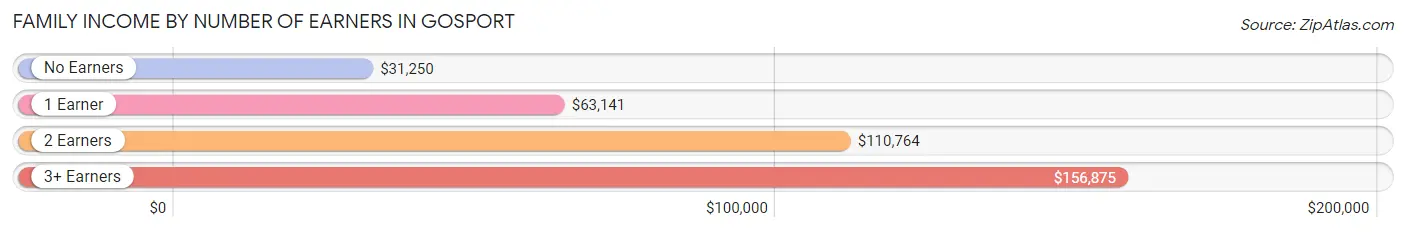
| Number of Earners | # Families | Median Income |
| No Earners | 6 (2.9%) | $31,250 |
| 1 Earner | 118 (57.3%) | $63,141 |
| 2 Earners | 75 (36.4%) | $110,764 |
| 3+ Earners | 7 (3.4%) | $156,875 |
| Total | 206 (100.0%) | $64,231 |
Household Income in Gosport
Household Income Brackets in Gosport
With 101 households falling in the category, the $50,000 to $74,999 income range is the most frequent in Gosport, accounting for 29.3% of all households. In contrast, only 9 households (2.6%) fall into the $200,000+ income bracket, making it the least populous group.
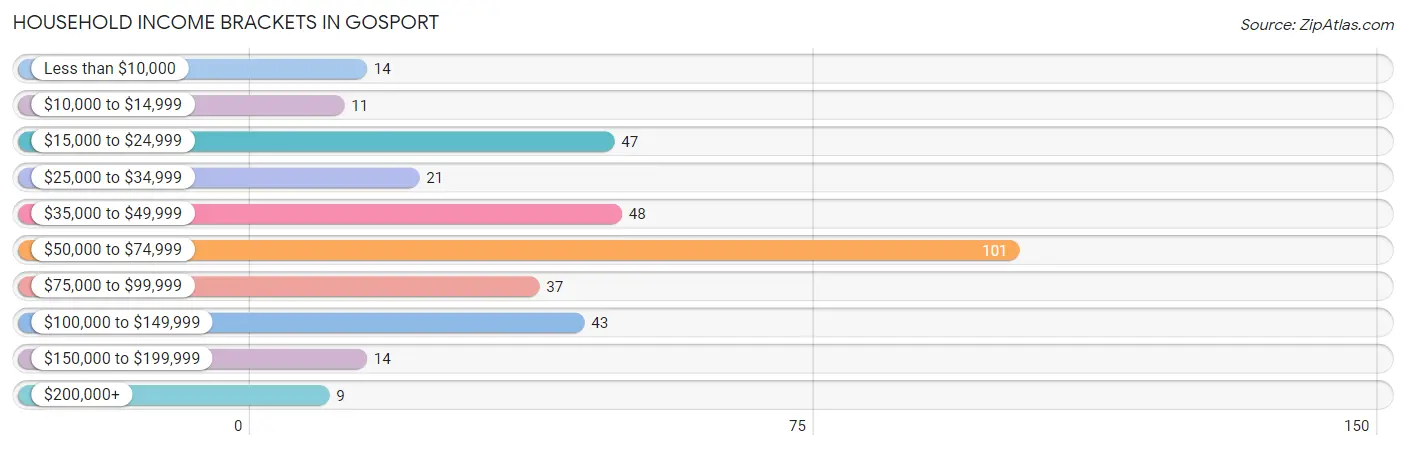
| Income Bracket | # Households | % Households |
| Less than $10,000 | 14 | 4.1% |
| $10,000 to $14,999 | 11 | 3.2% |
| $15,000 to $24,999 | 47 | 13.6% |
| $25,000 to $34,999 | 21 | 6.1% |
| $35,000 to $49,999 | 48 | 13.9% |
| $50,000 to $74,999 | 101 | 29.3% |
| $75,000 to $99,999 | 37 | 10.7% |
| $100,000 to $149,999 | 43 | 12.5% |
| $150,000 to $199,999 | 14 | 4.1% |
| $200,000+ | 9 | 2.6% |
Household Income by Householder Age in Gosport
The median household income in Gosport is $59,219, with the highest median household income of $62,821 found in the 65+ years age bracket for the primary householder. A total of 100 households (29.0%) fall into this category. Meanwhile, the 45 to 64 years age bracket for the primary householder has the lowest median household income of $46,750, with 111 households (32.2%) in this group.
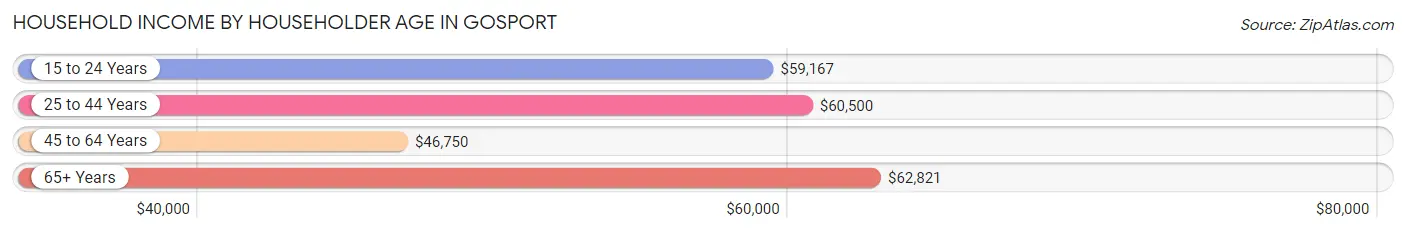
| Income Bracket | # Households | Median Income |
| 15 to 24 Years | 14 (4.1%) | $59,167 |
| 25 to 44 Years | 120 (34.8%) | $60,500 |
| 45 to 64 Years | 111 (32.2%) | $46,750 |
| 65+ Years | 100 (29.0%) | $62,821 |
| Total | 345 (100.0%) | $59,219 |
Poverty in Gosport
Income Below Poverty by Sex and Age in Gosport
With 6.6% poverty level for males and 6.4% for females among the residents of Gosport, 16 and 17 year old males and 55 to 64 year old females are the most vulnerable to poverty, with 3 males (37.5%) and 8 females (13.3%) in their respective age groups living below the poverty level.
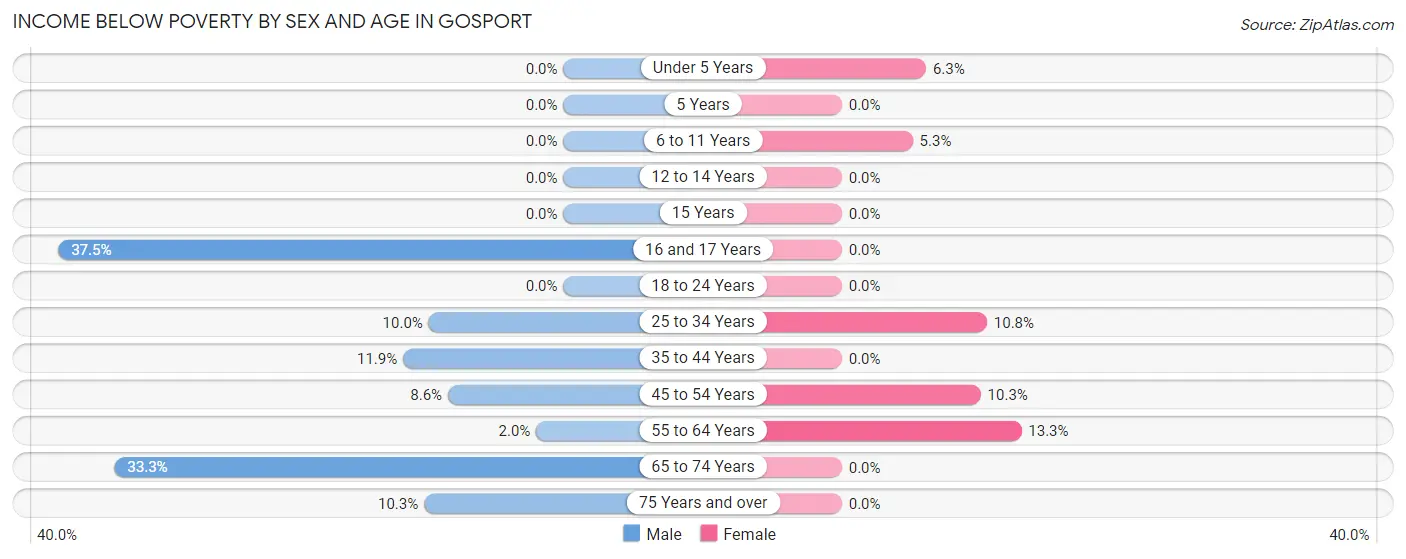
| Age Bracket | Male | Female |
| Under 5 Years | 0 (0.0%) | 1 (6.2%) |
| 5 Years | 0 (0.0%) | 0 (0.0%) |
| 6 to 11 Years | 0 (0.0%) | 1 (5.3%) |
| 12 to 14 Years | 0 (0.0%) | 0 (0.0%) |
| 15 Years | 0 (0.0%) | 0 (0.0%) |
| 16 and 17 Years | 3 (37.5%) | 0 (0.0%) |
| 18 to 24 Years | 0 (0.0%) | 0 (0.0%) |
| 25 to 34 Years | 7 (10.0%) | 7 (10.8%) |
| 35 to 44 Years | 5 (11.9%) | 0 (0.0%) |
| 45 to 54 Years | 3 (8.6%) | 10 (10.3%) |
| 55 to 64 Years | 4 (2.0%) | 8 (13.3%) |
| 65 to 74 Years | 12 (33.3%) | 0 (0.0%) |
| 75 Years and over | 3 (10.3%) | 0 (0.0%) |
| Total | 37 (6.6%) | 27 (6.4%) |
Income Above Poverty by Sex and Age in Gosport
According to the poverty statistics in Gosport, males aged under 5 years and females aged 5 years are the age groups that are most secure financially, with 100.0% of males and 100.0% of females in these age groups living above the poverty line.
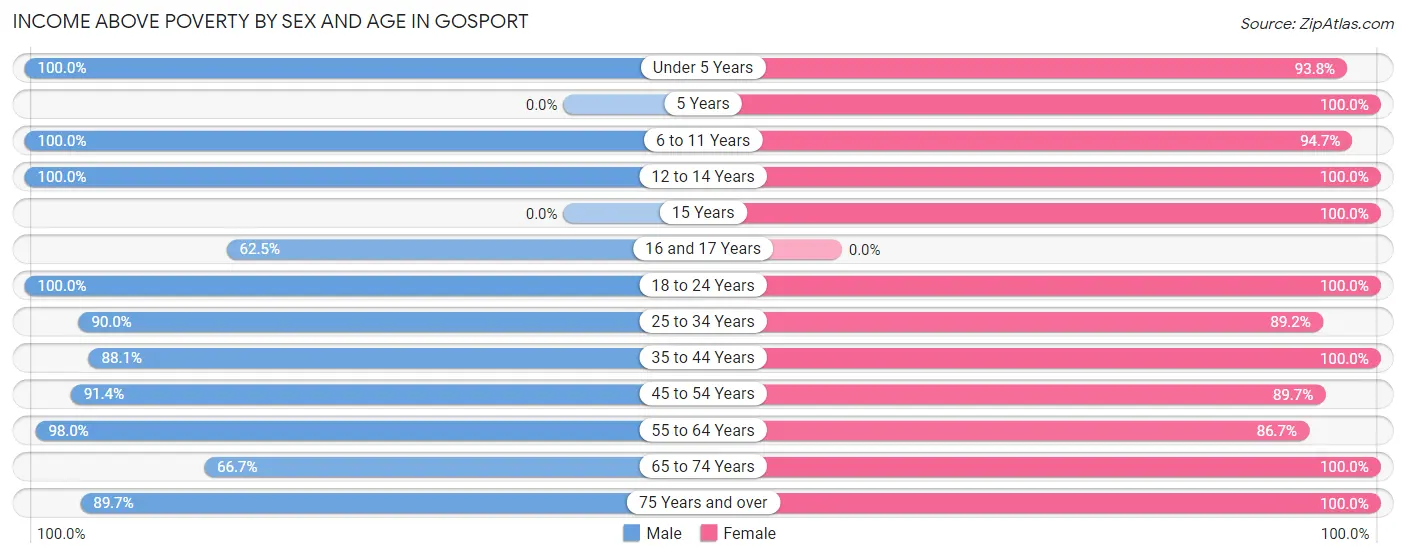
| Age Bracket | Male | Female |
| Under 5 Years | 33 (100.0%) | 15 (93.8%) |
| 5 Years | 0 (0.0%) | 8 (100.0%) |
| 6 to 11 Years | 22 (100.0%) | 18 (94.7%) |
| 12 to 14 Years | 65 (100.0%) | 11 (100.0%) |
| 15 Years | 0 (0.0%) | 14 (100.0%) |
| 16 and 17 Years | 5 (62.5%) | 0 (0.0%) |
| 18 to 24 Years | 25 (100.0%) | 25 (100.0%) |
| 25 to 34 Years | 63 (90.0%) | 58 (89.2%) |
| 35 to 44 Years | 37 (88.1%) | 34 (100.0%) |
| 45 to 54 Years | 32 (91.4%) | 87 (89.7%) |
| 55 to 64 Years | 194 (98.0%) | 52 (86.7%) |
| 65 to 74 Years | 24 (66.7%) | 12 (100.0%) |
| 75 Years and over | 26 (89.7%) | 58 (100.0%) |
| Total | 526 (93.4%) | 392 (93.6%) |
Income Below Poverty Among Married-Couple Families in Gosport
The poverty statistics for married-couple families in Gosport show that 5.8% or 6 of the total 104 families live below the poverty line. Families with 1 or 2 children have the highest poverty rate of 20.7%, comprising of 6 families. On the other hand, families with no children have the lowest poverty rate of 0.0%, which includes 0 families.
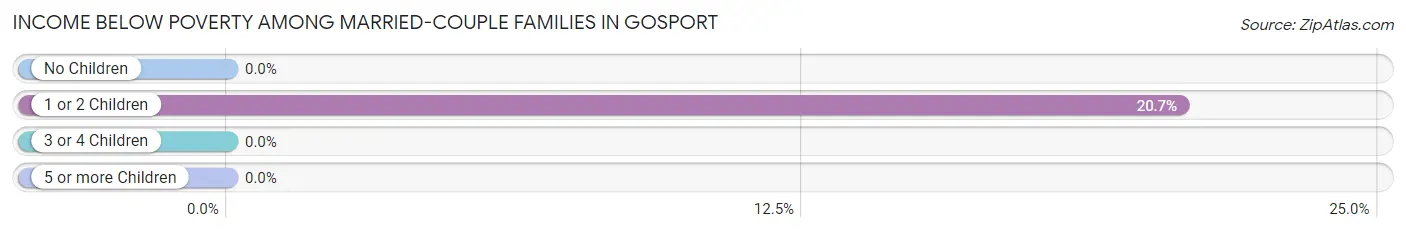
| Children | Above Poverty | Below Poverty |
| No Children | 64 (100.0%) | 0 (0.0%) |
| 1 or 2 Children | 23 (79.3%) | 6 (20.7%) |
| 3 or 4 Children | 11 (100.0%) | 0 (0.0%) |
| 5 or more Children | 0 (0.0%) | 0 (0.0%) |
| Total | 98 (94.2%) | 6 (5.8%) |
Income Below Poverty Among Single-Parent Households in Gosport
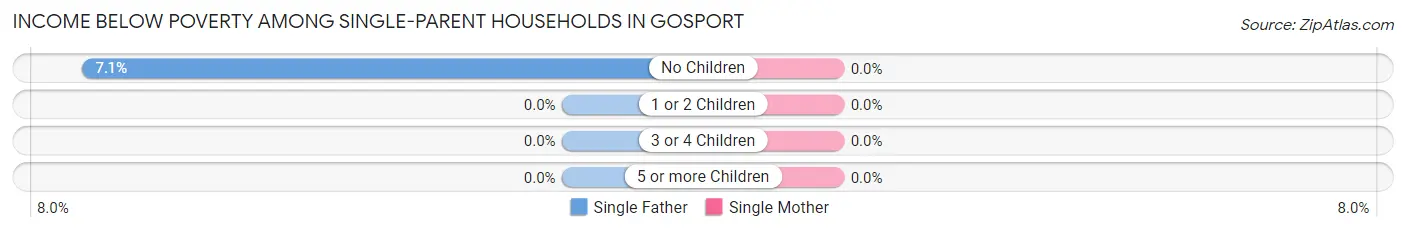
| Children | Single Father | Single Mother |
| No Children | 1 (7.1%) | 0 (0.0%) |
| 1 or 2 Children | 0 (0.0%) | 0 (0.0%) |
| 3 or 4 Children | 0 (0.0%) | 0 (0.0%) |
| 5 or more Children | 0 (0.0%) | 0 (0.0%) |
| Total | 1 (2.6%) | 0 (0.0%) |
Income Below Poverty Among Married-Couple vs Single-Parent Households in Gosport
The poverty data for Gosport shows that 6 of the married-couple family households (5.8%) and 1 of the single-parent households (1.0%) are living below the poverty level. Within the married-couple family households, those with 1 or 2 children have the highest poverty rate, with 6 households (20.7%) falling below the poverty line. Among the single-parent households, those with no children have the highest poverty rate, with 1 household (6.2%) living below poverty.
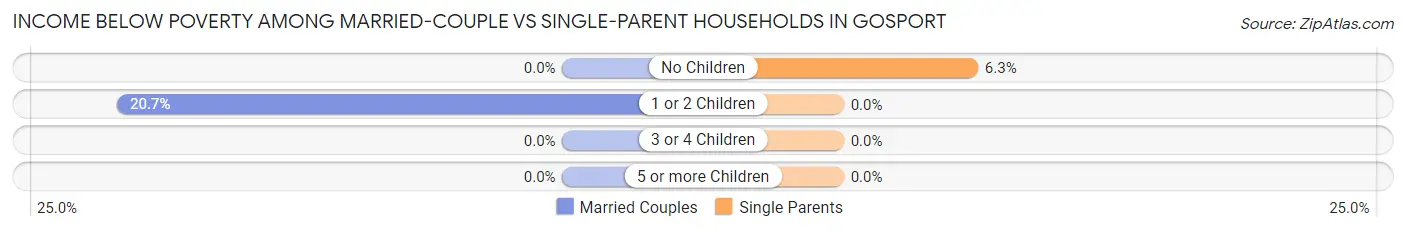
| Children | Married-Couple Families | Single-Parent Households |
| No Children | 0 (0.0%) | 1 (6.2%) |
| 1 or 2 Children | 6 (20.7%) | 0 (0.0%) |
| 3 or 4 Children | 0 (0.0%) | 0 (0.0%) |
| 5 or more Children | 0 (0.0%) | 0 (0.0%) |
| Total | 6 (5.8%) | 1 (1.0%) |
Race in Gosport
The most populous races in Gosport are White / Caucasian (1,057 | 100.0%), and Hispanic or Latino (5 | 0.5%).
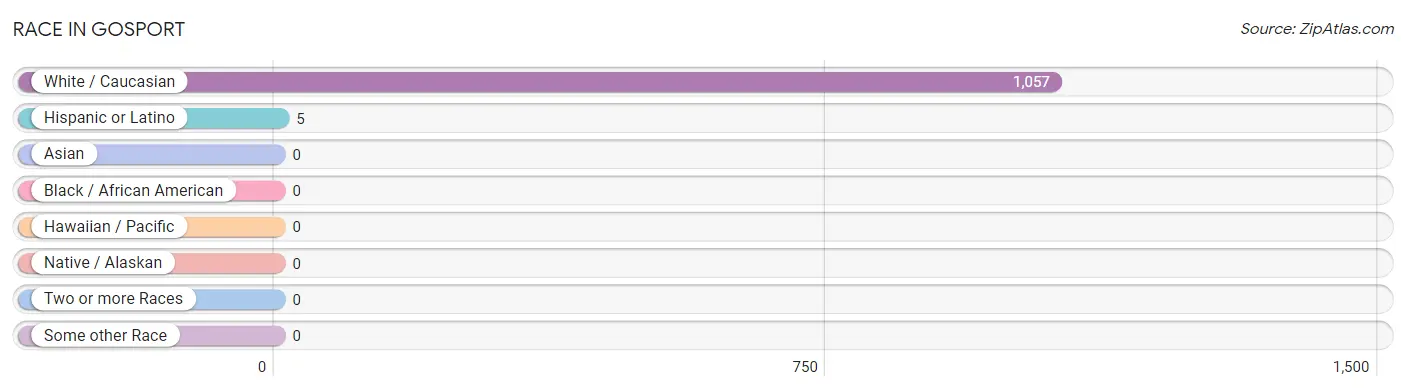
| Race | # Population | % Population |
| Asian | 0 | 0.0% |
| Black / African American | 0 | 0.0% |
| Hawaiian / Pacific | 0 | 0.0% |
| Hispanic or Latino | 5 | 0.5% |
| Native / Alaskan | 0 | 0.0% |
| White / Caucasian | 1,057 | 100.0% |
| Two or more Races | 0 | 0.0% |
| Some other Race | 0 | 0.0% |
| Total | 1,057 | 100.0% |
Ancestry in Gosport
The most populous ancestries reported in Gosport are European (257 | 24.3%), German (170 | 16.1%), English (101 | 9.6%), Irish (79 | 7.5%), and American (71 | 6.7%), together accounting for 64.1% of all Gosport residents.
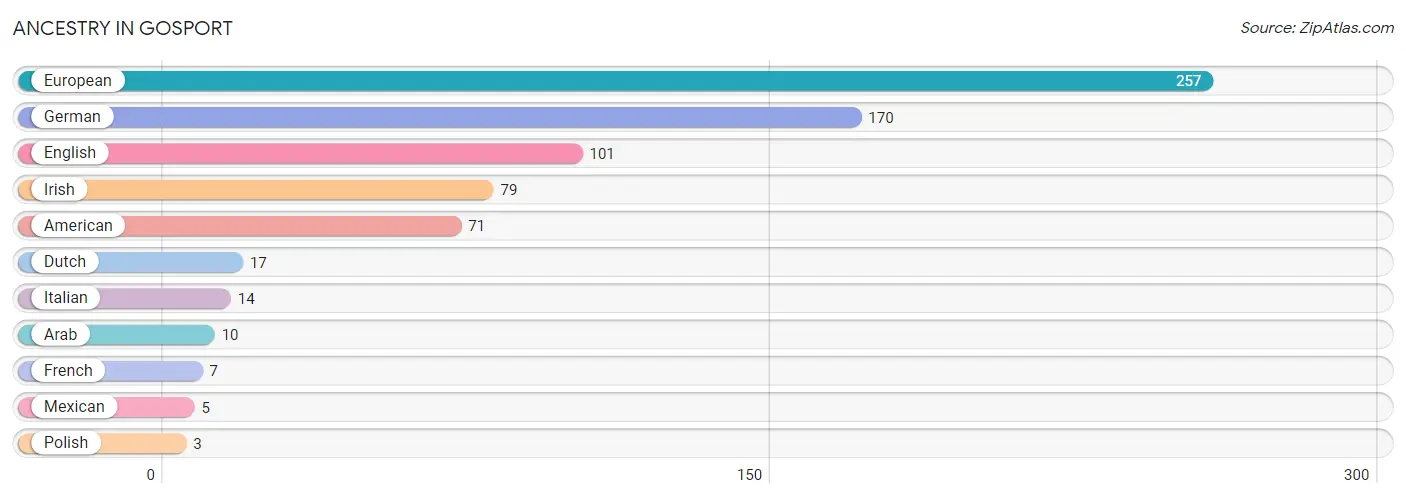
| Ancestry | # Population | % Population |
| American | 71 | 6.7% |
| Arab | 10 | 0.9% |
| Dutch | 17 | 1.6% |
| English | 101 | 9.6% |
| European | 257 | 24.3% |
| French | 7 | 0.7% |
| German | 170 | 16.1% |
| Irish | 79 | 7.5% |
| Italian | 14 | 1.3% |
| Mexican | 5 | 0.5% |
| Polish | 3 | 0.3% | View All 11 Rows |
Immigrants in Gosport
The most numerous immigrant groups reported in Gosport came from Asia (10 | 0.9%), Israel (10 | 0.9%), Western Asia (10 | 0.9%), Eastern Europe (1 | 0.1%), and Europe (1 | 0.1%), together accounting for 3.0% of all Gosport residents.
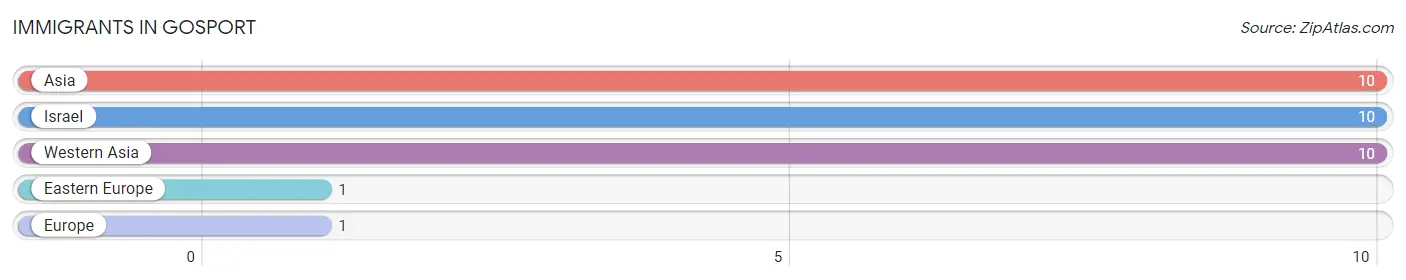
| Immigration Origin | # Population | % Population |
| Asia | 10 | 0.9% |
| Eastern Europe | 1 | 0.1% |
| Europe | 1 | 0.1% |
| Israel | 10 | 0.9% |
| Western Asia | 10 | 0.9% | View All 5 Rows |
Sex and Age in Gosport
Sex and Age in Gosport
The most populous age groups in Gosport are 55 to 59 Years (178 | 29.9%) for men and 45 to 49 Years (87 | 18.9%) for women.
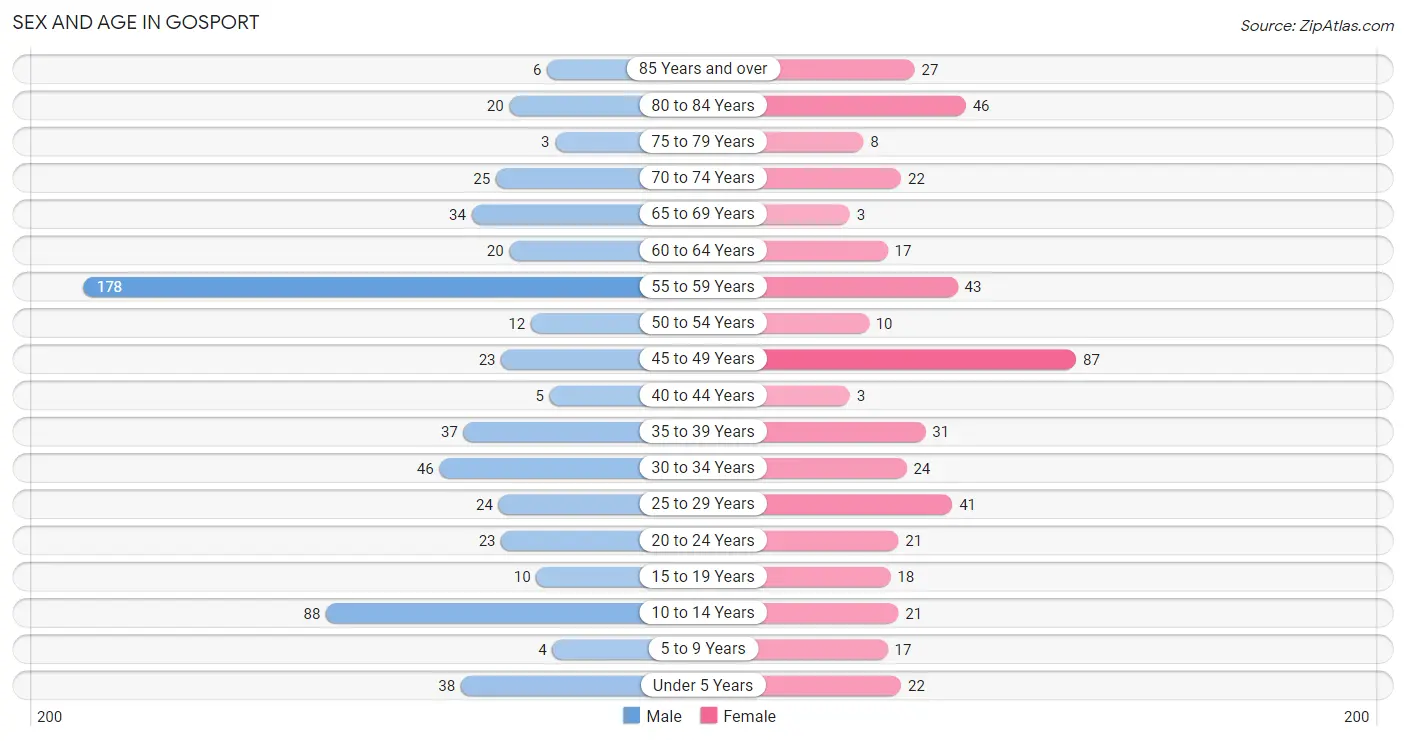
| Age Bracket | Male | Female |
| Under 5 Years | 38 (6.4%) | 22 (4.8%) |
| 5 to 9 Years | 4 (0.7%) | 17 (3.7%) |
| 10 to 14 Years | 88 (14.8%) | 21 (4.6%) |
| 15 to 19 Years | 10 (1.7%) | 18 (3.9%) |
| 20 to 24 Years | 23 (3.9%) | 21 (4.6%) |
| 25 to 29 Years | 24 (4.0%) | 41 (8.9%) |
| 30 to 34 Years | 46 (7.7%) | 24 (5.2%) |
| 35 to 39 Years | 37 (6.2%) | 31 (6.7%) |
| 40 to 44 Years | 5 (0.8%) | 3 (0.6%) |
| 45 to 49 Years | 23 (3.9%) | 87 (18.9%) |
| 50 to 54 Years | 12 (2.0%) | 10 (2.2%) |
| 55 to 59 Years | 178 (29.9%) | 43 (9.3%) |
| 60 to 64 Years | 20 (3.4%) | 17 (3.7%) |
| 65 to 69 Years | 34 (5.7%) | 3 (0.6%) |
| 70 to 74 Years | 25 (4.2%) | 22 (4.8%) |
| 75 to 79 Years | 3 (0.5%) | 8 (1.7%) |
| 80 to 84 Years | 20 (3.4%) | 46 (10.0%) |
| 85 Years and over | 6 (1.0%) | 27 (5.9%) |
| Total | 596 (100.0%) | 461 (100.0%) |
Families and Households in Gosport
Median Family Size in Gosport
The median family size in Gosport is 3.78 persons per family, with single female/mother families (63 | 30.6%) accounting for the largest median family size of 6.25 persons per family. On the other hand, single male/father families (39 | 18.9%) represent the smallest median family size with 2.67 persons per family.
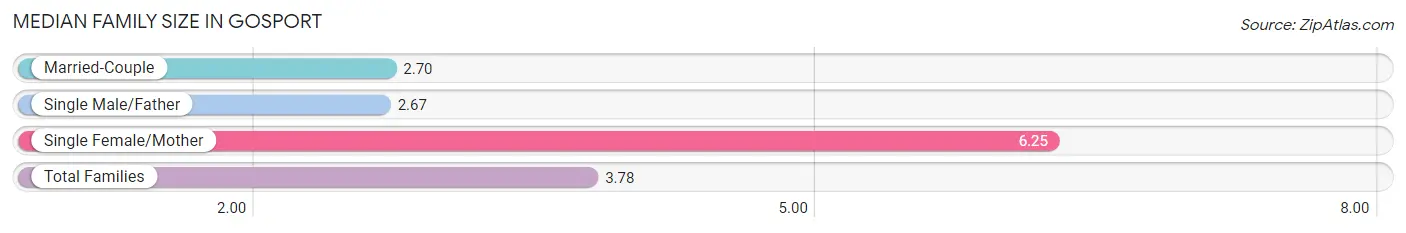
| Family Type | # Families | Family Size |
| Married-Couple | 104 (50.5%) | 2.70 |
| Single Male/Father | 39 (18.9%) | 2.67 |
| Single Female/Mother | 63 (30.6%) | 6.25 |
| Total Families | 206 (100.0%) | 3.78 |
Median Household Size in Gosport
The median household size in Gosport is 2.89 persons per household, with single female/mother households (63 | 18.3%) accounting for the largest median household size of 6.25 persons per household. non-family households (139 | 40.3%) represent the smallest median household size with 1.37 persons per household.
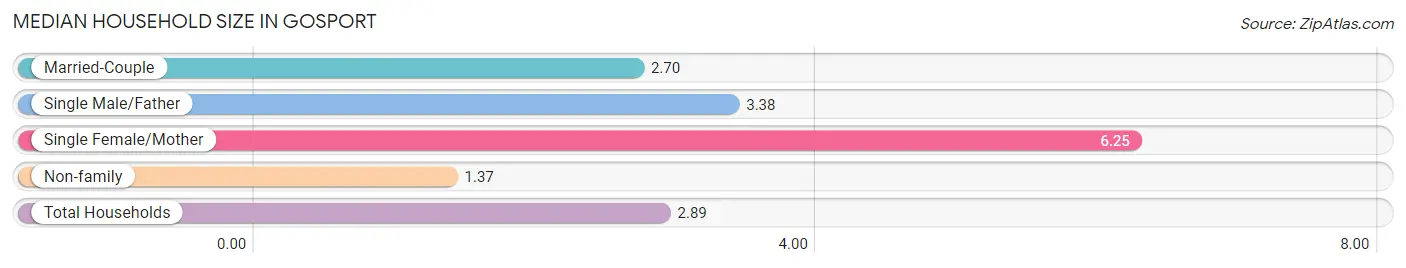
| Household Type | # Households | Household Size |
| Married-Couple | 104 (30.1%) | 2.70 |
| Single Male/Father | 39 (11.3%) | 3.38 |
| Single Female/Mother | 63 (18.3%) | 6.25 |
| Non-family | 139 (40.3%) | 1.37 |
| Total Households | 345 (100.0%) | 2.89 |
Household Size by Marriage Status in Gosport
Out of a total of 345 households in Gosport, 206 (59.7%) are family households, while 139 (40.3%) are nonfamily households. The most numerous type of family households are 2-person households, comprising 84, and the most common type of nonfamily households are 1-person households, comprising 109.
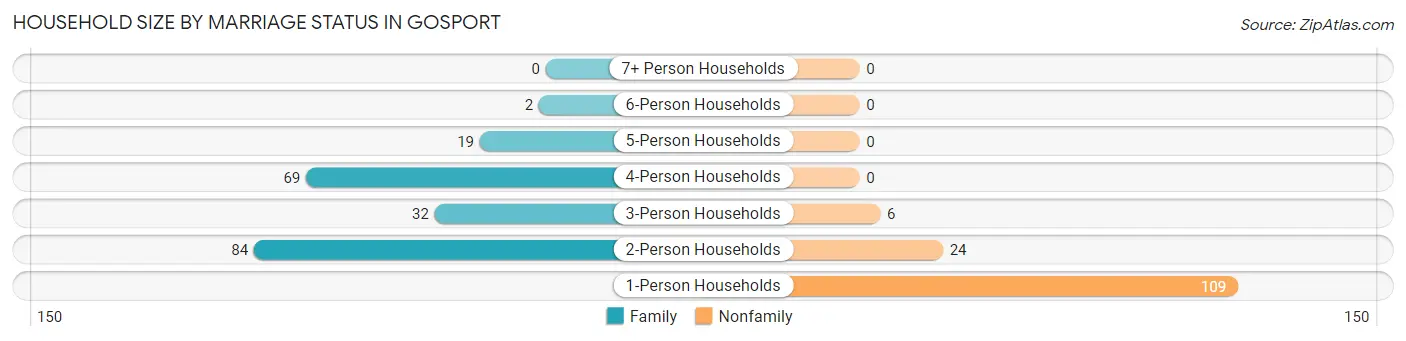
| Household Size | Family Households | Nonfamily Households |
| 1-Person Households | - | 109 (31.6%) |
| 2-Person Households | 84 (24.3%) | 24 (7.0%) |
| 3-Person Households | 32 (9.3%) | 6 (1.7%) |
| 4-Person Households | 69 (20.0%) | 0 (0.0%) |
| 5-Person Households | 19 (5.5%) | 0 (0.0%) |
| 6-Person Households | 2 (0.6%) | 0 (0.0%) |
| 7+ Person Households | 0 (0.0%) | 0 (0.0%) |
| Total | 206 (59.7%) | 139 (40.3%) |
Female Fertility in Gosport
Fertility by Age in Gosport
| Age Bracket | Women with Births | Births / 1,000 Women |
| 15 to 19 years | 0 (0.0%) | 0.0 |
| 20 to 34 years | 0 (0.0%) | 0.0 |
| 35 to 50 years | 0 (0.0%) | 0.0 |
| Total | 0 (0.0%) | 0.0 |
Fertility by Age by Marriage Status in Gosport
| Age Bracket | Married | Unmarried |
| 15 to 19 years | 0 (0.0%) | 0 (0.0%) |
| 20 to 34 years | 0 (0.0%) | 0 (0.0%) |
| 35 to 50 years | 0 (0.0%) | 0 (0.0%) |
| Total | 0 (0.0%) | 0 (0.0%) |
Fertility by Education in Gosport
| Educational Attainment | Women with Births | Births / 1,000 Women |
| Less than High School | 0 (0.0%) | 0.0 |
| High School Diploma | 0 (0.0%) | 0.0 |
| College or Associate's Degree | 0 (0.0%) | 0.0 |
| Bachelor's Degree | 0 (0.0%) | 0.0 |
| Graduate Degree | 0 (0.0%) | 0.0 |
| Total | 0 (0.0%) | 0.0 |
Fertility by Education by Marriage Status in Gosport
| Educational Attainment | Married | Unmarried |
| Less than High School | 0 (0.0%) | 0 (0.0%) |
| High School Diploma | 0 (0.0%) | 0 (0.0%) |
| College or Associate's Degree | 0 (0.0%) | 0 (0.0%) |
| Bachelor's Degree | 0 (0.0%) | 0 (0.0%) |
| Graduate Degree | 0 (0.0%) | 0 (0.0%) |
| Total | 0 (0.0%) | 0 (0.0%) |
Employment Characteristics in Gosport
Employment by Class of Employer in Gosport
Among the 425 employed individuals in Gosport, private company employees (346 | 81.4%), not-for-profit organizations (24 | 5.7%), and local government employees (23 | 5.4%) make up the most common classes of employment.
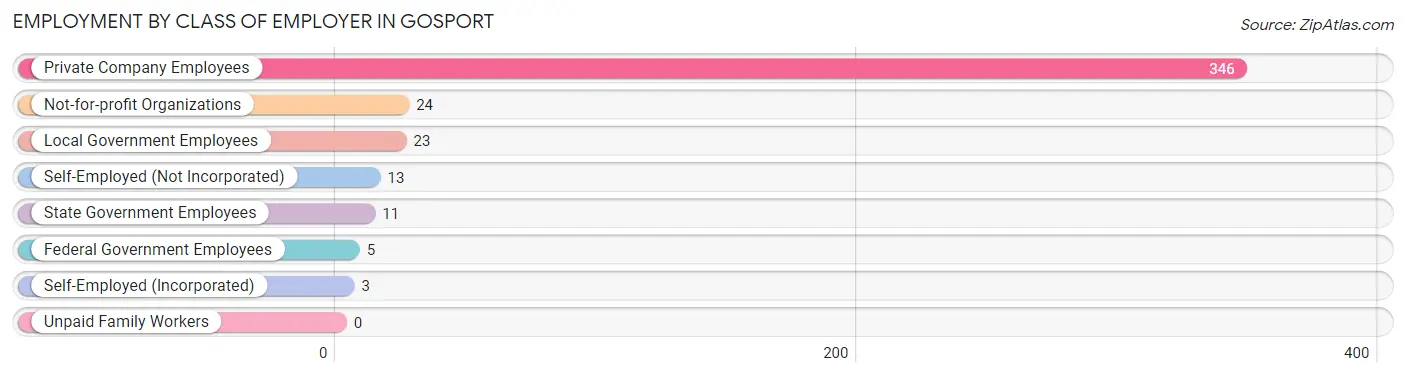
| Employer Class | # Employees | % Employees |
| Private Company Employees | 346 | 81.4% |
| Self-Employed (Incorporated) | 3 | 0.7% |
| Self-Employed (Not Incorporated) | 13 | 3.1% |
| Not-for-profit Organizations | 24 | 5.7% |
| Local Government Employees | 23 | 5.4% |
| State Government Employees | 11 | 2.6% |
| Federal Government Employees | 5 | 1.2% |
| Unpaid Family Workers | 0 | 0.0% |
| Total | 425 | 100.0% |
Employment Status by Age in Gosport
According to the labor force statistics for Gosport, out of the total population over 16 years of age (853), 52.9% or 451 individuals are in the labor force, with 5.5% or 25 of them unemployed. The age group with the highest labor force participation rate is 20 to 24 years, with 100.0% or 44 individuals in the labor force. Within the labor force, the 16 to 19 years age range has the highest percentage of unemployed individuals, with 66.7% or 4 of them being unemployed.
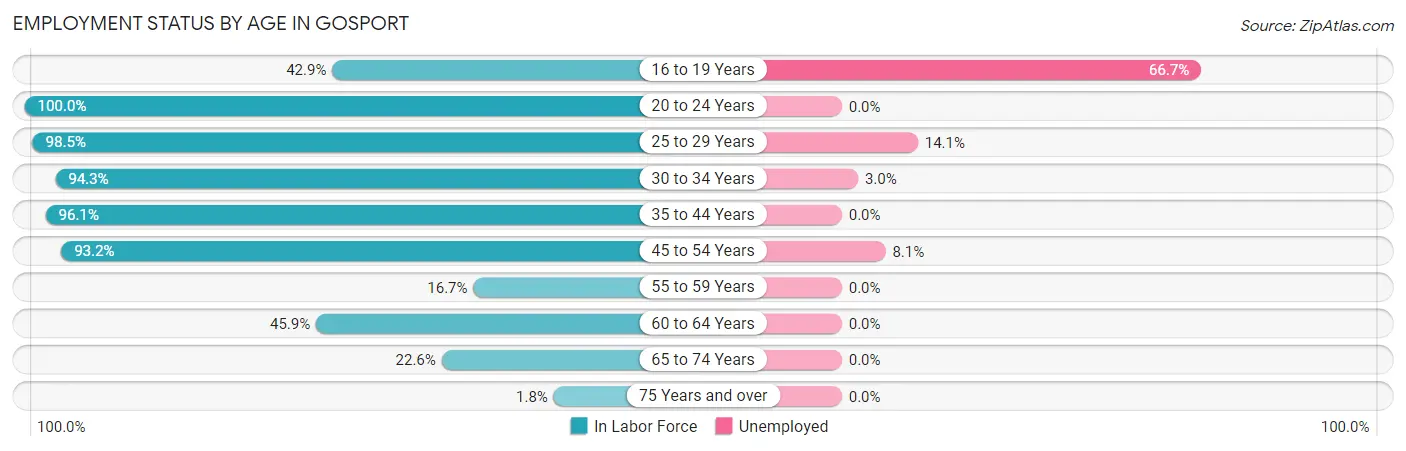
| Age Bracket | In Labor Force | Unemployed |
| 16 to 19 Years | 6 (42.9%) | 4 (66.7%) |
| 20 to 24 Years | 44 (100.0%) | 0 (0.0%) |
| 25 to 29 Years | 64 (98.5%) | 9 (14.1%) |
| 30 to 34 Years | 66 (94.3%) | 2 (3.0%) |
| 35 to 44 Years | 73 (96.1%) | 0 (0.0%) |
| 45 to 54 Years | 123 (93.2%) | 10 (8.1%) |
| 55 to 59 Years | 37 (16.7%) | 0 (0.0%) |
| 60 to 64 Years | 17 (45.9%) | 0 (0.0%) |
| 65 to 74 Years | 19 (22.6%) | 0 (0.0%) |
| 75 Years and over | 2 (1.8%) | 0 (0.0%) |
| Total | 451 (52.9%) | 25 (5.5%) |
Employment Status by Educational Attainment in Gosport
According to labor force statistics for Gosport, 63.2% of individuals (380) out of the total population between 25 and 64 years of age (601) are in the labor force, with 5.5% or 21 of them being unemployed. The group with the highest labor force participation rate are those with the educational attainment of bachelor's degree or higher, with 95.8% or 46 individuals in the labor force. Within the labor force, individuals with bachelor's degree or higher education have the highest percentage of unemployment, with 21.7% or 10 of them being unemployed.
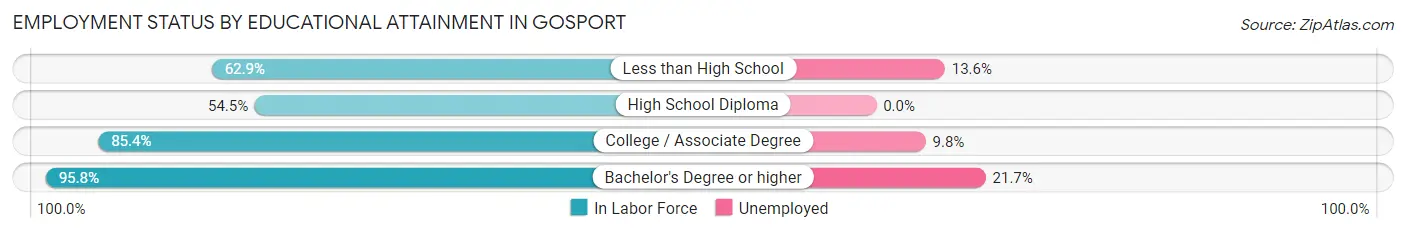
| Educational Attainment | In Labor Force | Unemployed |
| Less than High School | 22 (62.9%) | 5 (13.6%) |
| High School Diploma | 230 (54.5%) | 0 (0.0%) |
| College / Associate Degree | 82 (85.4%) | 9 (9.8%) |
| Bachelor's Degree or higher | 46 (95.8%) | 10 (21.7%) |
| Total | 380 (63.2%) | 33 (5.5%) |
Employment Occupations by Sex in Gosport
Management, Business, Science and Arts Occupations
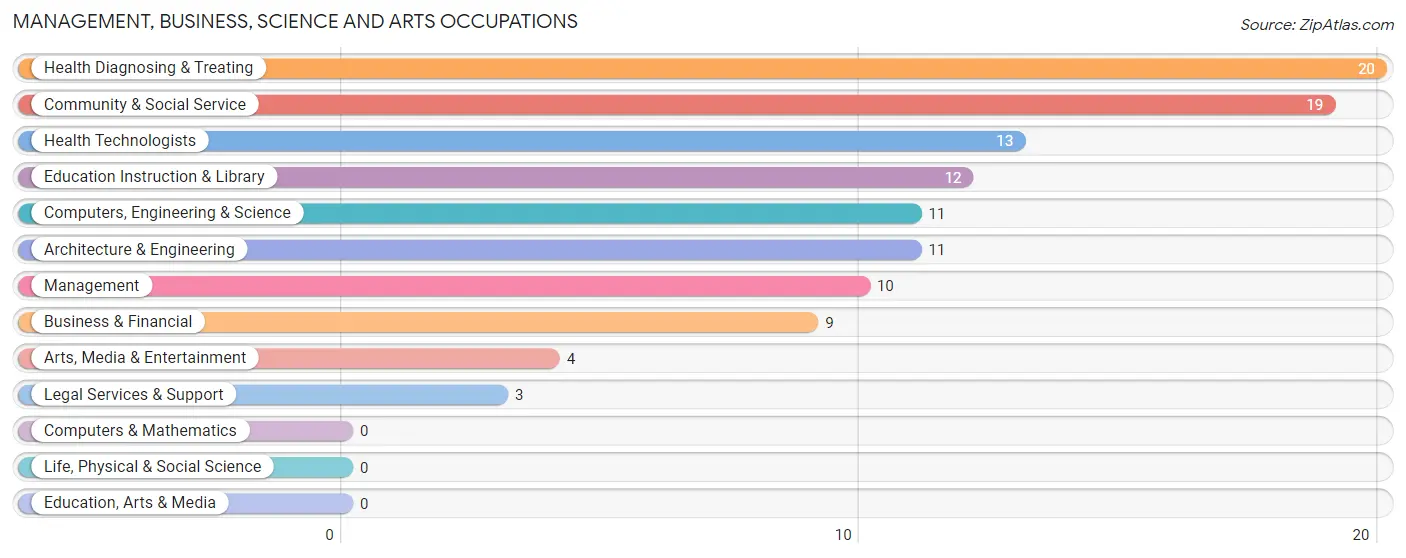
The most common Management, Business, Science and Arts occupations in Gosport are Health Diagnosing & Treating (20 | 4.7%), Community & Social Service (19 | 4.5%), Health Technologists (13 | 3.0%), Education Instruction & Library (12 | 2.8%), and Computers, Engineering & Science (11 | 2.6%).
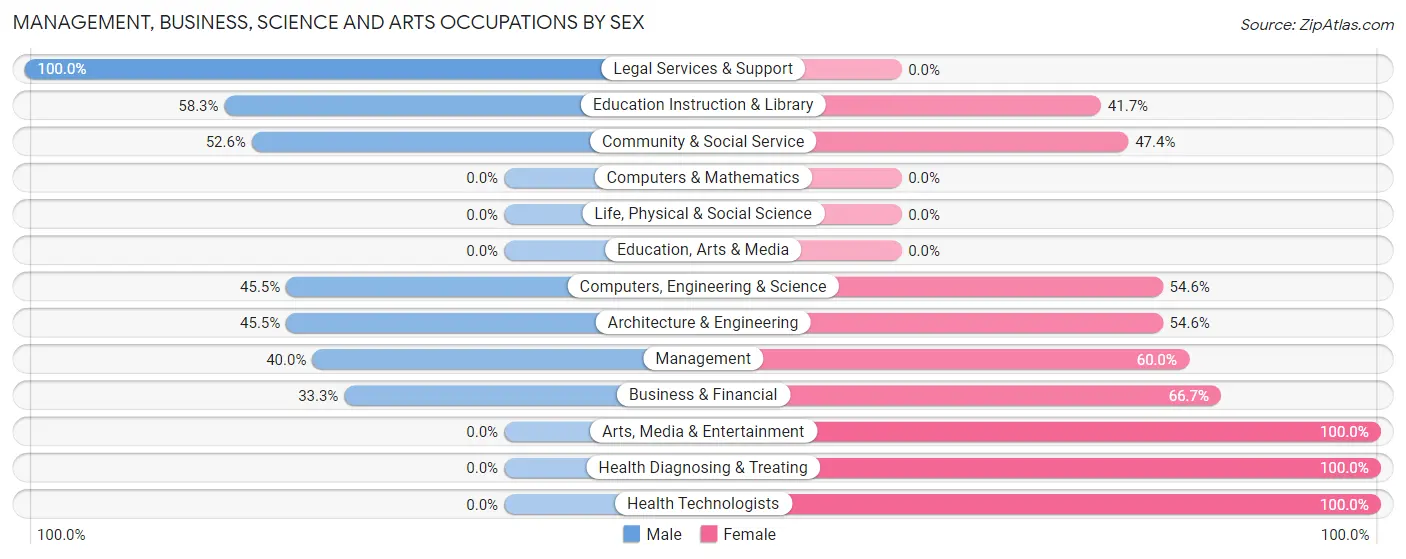
Management, Business, Science and Arts Occupations by Sex
Within the Management, Business, Science and Arts occupations in Gosport, the most male-oriented occupations are Legal Services & Support (100.0%), Education Instruction & Library (58.3%), and Community & Social Service (52.6%), while the most female-oriented occupations are Arts, Media & Entertainment (100.0%), Health Diagnosing & Treating (100.0%), and Health Technologists (100.0%).
| Occupation | Male | Female |
| Management | 4 (40.0%) | 6 (60.0%) |
| Business & Financial | 3 (33.3%) | 6 (66.7%) |
| Computers, Engineering & Science | 5 (45.5%) | 6 (54.5%) |
| Computers & Mathematics | 0 (0.0%) | 0 (0.0%) |
| Architecture & Engineering | 5 (45.5%) | 6 (54.5%) |
| Life, Physical & Social Science | 0 (0.0%) | 0 (0.0%) |
| Community & Social Service | 10 (52.6%) | 9 (47.4%) |
| Education, Arts & Media | 0 (0.0%) | 0 (0.0%) |
| Legal Services & Support | 3 (100.0%) | 0 (0.0%) |
| Education Instruction & Library | 7 (58.3%) | 5 (41.7%) |
| Arts, Media & Entertainment | 0 (0.0%) | 4 (100.0%) |
| Health Diagnosing & Treating | 0 (0.0%) | 20 (100.0%) |
| Health Technologists | 0 (0.0%) | 13 (100.0%) |
| Total (Category) | 22 (31.9%) | 47 (68.1%) |
| Total (Overall) | 197 (46.2%) | 229 (53.8%) |
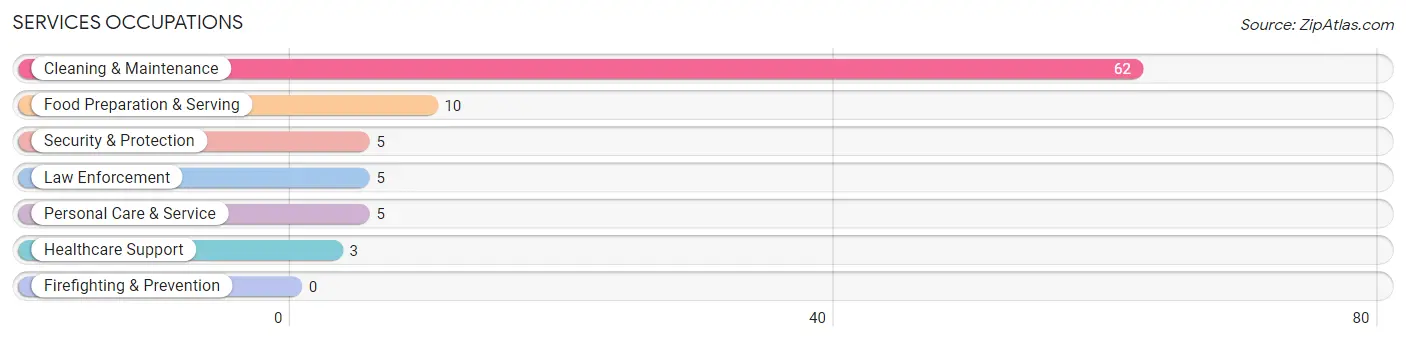
Services Occupations
The most common Services occupations in Gosport are Cleaning & Maintenance (62 | 14.5%), Food Preparation & Serving (10 | 2.4%), Security & Protection (5 | 1.2%), Law Enforcement (5 | 1.2%), and Personal Care & Service (5 | 1.2%).
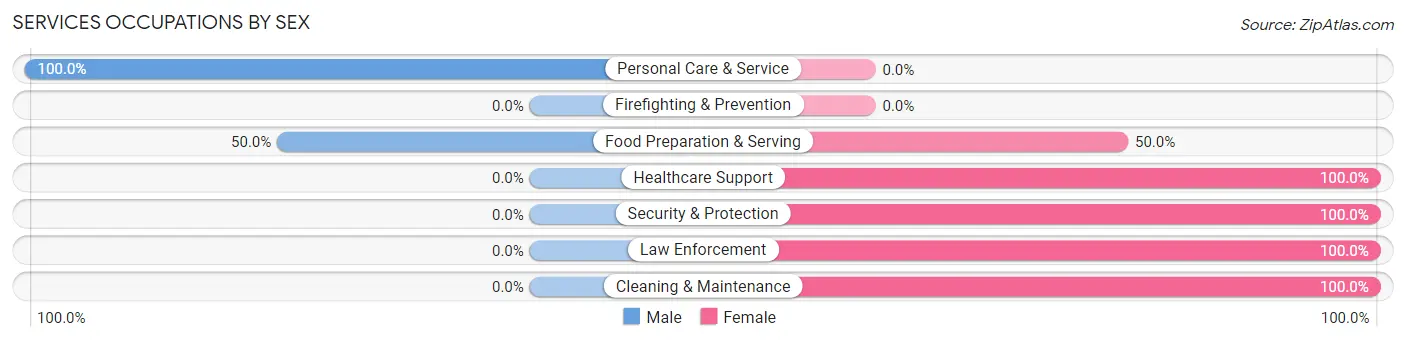
Services Occupations by Sex
Within the Services occupations in Gosport, the most male-oriented occupations are Personal Care & Service (100.0%), and Food Preparation & Serving (50.0%), while the most female-oriented occupations are Healthcare Support (100.0%), Security & Protection (100.0%), and Law Enforcement (100.0%).
| Occupation | Male | Female |
| Healthcare Support | 0 (0.0%) | 3 (100.0%) |
| Security & Protection | 0 (0.0%) | 5 (100.0%) |
| Firefighting & Prevention | 0 (0.0%) | 0 (0.0%) |
| Law Enforcement | 0 (0.0%) | 5 (100.0%) |
| Food Preparation & Serving | 5 (50.0%) | 5 (50.0%) |
| Cleaning & Maintenance | 0 (0.0%) | 62 (100.0%) |
| Personal Care & Service | 5 (100.0%) | 0 (0.0%) |
| Total (Category) | 10 (11.8%) | 75 (88.2%) |
| Total (Overall) | 197 (46.2%) | 229 (53.8%) |
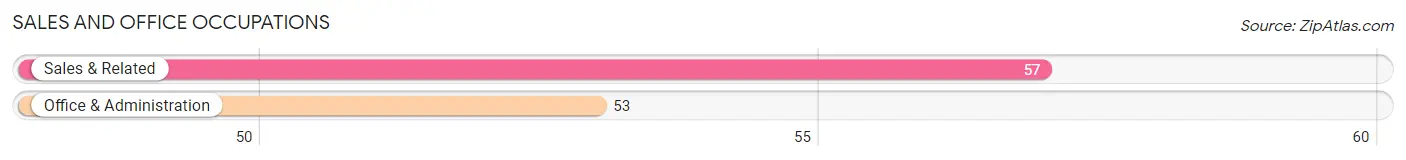
Sales and Office Occupations
The most common Sales and Office occupations in Gosport are Sales & Related (57 | 13.4%), and Office & Administration (53 | 12.4%).
Sales and Office Occupations by Sex
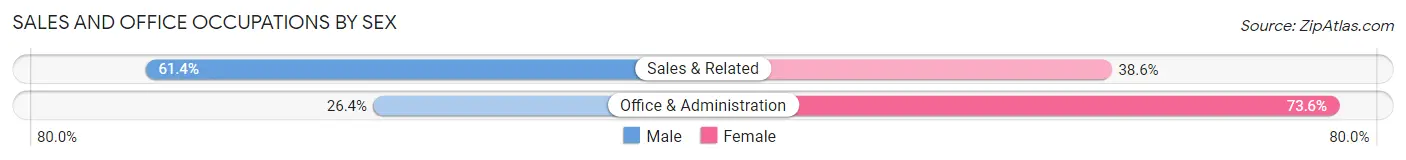
| Occupation | Male | Female |
| Sales & Related | 35 (61.4%) | 22 (38.6%) |
| Office & Administration | 14 (26.4%) | 39 (73.6%) |
| Total (Category) | 49 (44.6%) | 61 (55.4%) |
| Total (Overall) | 197 (46.2%) | 229 (53.8%) |
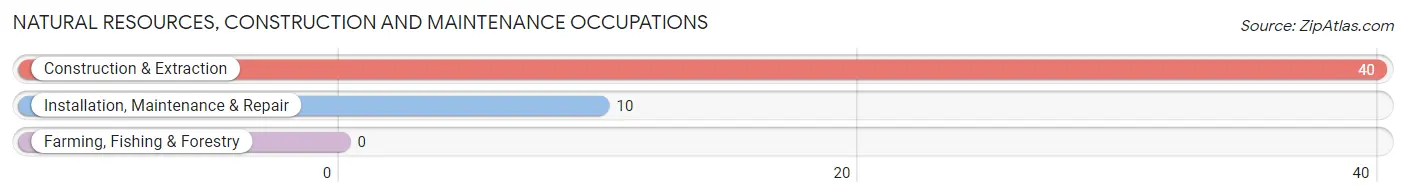
Natural Resources, Construction and Maintenance Occupations
The most common Natural Resources, Construction and Maintenance occupations in Gosport are Construction & Extraction (40 | 9.4%), and Installation, Maintenance & Repair (10 | 2.4%).
Natural Resources, Construction and Maintenance Occupations by Sex
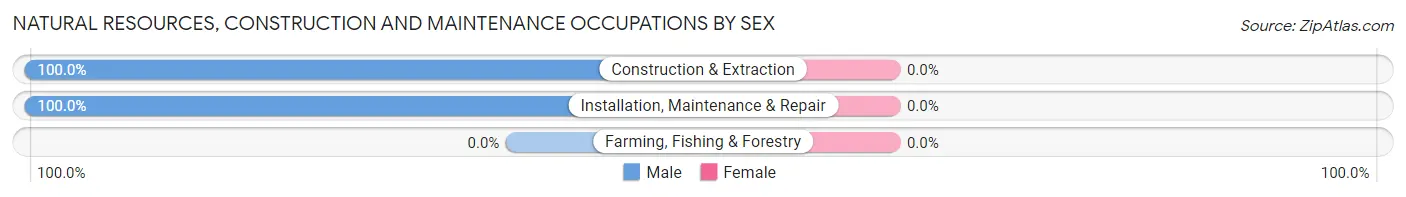
| Occupation | Male | Female |
| Farming, Fishing & Forestry | 0 (0.0%) | 0 (0.0%) |
| Construction & Extraction | 40 (100.0%) | 0 (0.0%) |
| Installation, Maintenance & Repair | 10 (100.0%) | 0 (0.0%) |
| Total (Category) | 50 (100.0%) | 0 (0.0%) |
| Total (Overall) | 197 (46.2%) | 229 (53.8%) |
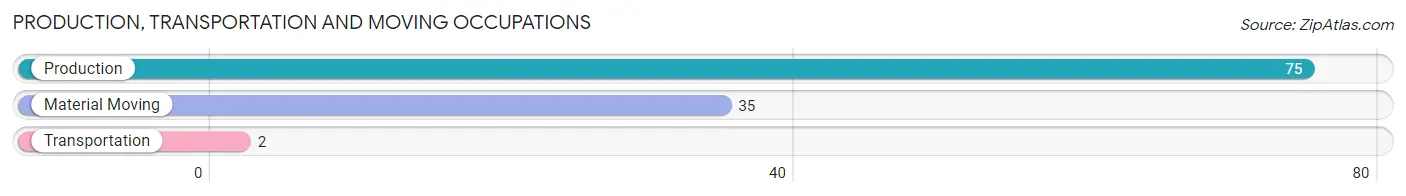
Production, Transportation and Moving Occupations
The most common Production, Transportation and Moving occupations in Gosport are Production (75 | 17.6%), Material Moving (35 | 8.2%), and Transportation (2 | 0.5%).
Production, Transportation and Moving Occupations by Sex
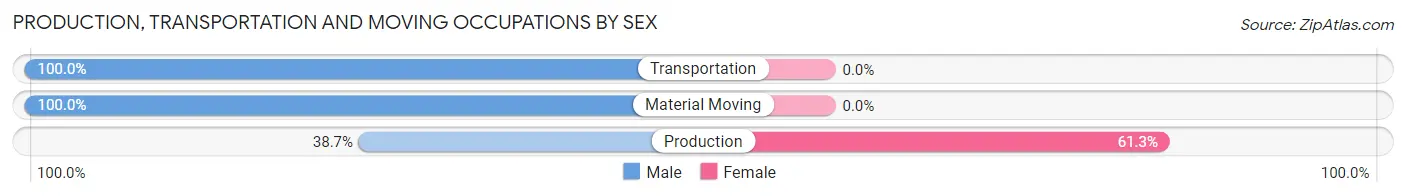
| Occupation | Male | Female |
| Production | 29 (38.7%) | 46 (61.3%) |
| Transportation | 2 (100.0%) | 0 (0.0%) |
| Material Moving | 35 (100.0%) | 0 (0.0%) |
| Total (Category) | 66 (58.9%) | 46 (41.1%) |
| Total (Overall) | 197 (46.2%) | 229 (53.8%) |
Employment Industries by Sex in Gosport
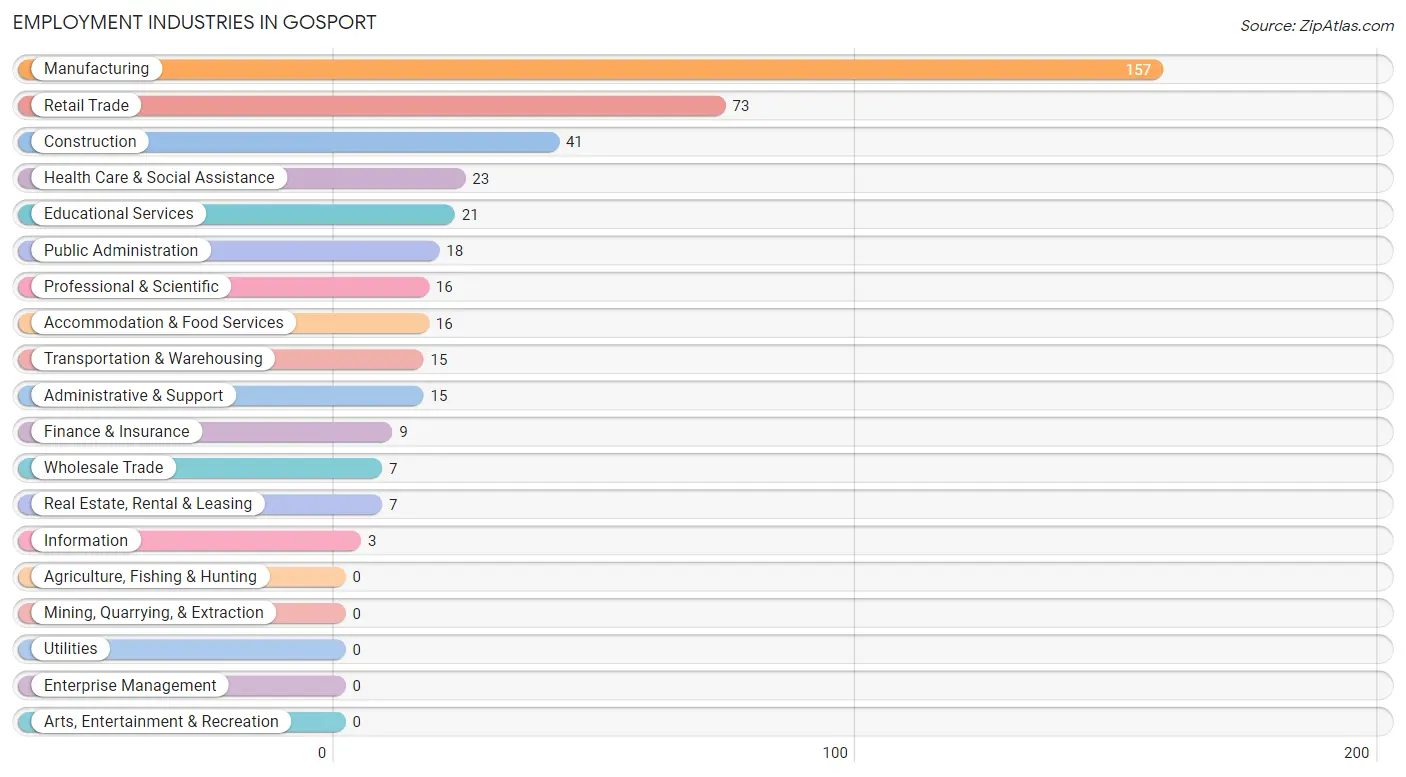
Employment Industries in Gosport
The major employment industries in Gosport include Manufacturing (157 | 36.8%), Retail Trade (73 | 17.1%), Construction (41 | 9.6%), Health Care & Social Assistance (23 | 5.4%), and Educational Services (21 | 4.9%).
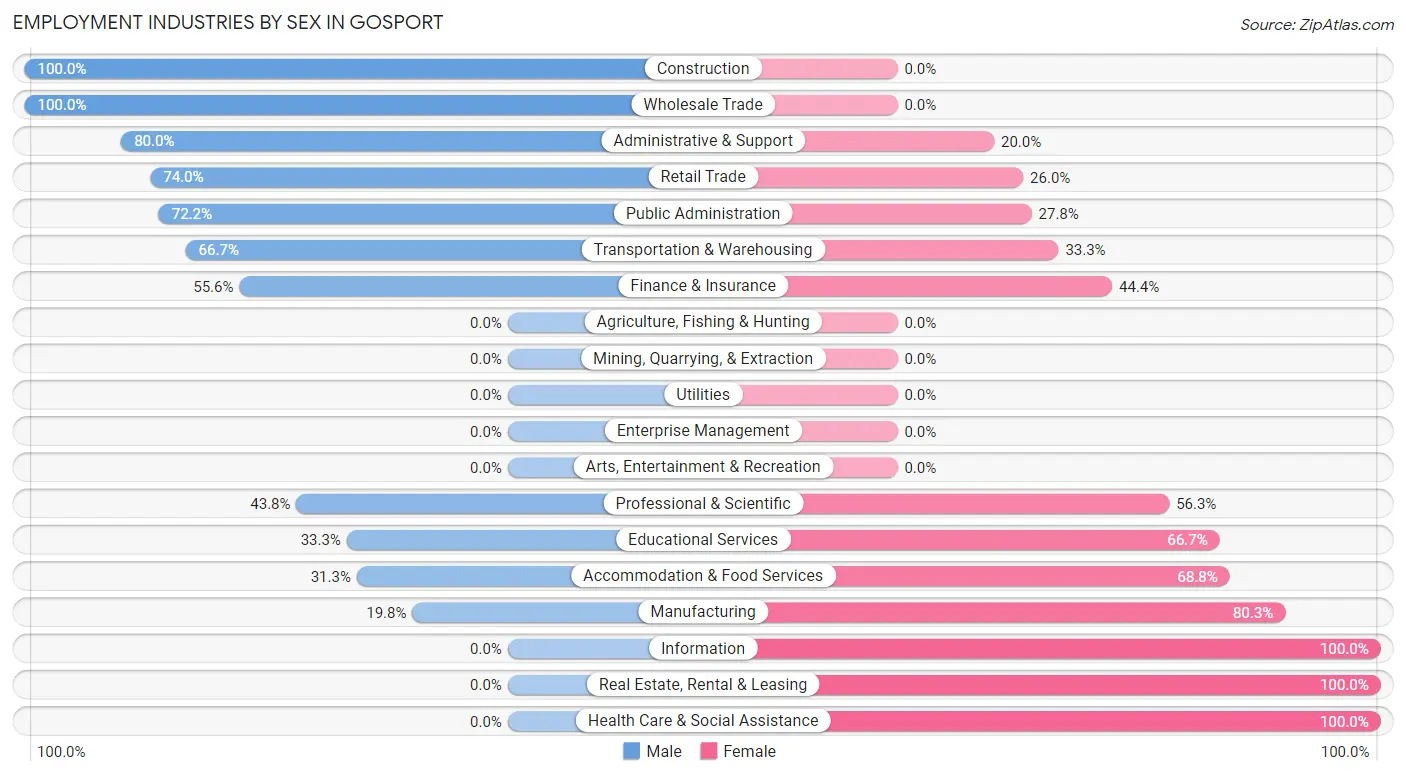
Employment Industries by Sex in Gosport
The Gosport industries that see more men than women are Construction (100.0%), Wholesale Trade (100.0%), and Administrative & Support (80.0%), whereas the industries that tend to have a higher number of women are Information (100.0%), Real Estate, Rental & Leasing (100.0%), and Health Care & Social Assistance (100.0%).
| Industry | Male | Female |
| Agriculture, Fishing & Hunting | 0 (0.0%) | 0 (0.0%) |
| Mining, Quarrying, & Extraction | 0 (0.0%) | 0 (0.0%) |
| Construction | 41 (100.0%) | 0 (0.0%) |
| Manufacturing | 31 (19.8%) | 126 (80.2%) |
| Wholesale Trade | 7 (100.0%) | 0 (0.0%) |
| Retail Trade | 54 (74.0%) | 19 (26.0%) |
| Transportation & Warehousing | 10 (66.7%) | 5 (33.3%) |
| Utilities | 0 (0.0%) | 0 (0.0%) |
| Information | 0 (0.0%) | 3 (100.0%) |
| Finance & Insurance | 5 (55.6%) | 4 (44.4%) |
| Real Estate, Rental & Leasing | 0 (0.0%) | 7 (100.0%) |
| Professional & Scientific | 7 (43.8%) | 9 (56.2%) |
| Enterprise Management | 0 (0.0%) | 0 (0.0%) |
| Administrative & Support | 12 (80.0%) | 3 (20.0%) |
| Educational Services | 7 (33.3%) | 14 (66.7%) |
| Health Care & Social Assistance | 0 (0.0%) | 23 (100.0%) |
| Arts, Entertainment & Recreation | 0 (0.0%) | 0 (0.0%) |
| Accommodation & Food Services | 5 (31.2%) | 11 (68.8%) |
| Public Administration | 13 (72.2%) | 5 (27.8%) |
| Total | 197 (46.2%) | 229 (53.8%) |
Education in Gosport
School Enrollment in Gosport
The most common levels of schooling among the 178 students in Gosport are middle school (91 | 51.1%), elementary school (28 | 15.7%), and high school (24 | 13.5%).
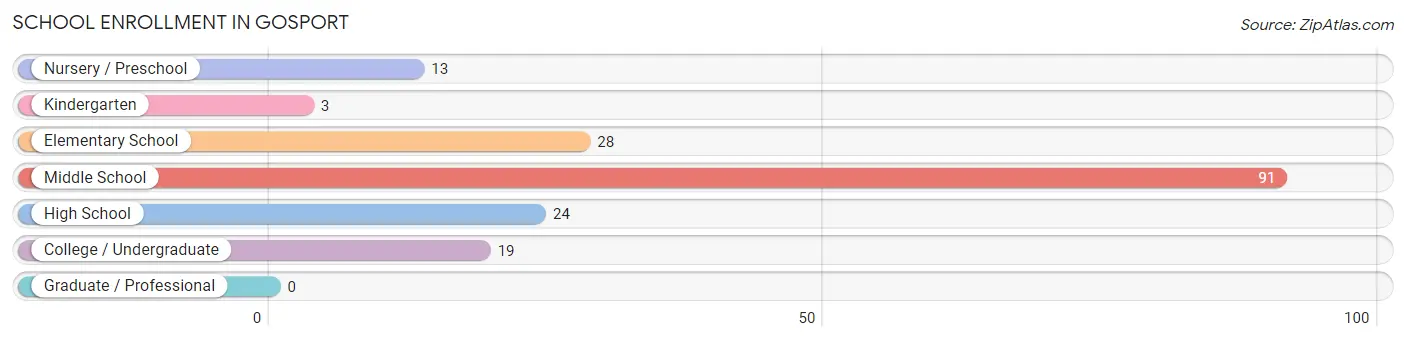
| School Level | # Students | % Students |
| Nursery / Preschool | 13 | 7.3% |
| Kindergarten | 3 | 1.7% |
| Elementary School | 28 | 15.7% |
| Middle School | 91 | 51.1% |
| High School | 24 | 13.5% |
| College / Undergraduate | 19 | 10.7% |
| Graduate / Professional | 0 | 0.0% |
| Total | 178 | 100.0% |
School Enrollment by Age by Funding Source in Gosport
Out of a total of 178 students who are enrolled in schools in Gosport, 5 (2.8%) attend a private institution, while the remaining 173 (97.2%) are enrolled in public schools. The age group of 5 to 9 year old has the highest likelihood of being enrolled in private schools, with 5 (23.8% in the age bracket) enrolled. Conversely, the age group of 3 to 4 year olds has the lowest likelihood of being enrolled in a private school, with 5 (100.0% in the age bracket) attending a public institution.
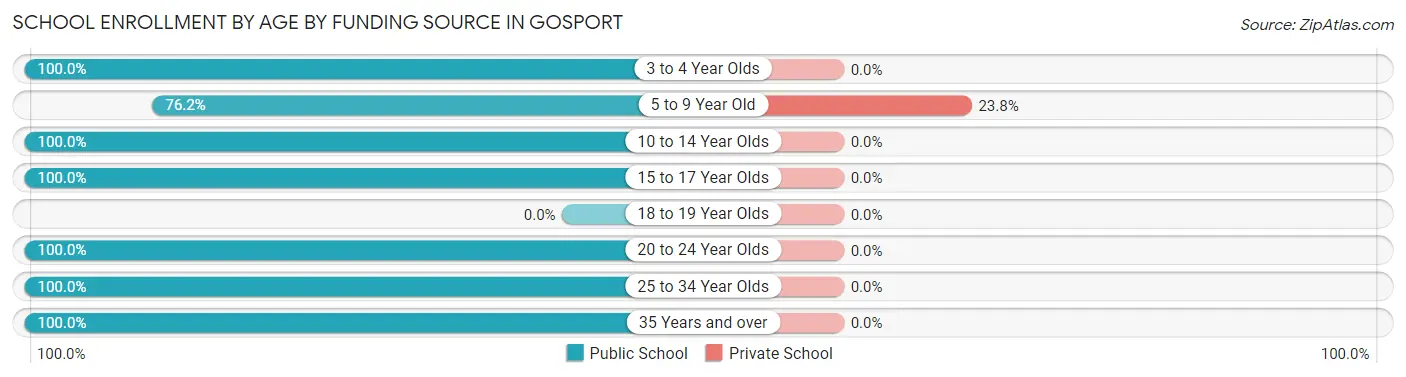
| Age Bracket | Public School | Private School |
| 3 to 4 Year Olds | 5 (100.0%) | 0 (0.0%) |
| 5 to 9 Year Old | 16 (76.2%) | 5 (23.8%) |
| 10 to 14 Year Olds | 109 (100.0%) | 0 (0.0%) |
| 15 to 17 Year Olds | 22 (100.0%) | 0 (0.0%) |
| 18 to 19 Year Olds | 0 (0.0%) | 0 (0.0%) |
| 20 to 24 Year Olds | 2 (100.0%) | 0 (0.0%) |
| 25 to 34 Year Olds | 11 (100.0%) | 0 (0.0%) |
| 35 Years and over | 8 (100.0%) | 0 (0.0%) |
| Total | 173 (97.2%) | 5 (2.8%) |
Educational Attainment by Field of Study in Gosport
Business (25 | 35.7%), education (12 | 17.1%), physical & health sciences (10 | 14.3%), liberal arts & history (7 | 10.0%), and science & technology (6 | 8.6%) are the most common fields of study among 70 individuals in Gosport who have obtained a bachelor's degree or higher.
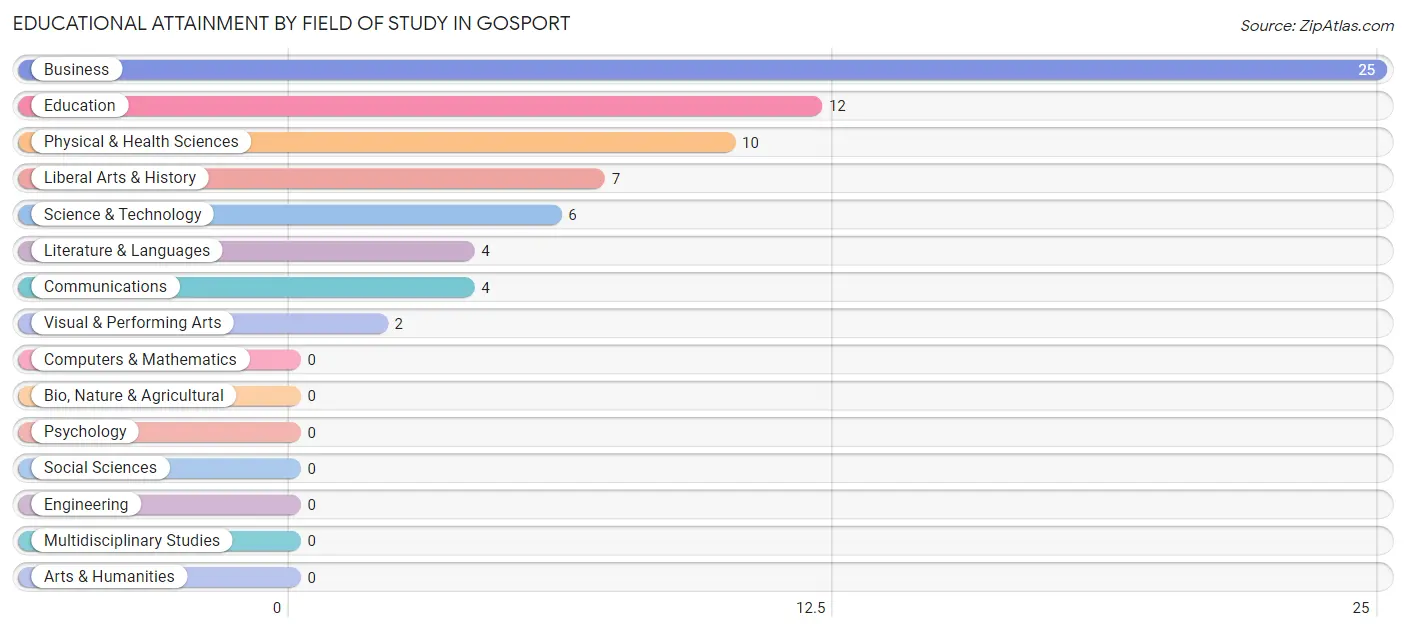
| Field of Study | # Graduates | % Graduates |
| Computers & Mathematics | 0 | 0.0% |
| Bio, Nature & Agricultural | 0 | 0.0% |
| Physical & Health Sciences | 10 | 14.3% |
| Psychology | 0 | 0.0% |
| Social Sciences | 0 | 0.0% |
| Engineering | 0 | 0.0% |
| Multidisciplinary Studies | 0 | 0.0% |
| Science & Technology | 6 | 8.6% |
| Business | 25 | 35.7% |
| Education | 12 | 17.1% |
| Literature & Languages | 4 | 5.7% |
| Liberal Arts & History | 7 | 10.0% |
| Visual & Performing Arts | 2 | 2.9% |
| Communications | 4 | 5.7% |
| Arts & Humanities | 0 | 0.0% |
| Total | 70 | 100.0% |
Transportation & Commute in Gosport
Vehicle Availability by Sex in Gosport
The most prevalent vehicle ownership categories in Gosport are males with 2 vehicles (81, accounting for 41.3%) and females with 2 vehicles (93, making up 35.4%).
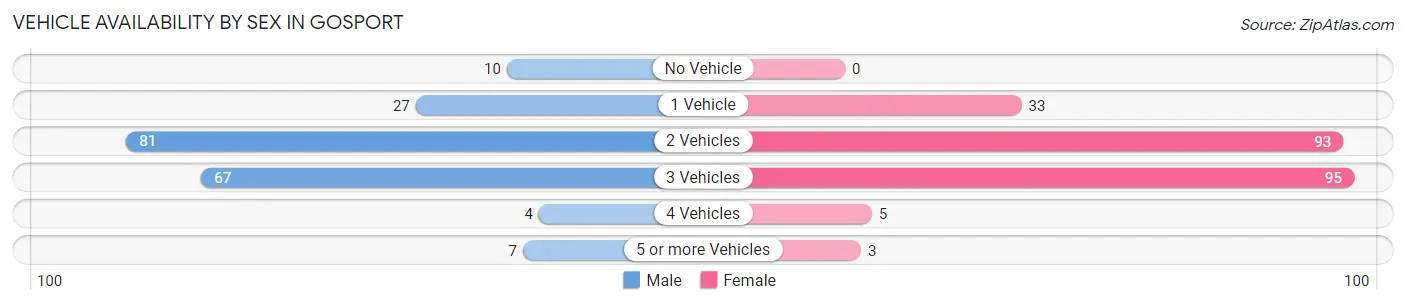
| Vehicles Available | Male | Female |
| No Vehicle | 10 (5.1%) | 0 (0.0%) |
| 1 Vehicle | 27 (13.8%) | 33 (14.4%) |
| 2 Vehicles | 81 (41.3%) | 93 (40.6%) |
| 3 Vehicles | 67 (34.2%) | 95 (41.5%) |
| 4 Vehicles | 4 (2.0%) | 5 (2.2%) |
| 5 or more Vehicles | 7 (3.6%) | 3 (1.3%) |
| Total | 196 (100.0%) | 229 (100.0%) |
Commute Time in Gosport
The most frequently occuring commute durations in Gosport are 30 to 34 minutes (106 commuters, 25.7%), 45 to 59 minutes (46 commuters, 11.2%), and 20 to 24 minutes (45 commuters, 10.9%).
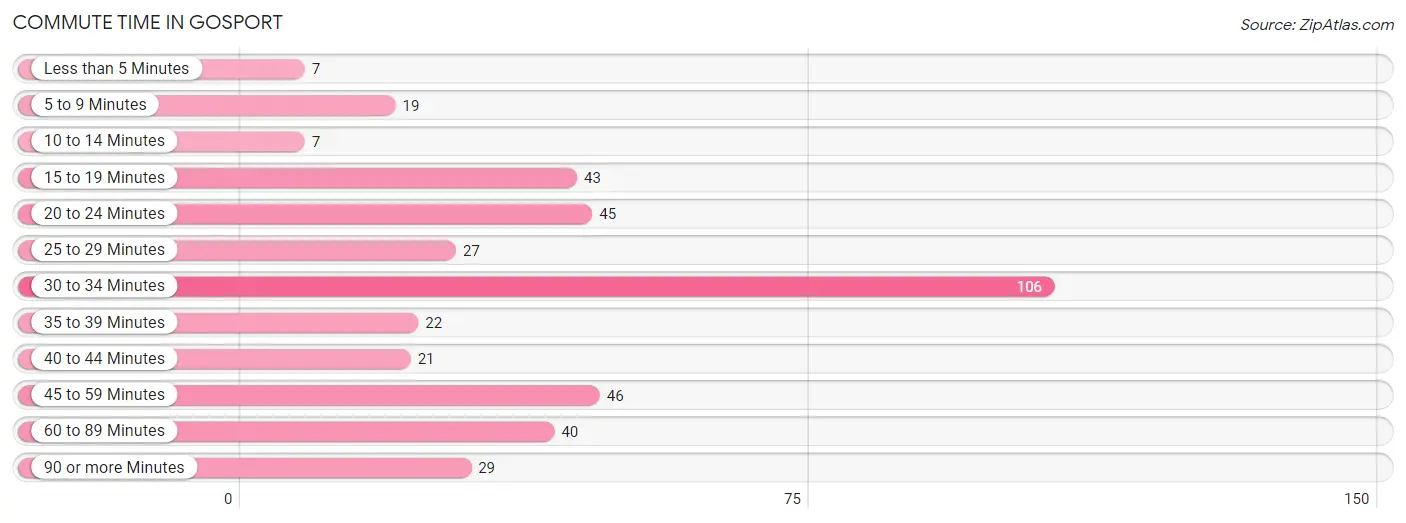
| Commute Time | # Commuters | % Commuters |
| Less than 5 Minutes | 7 | 1.7% |
| 5 to 9 Minutes | 19 | 4.6% |
| 10 to 14 Minutes | 7 | 1.7% |
| 15 to 19 Minutes | 43 | 10.4% |
| 20 to 24 Minutes | 45 | 10.9% |
| 25 to 29 Minutes | 27 | 6.6% |
| 30 to 34 Minutes | 106 | 25.7% |
| 35 to 39 Minutes | 22 | 5.3% |
| 40 to 44 Minutes | 21 | 5.1% |
| 45 to 59 Minutes | 46 | 11.2% |
| 60 to 89 Minutes | 40 | 9.7% |
| 90 or more Minutes | 29 | 7.0% |
Commute Time by Sex in Gosport
The most common commute times in Gosport are 60 to 89 minutes (34 commuters, 17.9%) for males and 30 to 34 minutes (80 commuters, 36.0%) for females.
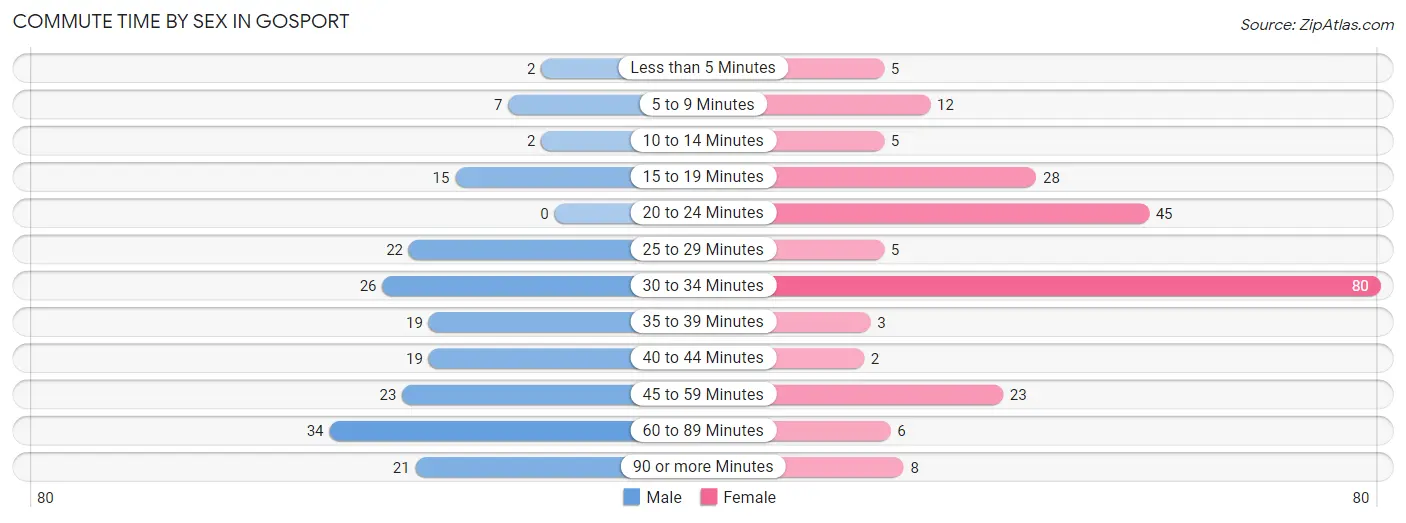
| Commute Time | Male | Female |
| Less than 5 Minutes | 2 (1.1%) | 5 (2.2%) |
| 5 to 9 Minutes | 7 (3.7%) | 12 (5.4%) |
| 10 to 14 Minutes | 2 (1.1%) | 5 (2.2%) |
| 15 to 19 Minutes | 15 (7.9%) | 28 (12.6%) |
| 20 to 24 Minutes | 0 (0.0%) | 45 (20.3%) |
| 25 to 29 Minutes | 22 (11.6%) | 5 (2.2%) |
| 30 to 34 Minutes | 26 (13.7%) | 80 (36.0%) |
| 35 to 39 Minutes | 19 (10.0%) | 3 (1.3%) |
| 40 to 44 Minutes | 19 (10.0%) | 2 (0.9%) |
| 45 to 59 Minutes | 23 (12.1%) | 23 (10.4%) |
| 60 to 89 Minutes | 34 (17.9%) | 6 (2.7%) |
| 90 or more Minutes | 21 (11.1%) | 8 (3.6%) |
Time of Departure to Work by Sex in Gosport
The most frequent times of departure to work in Gosport are 6:00 AM to 6:29 AM (35, 18.4%) for males and 7:00 AM to 7:29 AM (82, 36.9%) for females.
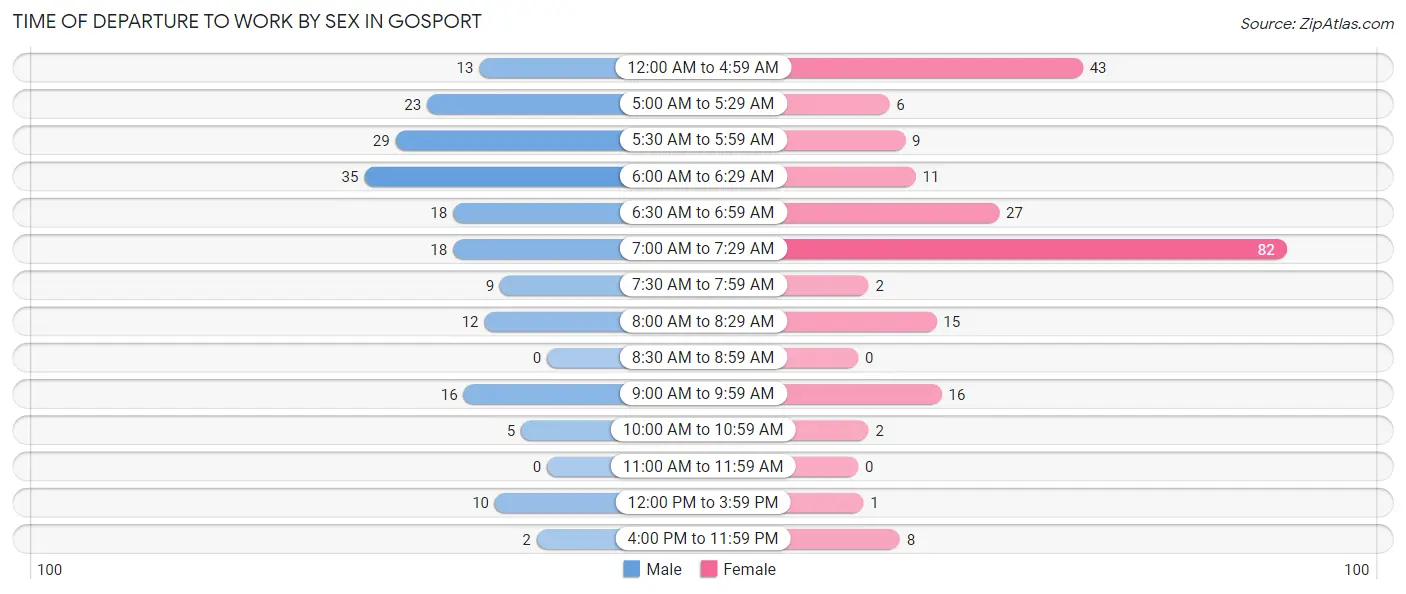
| Time of Departure | Male | Female |
| 12:00 AM to 4:59 AM | 13 (6.8%) | 43 (19.4%) |
| 5:00 AM to 5:29 AM | 23 (12.1%) | 6 (2.7%) |
| 5:30 AM to 5:59 AM | 29 (15.3%) | 9 (4.1%) |
| 6:00 AM to 6:29 AM | 35 (18.4%) | 11 (5.0%) |
| 6:30 AM to 6:59 AM | 18 (9.5%) | 27 (12.2%) |
| 7:00 AM to 7:29 AM | 18 (9.5%) | 82 (36.9%) |
| 7:30 AM to 7:59 AM | 9 (4.7%) | 2 (0.9%) |
| 8:00 AM to 8:29 AM | 12 (6.3%) | 15 (6.8%) |
| 8:30 AM to 8:59 AM | 0 (0.0%) | 0 (0.0%) |
| 9:00 AM to 9:59 AM | 16 (8.4%) | 16 (7.2%) |
| 10:00 AM to 10:59 AM | 5 (2.6%) | 2 (0.9%) |
| 11:00 AM to 11:59 AM | 0 (0.0%) | 0 (0.0%) |
| 12:00 PM to 3:59 PM | 10 (5.3%) | 1 (0.4%) |
| 4:00 PM to 11:59 PM | 2 (1.1%) | 8 (3.6%) |
| Total | 190 (100.0%) | 222 (100.0%) |
Housing Occupancy in Gosport
Occupancy by Ownership in Gosport
Of the total 345 dwellings in Gosport, owner-occupied units account for 191 (55.4%), while renter-occupied units make up 154 (44.6%).
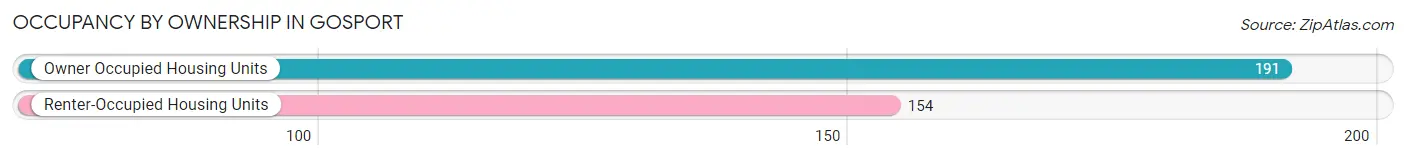
| Occupancy | # Housing Units | % Housing Units |
| Owner Occupied Housing Units | 191 | 55.4% |
| Renter-Occupied Housing Units | 154 | 44.6% |
| Total Occupied Housing Units | 345 | 100.0% |
Occupancy by Household Size in Gosport
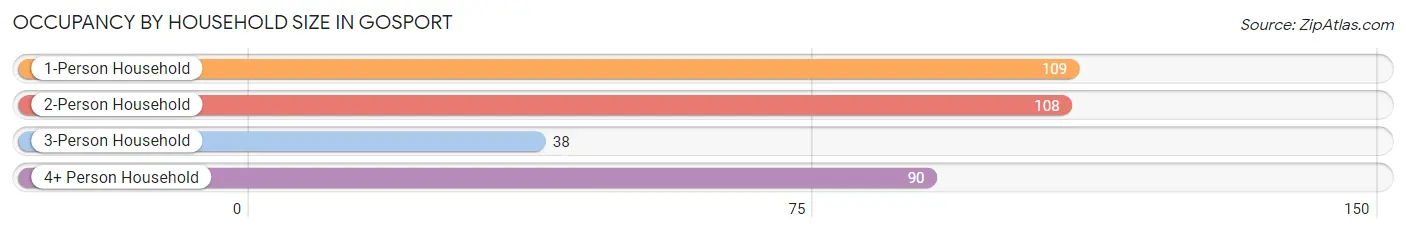
| Household Size | # Housing Units | % Housing Units |
| 1-Person Household | 109 | 31.6% |
| 2-Person Household | 108 | 31.3% |
| 3-Person Household | 38 | 11.0% |
| 4+ Person Household | 90 | 26.1% |
| Total Housing Units | 345 | 100.0% |
Occupancy by Ownership by Household Size in Gosport
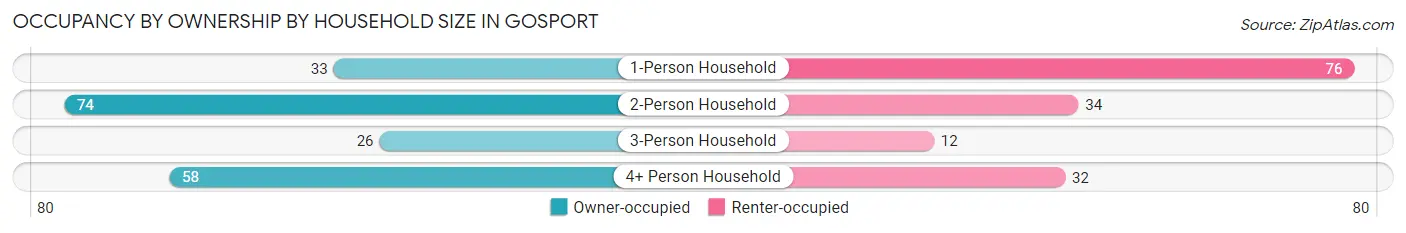
| Household Size | Owner-occupied | Renter-occupied |
| 1-Person Household | 33 (30.3%) | 76 (69.7%) |
| 2-Person Household | 74 (68.5%) | 34 (31.5%) |
| 3-Person Household | 26 (68.4%) | 12 (31.6%) |
| 4+ Person Household | 58 (64.4%) | 32 (35.6%) |
| Total Housing Units | 191 (55.4%) | 154 (44.6%) |
Occupancy by Educational Attainment in Gosport
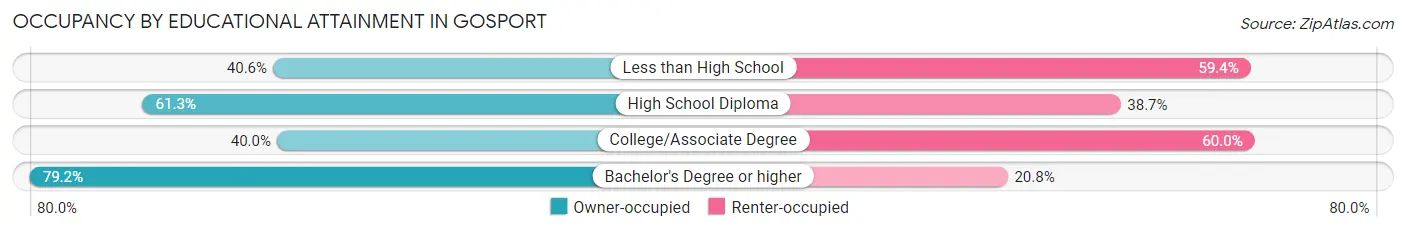
| Household Size | Owner-occupied | Renter-occupied |
| Less than High School | 13 (40.6%) | 19 (59.4%) |
| High School Diploma | 125 (61.3%) | 79 (38.7%) |
| College/Associate Degree | 34 (40.0%) | 51 (60.0%) |
| Bachelor's Degree or higher | 19 (79.2%) | 5 (20.8%) |
Occupancy by Age of Householder in Gosport
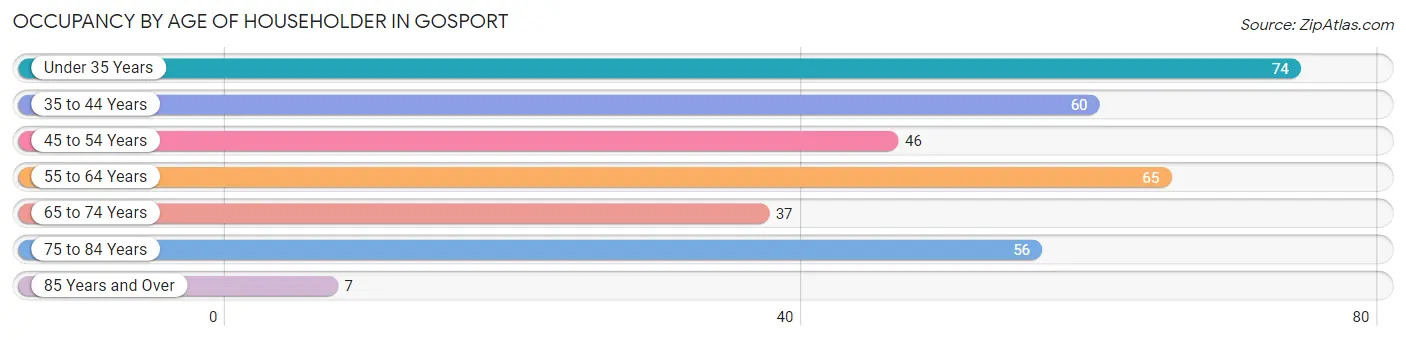
| Age Bracket | # Households | % Households |
| Under 35 Years | 74 | 21.4% |
| 35 to 44 Years | 60 | 17.4% |
| 45 to 54 Years | 46 | 13.3% |
| 55 to 64 Years | 65 | 18.8% |
| 65 to 74 Years | 37 | 10.7% |
| 75 to 84 Years | 56 | 16.2% |
| 85 Years and Over | 7 | 2.0% |
| Total | 345 | 100.0% |
Housing Finances in Gosport
Median Income by Occupancy in Gosport
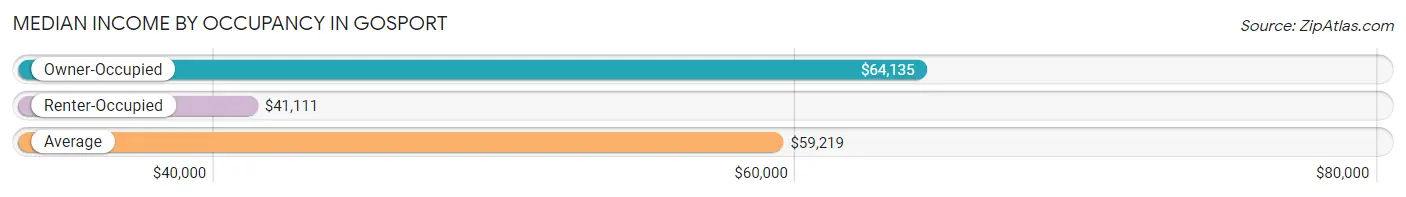
| Occupancy Type | # Households | Median Income |
| Owner-Occupied | 191 (55.4%) | $64,135 |
| Renter-Occupied | 154 (44.6%) | $41,111 |
| Average | 345 (100.0%) | $59,219 |
Occupancy by Householder Income Bracket in Gosport
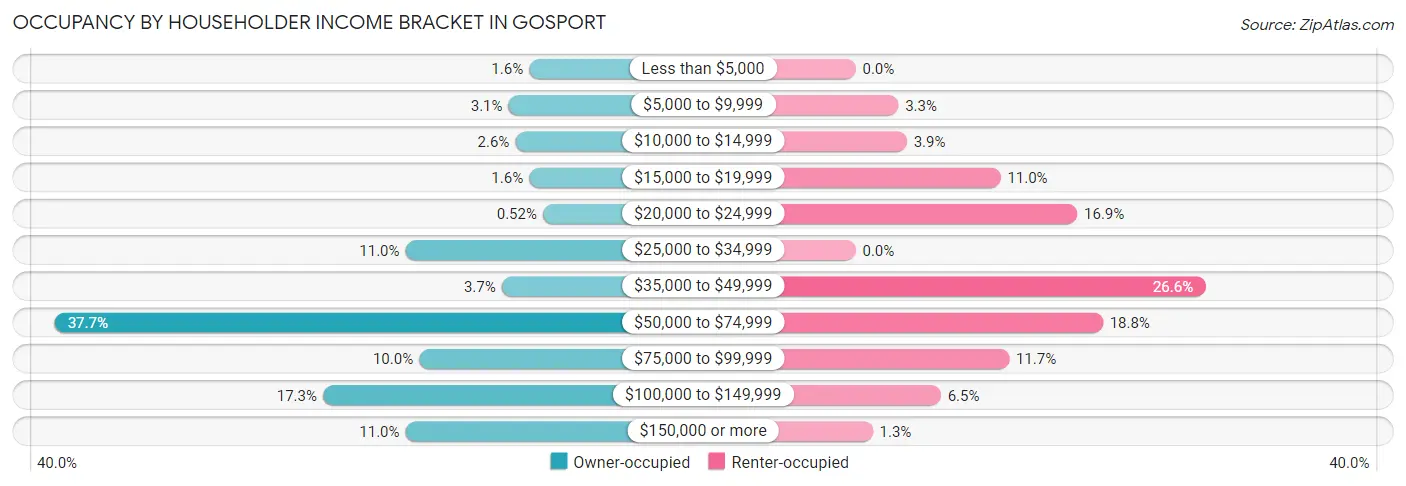
| Income Bracket | Owner-occupied | Renter-occupied |
| Less than $5,000 | 3 (1.6%) | 0 (0.0%) |
| $5,000 to $9,999 | 6 (3.1%) | 5 (3.3%) |
| $10,000 to $14,999 | 5 (2.6%) | 6 (3.9%) |
| $15,000 to $19,999 | 3 (1.6%) | 17 (11.0%) |
| $20,000 to $24,999 | 1 (0.5%) | 26 (16.9%) |
| $25,000 to $34,999 | 21 (11.0%) | 0 (0.0%) |
| $35,000 to $49,999 | 7 (3.7%) | 41 (26.6%) |
| $50,000 to $74,999 | 72 (37.7%) | 29 (18.8%) |
| $75,000 to $99,999 | 19 (10.0%) | 18 (11.7%) |
| $100,000 to $149,999 | 33 (17.3%) | 10 (6.5%) |
| $150,000 or more | 21 (11.0%) | 2 (1.3%) |
| Total | 191 (100.0%) | 154 (100.0%) |
Monthly Housing Cost Tiers in Gosport
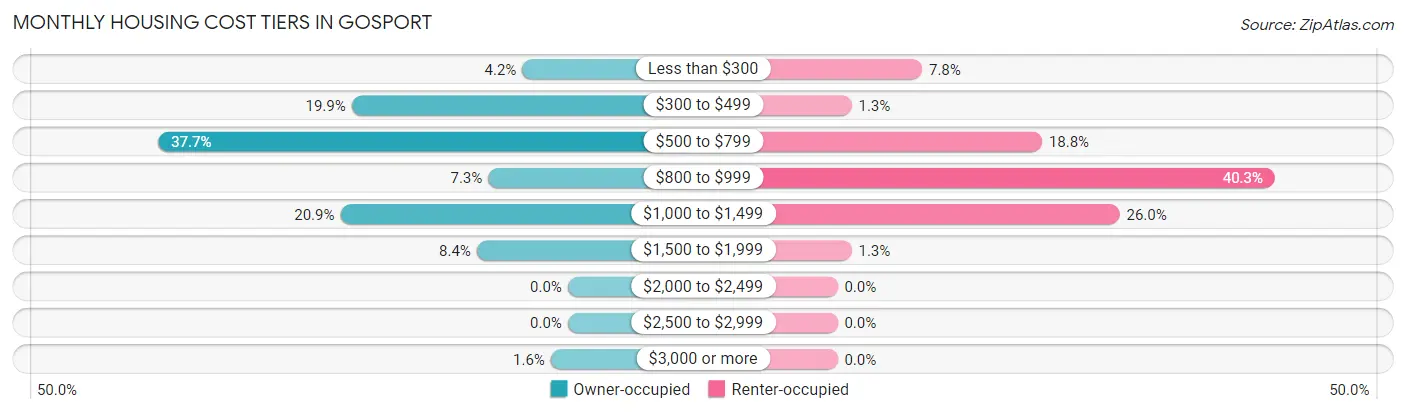
| Monthly Cost | Owner-occupied | Renter-occupied |
| Less than $300 | 8 (4.2%) | 12 (7.8%) |
| $300 to $499 | 38 (19.9%) | 2 (1.3%) |
| $500 to $799 | 72 (37.7%) | 29 (18.8%) |
| $800 to $999 | 14 (7.3%) | 62 (40.3%) |
| $1,000 to $1,499 | 40 (20.9%) | 40 (26.0%) |
| $1,500 to $1,999 | 16 (8.4%) | 2 (1.3%) |
| $2,000 to $2,499 | 0 (0.0%) | 0 (0.0%) |
| $2,500 to $2,999 | 0 (0.0%) | 0 (0.0%) |
| $3,000 or more | 3 (1.6%) | 0 (0.0%) |
| Total | 191 (100.0%) | 154 (100.0%) |
Physical Housing Characteristics in Gosport
Housing Structures in Gosport
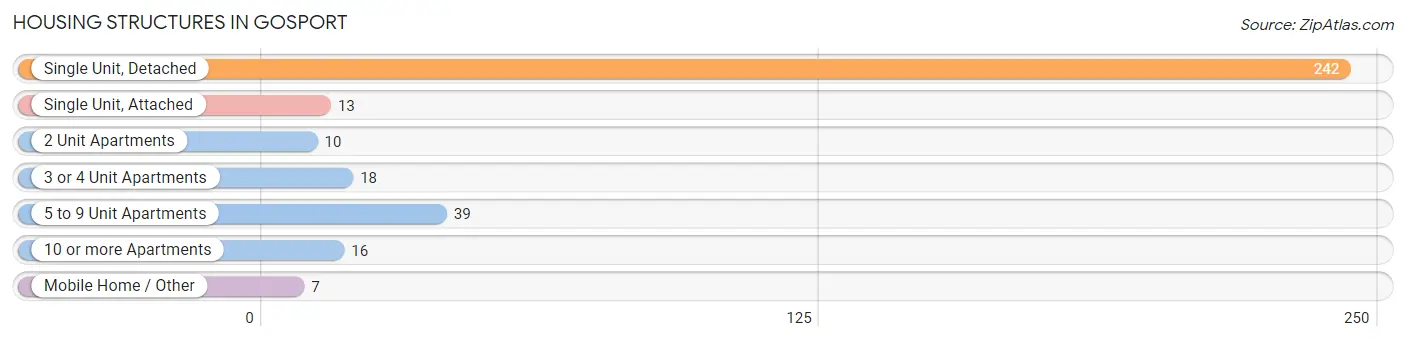
| Structure Type | # Housing Units | % Housing Units |
| Single Unit, Detached | 242 | 70.1% |
| Single Unit, Attached | 13 | 3.8% |
| 2 Unit Apartments | 10 | 2.9% |
| 3 or 4 Unit Apartments | 18 | 5.2% |
| 5 to 9 Unit Apartments | 39 | 11.3% |
| 10 or more Apartments | 16 | 4.6% |
| Mobile Home / Other | 7 | 2.0% |
| Total | 345 | 100.0% |
Housing Structures by Occupancy in Gosport
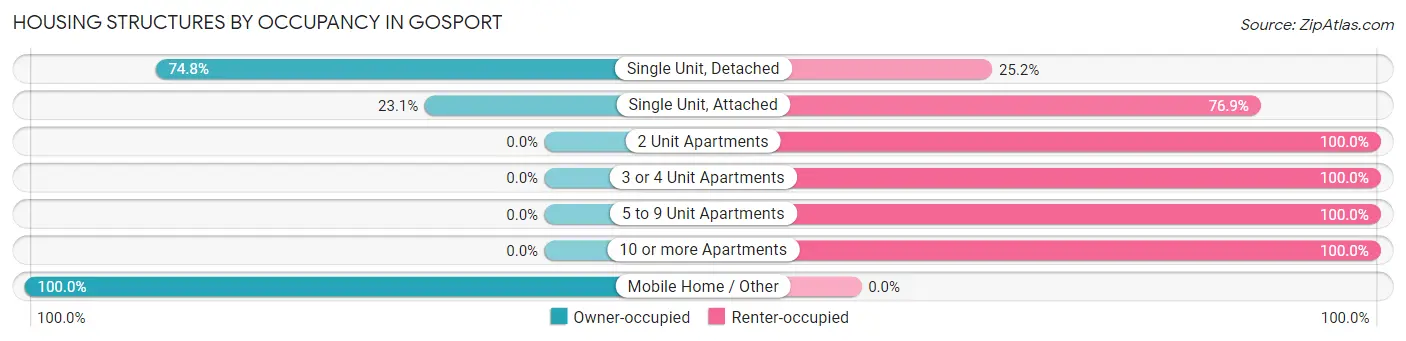
| Structure Type | Owner-occupied | Renter-occupied |
| Single Unit, Detached | 181 (74.8%) | 61 (25.2%) |
| Single Unit, Attached | 3 (23.1%) | 10 (76.9%) |
| 2 Unit Apartments | 0 (0.0%) | 10 (100.0%) |
| 3 or 4 Unit Apartments | 0 (0.0%) | 18 (100.0%) |
| 5 to 9 Unit Apartments | 0 (0.0%) | 39 (100.0%) |
| 10 or more Apartments | 0 (0.0%) | 16 (100.0%) |
| Mobile Home / Other | 7 (100.0%) | 0 (0.0%) |
| Total | 191 (55.4%) | 154 (44.6%) |
Housing Structures by Number of Rooms in Gosport
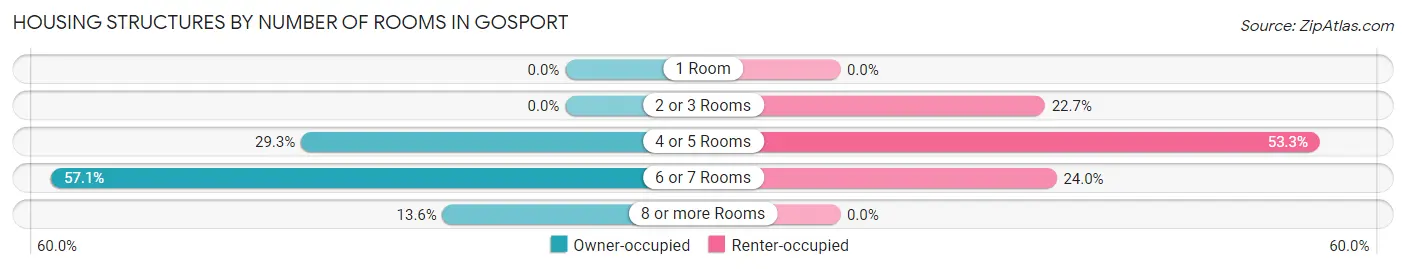
| Number of Rooms | Owner-occupied | Renter-occupied |
| 1 Room | 0 (0.0%) | 0 (0.0%) |
| 2 or 3 Rooms | 0 (0.0%) | 35 (22.7%) |
| 4 or 5 Rooms | 56 (29.3%) | 82 (53.2%) |
| 6 or 7 Rooms | 109 (57.1%) | 37 (24.0%) |
| 8 or more Rooms | 26 (13.6%) | 0 (0.0%) |
| Total | 191 (100.0%) | 154 (100.0%) |
Housing Structure by Heating Type in Gosport
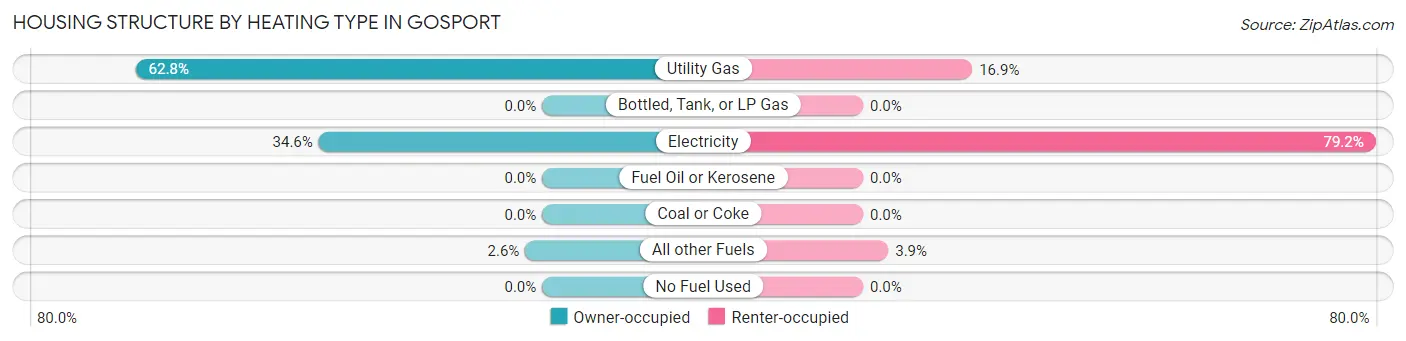
| Heating Type | Owner-occupied | Renter-occupied |
| Utility Gas | 120 (62.8%) | 26 (16.9%) |
| Bottled, Tank, or LP Gas | 0 (0.0%) | 0 (0.0%) |
| Electricity | 66 (34.5%) | 122 (79.2%) |
| Fuel Oil or Kerosene | 0 (0.0%) | 0 (0.0%) |
| Coal or Coke | 0 (0.0%) | 0 (0.0%) |
| All other Fuels | 5 (2.6%) | 6 (3.9%) |
| No Fuel Used | 0 (0.0%) | 0 (0.0%) |
| Total | 191 (100.0%) | 154 (100.0%) |
Household Vehicle Usage in Gosport
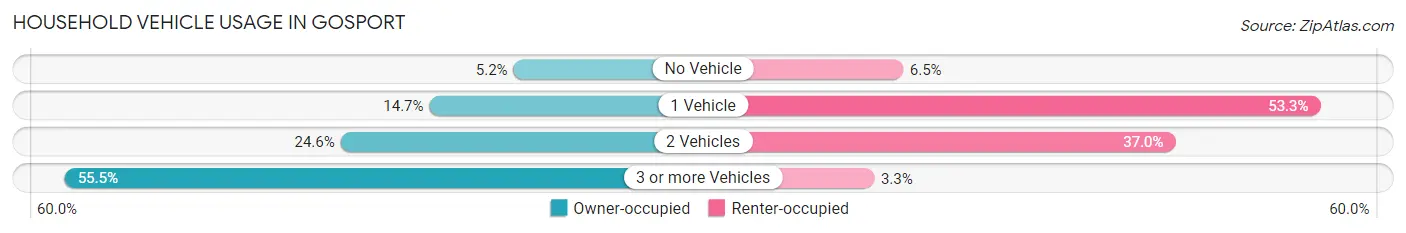
| Vehicles per Household | Owner-occupied | Renter-occupied |
| No Vehicle | 10 (5.2%) | 10 (6.5%) |
| 1 Vehicle | 28 (14.7%) | 82 (53.2%) |
| 2 Vehicles | 47 (24.6%) | 57 (37.0%) |
| 3 or more Vehicles | 106 (55.5%) | 5 (3.3%) |
| Total | 191 (100.0%) | 154 (100.0%) |
Real Estate & Mortgages in Gosport
Real Estate and Mortgage Overview in Gosport
| Characteristic | Without Mortgage | With Mortgage |
| Housing Units | 77 | 114 |
| Median Property Value | $119,800 | $96,200 |
| Median Household Income | $65,781 | $3 |
| Monthly Housing Costs | $461 | $3 |
| Real Estate Taxes | $1,050 | $0 |
Property Value by Mortgage Status in Gosport
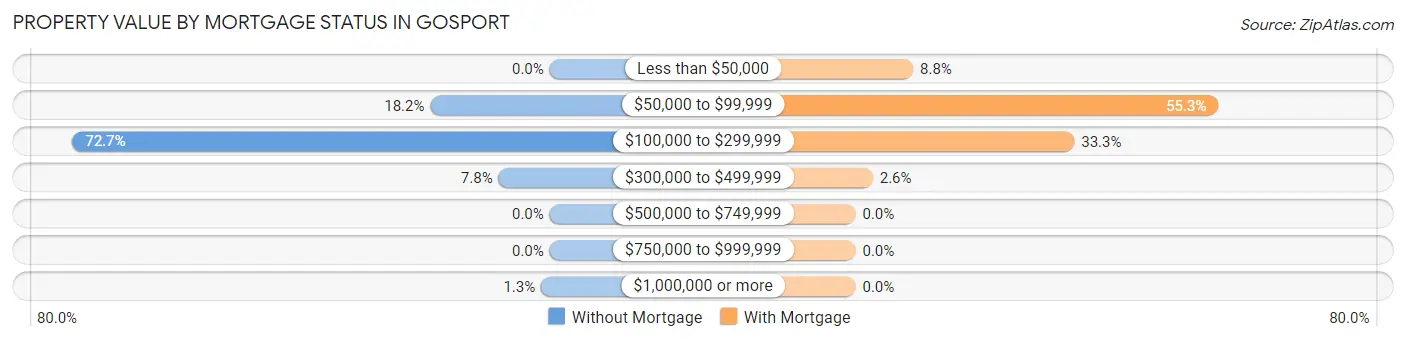
| Property Value | Without Mortgage | With Mortgage |
| Less than $50,000 | 0 (0.0%) | 10 (8.8%) |
| $50,000 to $99,999 | 14 (18.2%) | 63 (55.3%) |
| $100,000 to $299,999 | 56 (72.7%) | 38 (33.3%) |
| $300,000 to $499,999 | 6 (7.8%) | 3 (2.6%) |
| $500,000 to $749,999 | 0 (0.0%) | 0 (0.0%) |
| $750,000 to $999,999 | 0 (0.0%) | 0 (0.0%) |
| $1,000,000 or more | 1 (1.3%) | 0 (0.0%) |
| Total | 77 (100.0%) | 114 (100.0%) |
Household Income by Mortgage Status in Gosport
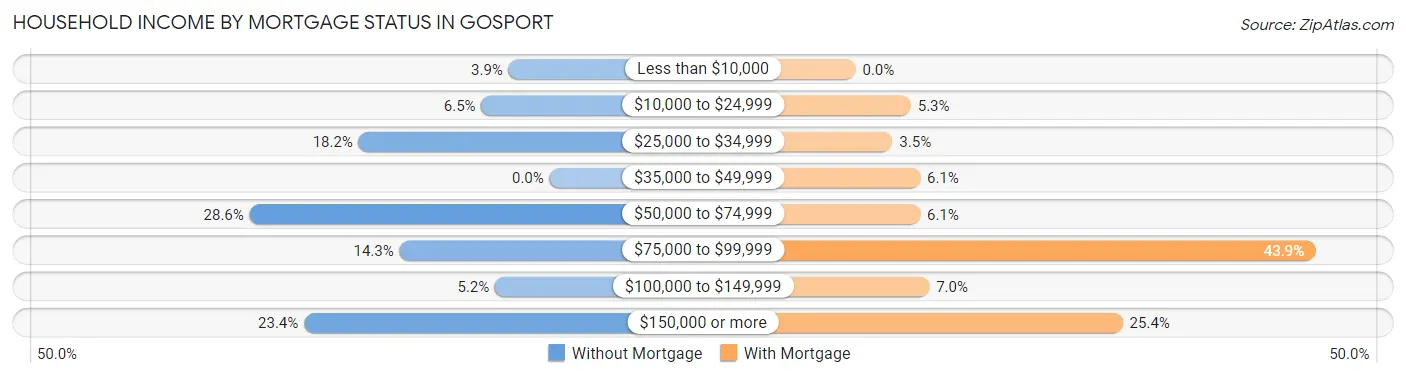
| Household Income | Without Mortgage | With Mortgage |
| Less than $10,000 | 3 (3.9%) | 0 (0.0%) |
| $10,000 to $24,999 | 5 (6.5%) | 6 (5.3%) |
| $25,000 to $34,999 | 14 (18.2%) | 4 (3.5%) |
| $35,000 to $49,999 | 0 (0.0%) | 7 (6.1%) |
| $50,000 to $74,999 | 22 (28.6%) | 7 (6.1%) |
| $75,000 to $99,999 | 11 (14.3%) | 50 (43.9%) |
| $100,000 to $149,999 | 4 (5.2%) | 8 (7.0%) |
| $150,000 or more | 18 (23.4%) | 29 (25.4%) |
| Total | 77 (100.0%) | 114 (100.0%) |
Property Value to Household Income Ratio in Gosport
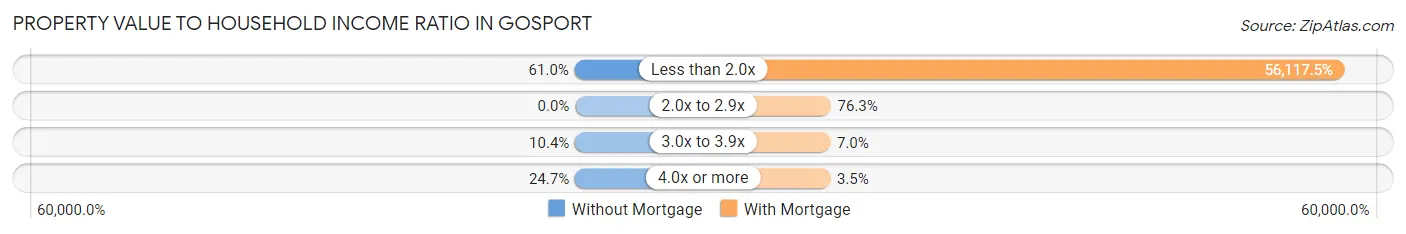
| Value-to-Income Ratio | Without Mortgage | With Mortgage |
| Less than 2.0x | 47 (61.0%) | 63,974 (56,117.5%) |
| 2.0x to 2.9x | 0 (0.0%) | 87 (76.3%) |
| 3.0x to 3.9x | 8 (10.4%) | 8 (7.0%) |
| 4.0x or more | 19 (24.7%) | 4 (3.5%) |
| Total | 77 (100.0%) | 114 (100.0%) |
Real Estate Taxes by Mortgage Status in Gosport
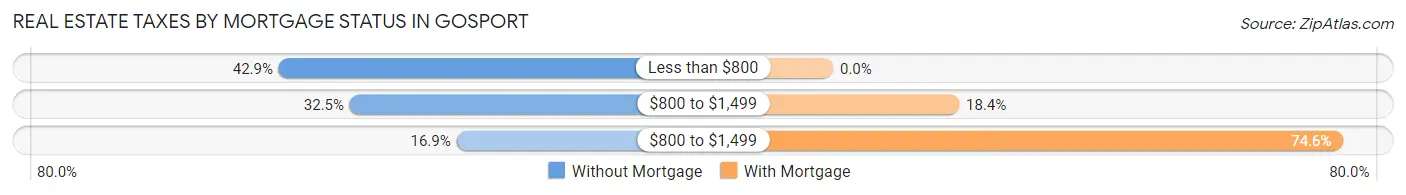
| Property Taxes | Without Mortgage | With Mortgage |
| Less than $800 | 33 (42.9%) | 0 (0.0%) |
| $800 to $1,499 | 25 (32.5%) | 21 (18.4%) |
| $800 to $1,499 | 13 (16.9%) | 85 (74.6%) |
| Total | 77 (100.0%) | 114 (100.0%) |
Health & Disability in Gosport
Health Insurance Coverage by Age in Gosport
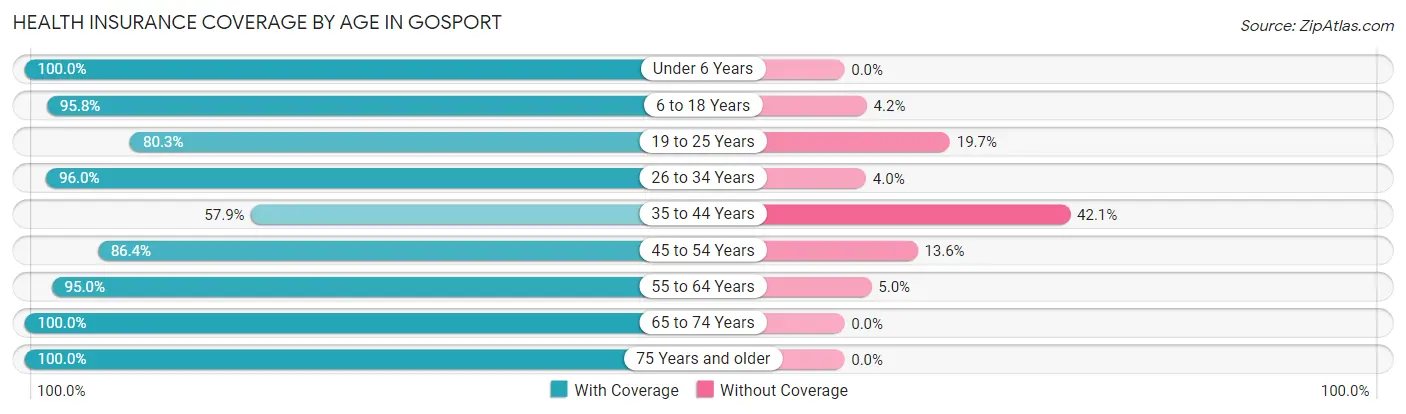
| Age Bracket | With Coverage | Without Coverage |
| Under 6 Years | 68 (100.0%) | 0 (0.0%) |
| 6 to 18 Years | 138 (95.8%) | 6 (4.2%) |
| 19 to 25 Years | 49 (80.3%) | 12 (19.7%) |
| 26 to 34 Years | 119 (96.0%) | 5 (4.0%) |
| 35 to 44 Years | 44 (57.9%) | 32 (42.1%) |
| 45 to 54 Years | 114 (86.4%) | 18 (13.6%) |
| 55 to 64 Years | 245 (95.0%) | 13 (5.0%) |
| 65 to 74 Years | 48 (100.0%) | 0 (0.0%) |
| 75 Years and older | 87 (100.0%) | 0 (0.0%) |
| Total | 912 (91.4%) | 86 (8.6%) |
Health Insurance Coverage by Citizenship Status in Gosport
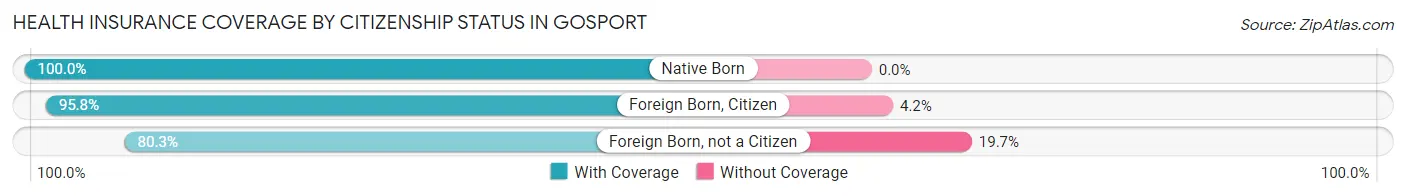
| Citizenship Status | With Coverage | Without Coverage |
| Native Born | 68 (100.0%) | 0 (0.0%) |
| Foreign Born, Citizen | 138 (95.8%) | 6 (4.2%) |
| Foreign Born, not a Citizen | 49 (80.3%) | 12 (19.7%) |
Health Insurance Coverage by Household Income in Gosport
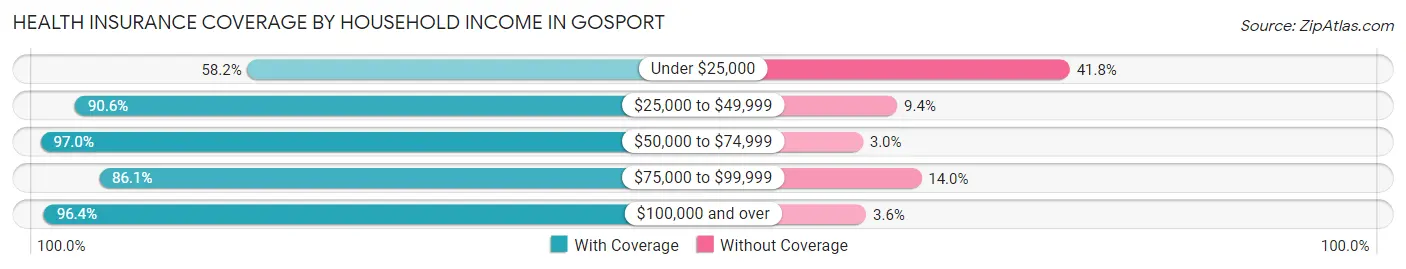
| Household Income | With Coverage | Without Coverage |
| Under $25,000 | 53 (58.2%) | 38 (41.8%) |
| $25,000 to $49,999 | 144 (90.6%) | 15 (9.4%) |
| $50,000 to $74,999 | 454 (97.0%) | 14 (3.0%) |
| $75,000 to $99,999 | 74 (86.1%) | 12 (14.0%) |
| $100,000 and over | 187 (96.4%) | 7 (3.6%) |
Public vs Private Health Insurance Coverage by Age in Gosport
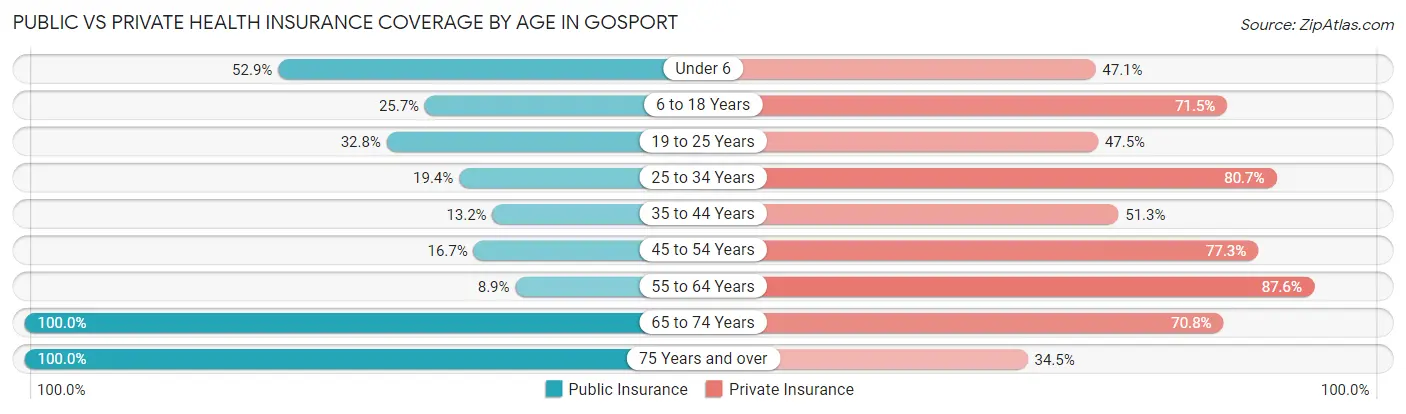
| Age Bracket | Public Insurance | Private Insurance |
| Under 6 | 36 (52.9%) | 32 (47.1%) |
| 6 to 18 Years | 37 (25.7%) | 103 (71.5%) |
| 19 to 25 Years | 20 (32.8%) | 29 (47.5%) |
| 25 to 34 Years | 24 (19.4%) | 100 (80.6%) |
| 35 to 44 Years | 10 (13.2%) | 39 (51.3%) |
| 45 to 54 Years | 22 (16.7%) | 102 (77.3%) |
| 55 to 64 Years | 23 (8.9%) | 226 (87.6%) |
| 65 to 74 Years | 48 (100.0%) | 34 (70.8%) |
| 75 Years and over | 87 (100.0%) | 30 (34.5%) |
| Total | 307 (30.8%) | 695 (69.6%) |
Disability Status by Sex by Age in Gosport
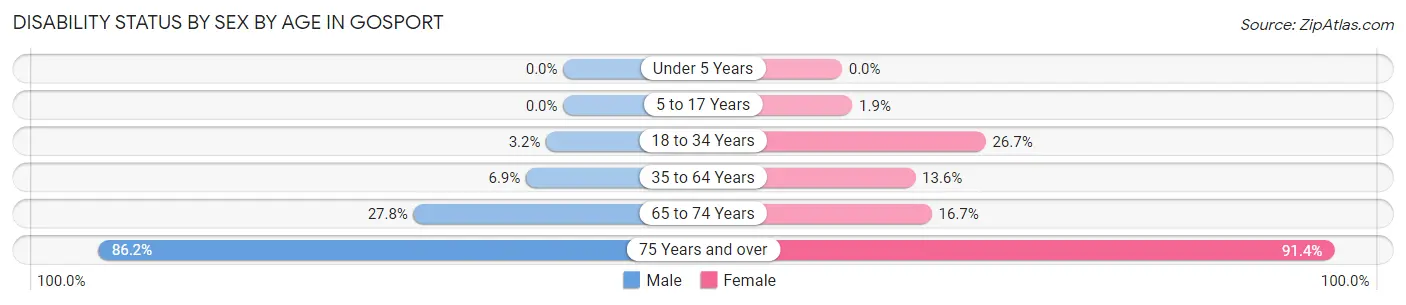
| Age Bracket | Male | Female |
| Under 5 Years | 0 (0.0%) | 0 (0.0%) |
| 5 to 17 Years | 0 (0.0%) | 1 (1.9%) |
| 18 to 34 Years | 3 (3.2%) | 24 (26.7%) |
| 35 to 64 Years | 19 (6.9%) | 26 (13.6%) |
| 65 to 74 Years | 10 (27.8%) | 2 (16.7%) |
| 75 Years and over | 25 (86.2%) | 53 (91.4%) |
Disability Class by Sex by Age in Gosport
Disability Class: Hearing Difficulty
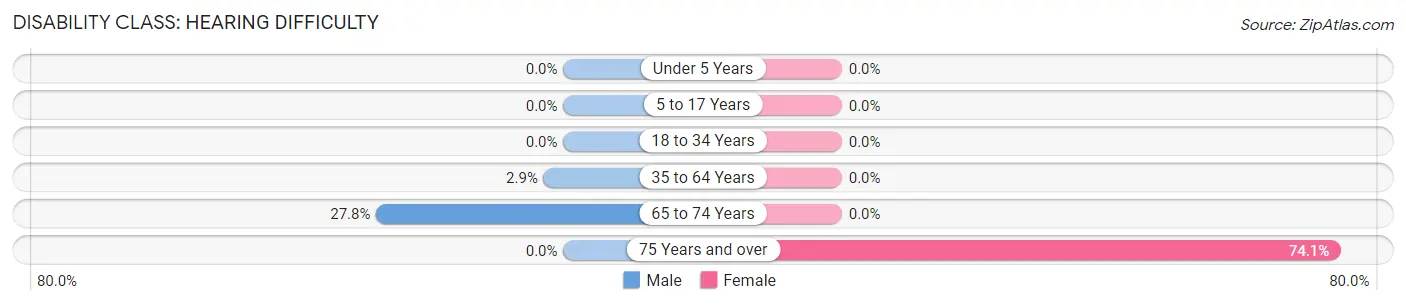
| Age Bracket | Male | Female |
| Under 5 Years | 0 (0.0%) | 0 (0.0%) |
| 5 to 17 Years | 0 (0.0%) | 0 (0.0%) |
| 18 to 34 Years | 0 (0.0%) | 0 (0.0%) |
| 35 to 64 Years | 8 (2.9%) | 0 (0.0%) |
| 65 to 74 Years | 10 (27.8%) | 0 (0.0%) |
| 75 Years and over | 0 (0.0%) | 43 (74.1%) |
Disability Class: Vision Difficulty
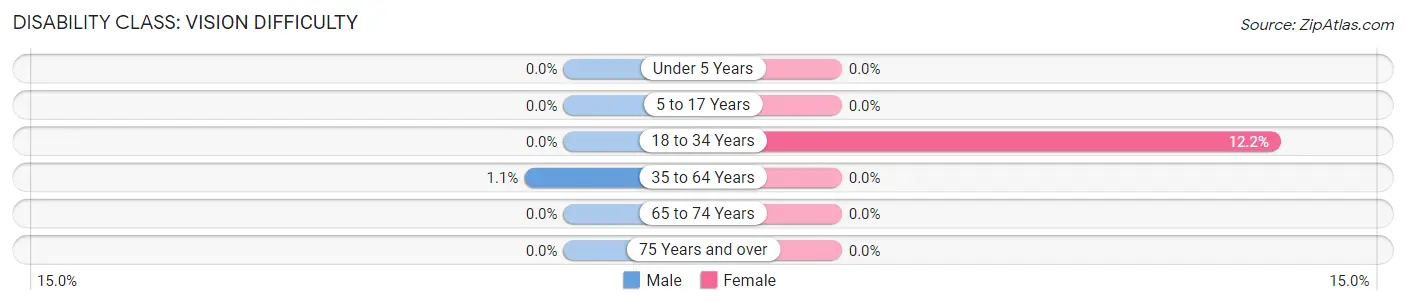
| Age Bracket | Male | Female |
| Under 5 Years | 0 (0.0%) | 0 (0.0%) |
| 5 to 17 Years | 0 (0.0%) | 0 (0.0%) |
| 18 to 34 Years | 0 (0.0%) | 11 (12.2%) |
| 35 to 64 Years | 3 (1.1%) | 0 (0.0%) |
| 65 to 74 Years | 0 (0.0%) | 0 (0.0%) |
| 75 Years and over | 0 (0.0%) | 0 (0.0%) |
Disability Class: Cognitive Difficulty
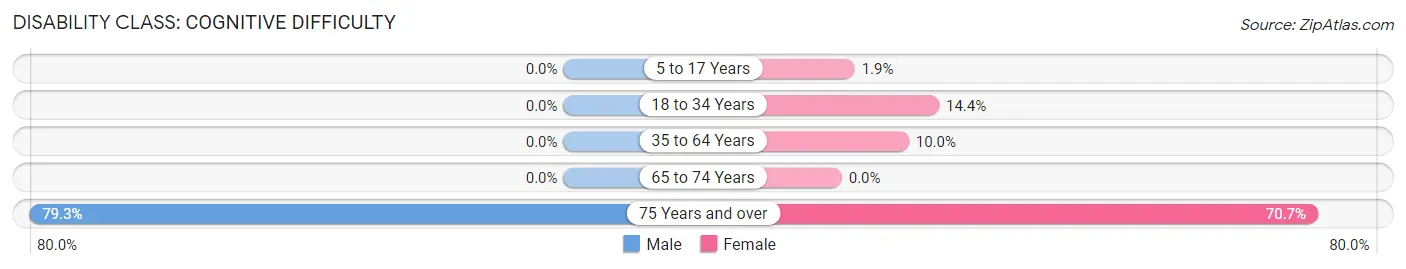
| Age Bracket | Male | Female |
| 5 to 17 Years | 0 (0.0%) | 1 (1.9%) |
| 18 to 34 Years | 0 (0.0%) | 13 (14.4%) |
| 35 to 64 Years | 0 (0.0%) | 19 (10.0%) |
| 65 to 74 Years | 0 (0.0%) | 0 (0.0%) |
| 75 Years and over | 23 (79.3%) | 41 (70.7%) |
Disability Class: Ambulatory Difficulty
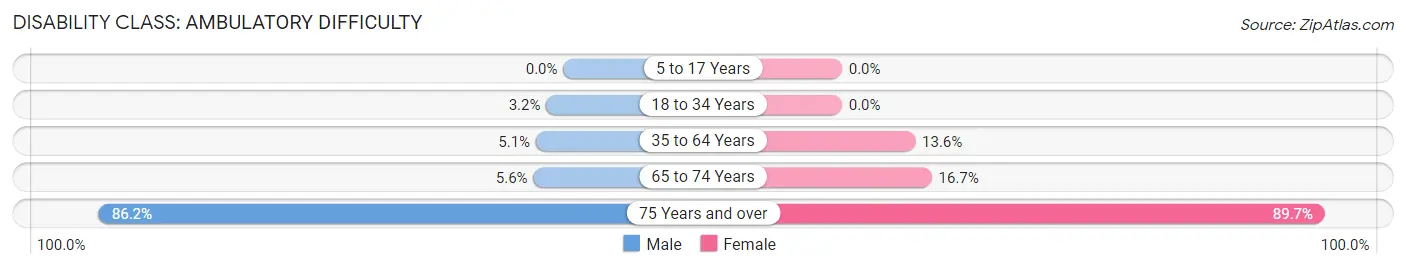
| Age Bracket | Male | Female |
| 5 to 17 Years | 0 (0.0%) | 0 (0.0%) |
| 18 to 34 Years | 3 (3.2%) | 0 (0.0%) |
| 35 to 64 Years | 14 (5.1%) | 26 (13.6%) |
| 65 to 74 Years | 2 (5.6%) | 2 (16.7%) |
| 75 Years and over | 25 (86.2%) | 52 (89.7%) |
Disability Class: Self-Care Difficulty
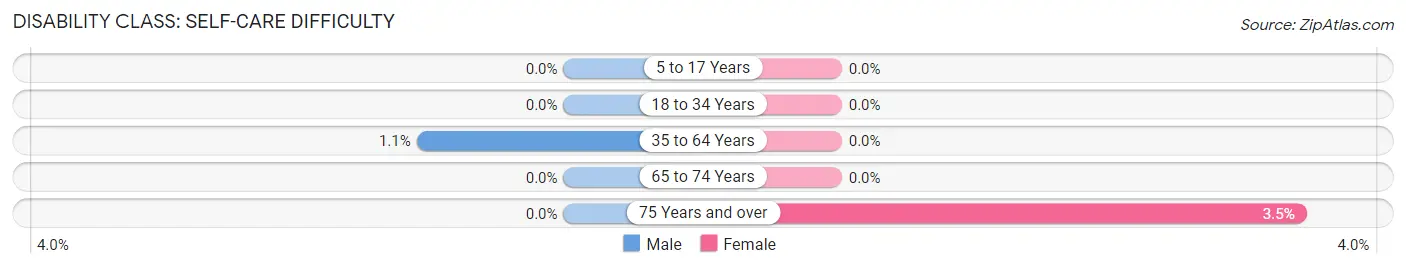
| Age Bracket | Male | Female |
| 5 to 17 Years | 0 (0.0%) | 0 (0.0%) |
| 18 to 34 Years | 0 (0.0%) | 0 (0.0%) |
| 35 to 64 Years | 3 (1.1%) | 0 (0.0%) |
| 65 to 74 Years | 0 (0.0%) | 0 (0.0%) |
| 75 Years and over | 0 (0.0%) | 2 (3.5%) |
Technology Access in Gosport
Computing Device Access in Gosport
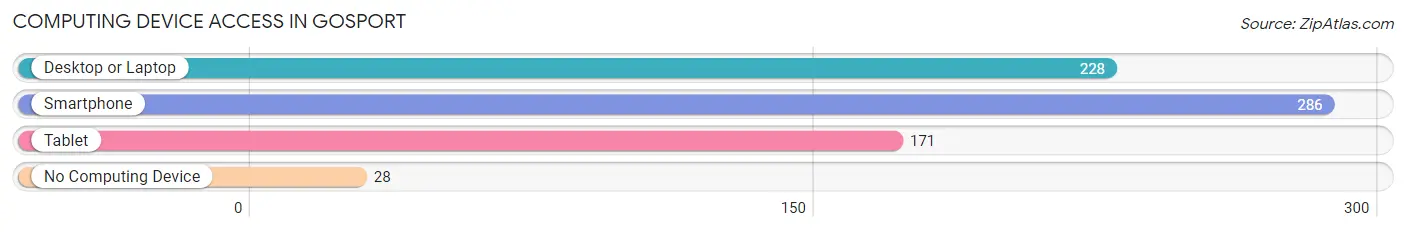
| Device Type | # Households | % Households |
| Desktop or Laptop | 228 | 66.1% |
| Smartphone | 286 | 82.9% |
| Tablet | 171 | 49.6% |
| No Computing Device | 28 | 8.1% |
| Total | 345 | 100.0% |
Internet Access in Gosport
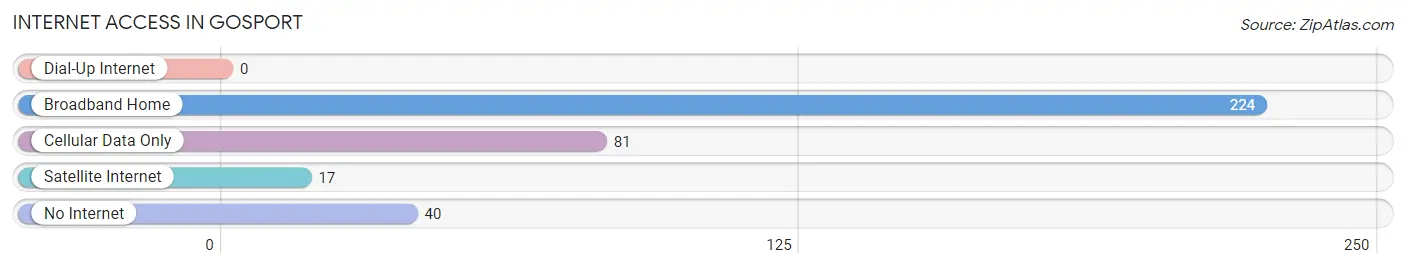
| Internet Type | # Households | % Households |
| Dial-Up Internet | 0 | 0.0% |
| Broadband Home | 224 | 64.9% |
| Cellular Data Only | 81 | 23.5% |
| Satellite Internet | 17 | 4.9% |
| No Internet | 40 | 11.6% |
| Total | 345 | 100.0% |
Gosport Summary
Gosport is a small town located in Owen County, Indiana, United States. It is situated in the western part of the state, approximately 40 miles southwest of Indianapolis. The town has a population of 1,717 people, according to the 2010 census.
Geography
Gosport is located at 39°25'25"N 86°37'45"W (39.423, -86.629). It is situated in the western part of Owen County, approximately 40 miles southwest of Indianapolis. The town is located on the banks of the White River, which flows through the town. The town is surrounded by rolling hills and farmland.
History
Gosport was founded in 1837 by William and Mary Gosport. The town was named after the Gosport family, who were among the first settlers in the area. The town was originally a small farming community, but it grew rapidly in the late 19th century due to the construction of the railroad. The railroad brought new industry and jobs to the area, and the town quickly became a bustling center of commerce.
In the early 20th century, Gosport was a popular tourist destination. The town was known for its beautiful scenery and its many outdoor activities, such as fishing, hunting, and camping. The town also had a thriving business district, with several stores, restaurants, and hotels.
Economy
Gosport’s economy is largely based on agriculture and tourism. The town is home to several farms, which produce a variety of crops, including corn, soybeans, and wheat. The town also has several tourist attractions, such as the White River State Park, which offers camping, fishing, and other outdoor activities.
Demographics
According to the 2010 census, Gosport has a population of 1,717 people. The town has a median household income of $41,944, and the median age is 41. The town is predominantly white (97.2%), with a small percentage of African Americans (1.2%) and Hispanics (1.1%).
Conclusion
Gosport is a small town located in Owen County, Indiana. It is situated in the western part of the state, approximately 40 miles southwest of Indianapolis. The town has a population of 1,717 people, according to the 2010 census. Gosport’s economy is largely based on agriculture and tourism, and the town is home to several farms and tourist attractions. The town is predominantly white, with a small percentage of African Americans and Hispanics.
Common Questions
What is Per Capita Income in Gosport?
Per Capita income in Gosport is $25,983.
What is the Median Family Income in Gosport?
Median Family Income in Gosport is $64,231.
What is the Median Household income in Gosport?
Median Household Income in Gosport is $59,219.
What is Income or Wage Gap in Gosport?
Income or Wage Gap in Gosport is 34.8%.
Women in Gosport earn 65.2 cents for every dollar earned by a man.
What is Inequality or Gini Index in Gosport?
Inequality or Gini Index in Gosport is 0.38.
What is the Total Population of Gosport?
Total Population of Gosport is 1,057.
What is the Total Male Population of Gosport?
Total Male Population of Gosport is 596.
What is the Total Female Population of Gosport?
Total Female Population of Gosport is 461.
What is the Ratio of Males per 100 Females in Gosport?
There are 129.28 Males per 100 Females in Gosport.
What is the Ratio of Females per 100 Males in Gosport?
There are 77.35 Females per 100 Males in Gosport.
What is the Median Population Age in Gosport?
Median Population Age in Gosport is 49.2 Years.
What is the Average Family Size in Gosport
Average Family Size in Gosport is 3.8 People.
What is the Average Household Size in Gosport
Average Household Size in Gosport is 2.9 People.
How Large is the Labor Force in Gosport?
There are 451 People in the Labor Forcein in Gosport.
What is the Percentage of People in the Labor Force in Gosport?
52.9% of People are in the Labor Force in Gosport.
What is the Unemployment Rate in Gosport?
Unemployment Rate in Gosport is 5.5%.