Lake Station, IN Map & Demographics
Lake Station Map
Lake Station Overview
$24,258
PER CAPITA INCOME
$61,728
AVG FAMILY INCOME
$53,588
AVG HOUSEHOLD INCOME
37.7%
WAGE / INCOME GAP [ % ]
62.3¢/ $1
WAGE / INCOME GAP [ $ ]
$16,100
FAMILY INCOME DEFICIT
0.42
INEQUALITY / GINI INDEX
13,352
TOTAL POPULATION
6,557
MALE POPULATION
6,795
FEMALE POPULATION
96.50
MALES / 100 FEMALES
103.63
FEMALES / 100 MALES
32.6
MEDIAN AGE
3.2
AVG FAMILY SIZE
2.7
AVG HOUSEHOLD SIZE
6,258
LABOR FORCE [ PEOPLE ]
61.6%
PERCENT IN LABOR FORCE
18.2%
UNEMPLOYMENT RATE
Lake Station Zip Codes
Lake Station Area Codes
Income in Lake Station
Income Overview in Lake Station
Per Capita Income in Lake Station is $24,258, while median incomes of families and households are $61,728 and $53,588 respectively.
| Characteristic | Number | Measure |
| Per Capita Income | 13,352 | $24,258 |
| Median Family Income | 3,324 | $61,728 |
| Mean Family Income | 3,324 | $71,642 |
| Median Household Income | 4,888 | $53,588 |
| Mean Household Income | 4,888 | $64,271 |
| Income Deficit | 3,324 | $16,100 |
| Wage / Income Gap (%) | 13,352 | 37.67% |
| Wage / Income Gap ($) | 13,352 | 62.33¢ per $1 |
| Gini / Inequality Index | 13,352 | 0.42 |
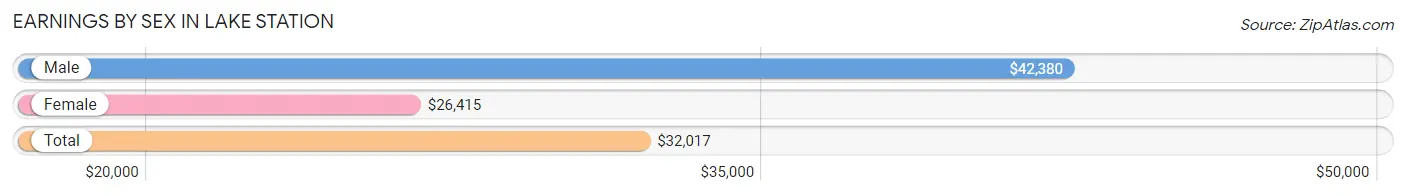
Earnings by Sex in Lake Station
Average Earnings in Lake Station are $32,017, $42,380 for men and $26,415 for women, a difference of 37.7%.
| Sex | Number | Average Earnings |
| Male | 3,277 (51.5%) | $42,380 |
| Female | 3,082 (48.5%) | $26,415 |
| Total | 6,359 (100.0%) | $32,017 |
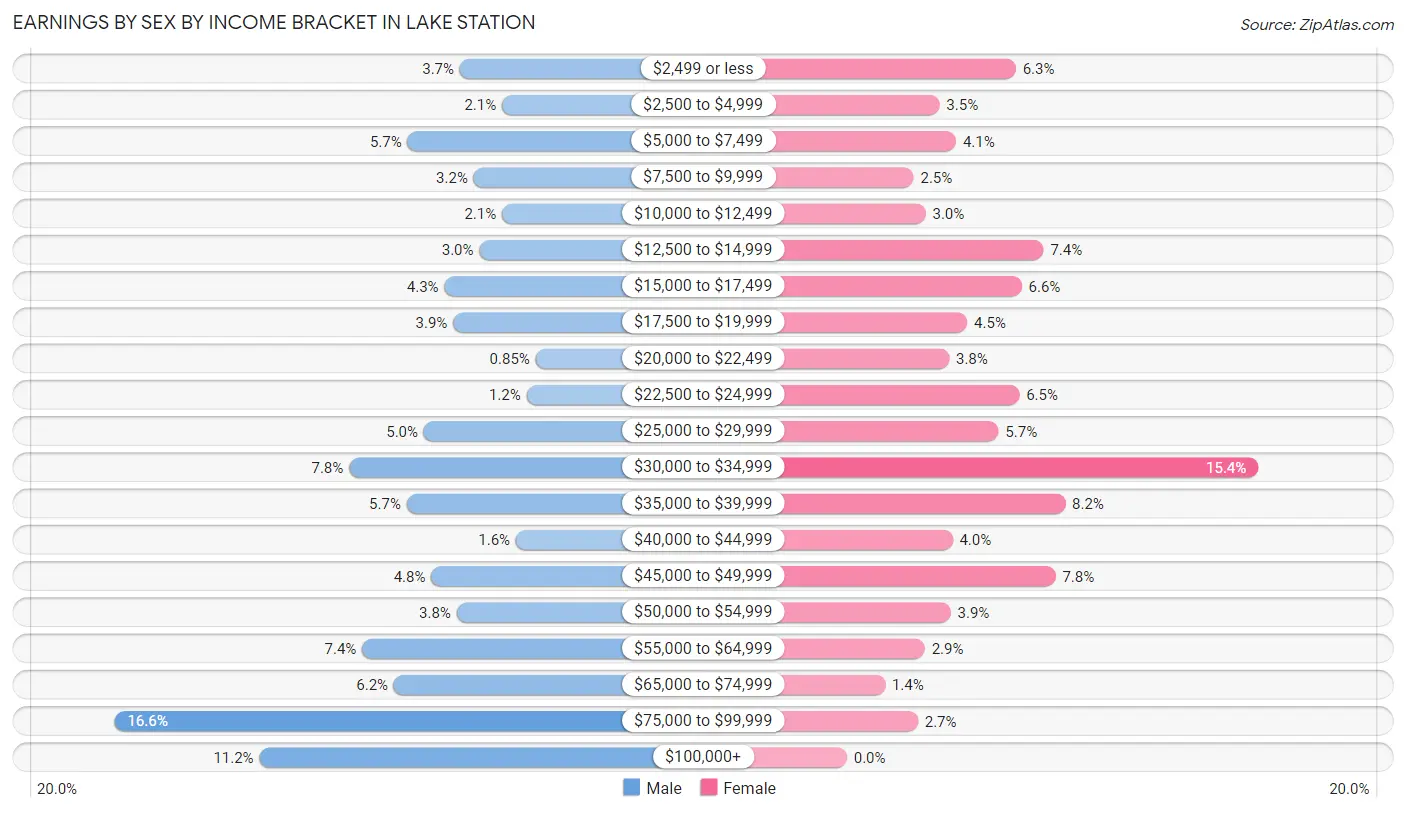
Earnings by Sex by Income Bracket in Lake Station
The most common earnings brackets in Lake Station are $75,000 to $99,999 for men (545 | 16.6%) and $30,000 to $34,999 for women (475 | 15.4%).
| Income | Male | Female |
| $2,499 or less | 121 (3.7%) | 195 (6.3%) |
| $2,500 to $4,999 | 69 (2.1%) | 107 (3.5%) |
| $5,000 to $7,499 | 185 (5.7%) | 126 (4.1%) |
| $7,500 to $9,999 | 104 (3.2%) | 77 (2.5%) |
| $10,000 to $12,499 | 69 (2.1%) | 91 (2.9%) |
| $12,500 to $14,999 | 97 (3.0%) | 227 (7.4%) |
| $15,000 to $17,499 | 140 (4.3%) | 202 (6.6%) |
| $17,500 to $19,999 | 129 (3.9%) | 139 (4.5%) |
| $20,000 to $22,499 | 28 (0.9%) | 118 (3.8%) |
| $22,500 to $24,999 | 39 (1.2%) | 199 (6.5%) |
| $25,000 to $29,999 | 165 (5.0%) | 175 (5.7%) |
| $30,000 to $34,999 | 257 (7.8%) | 475 (15.4%) |
| $35,000 to $39,999 | 186 (5.7%) | 252 (8.2%) |
| $40,000 to $44,999 | 52 (1.6%) | 122 (4.0%) |
| $45,000 to $49,999 | 156 (4.8%) | 241 (7.8%) |
| $50,000 to $54,999 | 125 (3.8%) | 120 (3.9%) |
| $55,000 to $64,999 | 241 (7.3%) | 90 (2.9%) |
| $65,000 to $74,999 | 202 (6.2%) | 44 (1.4%) |
| $75,000 to $99,999 | 545 (16.6%) | 82 (2.7%) |
| $100,000+ | 367 (11.2%) | 0 (0.0%) |
| Total | 3,277 (100.0%) | 3,082 (100.0%) |
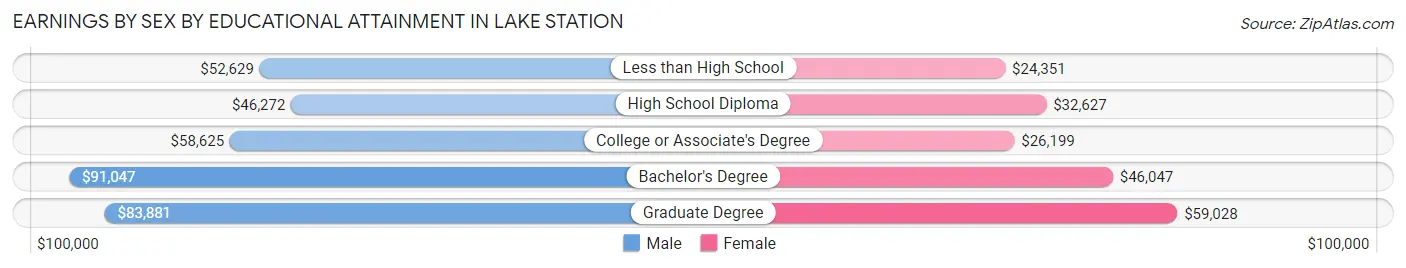
Earnings by Sex by Educational Attainment in Lake Station
Average earnings in Lake Station are $54,013 for men and $31,362 for women, a difference of 41.9%. Men with an educational attainment of bachelor's degree enjoy the highest average annual earnings of $91,047, while those with high school diploma education earn the least with $46,272. Women with an educational attainment of graduate degree earn the most with the average annual earnings of $59,028, while those with less than high school education have the smallest earnings of $24,351.
| Educational Attainment | Male Income | Female Income |
| Less than High School | $52,629 | $24,351 |
| High School Diploma | $46,272 | $32,627 |
| College or Associate's Degree | $58,625 | $26,199 |
| Bachelor's Degree | $91,047 | $46,047 |
| Graduate Degree | $83,881 | $59,028 |
| Total | $54,013 | $31,362 |
Family Income in Lake Station
Family Income Brackets in Lake Station
According to the Lake Station family income data, there are 751 families falling into the $50,000 to $74,999 income range, which is the most common income bracket and makes up 22.6% of all families. Conversely, the $200,000+ income bracket is the least frequent group with only 37 families (1.1%) belonging to this category.
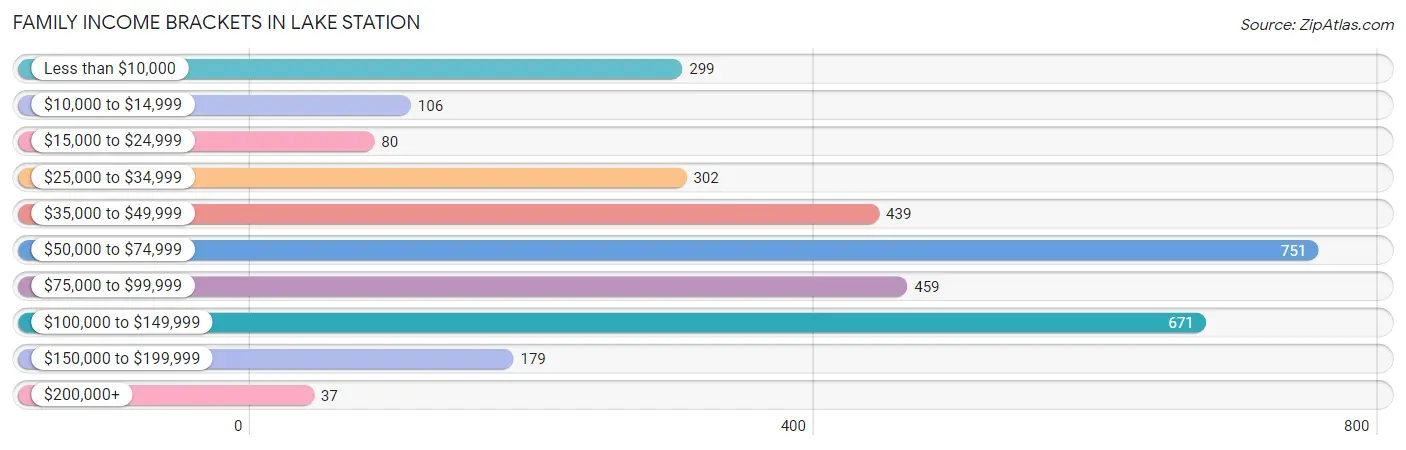
| Income Bracket | # Families | % Families |
| Less than $10,000 | 299 | 9.0% |
| $10,000 to $14,999 | 106 | 3.2% |
| $15,000 to $24,999 | 80 | 2.4% |
| $25,000 to $34,999 | 302 | 9.1% |
| $35,000 to $49,999 | 439 | 13.2% |
| $50,000 to $74,999 | 751 | 22.6% |
| $75,000 to $99,999 | 459 | 13.8% |
| $100,000 to $149,999 | 671 | 20.2% |
| $150,000 to $199,999 | 179 | 5.4% |
| $200,000+ | 37 | 1.1% |
Family Income by Famaliy Size in Lake Station
5-person families (169 | 5.1%) account for the highest median family income in Lake Station with $65,772 per family, while 2-person families (1,512 | 45.5%) have the highest median income of $30,660 per family member.
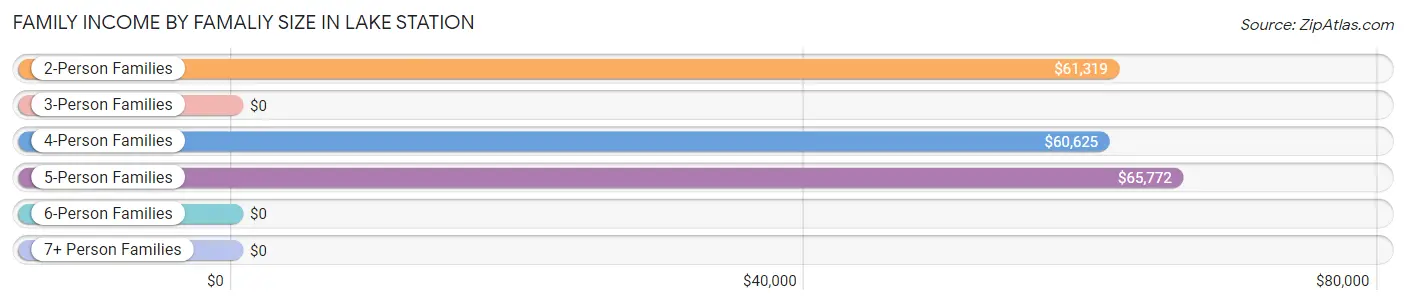
| Income Bracket | # Families | Median Income |
| 2-Person Families | 1,512 (45.5%) | $61,319 |
| 3-Person Families | 811 (24.4%) | $0 |
| 4-Person Families | 628 (18.9%) | $60,625 |
| 5-Person Families | 169 (5.1%) | $65,772 |
| 6-Person Families | 202 (6.1%) | $0 |
| 7+ Person Families | 2 (0.1%) | $0 |
| Total | 3,324 (100.0%) | $61,728 |
Family Income by Number of Earners in Lake Station
The median family income in Lake Station is $61,728, with families comprising 3+ earners (310) having the highest median family income of $177,932, while families with no earners (642) have the lowest median family income of $30,682, accounting for 9.3% and 19.3% of families, respectively.
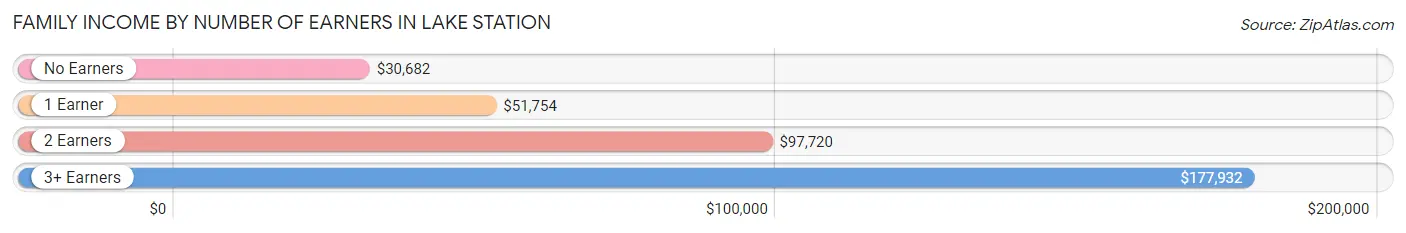
| Number of Earners | # Families | Median Income |
| No Earners | 642 (19.3%) | $30,682 |
| 1 Earner | 1,114 (33.5%) | $51,754 |
| 2 Earners | 1,258 (37.9%) | $97,720 |
| 3+ Earners | 310 (9.3%) | $177,932 |
| Total | 3,324 (100.0%) | $61,728 |
Household Income in Lake Station
Household Income Brackets in Lake Station
With 870 households falling in the category, the $50,000 to $74,999 income range is the most frequent in Lake Station, accounting for 17.8% of all households. In contrast, only 44 households (0.9%) fall into the $200,000+ income bracket, making it the least populous group.
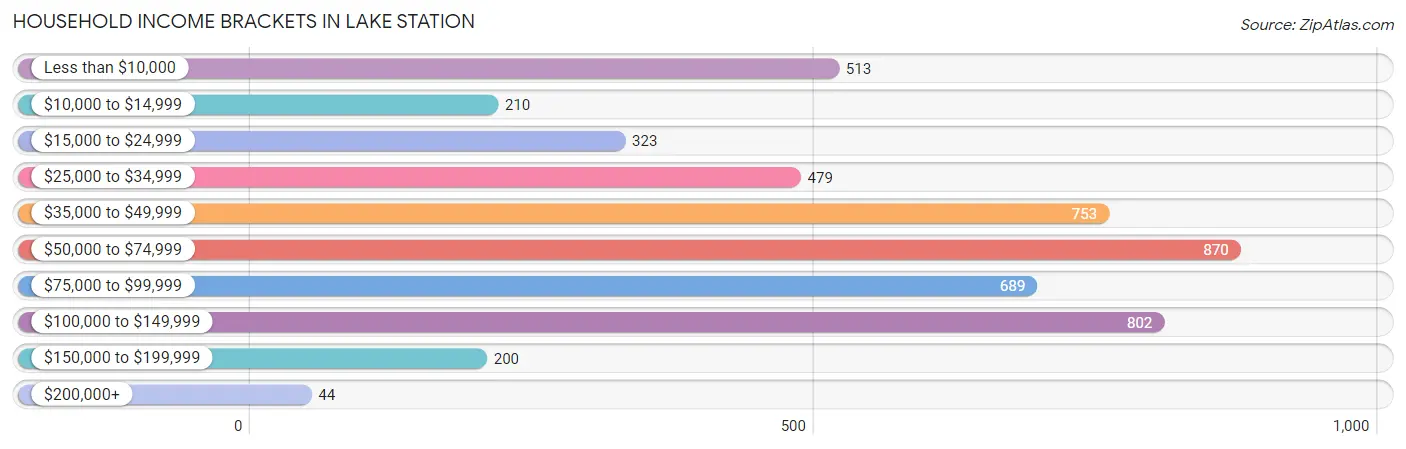
| Income Bracket | # Households | % Households |
| Less than $10,000 | 513 | 10.5% |
| $10,000 to $14,999 | 210 | 4.3% |
| $15,000 to $24,999 | 323 | 6.6% |
| $25,000 to $34,999 | 479 | 9.8% |
| $35,000 to $49,999 | 753 | 15.4% |
| $50,000 to $74,999 | 870 | 17.8% |
| $75,000 to $99,999 | 689 | 14.1% |
| $100,000 to $149,999 | 802 | 16.4% |
| $150,000 to $199,999 | 200 | 4.1% |
| $200,000+ | 44 | 0.9% |
Household Income by Householder Age in Lake Station
The median household income in Lake Station is $53,588, with the highest median household income of $54,740 found in the 45 to 64 years age bracket for the primary householder. A total of 2,021 households (41.3%) fall into this category. Meanwhile, the 15 to 24 years age bracket for the primary householder has the lowest median household income of $0, with 195 households (4.0%) in this group.
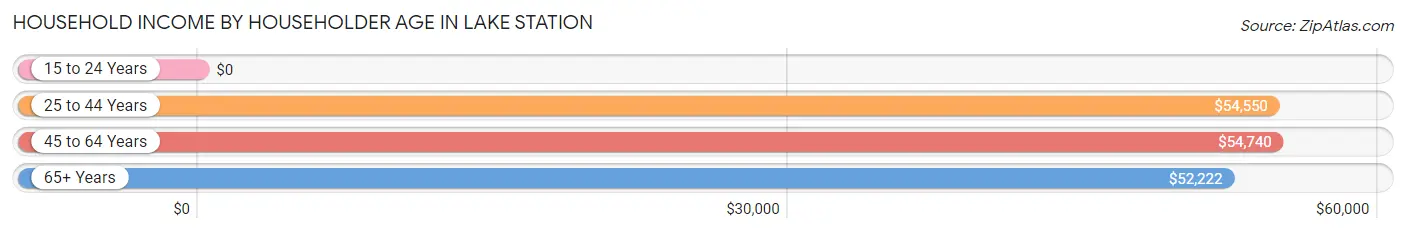
| Income Bracket | # Households | Median Income |
| 15 to 24 Years | 195 (4.0%) | $0 |
| 25 to 44 Years | 1,650 (33.8%) | $54,550 |
| 45 to 64 Years | 2,021 (41.3%) | $54,740 |
| 65+ Years | 1,022 (20.9%) | $52,222 |
| Total | 4,888 (100.0%) | $53,588 |
Poverty in Lake Station
Income Below Poverty by Sex and Age in Lake Station
With 17.1% poverty level for males and 19.3% for females among the residents of Lake Station, 18 to 24 year old males and 5 year old females are the most vulnerable to poverty, with 265 males (33.5%) and 117 females (63.9%) in their respective age groups living below the poverty level.
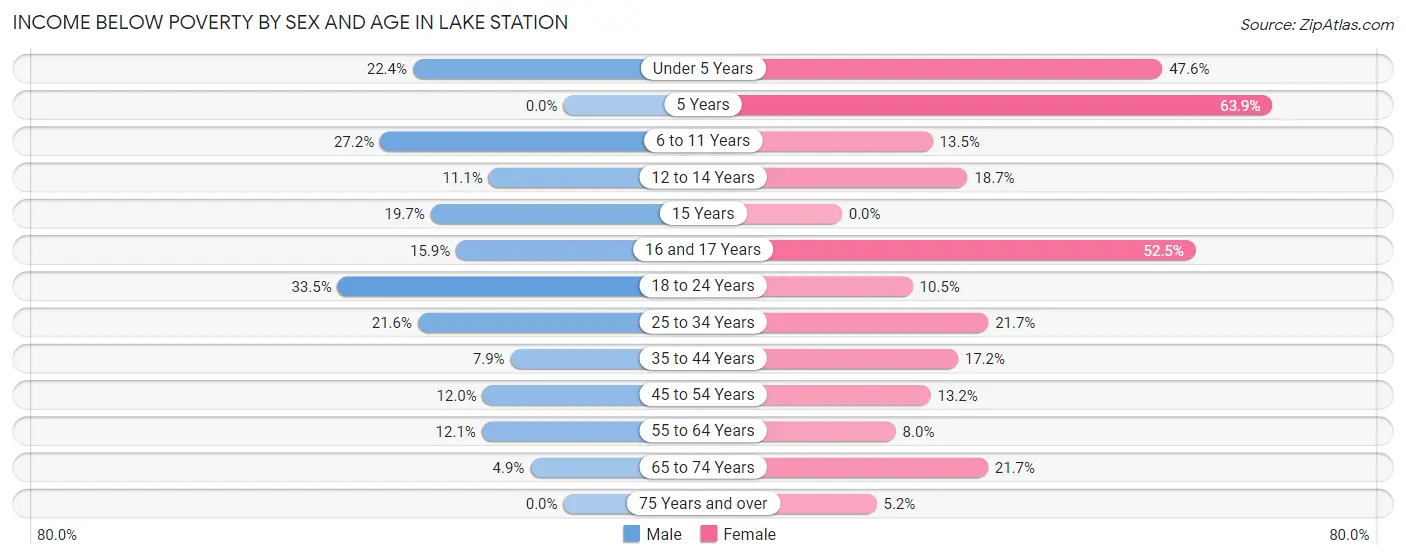
| Age Bracket | Male | Female |
| Under 5 Years | 38 (22.4%) | 275 (47.6%) |
| 5 Years | 0 (0.0%) | 117 (63.9%) |
| 6 to 11 Years | 244 (27.2%) | 73 (13.5%) |
| 12 to 14 Years | 27 (11.1%) | 47 (18.6%) |
| 15 Years | 14 (19.7%) | 0 (0.0%) |
| 16 and 17 Years | 18 (15.9%) | 52 (52.5%) |
| 18 to 24 Years | 265 (33.5%) | 85 (10.5%) |
| 25 to 34 Years | 193 (21.6%) | 225 (21.7%) |
| 35 to 44 Years | 62 (7.9%) | 117 (17.2%) |
| 45 to 54 Years | 68 (12.0%) | 80 (13.2%) |
| 55 to 64 Years | 146 (12.1%) | 74 (8.0%) |
| 65 to 74 Years | 27 (4.9%) | 126 (21.7%) |
| 75 Years and over | 0 (0.0%) | 16 (5.2%) |
| Total | 1,102 (17.1%) | 1,287 (19.3%) |
Income Above Poverty by Sex and Age in Lake Station
According to the poverty statistics in Lake Station, males aged 5 years and females aged 15 years are the age groups that are most secure financially, with 100.0% of males and 100.0% of females in these age groups living above the poverty line.
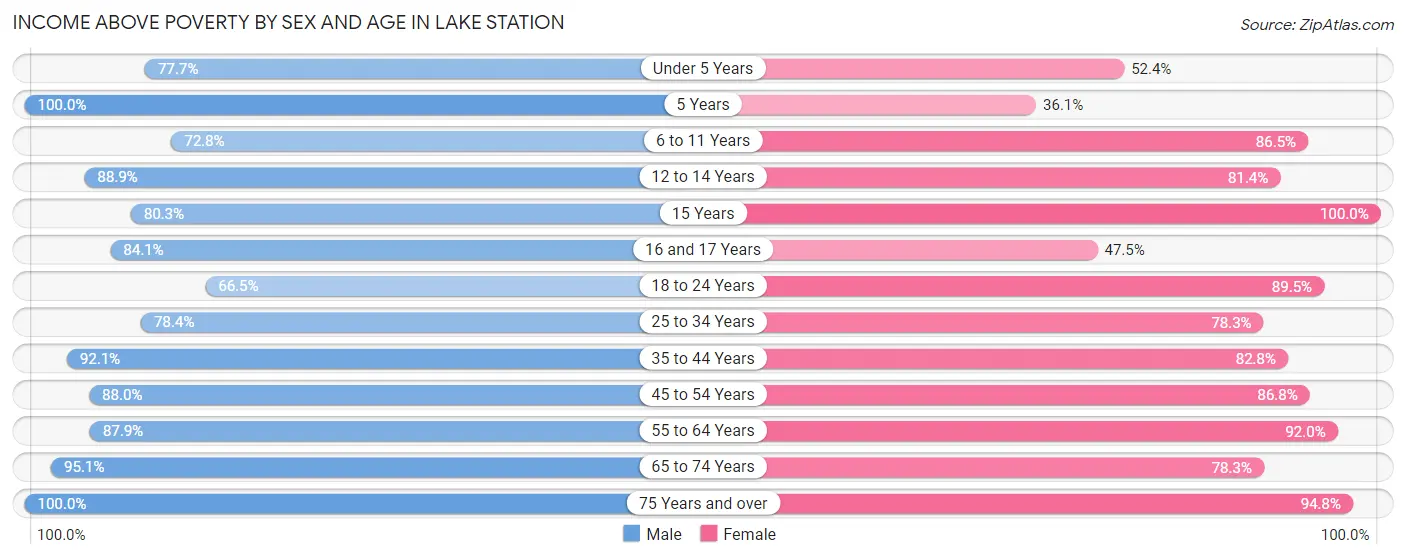
| Age Bracket | Male | Female |
| Under 5 Years | 132 (77.6%) | 303 (52.4%) |
| 5 Years | 70 (100.0%) | 66 (36.1%) |
| 6 to 11 Years | 652 (72.8%) | 468 (86.5%) |
| 12 to 14 Years | 216 (88.9%) | 205 (81.4%) |
| 15 Years | 57 (80.3%) | 84 (100.0%) |
| 16 and 17 Years | 95 (84.1%) | 47 (47.5%) |
| 18 to 24 Years | 525 (66.5%) | 723 (89.5%) |
| 25 to 34 Years | 700 (78.4%) | 810 (78.3%) |
| 35 to 44 Years | 727 (92.1%) | 562 (82.8%) |
| 45 to 54 Years | 499 (88.0%) | 527 (86.8%) |
| 55 to 64 Years | 1,058 (87.9%) | 851 (92.0%) |
| 65 to 74 Years | 522 (95.1%) | 455 (78.3%) |
| 75 Years and over | 107 (100.0%) | 294 (94.8%) |
| Total | 5,360 (83.0%) | 5,395 (80.7%) |
Income Below Poverty Among Married-Couple Families in Lake Station
The poverty statistics for married-couple families in Lake Station show that 2.2% or 40 of the total 1,823 families live below the poverty line. Families with 3 or 4 children have the highest poverty rate of 15.2%, comprising of 14 families. On the other hand, families with 1 or 2 children have the lowest poverty rate of 0.0%, which includes 0 families.
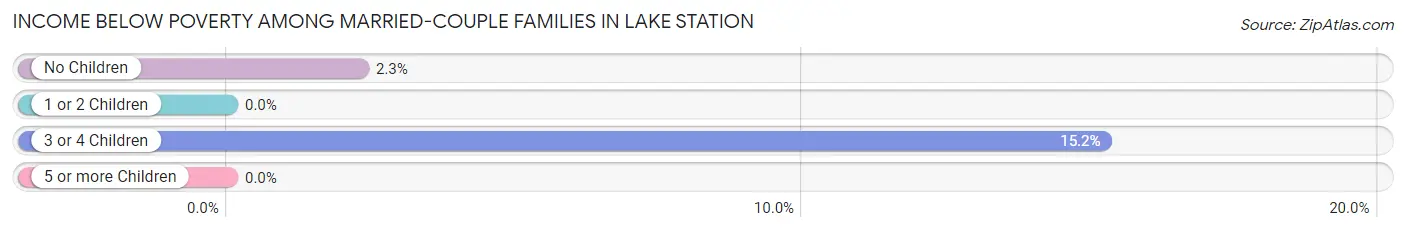
| Children | Above Poverty | Below Poverty |
| No Children | 1,112 (97.7%) | 26 (2.3%) |
| 1 or 2 Children | 593 (100.0%) | 0 (0.0%) |
| 3 or 4 Children | 78 (84.8%) | 14 (15.2%) |
| 5 or more Children | 0 (0.0%) | 0 (0.0%) |
| Total | 1,783 (97.8%) | 40 (2.2%) |
Income Below Poverty Among Single-Parent Households in Lake Station
According to the poverty data in Lake Station, 13.8% or 82 single-father households and 40.8% or 370 single-mother households are living below the poverty line. Among single-father households, those with 1 or 2 children have the highest poverty rate, with 63 households (30.4%) experiencing poverty. Likewise, among single-mother households, those with 5 or more children have the highest poverty rate, with 79 households (100.0%) falling below the poverty line.
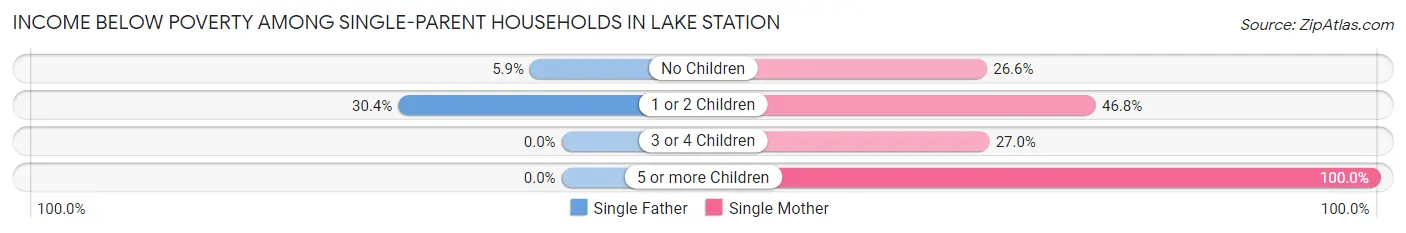
| Children | Single Father | Single Mother |
| No Children | 19 (5.9%) | 72 (26.6%) |
| 1 or 2 Children | 63 (30.4%) | 162 (46.8%) |
| 3 or 4 Children | 0 (0.0%) | 57 (27.0%) |
| 5 or more Children | 0 (0.0%) | 79 (100.0%) |
| Total | 82 (13.8%) | 370 (40.8%) |
Income Below Poverty Among Married-Couple vs Single-Parent Households in Lake Station
The poverty data for Lake Station shows that 40 of the married-couple family households (2.2%) and 452 of the single-parent households (30.1%) are living below the poverty level. Within the married-couple family households, those with 3 or 4 children have the highest poverty rate, with 14 households (15.2%) falling below the poverty line. Among the single-parent households, those with 5 or more children have the highest poverty rate, with 79 household (100.0%) living below poverty.
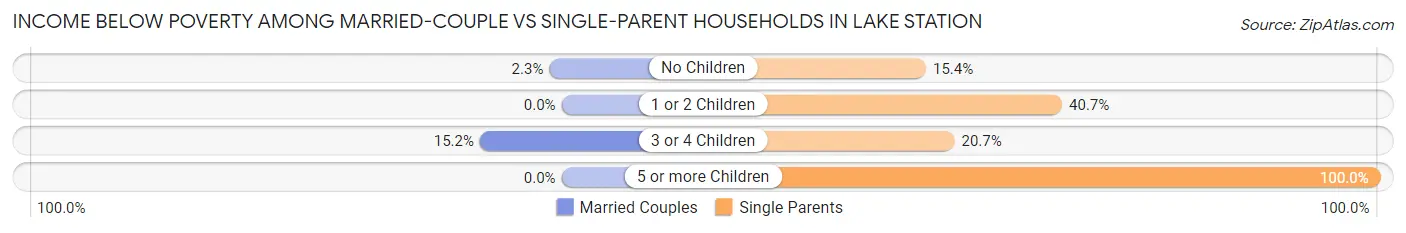
| Children | Married-Couple Families | Single-Parent Households |
| No Children | 26 (2.3%) | 91 (15.3%) |
| 1 or 2 Children | 0 (0.0%) | 225 (40.7%) |
| 3 or 4 Children | 14 (15.2%) | 57 (20.6%) |
| 5 or more Children | 0 (0.0%) | 79 (100.0%) |
| Total | 40 (2.2%) | 452 (30.1%) |
Race in Lake Station
The most populous races in Lake Station are White / Caucasian (9,359 | 70.1%), Hispanic or Latino (4,109 | 30.8%), and Two or more Races (2,153 | 16.1%).
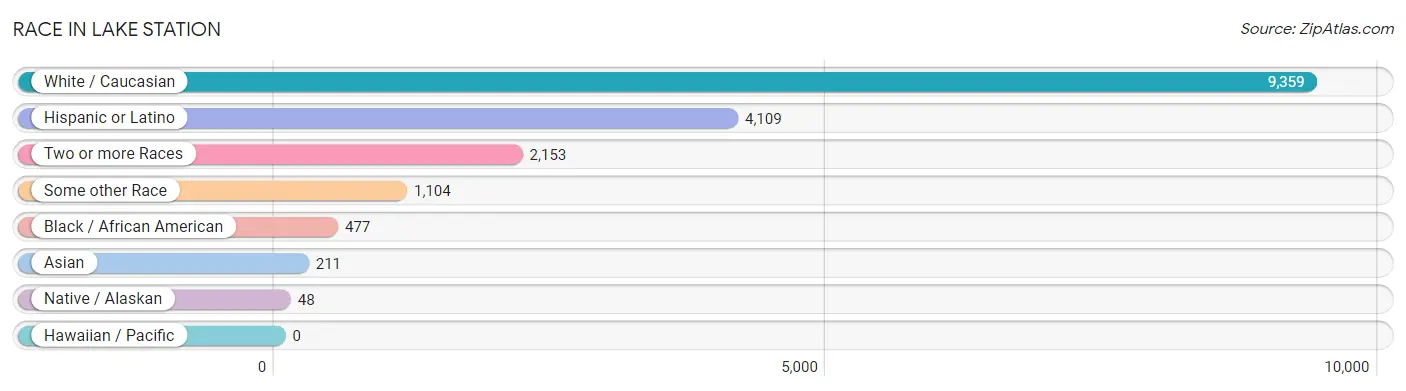
| Race | # Population | % Population |
| Asian | 211 | 1.6% |
| Black / African American | 477 | 3.6% |
| Hawaiian / Pacific | 0 | 0.0% |
| Hispanic or Latino | 4,109 | 30.8% |
| Native / Alaskan | 48 | 0.4% |
| White / Caucasian | 9,359 | 70.1% |
| Two or more Races | 2,153 | 16.1% |
| Some other Race | 1,104 | 8.3% |
| Total | 13,352 | 100.0% |
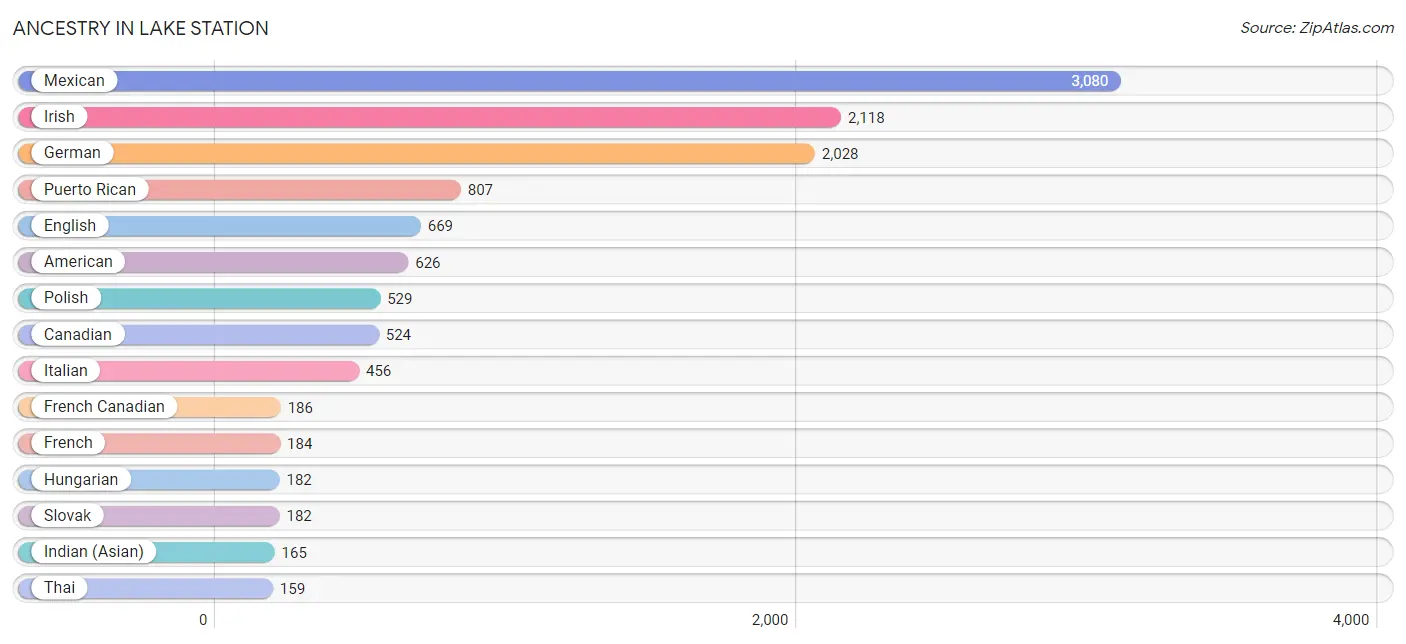
Ancestry in Lake Station
The most populous ancestries reported in Lake Station are Mexican (3,080 | 23.1%), Irish (2,118 | 15.9%), German (2,028 | 15.2%), Puerto Rican (807 | 6.0%), and English (669 | 5.0%), together accounting for 65.2% of all Lake Station residents.
| Ancestry | # Population | % Population |
| Alaska Native | 6 | 0.0% |
| American | 626 | 4.7% |
| Apache | 87 | 0.6% |
| Arab | 41 | 0.3% |
| Blackfeet | 8 | 0.1% |
| British | 61 | 0.5% |
| Canadian | 524 | 3.9% |
| Carpatho Rusyn | 17 | 0.1% |
| Central American | 33 | 0.3% |
| Cherokee | 75 | 0.6% |
| Chippewa | 10 | 0.1% |
| Croatian | 24 | 0.2% |
| Cuban | 28 | 0.2% |
| Czech | 67 | 0.5% |
| Czechoslovakian | 8 | 0.1% |
| Danish | 101 | 0.8% |
| Dutch | 157 | 1.2% |
| English | 669 | 5.0% |
| European | 152 | 1.1% |
| Finnish | 97 | 0.7% |
| French | 184 | 1.4% |
| French Canadian | 186 | 1.4% |
| German | 2,028 | 15.2% |
| Greek | 63 | 0.5% |
| Guatemalan | 10 | 0.1% |
| Guyanese | 29 | 0.2% |
| Honduran | 23 | 0.2% |
| Hungarian | 182 | 1.4% |
| Indian (Asian) | 165 | 1.2% |
| Irish | 2,118 | 15.9% |
| Italian | 456 | 3.4% |
| Lithuanian | 46 | 0.3% |
| Macedonian | 20 | 0.2% |
| Mexican | 3,080 | 23.1% |
| Mexican American Indian | 87 | 0.6% |
| Native Hawaiian | 8 | 0.1% |
| Norwegian | 80 | 0.6% |
| Pennsylvania German | 32 | 0.2% |
| Polish | 529 | 4.0% |
| Potawatomi | 5 | 0.0% |
| Puerto Rican | 807 | 6.0% |
| Scandinavian | 50 | 0.4% |
| Scotch-Irish | 30 | 0.2% |
| Scottish | 84 | 0.6% |
| Serbian | 51 | 0.4% |
| Sioux | 75 | 0.6% |
| Slovak | 182 | 1.4% |
| Spaniard | 59 | 0.4% |
| Spanish | 24 | 0.2% |
| Sri Lankan | 27 | 0.2% |
| Subsaharan African | 15 | 0.1% |
| Swedish | 54 | 0.4% |
| Swiss | 5 | 0.0% |
| Thai | 159 | 1.2% |
| Welsh | 51 | 0.4% | View All 55 Rows |
Immigrants in Lake Station
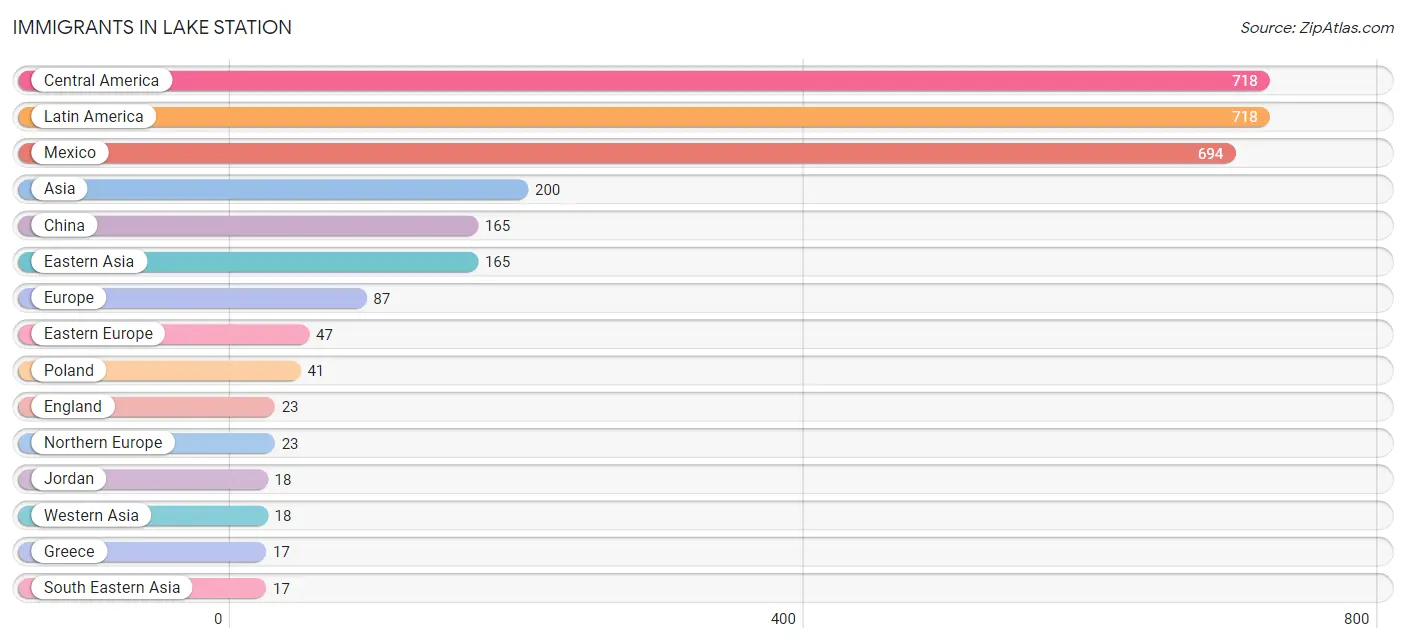
The most numerous immigrant groups reported in Lake Station came from Central America (718 | 5.4%), Latin America (718 | 5.4%), Mexico (694 | 5.2%), Asia (200 | 1.5%), and China (165 | 1.2%), together accounting for 18.7% of all Lake Station residents.
| Immigration Origin | # Population | % Population |
| Asia | 200 | 1.5% |
| Central America | 718 | 5.4% |
| China | 165 | 1.2% |
| Eastern Asia | 165 | 1.2% |
| Eastern Europe | 47 | 0.4% |
| England | 23 | 0.2% |
| Europe | 87 | 0.6% |
| Greece | 17 | 0.1% |
| Guatemala | 10 | 0.1% |
| Honduras | 14 | 0.1% |
| Hungary | 6 | 0.0% |
| Jordan | 18 | 0.1% |
| Latin America | 718 | 5.4% |
| Mexico | 694 | 5.2% |
| Northern Europe | 23 | 0.2% |
| Poland | 41 | 0.3% |
| South Eastern Asia | 17 | 0.1% |
| Southern Europe | 17 | 0.1% |
| Vietnam | 17 | 0.1% |
| Western Asia | 18 | 0.1% | View All 20 Rows |
Sex and Age in Lake Station
Sex and Age in Lake Station
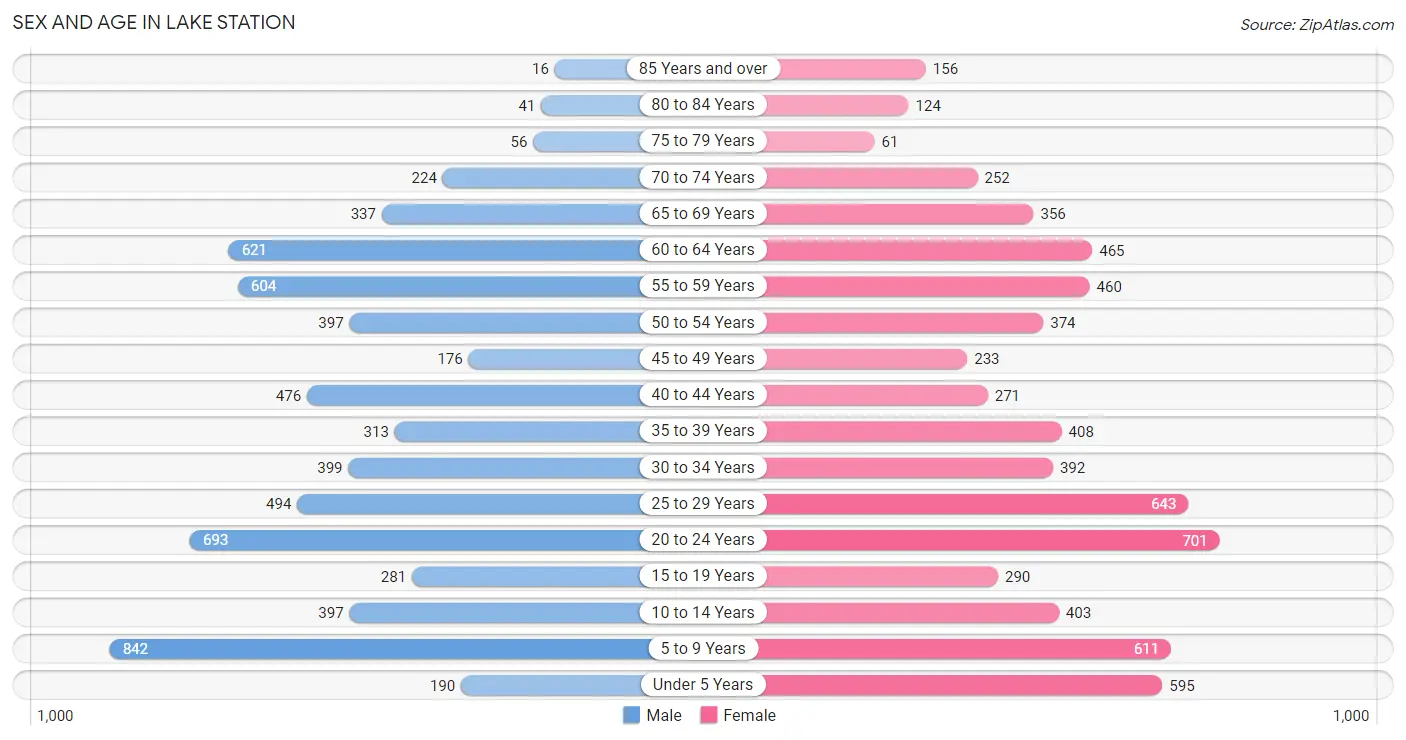
The most populous age groups in Lake Station are 5 to 9 Years (842 | 12.8%) for men and 20 to 24 Years (701 | 10.3%) for women.
| Age Bracket | Male | Female |
| Under 5 Years | 190 (2.9%) | 595 (8.8%) |
| 5 to 9 Years | 842 (12.8%) | 611 (9.0%) |
| 10 to 14 Years | 397 (6.0%) | 403 (5.9%) |
| 15 to 19 Years | 281 (4.3%) | 290 (4.3%) |
| 20 to 24 Years | 693 (10.6%) | 701 (10.3%) |
| 25 to 29 Years | 494 (7.5%) | 643 (9.5%) |
| 30 to 34 Years | 399 (6.1%) | 392 (5.8%) |
| 35 to 39 Years | 313 (4.8%) | 408 (6.0%) |
| 40 to 44 Years | 476 (7.3%) | 271 (4.0%) |
| 45 to 49 Years | 176 (2.7%) | 233 (3.4%) |
| 50 to 54 Years | 397 (6.0%) | 374 (5.5%) |
| 55 to 59 Years | 604 (9.2%) | 460 (6.8%) |
| 60 to 64 Years | 621 (9.5%) | 465 (6.8%) |
| 65 to 69 Years | 337 (5.1%) | 356 (5.2%) |
| 70 to 74 Years | 224 (3.4%) | 252 (3.7%) |
| 75 to 79 Years | 56 (0.9%) | 61 (0.9%) |
| 80 to 84 Years | 41 (0.6%) | 124 (1.8%) |
| 85 Years and over | 16 (0.2%) | 156 (2.3%) |
| Total | 6,557 (100.0%) | 6,795 (100.0%) |
Families and Households in Lake Station
Median Family Size in Lake Station
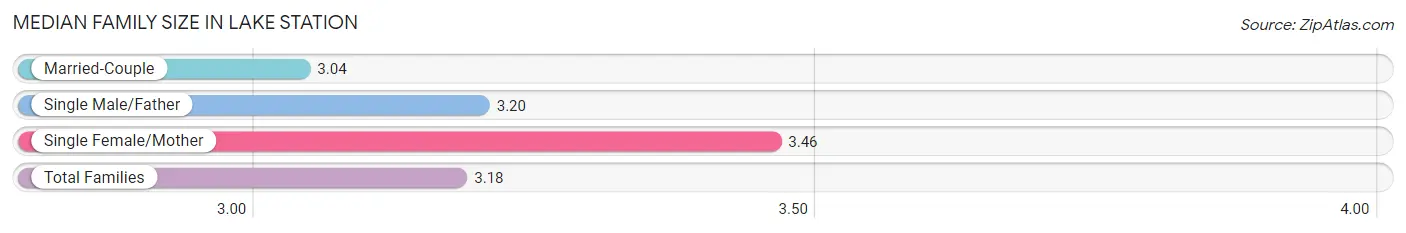
The median family size in Lake Station is 3.18 persons per family, with single female/mother families (907 | 27.3%) accounting for the largest median family size of 3.46 persons per family. On the other hand, married-couple families (1,823 | 54.8%) represent the smallest median family size with 3.04 persons per family.
| Family Type | # Families | Family Size |
| Married-Couple | 1,823 (54.8%) | 3.04 |
| Single Male/Father | 594 (17.9%) | 3.20 |
| Single Female/Mother | 907 (27.3%) | 3.46 |
| Total Families | 3,324 (100.0%) | 3.18 |
Median Household Size in Lake Station
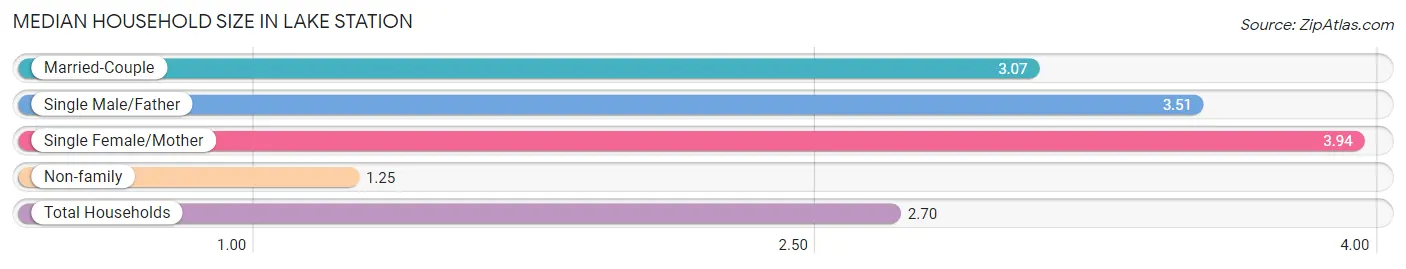
The median household size in Lake Station is 2.70 persons per household, with single female/mother households (907 | 18.6%) accounting for the largest median household size of 3.94 persons per household. non-family households (1,564 | 32.0%) represent the smallest median household size with 1.25 persons per household.
| Household Type | # Households | Household Size |
| Married-Couple | 1,823 (37.3%) | 3.07 |
| Single Male/Father | 594 (12.1%) | 3.51 |
| Single Female/Mother | 907 (18.6%) | 3.94 |
| Non-family | 1,564 (32.0%) | 1.25 |
| Total Households | 4,888 (100.0%) | 2.70 |
Household Size by Marriage Status in Lake Station
Out of a total of 4,888 households in Lake Station, 3,324 (68.0%) are family households, while 1,564 (32.0%) are nonfamily households. The most numerous type of family households are 2-person households, comprising 1,305, and the most common type of nonfamily households are 1-person households, comprising 1,268.
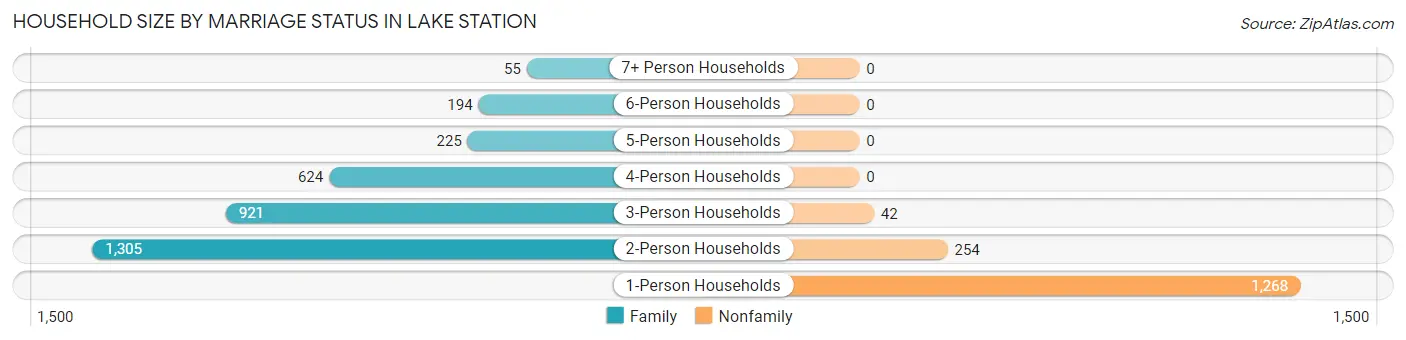
| Household Size | Family Households | Nonfamily Households |
| 1-Person Households | - | 1,268 (25.9%) |
| 2-Person Households | 1,305 (26.7%) | 254 (5.2%) |
| 3-Person Households | 921 (18.8%) | 42 (0.9%) |
| 4-Person Households | 624 (12.8%) | 0 (0.0%) |
| 5-Person Households | 225 (4.6%) | 0 (0.0%) |
| 6-Person Households | 194 (4.0%) | 0 (0.0%) |
| 7+ Person Households | 55 (1.1%) | 0 (0.0%) |
| Total | 3,324 (68.0%) | 1,564 (32.0%) |
Female Fertility in Lake Station
Fertility by Age in Lake Station
Average fertility rate in Lake Station is 56.0 births per 1,000 women. Women in the age bracket of 20 to 34 years have the highest fertility rate with 96.0 births per 1,000 women. Women in the age bracket of 20 to 34 years acount for 98.2% of all women with births.
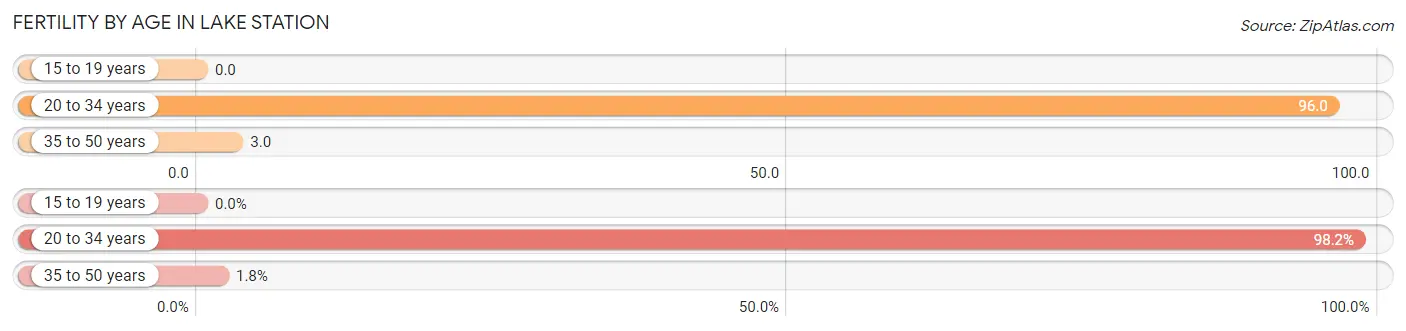
| Age Bracket | Women with Births | Births / 1,000 Women |
| 15 to 19 years | 0 (0.0%) | 0.0 |
| 20 to 34 years | 166 (98.2%) | 96.0 |
| 35 to 50 years | 3 (1.8%) | 3.0 |
| Total | 169 (100.0%) | 56.0 |
Fertility by Age by Marriage Status in Lake Station
37.3% of women with births (169) in Lake Station are married. The highest percentage of unmarried women with births falls into 20 to 34 years age bracket with 63.9% of them unmarried at the time of birth, while the lowest percentage of unmarried women with births belong to 35 to 50 years age bracket with 0.0% of them unmarried.
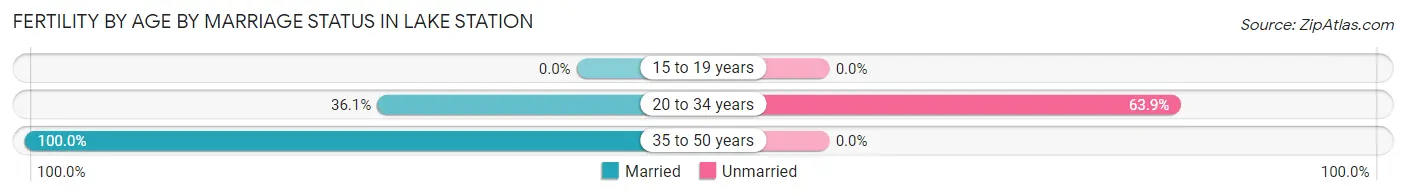
| Age Bracket | Married | Unmarried |
| 15 to 19 years | 0 (0.0%) | 0 (0.0%) |
| 20 to 34 years | 60 (36.1%) | 106 (63.9%) |
| 35 to 50 years | 3 (100.0%) | 0 (0.0%) |
| Total | 63 (37.3%) | 106 (62.7%) |
Fertility by Education in Lake Station
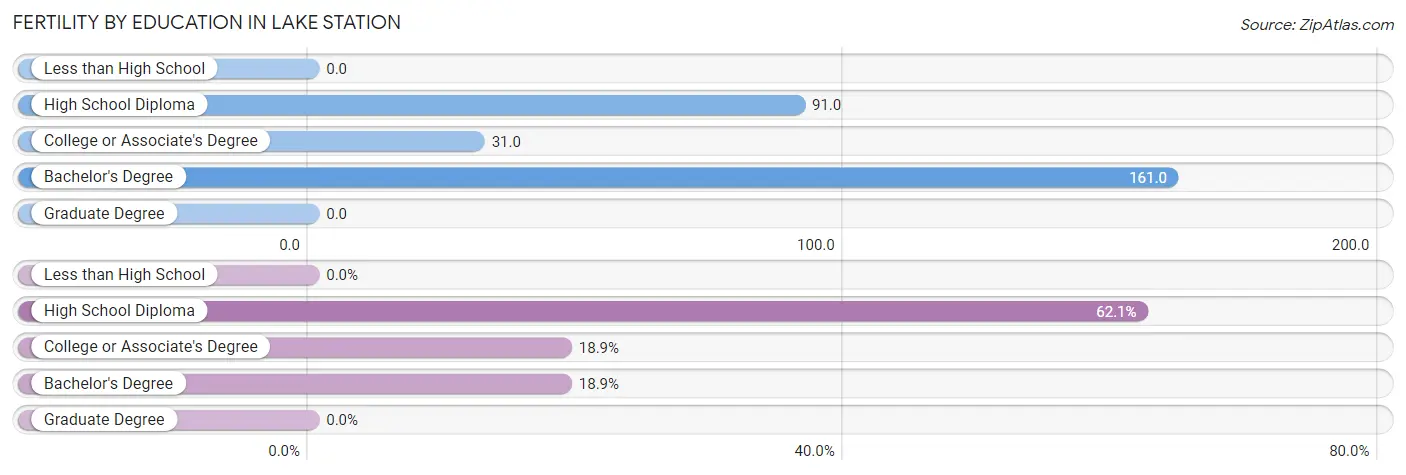
| Educational Attainment | Women with Births | Births / 1,000 Women |
| Less than High School | 0 (0.0%) | 0.0 |
| High School Diploma | 105 (62.1%) | 91.0 |
| College or Associate's Degree | 32 (18.9%) | 31.0 |
| Bachelor's Degree | 32 (18.9%) | 161.0 |
| Graduate Degree | 0 (0.0%) | 0.0 |
| Total | 169 (100.0%) | 56.0 |
Fertility by Education by Marriage Status in Lake Station
62.7% of women with births in Lake Station are unmarried. Women with the educational attainment of bachelor's degree are most likely to be married with 100.0% of them married at childbirth, while women with the educational attainment of college or associate's degree are least likely to be married with 90.6% of them unmarried at childbirth.
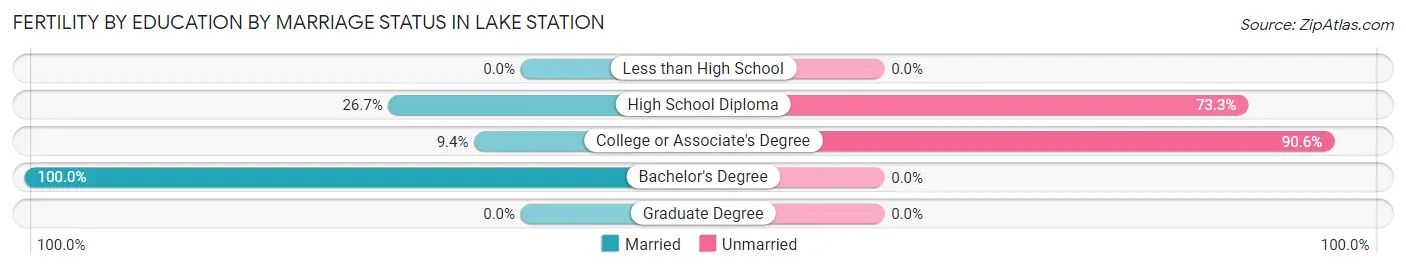
| Educational Attainment | Married | Unmarried |
| Less than High School | 0 (0.0%) | 0 (0.0%) |
| High School Diploma | 28 (26.7%) | 77 (73.3%) |
| College or Associate's Degree | 3 (9.4%) | 29 (90.6%) |
| Bachelor's Degree | 32 (100.0%) | 0 (0.0%) |
| Graduate Degree | 0 (0.0%) | 0 (0.0%) |
| Total | 63 (37.3%) | 106 (62.7%) |
Employment Characteristics in Lake Station
Employment by Class of Employer in Lake Station
Among the 4,983 employed individuals in Lake Station, private company employees (4,110 | 82.5%), not-for-profit organizations (296 | 5.9%), and local government employees (292 | 5.9%) make up the most common classes of employment.
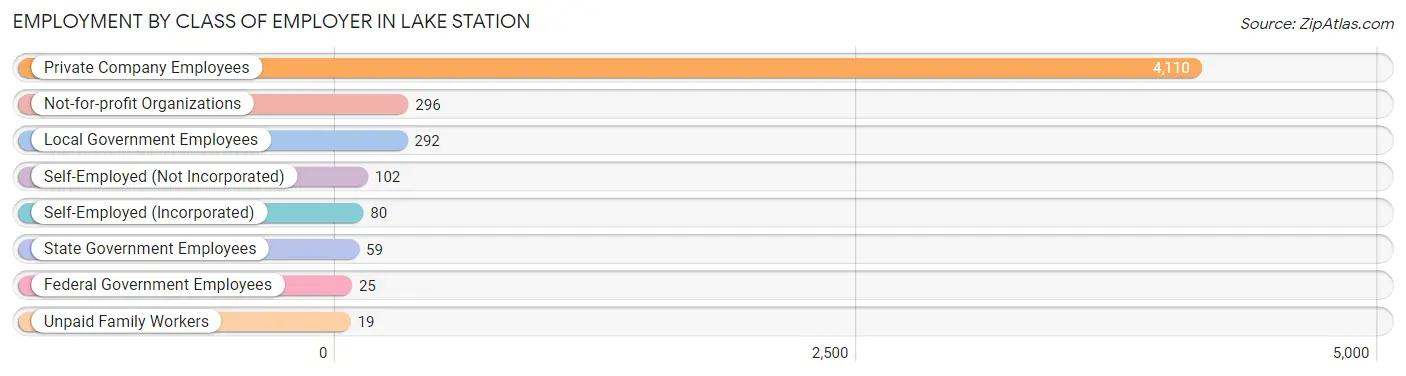
| Employer Class | # Employees | % Employees |
| Private Company Employees | 4,110 | 82.5% |
| Self-Employed (Incorporated) | 80 | 1.6% |
| Self-Employed (Not Incorporated) | 102 | 2.1% |
| Not-for-profit Organizations | 296 | 5.9% |
| Local Government Employees | 292 | 5.9% |
| State Government Employees | 59 | 1.2% |
| Federal Government Employees | 25 | 0.5% |
| Unpaid Family Workers | 19 | 0.4% |
| Total | 4,983 | 100.0% |
Employment Status by Age in Lake Station
According to the labor force statistics for Lake Station, out of the total population over 16 years of age (10,159), 61.6% or 6,258 individuals are in the labor force, with 18.2% or 1,139 of them unemployed. The age group with the highest labor force participation rate is 30 to 34 years, with 81.7% or 646 individuals in the labor force. Within the labor force, the 20 to 24 years age range has the highest percentage of unemployed individuals, with 44.9% or 493 of them being unemployed.
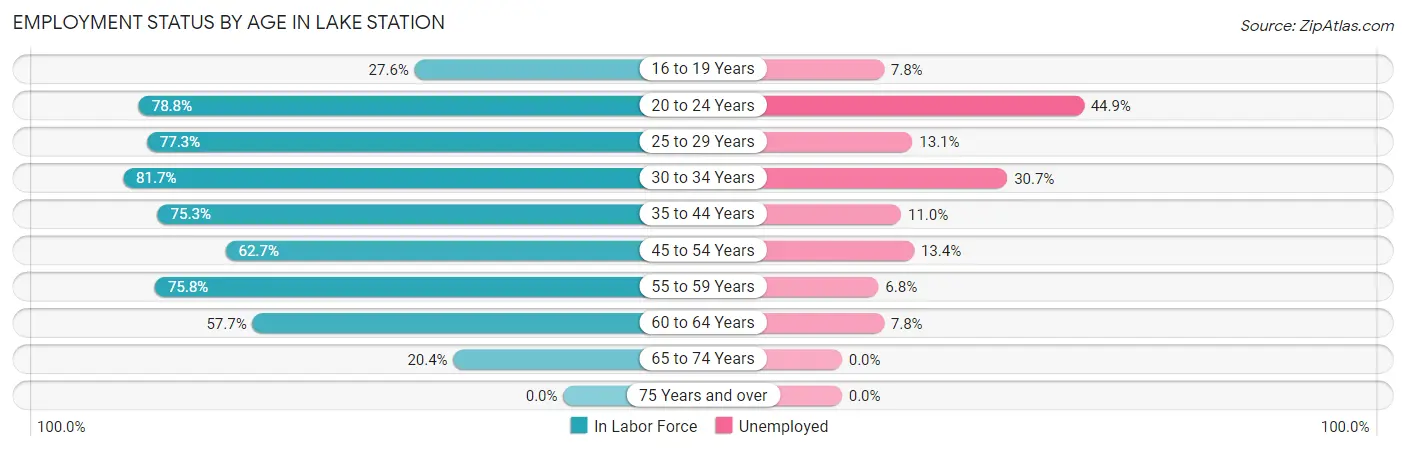
| Age Bracket | In Labor Force | Unemployed |
| 16 to 19 Years | 115 (27.6%) | 9 (7.8%) |
| 20 to 24 Years | 1,098 (78.8%) | 493 (44.9%) |
| 25 to 29 Years | 879 (77.3%) | 115 (13.1%) |
| 30 to 34 Years | 646 (81.7%) | 198 (30.7%) |
| 35 to 44 Years | 1,105 (75.3%) | 122 (11.0%) |
| 45 to 54 Years | 740 (62.7%) | 99 (13.4%) |
| 55 to 59 Years | 807 (75.8%) | 55 (6.8%) |
| 60 to 64 Years | 627 (57.7%) | 49 (7.8%) |
| 65 to 74 Years | 238 (20.4%) | 0 (0.0%) |
| 75 Years and over | 0 (0.0%) | 0 (0.0%) |
| Total | 6,258 (61.6%) | 1,139 (18.2%) |
Employment Status by Educational Attainment in Lake Station
According to labor force statistics for Lake Station, 71.4% of individuals (4,802) out of the total population between 25 and 64 years of age (6,726) are in the labor force, with 13.3% or 639 of them being unemployed. The group with the highest labor force participation rate are those with the educational attainment of bachelor's degree or higher, with 77.1% or 465 individuals in the labor force. Within the labor force, individuals with less than high school education have the highest percentage of unemployment, with 18.9% or 164 of them being unemployed.
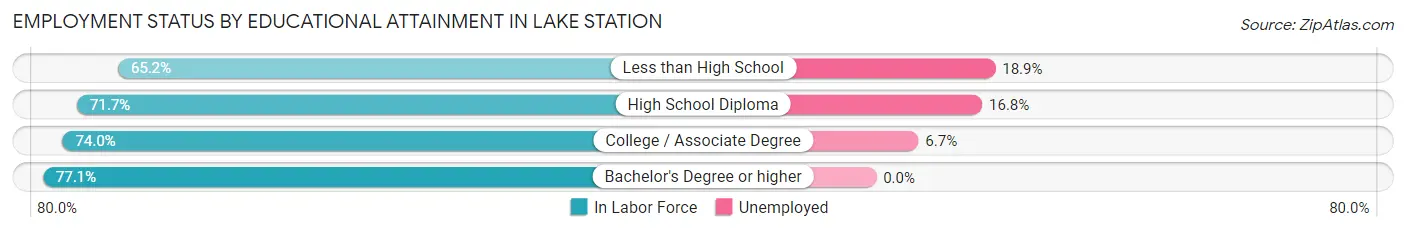
| Educational Attainment | In Labor Force | Unemployed |
| Less than High School | 870 (65.2%) | 252 (18.9%) |
| High School Diploma | 2,375 (71.7%) | 557 (16.8%) |
| College / Associate Degree | 1,092 (74.0%) | 99 (6.7%) |
| Bachelor's Degree or higher | 465 (77.1%) | 0 (0.0%) |
| Total | 4,802 (71.4%) | 895 (13.3%) |
Employment Occupations by Sex in Lake Station
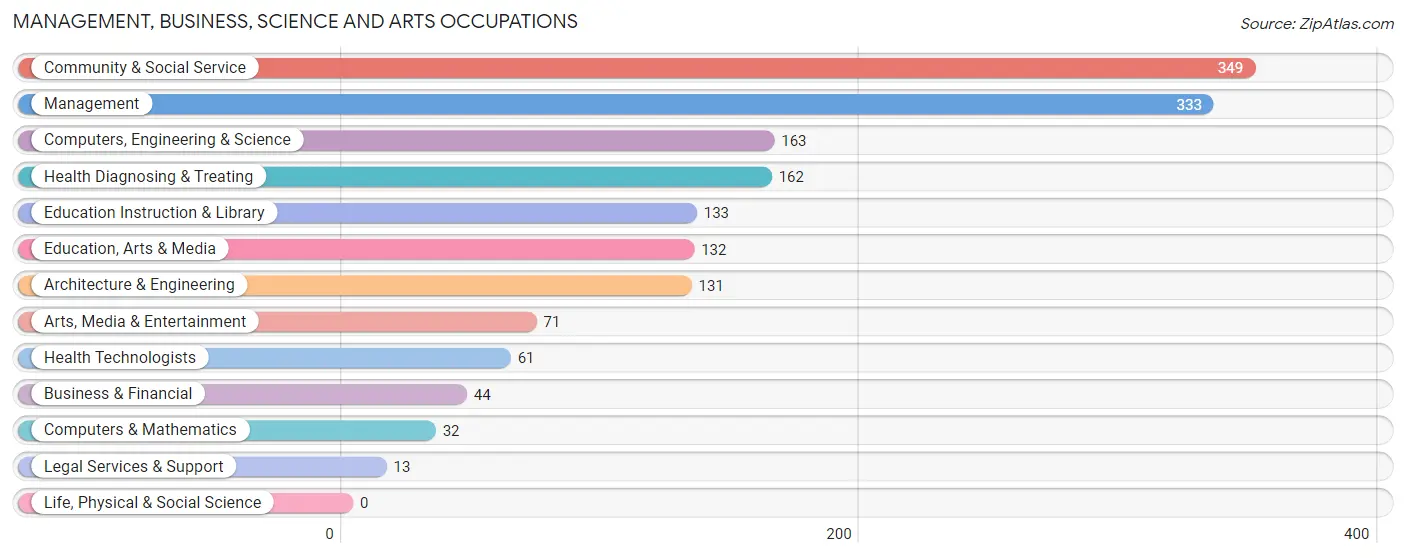
Management, Business, Science and Arts Occupations
The most common Management, Business, Science and Arts occupations in Lake Station are Community & Social Service (349 | 6.8%), Management (333 | 6.5%), Computers, Engineering & Science (163 | 3.2%), Health Diagnosing & Treating (162 | 3.2%), and Education Instruction & Library (133 | 2.6%).
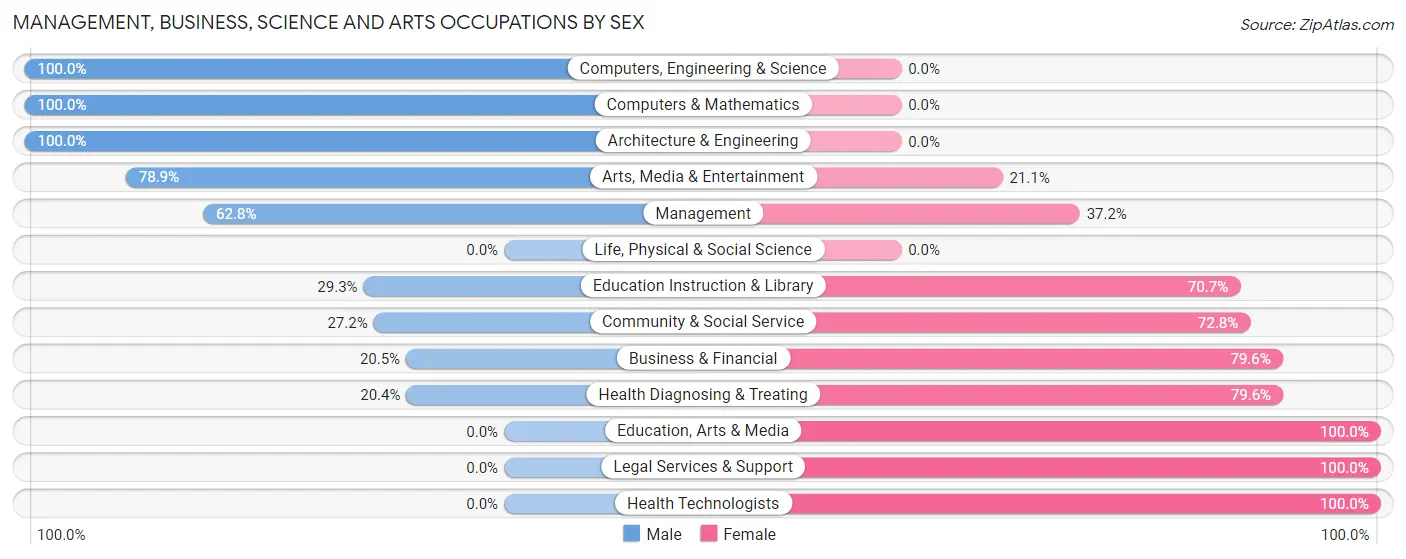
Management, Business, Science and Arts Occupations by Sex
Within the Management, Business, Science and Arts occupations in Lake Station, the most male-oriented occupations are Computers, Engineering & Science (100.0%), Computers & Mathematics (100.0%), and Architecture & Engineering (100.0%), while the most female-oriented occupations are Education, Arts & Media (100.0%), Legal Services & Support (100.0%), and Health Technologists (100.0%).
| Occupation | Male | Female |
| Management | 209 (62.8%) | 124 (37.2%) |
| Business & Financial | 9 (20.4%) | 35 (79.5%) |
| Computers, Engineering & Science | 163 (100.0%) | 0 (0.0%) |
| Computers & Mathematics | 32 (100.0%) | 0 (0.0%) |
| Architecture & Engineering | 131 (100.0%) | 0 (0.0%) |
| Life, Physical & Social Science | 0 (0.0%) | 0 (0.0%) |
| Community & Social Service | 95 (27.2%) | 254 (72.8%) |
| Education, Arts & Media | 0 (0.0%) | 132 (100.0%) |
| Legal Services & Support | 0 (0.0%) | 13 (100.0%) |
| Education Instruction & Library | 39 (29.3%) | 94 (70.7%) |
| Arts, Media & Entertainment | 56 (78.9%) | 15 (21.1%) |
| Health Diagnosing & Treating | 33 (20.4%) | 129 (79.6%) |
| Health Technologists | 0 (0.0%) | 61 (100.0%) |
| Total (Category) | 509 (48.4%) | 542 (51.6%) |
| Total (Overall) | 2,728 (53.3%) | 2,388 (46.7%) |
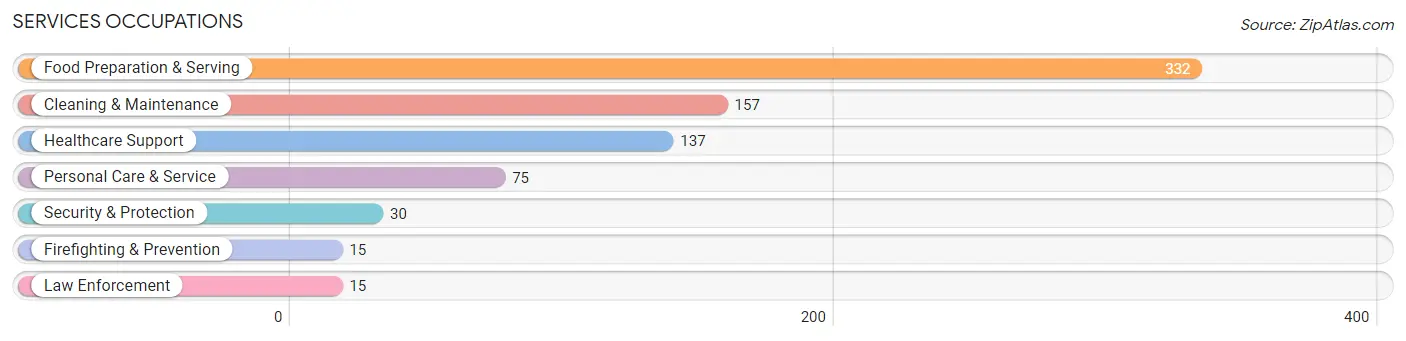
Services Occupations
The most common Services occupations in Lake Station are Food Preparation & Serving (332 | 6.5%), Cleaning & Maintenance (157 | 3.1%), Healthcare Support (137 | 2.7%), Personal Care & Service (75 | 1.5%), and Security & Protection (30 | 0.6%).
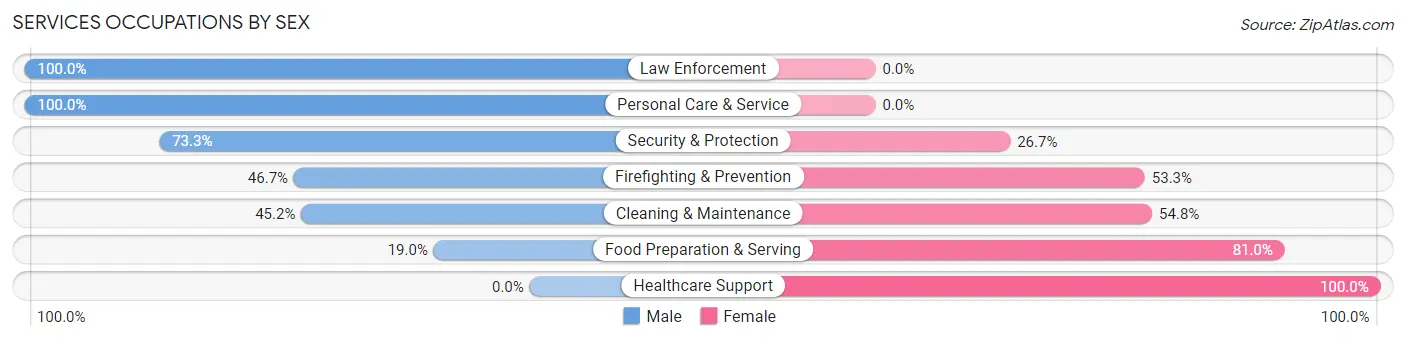
Services Occupations by Sex
Within the Services occupations in Lake Station, the most male-oriented occupations are Law Enforcement (100.0%), Personal Care & Service (100.0%), and Security & Protection (73.3%), while the most female-oriented occupations are Healthcare Support (100.0%), Food Preparation & Serving (81.0%), and Cleaning & Maintenance (54.8%).
| Occupation | Male | Female |
| Healthcare Support | 0 (0.0%) | 137 (100.0%) |
| Security & Protection | 22 (73.3%) | 8 (26.7%) |
| Firefighting & Prevention | 7 (46.7%) | 8 (53.3%) |
| Law Enforcement | 15 (100.0%) | 0 (0.0%) |
| Food Preparation & Serving | 63 (19.0%) | 269 (81.0%) |
| Cleaning & Maintenance | 71 (45.2%) | 86 (54.8%) |
| Personal Care & Service | 75 (100.0%) | 0 (0.0%) |
| Total (Category) | 231 (31.6%) | 500 (68.4%) |
| Total (Overall) | 2,728 (53.3%) | 2,388 (46.7%) |
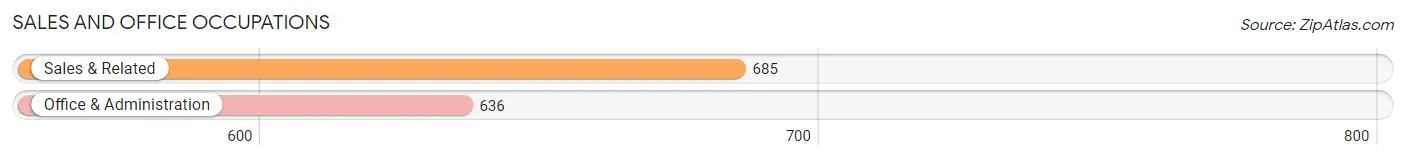
Sales and Office Occupations
The most common Sales and Office occupations in Lake Station are Sales & Related (685 | 13.4%), and Office & Administration (636 | 12.4%).
Sales and Office Occupations by Sex

| Occupation | Male | Female |
| Sales & Related | 124 (18.1%) | 561 (81.9%) |
| Office & Administration | 170 (26.7%) | 466 (73.3%) |
| Total (Category) | 294 (22.3%) | 1,027 (77.7%) |
| Total (Overall) | 2,728 (53.3%) | 2,388 (46.7%) |
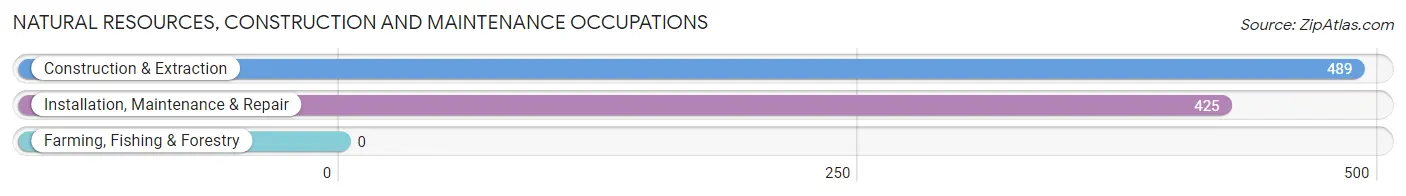
Natural Resources, Construction and Maintenance Occupations
The most common Natural Resources, Construction and Maintenance occupations in Lake Station are Construction & Extraction (489 | 9.6%), and Installation, Maintenance & Repair (425 | 8.3%).
Natural Resources, Construction and Maintenance Occupations by Sex
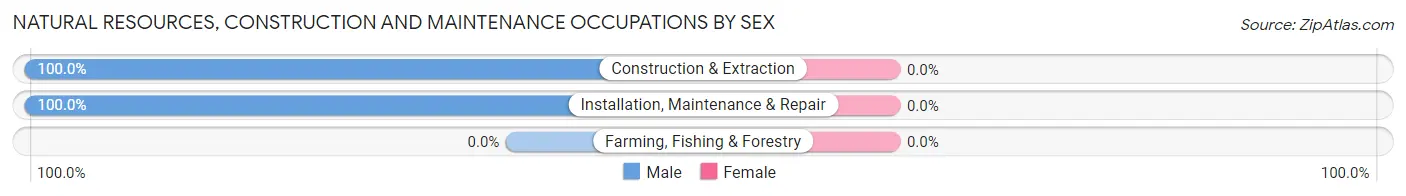
| Occupation | Male | Female |
| Farming, Fishing & Forestry | 0 (0.0%) | 0 (0.0%) |
| Construction & Extraction | 489 (100.0%) | 0 (0.0%) |
| Installation, Maintenance & Repair | 425 (100.0%) | 0 (0.0%) |
| Total (Category) | 914 (100.0%) | 0 (0.0%) |
| Total (Overall) | 2,728 (53.3%) | 2,388 (46.7%) |
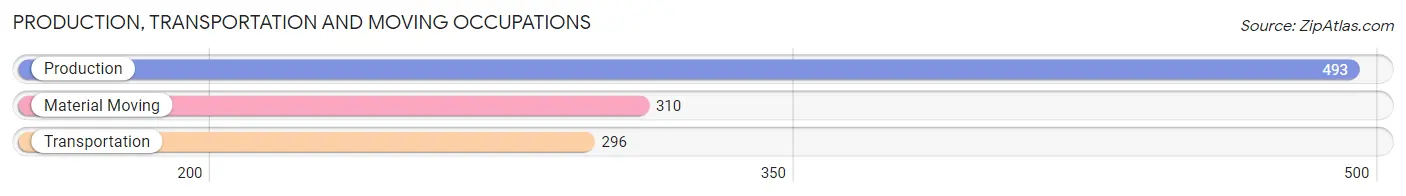
Production, Transportation and Moving Occupations
The most common Production, Transportation and Moving occupations in Lake Station are Production (493 | 9.6%), Material Moving (310 | 6.1%), and Transportation (296 | 5.8%).
Production, Transportation and Moving Occupations by Sex
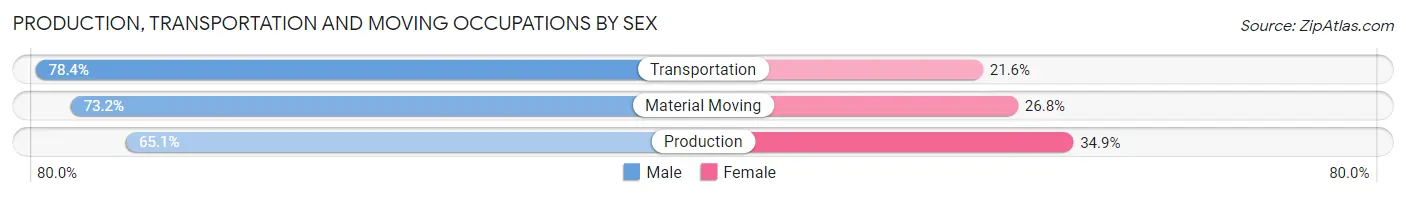
| Occupation | Male | Female |
| Production | 321 (65.1%) | 172 (34.9%) |
| Transportation | 232 (78.4%) | 64 (21.6%) |
| Material Moving | 227 (73.2%) | 83 (26.8%) |
| Total (Category) | 780 (71.0%) | 319 (29.0%) |
| Total (Overall) | 2,728 (53.3%) | 2,388 (46.7%) |
Employment Industries by Sex in Lake Station
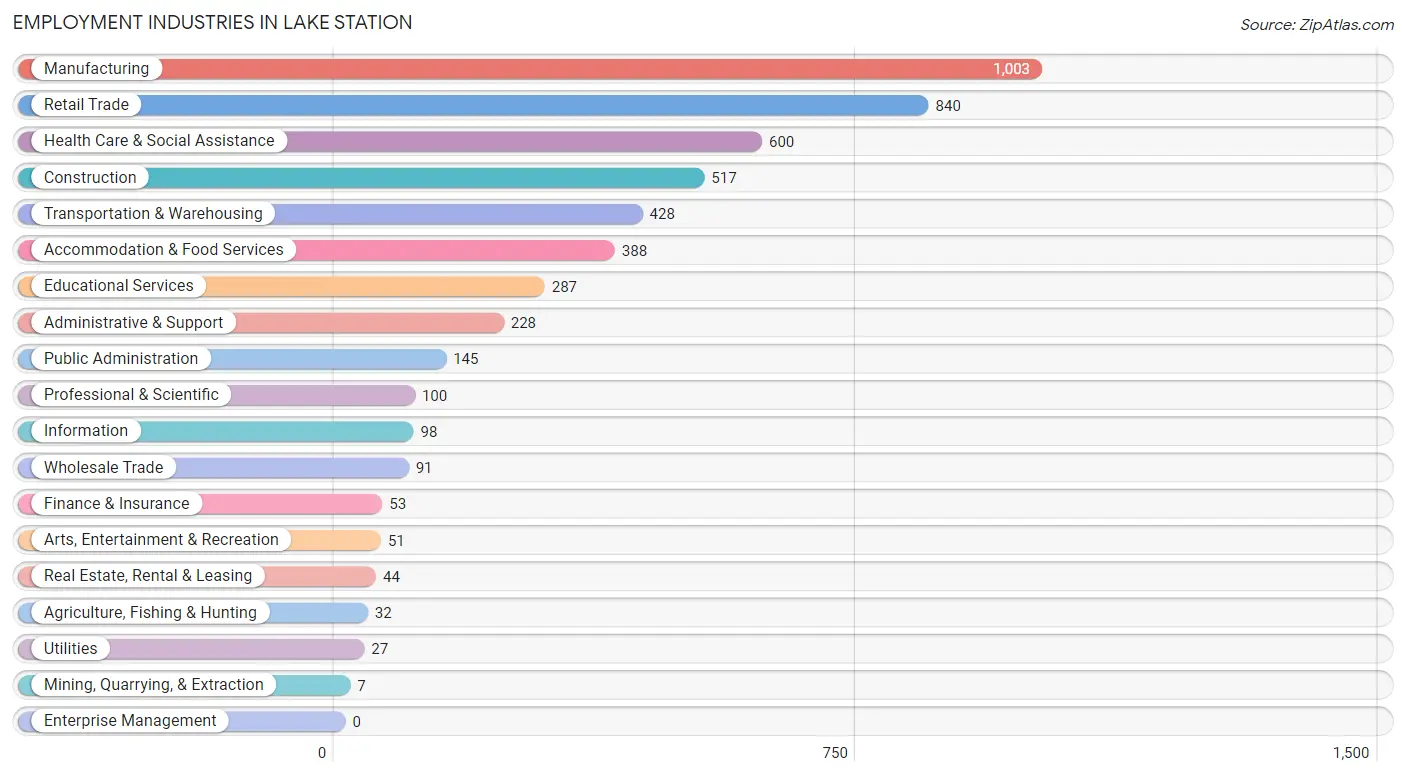
Employment Industries in Lake Station
The major employment industries in Lake Station include Manufacturing (1,003 | 19.6%), Retail Trade (840 | 16.4%), Health Care & Social Assistance (600 | 11.7%), Construction (517 | 10.1%), and Transportation & Warehousing (428 | 8.4%).
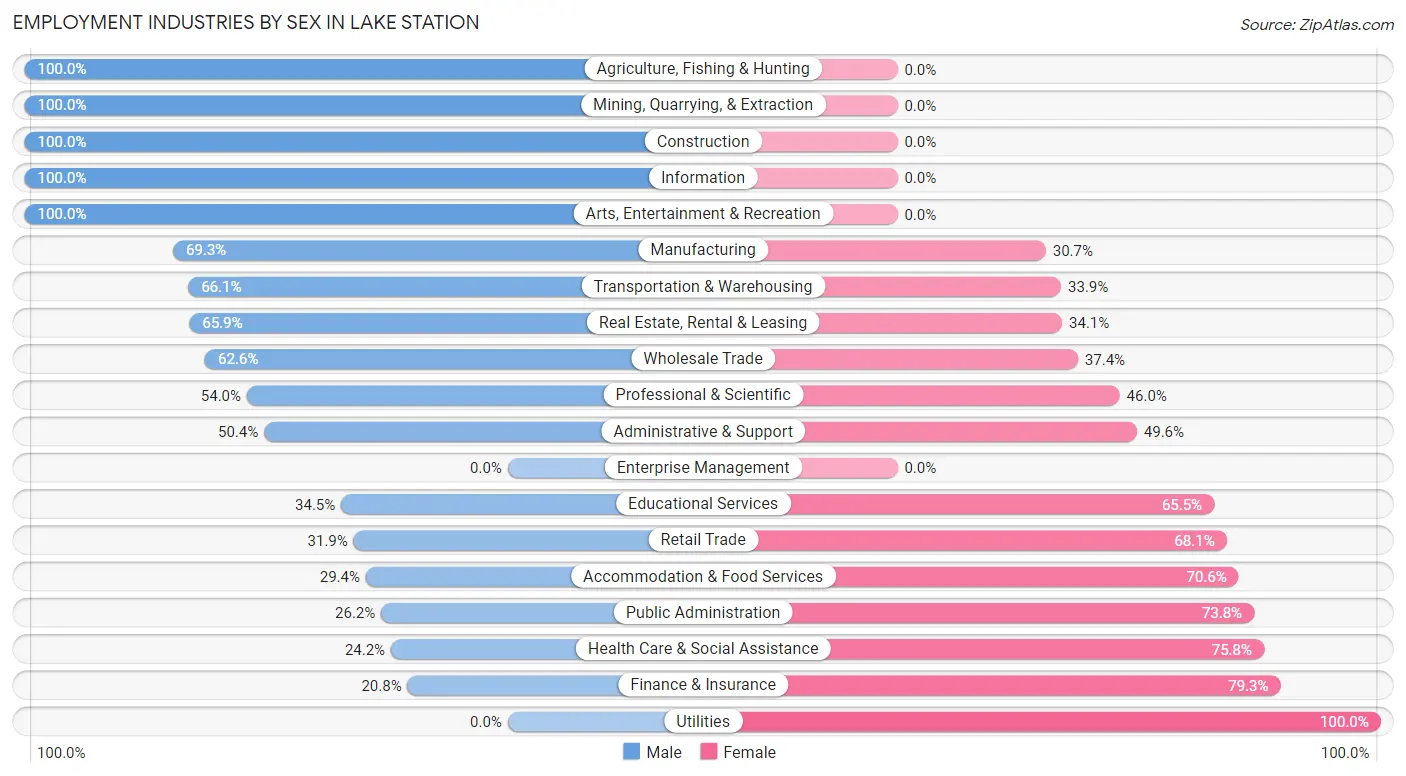
Employment Industries by Sex in Lake Station
The Lake Station industries that see more men than women are Agriculture, Fishing & Hunting (100.0%), Mining, Quarrying, & Extraction (100.0%), and Construction (100.0%), whereas the industries that tend to have a higher number of women are Utilities (100.0%), Finance & Insurance (79.2%), and Health Care & Social Assistance (75.8%).
| Industry | Male | Female |
| Agriculture, Fishing & Hunting | 32 (100.0%) | 0 (0.0%) |
| Mining, Quarrying, & Extraction | 7 (100.0%) | 0 (0.0%) |
| Construction | 517 (100.0%) | 0 (0.0%) |
| Manufacturing | 695 (69.3%) | 308 (30.7%) |
| Wholesale Trade | 57 (62.6%) | 34 (37.4%) |
| Retail Trade | 268 (31.9%) | 572 (68.1%) |
| Transportation & Warehousing | 283 (66.1%) | 145 (33.9%) |
| Utilities | 0 (0.0%) | 27 (100.0%) |
| Information | 98 (100.0%) | 0 (0.0%) |
| Finance & Insurance | 11 (20.7%) | 42 (79.2%) |
| Real Estate, Rental & Leasing | 29 (65.9%) | 15 (34.1%) |
| Professional & Scientific | 54 (54.0%) | 46 (46.0%) |
| Enterprise Management | 0 (0.0%) | 0 (0.0%) |
| Administrative & Support | 115 (50.4%) | 113 (49.6%) |
| Educational Services | 99 (34.5%) | 188 (65.5%) |
| Health Care & Social Assistance | 145 (24.2%) | 455 (75.8%) |
| Arts, Entertainment & Recreation | 51 (100.0%) | 0 (0.0%) |
| Accommodation & Food Services | 114 (29.4%) | 274 (70.6%) |
| Public Administration | 38 (26.2%) | 107 (73.8%) |
| Total | 2,728 (53.3%) | 2,388 (46.7%) |
Education in Lake Station
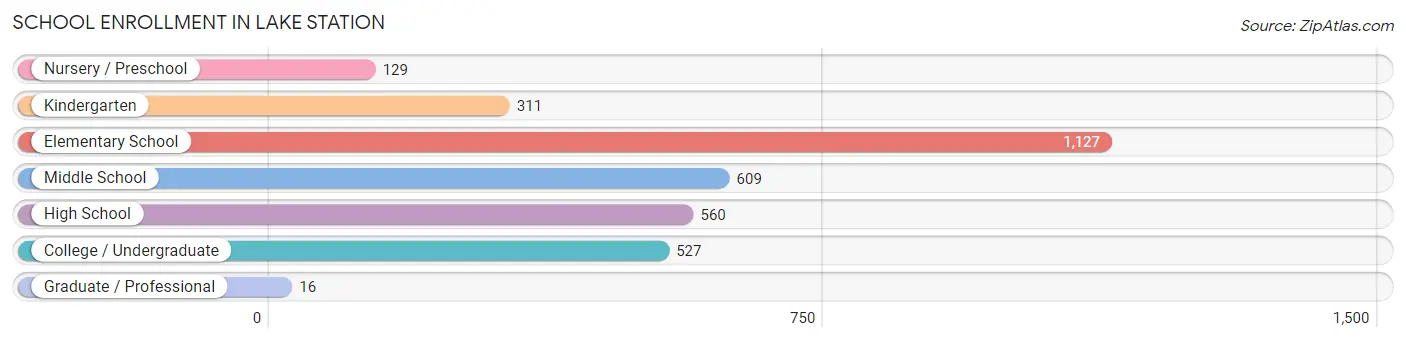
School Enrollment in Lake Station
The most common levels of schooling among the 3,279 students in Lake Station are elementary school (1,127 | 34.4%), middle school (609 | 18.6%), and high school (560 | 17.1%).
| School Level | # Students | % Students |
| Nursery / Preschool | 129 | 3.9% |
| Kindergarten | 311 | 9.5% |
| Elementary School | 1,127 | 34.4% |
| Middle School | 609 | 18.6% |
| High School | 560 | 17.1% |
| College / Undergraduate | 527 | 16.1% |
| Graduate / Professional | 16 | 0.5% |
| Total | 3,279 | 100.0% |
School Enrollment by Age by Funding Source in Lake Station
Out of a total of 3,279 students who are enrolled in schools in Lake Station, 213 (6.5%) attend a private institution, while the remaining 3,066 (93.5%) are enrolled in public schools. The age group of 3 to 4 year olds has the highest likelihood of being enrolled in private schools, with 28 (38.9% in the age bracket) enrolled. Conversely, the age group of 5 to 9 year old has the lowest likelihood of being enrolled in a private school, with 1,406 (100.0% in the age bracket) attending a public institution.
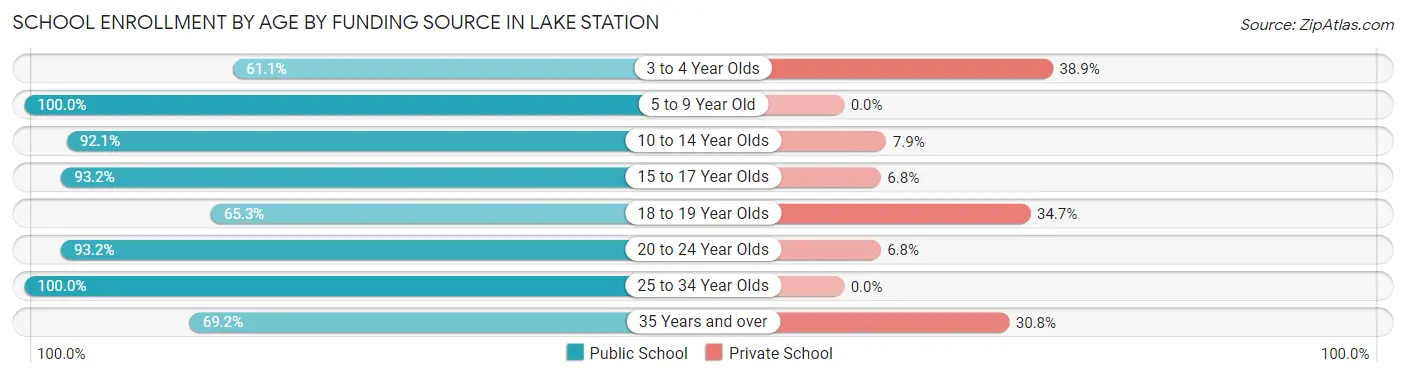
| Age Bracket | Public School | Private School |
| 3 to 4 Year Olds | 44 (61.1%) | 28 (38.9%) |
| 5 to 9 Year Old | 1,406 (100.0%) | 0 (0.0%) |
| 10 to 14 Year Olds | 726 (92.1%) | 62 (7.9%) |
| 15 to 17 Year Olds | 327 (93.2%) | 24 (6.8%) |
| 18 to 19 Year Olds | 94 (65.3%) | 50 (34.7%) |
| 20 to 24 Year Olds | 329 (93.2%) | 24 (6.8%) |
| 25 to 34 Year Olds | 87 (100.0%) | 0 (0.0%) |
| 35 Years and over | 54 (69.2%) | 24 (30.8%) |
| Total | 3,066 (93.5%) | 213 (6.5%) |
Educational Attainment by Field of Study in Lake Station
Arts & humanities (151 | 19.2%), education (114 | 14.5%), business (105 | 13.3%), psychology (100 | 12.7%), and science & technology (70 | 8.9%) are the most common fields of study among 787 individuals in Lake Station who have obtained a bachelor's degree or higher.
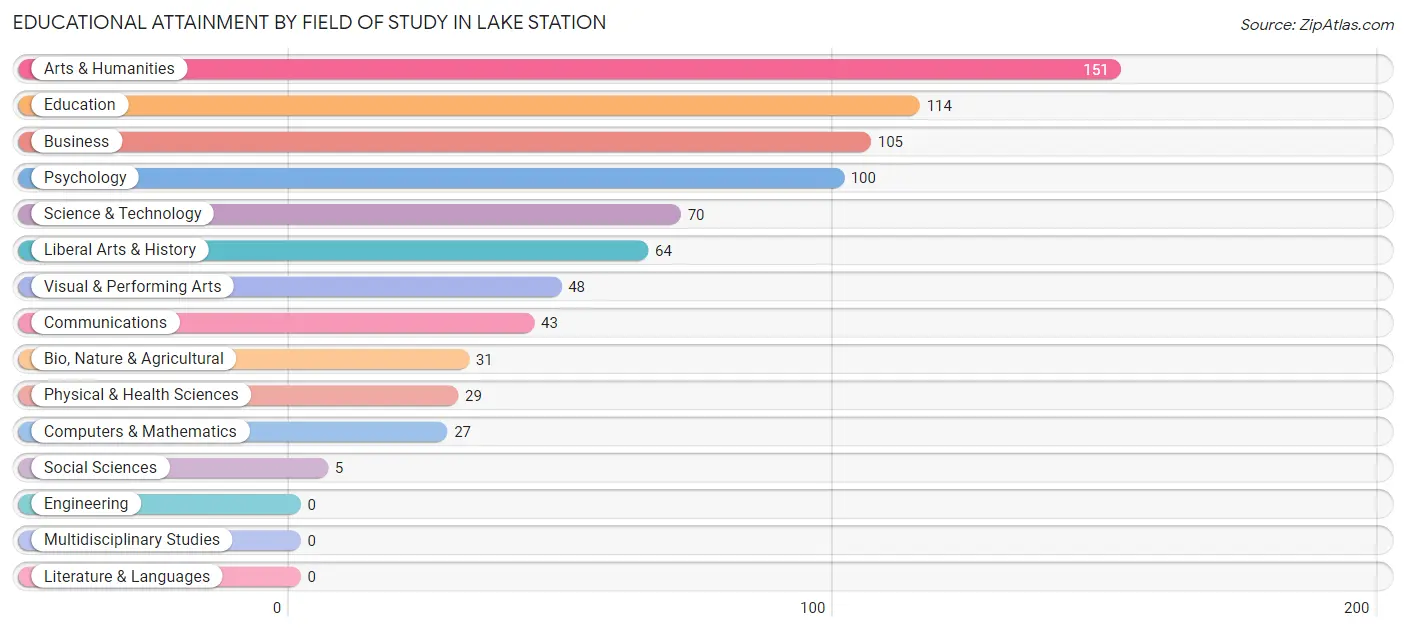
| Field of Study | # Graduates | % Graduates |
| Computers & Mathematics | 27 | 3.4% |
| Bio, Nature & Agricultural | 31 | 3.9% |
| Physical & Health Sciences | 29 | 3.7% |
| Psychology | 100 | 12.7% |
| Social Sciences | 5 | 0.6% |
| Engineering | 0 | 0.0% |
| Multidisciplinary Studies | 0 | 0.0% |
| Science & Technology | 70 | 8.9% |
| Business | 105 | 13.3% |
| Education | 114 | 14.5% |
| Literature & Languages | 0 | 0.0% |
| Liberal Arts & History | 64 | 8.1% |
| Visual & Performing Arts | 48 | 6.1% |
| Communications | 43 | 5.5% |
| Arts & Humanities | 151 | 19.2% |
| Total | 787 | 100.0% |
Transportation & Commute in Lake Station
Vehicle Availability by Sex in Lake Station
The most prevalent vehicle ownership categories in Lake Station are males with 2 vehicles (1,217, accounting for 45.2%) and females with 2 vehicles (1,224, making up 53.1%).
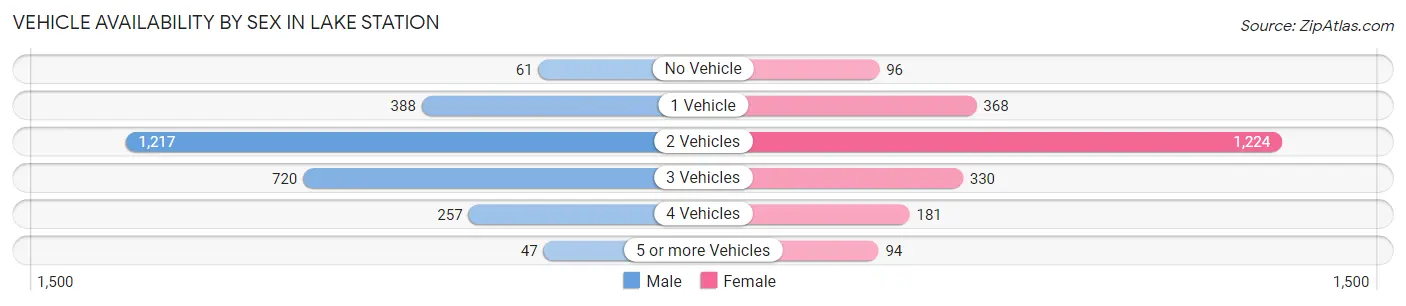
| Vehicles Available | Male | Female |
| No Vehicle | 61 (2.3%) | 96 (4.2%) |
| 1 Vehicle | 388 (14.4%) | 368 (16.1%) |
| 2 Vehicles | 1,217 (45.2%) | 1,224 (53.4%) |
| 3 Vehicles | 720 (26.8%) | 330 (14.4%) |
| 4 Vehicles | 257 (9.6%) | 181 (7.9%) |
| 5 or more Vehicles | 47 (1.8%) | 94 (4.1%) |
| Total | 2,690 (100.0%) | 2,293 (100.0%) |
Commute Time in Lake Station
The most frequently occuring commute durations in Lake Station are 20 to 24 minutes (765 commuters, 16.0%), 15 to 19 minutes (751 commuters, 15.7%), and 30 to 34 minutes (681 commuters, 14.2%).
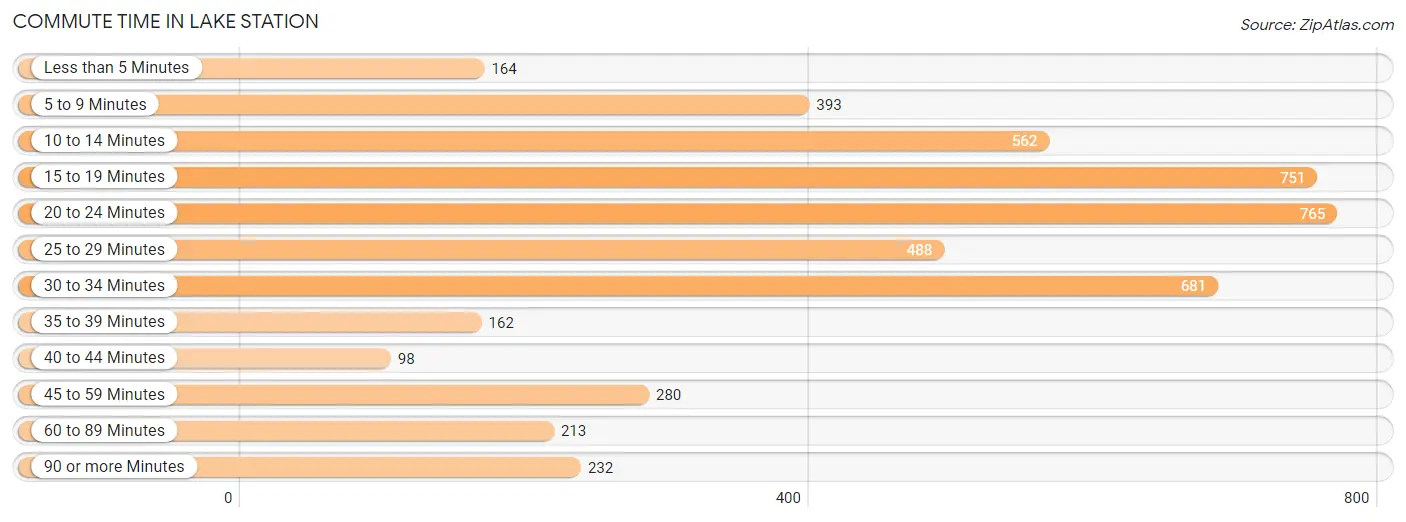
| Commute Time | # Commuters | % Commuters |
| Less than 5 Minutes | 164 | 3.4% |
| 5 to 9 Minutes | 393 | 8.2% |
| 10 to 14 Minutes | 562 | 11.7% |
| 15 to 19 Minutes | 751 | 15.7% |
| 20 to 24 Minutes | 765 | 16.0% |
| 25 to 29 Minutes | 488 | 10.2% |
| 30 to 34 Minutes | 681 | 14.2% |
| 35 to 39 Minutes | 162 | 3.4% |
| 40 to 44 Minutes | 98 | 2.1% |
| 45 to 59 Minutes | 280 | 5.9% |
| 60 to 89 Minutes | 213 | 4.4% |
| 90 or more Minutes | 232 | 4.8% |
Commute Time by Sex in Lake Station
The most common commute times in Lake Station are 30 to 34 minutes (423 commuters, 16.1%) for males and 20 to 24 minutes (383 commuters, 17.7%) for females.
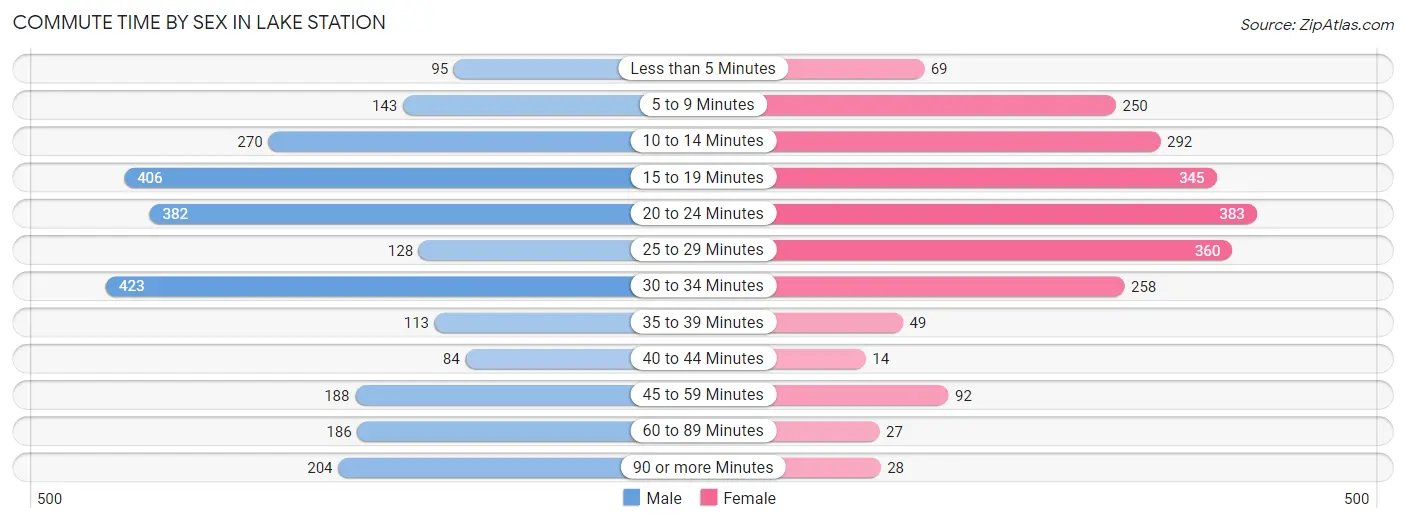
| Commute Time | Male | Female |
| Less than 5 Minutes | 95 (3.6%) | 69 (3.2%) |
| 5 to 9 Minutes | 143 (5.4%) | 250 (11.5%) |
| 10 to 14 Minutes | 270 (10.3%) | 292 (13.5%) |
| 15 to 19 Minutes | 406 (15.5%) | 345 (15.9%) |
| 20 to 24 Minutes | 382 (14.6%) | 383 (17.7%) |
| 25 to 29 Minutes | 128 (4.9%) | 360 (16.6%) |
| 30 to 34 Minutes | 423 (16.1%) | 258 (11.9%) |
| 35 to 39 Minutes | 113 (4.3%) | 49 (2.3%) |
| 40 to 44 Minutes | 84 (3.2%) | 14 (0.6%) |
| 45 to 59 Minutes | 188 (7.2%) | 92 (4.3%) |
| 60 to 89 Minutes | 186 (7.1%) | 27 (1.3%) |
| 90 or more Minutes | 204 (7.8%) | 28 (1.3%) |
Time of Departure to Work by Sex in Lake Station
The most frequent times of departure to work in Lake Station are 12:00 AM to 4:59 AM (480, 18.3%) for males and 12:00 AM to 4:59 AM (287, 13.2%) for females.
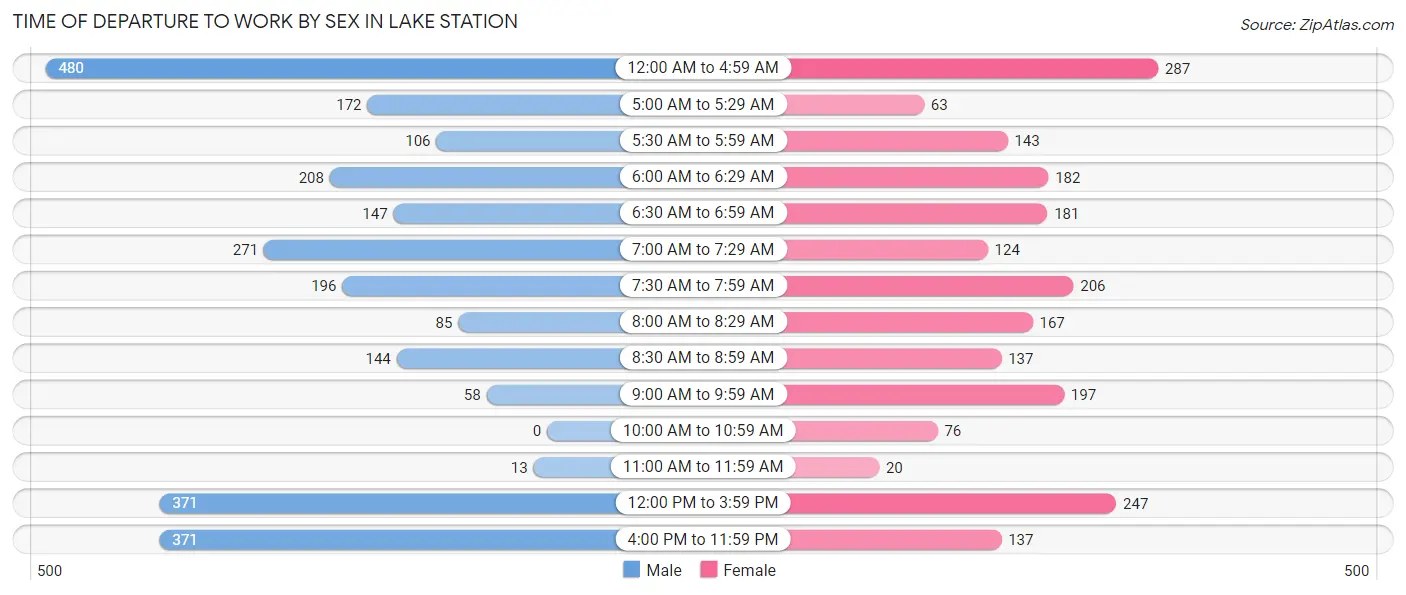
| Time of Departure | Male | Female |
| 12:00 AM to 4:59 AM | 480 (18.3%) | 287 (13.2%) |
| 5:00 AM to 5:29 AM | 172 (6.6%) | 63 (2.9%) |
| 5:30 AM to 5:59 AM | 106 (4.0%) | 143 (6.6%) |
| 6:00 AM to 6:29 AM | 208 (7.9%) | 182 (8.4%) |
| 6:30 AM to 6:59 AM | 147 (5.6%) | 181 (8.4%) |
| 7:00 AM to 7:29 AM | 271 (10.3%) | 124 (5.7%) |
| 7:30 AM to 7:59 AM | 196 (7.5%) | 206 (9.5%) |
| 8:00 AM to 8:29 AM | 85 (3.2%) | 167 (7.7%) |
| 8:30 AM to 8:59 AM | 144 (5.5%) | 137 (6.3%) |
| 9:00 AM to 9:59 AM | 58 (2.2%) | 197 (9.1%) |
| 10:00 AM to 10:59 AM | 0 (0.0%) | 76 (3.5%) |
| 11:00 AM to 11:59 AM | 13 (0.5%) | 20 (0.9%) |
| 12:00 PM to 3:59 PM | 371 (14.1%) | 247 (11.4%) |
| 4:00 PM to 11:59 PM | 371 (14.1%) | 137 (6.3%) |
| Total | 2,622 (100.0%) | 2,167 (100.0%) |
Housing Occupancy in Lake Station
Occupancy by Ownership in Lake Station
Of the total 4,888 dwellings in Lake Station, owner-occupied units account for 3,276 (67.0%), while renter-occupied units make up 1,612 (33.0%).
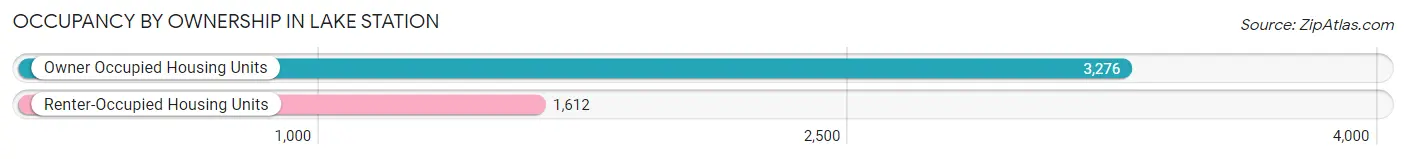
| Occupancy | # Housing Units | % Housing Units |
| Owner Occupied Housing Units | 3,276 | 67.0% |
| Renter-Occupied Housing Units | 1,612 | 33.0% |
| Total Occupied Housing Units | 4,888 | 100.0% |
Occupancy by Household Size in Lake Station
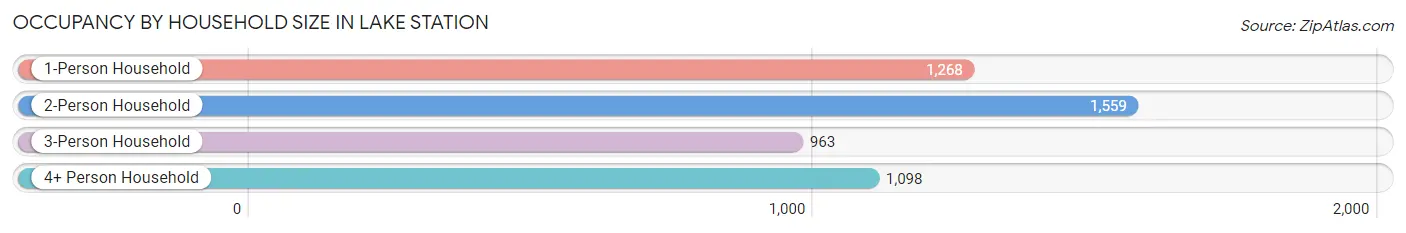
| Household Size | # Housing Units | % Housing Units |
| 1-Person Household | 1,268 | 25.9% |
| 2-Person Household | 1,559 | 31.9% |
| 3-Person Household | 963 | 19.7% |
| 4+ Person Household | 1,098 | 22.5% |
| Total Housing Units | 4,888 | 100.0% |
Occupancy by Ownership by Household Size in Lake Station
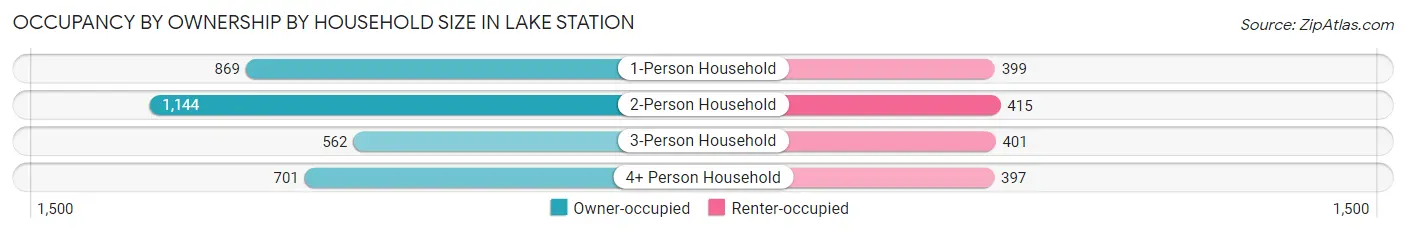
| Household Size | Owner-occupied | Renter-occupied |
| 1-Person Household | 869 (68.5%) | 399 (31.5%) |
| 2-Person Household | 1,144 (73.4%) | 415 (26.6%) |
| 3-Person Household | 562 (58.4%) | 401 (41.6%) |
| 4+ Person Household | 701 (63.8%) | 397 (36.2%) |
| Total Housing Units | 3,276 (67.0%) | 1,612 (33.0%) |
Occupancy by Educational Attainment in Lake Station
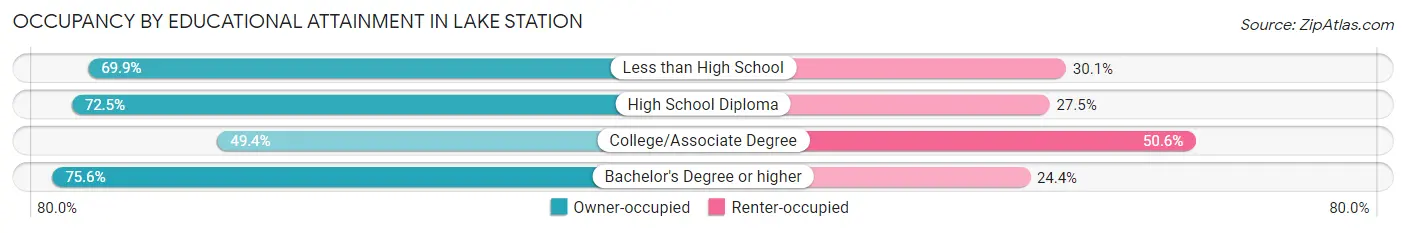
| Household Size | Owner-occupied | Renter-occupied |
| Less than High School | 676 (69.9%) | 291 (30.1%) |
| High School Diploma | 1,638 (72.5%) | 621 (27.5%) |
| College/Associate Degree | 556 (49.4%) | 569 (50.6%) |
| Bachelor's Degree or higher | 406 (75.6%) | 131 (24.4%) |
Occupancy by Age of Householder in Lake Station
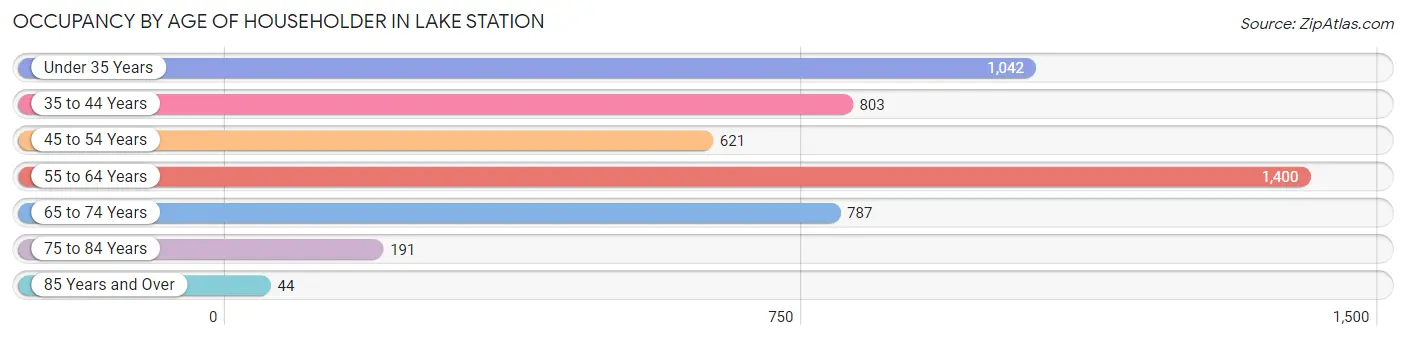
| Age Bracket | # Households | % Households |
| Under 35 Years | 1,042 | 21.3% |
| 35 to 44 Years | 803 | 16.4% |
| 45 to 54 Years | 621 | 12.7% |
| 55 to 64 Years | 1,400 | 28.6% |
| 65 to 74 Years | 787 | 16.1% |
| 75 to 84 Years | 191 | 3.9% |
| 85 Years and Over | 44 | 0.9% |
| Total | 4,888 | 100.0% |
Housing Finances in Lake Station
Median Income by Occupancy in Lake Station
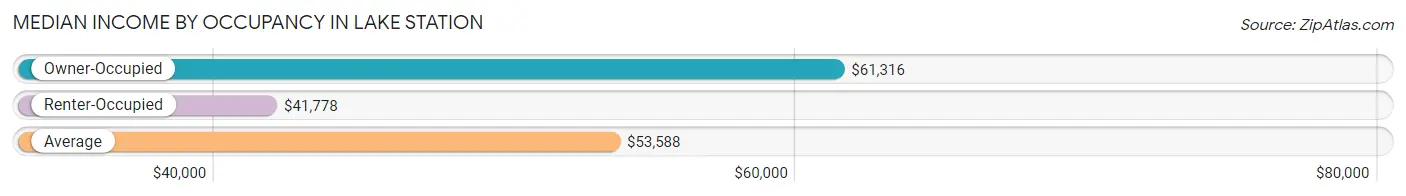
| Occupancy Type | # Households | Median Income |
| Owner-Occupied | 3,276 (67.0%) | $61,316 |
| Renter-Occupied | 1,612 (33.0%) | $41,778 |
| Average | 4,888 (100.0%) | $53,588 |
Occupancy by Householder Income Bracket in Lake Station
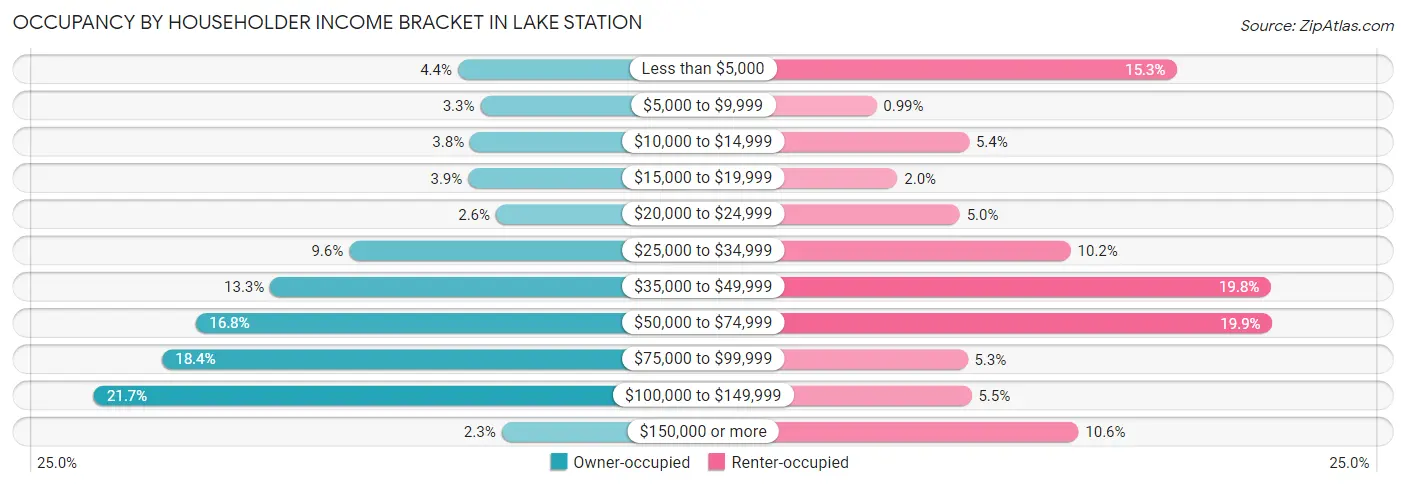
| Income Bracket | Owner-occupied | Renter-occupied |
| Less than $5,000 | 143 (4.4%) | 247 (15.3%) |
| $5,000 to $9,999 | 108 (3.3%) | 16 (1.0%) |
| $10,000 to $14,999 | 124 (3.8%) | 87 (5.4%) |
| $15,000 to $19,999 | 127 (3.9%) | 32 (2.0%) |
| $20,000 to $24,999 | 84 (2.6%) | 80 (5.0%) |
| $25,000 to $34,999 | 313 (9.6%) | 165 (10.2%) |
| $35,000 to $49,999 | 436 (13.3%) | 319 (19.8%) |
| $50,000 to $74,999 | 551 (16.8%) | 320 (19.9%) |
| $75,000 to $99,999 | 604 (18.4%) | 86 (5.3%) |
| $100,000 to $149,999 | 711 (21.7%) | 89 (5.5%) |
| $150,000 or more | 75 (2.3%) | 171 (10.6%) |
| Total | 3,276 (100.0%) | 1,612 (100.0%) |
Monthly Housing Cost Tiers in Lake Station
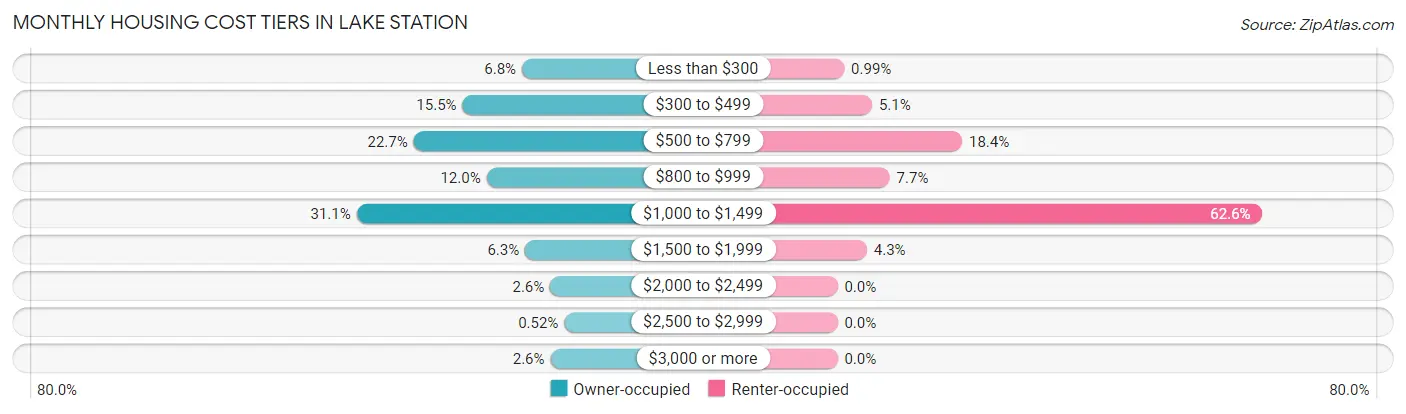
| Monthly Cost | Owner-occupied | Renter-occupied |
| Less than $300 | 221 (6.8%) | 16 (1.0%) |
| $300 to $499 | 508 (15.5%) | 82 (5.1%) |
| $500 to $799 | 744 (22.7%) | 296 (18.4%) |
| $800 to $999 | 392 (12.0%) | 124 (7.7%) |
| $1,000 to $1,499 | 1,019 (31.1%) | 1,009 (62.6%) |
| $1,500 to $1,999 | 206 (6.3%) | 70 (4.3%) |
| $2,000 to $2,499 | 85 (2.6%) | 0 (0.0%) |
| $2,500 to $2,999 | 17 (0.5%) | 0 (0.0%) |
| $3,000 or more | 84 (2.6%) | 0 (0.0%) |
| Total | 3,276 (100.0%) | 1,612 (100.0%) |
Physical Housing Characteristics in Lake Station
Housing Structures in Lake Station
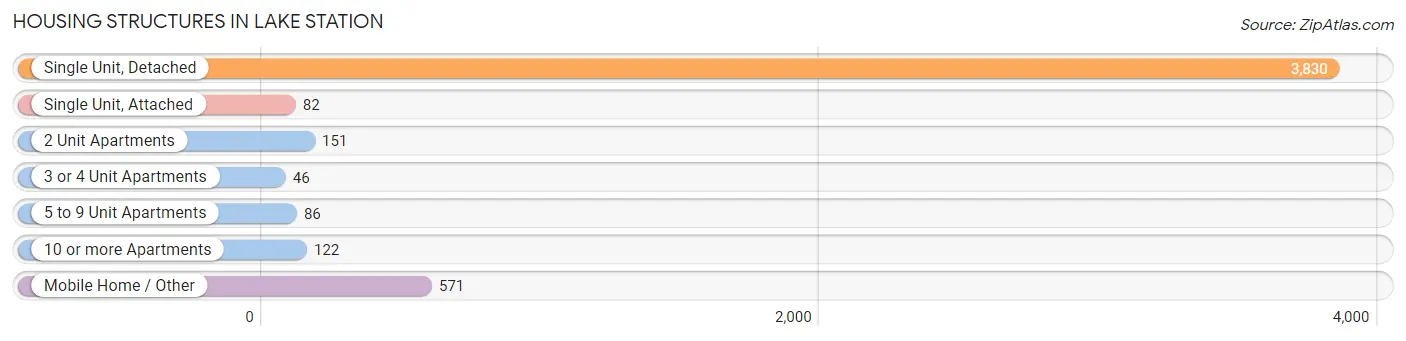
| Structure Type | # Housing Units | % Housing Units |
| Single Unit, Detached | 3,830 | 78.4% |
| Single Unit, Attached | 82 | 1.7% |
| 2 Unit Apartments | 151 | 3.1% |
| 3 or 4 Unit Apartments | 46 | 0.9% |
| 5 to 9 Unit Apartments | 86 | 1.8% |
| 10 or more Apartments | 122 | 2.5% |
| Mobile Home / Other | 571 | 11.7% |
| Total | 4,888 | 100.0% |
Housing Structures by Occupancy in Lake Station
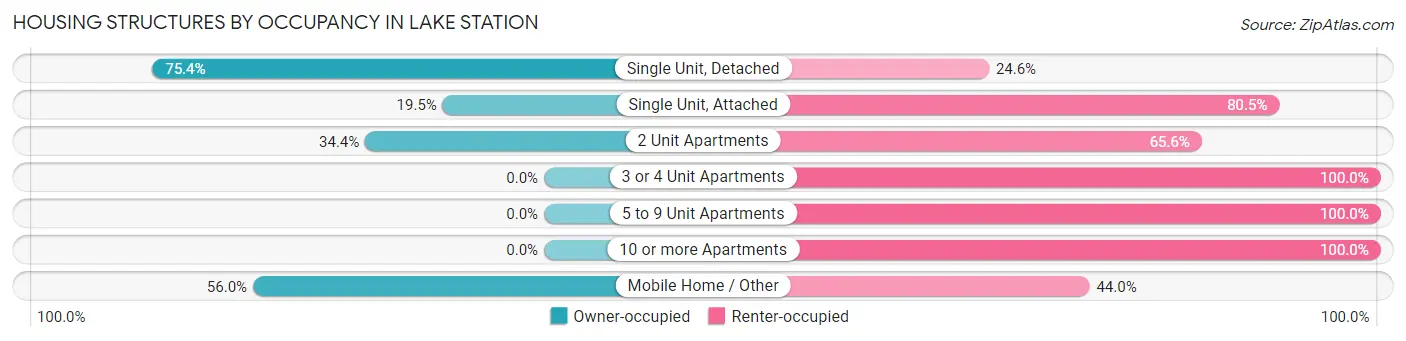
| Structure Type | Owner-occupied | Renter-occupied |
| Single Unit, Detached | 2,888 (75.4%) | 942 (24.6%) |
| Single Unit, Attached | 16 (19.5%) | 66 (80.5%) |
| 2 Unit Apartments | 52 (34.4%) | 99 (65.6%) |
| 3 or 4 Unit Apartments | 0 (0.0%) | 46 (100.0%) |
| 5 to 9 Unit Apartments | 0 (0.0%) | 86 (100.0%) |
| 10 or more Apartments | 0 (0.0%) | 122 (100.0%) |
| Mobile Home / Other | 320 (56.0%) | 251 (44.0%) |
| Total | 3,276 (67.0%) | 1,612 (33.0%) |
Housing Structures by Number of Rooms in Lake Station
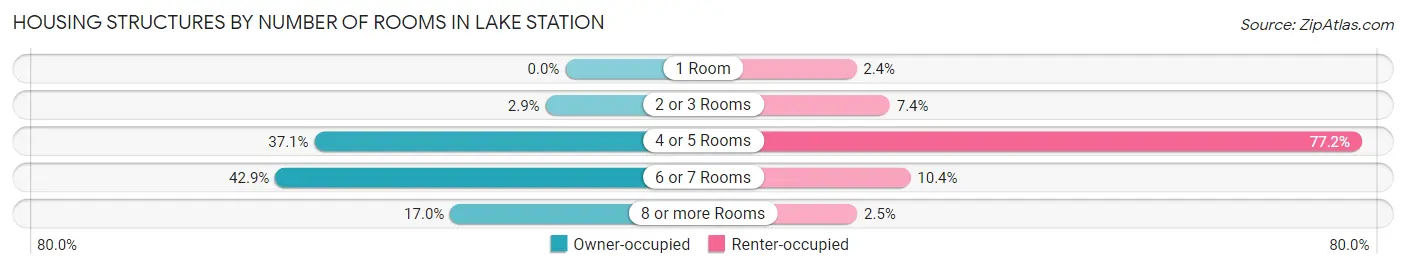
| Number of Rooms | Owner-occupied | Renter-occupied |
| 1 Room | 0 (0.0%) | 39 (2.4%) |
| 2 or 3 Rooms | 96 (2.9%) | 119 (7.4%) |
| 4 or 5 Rooms | 1,216 (37.1%) | 1,245 (77.2%) |
| 6 or 7 Rooms | 1,406 (42.9%) | 168 (10.4%) |
| 8 or more Rooms | 558 (17.0%) | 41 (2.5%) |
| Total | 3,276 (100.0%) | 1,612 (100.0%) |
Housing Structure by Heating Type in Lake Station
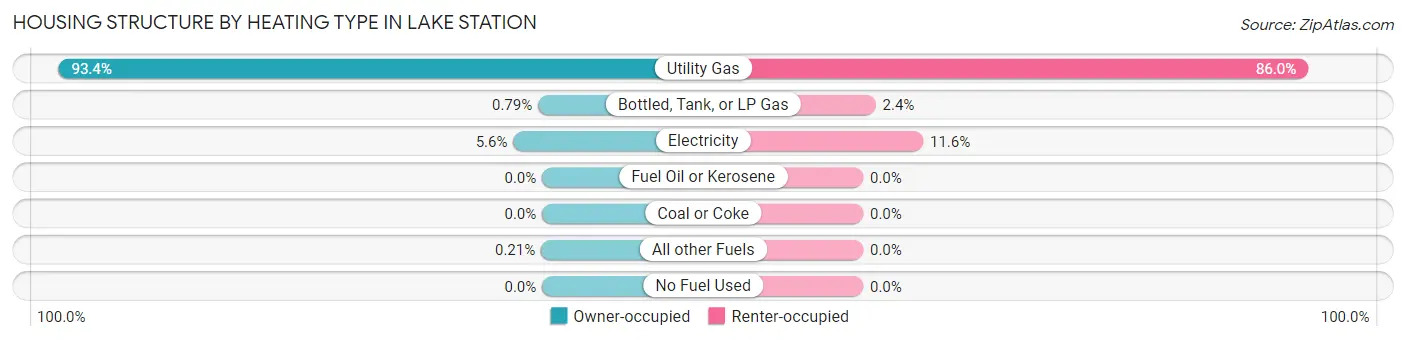
| Heating Type | Owner-occupied | Renter-occupied |
| Utility Gas | 3,061 (93.4%) | 1,386 (86.0%) |
| Bottled, Tank, or LP Gas | 26 (0.8%) | 39 (2.4%) |
| Electricity | 182 (5.6%) | 187 (11.6%) |
| Fuel Oil or Kerosene | 0 (0.0%) | 0 (0.0%) |
| Coal or Coke | 0 (0.0%) | 0 (0.0%) |
| All other Fuels | 7 (0.2%) | 0 (0.0%) |
| No Fuel Used | 0 (0.0%) | 0 (0.0%) |
| Total | 3,276 (100.0%) | 1,612 (100.0%) |
Household Vehicle Usage in Lake Station
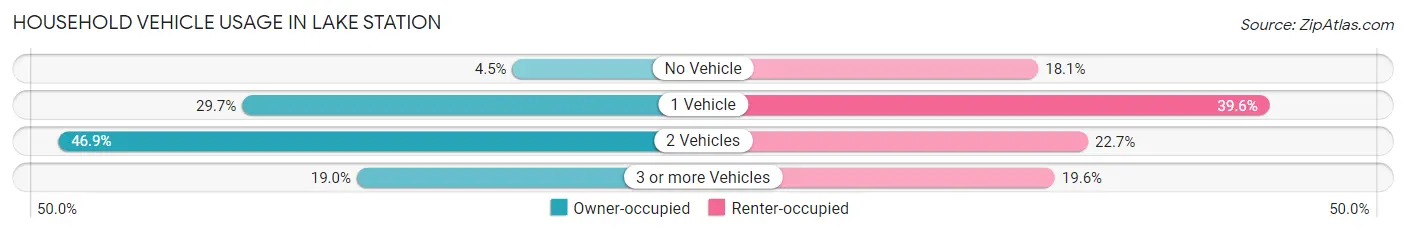
| Vehicles per Household | Owner-occupied | Renter-occupied |
| No Vehicle | 146 (4.5%) | 291 (18.0%) |
| 1 Vehicle | 973 (29.7%) | 639 (39.6%) |
| 2 Vehicles | 1,535 (46.9%) | 366 (22.7%) |
| 3 or more Vehicles | 622 (19.0%) | 316 (19.6%) |
| Total | 3,276 (100.0%) | 1,612 (100.0%) |
Real Estate & Mortgages in Lake Station
Real Estate and Mortgage Overview in Lake Station
| Characteristic | Without Mortgage | With Mortgage |
| Housing Units | 1,299 | 1,977 |
| Median Property Value | $83,100 | $118,400 |
| Median Household Income | $35,393 | $45 |
| Monthly Housing Costs | $485 | $84 |
| Real Estate Taxes | $1,129 | $31 |
Property Value by Mortgage Status in Lake Station
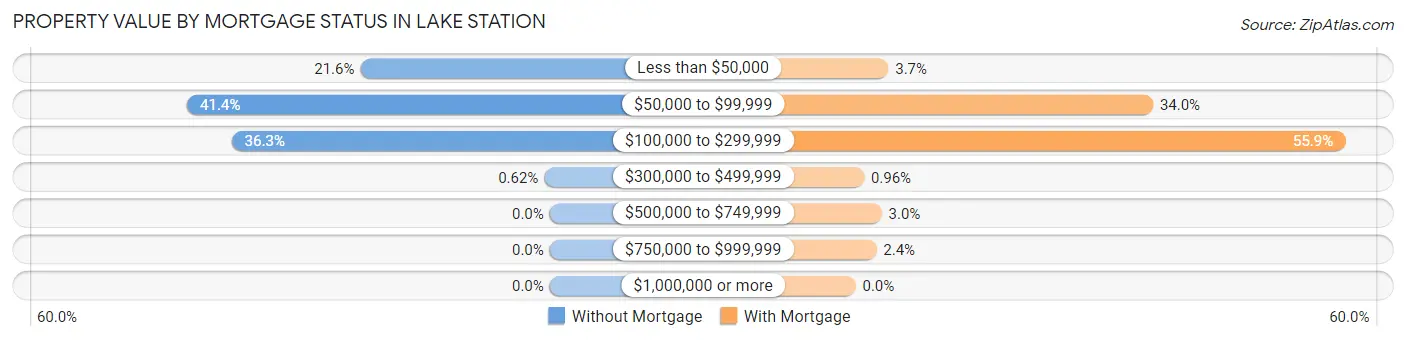
| Property Value | Without Mortgage | With Mortgage |
| Less than $50,000 | 281 (21.6%) | 74 (3.7%) |
| $50,000 to $99,999 | 538 (41.4%) | 672 (34.0%) |
| $100,000 to $299,999 | 472 (36.3%) | 1,106 (55.9%) |
| $300,000 to $499,999 | 8 (0.6%) | 19 (1.0%) |
| $500,000 to $749,999 | 0 (0.0%) | 59 (3.0%) |
| $750,000 to $999,999 | 0 (0.0%) | 47 (2.4%) |
| $1,000,000 or more | 0 (0.0%) | 0 (0.0%) |
| Total | 1,299 (100.0%) | 1,977 (100.0%) |
Household Income by Mortgage Status in Lake Station
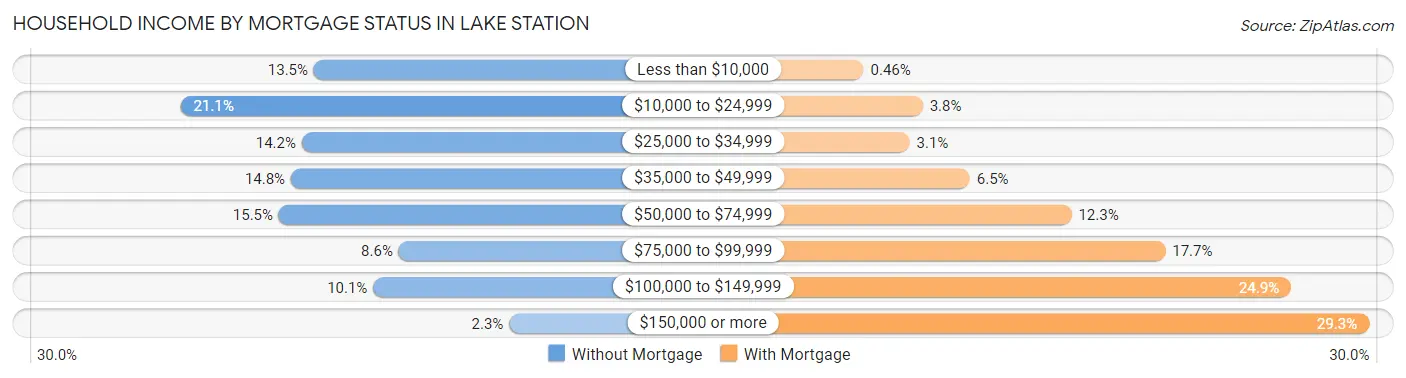
| Household Income | Without Mortgage | With Mortgage |
| Less than $10,000 | 175 (13.5%) | 9 (0.5%) |
| $10,000 to $24,999 | 274 (21.1%) | 76 (3.8%) |
| $25,000 to $34,999 | 184 (14.2%) | 61 (3.1%) |
| $35,000 to $49,999 | 192 (14.8%) | 129 (6.5%) |
| $50,000 to $74,999 | 201 (15.5%) | 244 (12.3%) |
| $75,000 to $99,999 | 112 (8.6%) | 350 (17.7%) |
| $100,000 to $149,999 | 131 (10.1%) | 492 (24.9%) |
| $150,000 or more | 30 (2.3%) | 580 (29.3%) |
| Total | 1,299 (100.0%) | 1,977 (100.0%) |
Property Value to Household Income Ratio in Lake Station
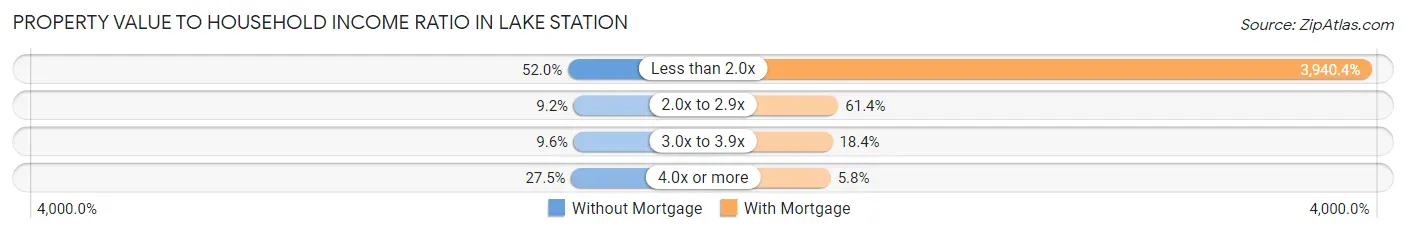
| Value-to-Income Ratio | Without Mortgage | With Mortgage |
| Less than 2.0x | 675 (52.0%) | 77,901 (3,940.4%) |
| 2.0x to 2.9x | 120 (9.2%) | 1,214 (61.4%) |
| 3.0x to 3.9x | 125 (9.6%) | 363 (18.4%) |
| 4.0x or more | 357 (27.5%) | 114 (5.8%) |
| Total | 1,299 (100.0%) | 1,977 (100.0%) |
Real Estate Taxes by Mortgage Status in Lake Station
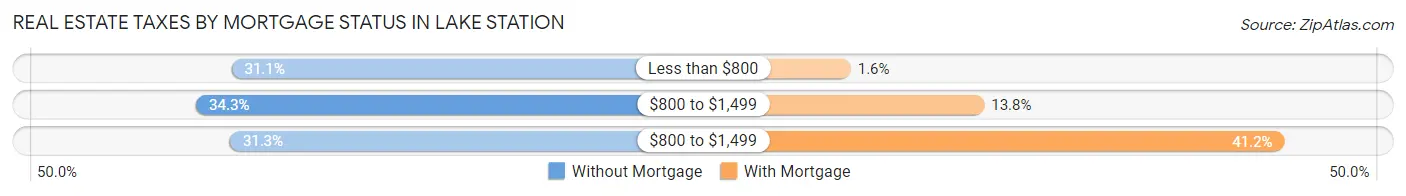
| Property Taxes | Without Mortgage | With Mortgage |
| Less than $800 | 404 (31.1%) | 32 (1.6%) |
| $800 to $1,499 | 446 (34.3%) | 273 (13.8%) |
| $800 to $1,499 | 406 (31.2%) | 815 (41.2%) |
| Total | 1,299 (100.0%) | 1,977 (100.0%) |
Health & Disability in Lake Station
Health Insurance Coverage by Age in Lake Station
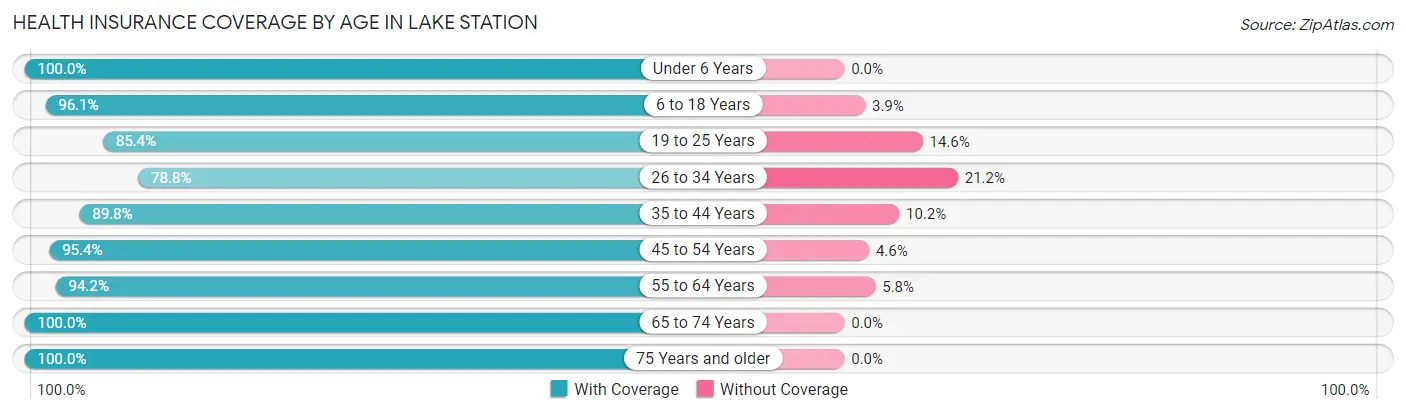
| Age Bracket | With Coverage | Without Coverage |
| Under 6 Years | 1,038 (100.0%) | 0 (0.0%) |
| 6 to 18 Years | 2,459 (96.1%) | 99 (3.9%) |
| 19 to 25 Years | 1,464 (85.4%) | 250 (14.6%) |
| 26 to 34 Years | 1,278 (78.8%) | 343 (21.2%) |
| 35 to 44 Years | 1,318 (89.8%) | 150 (10.2%) |
| 45 to 54 Years | 1,120 (95.4%) | 54 (4.6%) |
| 55 to 64 Years | 2,006 (94.2%) | 123 (5.8%) |
| 65 to 74 Years | 1,130 (100.0%) | 0 (0.0%) |
| 75 Years and older | 417 (100.0%) | 0 (0.0%) |
| Total | 12,230 (92.3%) | 1,019 (7.7%) |
Health Insurance Coverage by Citizenship Status in Lake Station

| Citizenship Status | With Coverage | Without Coverage |
| Native Born | 1,038 (100.0%) | 0 (0.0%) |
| Foreign Born, Citizen | 2,459 (96.1%) | 99 (3.9%) |
| Foreign Born, not a Citizen | 1,464 (85.4%) | 250 (14.6%) |
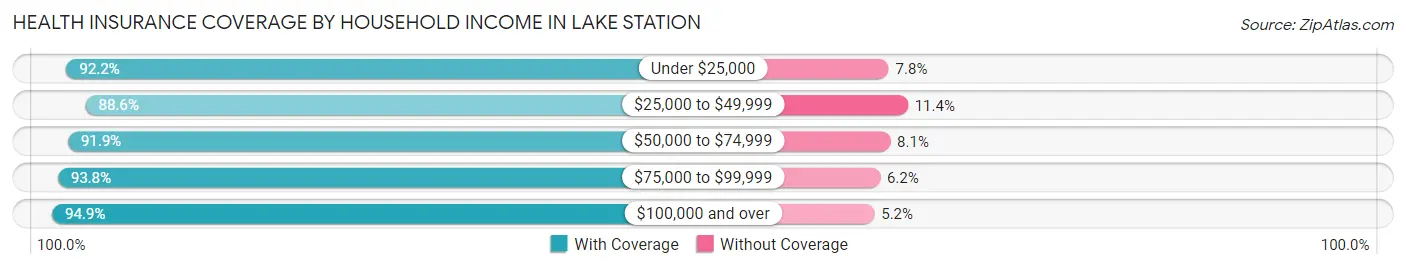
Health Insurance Coverage by Household Income in Lake Station
| Household Income | With Coverage | Without Coverage |
| Under $25,000 | 1,881 (92.2%) | 160 (7.8%) |
| $25,000 to $49,999 | 2,576 (88.6%) | 332 (11.4%) |
| $50,000 to $74,999 | 2,457 (91.9%) | 217 (8.1%) |
| $75,000 to $99,999 | 1,929 (93.8%) | 128 (6.2%) |
| $100,000 and over | 3,350 (94.9%) | 182 (5.1%) |
Public vs Private Health Insurance Coverage by Age in Lake Station
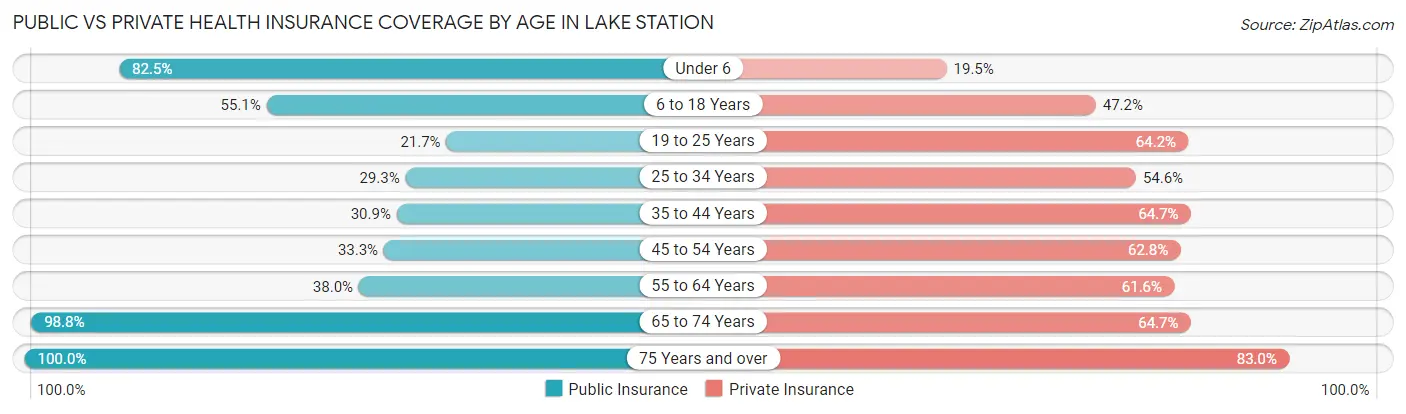
| Age Bracket | Public Insurance | Private Insurance |
| Under 6 | 856 (82.5%) | 202 (19.5%) |
| 6 to 18 Years | 1,409 (55.1%) | 1,206 (47.1%) |
| 19 to 25 Years | 372 (21.7%) | 1,101 (64.2%) |
| 25 to 34 Years | 475 (29.3%) | 885 (54.6%) |
| 35 to 44 Years | 454 (30.9%) | 950 (64.7%) |
| 45 to 54 Years | 391 (33.3%) | 737 (62.8%) |
| 55 to 64 Years | 808 (38.0%) | 1,312 (61.6%) |
| 65 to 74 Years | 1,116 (98.8%) | 731 (64.7%) |
| 75 Years and over | 417 (100.0%) | 346 (83.0%) |
| Total | 6,298 (47.5%) | 7,470 (56.4%) |
Disability Status by Sex by Age in Lake Station
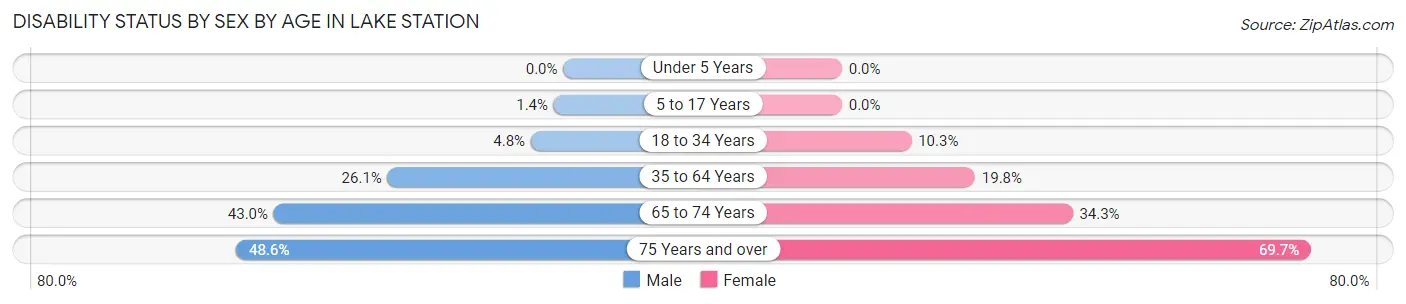
| Age Bracket | Male | Female |
| Under 5 Years | 0 (0.0%) | 0 (0.0%) |
| 5 to 17 Years | 20 (1.4%) | 0 (0.0%) |
| 18 to 34 Years | 81 (4.8%) | 190 (10.3%) |
| 35 to 64 Years | 668 (26.1%) | 437 (19.8%) |
| 65 to 74 Years | 236 (43.0%) | 199 (34.3%) |
| 75 Years and over | 52 (48.6%) | 216 (69.7%) |
Disability Class by Sex by Age in Lake Station
Disability Class: Hearing Difficulty
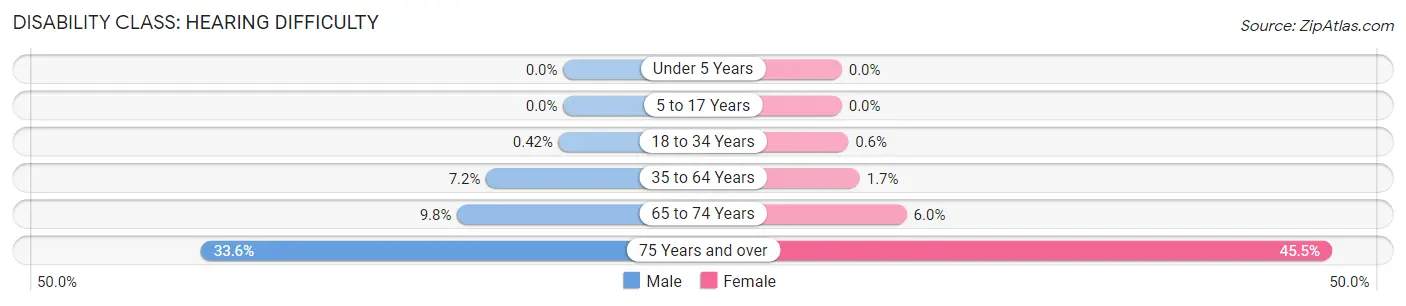
| Age Bracket | Male | Female |
| Under 5 Years | 0 (0.0%) | 0 (0.0%) |
| 5 to 17 Years | 0 (0.0%) | 0 (0.0%) |
| 18 to 34 Years | 7 (0.4%) | 11 (0.6%) |
| 35 to 64 Years | 183 (7.1%) | 37 (1.7%) |
| 65 to 74 Years | 54 (9.8%) | 35 (6.0%) |
| 75 Years and over | 36 (33.6%) | 141 (45.5%) |
Disability Class: Vision Difficulty
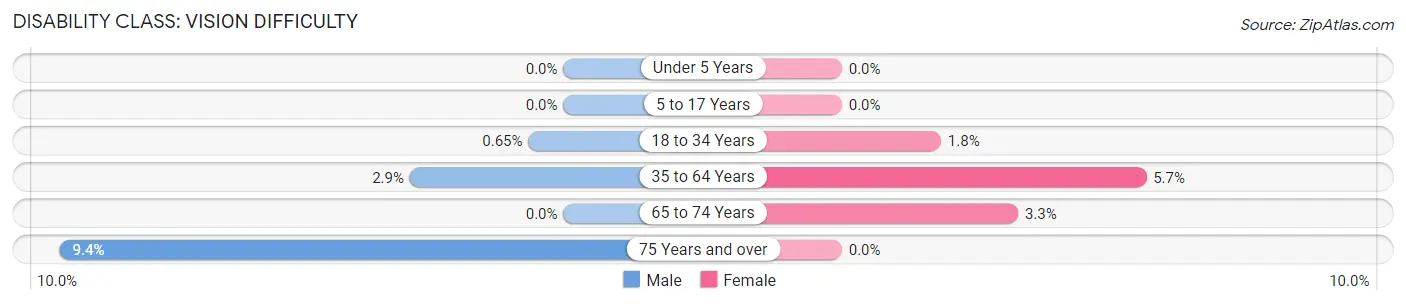
| Age Bracket | Male | Female |
| Under 5 Years | 0 (0.0%) | 0 (0.0%) |
| 5 to 17 Years | 0 (0.0%) | 0 (0.0%) |
| 18 to 34 Years | 11 (0.6%) | 34 (1.8%) |
| 35 to 64 Years | 73 (2.9%) | 125 (5.7%) |
| 65 to 74 Years | 0 (0.0%) | 19 (3.3%) |
| 75 Years and over | 10 (9.3%) | 0 (0.0%) |
Disability Class: Cognitive Difficulty
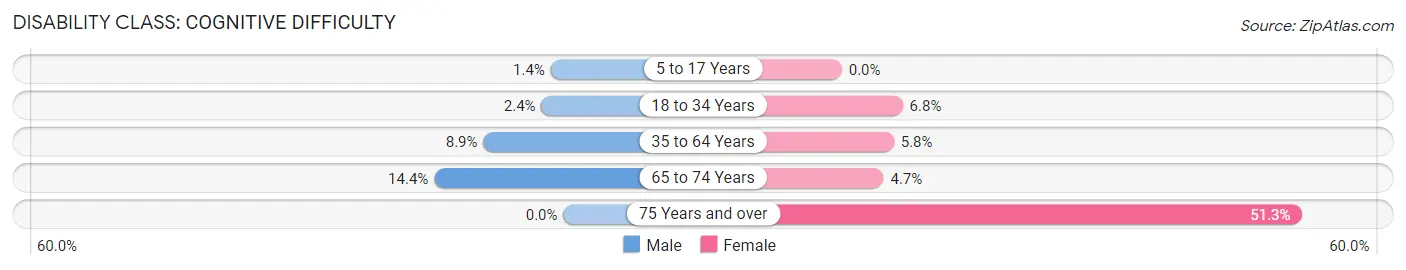
| Age Bracket | Male | Female |
| 5 to 17 Years | 20 (1.4%) | 0 (0.0%) |
| 18 to 34 Years | 41 (2.4%) | 125 (6.8%) |
| 35 to 64 Years | 228 (8.9%) | 128 (5.8%) |
| 65 to 74 Years | 79 (14.4%) | 27 (4.6%) |
| 75 Years and over | 0 (0.0%) | 159 (51.3%) |
Disability Class: Ambulatory Difficulty
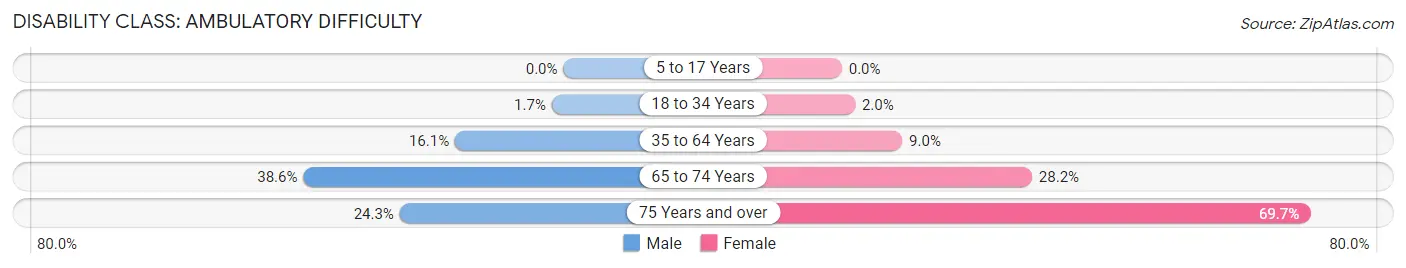
| Age Bracket | Male | Female |
| 5 to 17 Years | 0 (0.0%) | 0 (0.0%) |
| 18 to 34 Years | 29 (1.7%) | 36 (1.9%) |
| 35 to 64 Years | 412 (16.1%) | 198 (9.0%) |
| 65 to 74 Years | 212 (38.6%) | 164 (28.2%) |
| 75 Years and over | 26 (24.3%) | 216 (69.7%) |
Disability Class: Self-Care Difficulty
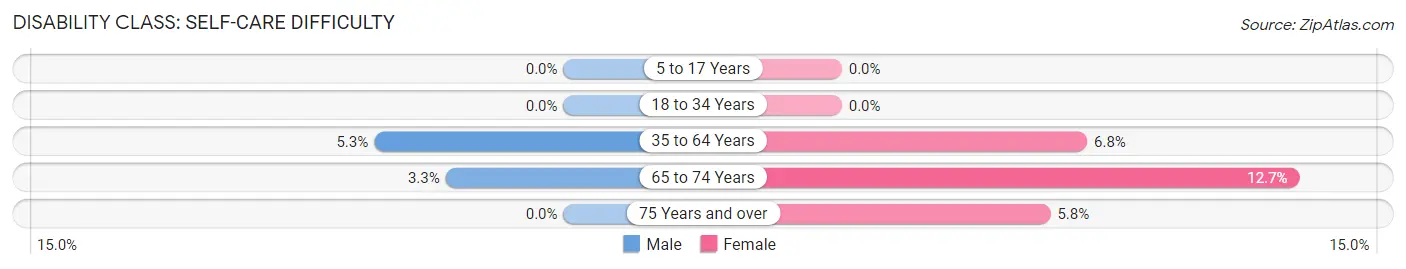
| Age Bracket | Male | Female |
| 5 to 17 Years | 0 (0.0%) | 0 (0.0%) |
| 18 to 34 Years | 0 (0.0%) | 0 (0.0%) |
| 35 to 64 Years | 135 (5.3%) | 151 (6.8%) |
| 65 to 74 Years | 18 (3.3%) | 74 (12.7%) |
| 75 Years and over | 0 (0.0%) | 18 (5.8%) |
Technology Access in Lake Station
Computing Device Access in Lake Station
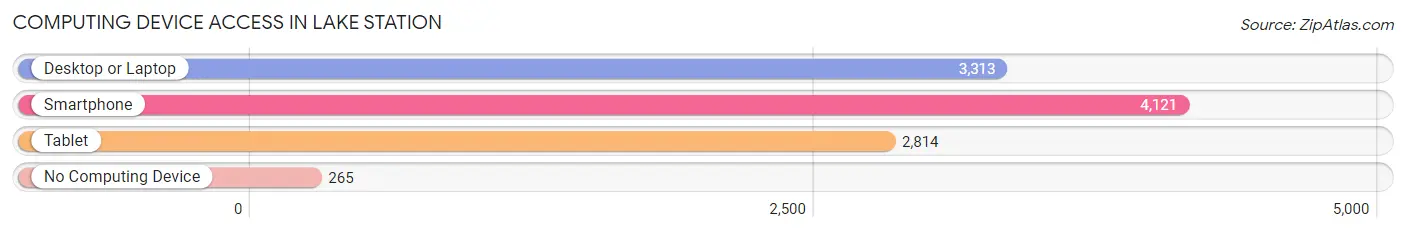
| Device Type | # Households | % Households |
| Desktop or Laptop | 3,313 | 67.8% |
| Smartphone | 4,121 | 84.3% |
| Tablet | 2,814 | 57.6% |
| No Computing Device | 265 | 5.4% |
| Total | 4,888 | 100.0% |
Internet Access in Lake Station
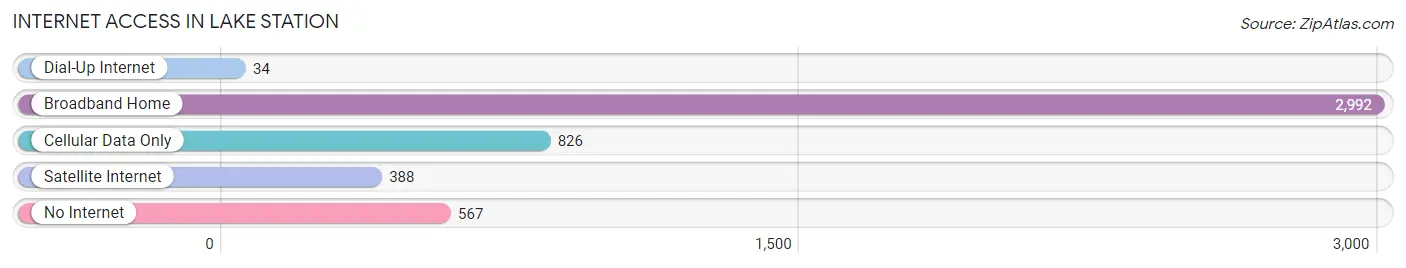
| Internet Type | # Households | % Households |
| Dial-Up Internet | 34 | 0.7% |
| Broadband Home | 2,992 | 61.2% |
| Cellular Data Only | 826 | 16.9% |
| Satellite Internet | 388 | 7.9% |
| No Internet | 567 | 11.6% |
| Total | 4,888 | 100.0% |
Lake Station Summary
Introduction
Located in Lake County, Indiana, Lake Station is a city of approximately 12,000 people. It is situated on the southern shore of Lake Michigan, just east of Gary and Hammond. The city is known for its industrial heritage, as well as its proximity to the lake. It is also home to a number of parks and recreational areas, making it a popular destination for outdoor enthusiasts.
History
The area that is now Lake Station was first settled in the early 1800s by settlers from New England. The first permanent settlement was established in 1834, when a group of settlers from New York purchased land from the Potawatomi Indians. The settlement was originally known as "New Boston," but was later renamed "Lake Station" in 1837.
The city was officially incorporated in 1869, and the first mayor was elected in 1870. The city quickly grew in size and population, and by the early 1900s, it had become a major industrial center. The city was home to several steel mills, as well as a number of other factories and businesses.
The city experienced a period of decline in the mid-20th century, as the steel industry declined and many of the factories closed. However, the city has since experienced a resurgence, and is now home to a number of businesses and industries.
Geography
Lake Station is located in the northwest corner of Lake County, Indiana. It is situated on the southern shore of Lake Michigan, just east of Gary and Hammond. The city is bordered by the cities of Hobart to the north, Merrillville to the east, and Gary to the south.
The city has a total area of 4.3 square miles, all of which is land. The terrain is generally flat, with some rolling hills in the northern part of the city. The city is located in the Kankakee River watershed, and is home to several small lakes and ponds.
Economy
Lake Station is home to a number of businesses and industries. The city is home to several steel mills, as well as a number of other factories and businesses. The city is also home to a number of retail stores, restaurants, and other businesses.
The city is also home to a number of parks and recreational areas, making it a popular destination for outdoor enthusiasts. The city is home to a number of golf courses, as well as a number of other recreational activities.
Demographics
As of the 2010 census, the population of Lake Station was 11,945. The racial makeup of the city was 79.3% White, 15.2% African American, 0.4% Native American, 0.7% Asian, 0.1% Pacific Islander, 1.7% from other races, and 2.7% from two or more races. Hispanic or Latino of any race were 5.2% of the population.
The median income for a household in the city was $37,917, and the median income for a family was $45,938. The per capita income for the city was $18,945. About 11.3% of families and 14.2% of the population were below the poverty line, including 22.2% of those under age 18 and 8.2% of those age 65 or over.
Conclusion
Lake Station is a city of approximately 12,000 people located in Lake County, Indiana. It is situated on the southern shore of Lake Michigan, just east of Gary and Hammond. The city is known for its industrial heritage, as well as its proximity to the lake. It is also home to a number of parks and recreational areas, making it a popular destination for outdoor enthusiasts. The city has a diverse economy, with a number of businesses and industries, as well as a number of retail stores, restaurants, and other businesses. The population of the city is diverse, with a mix of races and ethnicities. The median income for a household in the city is $37,917, and the median income for a family is $45,938.
Common Questions
What is Per Capita Income in Lake Station?
Per Capita income in Lake Station is $24,258.
What is the Median Family Income in Lake Station?
Median Family Income in Lake Station is $61,728.
What is the Median Household income in Lake Station?
Median Household Income in Lake Station is $53,588.
What is Income or Wage Gap in Lake Station?
Income or Wage Gap in Lake Station is 37.7%.
Women in Lake Station earn 62.3 cents for every dollar earned by a man.
What is Family Income Deficit in Lake Station?
Family Income Deficit in Lake Station is $16,100.
Families that are below poverty line in Lake Station earn $16,100 less on average than the poverty threshold level.
What is Inequality or Gini Index in Lake Station?
Inequality or Gini Index in Lake Station is 0.42.
What is the Total Population of Lake Station?
Total Population of Lake Station is 13,352.
What is the Total Male Population of Lake Station?
Total Male Population of Lake Station is 6,557.
What is the Total Female Population of Lake Station?
Total Female Population of Lake Station is 6,795.
What is the Ratio of Males per 100 Females in Lake Station?
There are 96.50 Males per 100 Females in Lake Station.
What is the Ratio of Females per 100 Males in Lake Station?
There are 103.63 Females per 100 Males in Lake Station.
What is the Median Population Age in Lake Station?
Median Population Age in Lake Station is 32.6 Years.
What is the Average Family Size in Lake Station
Average Family Size in Lake Station is 3.2 People.
What is the Average Household Size in Lake Station
Average Household Size in Lake Station is 2.7 People.
How Large is the Labor Force in Lake Station?
There are 6,258 People in the Labor Forcein in Lake Station.
What is the Percentage of People in the Labor Force in Lake Station?
61.6% of People are in the Labor Force in Lake Station.
What is the Unemployment Rate in Lake Station?
Unemployment Rate in Lake Station is 18.2%.