Connersville, IN Map & Demographics
Connersville Map
Connersville Overview
$23,426
PER CAPITA INCOME
$52,271
AVG FAMILY INCOME
$41,769
AVG HOUSEHOLD INCOME
52.9%
WAGE / INCOME GAP [ % ]
47.1¢/ $1
WAGE / INCOME GAP [ $ ]
$8,971
FAMILY INCOME DEFICIT
0.41
INEQUALITY / GINI INDEX
13,395
TOTAL POPULATION
6,396
MALE POPULATION
6,999
FEMALE POPULATION
91.38
MALES / 100 FEMALES
109.43
FEMALES / 100 MALES
40.6
MEDIAN AGE
3.0
AVG FAMILY SIZE
2.3
AVG HOUSEHOLD SIZE
6,073
LABOR FORCE [ PEOPLE ]
56.6%
PERCENT IN LABOR FORCE
5.8%
UNEMPLOYMENT RATE
Connersville Zip Codes
Connersville Area Codes
Income in Connersville
Income Overview in Connersville
Per Capita Income in Connersville is $23,426, while median incomes of families and households are $52,271 and $41,769 respectively.
| Characteristic | Number | Measure |
| Per Capita Income | 13,395 | $23,426 |
| Median Family Income | 3,181 | $52,271 |
| Mean Family Income | 3,181 | $62,941 |
| Median Household Income | 5,706 | $41,769 |
| Mean Household Income | 5,706 | $52,706 |
| Income Deficit | 3,181 | $8,971 |
| Wage / Income Gap (%) | 13,395 | 52.87% |
| Wage / Income Gap ($) | 13,395 | 47.13¢ per $1 |
| Gini / Inequality Index | 13,395 | 0.41 |
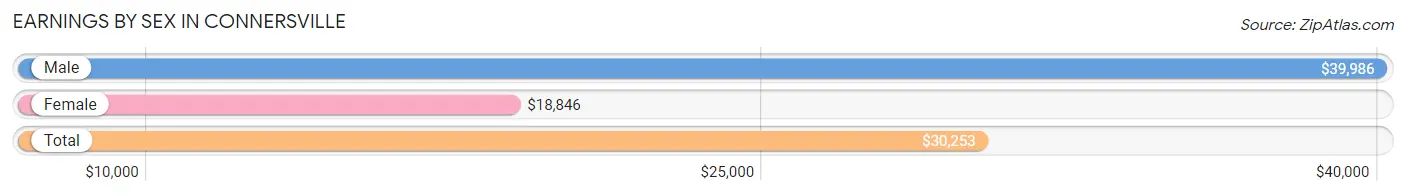
Earnings by Sex in Connersville
Average Earnings in Connersville are $30,253, $39,986 for men and $18,846 for women, a difference of 52.9%.
| Sex | Number | Average Earnings |
| Male | 3,246 (52.0%) | $39,986 |
| Female | 2,996 (48.0%) | $18,846 |
| Total | 6,242 (100.0%) | $30,253 |
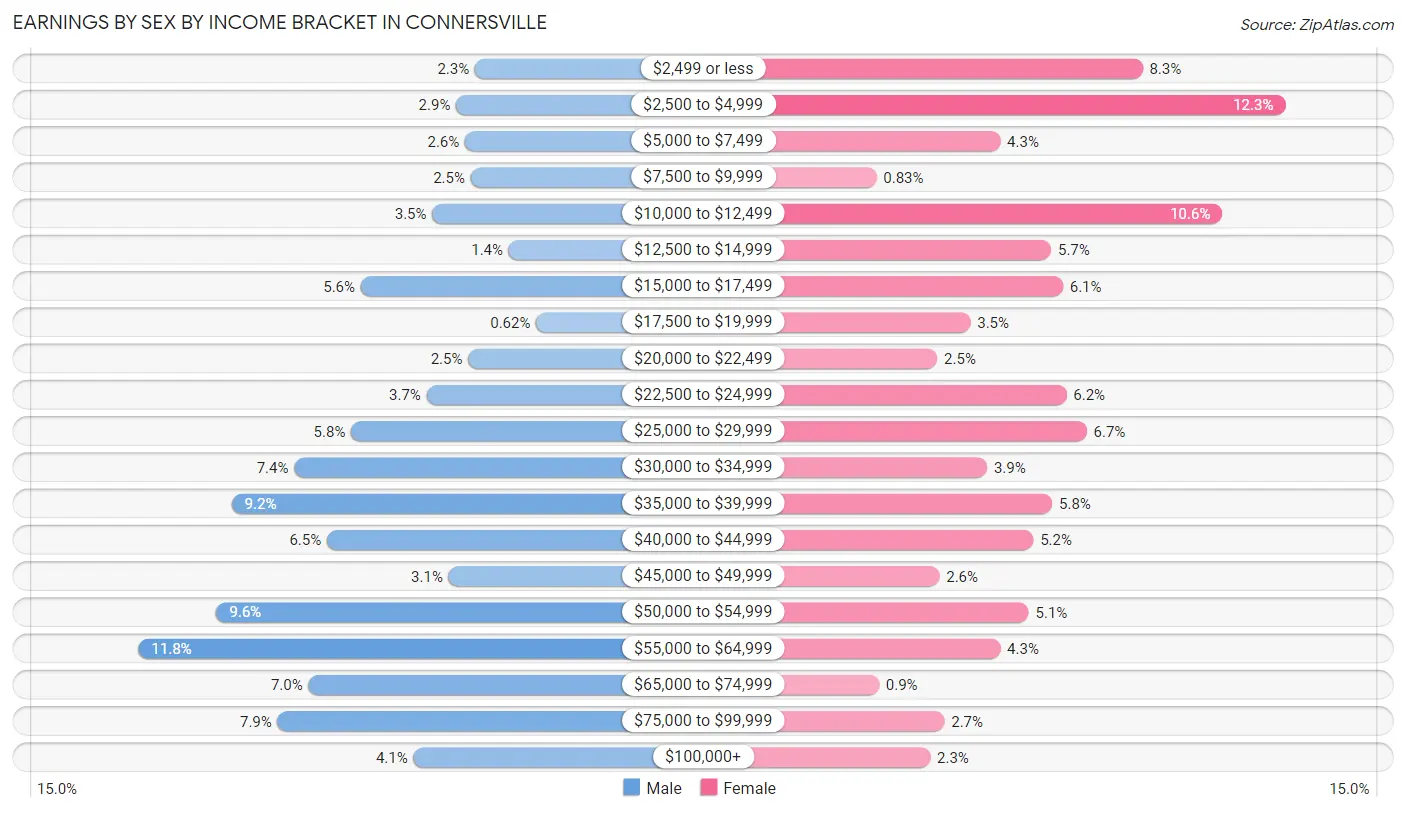
Earnings by Sex by Income Bracket in Connersville
The most common earnings brackets in Connersville are $55,000 to $64,999 for men (383 | 11.8%) and $2,500 to $4,999 for women (369 | 12.3%).
| Income | Male | Female |
| $2,499 or less | 76 (2.3%) | 249 (8.3%) |
| $2,500 to $4,999 | 93 (2.9%) | 369 (12.3%) |
| $5,000 to $7,499 | 85 (2.6%) | 129 (4.3%) |
| $7,500 to $9,999 | 80 (2.5%) | 25 (0.8%) |
| $10,000 to $12,499 | 115 (3.5%) | 316 (10.5%) |
| $12,500 to $14,999 | 45 (1.4%) | 172 (5.7%) |
| $15,000 to $17,499 | 180 (5.6%) | 182 (6.1%) |
| $17,500 to $19,999 | 20 (0.6%) | 104 (3.5%) |
| $20,000 to $22,499 | 82 (2.5%) | 76 (2.5%) |
| $22,500 to $24,999 | 120 (3.7%) | 185 (6.2%) |
| $25,000 to $29,999 | 189 (5.8%) | 202 (6.7%) |
| $30,000 to $34,999 | 241 (7.4%) | 118 (3.9%) |
| $35,000 to $39,999 | 298 (9.2%) | 173 (5.8%) |
| $40,000 to $44,999 | 211 (6.5%) | 157 (5.2%) |
| $45,000 to $49,999 | 100 (3.1%) | 78 (2.6%) |
| $50,000 to $54,999 | 312 (9.6%) | 153 (5.1%) |
| $55,000 to $64,999 | 383 (11.8%) | 129 (4.3%) |
| $65,000 to $74,999 | 228 (7.0%) | 27 (0.9%) |
| $75,000 to $99,999 | 256 (7.9%) | 82 (2.7%) |
| $100,000+ | 132 (4.1%) | 70 (2.3%) |
| Total | 3,246 (100.0%) | 2,996 (100.0%) |
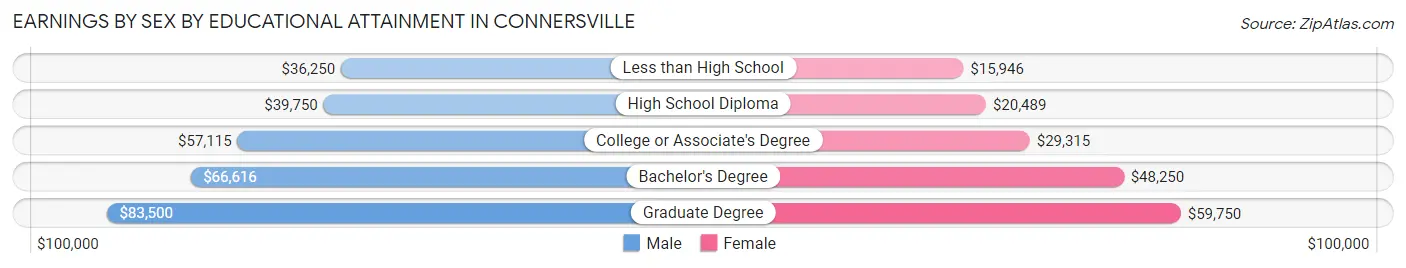
Earnings by Sex by Educational Attainment in Connersville
Average earnings in Connersville are $45,156 for men and $26,696 for women, a difference of 40.9%. Men with an educational attainment of graduate degree enjoy the highest average annual earnings of $83,500, while those with less than high school education earn the least with $36,250. Women with an educational attainment of graduate degree earn the most with the average annual earnings of $59,750, while those with less than high school education have the smallest earnings of $15,946.
| Educational Attainment | Male Income | Female Income |
| Less than High School | $36,250 | $15,946 |
| High School Diploma | $39,750 | $20,489 |
| College or Associate's Degree | $57,115 | $29,315 |
| Bachelor's Degree | $66,616 | $48,250 |
| Graduate Degree | $83,500 | $59,750 |
| Total | $45,156 | $26,696 |
Family Income in Connersville
Family Income Brackets in Connersville
According to the Connersville family income data, there are 728 families falling into the $50,000 to $74,999 income range, which is the most common income bracket and makes up 22.9% of all families. Conversely, the $200,000+ income bracket is the least frequent group with only 57 families (1.8%) belonging to this category.
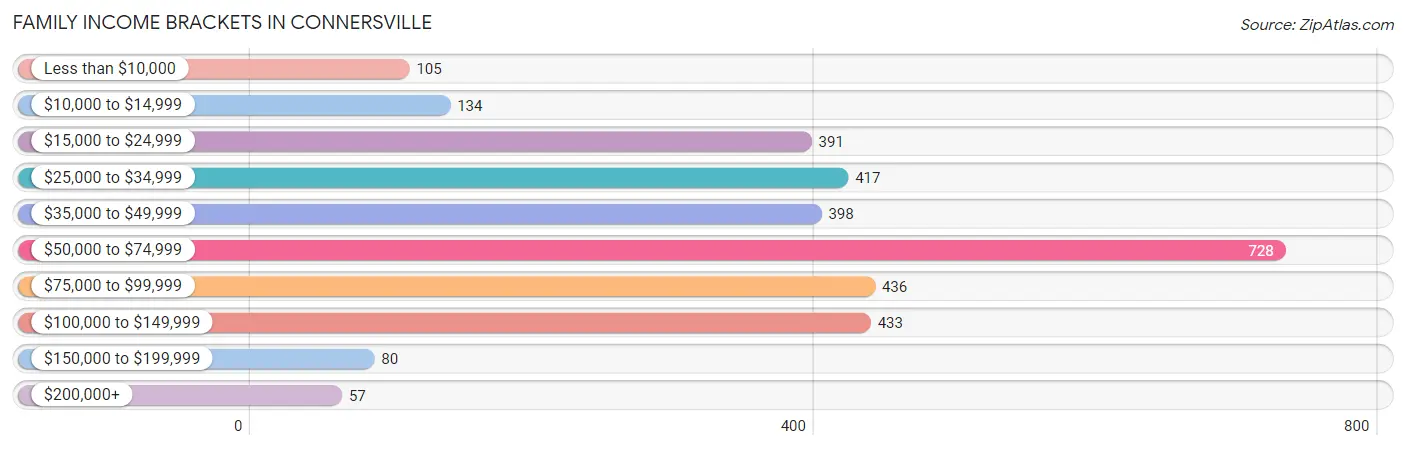
| Income Bracket | # Families | % Families |
| Less than $10,000 | 105 | 3.3% |
| $10,000 to $14,999 | 134 | 4.2% |
| $15,000 to $24,999 | 391 | 12.3% |
| $25,000 to $34,999 | 417 | 13.1% |
| $35,000 to $49,999 | 398 | 12.5% |
| $50,000 to $74,999 | 728 | 22.9% |
| $75,000 to $99,999 | 436 | 13.7% |
| $100,000 to $149,999 | 433 | 13.6% |
| $150,000 to $199,999 | 80 | 2.5% |
| $200,000+ | 57 | 1.8% |
Family Income by Famaliy Size in Connersville
7+ person families (30 | 0.9%) account for the highest median family income in Connersville with $153,250 per family, while 2-person families (1,758 | 55.3%) have the highest median income of $25,538 per family member.
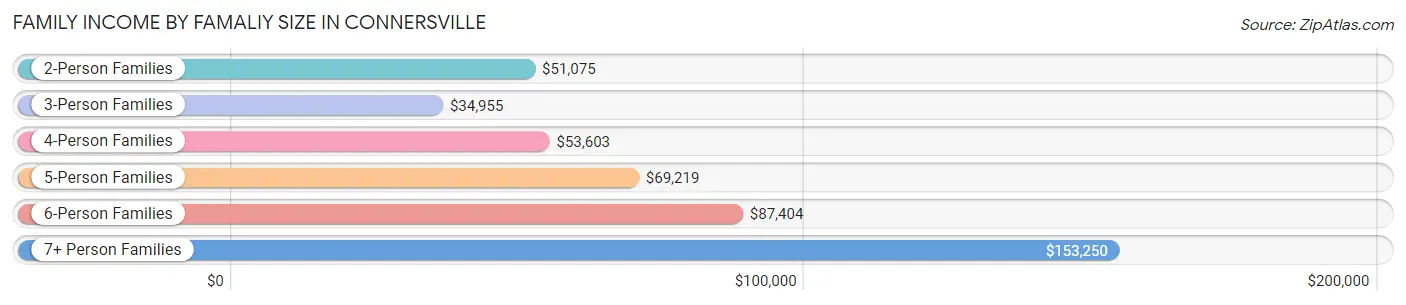
| Income Bracket | # Families | Median Income |
| 2-Person Families | 1,758 (55.3%) | $51,075 |
| 3-Person Families | 467 (14.7%) | $34,955 |
| 4-Person Families | 585 (18.4%) | $53,603 |
| 5-Person Families | 204 (6.4%) | $69,219 |
| 6-Person Families | 137 (4.3%) | $87,404 |
| 7+ Person Families | 30 (0.9%) | $153,250 |
| Total | 3,181 (100.0%) | $52,271 |
Family Income by Number of Earners in Connersville
The median family income in Connersville is $52,271, with families comprising 3+ earners (203) having the highest median family income of $116,181, while families with no earners (644) have the lowest median family income of $31,818, accounting for 6.4% and 20.3% of families, respectively.
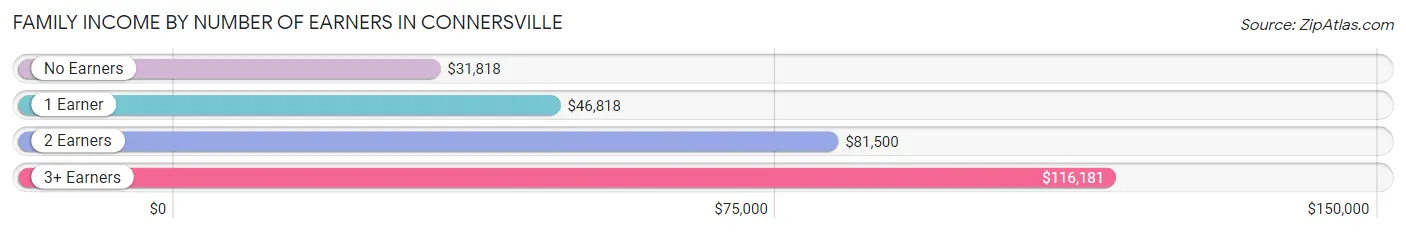
| Number of Earners | # Families | Median Income |
| No Earners | 644 (20.3%) | $31,818 |
| 1 Earner | 1,200 (37.7%) | $46,818 |
| 2 Earners | 1,134 (35.6%) | $81,500 |
| 3+ Earners | 203 (6.4%) | $116,181 |
| Total | 3,181 (100.0%) | $52,271 |
Household Income in Connersville
Household Income Brackets in Connersville
With 1,056 households falling in the category, the $50,000 to $74,999 income range is the most frequent in Connersville, accounting for 18.5% of all households. In contrast, only 57 households (1.0%) fall into the $200,000+ income bracket, making it the least populous group.
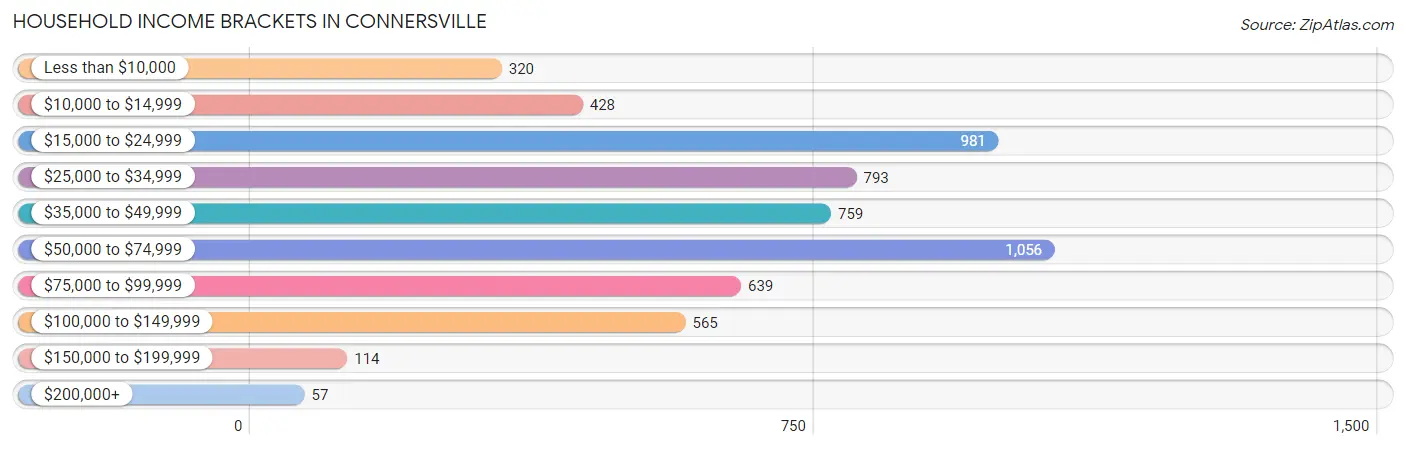
| Income Bracket | # Households | % Households |
| Less than $10,000 | 320 | 5.6% |
| $10,000 to $14,999 | 428 | 7.5% |
| $15,000 to $24,999 | 981 | 17.2% |
| $25,000 to $34,999 | 793 | 13.9% |
| $35,000 to $49,999 | 759 | 13.3% |
| $50,000 to $74,999 | 1,056 | 18.5% |
| $75,000 to $99,999 | 639 | 11.2% |
| $100,000 to $149,999 | 565 | 9.9% |
| $150,000 to $199,999 | 114 | 2.0% |
| $200,000+ | 57 | 1.0% |
Household Income by Householder Age in Connersville
The median household income in Connersville is $41,769, with the highest median household income of $54,625 found in the 45 to 64 years age bracket for the primary householder. A total of 1,999 households (35.0%) fall into this category. Meanwhile, the 15 to 24 years age bracket for the primary householder has the lowest median household income of $29,091, with 302 households (5.3%) in this group.
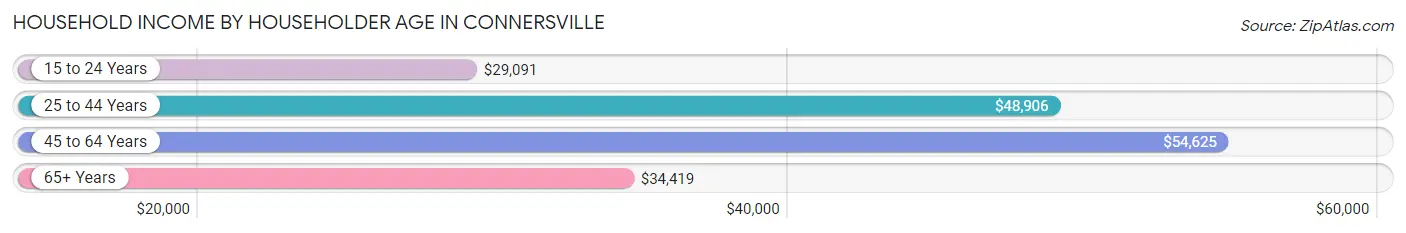
| Income Bracket | # Households | Median Income |
| 15 to 24 Years | 302 (5.3%) | $29,091 |
| 25 to 44 Years | 1,585 (27.8%) | $48,906 |
| 45 to 64 Years | 1,999 (35.0%) | $54,625 |
| 65+ Years | 1,820 (31.9%) | $34,419 |
| Total | 5,706 (100.0%) | $41,769 |
Poverty in Connersville
Income Below Poverty by Sex and Age in Connersville
With 19.4% poverty level for males and 24.8% for females among the residents of Connersville, 16 and 17 year old males and 5 year old females are the most vulnerable to poverty, with 47 males (48.4%) and 78 females (66.7%) in their respective age groups living below the poverty level.
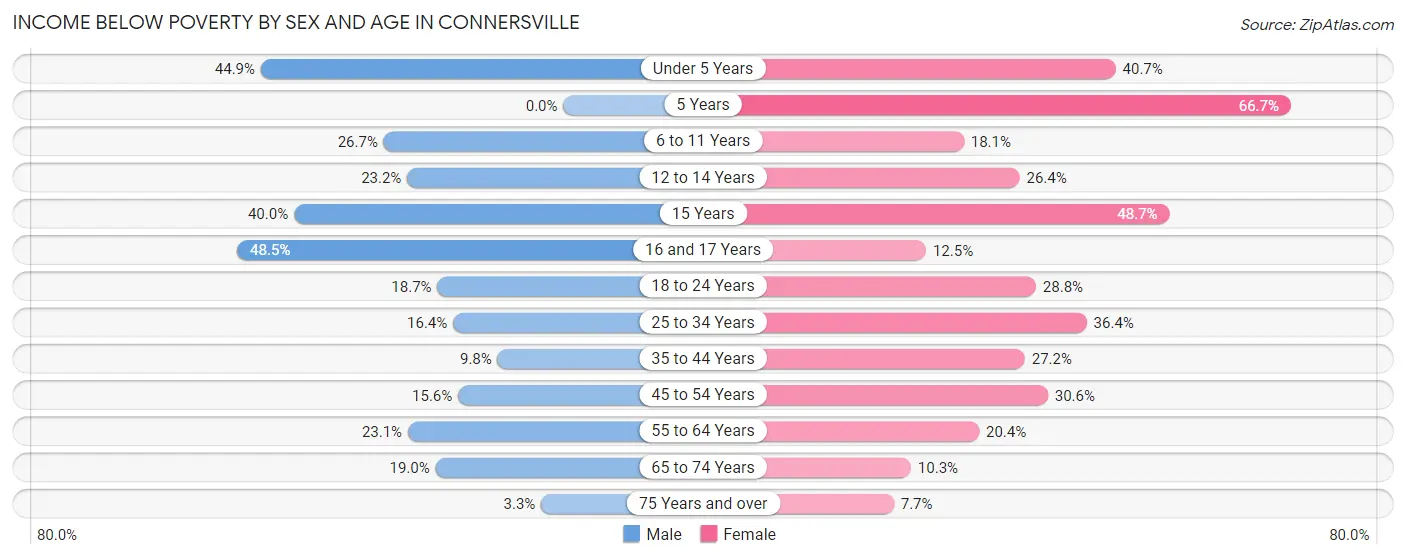
| Age Bracket | Male | Female |
| Under 5 Years | 137 (44.9%) | 159 (40.7%) |
| 5 Years | 0 (0.0%) | 78 (66.7%) |
| 6 to 11 Years | 144 (26.7%) | 98 (18.1%) |
| 12 to 14 Years | 64 (23.2%) | 71 (26.4%) |
| 15 Years | 26 (40.0%) | 18 (48.6%) |
| 16 and 17 Years | 47 (48.4%) | 31 (12.5%) |
| 18 to 24 Years | 118 (18.7%) | 202 (28.8%) |
| 25 to 34 Years | 128 (16.4%) | 268 (36.4%) |
| 35 to 44 Years | 68 (9.8%) | 224 (27.2%) |
| 45 to 54 Years | 136 (15.6%) | 268 (30.6%) |
| 55 to 64 Years | 174 (23.1%) | 160 (20.4%) |
| 65 to 74 Years | 153 (19.0%) | 80 (10.3%) |
| 75 Years and over | 12 (3.3%) | 43 (7.7%) |
| Total | 1,207 (19.4%) | 1,700 (24.8%) |
Income Above Poverty by Sex and Age in Connersville
According to the poverty statistics in Connersville, males aged 5 years and females aged 75 years and over are the age groups that are most secure financially, with 100.0% of males and 92.3% of females in these age groups living above the poverty line.
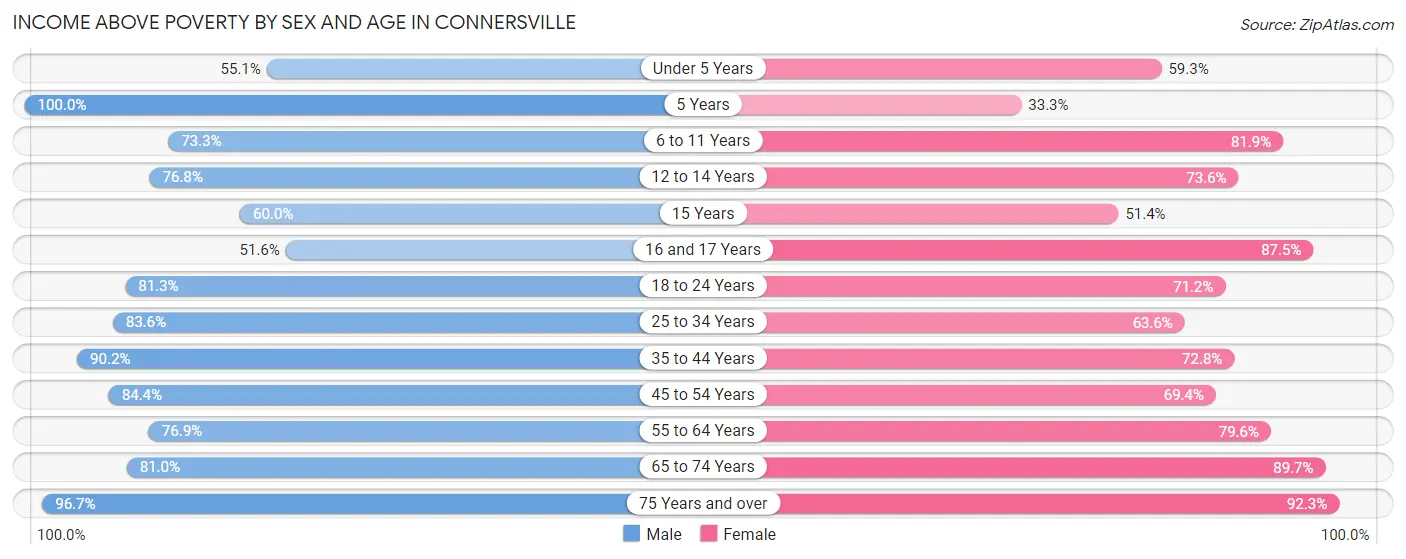
| Age Bracket | Male | Female |
| Under 5 Years | 168 (55.1%) | 232 (59.3%) |
| 5 Years | 48 (100.0%) | 39 (33.3%) |
| 6 to 11 Years | 396 (73.3%) | 443 (81.9%) |
| 12 to 14 Years | 212 (76.8%) | 198 (73.6%) |
| 15 Years | 39 (60.0%) | 19 (51.3%) |
| 16 and 17 Years | 50 (51.5%) | 217 (87.5%) |
| 18 to 24 Years | 513 (81.3%) | 499 (71.2%) |
| 25 to 34 Years | 654 (83.6%) | 469 (63.6%) |
| 35 to 44 Years | 629 (90.2%) | 600 (72.8%) |
| 45 to 54 Years | 734 (84.4%) | 608 (69.4%) |
| 55 to 64 Years | 580 (76.9%) | 625 (79.6%) |
| 65 to 74 Years | 653 (81.0%) | 700 (89.7%) |
| 75 Years and over | 353 (96.7%) | 514 (92.3%) |
| Total | 5,029 (80.6%) | 5,163 (75.2%) |
Income Below Poverty Among Married-Couple Families in Connersville
The poverty statistics for married-couple families in Connersville show that 8.2% or 169 of the total 2,068 families live below the poverty line. Families with 1 or 2 children have the highest poverty rate of 12.9%, comprising of 57 families. On the other hand, families with 5 or more children have the lowest poverty rate of 0.0%, which includes 0 families.
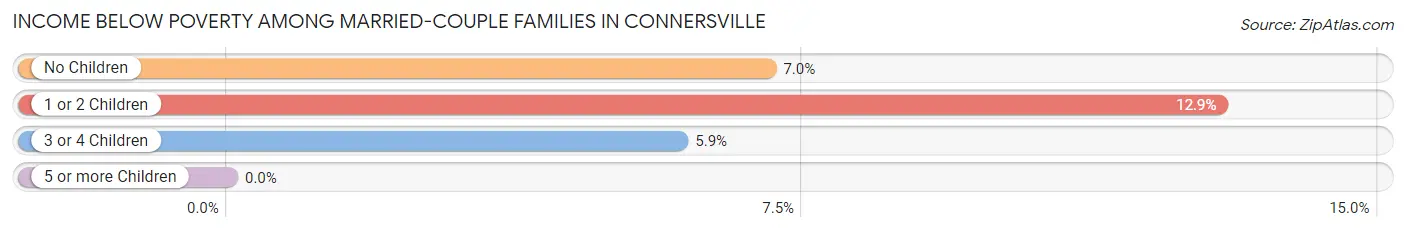
| Children | Above Poverty | Below Poverty |
| No Children | 1,363 (93.0%) | 103 (7.0%) |
| 1 or 2 Children | 384 (87.1%) | 57 (12.9%) |
| 3 or 4 Children | 144 (94.1%) | 9 (5.9%) |
| 5 or more Children | 8 (100.0%) | 0 (0.0%) |
| Total | 1,899 (91.8%) | 169 (8.2%) |
Income Below Poverty Among Single-Parent Households in Connersville
According to the poverty data in Connersville, 15.6% or 51 single-father households and 46.2% or 363 single-mother households are living below the poverty line. Among single-father households, those with 3 or 4 children have the highest poverty rate, with 31 households (63.3%) experiencing poverty. Likewise, among single-mother households, those with 5 or more children have the highest poverty rate, with 32 households (72.7%) falling below the poverty line.
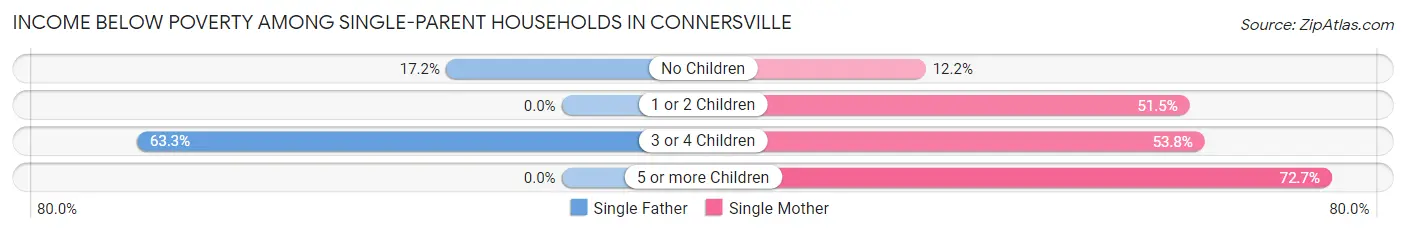
| Children | Single Father | Single Mother |
| No Children | 20 (17.2%) | 17 (12.2%) |
| 1 or 2 Children | 0 (0.0%) | 236 (51.5%) |
| 3 or 4 Children | 31 (63.3%) | 78 (53.8%) |
| 5 or more Children | 0 (0.0%) | 32 (72.7%) |
| Total | 51 (15.6%) | 363 (46.2%) |
Income Below Poverty Among Married-Couple vs Single-Parent Households in Connersville
The poverty data for Connersville shows that 169 of the married-couple family households (8.2%) and 414 of the single-parent households (37.2%) are living below the poverty level. Within the married-couple family households, those with 1 or 2 children have the highest poverty rate, with 57 households (12.9%) falling below the poverty line. Among the single-parent households, those with 5 or more children have the highest poverty rate, with 32 household (72.7%) living below poverty.
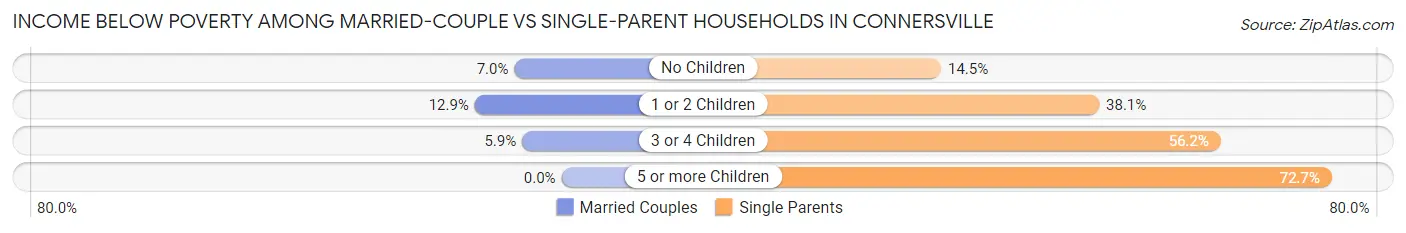
| Children | Married-Couple Families | Single-Parent Households |
| No Children | 103 (7.0%) | 37 (14.5%) |
| 1 or 2 Children | 57 (12.9%) | 236 (38.1%) |
| 3 or 4 Children | 9 (5.9%) | 109 (56.2%) |
| 5 or more Children | 0 (0.0%) | 32 (72.7%) |
| Total | 169 (8.2%) | 414 (37.2%) |
Race in Connersville
The most populous races in Connersville are White / Caucasian (12,436 | 92.8%), Two or more Races (578 | 4.3%), and Hispanic or Latino (305 | 2.3%).
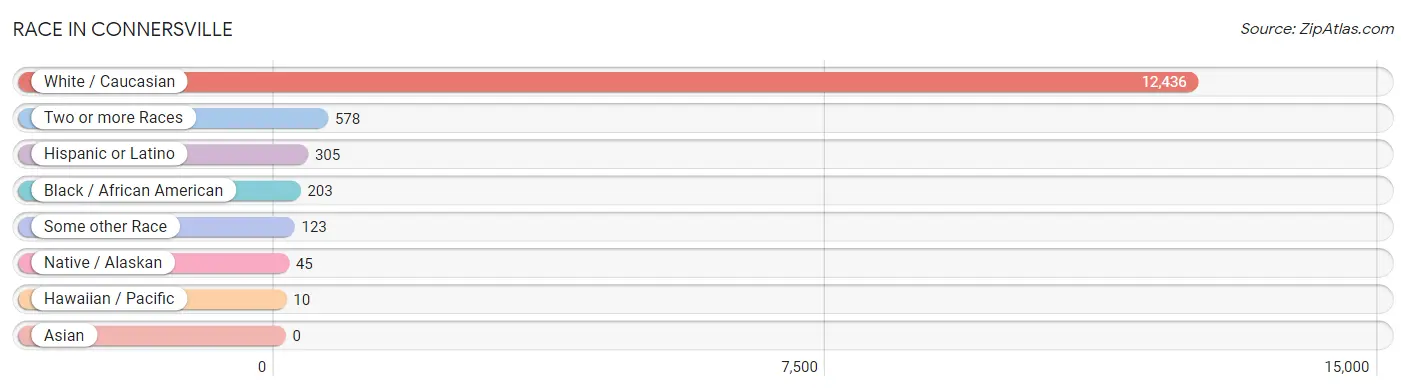
| Race | # Population | % Population |
| Asian | 0 | 0.0% |
| Black / African American | 203 | 1.5% |
| Hawaiian / Pacific | 10 | 0.1% |
| Hispanic or Latino | 305 | 2.3% |
| Native / Alaskan | 45 | 0.3% |
| White / Caucasian | 12,436 | 92.8% |
| Two or more Races | 578 | 4.3% |
| Some other Race | 123 | 0.9% |
| Total | 13,395 | 100.0% |
Ancestry in Connersville
The most populous ancestries reported in Connersville are German (3,073 | 22.9%), Irish (1,811 | 13.5%), American (1,661 | 12.4%), English (1,641 | 12.2%), and European (314 | 2.3%), together accounting for 63.4% of all Connersville residents.
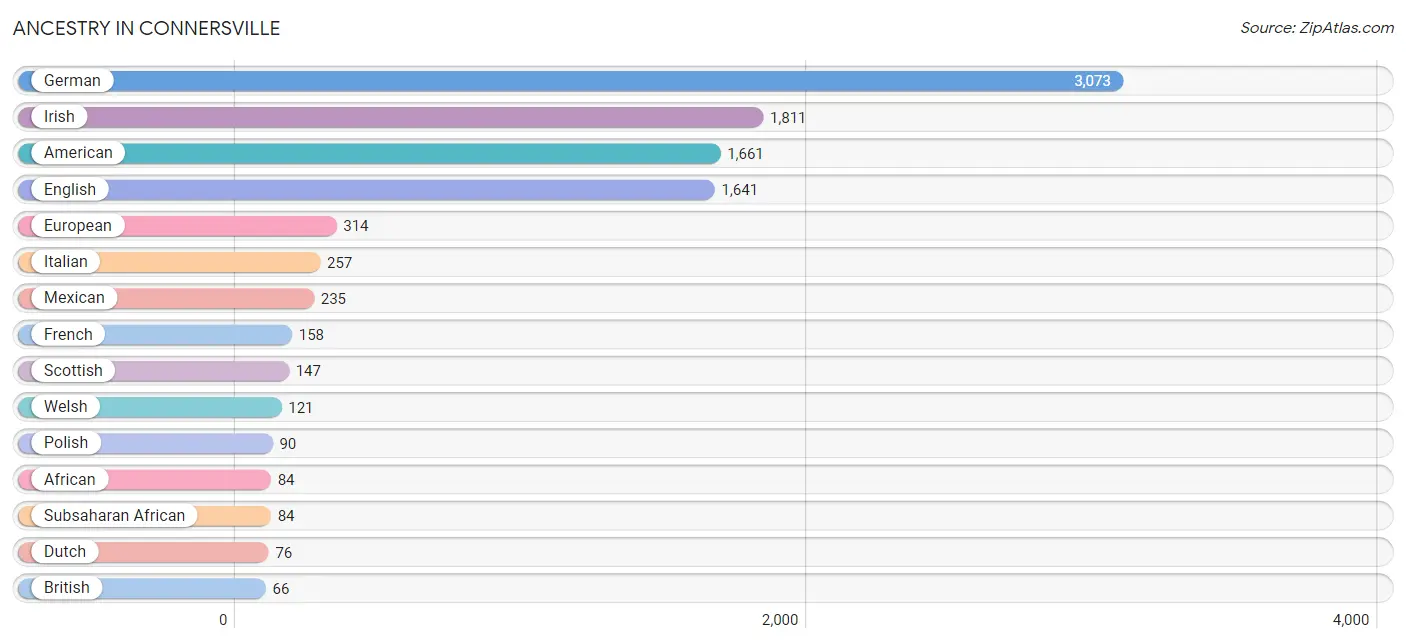
| Ancestry | # Population | % Population |
| African | 84 | 0.6% |
| American | 1,661 | 12.4% |
| Arab | 21 | 0.2% |
| Belgian | 23 | 0.2% |
| Blackfeet | 22 | 0.2% |
| British | 66 | 0.5% |
| Canadian | 18 | 0.1% |
| Celtic | 4 | 0.0% |
| Central American | 56 | 0.4% |
| Cherokee | 60 | 0.4% |
| Choctaw | 45 | 0.3% |
| Croatian | 20 | 0.2% |
| Czechoslovakian | 21 | 0.2% |
| Danish | 21 | 0.2% |
| Dutch | 76 | 0.6% |
| English | 1,641 | 12.2% |
| European | 314 | 2.3% |
| French | 158 | 1.2% |
| German | 3,073 | 22.9% |
| Guatemalan | 56 | 0.4% |
| Hungarian | 18 | 0.1% |
| Irish | 1,811 | 13.5% |
| Italian | 257 | 1.9% |
| Mexican | 235 | 1.8% |
| New Zealander | 6 | 0.0% |
| Polish | 90 | 0.7% |
| Portuguese | 23 | 0.2% |
| Romanian | 33 | 0.3% |
| Russian | 19 | 0.1% |
| Samoan | 10 | 0.1% |
| Scandinavian | 12 | 0.1% |
| Scotch-Irish | 25 | 0.2% |
| Scottish | 147 | 1.1% |
| South American | 10 | 0.1% |
| Spaniard | 4 | 0.0% |
| Subsaharan African | 84 | 0.6% |
| Swedish | 21 | 0.2% |
| Swiss | 27 | 0.2% |
| Venezuelan | 10 | 0.1% |
| Welsh | 121 | 0.9% | View All 40 Rows |
Immigrants in Connersville
The most numerous immigrant groups reported in Connersville came from Latin America (178 | 1.3%), Central America (168 | 1.3%), Mexico (112 | 0.8%), Guatemala (56 | 0.4%), and Africa (37 | 0.3%), together accounting for 4.1% of all Connersville residents.
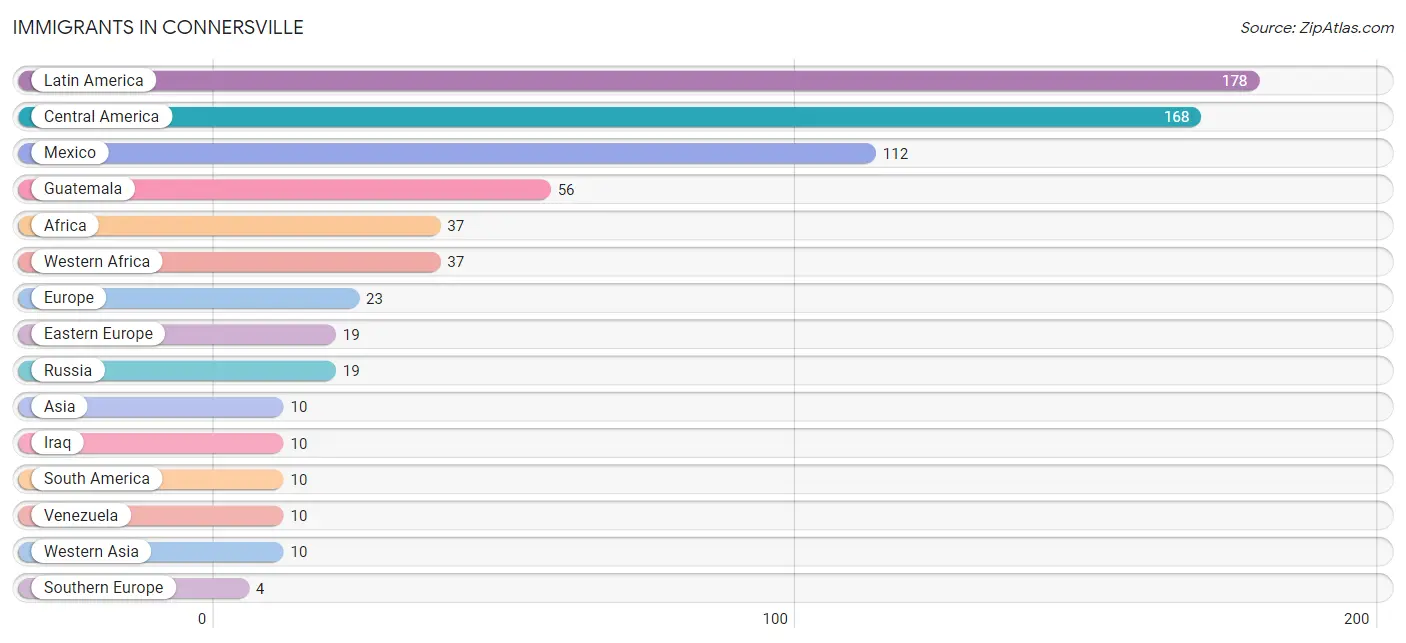
| Immigration Origin | # Population | % Population |
| Africa | 37 | 0.3% |
| Asia | 10 | 0.1% |
| Central America | 168 | 1.3% |
| Eastern Europe | 19 | 0.1% |
| Europe | 23 | 0.2% |
| Guatemala | 56 | 0.4% |
| Iraq | 10 | 0.1% |
| Latin America | 178 | 1.3% |
| Mexico | 112 | 0.8% |
| Russia | 19 | 0.1% |
| South America | 10 | 0.1% |
| Southern Europe | 4 | 0.0% |
| Spain | 4 | 0.0% |
| Venezuela | 10 | 0.1% |
| Western Africa | 37 | 0.3% |
| Western Asia | 10 | 0.1% | View All 16 Rows |
Sex and Age in Connersville
Sex and Age in Connersville
The most populous age groups in Connersville are 10 to 14 Years (627 | 9.8%) for men and 20 to 24 Years (531 | 7.6%) for women.
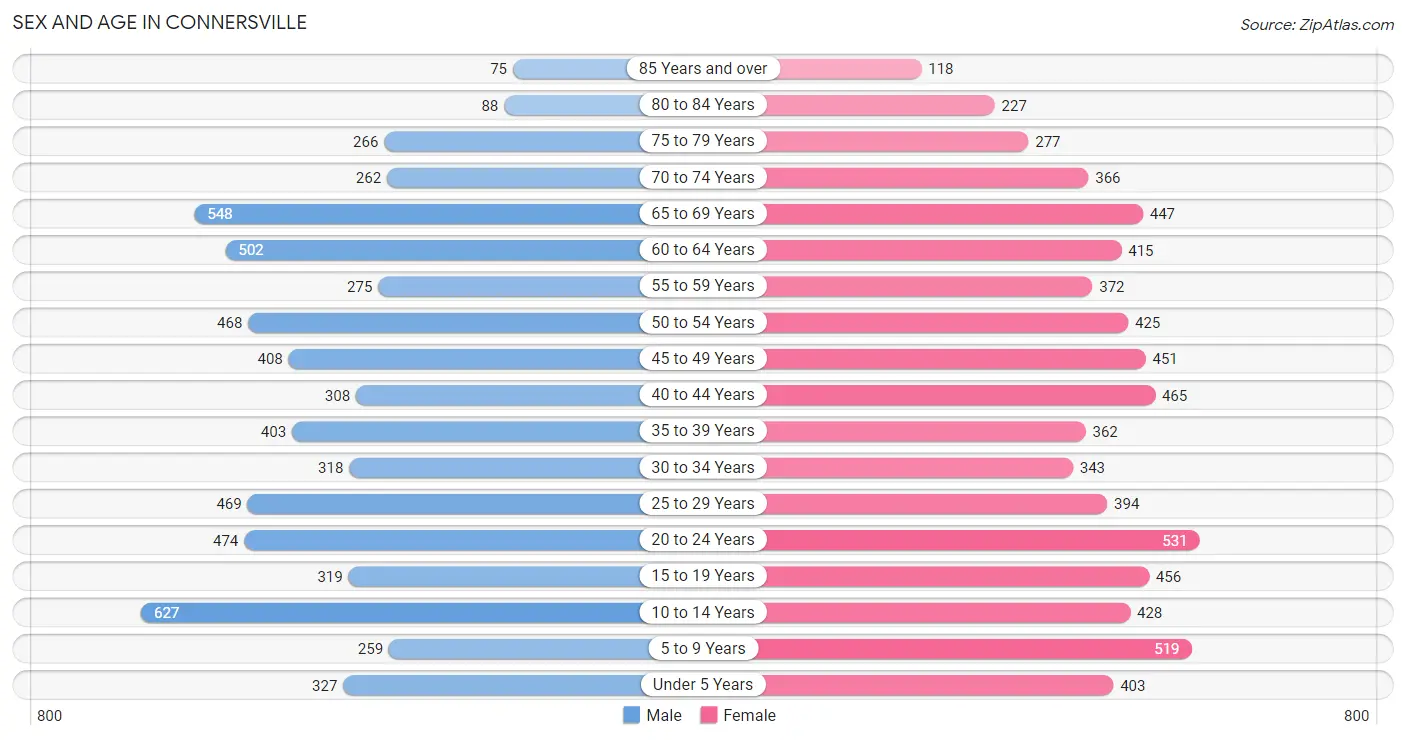
| Age Bracket | Male | Female |
| Under 5 Years | 327 (5.1%) | 403 (5.8%) |
| 5 to 9 Years | 259 (4.1%) | 519 (7.4%) |
| 10 to 14 Years | 627 (9.8%) | 428 (6.1%) |
| 15 to 19 Years | 319 (5.0%) | 456 (6.5%) |
| 20 to 24 Years | 474 (7.4%) | 531 (7.6%) |
| 25 to 29 Years | 469 (7.3%) | 394 (5.6%) |
| 30 to 34 Years | 318 (5.0%) | 343 (4.9%) |
| 35 to 39 Years | 403 (6.3%) | 362 (5.2%) |
| 40 to 44 Years | 308 (4.8%) | 465 (6.6%) |
| 45 to 49 Years | 408 (6.4%) | 451 (6.4%) |
| 50 to 54 Years | 468 (7.3%) | 425 (6.1%) |
| 55 to 59 Years | 275 (4.3%) | 372 (5.3%) |
| 60 to 64 Years | 502 (7.9%) | 415 (5.9%) |
| 65 to 69 Years | 548 (8.6%) | 447 (6.4%) |
| 70 to 74 Years | 262 (4.1%) | 366 (5.2%) |
| 75 to 79 Years | 266 (4.2%) | 277 (4.0%) |
| 80 to 84 Years | 88 (1.4%) | 227 (3.2%) |
| 85 Years and over | 75 (1.2%) | 118 (1.7%) |
| Total | 6,396 (100.0%) | 6,999 (100.0%) |
Families and Households in Connersville
Median Family Size in Connersville
The median family size in Connersville is 3.01 persons per family, with single female/mother families (786 | 24.7%) accounting for the largest median family size of 3.4 persons per family. On the other hand, married-couple families (2,068 | 65.0%) represent the smallest median family size with 2.86 persons per family.
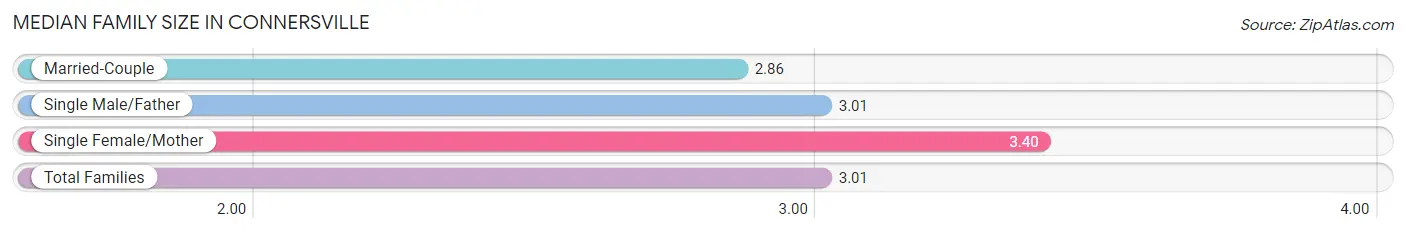
| Family Type | # Families | Family Size |
| Married-Couple | 2,068 (65.0%) | 2.86 |
| Single Male/Father | 327 (10.3%) | 3.01 |
| Single Female/Mother | 786 (24.7%) | 3.40 |
| Total Families | 3,181 (100.0%) | 3.01 |
Median Household Size in Connersville
The median household size in Connersville is 2.30 persons per household, with single female/mother households (786 | 13.8%) accounting for the largest median household size of 3.7 persons per household. non-family households (2,525 | 44.3%) represent the smallest median household size with 1.25 persons per household.
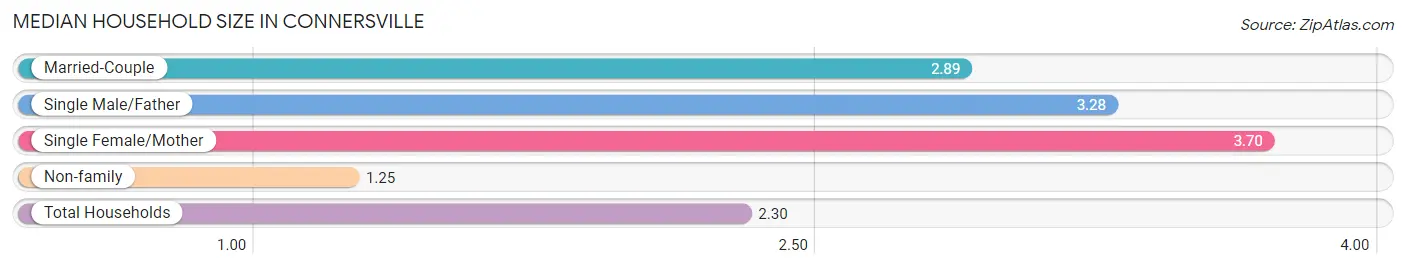
| Household Type | # Households | Household Size |
| Married-Couple | 2,068 (36.2%) | 2.89 |
| Single Male/Father | 327 (5.7%) | 3.28 |
| Single Female/Mother | 786 (13.8%) | 3.70 |
| Non-family | 2,525 (44.3%) | 1.25 |
| Total Households | 5,706 (100.0%) | 2.30 |
Household Size by Marriage Status in Connersville
Out of a total of 5,706 households in Connersville, 3,181 (55.7%) are family households, while 2,525 (44.3%) are nonfamily households. The most numerous type of family households are 2-person households, comprising 1,601, and the most common type of nonfamily households are 1-person households, comprising 2,167.
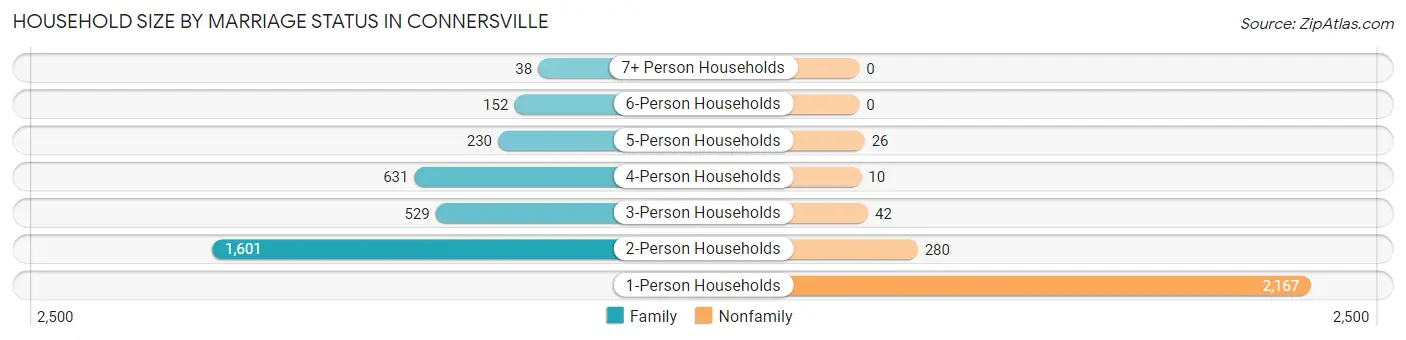
| Household Size | Family Households | Nonfamily Households |
| 1-Person Households | - | 2,167 (38.0%) |
| 2-Person Households | 1,601 (28.1%) | 280 (4.9%) |
| 3-Person Households | 529 (9.3%) | 42 (0.7%) |
| 4-Person Households | 631 (11.1%) | 10 (0.2%) |
| 5-Person Households | 230 (4.0%) | 26 (0.5%) |
| 6-Person Households | 152 (2.7%) | 0 (0.0%) |
| 7+ Person Households | 38 (0.7%) | 0 (0.0%) |
| Total | 3,181 (55.7%) | 2,525 (44.3%) |
Female Fertility in Connersville
Fertility by Age in Connersville
Average fertility rate in Connersville is 56.0 births per 1,000 women. Women in the age bracket of 20 to 34 years have the highest fertility rate with 110.0 births per 1,000 women. Women in the age bracket of 20 to 34 years acount for 80.3% of all women with births.
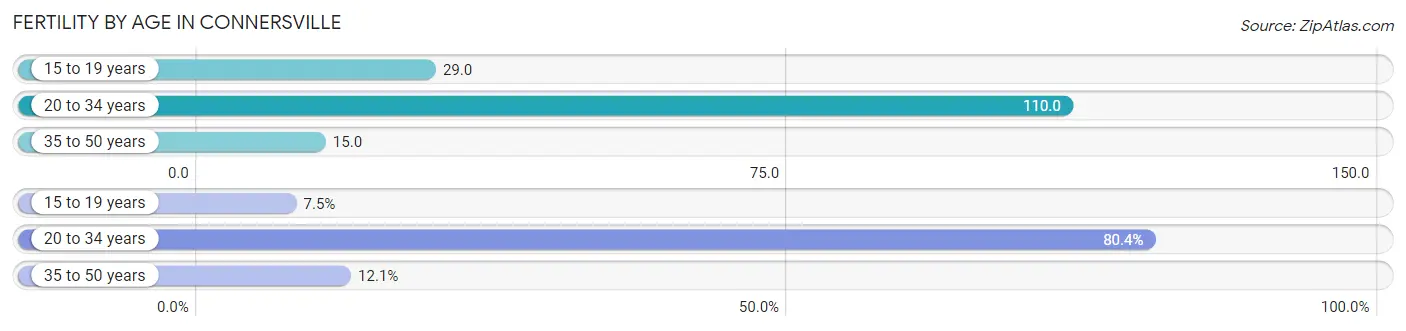
| Age Bracket | Women with Births | Births / 1,000 Women |
| 15 to 19 years | 13 (7.5%) | 29.0 |
| 20 to 34 years | 139 (80.3%) | 110.0 |
| 35 to 50 years | 21 (12.1%) | 15.0 |
| Total | 173 (100.0%) | 56.0 |
Fertility by Age by Marriage Status in Connersville
51.4% of women with births (173) in Connersville are married. The highest percentage of unmarried women with births falls into 20 to 34 years age bracket with 52.5% of them unmarried at the time of birth, while the lowest percentage of unmarried women with births belong to 15 to 19 years age bracket with 0.0% of them unmarried.
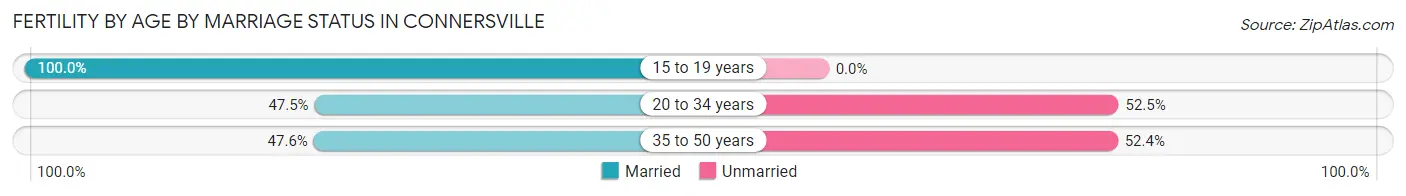
| Age Bracket | Married | Unmarried |
| 15 to 19 years | 13 (100.0%) | 0 (0.0%) |
| 20 to 34 years | 66 (47.5%) | 73 (52.5%) |
| 35 to 50 years | 10 (47.6%) | 11 (52.4%) |
| Total | 89 (51.4%) | 84 (48.5%) |
Fertility by Education in Connersville
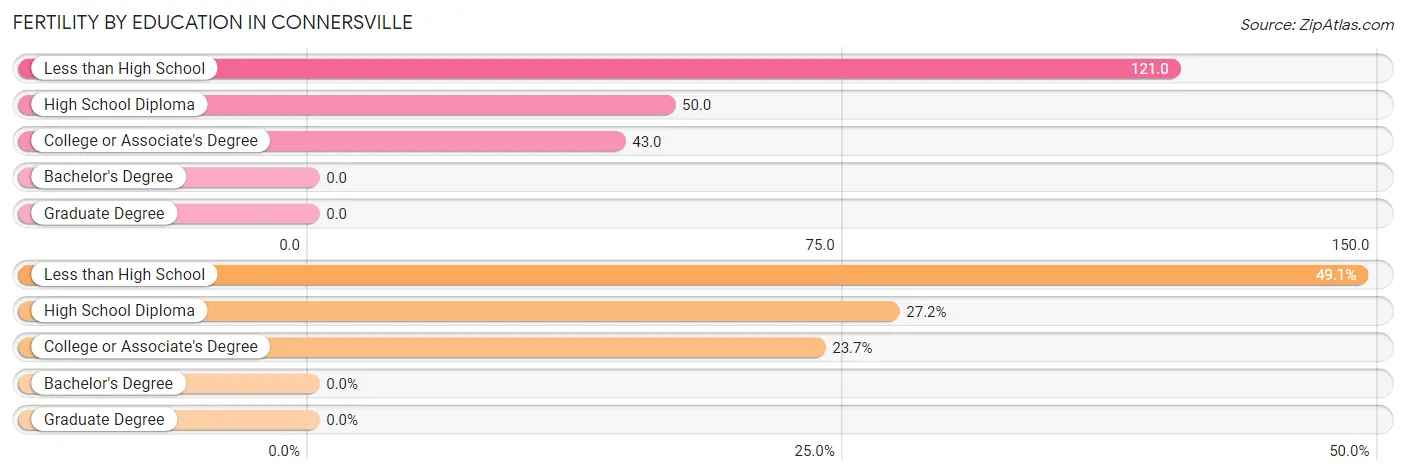
| Educational Attainment | Women with Births | Births / 1,000 Women |
| Less than High School | 85 (49.1%) | 121.0 |
| High School Diploma | 47 (27.2%) | 50.0 |
| College or Associate's Degree | 41 (23.7%) | 43.0 |
| Bachelor's Degree | 0 (0.0%) | 0.0 |
| Graduate Degree | 0 (0.0%) | 0.0 |
| Total | 173 (100.0%) | 56.0 |
Fertility by Education by Marriage Status in Connersville
48.5% of women with births in Connersville are unmarried. Women with the educational attainment of college or associate's degree are most likely to be married with 100.0% of them married at childbirth, while women with the educational attainment of high school diploma are least likely to be married with 100.0% of them unmarried at childbirth.
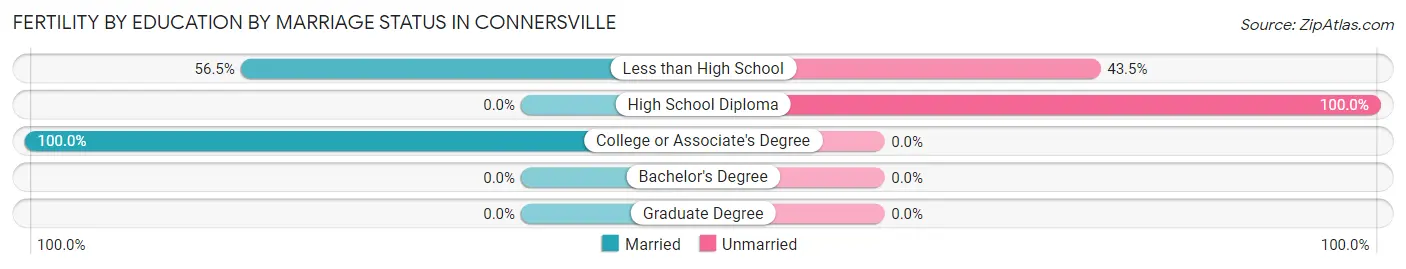
| Educational Attainment | Married | Unmarried |
| Less than High School | 48 (56.5%) | 37 (43.5%) |
| High School Diploma | 0 (0.0%) | 47 (100.0%) |
| College or Associate's Degree | 41 (100.0%) | 0 (0.0%) |
| Bachelor's Degree | 0 (0.0%) | 0 (0.0%) |
| Graduate Degree | 0 (0.0%) | 0 (0.0%) |
| Total | 89 (51.4%) | 84 (48.5%) |
Employment Characteristics in Connersville
Employment by Class of Employer in Connersville
Among the 5,544 employed individuals in Connersville, private company employees (4,092 | 73.8%), not-for-profit organizations (560 | 10.1%), and self-employed (not incorporated) (256 | 4.6%) make up the most common classes of employment.
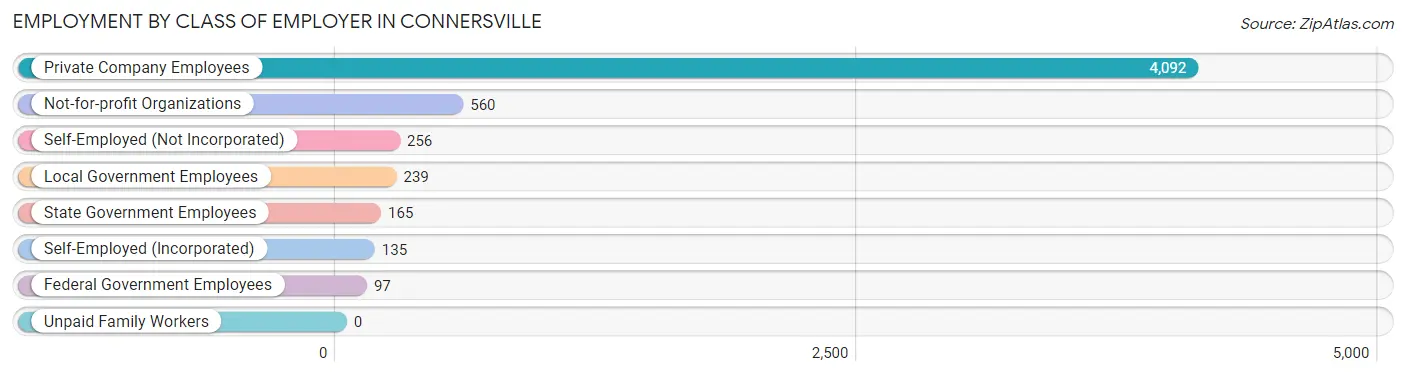
| Employer Class | # Employees | % Employees |
| Private Company Employees | 4,092 | 73.8% |
| Self-Employed (Incorporated) | 135 | 2.4% |
| Self-Employed (Not Incorporated) | 256 | 4.6% |
| Not-for-profit Organizations | 560 | 10.1% |
| Local Government Employees | 239 | 4.3% |
| State Government Employees | 165 | 3.0% |
| Federal Government Employees | 97 | 1.8% |
| Unpaid Family Workers | 0 | 0.0% |
| Total | 5,544 | 100.0% |
Employment Status by Age in Connersville
According to the labor force statistics for Connersville, out of the total population over 16 years of age (10,730), 56.6% or 6,073 individuals are in the labor force, with 5.8% or 352 of them unemployed. The age group with the highest labor force participation rate is 20 to 24 years, with 83.6% or 840 individuals in the labor force. Within the labor force, the 16 to 19 years age range has the highest percentage of unemployed individuals, with 19.7% or 77 of them being unemployed.
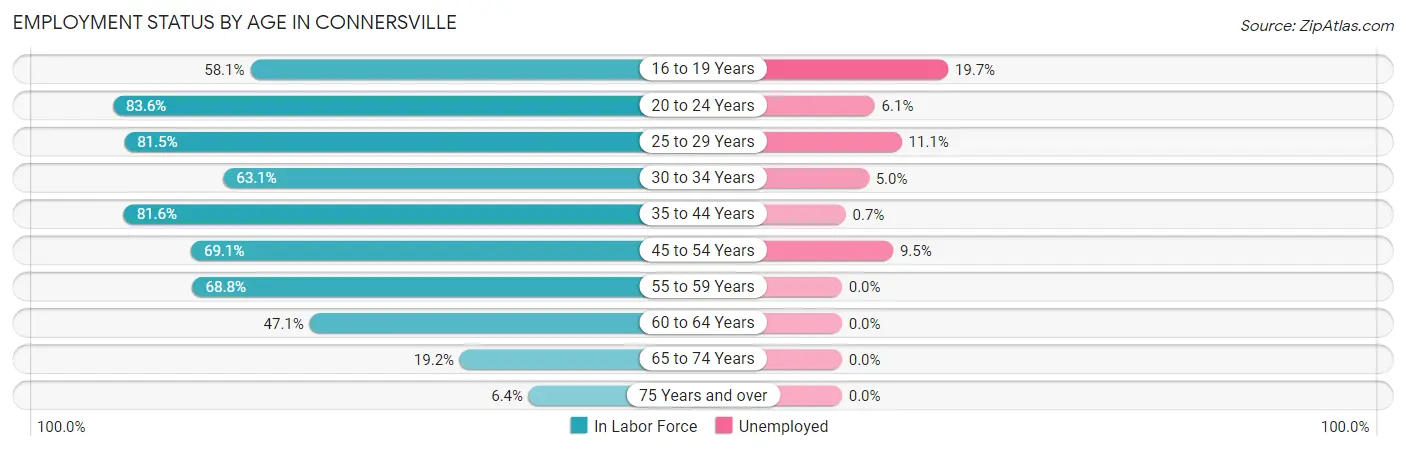
| Age Bracket | In Labor Force | Unemployed |
| 16 to 19 Years | 391 (58.1%) | 77 (19.7%) |
| 20 to 24 Years | 840 (83.6%) | 51 (6.1%) |
| 25 to 29 Years | 703 (81.5%) | 78 (11.1%) |
| 30 to 34 Years | 417 (63.1%) | 21 (5.0%) |
| 35 to 44 Years | 1,255 (81.6%) | 9 (0.7%) |
| 45 to 54 Years | 1,211 (69.1%) | 115 (9.5%) |
| 55 to 59 Years | 445 (68.8%) | 0 (0.0%) |
| 60 to 64 Years | 432 (47.1%) | 0 (0.0%) |
| 65 to 74 Years | 312 (19.2%) | 0 (0.0%) |
| 75 Years and over | 67 (6.4%) | 0 (0.0%) |
| Total | 6,073 (56.6%) | 352 (5.8%) |
Employment Status by Educational Attainment in Connersville
According to labor force statistics for Connersville, 70.0% of individuals (4,465) out of the total population between 25 and 64 years of age (6,378) are in the labor force, with 5.0% or 223 of them being unemployed. The group with the highest labor force participation rate are those with the educational attainment of college / associate degree, with 77.9% or 1,345 individuals in the labor force. Within the labor force, individuals with less than high school education have the highest percentage of unemployment, with 9.7% or 40 of them being unemployed.
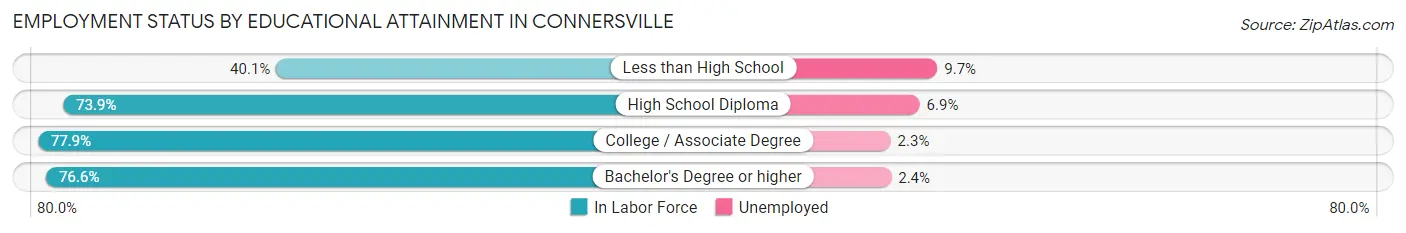
| Educational Attainment | In Labor Force | Unemployed |
| Less than High School | 413 (40.1%) | 100 (9.7%) |
| High School Diploma | 1,942 (73.9%) | 181 (6.9%) |
| College / Associate Degree | 1,345 (77.9%) | 40 (2.3%) |
| Bachelor's Degree or higher | 761 (76.6%) | 24 (2.4%) |
| Total | 4,465 (70.0%) | 319 (5.0%) |
Employment Occupations by Sex in Connersville
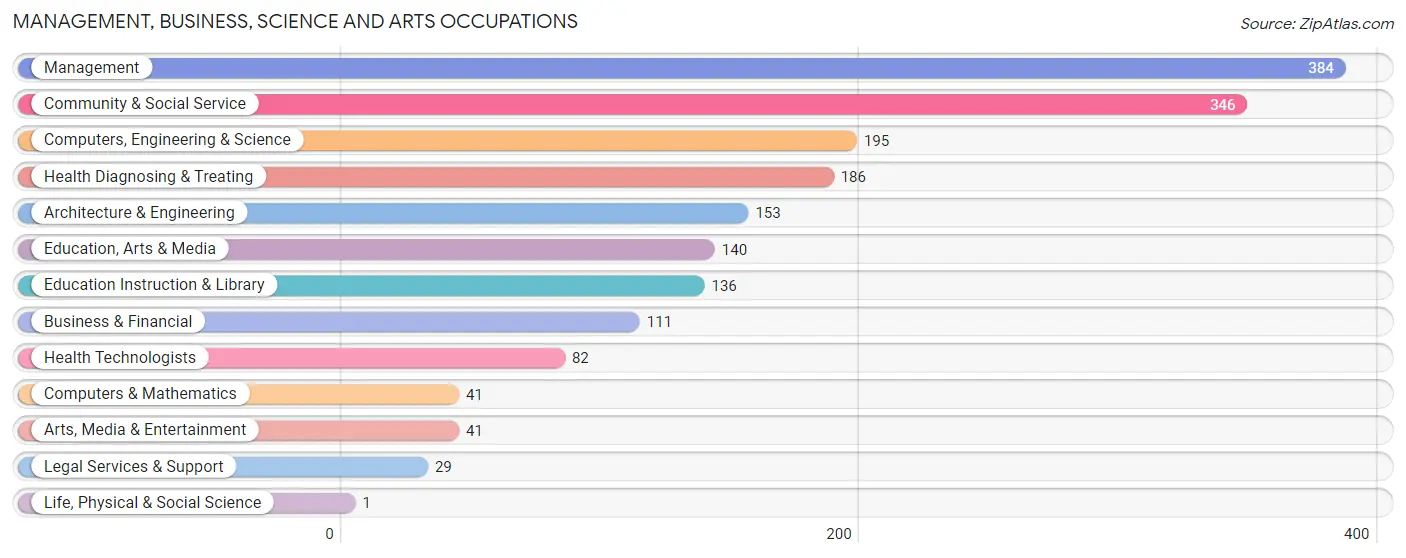
Management, Business, Science and Arts Occupations
The most common Management, Business, Science and Arts occupations in Connersville are Management (384 | 6.7%), Community & Social Service (346 | 6.0%), Computers, Engineering & Science (195 | 3.4%), Health Diagnosing & Treating (186 | 3.3%), and Architecture & Engineering (153 | 2.7%).
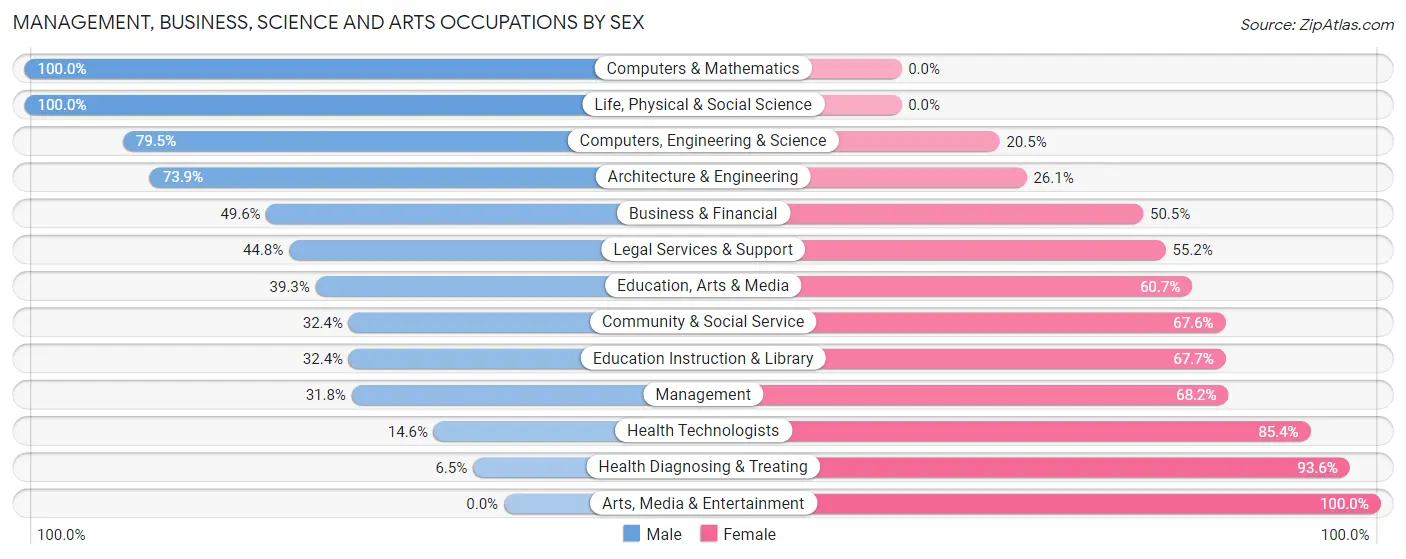
Management, Business, Science and Arts Occupations by Sex
Within the Management, Business, Science and Arts occupations in Connersville, the most male-oriented occupations are Computers & Mathematics (100.0%), Life, Physical & Social Science (100.0%), and Computers, Engineering & Science (79.5%), while the most female-oriented occupations are Arts, Media & Entertainment (100.0%), Health Diagnosing & Treating (93.5%), and Health Technologists (85.4%).
| Occupation | Male | Female |
| Management | 122 (31.8%) | 262 (68.2%) |
| Business & Financial | 55 (49.5%) | 56 (50.4%) |
| Computers, Engineering & Science | 155 (79.5%) | 40 (20.5%) |
| Computers & Mathematics | 41 (100.0%) | 0 (0.0%) |
| Architecture & Engineering | 113 (73.9%) | 40 (26.1%) |
| Life, Physical & Social Science | 1 (100.0%) | 0 (0.0%) |
| Community & Social Service | 112 (32.4%) | 234 (67.6%) |
| Education, Arts & Media | 55 (39.3%) | 85 (60.7%) |
| Legal Services & Support | 13 (44.8%) | 16 (55.2%) |
| Education Instruction & Library | 44 (32.4%) | 92 (67.6%) |
| Arts, Media & Entertainment | 0 (0.0%) | 41 (100.0%) |
| Health Diagnosing & Treating | 12 (6.5%) | 174 (93.5%) |
| Health Technologists | 12 (14.6%) | 70 (85.4%) |
| Total (Category) | 456 (37.3%) | 766 (62.7%) |
| Total (Overall) | 3,044 (53.2%) | 2,676 (46.8%) |
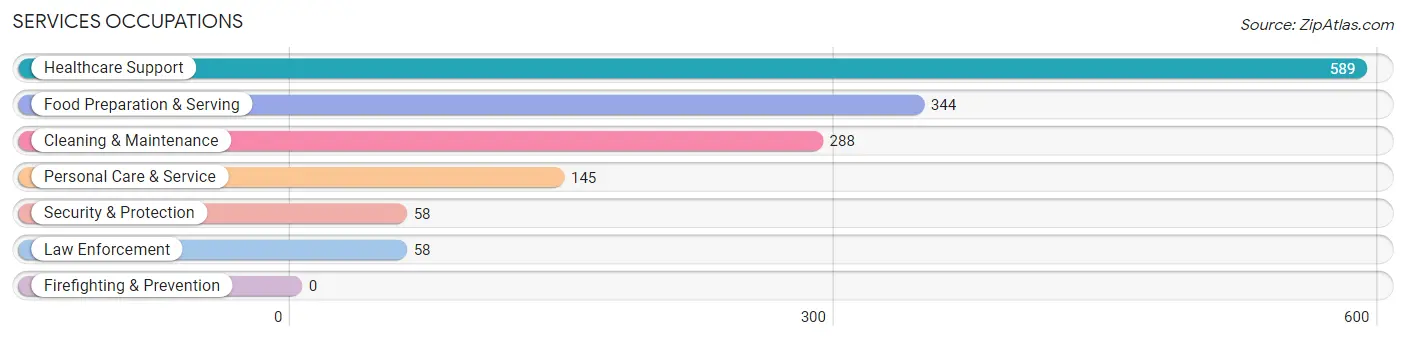
Services Occupations
The most common Services occupations in Connersville are Healthcare Support (589 | 10.3%), Food Preparation & Serving (344 | 6.0%), Cleaning & Maintenance (288 | 5.0%), Personal Care & Service (145 | 2.5%), and Security & Protection (58 | 1.0%).
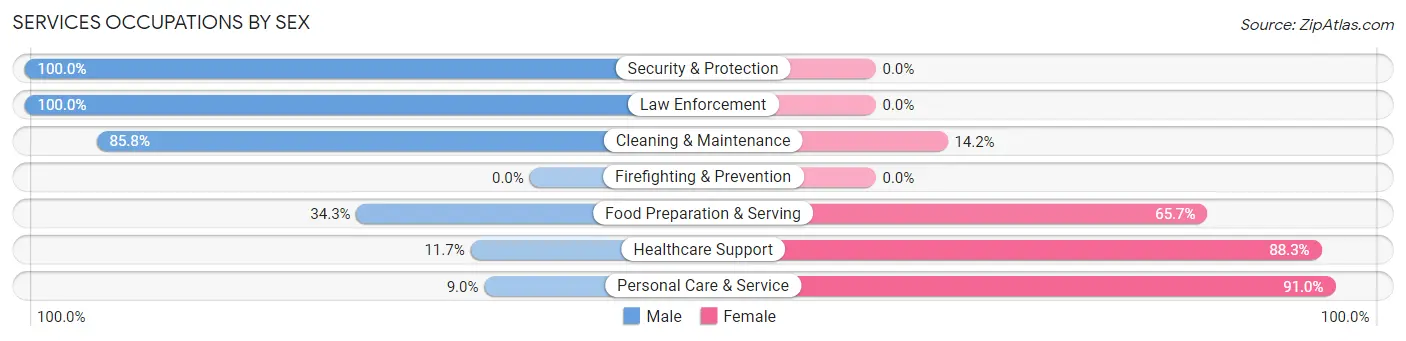
Services Occupations by Sex
Within the Services occupations in Connersville, the most male-oriented occupations are Security & Protection (100.0%), Law Enforcement (100.0%), and Cleaning & Maintenance (85.8%), while the most female-oriented occupations are Personal Care & Service (91.0%), Healthcare Support (88.3%), and Food Preparation & Serving (65.7%).
| Occupation | Male | Female |
| Healthcare Support | 69 (11.7%) | 520 (88.3%) |
| Security & Protection | 58 (100.0%) | 0 (0.0%) |
| Firefighting & Prevention | 0 (0.0%) | 0 (0.0%) |
| Law Enforcement | 58 (100.0%) | 0 (0.0%) |
| Food Preparation & Serving | 118 (34.3%) | 226 (65.7%) |
| Cleaning & Maintenance | 247 (85.8%) | 41 (14.2%) |
| Personal Care & Service | 13 (9.0%) | 132 (91.0%) |
| Total (Category) | 505 (35.5%) | 919 (64.5%) |
| Total (Overall) | 3,044 (53.2%) | 2,676 (46.8%) |
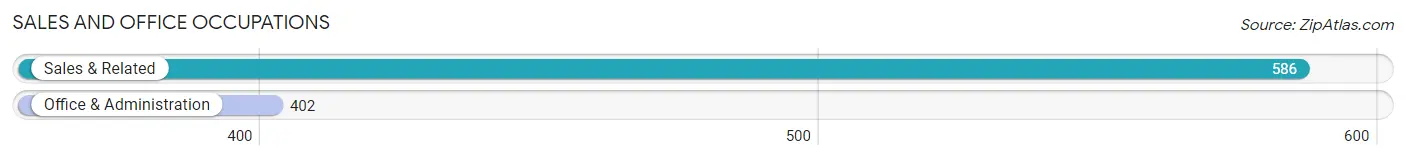
Sales and Office Occupations
The most common Sales and Office occupations in Connersville are Sales & Related (586 | 10.2%), and Office & Administration (402 | 7.0%).
Sales and Office Occupations by Sex
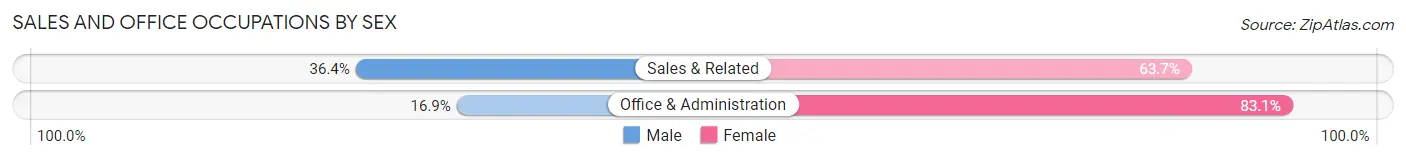
| Occupation | Male | Female |
| Sales & Related | 213 (36.3%) | 373 (63.6%) |
| Office & Administration | 68 (16.9%) | 334 (83.1%) |
| Total (Category) | 281 (28.4%) | 707 (71.6%) |
| Total (Overall) | 3,044 (53.2%) | 2,676 (46.8%) |
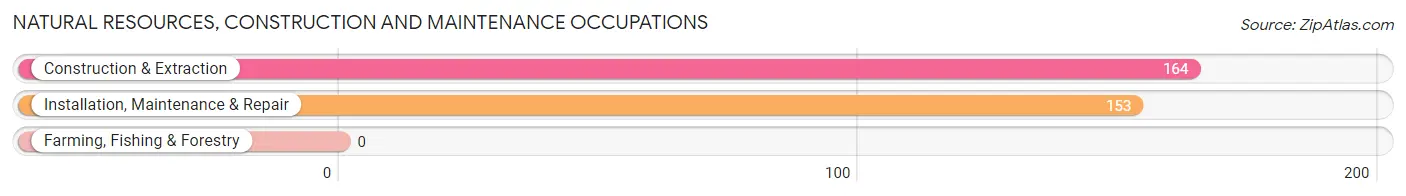
Natural Resources, Construction and Maintenance Occupations
The most common Natural Resources, Construction and Maintenance occupations in Connersville are Construction & Extraction (164 | 2.9%), and Installation, Maintenance & Repair (153 | 2.7%).
Natural Resources, Construction and Maintenance Occupations by Sex
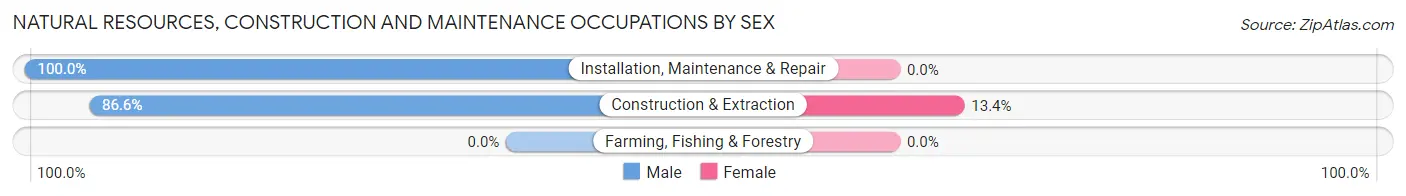
| Occupation | Male | Female |
| Farming, Fishing & Forestry | 0 (0.0%) | 0 (0.0%) |
| Construction & Extraction | 142 (86.6%) | 22 (13.4%) |
| Installation, Maintenance & Repair | 153 (100.0%) | 0 (0.0%) |
| Total (Category) | 295 (93.1%) | 22 (6.9%) |
| Total (Overall) | 3,044 (53.2%) | 2,676 (46.8%) |
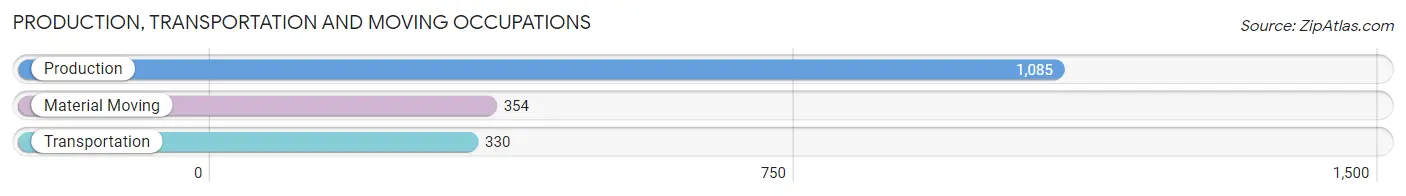
Production, Transportation and Moving Occupations
The most common Production, Transportation and Moving occupations in Connersville are Production (1,085 | 19.0%), Material Moving (354 | 6.2%), and Transportation (330 | 5.8%).
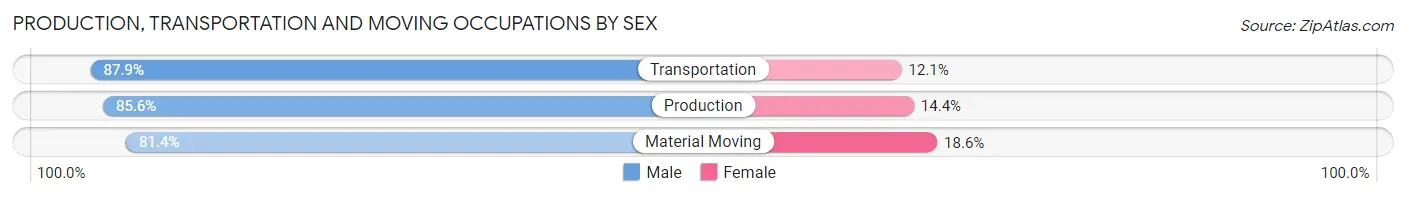
Production, Transportation and Moving Occupations by Sex
| Occupation | Male | Female |
| Production | 929 (85.6%) | 156 (14.4%) |
| Transportation | 290 (87.9%) | 40 (12.1%) |
| Material Moving | 288 (81.4%) | 66 (18.6%) |
| Total (Category) | 1,507 (85.2%) | 262 (14.8%) |
| Total (Overall) | 3,044 (53.2%) | 2,676 (46.8%) |
Employment Industries by Sex in Connersville
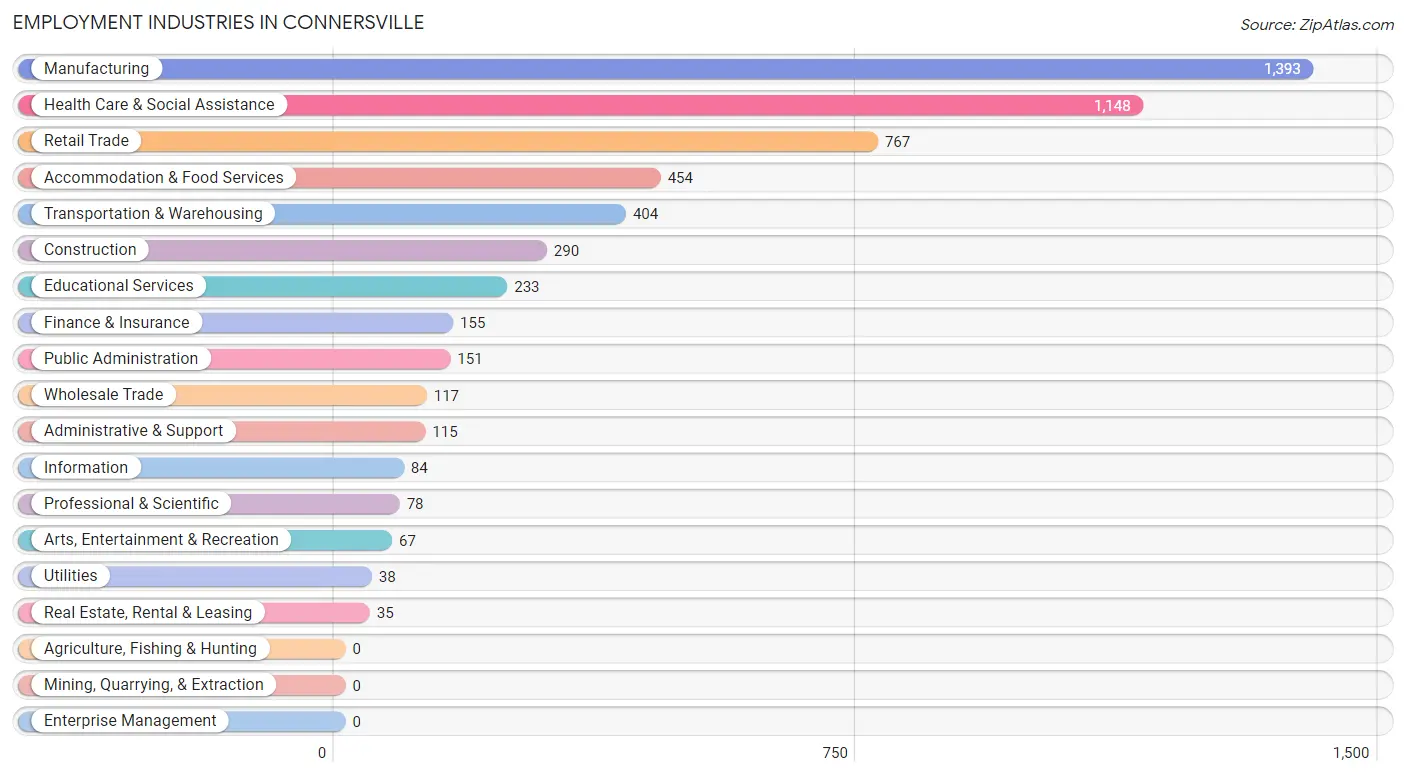
Employment Industries in Connersville
The major employment industries in Connersville include Manufacturing (1,393 | 24.3%), Health Care & Social Assistance (1,148 | 20.1%), Retail Trade (767 | 13.4%), Accommodation & Food Services (454 | 7.9%), and Transportation & Warehousing (404 | 7.1%).
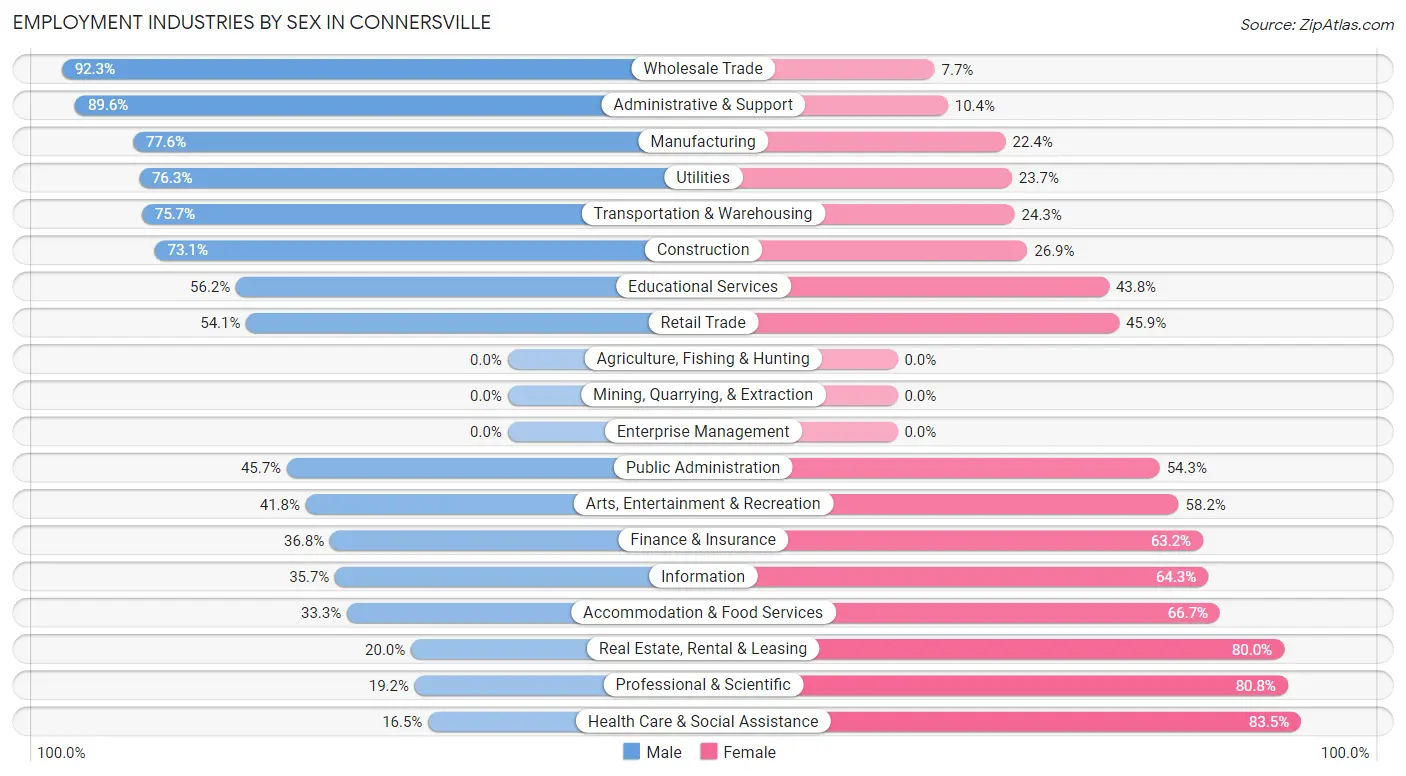
Employment Industries by Sex in Connersville
The Connersville industries that see more men than women are Wholesale Trade (92.3%), Administrative & Support (89.6%), and Manufacturing (77.6%), whereas the industries that tend to have a higher number of women are Health Care & Social Assistance (83.5%), Professional & Scientific (80.8%), and Real Estate, Rental & Leasing (80.0%).
| Industry | Male | Female |
| Agriculture, Fishing & Hunting | 0 (0.0%) | 0 (0.0%) |
| Mining, Quarrying, & Extraction | 0 (0.0%) | 0 (0.0%) |
| Construction | 212 (73.1%) | 78 (26.9%) |
| Manufacturing | 1,081 (77.6%) | 312 (22.4%) |
| Wholesale Trade | 108 (92.3%) | 9 (7.7%) |
| Retail Trade | 415 (54.1%) | 352 (45.9%) |
| Transportation & Warehousing | 306 (75.7%) | 98 (24.3%) |
| Utilities | 29 (76.3%) | 9 (23.7%) |
| Information | 30 (35.7%) | 54 (64.3%) |
| Finance & Insurance | 57 (36.8%) | 98 (63.2%) |
| Real Estate, Rental & Leasing | 7 (20.0%) | 28 (80.0%) |
| Professional & Scientific | 15 (19.2%) | 63 (80.8%) |
| Enterprise Management | 0 (0.0%) | 0 (0.0%) |
| Administrative & Support | 103 (89.6%) | 12 (10.4%) |
| Educational Services | 131 (56.2%) | 102 (43.8%) |
| Health Care & Social Assistance | 189 (16.5%) | 959 (83.5%) |
| Arts, Entertainment & Recreation | 28 (41.8%) | 39 (58.2%) |
| Accommodation & Food Services | 151 (33.3%) | 303 (66.7%) |
| Public Administration | 69 (45.7%) | 82 (54.3%) |
| Total | 3,044 (53.2%) | 2,676 (46.8%) |
Education in Connersville
School Enrollment in Connersville
The most common levels of schooling among the 2,722 students in Connersville are elementary school (821 | 30.2%), middle school (719 | 26.4%), and college / undergraduate (458 | 16.8%).
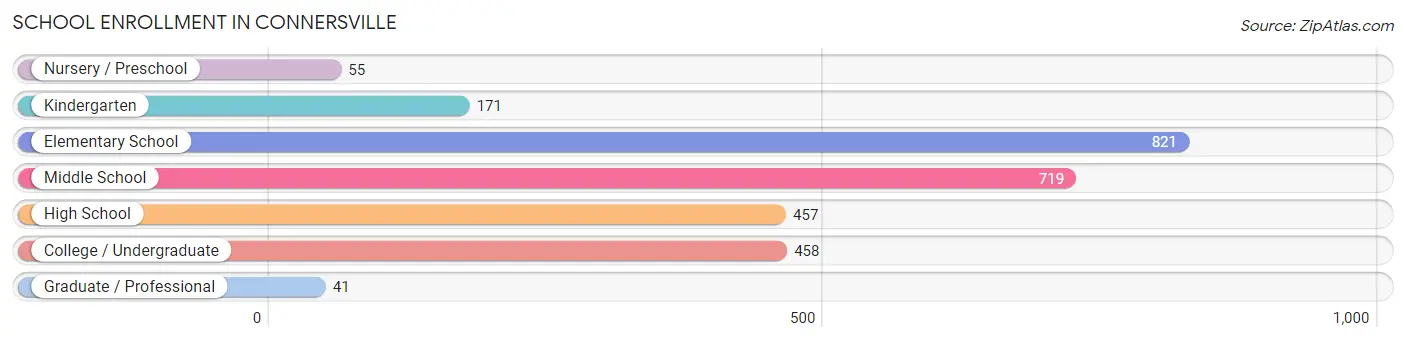
| School Level | # Students | % Students |
| Nursery / Preschool | 55 | 2.0% |
| Kindergarten | 171 | 6.3% |
| Elementary School | 821 | 30.2% |
| Middle School | 719 | 26.4% |
| High School | 457 | 16.8% |
| College / Undergraduate | 458 | 16.8% |
| Graduate / Professional | 41 | 1.5% |
| Total | 2,722 | 100.0% |
School Enrollment by Age by Funding Source in Connersville
Out of a total of 2,722 students who are enrolled in schools in Connersville, 498 (18.3%) attend a private institution, while the remaining 2,224 (81.7%) are enrolled in public schools. The age group of 3 to 4 year olds has the highest likelihood of being enrolled in private schools, with 42 (76.4% in the age bracket) enrolled. Conversely, the age group of 35 years and over has the lowest likelihood of being enrolled in a private school, with 64 (100.0% in the age bracket) attending a public institution.
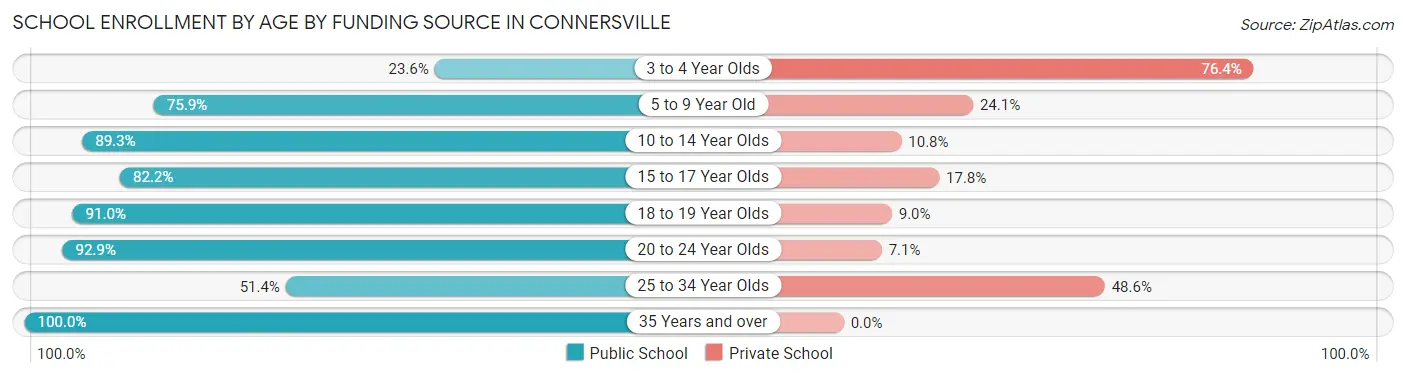
| Age Bracket | Public School | Private School |
| 3 to 4 Year Olds | 13 (23.6%) | 42 (76.4%) |
| 5 to 9 Year Old | 523 (75.9%) | 166 (24.1%) |
| 10 to 14 Year Olds | 930 (89.2%) | 112 (10.7%) |
| 15 to 17 Year Olds | 282 (82.2%) | 61 (17.8%) |
| 18 to 19 Year Olds | 122 (91.0%) | 12 (9.0%) |
| 20 to 24 Year Olds | 197 (92.9%) | 15 (7.1%) |
| 25 to 34 Year Olds | 94 (51.4%) | 89 (48.6%) |
| 35 Years and over | 64 (100.0%) | 0 (0.0%) |
| Total | 2,224 (81.7%) | 498 (18.3%) |
Educational Attainment by Field of Study in Connersville
Business (358 | 25.9%), education (236 | 17.1%), computers & mathematics (203 | 14.7%), science & technology (147 | 10.6%), and liberal arts & history (92 | 6.7%) are the most common fields of study among 1,384 individuals in Connersville who have obtained a bachelor's degree or higher.
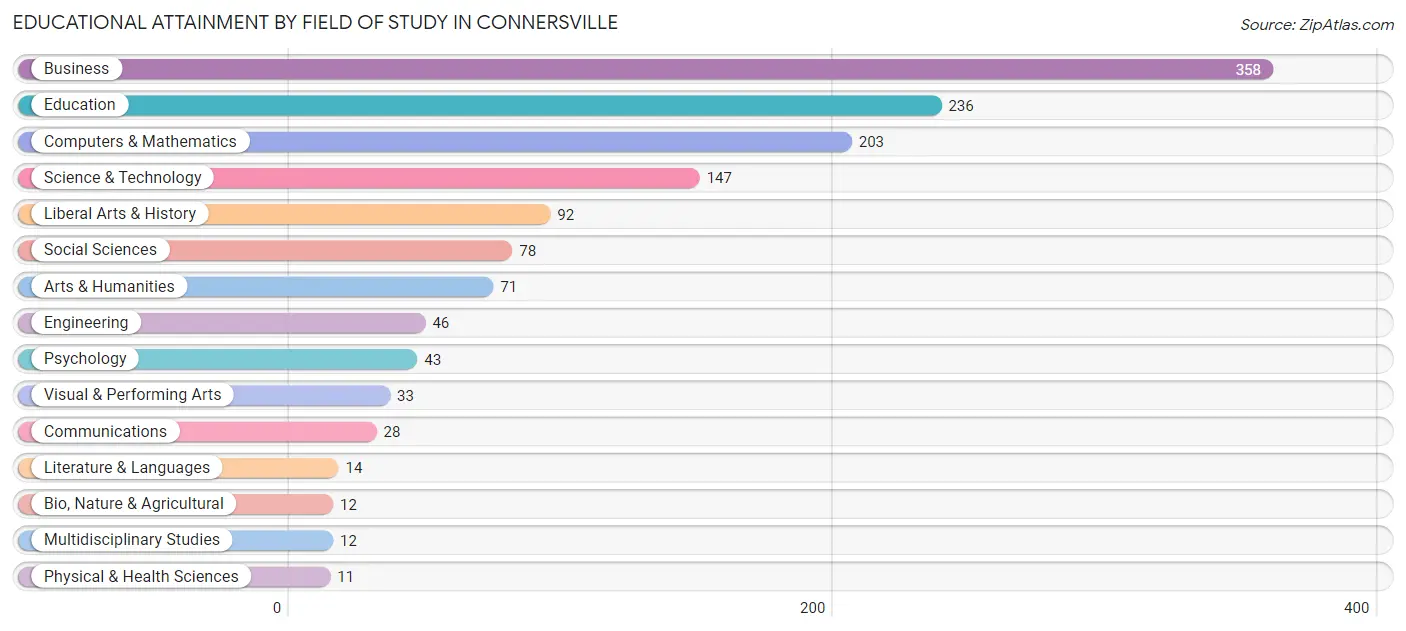
| Field of Study | # Graduates | % Graduates |
| Computers & Mathematics | 203 | 14.7% |
| Bio, Nature & Agricultural | 12 | 0.9% |
| Physical & Health Sciences | 11 | 0.8% |
| Psychology | 43 | 3.1% |
| Social Sciences | 78 | 5.6% |
| Engineering | 46 | 3.3% |
| Multidisciplinary Studies | 12 | 0.9% |
| Science & Technology | 147 | 10.6% |
| Business | 358 | 25.9% |
| Education | 236 | 17.1% |
| Literature & Languages | 14 | 1.0% |
| Liberal Arts & History | 92 | 6.7% |
| Visual & Performing Arts | 33 | 2.4% |
| Communications | 28 | 2.0% |
| Arts & Humanities | 71 | 5.1% |
| Total | 1,384 | 100.0% |
Transportation & Commute in Connersville
Vehicle Availability by Sex in Connersville
The most prevalent vehicle ownership categories in Connersville are males with 2 vehicles (1,302, accounting for 44.2%) and females with 2 vehicles (742, making up 50.1%).
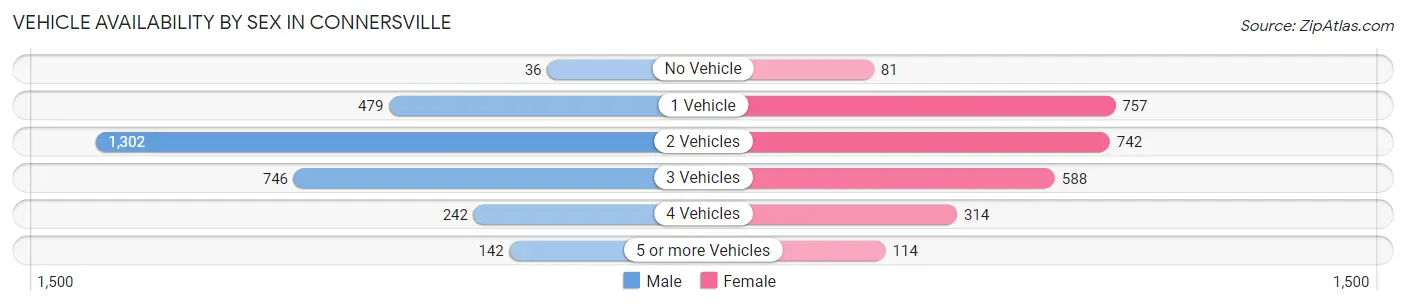
| Vehicles Available | Male | Female |
| No Vehicle | 36 (1.2%) | 81 (3.1%) |
| 1 Vehicle | 479 (16.3%) | 757 (29.2%) |
| 2 Vehicles | 1,302 (44.2%) | 742 (28.6%) |
| 3 Vehicles | 746 (25.3%) | 588 (22.7%) |
| 4 Vehicles | 242 (8.2%) | 314 (12.1%) |
| 5 or more Vehicles | 142 (4.8%) | 114 (4.4%) |
| Total | 2,947 (100.0%) | 2,596 (100.0%) |
Commute Time in Connersville
The most frequently occuring commute durations in Connersville are 5 to 9 minutes (1,344 commuters, 25.0%), 10 to 14 minutes (919 commuters, 17.1%), and 45 to 59 minutes (693 commuters, 12.9%).
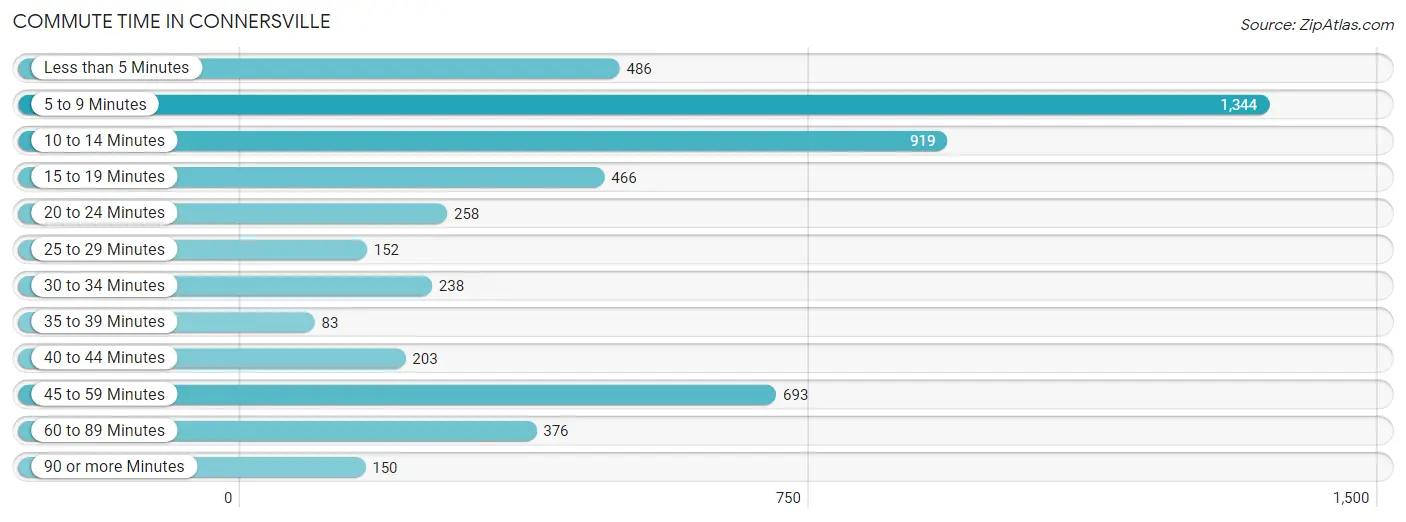
| Commute Time | # Commuters | % Commuters |
| Less than 5 Minutes | 486 | 9.0% |
| 5 to 9 Minutes | 1,344 | 25.0% |
| 10 to 14 Minutes | 919 | 17.1% |
| 15 to 19 Minutes | 466 | 8.7% |
| 20 to 24 Minutes | 258 | 4.8% |
| 25 to 29 Minutes | 152 | 2.8% |
| 30 to 34 Minutes | 238 | 4.4% |
| 35 to 39 Minutes | 83 | 1.5% |
| 40 to 44 Minutes | 203 | 3.8% |
| 45 to 59 Minutes | 693 | 12.9% |
| 60 to 89 Minutes | 376 | 7.0% |
| 90 or more Minutes | 150 | 2.8% |
Commute Time by Sex in Connersville
The most common commute times in Connersville are 5 to 9 minutes (510 commuters, 17.7%) for males and 5 to 9 minutes (834 commuters, 33.4%) for females.
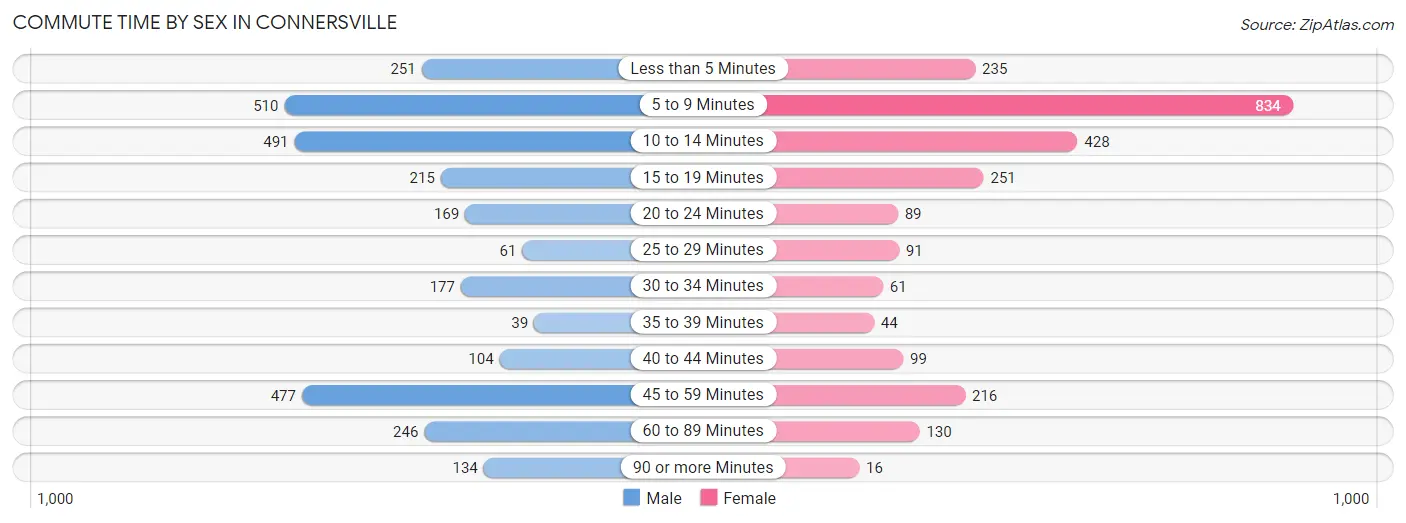
| Commute Time | Male | Female |
| Less than 5 Minutes | 251 (8.7%) | 235 (9.4%) |
| 5 to 9 Minutes | 510 (17.7%) | 834 (33.4%) |
| 10 to 14 Minutes | 491 (17.1%) | 428 (17.2%) |
| 15 to 19 Minutes | 215 (7.5%) | 251 (10.1%) |
| 20 to 24 Minutes | 169 (5.9%) | 89 (3.6%) |
| 25 to 29 Minutes | 61 (2.1%) | 91 (3.6%) |
| 30 to 34 Minutes | 177 (6.2%) | 61 (2.5%) |
| 35 to 39 Minutes | 39 (1.4%) | 44 (1.8%) |
| 40 to 44 Minutes | 104 (3.6%) | 99 (4.0%) |
| 45 to 59 Minutes | 477 (16.6%) | 216 (8.7%) |
| 60 to 89 Minutes | 246 (8.6%) | 130 (5.2%) |
| 90 or more Minutes | 134 (4.7%) | 16 (0.6%) |
Time of Departure to Work by Sex in Connersville
The most frequent times of departure to work in Connersville are 12:00 AM to 4:59 AM (391, 13.6%) for males and 12:00 PM to 3:59 PM (345, 13.8%) for females.
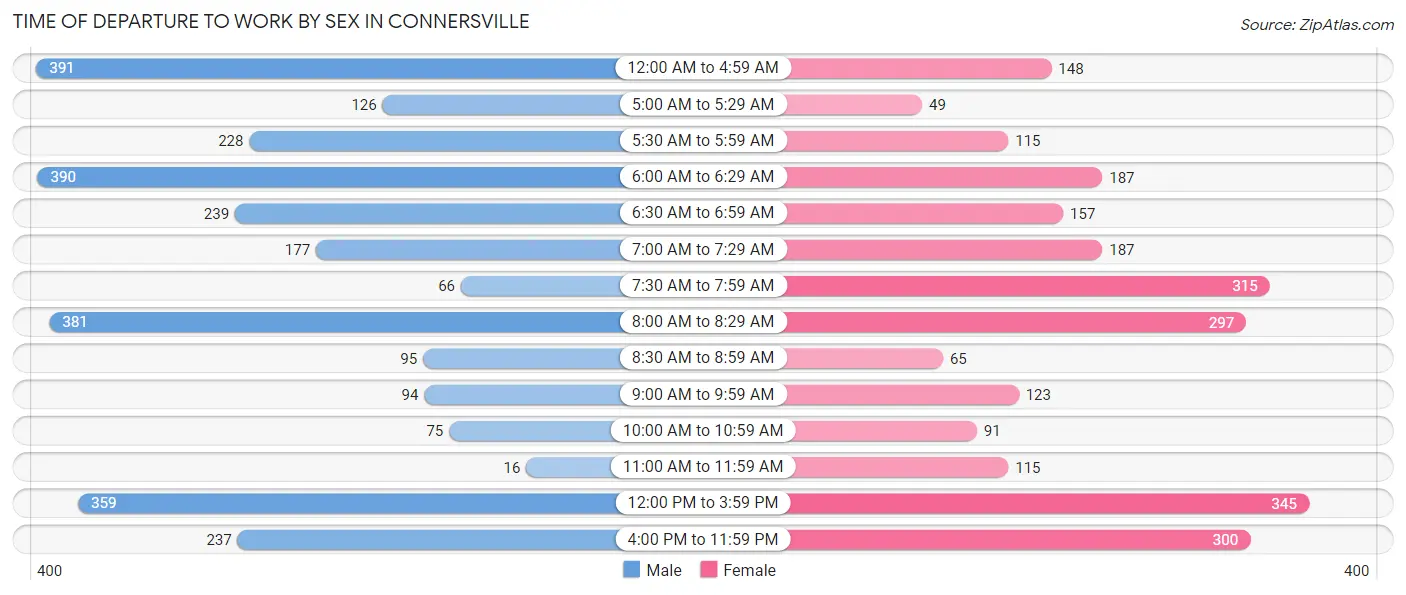
| Time of Departure | Male | Female |
| 12:00 AM to 4:59 AM | 391 (13.6%) | 148 (5.9%) |
| 5:00 AM to 5:29 AM | 126 (4.4%) | 49 (2.0%) |
| 5:30 AM to 5:59 AM | 228 (7.9%) | 115 (4.6%) |
| 6:00 AM to 6:29 AM | 390 (13.6%) | 187 (7.5%) |
| 6:30 AM to 6:59 AM | 239 (8.3%) | 157 (6.3%) |
| 7:00 AM to 7:29 AM | 177 (6.2%) | 187 (7.5%) |
| 7:30 AM to 7:59 AM | 66 (2.3%) | 315 (12.6%) |
| 8:00 AM to 8:29 AM | 381 (13.3%) | 297 (11.9%) |
| 8:30 AM to 8:59 AM | 95 (3.3%) | 65 (2.6%) |
| 9:00 AM to 9:59 AM | 94 (3.3%) | 123 (4.9%) |
| 10:00 AM to 10:59 AM | 75 (2.6%) | 91 (3.6%) |
| 11:00 AM to 11:59 AM | 16 (0.6%) | 115 (4.6%) |
| 12:00 PM to 3:59 PM | 359 (12.5%) | 345 (13.8%) |
| 4:00 PM to 11:59 PM | 237 (8.3%) | 300 (12.0%) |
| Total | 2,874 (100.0%) | 2,494 (100.0%) |
Housing Occupancy in Connersville
Occupancy by Ownership in Connersville
Of the total 5,706 dwellings in Connersville, owner-occupied units account for 3,432 (60.2%), while renter-occupied units make up 2,274 (39.9%).
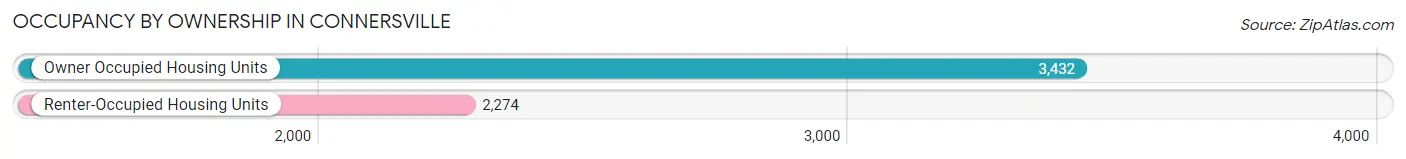
| Occupancy | # Housing Units | % Housing Units |
| Owner Occupied Housing Units | 3,432 | 60.2% |
| Renter-Occupied Housing Units | 2,274 | 39.9% |
| Total Occupied Housing Units | 5,706 | 100.0% |
Occupancy by Household Size in Connersville
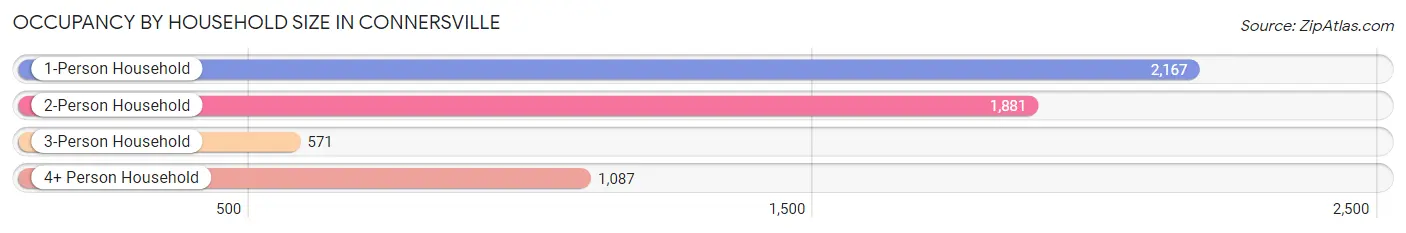
| Household Size | # Housing Units | % Housing Units |
| 1-Person Household | 2,167 | 38.0% |
| 2-Person Household | 1,881 | 33.0% |
| 3-Person Household | 571 | 10.0% |
| 4+ Person Household | 1,087 | 19.1% |
| Total Housing Units | 5,706 | 100.0% |
Occupancy by Ownership by Household Size in Connersville
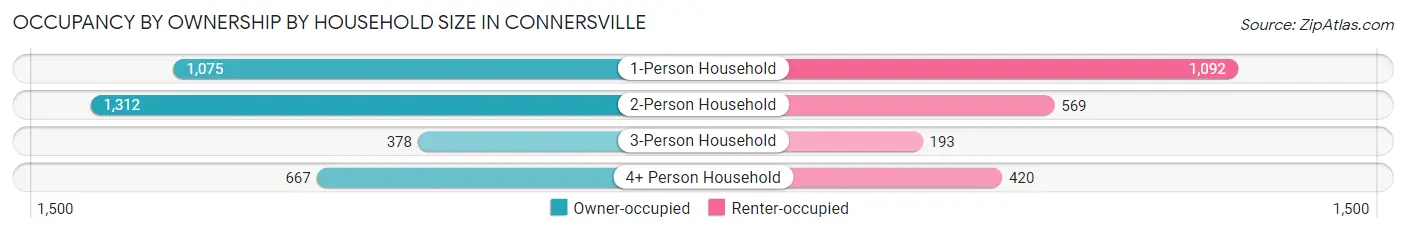
| Household Size | Owner-occupied | Renter-occupied |
| 1-Person Household | 1,075 (49.6%) | 1,092 (50.4%) |
| 2-Person Household | 1,312 (69.8%) | 569 (30.2%) |
| 3-Person Household | 378 (66.2%) | 193 (33.8%) |
| 4+ Person Household | 667 (61.4%) | 420 (38.6%) |
| Total Housing Units | 3,432 (60.2%) | 2,274 (39.9%) |
Occupancy by Educational Attainment in Connersville
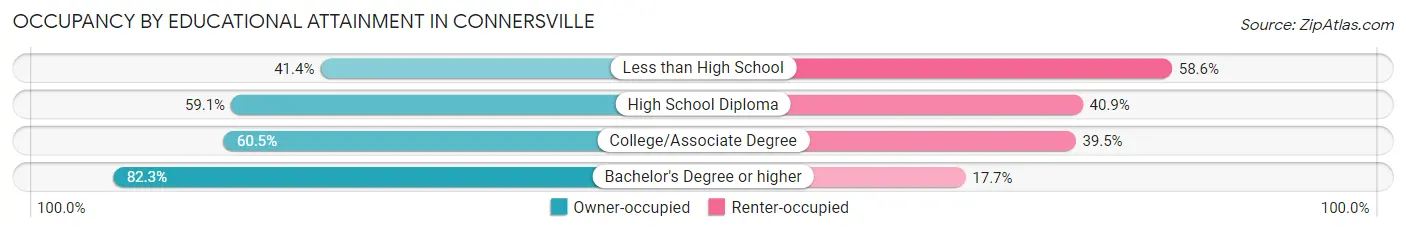
| Household Size | Owner-occupied | Renter-occupied |
| Less than High School | 411 (41.4%) | 582 (58.6%) |
| High School Diploma | 1,414 (59.1%) | 979 (40.9%) |
| College/Associate Degree | 839 (60.5%) | 548 (39.5%) |
| Bachelor's Degree or higher | 768 (82.3%) | 165 (17.7%) |
Occupancy by Age of Householder in Connersville
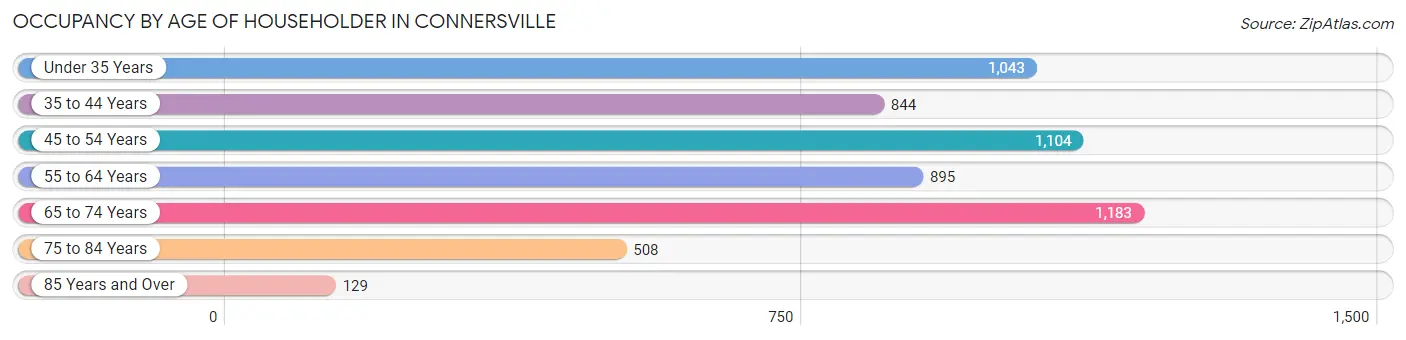
| Age Bracket | # Households | % Households |
| Under 35 Years | 1,043 | 18.3% |
| 35 to 44 Years | 844 | 14.8% |
| 45 to 54 Years | 1,104 | 19.4% |
| 55 to 64 Years | 895 | 15.7% |
| 65 to 74 Years | 1,183 | 20.7% |
| 75 to 84 Years | 508 | 8.9% |
| 85 Years and Over | 129 | 2.3% |
| Total | 5,706 | 100.0% |
Housing Finances in Connersville
Median Income by Occupancy in Connersville
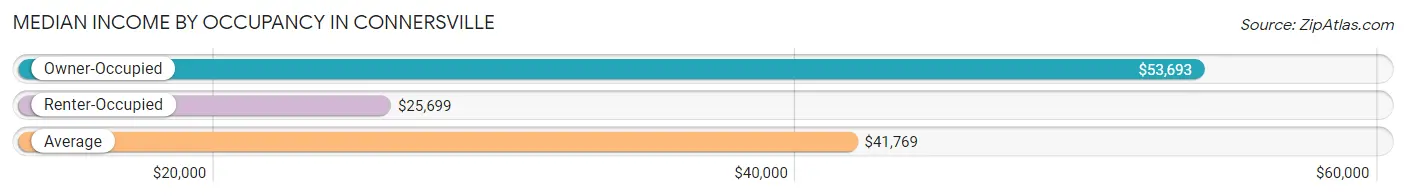
| Occupancy Type | # Households | Median Income |
| Owner-Occupied | 3,432 (60.2%) | $53,693 |
| Renter-Occupied | 2,274 (39.9%) | $25,699 |
| Average | 5,706 (100.0%) | $41,769 |
Occupancy by Householder Income Bracket in Connersville
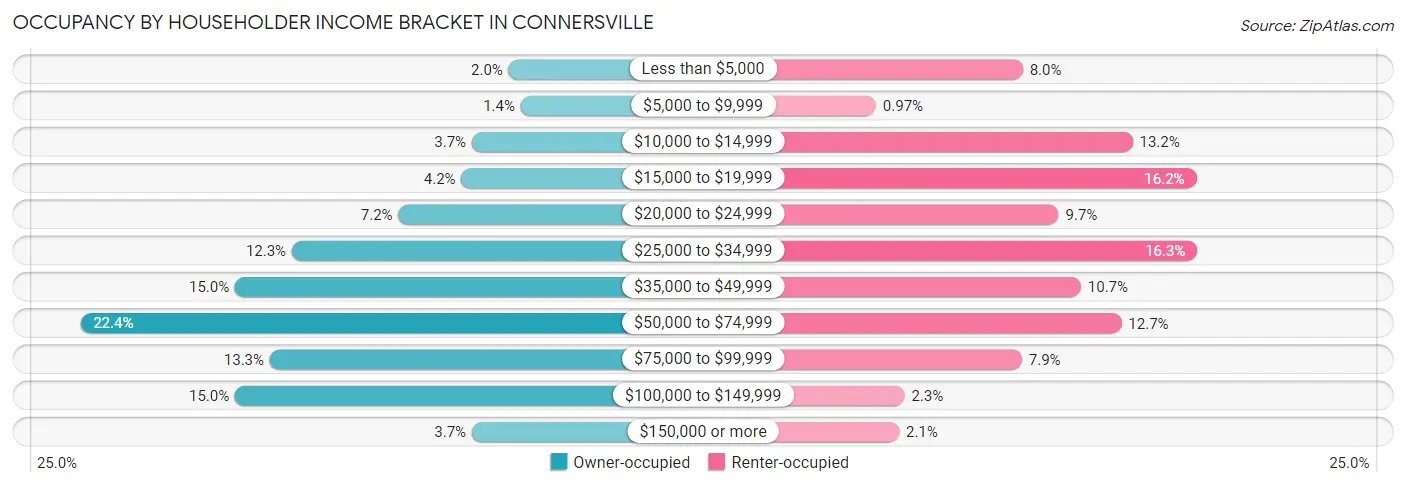
| Income Bracket | Owner-occupied | Renter-occupied |
| Less than $5,000 | 67 (1.9%) | 181 (8.0%) |
| $5,000 to $9,999 | 47 (1.4%) | 22 (1.0%) |
| $10,000 to $14,999 | 127 (3.7%) | 300 (13.2%) |
| $15,000 to $19,999 | 144 (4.2%) | 369 (16.2%) |
| $20,000 to $24,999 | 247 (7.2%) | 220 (9.7%) |
| $25,000 to $34,999 | 421 (12.3%) | 370 (16.3%) |
| $35,000 to $49,999 | 514 (15.0%) | 244 (10.7%) |
| $50,000 to $74,999 | 767 (22.4%) | 288 (12.7%) |
| $75,000 to $99,999 | 457 (13.3%) | 180 (7.9%) |
| $100,000 to $149,999 | 514 (15.0%) | 53 (2.3%) |
| $150,000 or more | 127 (3.7%) | 47 (2.1%) |
| Total | 3,432 (100.0%) | 2,274 (100.0%) |
Monthly Housing Cost Tiers in Connersville
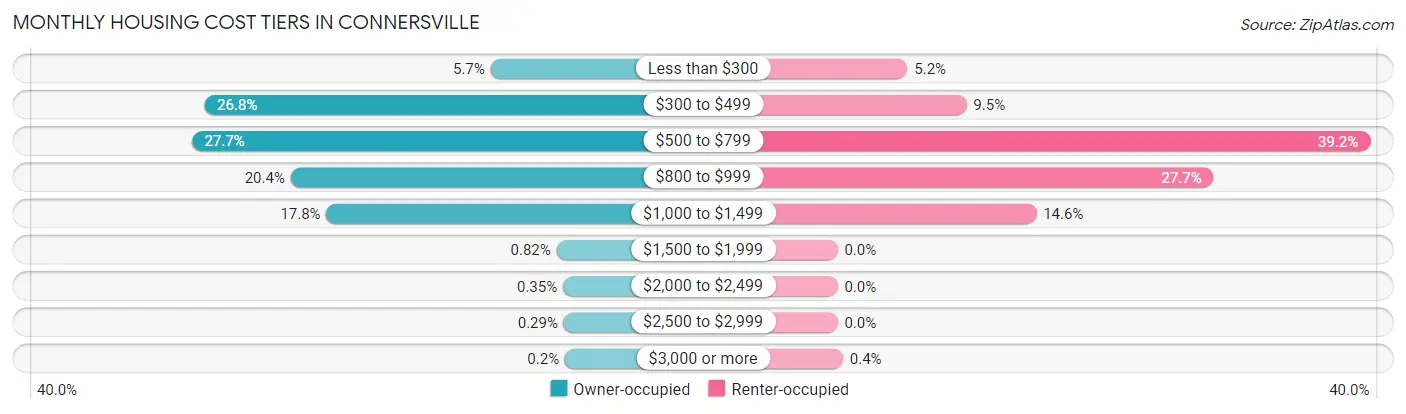
| Monthly Cost | Owner-occupied | Renter-occupied |
| Less than $300 | 195 (5.7%) | 117 (5.1%) |
| $300 to $499 | 919 (26.8%) | 216 (9.5%) |
| $500 to $799 | 951 (27.7%) | 892 (39.2%) |
| $800 to $999 | 700 (20.4%) | 630 (27.7%) |
| $1,000 to $1,499 | 610 (17.8%) | 333 (14.6%) |
| $1,500 to $1,999 | 28 (0.8%) | 0 (0.0%) |
| $2,000 to $2,499 | 12 (0.4%) | 0 (0.0%) |
| $2,500 to $2,999 | 10 (0.3%) | 0 (0.0%) |
| $3,000 or more | 7 (0.2%) | 9 (0.4%) |
| Total | 3,432 (100.0%) | 2,274 (100.0%) |
Physical Housing Characteristics in Connersville
Housing Structures in Connersville
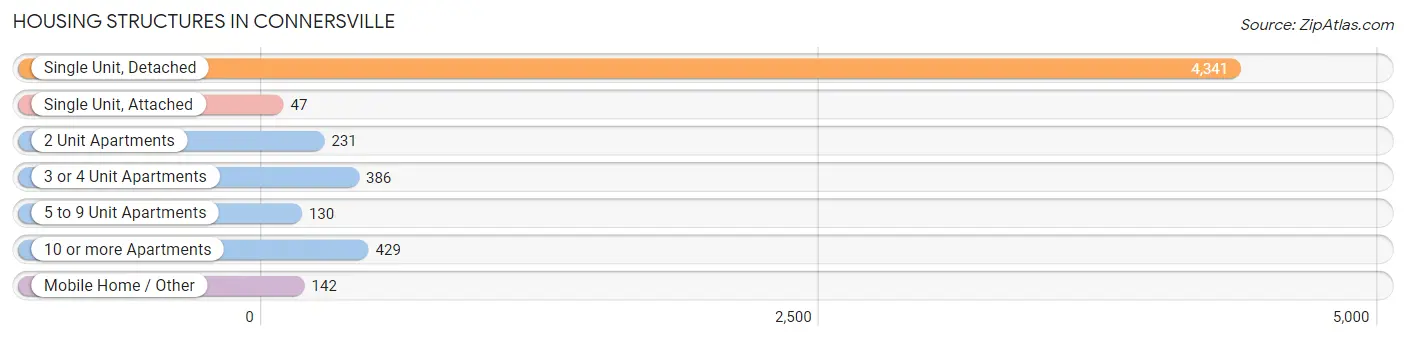
| Structure Type | # Housing Units | % Housing Units |
| Single Unit, Detached | 4,341 | 76.1% |
| Single Unit, Attached | 47 | 0.8% |
| 2 Unit Apartments | 231 | 4.1% |
| 3 or 4 Unit Apartments | 386 | 6.8% |
| 5 to 9 Unit Apartments | 130 | 2.3% |
| 10 or more Apartments | 429 | 7.5% |
| Mobile Home / Other | 142 | 2.5% |
| Total | 5,706 | 100.0% |
Housing Structures by Occupancy in Connersville
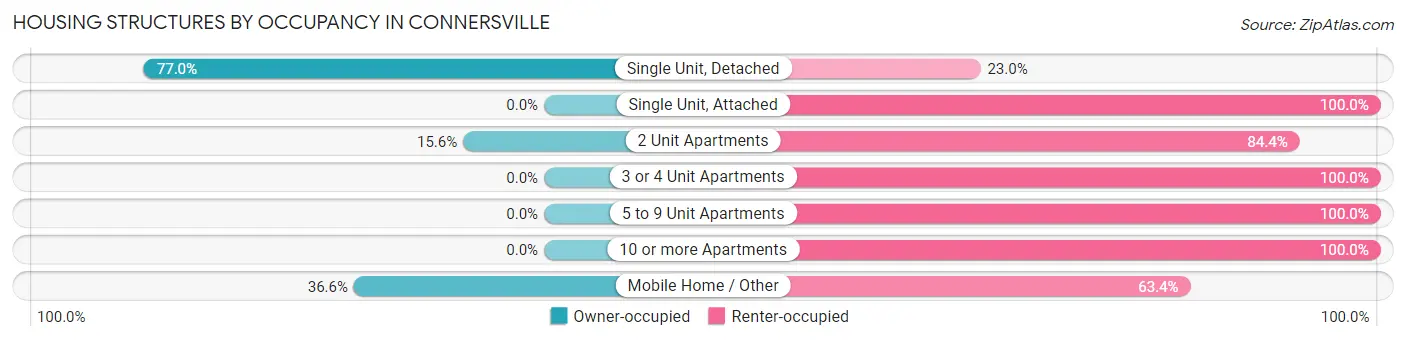
| Structure Type | Owner-occupied | Renter-occupied |
| Single Unit, Detached | 3,344 (77.0%) | 997 (23.0%) |
| Single Unit, Attached | 0 (0.0%) | 47 (100.0%) |
| 2 Unit Apartments | 36 (15.6%) | 195 (84.4%) |
| 3 or 4 Unit Apartments | 0 (0.0%) | 386 (100.0%) |
| 5 to 9 Unit Apartments | 0 (0.0%) | 130 (100.0%) |
| 10 or more Apartments | 0 (0.0%) | 429 (100.0%) |
| Mobile Home / Other | 52 (36.6%) | 90 (63.4%) |
| Total | 3,432 (60.2%) | 2,274 (39.9%) |
Housing Structures by Number of Rooms in Connersville
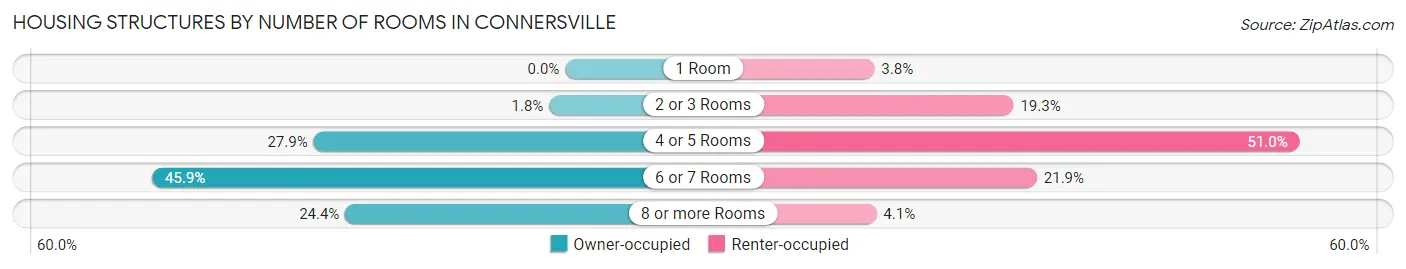
| Number of Rooms | Owner-occupied | Renter-occupied |
| 1 Room | 0 (0.0%) | 87 (3.8%) |
| 2 or 3 Rooms | 61 (1.8%) | 438 (19.3%) |
| 4 or 5 Rooms | 959 (27.9%) | 1,160 (51.0%) |
| 6 or 7 Rooms | 1,574 (45.9%) | 497 (21.9%) |
| 8 or more Rooms | 838 (24.4%) | 92 (4.1%) |
| Total | 3,432 (100.0%) | 2,274 (100.0%) |
Housing Structure by Heating Type in Connersville
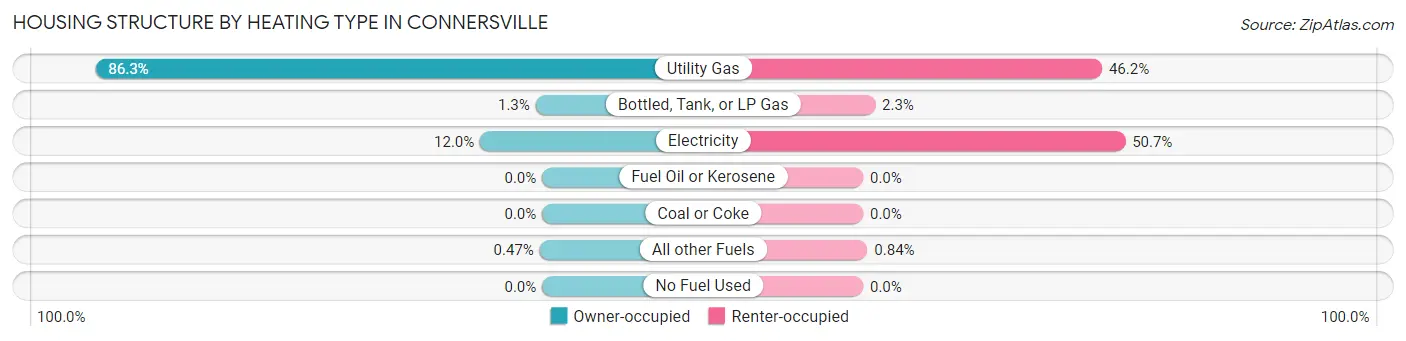
| Heating Type | Owner-occupied | Renter-occupied |
| Utility Gas | 2,962 (86.3%) | 1,050 (46.2%) |
| Bottled, Tank, or LP Gas | 43 (1.3%) | 53 (2.3%) |
| Electricity | 411 (12.0%) | 1,152 (50.7%) |
| Fuel Oil or Kerosene | 0 (0.0%) | 0 (0.0%) |
| Coal or Coke | 0 (0.0%) | 0 (0.0%) |
| All other Fuels | 16 (0.5%) | 19 (0.8%) |
| No Fuel Used | 0 (0.0%) | 0 (0.0%) |
| Total | 3,432 (100.0%) | 2,274 (100.0%) |
Household Vehicle Usage in Connersville
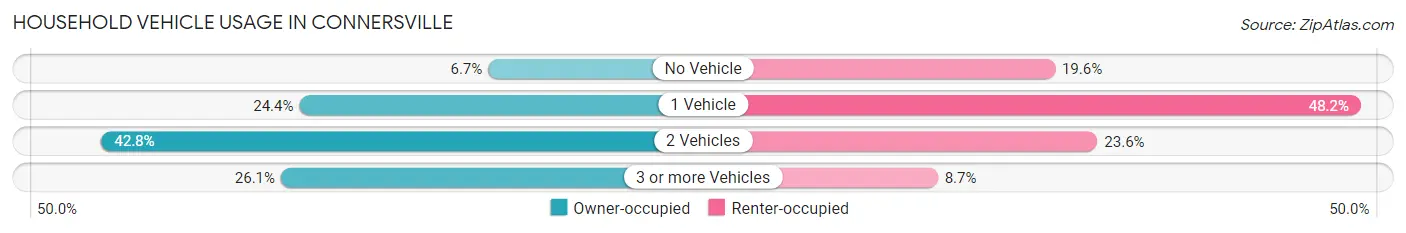
| Vehicles per Household | Owner-occupied | Renter-occupied |
| No Vehicle | 231 (6.7%) | 446 (19.6%) |
| 1 Vehicle | 836 (24.4%) | 1,095 (48.1%) |
| 2 Vehicles | 1,470 (42.8%) | 536 (23.6%) |
| 3 or more Vehicles | 895 (26.1%) | 197 (8.7%) |
| Total | 3,432 (100.0%) | 2,274 (100.0%) |
Real Estate & Mortgages in Connersville
Real Estate and Mortgage Overview in Connersville
| Characteristic | Without Mortgage | With Mortgage |
| Housing Units | 1,411 | 2,021 |
| Median Property Value | $92,000 | $88,900 |
| Median Household Income | $39,236 | $102 |
| Monthly Housing Costs | $415 | $7 |
| Real Estate Taxes | $636 | $26 |
Property Value by Mortgage Status in Connersville
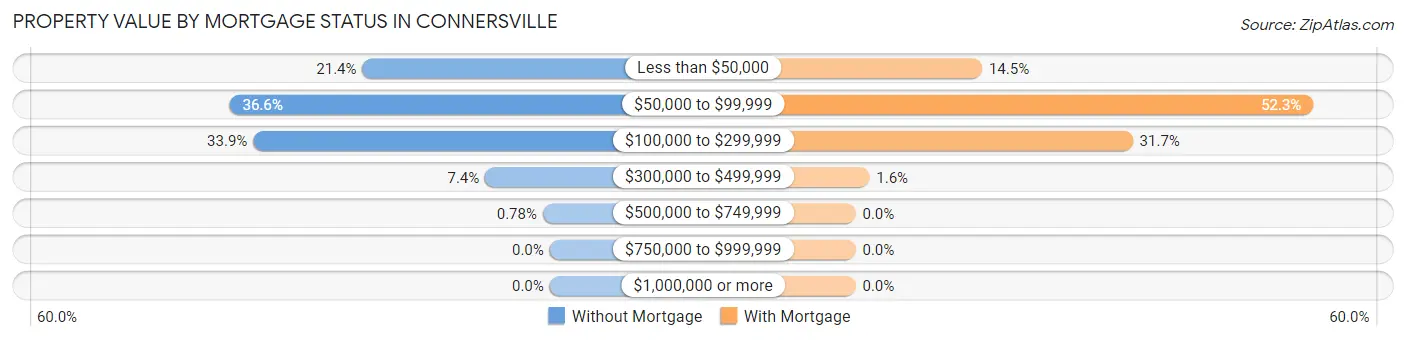
| Property Value | Without Mortgage | With Mortgage |
| Less than $50,000 | 302 (21.4%) | 292 (14.4%) |
| $50,000 to $99,999 | 516 (36.6%) | 1,057 (52.3%) |
| $100,000 to $299,999 | 478 (33.9%) | 640 (31.7%) |
| $300,000 to $499,999 | 104 (7.4%) | 32 (1.6%) |
| $500,000 to $749,999 | 11 (0.8%) | 0 (0.0%) |
| $750,000 to $999,999 | 0 (0.0%) | 0 (0.0%) |
| $1,000,000 or more | 0 (0.0%) | 0 (0.0%) |
| Total | 1,411 (100.0%) | 2,021 (100.0%) |
Household Income by Mortgage Status in Connersville
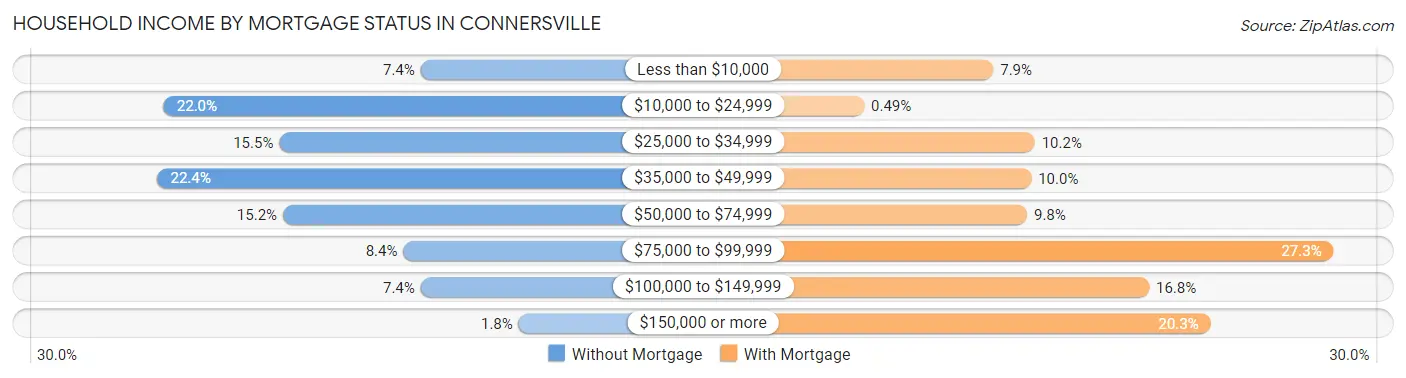
| Household Income | Without Mortgage | With Mortgage |
| Less than $10,000 | 104 (7.4%) | 159 (7.9%) |
| $10,000 to $24,999 | 311 (22.0%) | 10 (0.5%) |
| $25,000 to $34,999 | 218 (15.4%) | 207 (10.2%) |
| $35,000 to $49,999 | 316 (22.4%) | 203 (10.0%) |
| $50,000 to $74,999 | 215 (15.2%) | 198 (9.8%) |
| $75,000 to $99,999 | 118 (8.4%) | 552 (27.3%) |
| $100,000 to $149,999 | 104 (7.4%) | 339 (16.8%) |
| $150,000 or more | 25 (1.8%) | 410 (20.3%) |
| Total | 1,411 (100.0%) | 2,021 (100.0%) |
Property Value to Household Income Ratio in Connersville
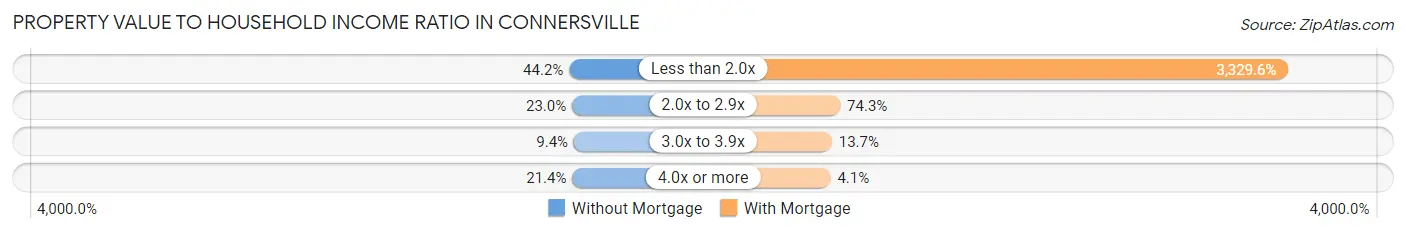
| Value-to-Income Ratio | Without Mortgage | With Mortgage |
| Less than 2.0x | 623 (44.2%) | 67,292 (3,329.6%) |
| 2.0x to 2.9x | 324 (23.0%) | 1,501 (74.3%) |
| 3.0x to 3.9x | 133 (9.4%) | 277 (13.7%) |
| 4.0x or more | 302 (21.4%) | 82 (4.1%) |
| Total | 1,411 (100.0%) | 2,021 (100.0%) |
Real Estate Taxes by Mortgage Status in Connersville
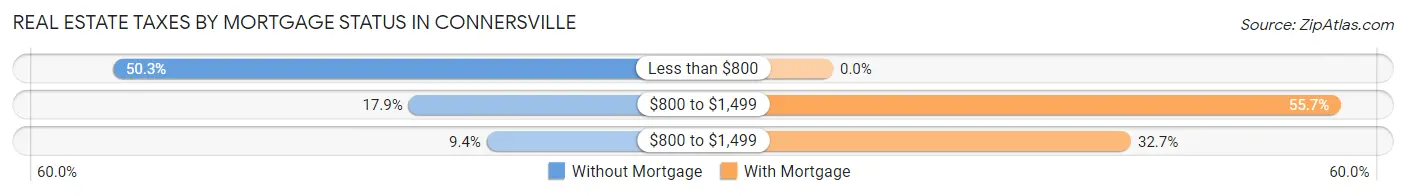
| Property Taxes | Without Mortgage | With Mortgage |
| Less than $800 | 710 (50.3%) | 0 (0.0%) |
| $800 to $1,499 | 253 (17.9%) | 1,125 (55.7%) |
| $800 to $1,499 | 132 (9.4%) | 660 (32.7%) |
| Total | 1,411 (100.0%) | 2,021 (100.0%) |
Health & Disability in Connersville
Health Insurance Coverage by Age in Connersville
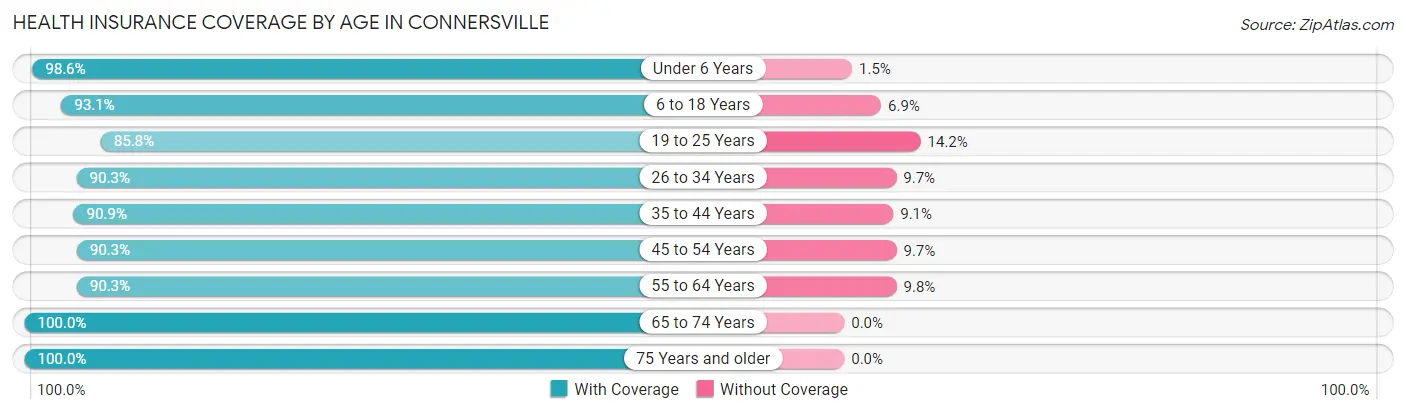
| Age Bracket | With Coverage | Without Coverage |
| Under 6 Years | 882 (98.6%) | 13 (1.5%) |
| 6 to 18 Years | 2,145 (93.1%) | 158 (6.9%) |
| 19 to 25 Years | 1,091 (85.8%) | 181 (14.2%) |
| 26 to 34 Years | 1,255 (90.3%) | 135 (9.7%) |
| 35 to 44 Years | 1,382 (90.9%) | 139 (9.1%) |
| 45 to 54 Years | 1,576 (90.3%) | 170 (9.7%) |
| 55 to 64 Years | 1,389 (90.2%) | 150 (9.8%) |
| 65 to 74 Years | 1,586 (100.0%) | 0 (0.0%) |
| 75 Years and older | 922 (100.0%) | 0 (0.0%) |
| Total | 12,228 (92.8%) | 946 (7.2%) |
Health Insurance Coverage by Citizenship Status in Connersville
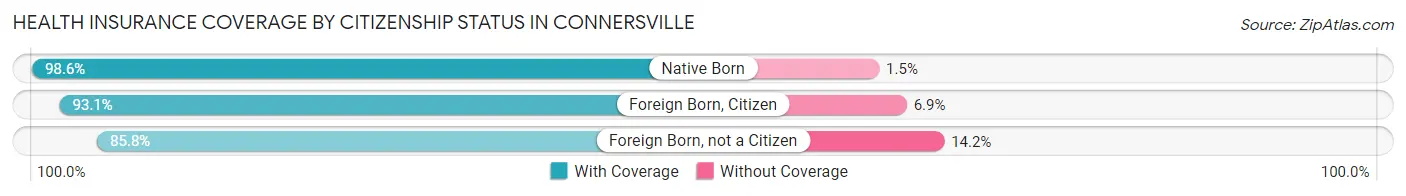
| Citizenship Status | With Coverage | Without Coverage |
| Native Born | 882 (98.6%) | 13 (1.5%) |
| Foreign Born, Citizen | 2,145 (93.1%) | 158 (6.9%) |
| Foreign Born, not a Citizen | 1,091 (85.8%) | 181 (14.2%) |
Health Insurance Coverage by Household Income in Connersville
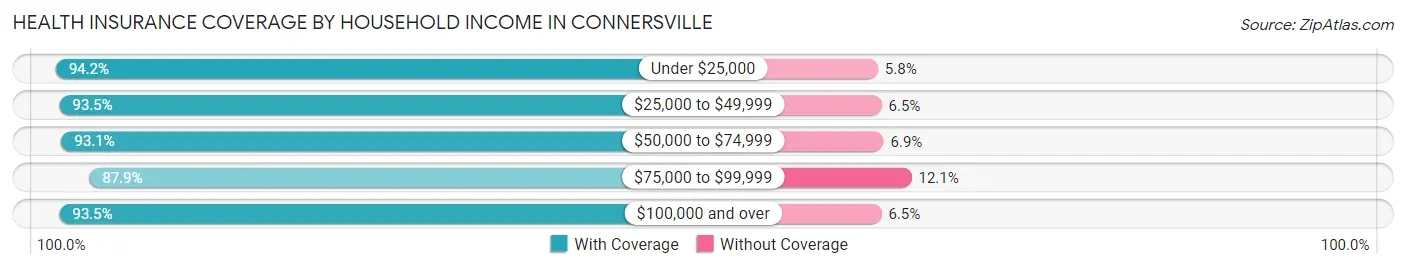
| Household Income | With Coverage | Without Coverage |
| Under $25,000 | 2,618 (94.2%) | 162 (5.8%) |
| $25,000 to $49,999 | 3,025 (93.5%) | 211 (6.5%) |
| $50,000 to $74,999 | 2,590 (93.1%) | 192 (6.9%) |
| $75,000 to $99,999 | 1,557 (87.9%) | 215 (12.1%) |
| $100,000 and over | 2,384 (93.5%) | 166 (6.5%) |
Public vs Private Health Insurance Coverage by Age in Connersville
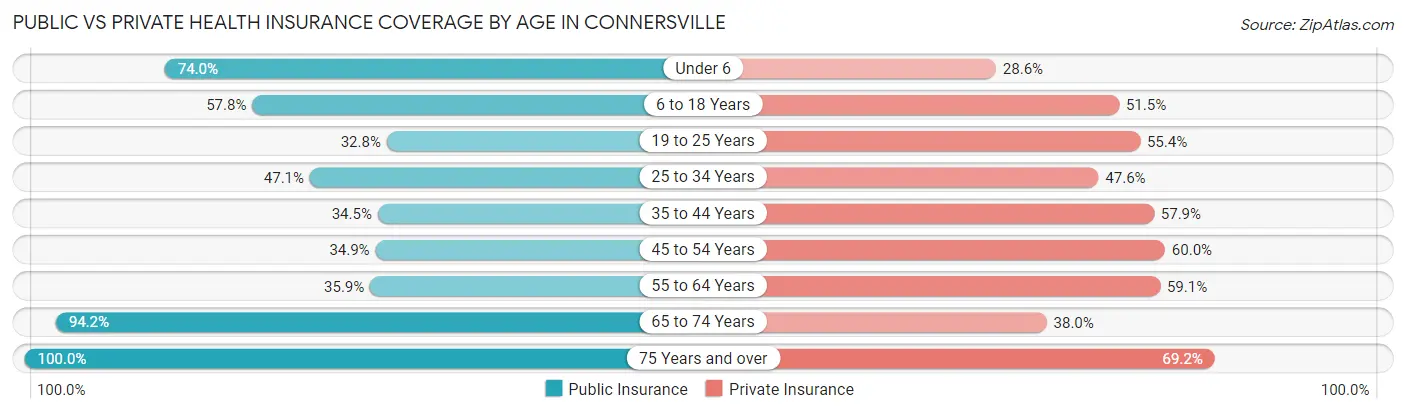
| Age Bracket | Public Insurance | Private Insurance |
| Under 6 | 662 (74.0%) | 256 (28.6%) |
| 6 to 18 Years | 1,330 (57.8%) | 1,185 (51.4%) |
| 19 to 25 Years | 417 (32.8%) | 704 (55.3%) |
| 25 to 34 Years | 654 (47.0%) | 662 (47.6%) |
| 35 to 44 Years | 524 (34.4%) | 881 (57.9%) |
| 45 to 54 Years | 609 (34.9%) | 1,047 (60.0%) |
| 55 to 64 Years | 552 (35.9%) | 909 (59.1%) |
| 65 to 74 Years | 1,494 (94.2%) | 603 (38.0%) |
| 75 Years and over | 922 (100.0%) | 638 (69.2%) |
| Total | 7,164 (54.4%) | 6,885 (52.3%) |
Disability Status by Sex by Age in Connersville
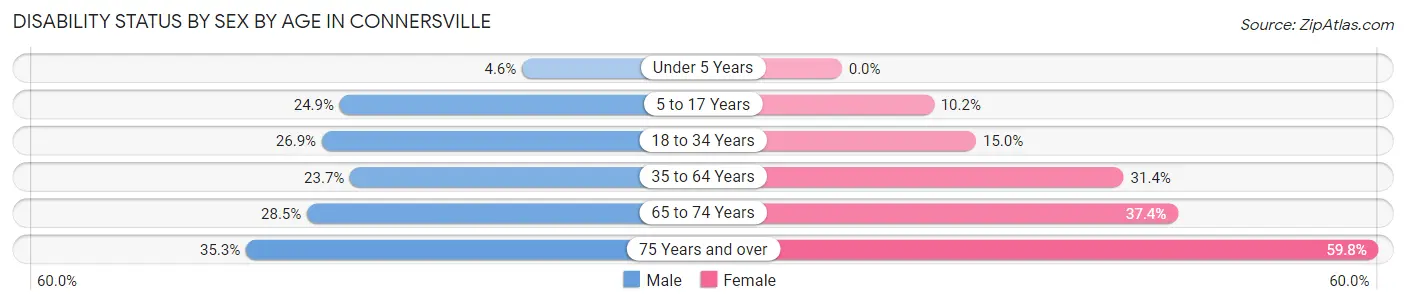
| Age Bracket | Male | Female |
| Under 5 Years | 15 (4.6%) | 0 (0.0%) |
| 5 to 17 Years | 261 (24.9%) | 126 (10.2%) |
| 18 to 34 Years | 380 (26.9%) | 215 (14.9%) |
| 35 to 64 Years | 551 (23.7%) | 780 (31.4%) |
| 65 to 74 Years | 230 (28.5%) | 292 (37.4%) |
| 75 Years and over | 129 (35.3%) | 333 (59.8%) |
Disability Class by Sex by Age in Connersville
Disability Class: Hearing Difficulty
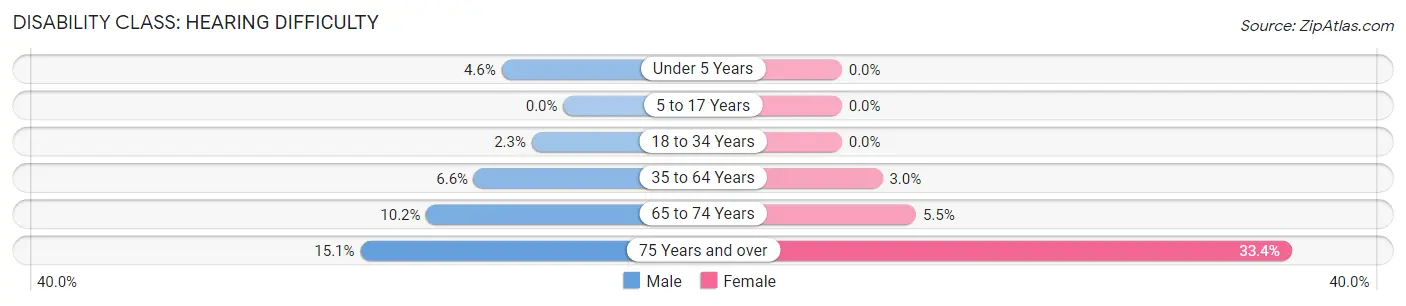
| Age Bracket | Male | Female |
| Under 5 Years | 15 (4.6%) | 0 (0.0%) |
| 5 to 17 Years | 0 (0.0%) | 0 (0.0%) |
| 18 to 34 Years | 33 (2.3%) | 0 (0.0%) |
| 35 to 64 Years | 154 (6.6%) | 75 (3.0%) |
| 65 to 74 Years | 82 (10.2%) | 43 (5.5%) |
| 75 Years and over | 55 (15.1%) | 186 (33.4%) |
Disability Class: Vision Difficulty
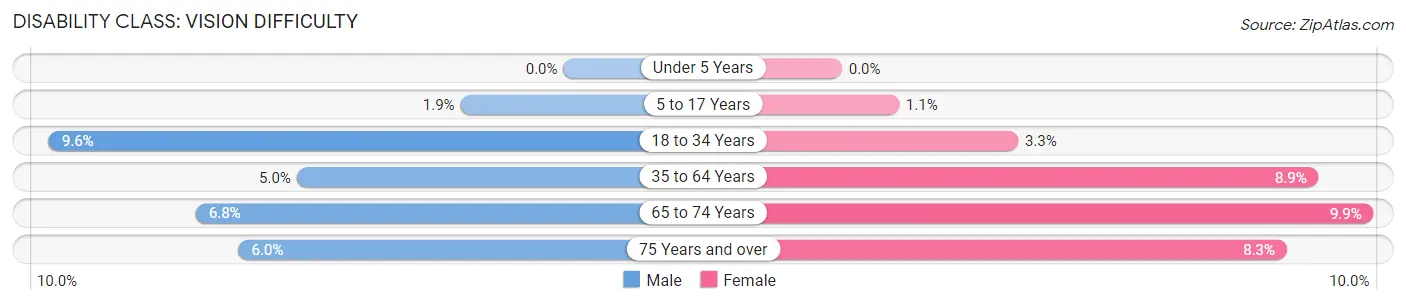
| Age Bracket | Male | Female |
| Under 5 Years | 0 (0.0%) | 0 (0.0%) |
| 5 to 17 Years | 20 (1.9%) | 13 (1.1%) |
| 18 to 34 Years | 135 (9.6%) | 47 (3.3%) |
| 35 to 64 Years | 115 (5.0%) | 220 (8.8%) |
| 65 to 74 Years | 55 (6.8%) | 77 (9.9%) |
| 75 Years and over | 22 (6.0%) | 46 (8.3%) |
Disability Class: Cognitive Difficulty
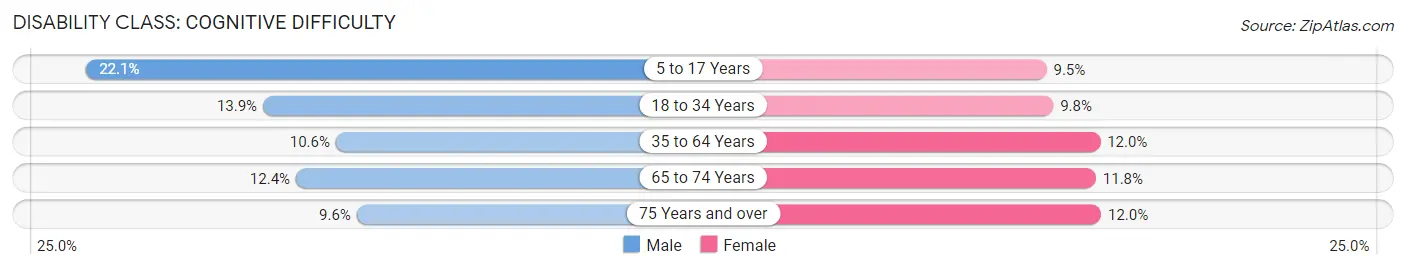
| Age Bracket | Male | Female |
| 5 to 17 Years | 232 (22.1%) | 117 (9.5%) |
| 18 to 34 Years | 197 (13.9%) | 141 (9.8%) |
| 35 to 64 Years | 245 (10.6%) | 298 (12.0%) |
| 65 to 74 Years | 100 (12.4%) | 92 (11.8%) |
| 75 Years and over | 35 (9.6%) | 67 (12.0%) |
Disability Class: Ambulatory Difficulty
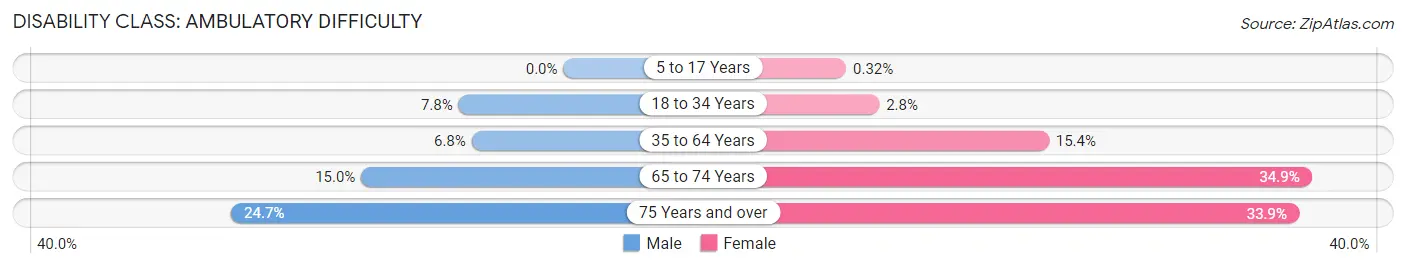
| Age Bracket | Male | Female |
| 5 to 17 Years | 0 (0.0%) | 4 (0.3%) |
| 18 to 34 Years | 110 (7.8%) | 40 (2.8%) |
| 35 to 64 Years | 158 (6.8%) | 382 (15.4%) |
| 65 to 74 Years | 121 (15.0%) | 272 (34.9%) |
| 75 Years and over | 90 (24.7%) | 189 (33.9%) |
Disability Class: Self-Care Difficulty
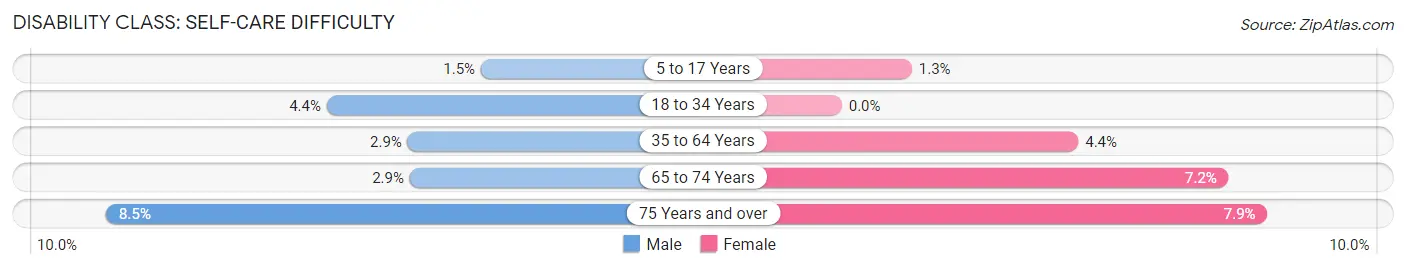
| Age Bracket | Male | Female |
| 5 to 17 Years | 16 (1.5%) | 16 (1.3%) |
| 18 to 34 Years | 62 (4.4%) | 0 (0.0%) |
| 35 to 64 Years | 67 (2.9%) | 109 (4.4%) |
| 65 to 74 Years | 23 (2.9%) | 56 (7.2%) |
| 75 Years and over | 31 (8.5%) | 44 (7.9%) |
Technology Access in Connersville
Computing Device Access in Connersville
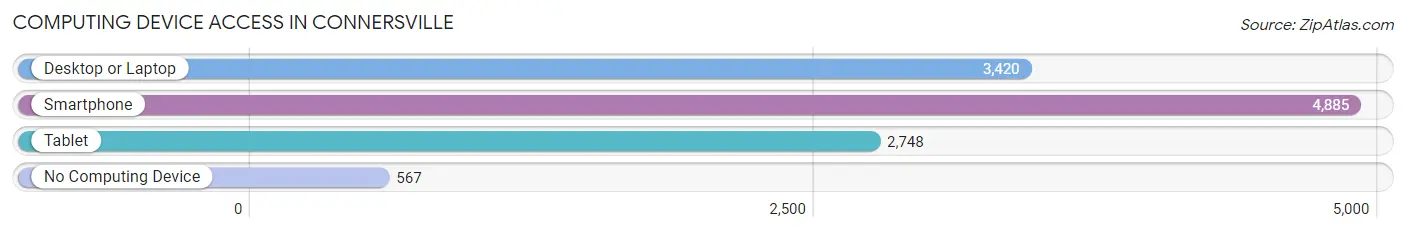
| Device Type | # Households | % Households |
| Desktop or Laptop | 3,420 | 59.9% |
| Smartphone | 4,885 | 85.6% |
| Tablet | 2,748 | 48.2% |
| No Computing Device | 567 | 9.9% |
| Total | 5,706 | 100.0% |
Internet Access in Connersville
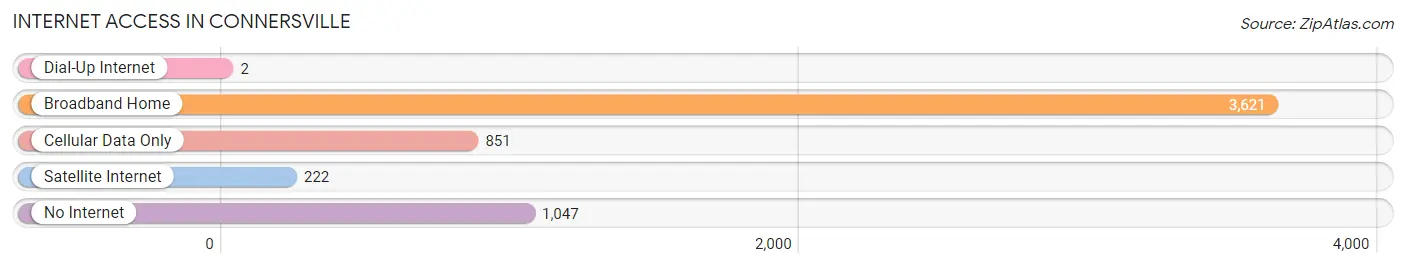
| Internet Type | # Households | % Households |
| Dial-Up Internet | 2 | 0.0% |
| Broadband Home | 3,621 | 63.5% |
| Cellular Data Only | 851 | 14.9% |
| Satellite Internet | 222 | 3.9% |
| No Internet | 1,047 | 18.3% |
| Total | 5,706 | 100.0% |
Connersville Summary
Connersville, Indiana is a small city located in Fayette County, Indiana. It is situated in the east-central part of the state, approximately 50 miles east of Indianapolis. The city has a population of 13,481, according to the 2010 census.
History
Connersville was founded in 1814 by William Conner, a fur trader and land speculator. The city was originally known as Conner's Settlement, and was later renamed Connersville in 1817. The city was incorporated in 1837.
In the early 19th century, Connersville was a major stop on the National Road, which connected the East Coast to the Midwest. The city was also a major hub for the Wabash and Erie Canal, which connected the Great Lakes to the Ohio River.
The city experienced a period of growth in the late 19th and early 20th centuries, due to its location on the railroads and its proximity to the coal fields of Indiana. The city was home to several factories, including the Connersville Furniture Company, which was founded in 1876 and was one of the largest furniture manufacturers in the United States.
Geography
Connersville is located in east-central Indiana, approximately 50 miles east of Indianapolis. The city is situated in the Whitewater Valley, which is part of the larger Great Miami River Valley. The city is located on the banks of the Whitewater River, which flows through the city.
The city has a total area of 8.3 square miles, of which 8.2 square miles is land and 0.1 square miles is water. The city is located in a humid continental climate zone, with hot summers and cold winters.
Economy
Connersville's economy is largely based on manufacturing. The city is home to several factories, including the Connersville Furniture Company, which is one of the largest furniture manufacturers in the United States. The city is also home to several automotive parts manufacturers, including the Connersville Automotive Parts Company.
The city is also home to several retail stores, including Walmart, Kmart, and several local businesses. The city is also home to several restaurants, including several fast food restaurants and several local restaurants.
Demographics
According to the 2010 census, Connersville has a population of 13,481. The city has a median household income of $37,945, and a median family income of $45,945. The city has a poverty rate of 17.3%, and a median age of 38.7 years.
The city is predominantly white, with a population that is 88.3% white, 5.3% African American, 0.7% Asian, 0.2% Native American, and 4.5% other. The city is also home to a large Hispanic population, with a population that is 8.3% Hispanic or Latino.
Conclusion
Connersville, Indiana is a small city located in Fayette County, Indiana. It is situated in the east-central part of the state, approximately 50 miles east of Indianapolis. The city has a population of 13,481, according to the 2010 census. The city has a long history, dating back to its founding in 1814. The city was a major stop on the National Road and the Wabash and Erie Canal, and experienced a period of growth in the late 19th and early 20th centuries due to its location on the railroads and its proximity to the coal fields of Indiana. The city's economy is largely based on manufacturing, and the city is home to several factories, retail stores, and restaurants. The city has a predominantly white population, with a median household income of $37,945 and a poverty rate of 17.3%.
Common Questions
What is Per Capita Income in Connersville?
Per Capita income in Connersville is $23,426.
What is the Median Family Income in Connersville?
Median Family Income in Connersville is $52,271.
What is the Median Household income in Connersville?
Median Household Income in Connersville is $41,769.
What is Income or Wage Gap in Connersville?
Income or Wage Gap in Connersville is 52.9%.
Women in Connersville earn 47.1 cents for every dollar earned by a man.
What is Family Income Deficit in Connersville?
Family Income Deficit in Connersville is $8,971.
Families that are below poverty line in Connersville earn $8,971 less on average than the poverty threshold level.
What is Inequality or Gini Index in Connersville?
Inequality or Gini Index in Connersville is 0.41.
What is the Total Population of Connersville?
Total Population of Connersville is 13,395.
What is the Total Male Population of Connersville?
Total Male Population of Connersville is 6,396.
What is the Total Female Population of Connersville?
Total Female Population of Connersville is 6,999.
What is the Ratio of Males per 100 Females in Connersville?
There are 91.38 Males per 100 Females in Connersville.
What is the Ratio of Females per 100 Males in Connersville?
There are 109.43 Females per 100 Males in Connersville.
What is the Median Population Age in Connersville?
Median Population Age in Connersville is 40.6 Years.
What is the Average Family Size in Connersville
Average Family Size in Connersville is 3.0 People.
What is the Average Household Size in Connersville
Average Household Size in Connersville is 2.3 People.
How Large is the Labor Force in Connersville?
There are 6,073 People in the Labor Forcein in Connersville.
What is the Percentage of People in the Labor Force in Connersville?
56.6% of People are in the Labor Force in Connersville.
What is the Unemployment Rate in Connersville?
Unemployment Rate in Connersville is 5.8%.