Brownsburg, IN Map & Demographics
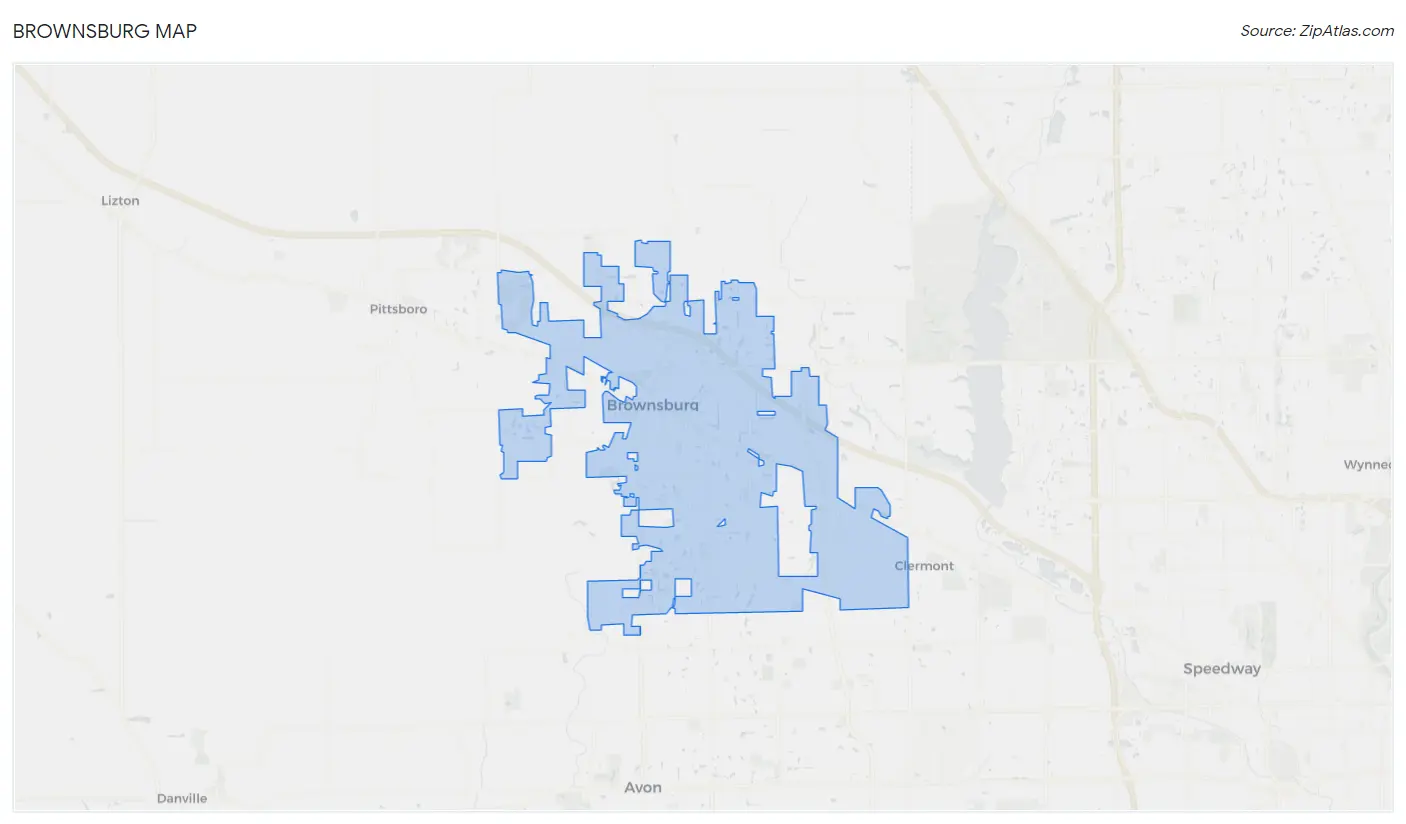
Brownsburg Map
Brownsburg Overview
$43,962
PER CAPITA INCOME
$112,663
AVG FAMILY INCOME
$101,883
AVG HOUSEHOLD INCOME
27.3%
WAGE / INCOME GAP [ % ]
72.7¢/ $1
WAGE / INCOME GAP [ $ ]
0.38
INEQUALITY / GINI INDEX
29,379
TOTAL POPULATION
15,041
MALE POPULATION
14,338
FEMALE POPULATION
104.90
MALES / 100 FEMALES
95.33
FEMALES / 100 MALES
35.7
MEDIAN AGE
3.1
AVG FAMILY SIZE
2.8
AVG HOUSEHOLD SIZE
15,878
LABOR FORCE [ PEOPLE ]
72.5%
PERCENT IN LABOR FORCE
1.2%
UNEMPLOYMENT RATE
Brownsburg Zip Codes
Brownsburg Area Codes
Income in Brownsburg
Income Overview in Brownsburg
Per Capita Income in Brownsburg is $43,962, while median incomes of families and households are $112,663 and $101,883 respectively.
| Characteristic | Number | Measure |
| Per Capita Income | 29,379 | $43,962 |
| Median Family Income | 8,069 | $112,663 |
| Mean Family Income | 8,069 | $133,496 |
| Median Household Income | 10,488 | $101,883 |
| Mean Household Income | 10,488 | $118,831 |
| Income Deficit | 8,069 | $0 |
| Wage / Income Gap (%) | 29,379 | 27.31% |
| Wage / Income Gap ($) | 29,379 | 72.69¢ per $1 |
| Gini / Inequality Index | 29,379 | 0.38 |
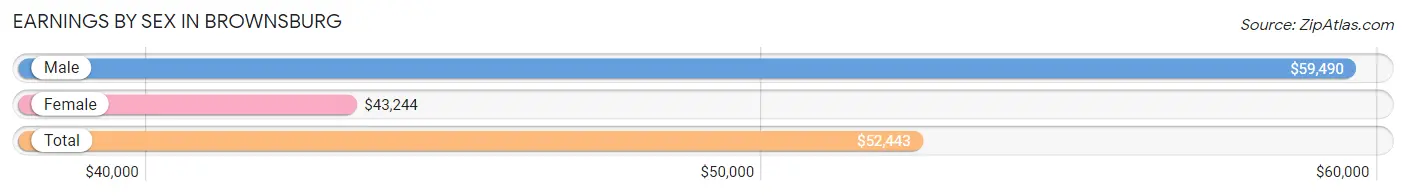
Earnings by Sex in Brownsburg
Average Earnings in Brownsburg are $52,443, $59,490 for men and $43,244 for women, a difference of 27.3%.
| Sex | Number | Average Earnings |
| Male | 8,682 (52.5%) | $59,490 |
| Female | 7,842 (47.5%) | $43,244 |
| Total | 16,524 (100.0%) | $52,443 |
Earnings by Sex by Income Bracket in Brownsburg
The most common earnings brackets in Brownsburg are $100,000+ for men (1,942 | 22.4%) and $100,000+ for women (1,245 | 15.9%).
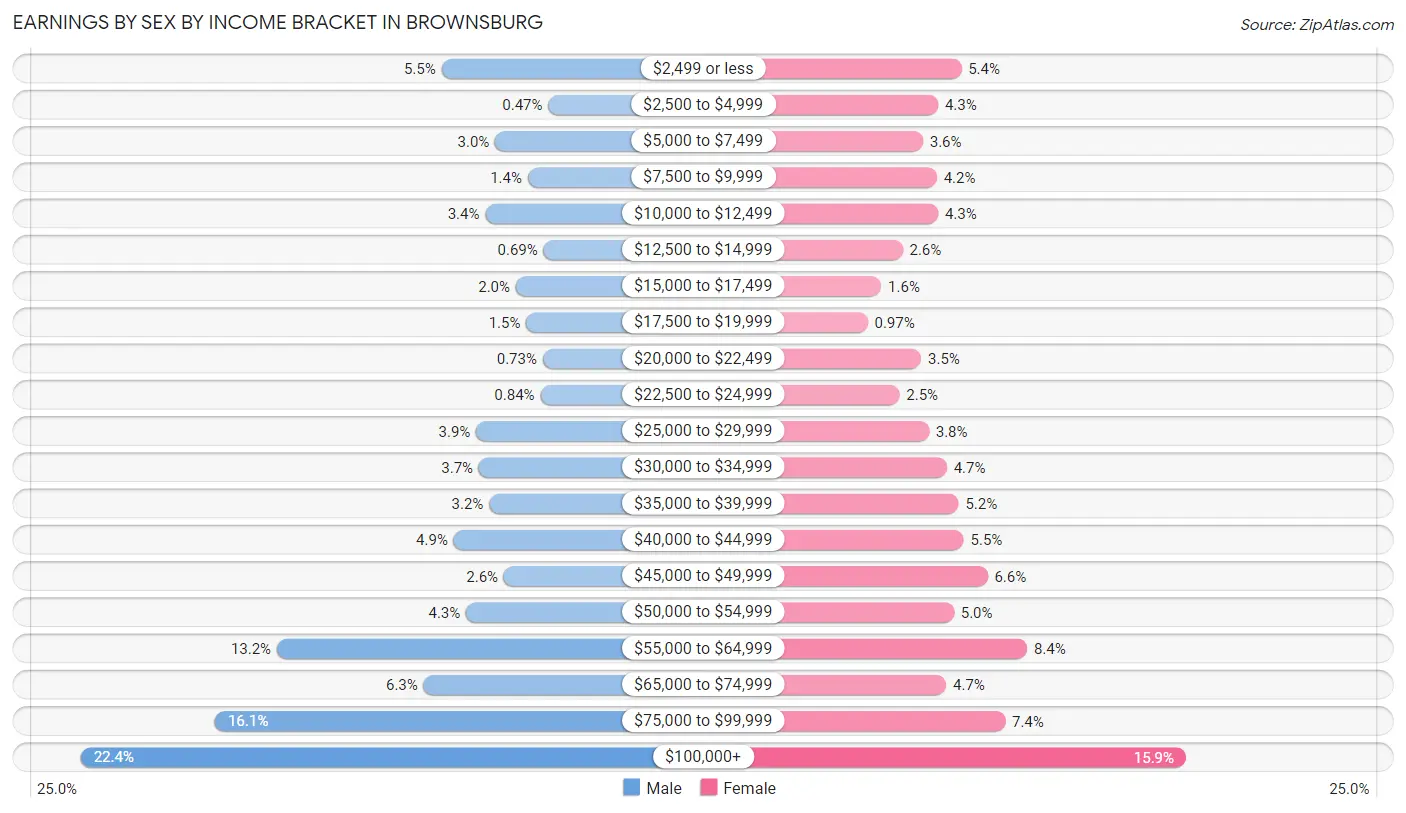
| Income | Male | Female |
| $2,499 or less | 475 (5.5%) | 420 (5.4%) |
| $2,500 to $4,999 | 41 (0.5%) | 335 (4.3%) |
| $5,000 to $7,499 | 257 (3.0%) | 279 (3.6%) |
| $7,500 to $9,999 | 124 (1.4%) | 330 (4.2%) |
| $10,000 to $12,499 | 297 (3.4%) | 335 (4.3%) |
| $12,500 to $14,999 | 60 (0.7%) | 205 (2.6%) |
| $15,000 to $17,499 | 173 (2.0%) | 126 (1.6%) |
| $17,500 to $19,999 | 130 (1.5%) | 76 (1.0%) |
| $20,000 to $22,499 | 63 (0.7%) | 273 (3.5%) |
| $22,500 to $24,999 | 73 (0.8%) | 193 (2.5%) |
| $25,000 to $29,999 | 334 (3.8%) | 301 (3.8%) |
| $30,000 to $34,999 | 323 (3.7%) | 367 (4.7%) |
| $35,000 to $39,999 | 281 (3.2%) | 410 (5.2%) |
| $40,000 to $44,999 | 425 (4.9%) | 429 (5.5%) |
| $45,000 to $49,999 | 221 (2.5%) | 517 (6.6%) |
| $50,000 to $54,999 | 375 (4.3%) | 393 (5.0%) |
| $55,000 to $64,999 | 1,144 (13.2%) | 662 (8.4%) |
| $65,000 to $74,999 | 548 (6.3%) | 365 (4.6%) |
| $75,000 to $99,999 | 1,396 (16.1%) | 581 (7.4%) |
| $100,000+ | 1,942 (22.4%) | 1,245 (15.9%) |
| Total | 8,682 (100.0%) | 7,842 (100.0%) |
Earnings by Sex by Educational Attainment in Brownsburg
Average earnings in Brownsburg are $65,892 for men and $47,834 for women, a difference of 27.4%. Men with an educational attainment of graduate degree enjoy the highest average annual earnings of $126,763, while those with less than high school education earn the least with $50,234. Women with an educational attainment of graduate degree earn the most with the average annual earnings of $99,050, while those with high school diploma education have the smallest earnings of $31,488.
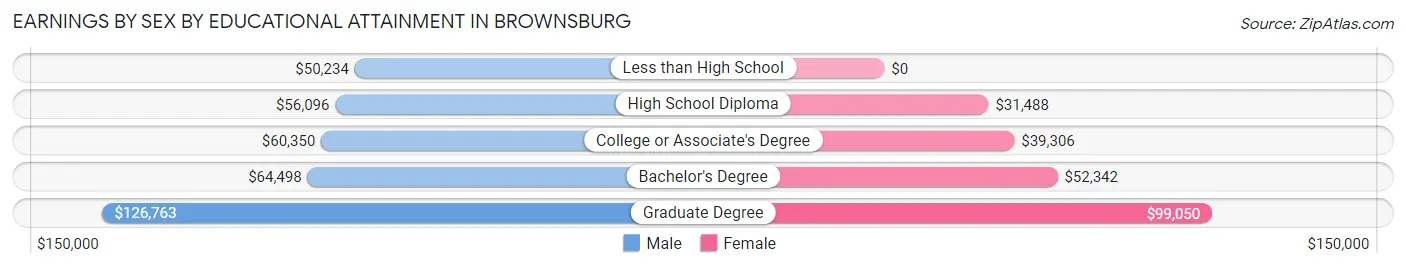
| Educational Attainment | Male Income | Female Income |
| Less than High School | $50,234 | $0 |
| High School Diploma | $56,096 | $31,488 |
| College or Associate's Degree | $60,350 | $39,306 |
| Bachelor's Degree | $64,498 | $52,342 |
| Graduate Degree | $126,763 | $99,050 |
| Total | $65,892 | $47,834 |
Family Income in Brownsburg
Family Income Brackets in Brownsburg
According to the Brownsburg family income data, there are 2,405 families falling into the $100,000 to $149,999 income range, which is the most common income bracket and makes up 29.8% of all families. Conversely, the less than $10,000 income bracket is the least frequent group with only 24 families (0.3%) belonging to this category.
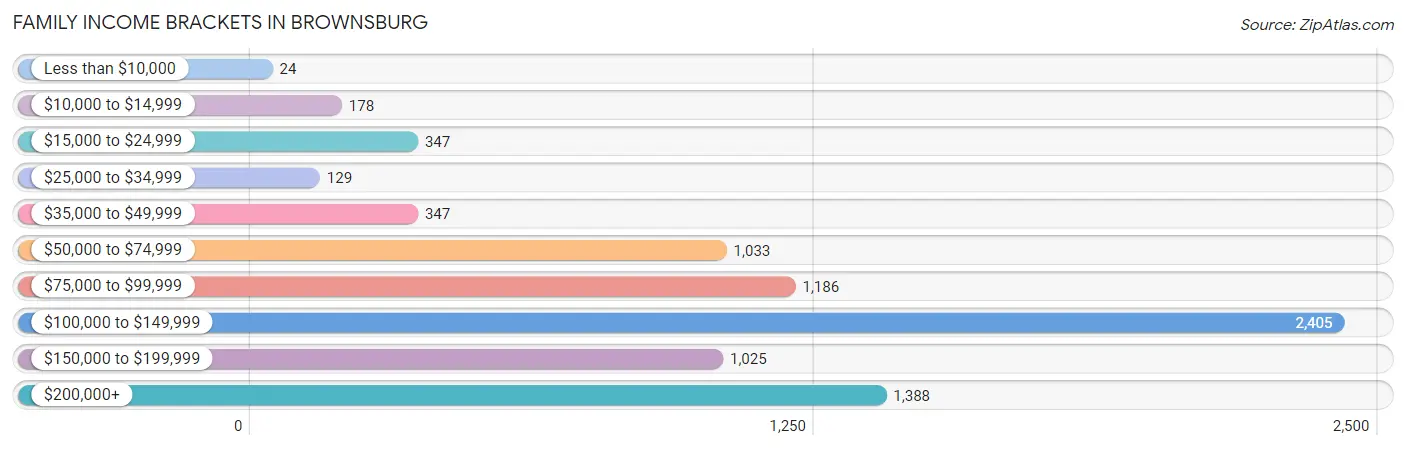
| Income Bracket | # Families | % Families |
| Less than $10,000 | 24 | 0.3% |
| $10,000 to $14,999 | 178 | 2.2% |
| $15,000 to $24,999 | 347 | 4.3% |
| $25,000 to $34,999 | 129 | 1.6% |
| $35,000 to $49,999 | 347 | 4.3% |
| $50,000 to $74,999 | 1,033 | 12.8% |
| $75,000 to $99,999 | 1,186 | 14.7% |
| $100,000 to $149,999 | 2,405 | 29.8% |
| $150,000 to $199,999 | 1,025 | 12.7% |
| $200,000+ | 1,388 | 17.2% |
Family Income by Famaliy Size in Brownsburg
6-person families (137 | 1.7%) account for the highest median family income in Brownsburg with $250,001 per family, while 2-person families (3,548 | 44.0%) have the highest median income of $51,279 per family member.
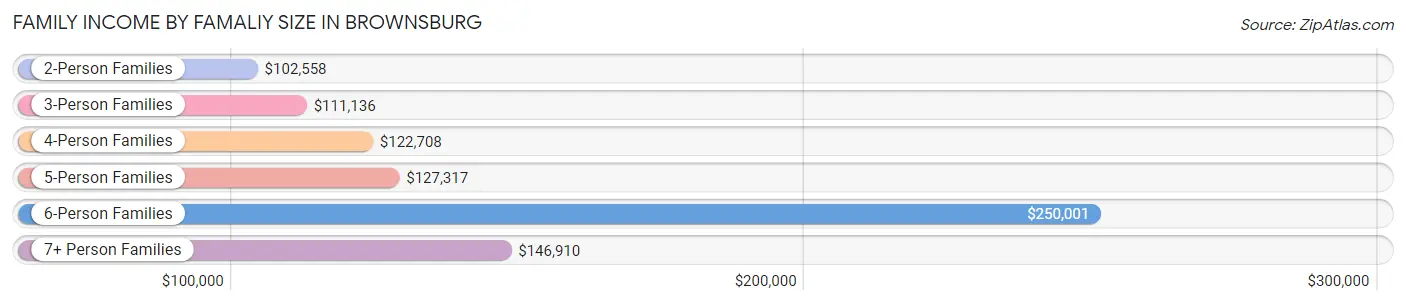
| Income Bracket | # Families | Median Income |
| 2-Person Families | 3,548 (44.0%) | $102,558 |
| 3-Person Families | 1,662 (20.6%) | $111,136 |
| 4-Person Families | 1,597 (19.8%) | $122,708 |
| 5-Person Families | 844 (10.5%) | $127,317 |
| 6-Person Families | 137 (1.7%) | $250,001 |
| 7+ Person Families | 281 (3.5%) | $146,910 |
| Total | 8,069 (100.0%) | $112,663 |
Family Income by Number of Earners in Brownsburg
The median family income in Brownsburg is $112,663, with families comprising 3+ earners (973) having the highest median family income of $171,321, while families with no earners (831) have the lowest median family income of $69,978, accounting for 12.1% and 10.3% of families, respectively.
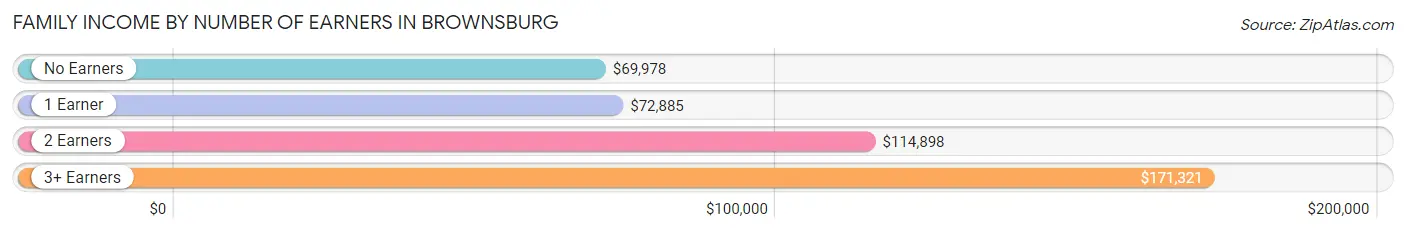
| Number of Earners | # Families | Median Income |
| No Earners | 831 (10.3%) | $69,978 |
| 1 Earner | 2,166 (26.8%) | $72,885 |
| 2 Earners | 4,099 (50.8%) | $114,898 |
| 3+ Earners | 973 (12.1%) | $171,321 |
| Total | 8,069 (100.0%) | $112,663 |
Household Income in Brownsburg
Household Income Brackets in Brownsburg
With 2,538 households falling in the category, the $100,000 to $149,999 income range is the most frequent in Brownsburg, accounting for 24.2% of all households. In contrast, only 73 households (0.7%) fall into the less than $10,000 income bracket, making it the least populous group.
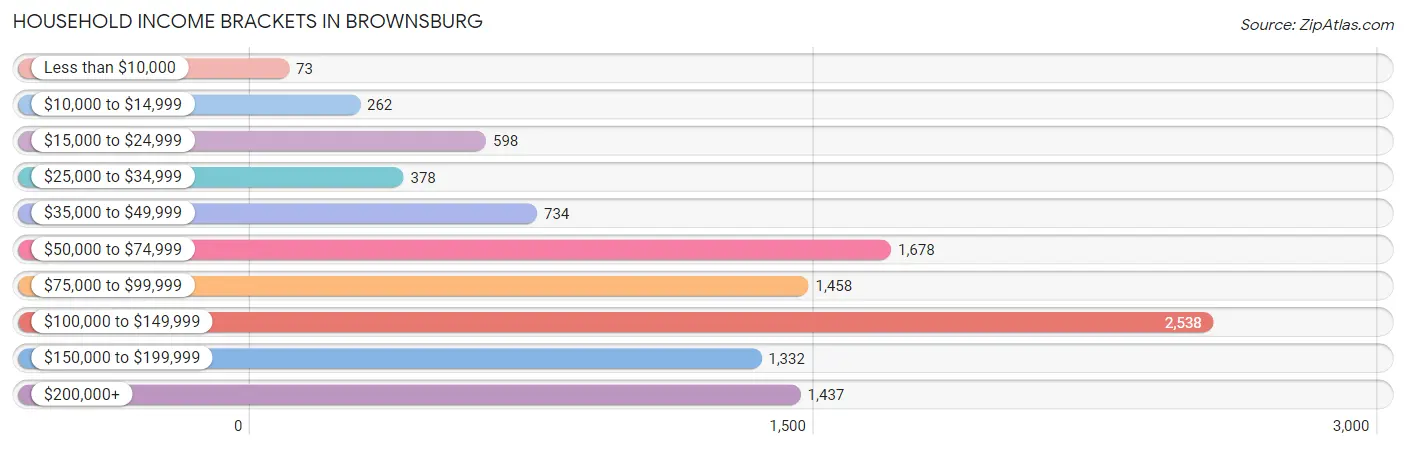
| Income Bracket | # Households | % Households |
| Less than $10,000 | 73 | 0.7% |
| $10,000 to $14,999 | 262 | 2.5% |
| $15,000 to $24,999 | 598 | 5.7% |
| $25,000 to $34,999 | 378 | 3.6% |
| $35,000 to $49,999 | 734 | 7.0% |
| $50,000 to $74,999 | 1,678 | 16.0% |
| $75,000 to $99,999 | 1,458 | 13.9% |
| $100,000 to $149,999 | 2,538 | 24.2% |
| $150,000 to $199,999 | 1,332 | 12.7% |
| $200,000+ | 1,437 | 13.7% |
Household Income by Householder Age in Brownsburg
The median household income in Brownsburg is $101,883, with the highest median household income of $116,250 found in the 45 to 64 years age bracket for the primary householder. A total of 3,574 households (34.1%) fall into this category. Meanwhile, the 65+ years age bracket for the primary householder has the lowest median household income of $64,916, with 2,149 households (20.5%) in this group.
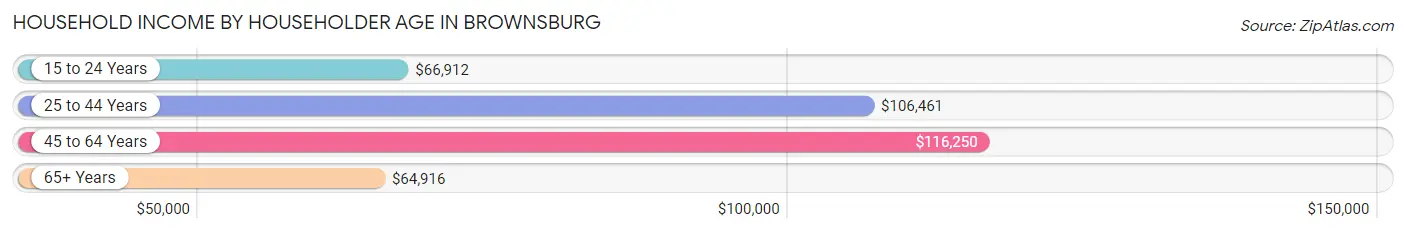
| Income Bracket | # Households | Median Income |
| 15 to 24 Years | 356 (3.4%) | $66,912 |
| 25 to 44 Years | 4,409 (42.0%) | $106,461 |
| 45 to 64 Years | 3,574 (34.1%) | $116,250 |
| 65+ Years | 2,149 (20.5%) | $64,916 |
| Total | 10,488 (100.0%) | $101,883 |
Poverty in Brownsburg
Income Below Poverty by Sex and Age in Brownsburg
With 6.6% poverty level for males and 7.8% for females among the residents of Brownsburg, 15 year old males and 12 to 14 year old females are the most vulnerable to poverty, with 60 males (22.8%) and 75 females (11.8%) in their respective age groups living below the poverty level.
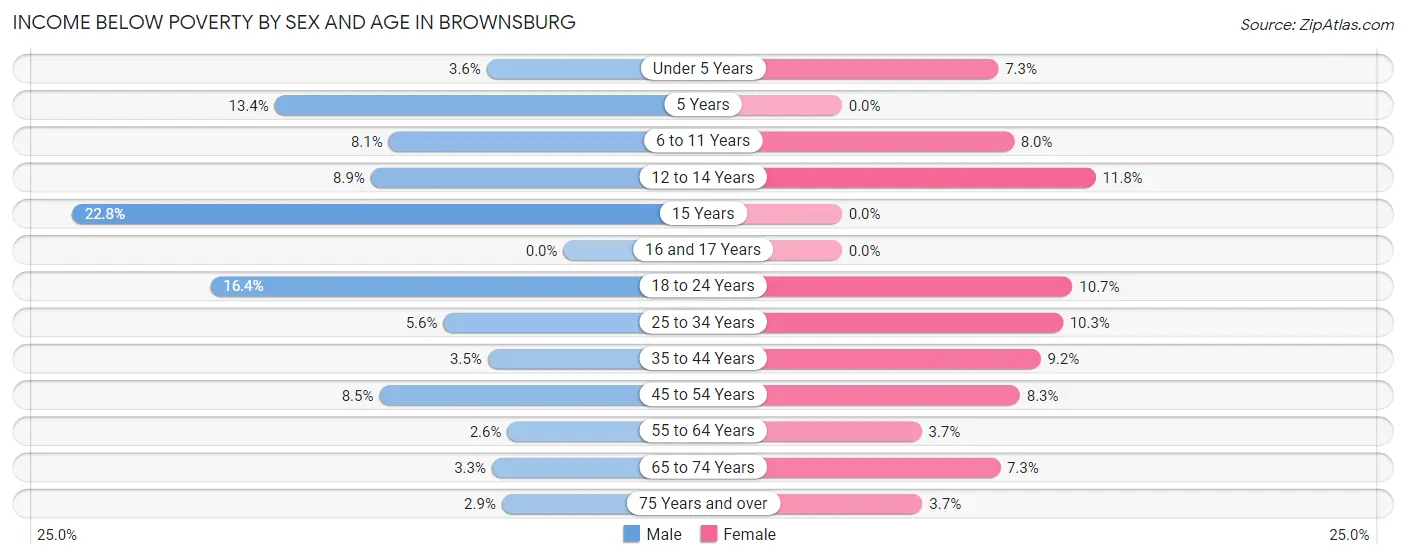
| Age Bracket | Male | Female |
| Under 5 Years | 32 (3.6%) | 51 (7.3%) |
| 5 Years | 41 (13.4%) | 0 (0.0%) |
| 6 to 11 Years | 142 (8.1%) | 122 (8.0%) |
| 12 to 14 Years | 90 (8.9%) | 75 (11.8%) |
| 15 Years | 60 (22.8%) | 0 (0.0%) |
| 16 and 17 Years | 0 (0.0%) | 0 (0.0%) |
| 18 to 24 Years | 188 (16.4%) | 123 (10.7%) |
| 25 to 34 Years | 109 (5.6%) | 191 (10.2%) |
| 35 to 44 Years | 74 (3.5%) | 223 (9.2%) |
| 45 to 54 Years | 157 (8.5%) | 155 (8.3%) |
| 55 to 64 Years | 42 (2.6%) | 57 (3.7%) |
| 65 to 74 Years | 31 (3.3%) | 84 (7.3%) |
| 75 Years and over | 15 (2.9%) | 29 (3.7%) |
| Total | 981 (6.6%) | 1,110 (7.8%) |
Income Above Poverty by Sex and Age in Brownsburg
According to the poverty statistics in Brownsburg, males aged 16 and 17 years and females aged 5 years are the age groups that are most secure financially, with 100.0% of males and 100.0% of females in these age groups living above the poverty line.
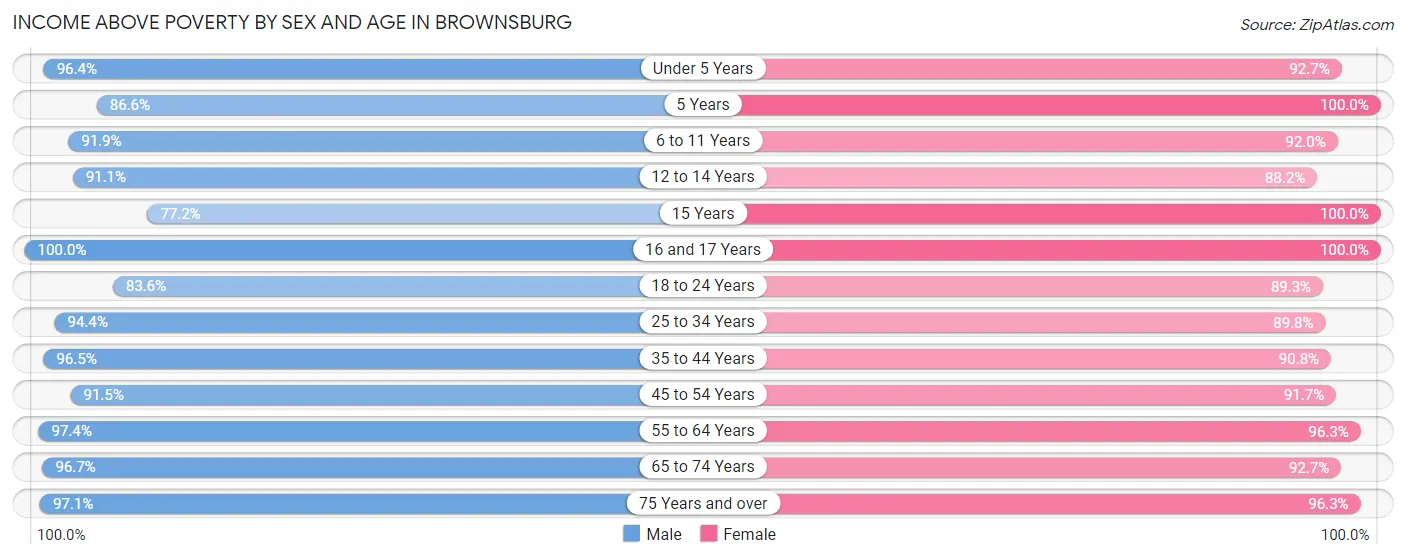
| Age Bracket | Male | Female |
| Under 5 Years | 866 (96.4%) | 651 (92.7%) |
| 5 Years | 265 (86.6%) | 203 (100.0%) |
| 6 to 11 Years | 1,609 (91.9%) | 1,406 (92.0%) |
| 12 to 14 Years | 917 (91.1%) | 562 (88.2%) |
| 15 Years | 203 (77.2%) | 95 (100.0%) |
| 16 and 17 Years | 468 (100.0%) | 258 (100.0%) |
| 18 to 24 Years | 960 (83.6%) | 1,026 (89.3%) |
| 25 to 34 Years | 1,849 (94.4%) | 1,672 (89.7%) |
| 35 to 44 Years | 2,035 (96.5%) | 2,196 (90.8%) |
| 45 to 54 Years | 1,682 (91.5%) | 1,722 (91.7%) |
| 55 to 64 Years | 1,573 (97.4%) | 1,485 (96.3%) |
| 65 to 74 Years | 903 (96.7%) | 1,061 (92.7%) |
| 75 Years and over | 509 (97.1%) | 746 (96.3%) |
| Total | 13,839 (93.4%) | 13,083 (92.2%) |
Income Below Poverty Among Married-Couple Families in Brownsburg
The poverty statistics for married-couple families in Brownsburg show that 2.4% or 153 of the total 6,465 families live below the poverty line. Families with 3 or 4 children have the highest poverty rate of 10.0%, comprising of 84 families. On the other hand, families with 1 or 2 children have the lowest poverty rate of 0.0%, which includes 0 families.
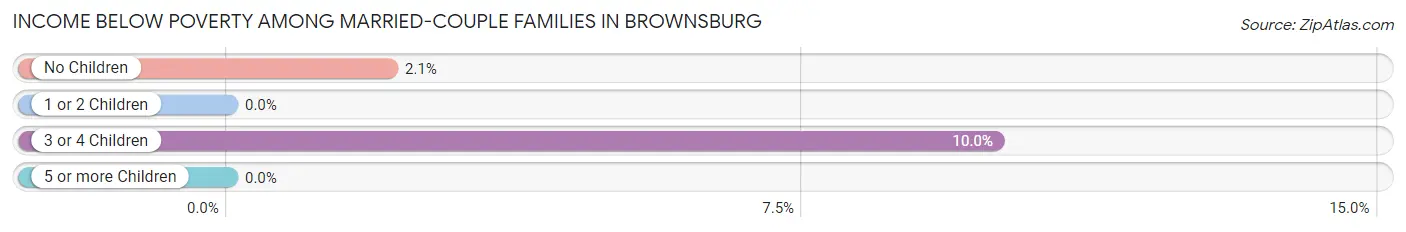
| Children | Above Poverty | Below Poverty |
| No Children | 3,229 (97.9%) | 69 (2.1%) |
| 1 or 2 Children | 2,126 (100.0%) | 0 (0.0%) |
| 3 or 4 Children | 755 (90.0%) | 84 (10.0%) |
| 5 or more Children | 202 (100.0%) | 0 (0.0%) |
| Total | 6,312 (97.6%) | 153 (2.4%) |
Income Below Poverty Among Single-Parent Households in Brownsburg
According to the poverty data in Brownsburg, 9.4% or 61 single-father households and 31.1% or 297 single-mother households are living below the poverty line. Among single-father households, those with 3 or 4 children have the highest poverty rate, with 55 households (64.7%) experiencing poverty. Likewise, among single-mother households, those with 1 or 2 children have the highest poverty rate, with 204 households (32.7%) falling below the poverty line.
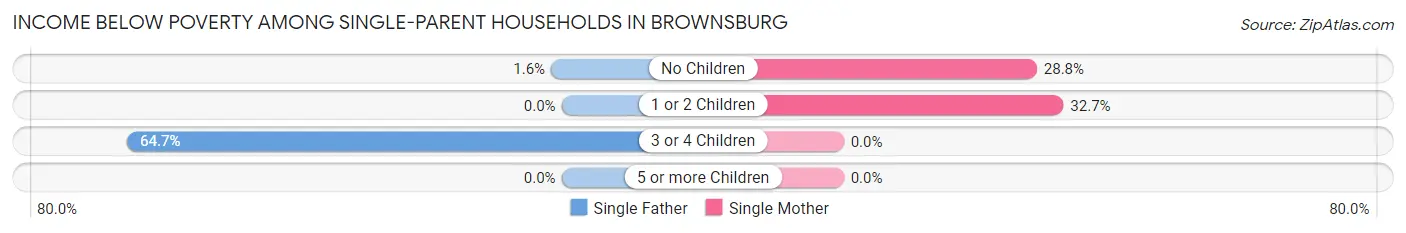
| Children | Single Father | Single Mother |
| No Children | 6 (1.6%) | 93 (28.8%) |
| 1 or 2 Children | 0 (0.0%) | 204 (32.7%) |
| 3 or 4 Children | 55 (64.7%) | 0 (0.0%) |
| 5 or more Children | 0 (0.0%) | 0 (0.0%) |
| Total | 61 (9.4%) | 297 (31.1%) |
Income Below Poverty Among Married-Couple vs Single-Parent Households in Brownsburg
The poverty data for Brownsburg shows that 153 of the married-couple family households (2.4%) and 358 of the single-parent households (22.3%) are living below the poverty level. Within the married-couple family households, those with 3 or 4 children have the highest poverty rate, with 84 households (10.0%) falling below the poverty line. Among the single-parent households, those with 3 or 4 children have the highest poverty rate, with 55 household (58.5%) living below poverty.
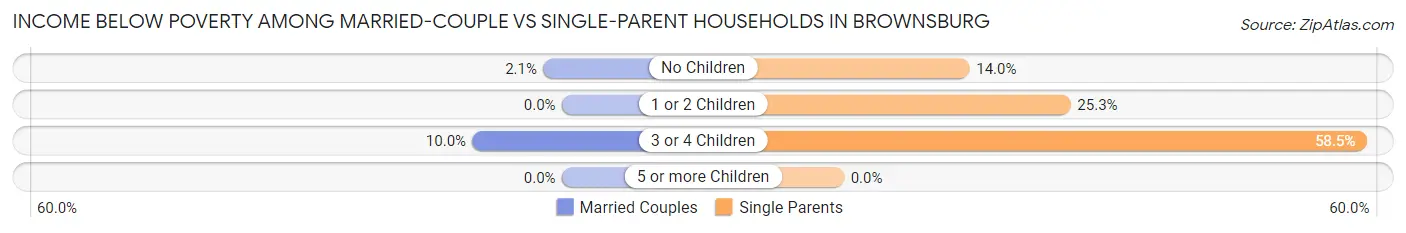
| Children | Married-Couple Families | Single-Parent Households |
| No Children | 69 (2.1%) | 99 (14.0%) |
| 1 or 2 Children | 0 (0.0%) | 204 (25.3%) |
| 3 or 4 Children | 84 (10.0%) | 55 (58.5%) |
| 5 or more Children | 0 (0.0%) | 0 (0.0%) |
| Total | 153 (2.4%) | 358 (22.3%) |
Race in Brownsburg
The most populous races in Brownsburg are White / Caucasian (25,228 | 85.9%), Black / African American (2,557 | 8.7%), and Hispanic or Latino (1,106 | 3.8%).
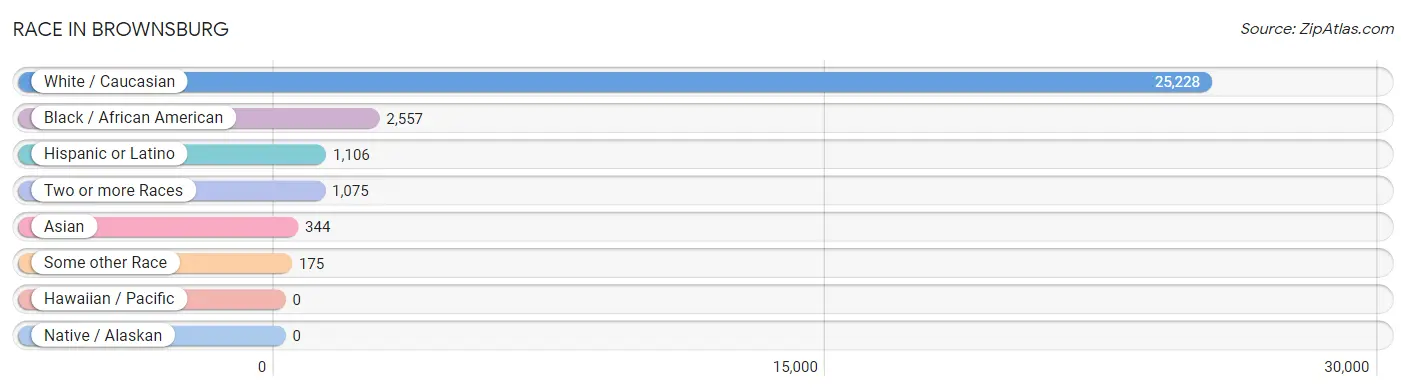
| Race | # Population | % Population |
| Asian | 344 | 1.2% |
| Black / African American | 2,557 | 8.7% |
| Hawaiian / Pacific | 0 | 0.0% |
| Hispanic or Latino | 1,106 | 3.8% |
| Native / Alaskan | 0 | 0.0% |
| White / Caucasian | 25,228 | 85.9% |
| Two or more Races | 1,075 | 3.7% |
| Some other Race | 175 | 0.6% |
| Total | 29,379 | 100.0% |
Ancestry in Brownsburg
The most populous ancestries reported in Brownsburg are German (5,615 | 19.1%), American (5,183 | 17.6%), English (3,400 | 11.6%), Irish (3,218 | 11.0%), and Subsaharan African (886 | 3.0%), together accounting for 62.3% of all Brownsburg residents.
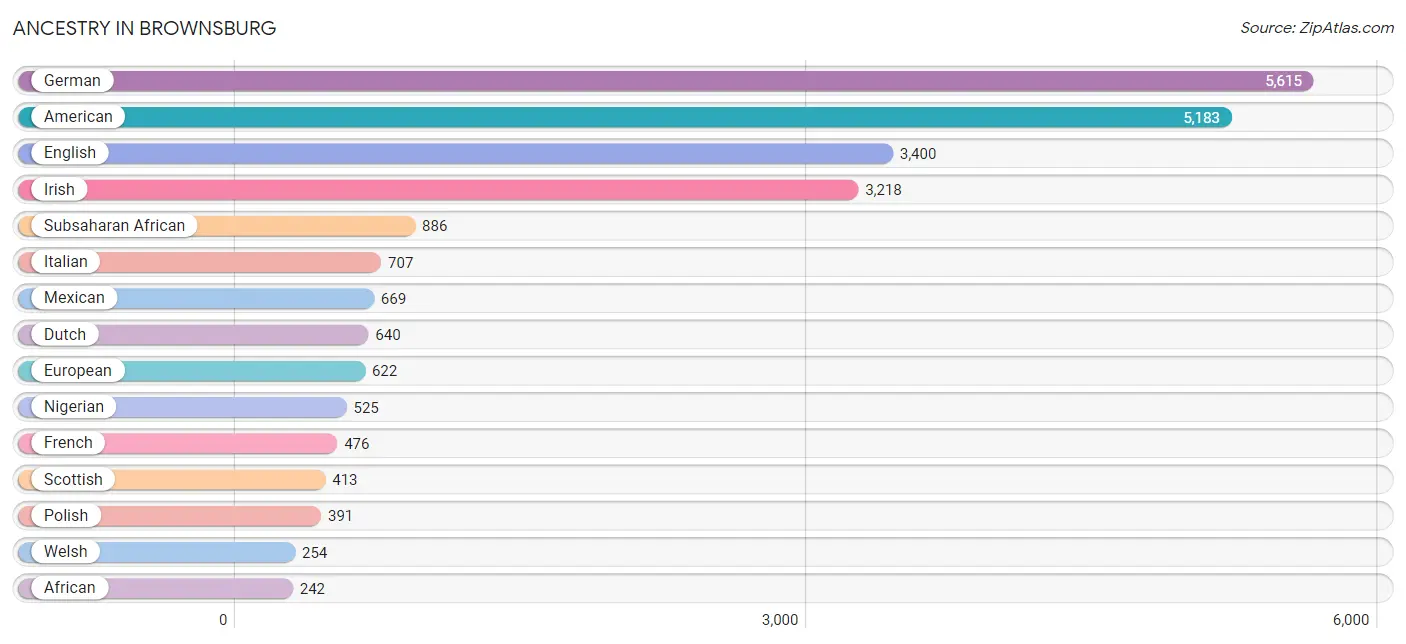
| Ancestry | # Population | % Population |
| African | 242 | 0.8% |
| American | 5,183 | 17.6% |
| Arab | 68 | 0.2% |
| Armenian | 8 | 0.0% |
| Austrian | 43 | 0.2% |
| Belgian | 38 | 0.1% |
| Bhutanese | 39 | 0.1% |
| British | 198 | 0.7% |
| Canadian | 5 | 0.0% |
| Central American | 53 | 0.2% |
| Cherokee | 93 | 0.3% |
| Chilean | 35 | 0.1% |
| Croatian | 13 | 0.0% |
| Cuban | 101 | 0.3% |
| Czech | 7 | 0.0% |
| Danish | 40 | 0.1% |
| Delaware | 12 | 0.0% |
| Dominican | 6 | 0.0% |
| Dutch | 640 | 2.2% |
| Eastern European | 199 | 0.7% |
| Ecuadorian | 19 | 0.1% |
| English | 3,400 | 11.6% |
| European | 622 | 2.1% |
| Finnish | 45 | 0.2% |
| French | 476 | 1.6% |
| French Canadian | 11 | 0.0% |
| German | 5,615 | 19.1% |
| Ghanaian | 10 | 0.0% |
| Greek | 134 | 0.5% |
| Hungarian | 59 | 0.2% |
| Indian (Asian) | 102 | 0.4% |
| Iranian | 31 | 0.1% |
| Irish | 3,218 | 11.0% |
| Italian | 707 | 2.4% |
| Korean | 165 | 0.6% |
| Latvian | 14 | 0.1% |
| Lithuanian | 13 | 0.0% |
| Mexican | 669 | 2.3% |
| Native Hawaiian | 39 | 0.1% |
| Nigerian | 525 | 1.8% |
| Norwegian | 80 | 0.3% |
| Panamanian | 13 | 0.0% |
| Polish | 391 | 1.3% |
| Puerto Rican | 73 | 0.3% |
| Romanian | 8 | 0.0% |
| Russian | 31 | 0.1% |
| Salvadoran | 40 | 0.1% |
| Scandinavian | 45 | 0.2% |
| Scotch-Irish | 104 | 0.4% |
| Scottish | 413 | 1.4% |
| Serbian | 63 | 0.2% |
| Slavic | 26 | 0.1% |
| Slovak | 69 | 0.2% |
| Slovene | 9 | 0.0% |
| South American | 81 | 0.3% |
| Subsaharan African | 886 | 3.0% |
| Swedish | 78 | 0.3% |
| Swiss | 35 | 0.1% |
| Thai | 85 | 0.3% |
| Turkish | 35 | 0.1% |
| Ukrainian | 26 | 0.1% |
| Venezuelan | 27 | 0.1% |
| Welsh | 254 | 0.9% |
| West Indian | 10 | 0.0% |
| Yugoslavian | 52 | 0.2% | View All 65 Rows |
Immigrants in Brownsburg
The most numerous immigrant groups reported in Brownsburg came from Africa (927 | 3.2%), Western Africa (898 | 3.1%), Nigeria (747 | 2.5%), Latin America (336 | 1.1%), and Asia (316 | 1.1%), together accounting for 11.0% of all Brownsburg residents.
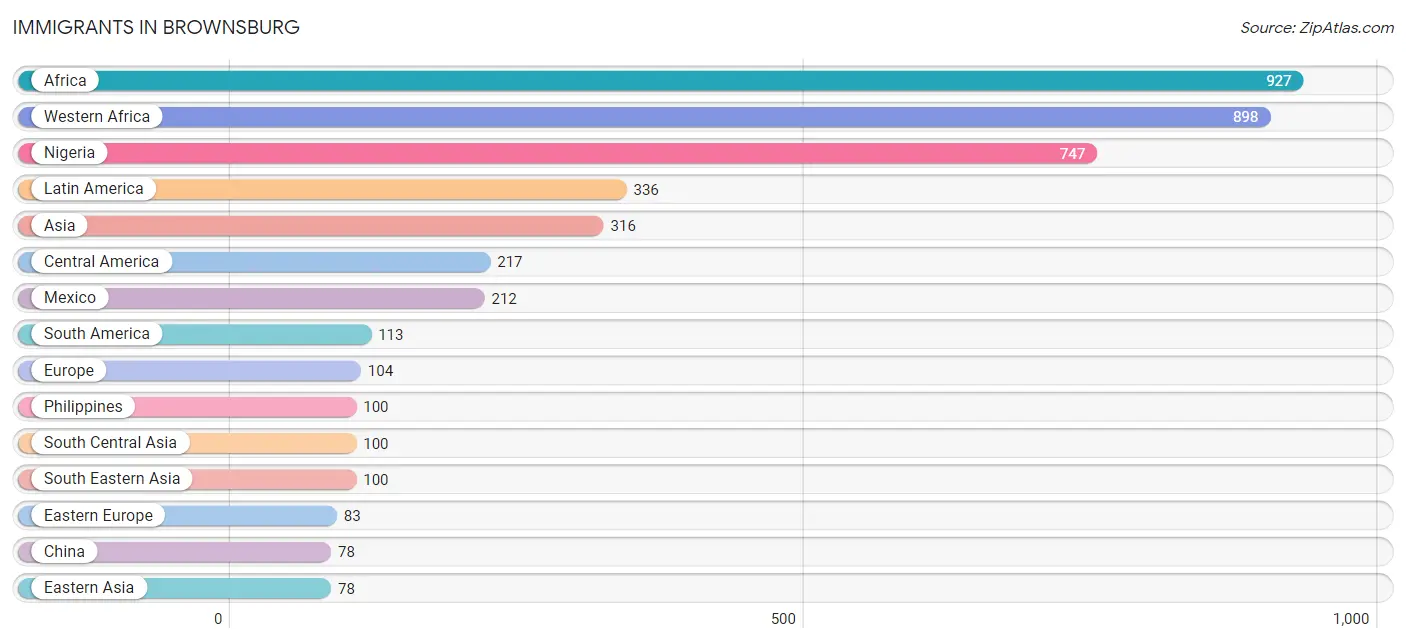
| Immigration Origin | # Population | % Population |
| Africa | 927 | 3.2% |
| Asia | 316 | 1.1% |
| Bosnia and Herzegovina | 14 | 0.1% |
| Brazil | 22 | 0.1% |
| Canada | 63 | 0.2% |
| Caribbean | 6 | 0.0% |
| Central America | 217 | 0.7% |
| China | 78 | 0.3% |
| Colombia | 10 | 0.0% |
| Dominican Republic | 6 | 0.0% |
| Eastern Asia | 78 | 0.3% |
| Eastern Europe | 83 | 0.3% |
| Ecuador | 19 | 0.1% |
| El Salvador | 5 | 0.0% |
| England | 12 | 0.0% |
| Europe | 104 | 0.4% |
| Greece | 9 | 0.0% |
| Hong Kong | 41 | 0.1% |
| India | 69 | 0.2% |
| Iran | 31 | 0.1% |
| Kuwait | 19 | 0.1% |
| Latin America | 336 | 1.1% |
| Mexico | 212 | 0.7% |
| Nigeria | 747 | 2.5% |
| Northern Europe | 12 | 0.0% |
| Philippines | 100 | 0.3% |
| Serbia | 23 | 0.1% |
| South America | 113 | 0.4% |
| South Central Asia | 100 | 0.3% |
| South Eastern Asia | 100 | 0.3% |
| Southern Europe | 9 | 0.0% |
| Turkey | 19 | 0.1% |
| Ukraine | 26 | 0.1% |
| Venezuela | 62 | 0.2% |
| Western Africa | 898 | 3.1% |
| Western Asia | 38 | 0.1% | View All 36 Rows |
Sex and Age in Brownsburg
Sex and Age in Brownsburg
The most populous age groups in Brownsburg are 10 to 14 Years (1,590 | 10.6%) for men and 40 to 44 Years (1,388 | 9.7%) for women.
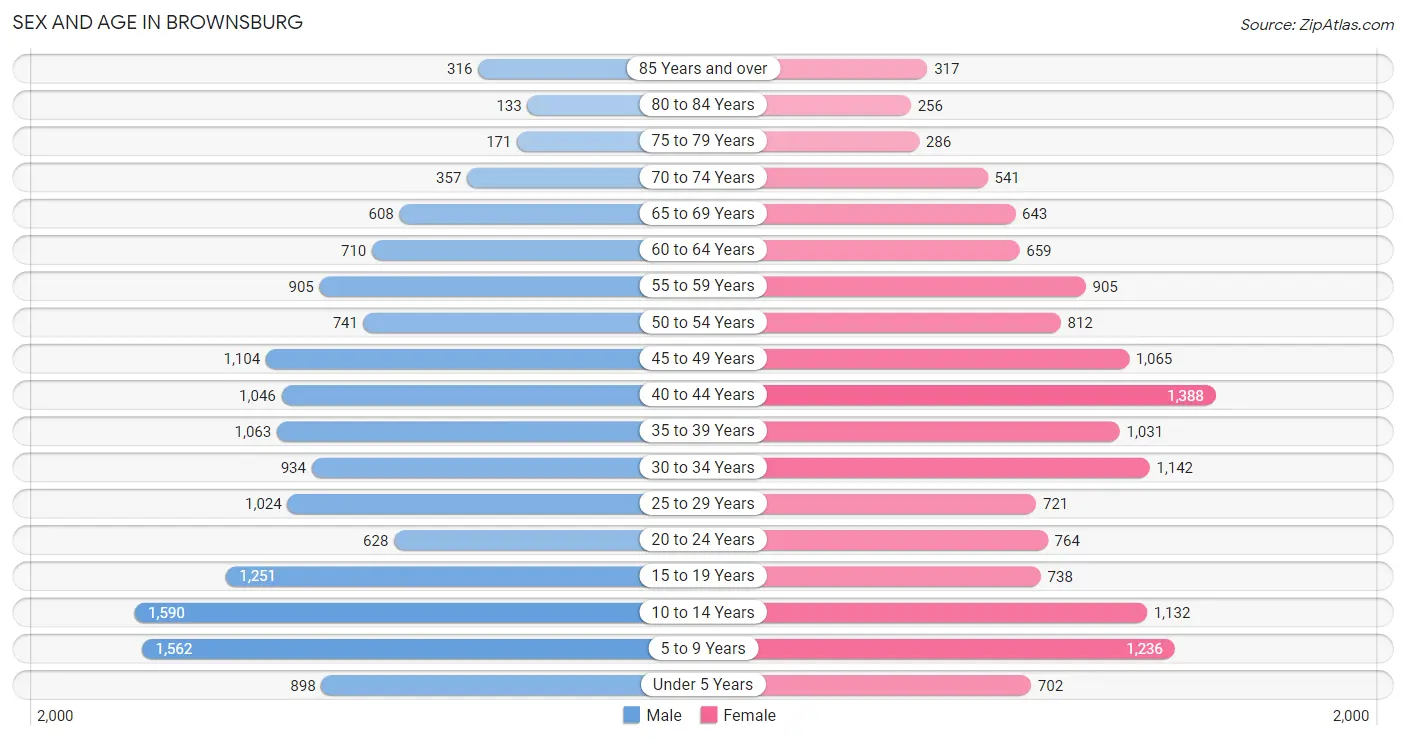
| Age Bracket | Male | Female |
| Under 5 Years | 898 (6.0%) | 702 (4.9%) |
| 5 to 9 Years | 1,562 (10.4%) | 1,236 (8.6%) |
| 10 to 14 Years | 1,590 (10.6%) | 1,132 (7.9%) |
| 15 to 19 Years | 1,251 (8.3%) | 738 (5.1%) |
| 20 to 24 Years | 628 (4.2%) | 764 (5.3%) |
| 25 to 29 Years | 1,024 (6.8%) | 721 (5.0%) |
| 30 to 34 Years | 934 (6.2%) | 1,142 (8.0%) |
| 35 to 39 Years | 1,063 (7.1%) | 1,031 (7.2%) |
| 40 to 44 Years | 1,046 (7.0%) | 1,388 (9.7%) |
| 45 to 49 Years | 1,104 (7.3%) | 1,065 (7.4%) |
| 50 to 54 Years | 741 (4.9%) | 812 (5.7%) |
| 55 to 59 Years | 905 (6.0%) | 905 (6.3%) |
| 60 to 64 Years | 710 (4.7%) | 659 (4.6%) |
| 65 to 69 Years | 608 (4.0%) | 643 (4.5%) |
| 70 to 74 Years | 357 (2.4%) | 541 (3.8%) |
| 75 to 79 Years | 171 (1.1%) | 286 (2.0%) |
| 80 to 84 Years | 133 (0.9%) | 256 (1.8%) |
| 85 Years and over | 316 (2.1%) | 317 (2.2%) |
| Total | 15,041 (100.0%) | 14,338 (100.0%) |
Families and Households in Brownsburg
Median Family Size in Brownsburg
The median family size in Brownsburg is 3.15 persons per family, with married-couple families (6,465 | 80.1%) accounting for the largest median family size of 3.28 persons per family. On the other hand, single female/mother families (955 | 11.8%) represent the smallest median family size with 2.61 persons per family.
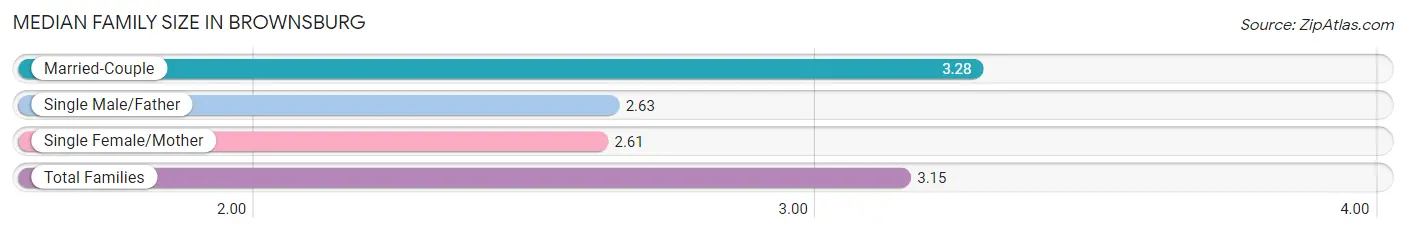
| Family Type | # Families | Family Size |
| Married-Couple | 6,465 (80.1%) | 3.28 |
| Single Male/Father | 649 (8.0%) | 2.63 |
| Single Female/Mother | 955 (11.8%) | 2.61 |
| Total Families | 8,069 (100.0%) | 3.15 |
Median Household Size in Brownsburg
The median household size in Brownsburg is 2.77 persons per household, with single male/father households (649 | 6.2%) accounting for the largest median household size of 3.31 persons per household. non-family households (2,419 | 23.1%) represent the smallest median household size with 1.25 persons per household.
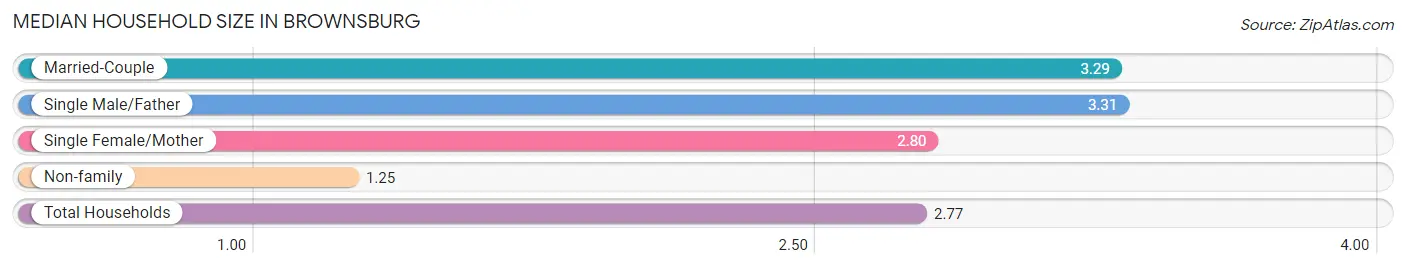
| Household Type | # Households | Household Size |
| Married-Couple | 6,465 (61.6%) | 3.29 |
| Single Male/Father | 649 (6.2%) | 3.31 |
| Single Female/Mother | 955 (9.1%) | 2.80 |
| Non-family | 2,419 (23.1%) | 1.25 |
| Total Households | 10,488 (100.0%) | 2.77 |
Household Size by Marriage Status in Brownsburg
Out of a total of 10,488 households in Brownsburg, 8,069 (76.9%) are family households, while 2,419 (23.1%) are nonfamily households. The most numerous type of family households are 2-person households, comprising 3,317, and the most common type of nonfamily households are 1-person households, comprising 1,849.
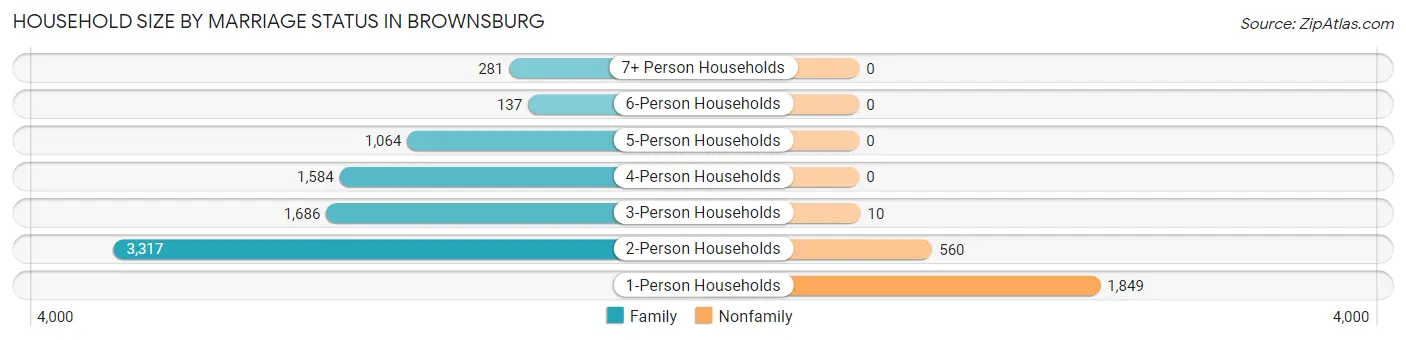
| Household Size | Family Households | Nonfamily Households |
| 1-Person Households | - | 1,849 (17.6%) |
| 2-Person Households | 3,317 (31.6%) | 560 (5.3%) |
| 3-Person Households | 1,686 (16.1%) | 10 (0.1%) |
| 4-Person Households | 1,584 (15.1%) | 0 (0.0%) |
| 5-Person Households | 1,064 (10.1%) | 0 (0.0%) |
| 6-Person Households | 137 (1.3%) | 0 (0.0%) |
| 7+ Person Households | 281 (2.7%) | 0 (0.0%) |
| Total | 8,069 (76.9%) | 2,419 (23.1%) |
Female Fertility in Brownsburg
Fertility by Age in Brownsburg
Average fertility rate in Brownsburg is 37.0 births per 1,000 women. Women in the age bracket of 20 to 34 years have the highest fertility rate with 88.0 births per 1,000 women. Women in the age bracket of 20 to 34 years acount for 90.3% of all women with births.
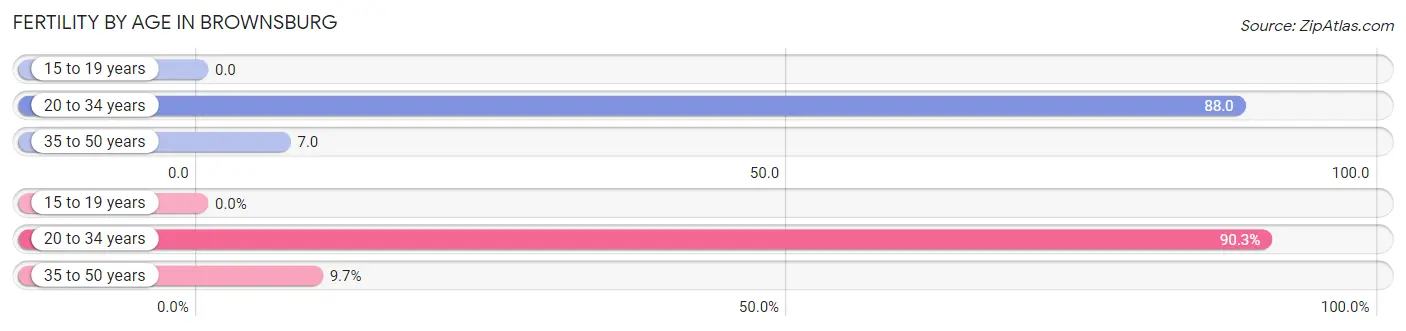
| Age Bracket | Women with Births | Births / 1,000 Women |
| 15 to 19 years | 0 (0.0%) | 0.0 |
| 20 to 34 years | 232 (90.3%) | 88.0 |
| 35 to 50 years | 25 (9.7%) | 7.0 |
| Total | 257 (100.0%) | 37.0 |
Fertility by Age by Marriage Status in Brownsburg
73.5% of women with births (257) in Brownsburg are married. The highest percentage of unmarried women with births falls into 20 to 34 years age bracket with 29.3% of them unmarried at the time of birth, while the lowest percentage of unmarried women with births belong to 35 to 50 years age bracket with 0.0% of them unmarried.
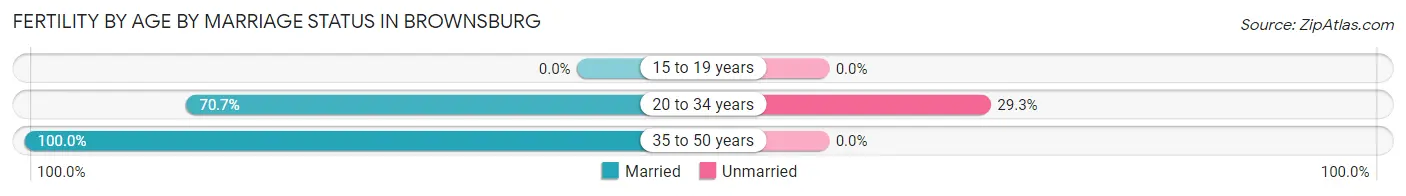
| Age Bracket | Married | Unmarried |
| 15 to 19 years | 0 (0.0%) | 0 (0.0%) |
| 20 to 34 years | 164 (70.7%) | 68 (29.3%) |
| 35 to 50 years | 25 (100.0%) | 0 (0.0%) |
| Total | 189 (73.5%) | 68 (26.5%) |
Fertility by Education in Brownsburg
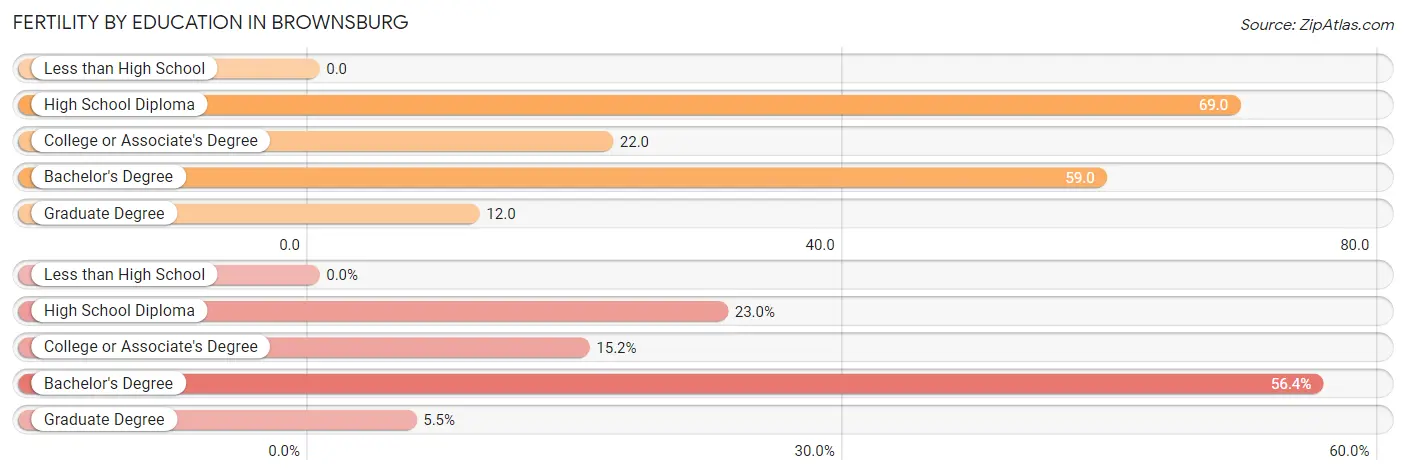
| Educational Attainment | Women with Births | Births / 1,000 Women |
| Less than High School | 0 (0.0%) | 0.0 |
| High School Diploma | 59 (23.0%) | 69.0 |
| College or Associate's Degree | 39 (15.2%) | 22.0 |
| Bachelor's Degree | 145 (56.4%) | 59.0 |
| Graduate Degree | 14 (5.4%) | 12.0 |
| Total | 257 (100.0%) | 37.0 |
Fertility by Education by Marriage Status in Brownsburg
26.5% of women with births in Brownsburg are unmarried. Women with the educational attainment of bachelor's degree are most likely to be married with 100.0% of them married at childbirth, while women with the educational attainment of college or associate's degree are least likely to be married with 100.0% of them unmarried at childbirth.
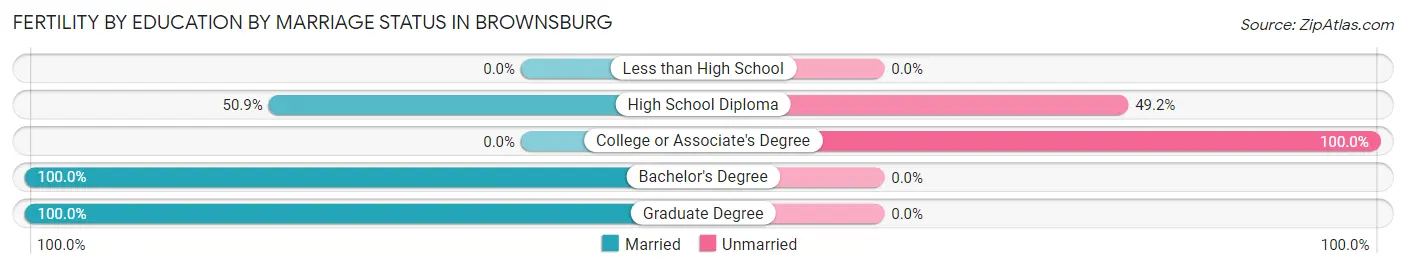
| Educational Attainment | Married | Unmarried |
| Less than High School | 0 (0.0%) | 0 (0.0%) |
| High School Diploma | 30 (50.8%) | 29 (49.1%) |
| College or Associate's Degree | 0 (0.0%) | 39 (100.0%) |
| Bachelor's Degree | 145 (100.0%) | 0 (0.0%) |
| Graduate Degree | 14 (100.0%) | 0 (0.0%) |
| Total | 189 (73.5%) | 68 (26.5%) |
Employment Characteristics in Brownsburg
Employment by Class of Employer in Brownsburg
Among the 15,528 employed individuals in Brownsburg, private company employees (10,509 | 67.7%), not-for-profit organizations (1,644 | 10.6%), and local government employees (1,158 | 7.5%) make up the most common classes of employment.
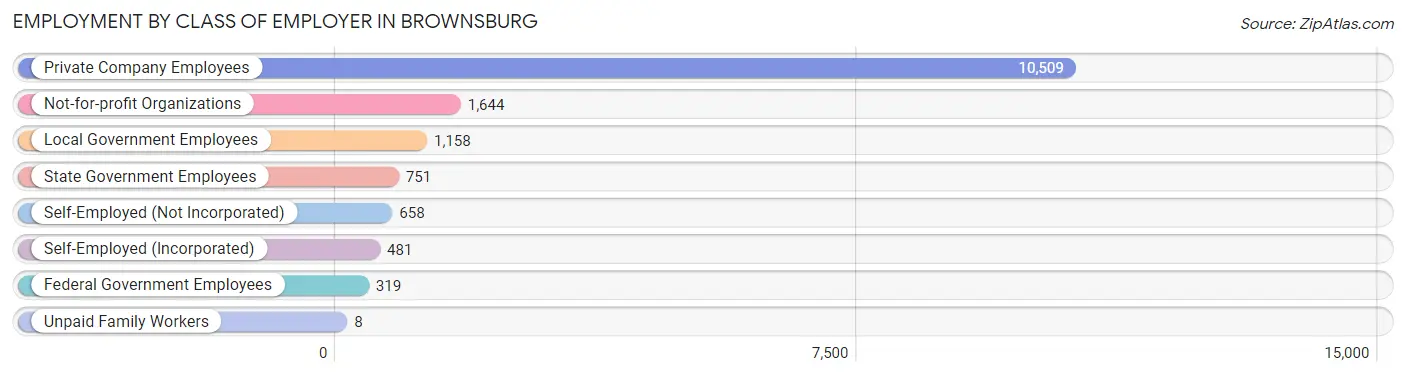
| Employer Class | # Employees | % Employees |
| Private Company Employees | 10,509 | 67.7% |
| Self-Employed (Incorporated) | 481 | 3.1% |
| Self-Employed (Not Incorporated) | 658 | 4.2% |
| Not-for-profit Organizations | 1,644 | 10.6% |
| Local Government Employees | 1,158 | 7.5% |
| State Government Employees | 751 | 4.8% |
| Federal Government Employees | 319 | 2.1% |
| Unpaid Family Workers | 8 | 0.1% |
| Total | 15,528 | 100.0% |
Employment Status by Age in Brownsburg
According to the labor force statistics for Brownsburg, out of the total population over 16 years of age (21,901), 72.5% or 15,878 individuals are in the labor force, with 1.2% or 191 of them unemployed. The age group with the highest labor force participation rate is 25 to 29 years, with 94.7% or 1,653 individuals in the labor force. Within the labor force, the 55 to 59 years age range has the highest percentage of unemployed individuals, with 3.8% or 53 of them being unemployed.
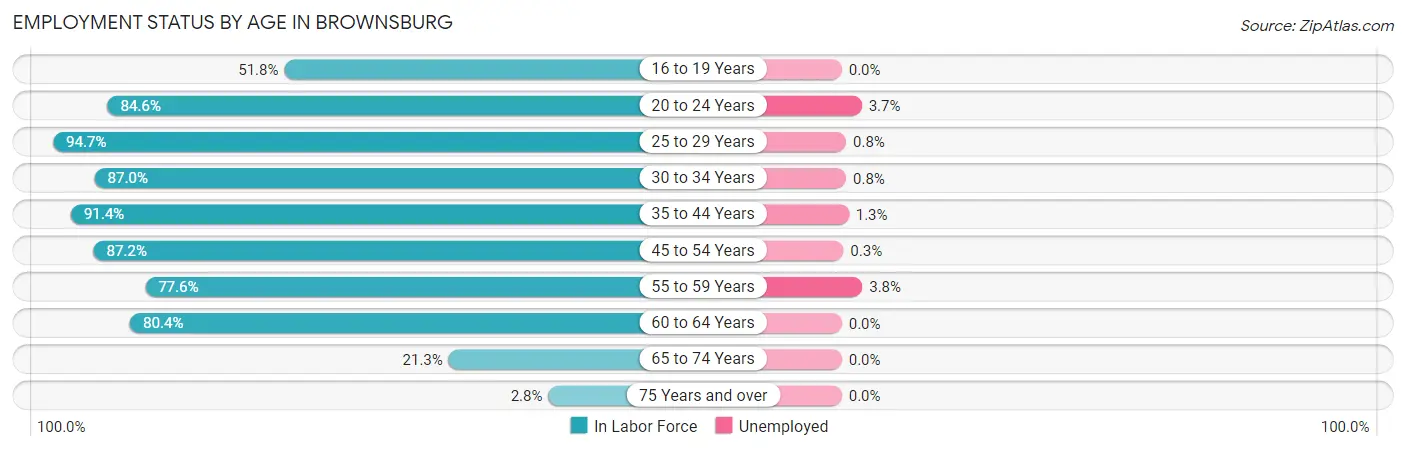
| Age Bracket | In Labor Force | Unemployed |
| 16 to 19 Years | 845 (51.8%) | 0 (0.0%) |
| 20 to 24 Years | 1,178 (84.6%) | 44 (3.7%) |
| 25 to 29 Years | 1,653 (94.7%) | 13 (0.8%) |
| 30 to 34 Years | 1,806 (87.0%) | 14 (0.8%) |
| 35 to 44 Years | 4,139 (91.4%) | 54 (1.3%) |
| 45 to 54 Years | 3,246 (87.2%) | 10 (0.3%) |
| 55 to 59 Years | 1,405 (77.6%) | 53 (3.8%) |
| 60 to 64 Years | 1,101 (80.4%) | 0 (0.0%) |
| 65 to 74 Years | 458 (21.3%) | 0 (0.0%) |
| 75 Years and over | 41 (2.8%) | 0 (0.0%) |
| Total | 15,878 (72.5%) | 191 (1.2%) |
Employment Status by Educational Attainment in Brownsburg
According to labor force statistics for Brownsburg, 87.5% of individuals (13,344) out of the total population between 25 and 64 years of age (15,250) are in the labor force, with 1.1% or 147 of them being unemployed. The group with the highest labor force participation rate are those with the educational attainment of bachelor's degree or higher, with 89.0% or 7,062 individuals in the labor force. Within the labor force, individuals with college / associate degree education have the highest percentage of unemployment, with 1.6% or 58 of them being unemployed.
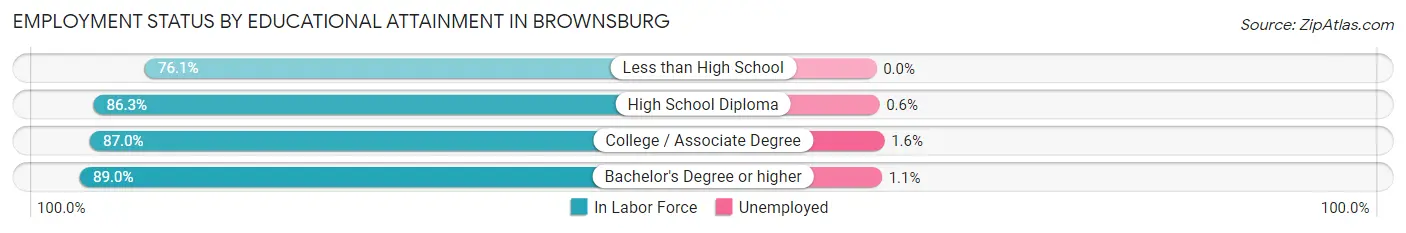
| Educational Attainment | In Labor Force | Unemployed |
| Less than High School | 462 (76.1%) | 0 (0.0%) |
| High School Diploma | 2,163 (86.3%) | 15 (0.6%) |
| College / Associate Degree | 3,656 (87.0%) | 67 (1.6%) |
| Bachelor's Degree or higher | 7,062 (89.0%) | 87 (1.1%) |
| Total | 13,344 (87.5%) | 168 (1.1%) |
Employment Occupations by Sex in Brownsburg
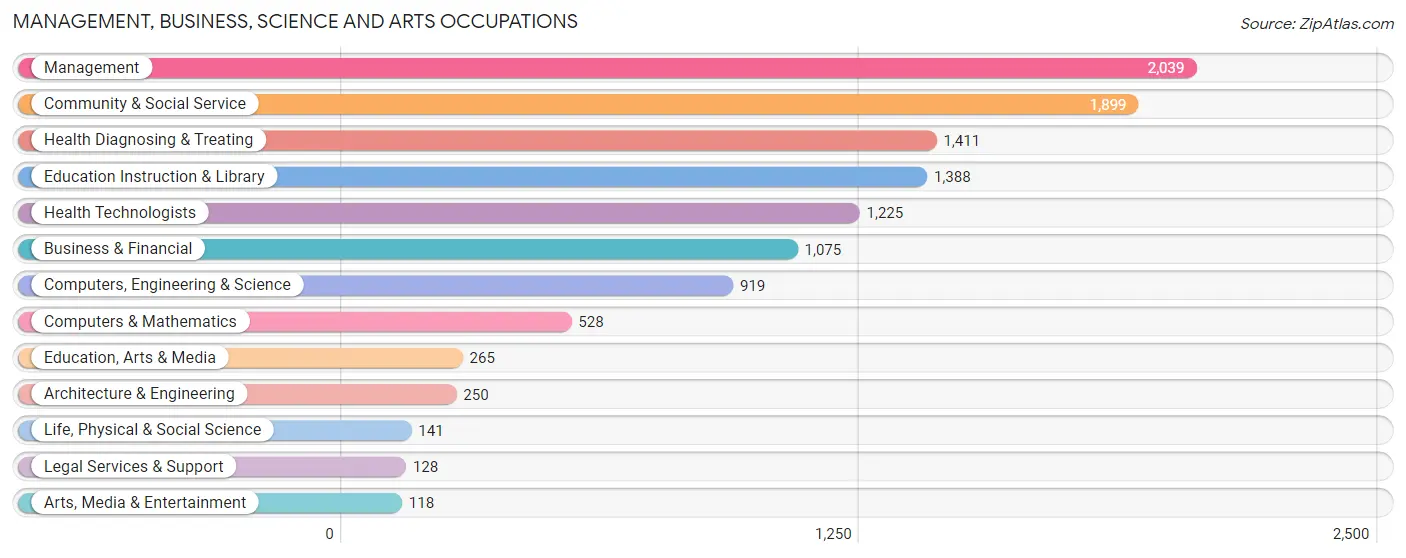
Management, Business, Science and Arts Occupations
The most common Management, Business, Science and Arts occupations in Brownsburg are Management (2,039 | 13.0%), Community & Social Service (1,899 | 12.1%), Health Diagnosing & Treating (1,411 | 9.0%), Education Instruction & Library (1,388 | 8.8%), and Health Technologists (1,225 | 7.8%).
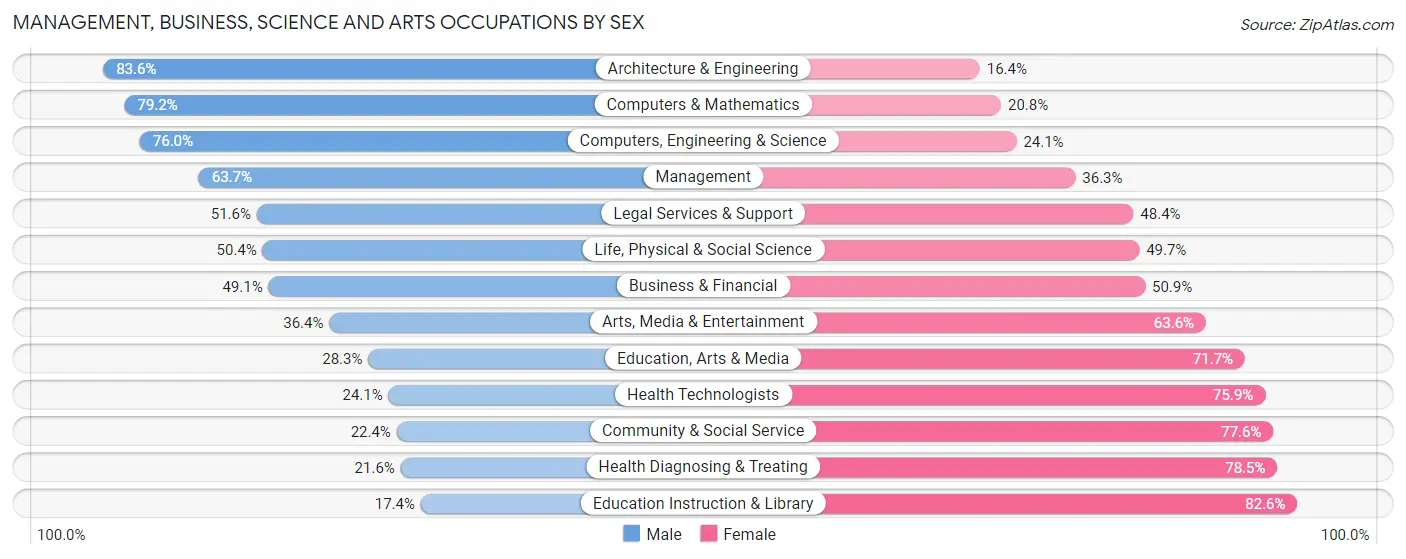
Management, Business, Science and Arts Occupations by Sex
Within the Management, Business, Science and Arts occupations in Brownsburg, the most male-oriented occupations are Architecture & Engineering (83.6%), Computers & Mathematics (79.2%), and Computers, Engineering & Science (75.9%), while the most female-oriented occupations are Education Instruction & Library (82.6%), Health Diagnosing & Treating (78.4%), and Community & Social Service (77.6%).
| Occupation | Male | Female |
| Management | 1,298 (63.7%) | 741 (36.3%) |
| Business & Financial | 528 (49.1%) | 547 (50.9%) |
| Computers, Engineering & Science | 698 (75.9%) | 221 (24.0%) |
| Computers & Mathematics | 418 (79.2%) | 110 (20.8%) |
| Architecture & Engineering | 209 (83.6%) | 41 (16.4%) |
| Life, Physical & Social Science | 71 (50.3%) | 70 (49.6%) |
| Community & Social Service | 425 (22.4%) | 1,474 (77.6%) |
| Education, Arts & Media | 75 (28.3%) | 190 (71.7%) |
| Legal Services & Support | 66 (51.6%) | 62 (48.4%) |
| Education Instruction & Library | 241 (17.4%) | 1,147 (82.6%) |
| Arts, Media & Entertainment | 43 (36.4%) | 75 (63.6%) |
| Health Diagnosing & Treating | 304 (21.5%) | 1,107 (78.4%) |
| Health Technologists | 295 (24.1%) | 930 (75.9%) |
| Total (Category) | 3,253 (44.3%) | 4,090 (55.7%) |
| Total (Overall) | 8,181 (52.2%) | 7,499 (47.8%) |
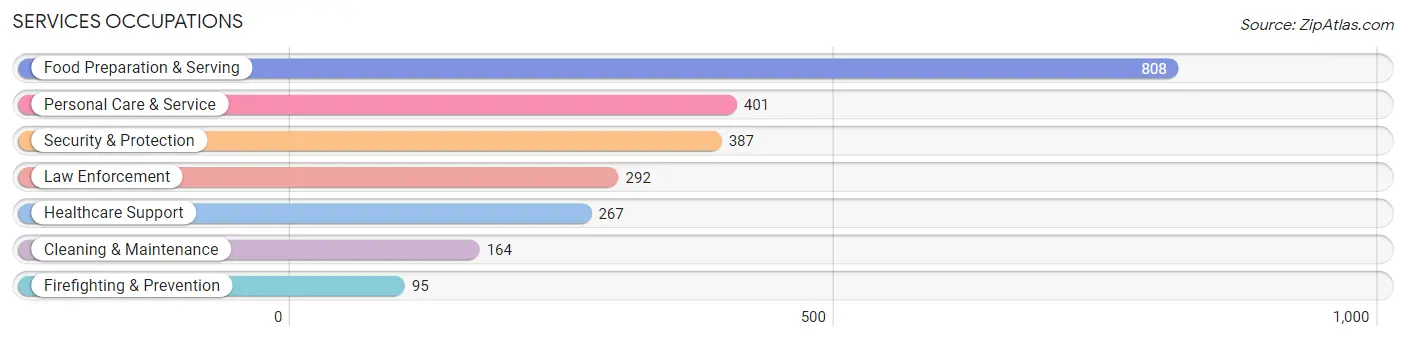
Services Occupations
The most common Services occupations in Brownsburg are Food Preparation & Serving (808 | 5.1%), Personal Care & Service (401 | 2.6%), Security & Protection (387 | 2.5%), Law Enforcement (292 | 1.9%), and Healthcare Support (267 | 1.7%).
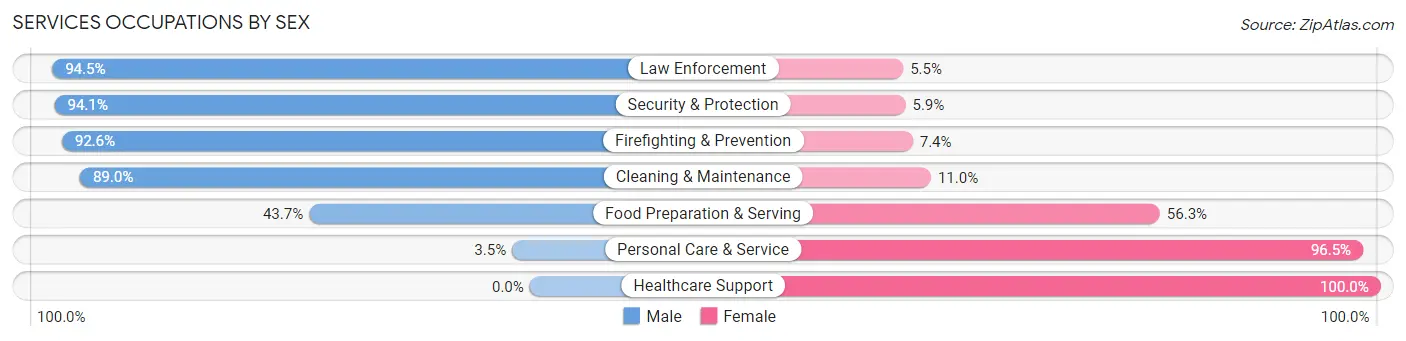
Services Occupations by Sex
Within the Services occupations in Brownsburg, the most male-oriented occupations are Law Enforcement (94.5%), Security & Protection (94.1%), and Firefighting & Prevention (92.6%), while the most female-oriented occupations are Healthcare Support (100.0%), Personal Care & Service (96.5%), and Food Preparation & Serving (56.3%).
| Occupation | Male | Female |
| Healthcare Support | 0 (0.0%) | 267 (100.0%) |
| Security & Protection | 364 (94.1%) | 23 (5.9%) |
| Firefighting & Prevention | 88 (92.6%) | 7 (7.4%) |
| Law Enforcement | 276 (94.5%) | 16 (5.5%) |
| Food Preparation & Serving | 353 (43.7%) | 455 (56.3%) |
| Cleaning & Maintenance | 146 (89.0%) | 18 (11.0%) |
| Personal Care & Service | 14 (3.5%) | 387 (96.5%) |
| Total (Category) | 877 (43.3%) | 1,150 (56.7%) |
| Total (Overall) | 8,181 (52.2%) | 7,499 (47.8%) |
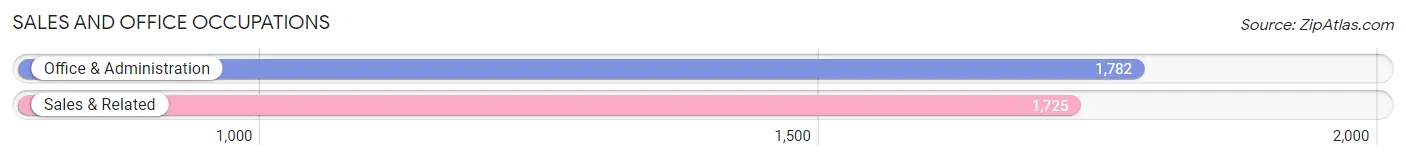
Sales and Office Occupations
The most common Sales and Office occupations in Brownsburg are Office & Administration (1,782 | 11.4%), and Sales & Related (1,725 | 11.0%).
Sales and Office Occupations by Sex
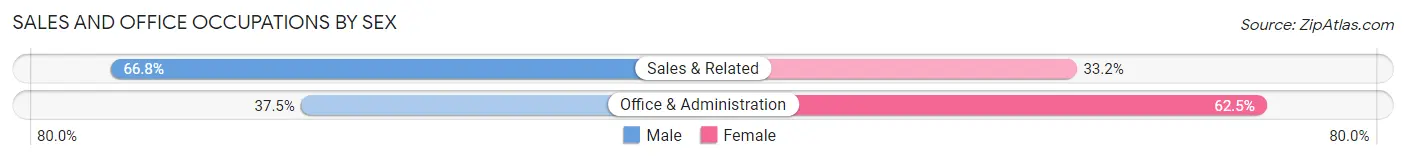
| Occupation | Male | Female |
| Sales & Related | 1,152 (66.8%) | 573 (33.2%) |
| Office & Administration | 669 (37.5%) | 1,113 (62.5%) |
| Total (Category) | 1,821 (51.9%) | 1,686 (48.1%) |
| Total (Overall) | 8,181 (52.2%) | 7,499 (47.8%) |
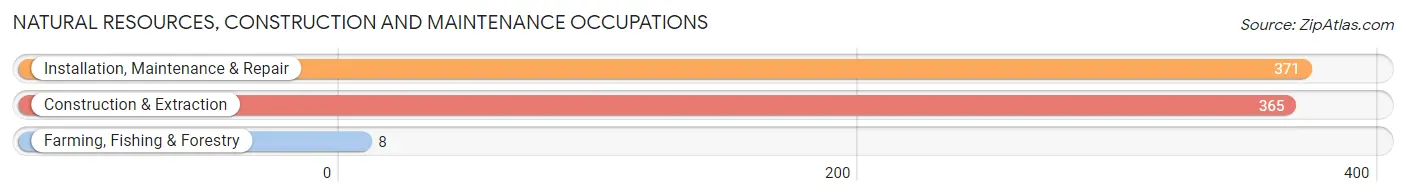
Natural Resources, Construction and Maintenance Occupations
The most common Natural Resources, Construction and Maintenance occupations in Brownsburg are Installation, Maintenance & Repair (371 | 2.4%), Construction & Extraction (365 | 2.3%), and Farming, Fishing & Forestry (8 | 0.1%).
Natural Resources, Construction and Maintenance Occupations by Sex
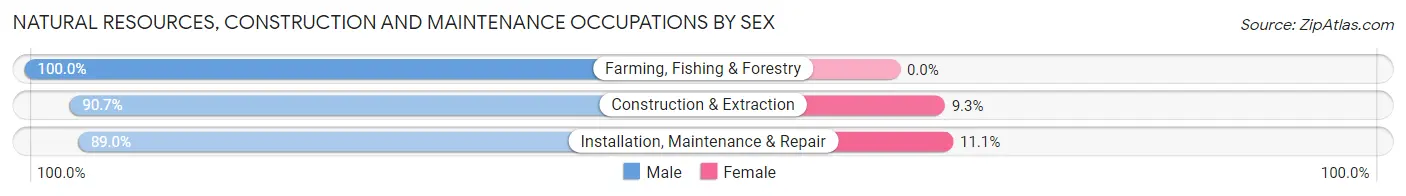
| Occupation | Male | Female |
| Farming, Fishing & Forestry | 8 (100.0%) | 0 (0.0%) |
| Construction & Extraction | 331 (90.7%) | 34 (9.3%) |
| Installation, Maintenance & Repair | 330 (88.9%) | 41 (11.1%) |
| Total (Category) | 669 (89.9%) | 75 (10.1%) |
| Total (Overall) | 8,181 (52.2%) | 7,499 (47.8%) |
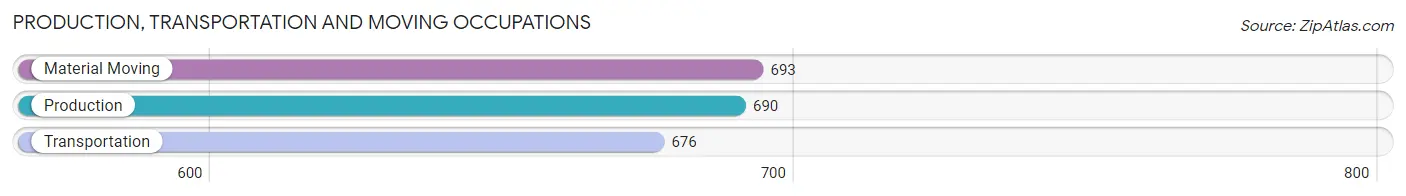
Production, Transportation and Moving Occupations
The most common Production, Transportation and Moving occupations in Brownsburg are Material Moving (693 | 4.4%), Production (690 | 4.4%), and Transportation (676 | 4.3%).
Production, Transportation and Moving Occupations by Sex
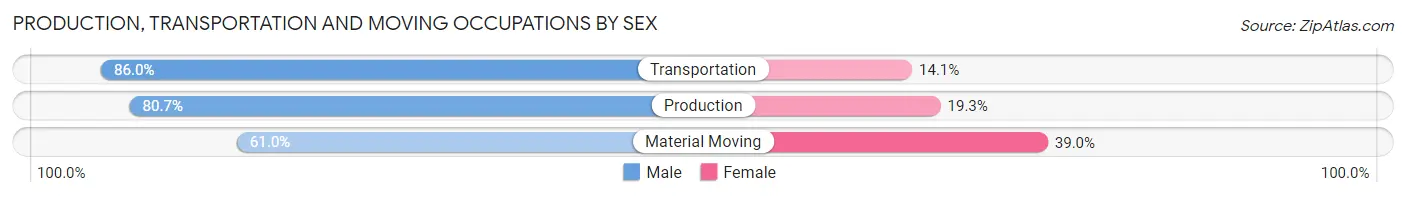
| Occupation | Male | Female |
| Production | 557 (80.7%) | 133 (19.3%) |
| Transportation | 581 (86.0%) | 95 (14.1%) |
| Material Moving | 423 (61.0%) | 270 (39.0%) |
| Total (Category) | 1,561 (75.8%) | 498 (24.2%) |
| Total (Overall) | 8,181 (52.2%) | 7,499 (47.8%) |
Employment Industries by Sex in Brownsburg
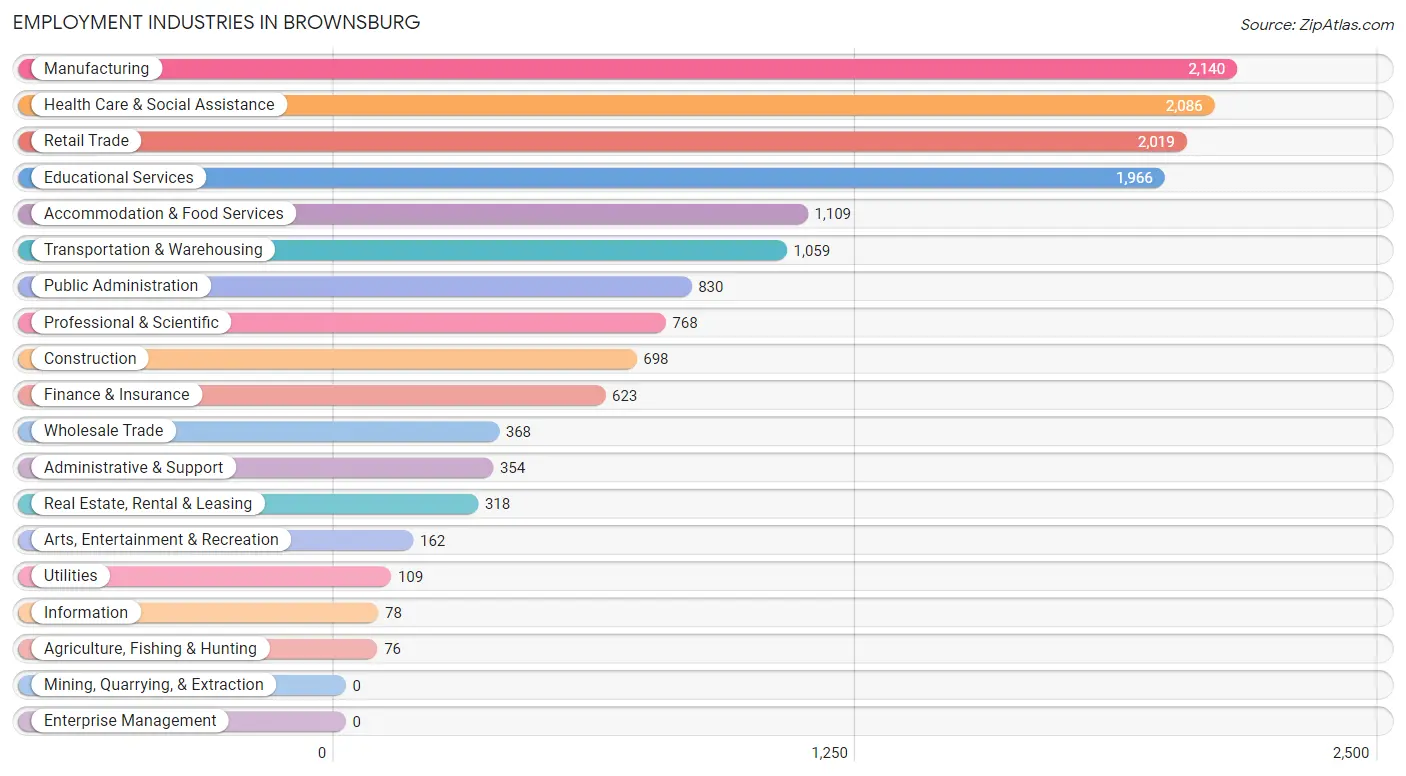
Employment Industries in Brownsburg
The major employment industries in Brownsburg include Manufacturing (2,140 | 13.7%), Health Care & Social Assistance (2,086 | 13.3%), Retail Trade (2,019 | 12.9%), Educational Services (1,966 | 12.5%), and Accommodation & Food Services (1,109 | 7.1%).
Employment Industries by Sex in Brownsburg
The Brownsburg industries that see more men than women are Agriculture, Fishing & Hunting (89.5%), Utilities (87.2%), and Construction (86.4%), whereas the industries that tend to have a higher number of women are Educational Services (81.2%), Health Care & Social Assistance (80.0%), and Information (66.7%).
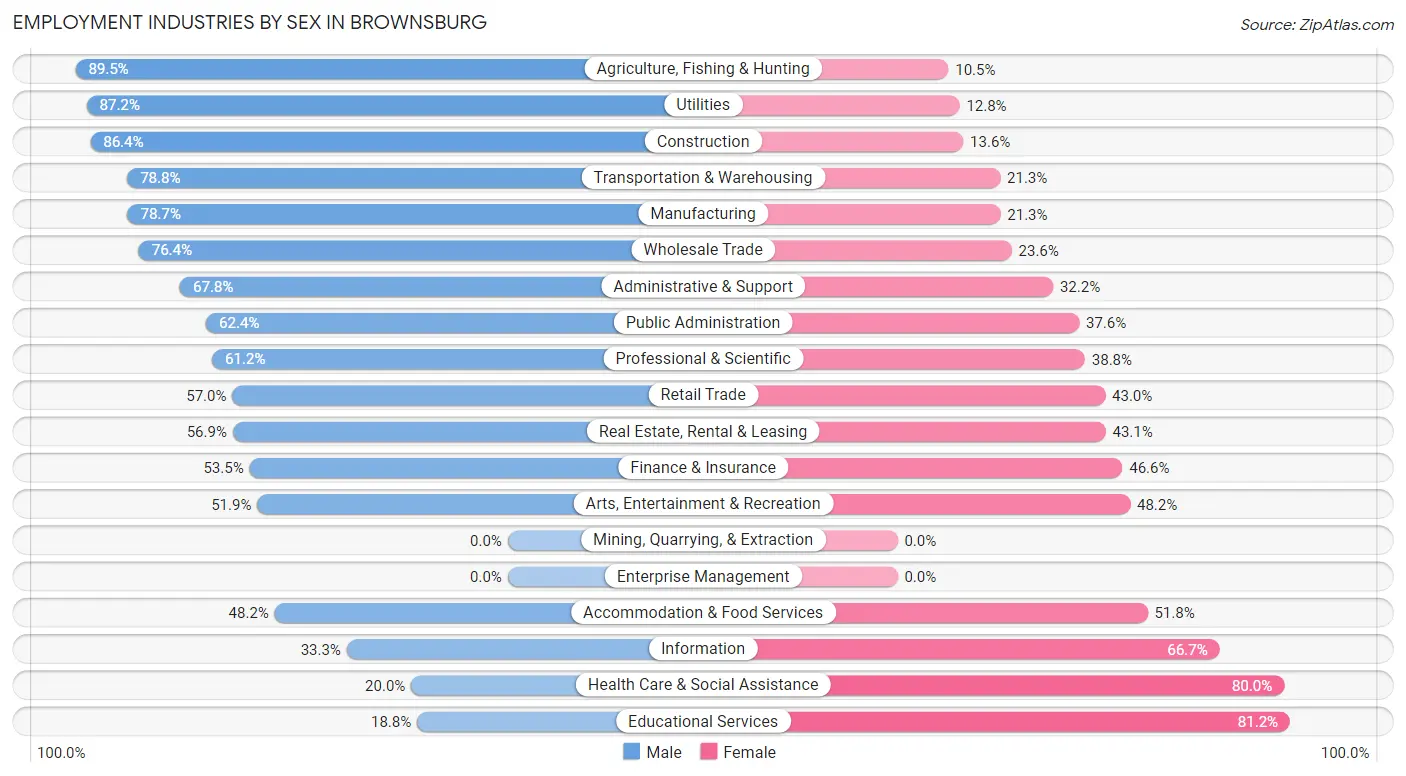
| Industry | Male | Female |
| Agriculture, Fishing & Hunting | 68 (89.5%) | 8 (10.5%) |
| Mining, Quarrying, & Extraction | 0 (0.0%) | 0 (0.0%) |
| Construction | 603 (86.4%) | 95 (13.6%) |
| Manufacturing | 1,684 (78.7%) | 456 (21.3%) |
| Wholesale Trade | 281 (76.4%) | 87 (23.6%) |
| Retail Trade | 1,151 (57.0%) | 868 (43.0%) |
| Transportation & Warehousing | 834 (78.7%) | 225 (21.2%) |
| Utilities | 95 (87.2%) | 14 (12.8%) |
| Information | 26 (33.3%) | 52 (66.7%) |
| Finance & Insurance | 333 (53.4%) | 290 (46.6%) |
| Real Estate, Rental & Leasing | 181 (56.9%) | 137 (43.1%) |
| Professional & Scientific | 470 (61.2%) | 298 (38.8%) |
| Enterprise Management | 0 (0.0%) | 0 (0.0%) |
| Administrative & Support | 240 (67.8%) | 114 (32.2%) |
| Educational Services | 369 (18.8%) | 1,597 (81.2%) |
| Health Care & Social Assistance | 417 (20.0%) | 1,669 (80.0%) |
| Arts, Entertainment & Recreation | 84 (51.8%) | 78 (48.1%) |
| Accommodation & Food Services | 535 (48.2%) | 574 (51.8%) |
| Public Administration | 518 (62.4%) | 312 (37.6%) |
| Total | 8,181 (52.2%) | 7,499 (47.8%) |
Education in Brownsburg
School Enrollment in Brownsburg
The most common levels of schooling among the 8,511 students in Brownsburg are middle school (2,192 | 25.8%), high school (2,056 | 24.2%), and elementary school (1,977 | 23.2%).
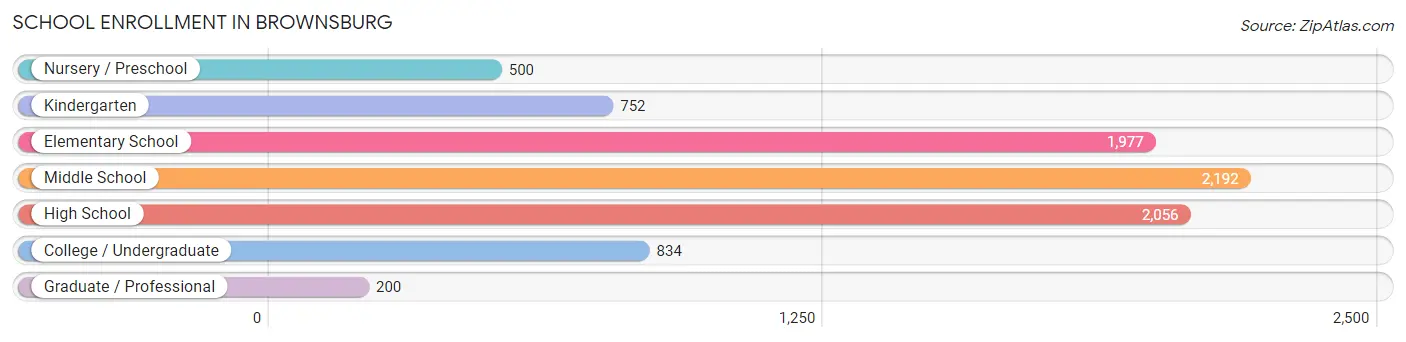
| School Level | # Students | % Students |
| Nursery / Preschool | 500 | 5.9% |
| Kindergarten | 752 | 8.8% |
| Elementary School | 1,977 | 23.2% |
| Middle School | 2,192 | 25.8% |
| High School | 2,056 | 24.2% |
| College / Undergraduate | 834 | 9.8% |
| Graduate / Professional | 200 | 2.4% |
| Total | 8,511 | 100.0% |
School Enrollment by Age by Funding Source in Brownsburg
Out of a total of 8,511 students who are enrolled in schools in Brownsburg, 1,694 (19.9%) attend a private institution, while the remaining 6,817 (80.1%) are enrolled in public schools. The age group of 3 to 4 year olds has the highest likelihood of being enrolled in private schools, with 270 (63.5% in the age bracket) enrolled. Conversely, the age group of 18 to 19 year olds has the lowest likelihood of being enrolled in a private school, with 705 (92.5% in the age bracket) attending a public institution.
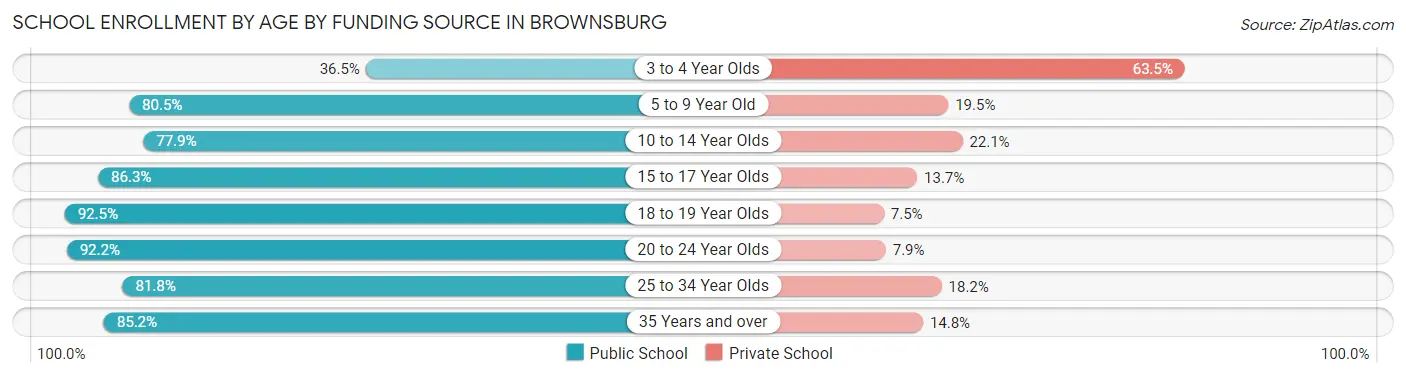
| Age Bracket | Public School | Private School |
| 3 to 4 Year Olds | 155 (36.5%) | 270 (63.5%) |
| 5 to 9 Year Old | 2,120 (80.5%) | 513 (19.5%) |
| 10 to 14 Year Olds | 2,099 (77.9%) | 596 (22.1%) |
| 15 to 17 Year Olds | 921 (86.3%) | 146 (13.7%) |
| 18 to 19 Year Olds | 705 (92.5%) | 57 (7.5%) |
| 20 to 24 Year Olds | 364 (92.1%) | 31 (7.9%) |
| 25 to 34 Year Olds | 121 (81.8%) | 27 (18.2%) |
| 35 Years and over | 329 (85.2%) | 57 (14.8%) |
| Total | 6,817 (80.1%) | 1,694 (19.9%) |
Educational Attainment by Field of Study in Brownsburg
Business (1,979 | 20.6%), education (1,603 | 16.7%), science & technology (1,404 | 14.6%), arts & humanities (881 | 9.2%), and engineering (783 | 8.2%) are the most common fields of study among 9,605 individuals in Brownsburg who have obtained a bachelor's degree or higher.
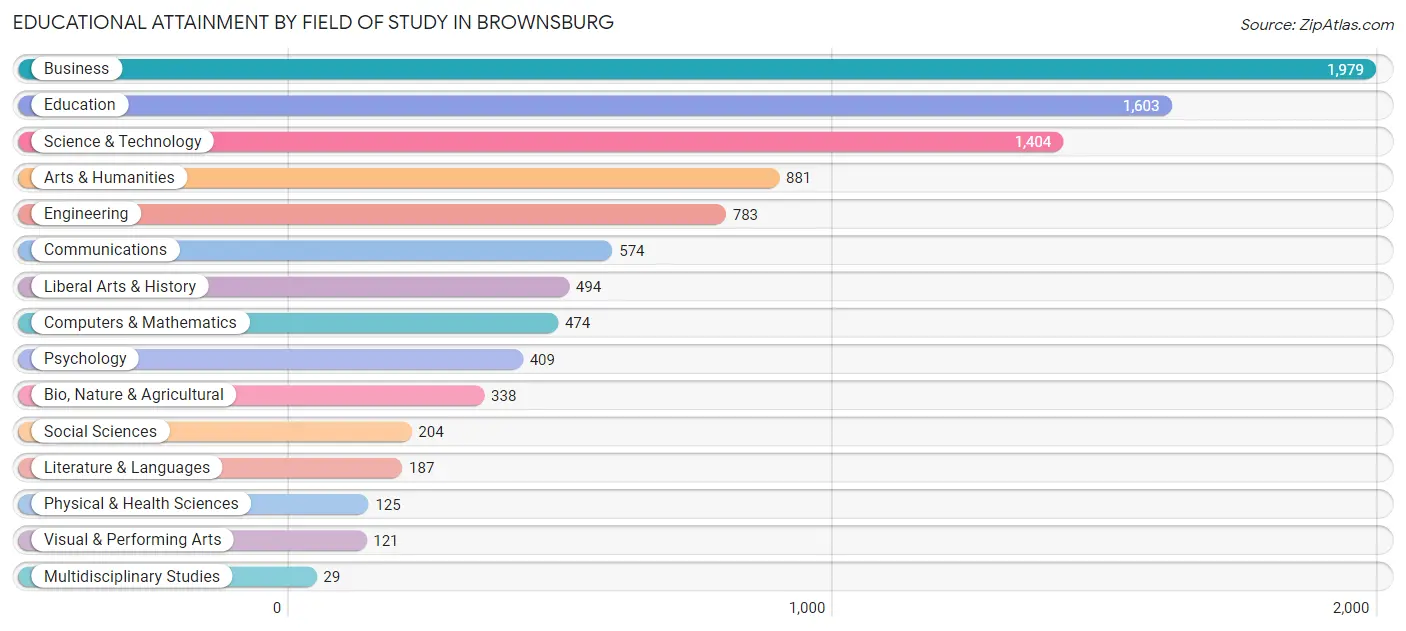
| Field of Study | # Graduates | % Graduates |
| Computers & Mathematics | 474 | 4.9% |
| Bio, Nature & Agricultural | 338 | 3.5% |
| Physical & Health Sciences | 125 | 1.3% |
| Psychology | 409 | 4.3% |
| Social Sciences | 204 | 2.1% |
| Engineering | 783 | 8.2% |
| Multidisciplinary Studies | 29 | 0.3% |
| Science & Technology | 1,404 | 14.6% |
| Business | 1,979 | 20.6% |
| Education | 1,603 | 16.7% |
| Literature & Languages | 187 | 1.9% |
| Liberal Arts & History | 494 | 5.1% |
| Visual & Performing Arts | 121 | 1.3% |
| Communications | 574 | 6.0% |
| Arts & Humanities | 881 | 9.2% |
| Total | 9,605 | 100.0% |
Transportation & Commute in Brownsburg
Vehicle Availability by Sex in Brownsburg
The most prevalent vehicle ownership categories in Brownsburg are males with 2 vehicles (3,943, accounting for 48.8%) and females with 2 vehicles (3,955, making up 52.9%).
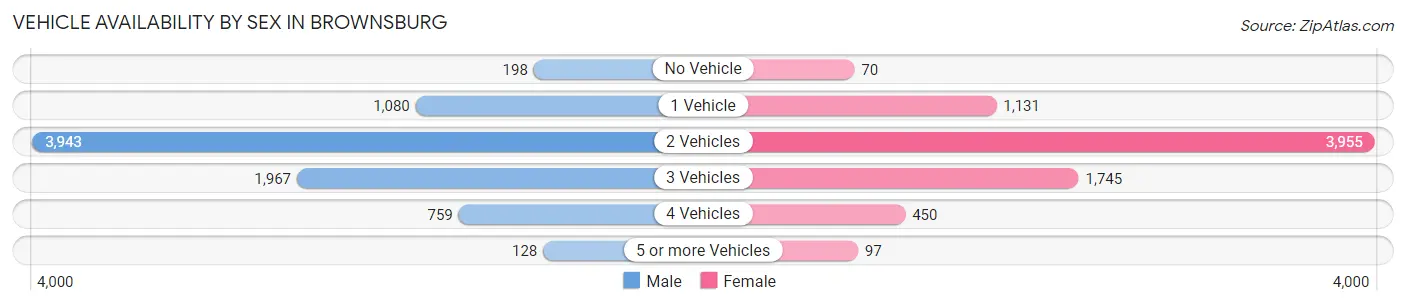
| Vehicles Available | Male | Female |
| No Vehicle | 198 (2.5%) | 70 (0.9%) |
| 1 Vehicle | 1,080 (13.4%) | 1,131 (15.2%) |
| 2 Vehicles | 3,943 (48.8%) | 3,955 (53.1%) |
| 3 Vehicles | 1,967 (24.4%) | 1,745 (23.4%) |
| 4 Vehicles | 759 (9.4%) | 450 (6.0%) |
| 5 or more Vehicles | 128 (1.6%) | 97 (1.3%) |
| Total | 8,075 (100.0%) | 7,448 (100.0%) |
Commute Time in Brownsburg
The most frequently occuring commute durations in Brownsburg are 30 to 34 minutes (2,236 commuters, 16.4%), 10 to 14 minutes (2,010 commuters, 14.7%), and 20 to 24 minutes (1,676 commuters, 12.3%).
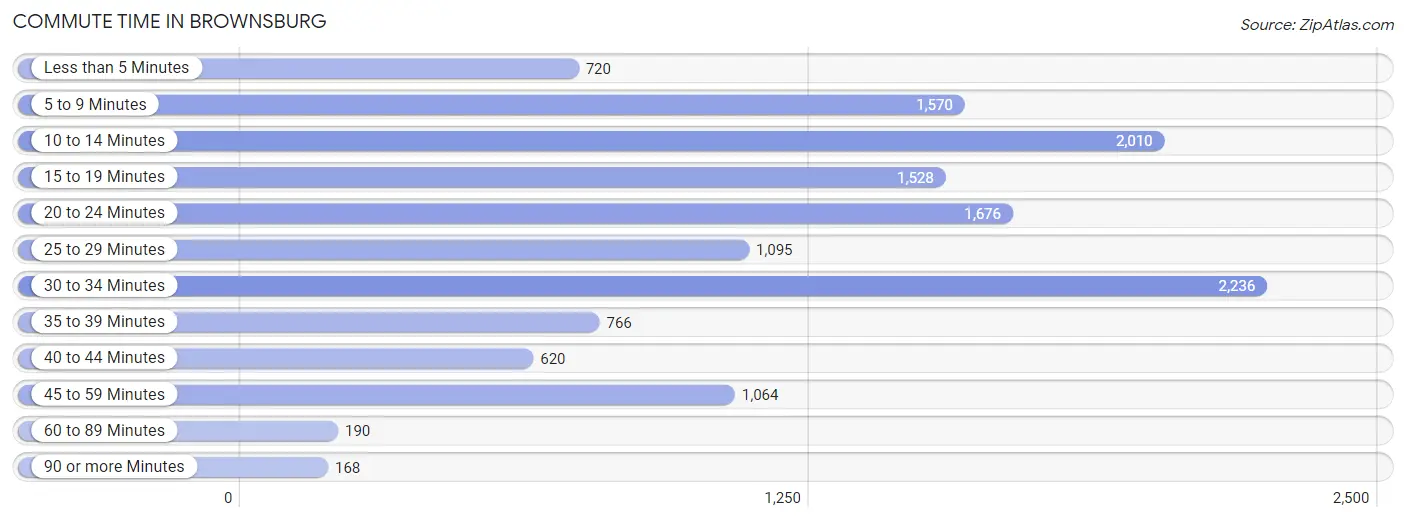
| Commute Time | # Commuters | % Commuters |
| Less than 5 Minutes | 720 | 5.3% |
| 5 to 9 Minutes | 1,570 | 11.5% |
| 10 to 14 Minutes | 2,010 | 14.7% |
| 15 to 19 Minutes | 1,528 | 11.2% |
| 20 to 24 Minutes | 1,676 | 12.3% |
| 25 to 29 Minutes | 1,095 | 8.0% |
| 30 to 34 Minutes | 2,236 | 16.4% |
| 35 to 39 Minutes | 766 | 5.6% |
| 40 to 44 Minutes | 620 | 4.5% |
| 45 to 59 Minutes | 1,064 | 7.8% |
| 60 to 89 Minutes | 190 | 1.4% |
| 90 or more Minutes | 168 | 1.2% |
Commute Time by Sex in Brownsburg
The most common commute times in Brownsburg are 30 to 34 minutes (1,335 commuters, 19.2%) for males and 10 to 14 minutes (1,157 commuters, 17.2%) for females.
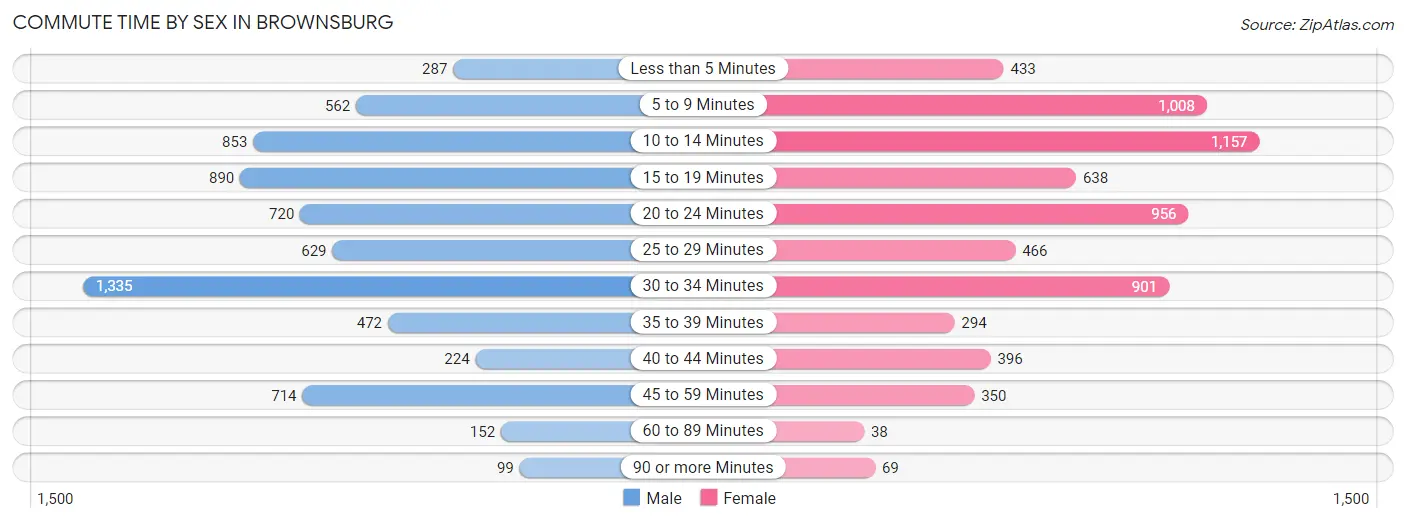
| Commute Time | Male | Female |
| Less than 5 Minutes | 287 (4.1%) | 433 (6.5%) |
| 5 to 9 Minutes | 562 (8.1%) | 1,008 (15.0%) |
| 10 to 14 Minutes | 853 (12.3%) | 1,157 (17.2%) |
| 15 to 19 Minutes | 890 (12.8%) | 638 (9.5%) |
| 20 to 24 Minutes | 720 (10.4%) | 956 (14.3%) |
| 25 to 29 Minutes | 629 (9.1%) | 466 (7.0%) |
| 30 to 34 Minutes | 1,335 (19.2%) | 901 (13.4%) |
| 35 to 39 Minutes | 472 (6.8%) | 294 (4.4%) |
| 40 to 44 Minutes | 224 (3.2%) | 396 (5.9%) |
| 45 to 59 Minutes | 714 (10.3%) | 350 (5.2%) |
| 60 to 89 Minutes | 152 (2.2%) | 38 (0.6%) |
| 90 or more Minutes | 99 (1.4%) | 69 (1.0%) |
Time of Departure to Work by Sex in Brownsburg
The most frequent times of departure to work in Brownsburg are 7:00 AM to 7:29 AM (1,073, 15.5%) for males and 7:00 AM to 7:29 AM (1,434, 21.4%) for females.
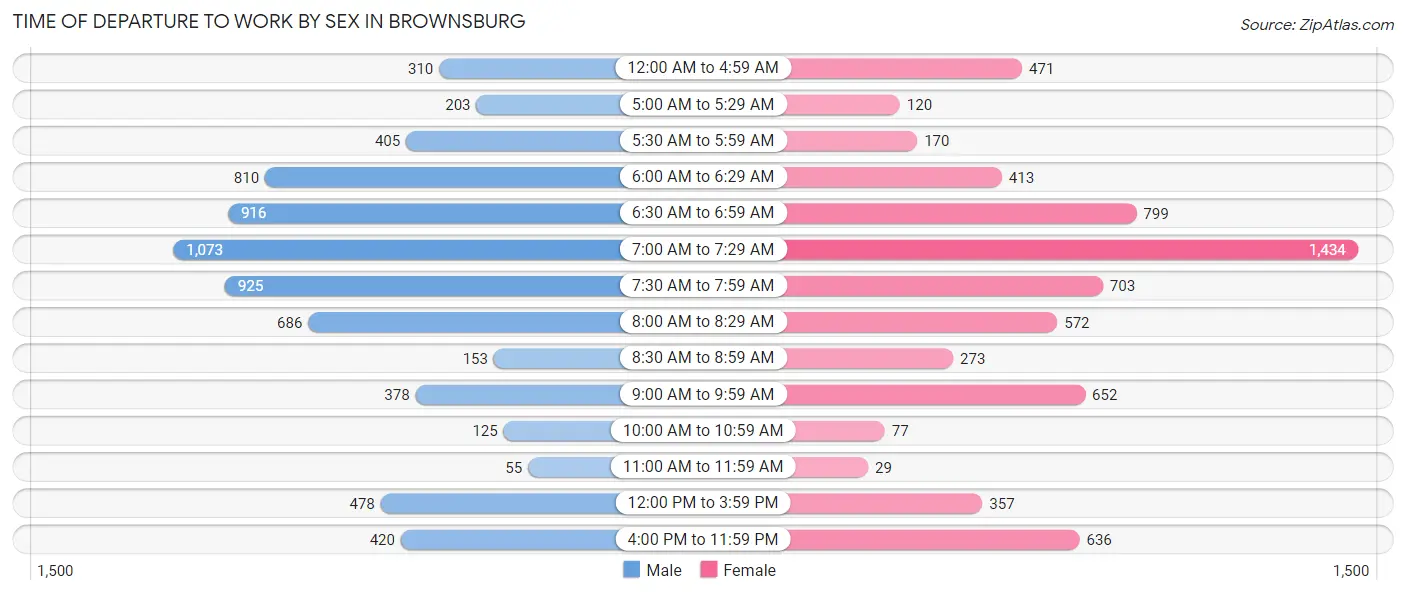
| Time of Departure | Male | Female |
| 12:00 AM to 4:59 AM | 310 (4.5%) | 471 (7.0%) |
| 5:00 AM to 5:29 AM | 203 (2.9%) | 120 (1.8%) |
| 5:30 AM to 5:59 AM | 405 (5.8%) | 170 (2.5%) |
| 6:00 AM to 6:29 AM | 810 (11.7%) | 413 (6.2%) |
| 6:30 AM to 6:59 AM | 916 (13.2%) | 799 (11.9%) |
| 7:00 AM to 7:29 AM | 1,073 (15.5%) | 1,434 (21.4%) |
| 7:30 AM to 7:59 AM | 925 (13.3%) | 703 (10.5%) |
| 8:00 AM to 8:29 AM | 686 (9.9%) | 572 (8.5%) |
| 8:30 AM to 8:59 AM | 153 (2.2%) | 273 (4.1%) |
| 9:00 AM to 9:59 AM | 378 (5.4%) | 652 (9.7%) |
| 10:00 AM to 10:59 AM | 125 (1.8%) | 77 (1.1%) |
| 11:00 AM to 11:59 AM | 55 (0.8%) | 29 (0.4%) |
| 12:00 PM to 3:59 PM | 478 (6.9%) | 357 (5.3%) |
| 4:00 PM to 11:59 PM | 420 (6.0%) | 636 (9.5%) |
| Total | 6,937 (100.0%) | 6,706 (100.0%) |
Housing Occupancy in Brownsburg
Occupancy by Ownership in Brownsburg
Of the total 10,488 dwellings in Brownsburg, owner-occupied units account for 7,476 (71.3%), while renter-occupied units make up 3,012 (28.7%).
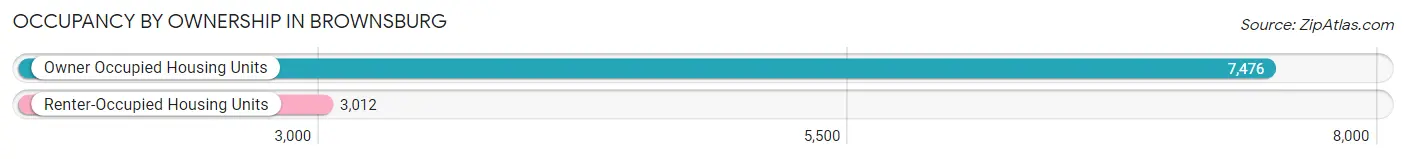
| Occupancy | # Housing Units | % Housing Units |
| Owner Occupied Housing Units | 7,476 | 71.3% |
| Renter-Occupied Housing Units | 3,012 | 28.7% |
| Total Occupied Housing Units | 10,488 | 100.0% |
Occupancy by Household Size in Brownsburg
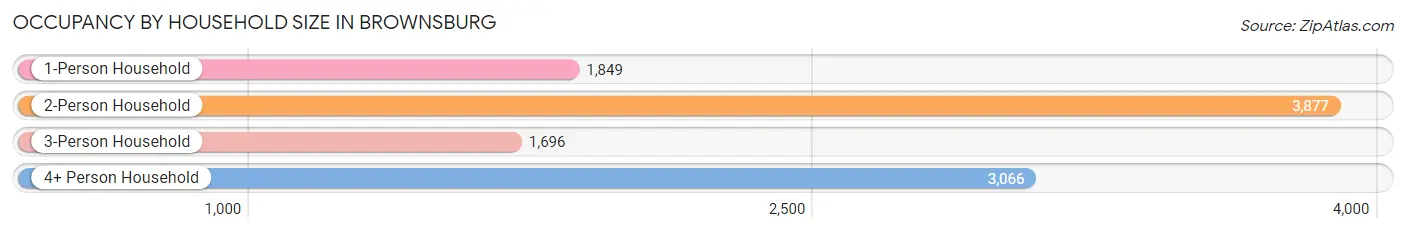
| Household Size | # Housing Units | % Housing Units |
| 1-Person Household | 1,849 | 17.6% |
| 2-Person Household | 3,877 | 37.0% |
| 3-Person Household | 1,696 | 16.2% |
| 4+ Person Household | 3,066 | 29.2% |
| Total Housing Units | 10,488 | 100.0% |
Occupancy by Ownership by Household Size in Brownsburg
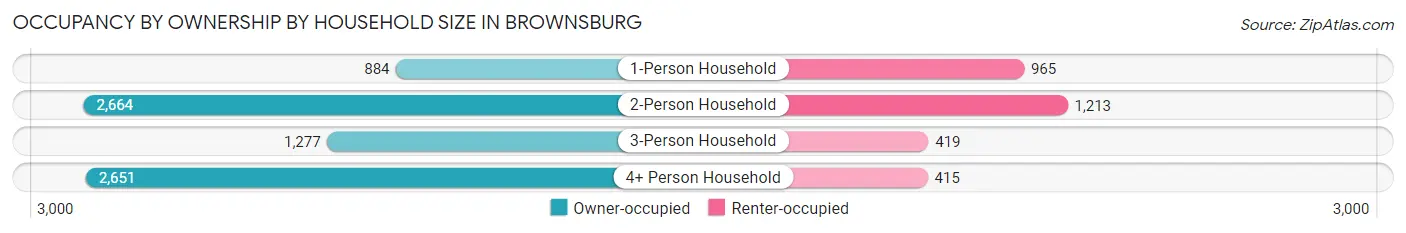
| Household Size | Owner-occupied | Renter-occupied |
| 1-Person Household | 884 (47.8%) | 965 (52.2%) |
| 2-Person Household | 2,664 (68.7%) | 1,213 (31.3%) |
| 3-Person Household | 1,277 (75.3%) | 419 (24.7%) |
| 4+ Person Household | 2,651 (86.5%) | 415 (13.5%) |
| Total Housing Units | 7,476 (71.3%) | 3,012 (28.7%) |
Occupancy by Educational Attainment in Brownsburg
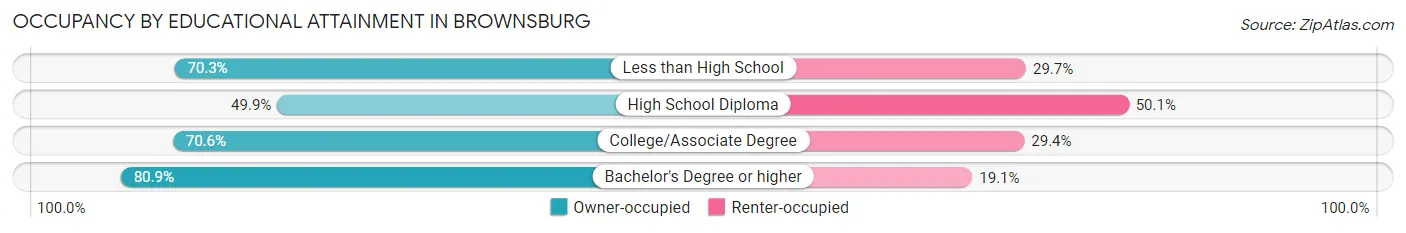
| Household Size | Owner-occupied | Renter-occupied |
| Less than High School | 395 (70.3%) | 167 (29.7%) |
| High School Diploma | 1,077 (49.9%) | 1,080 (50.1%) |
| College/Associate Degree | 1,942 (70.6%) | 808 (29.4%) |
| Bachelor's Degree or higher | 4,062 (80.9%) | 957 (19.1%) |
Occupancy by Age of Householder in Brownsburg
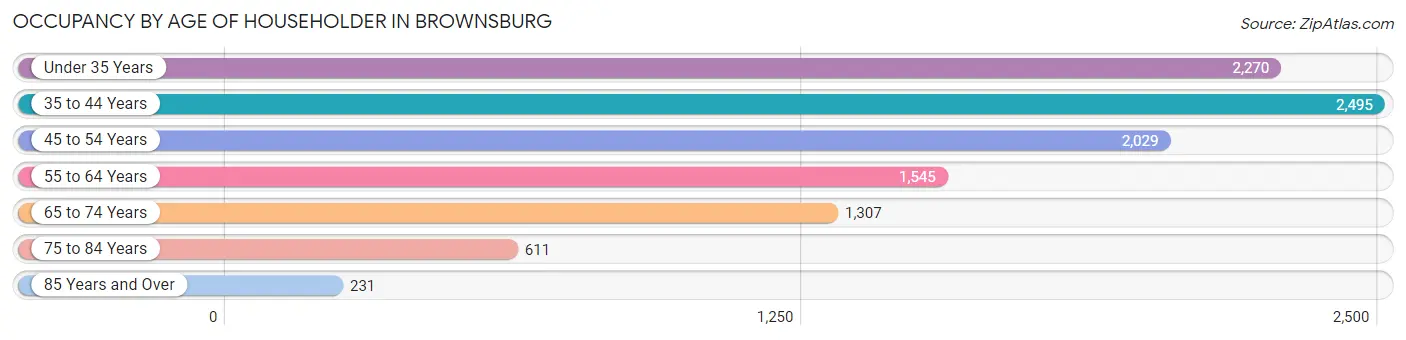
| Age Bracket | # Households | % Households |
| Under 35 Years | 2,270 | 21.6% |
| 35 to 44 Years | 2,495 | 23.8% |
| 45 to 54 Years | 2,029 | 19.4% |
| 55 to 64 Years | 1,545 | 14.7% |
| 65 to 74 Years | 1,307 | 12.5% |
| 75 to 84 Years | 611 | 5.8% |
| 85 Years and Over | 231 | 2.2% |
| Total | 10,488 | 100.0% |
Housing Finances in Brownsburg
Median Income by Occupancy in Brownsburg
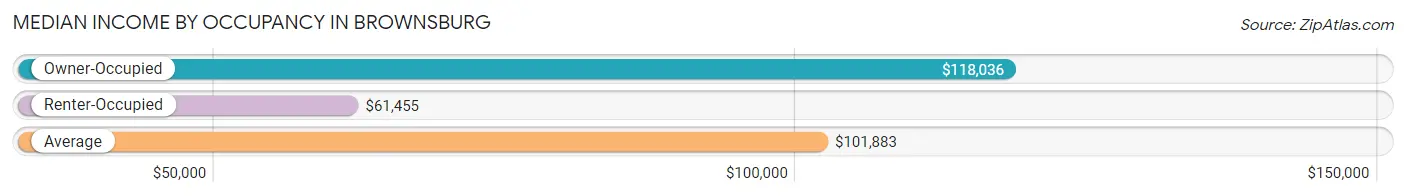
| Occupancy Type | # Households | Median Income |
| Owner-Occupied | 7,476 (71.3%) | $118,036 |
| Renter-Occupied | 3,012 (28.7%) | $61,455 |
| Average | 10,488 (100.0%) | $101,883 |
Occupancy by Householder Income Bracket in Brownsburg
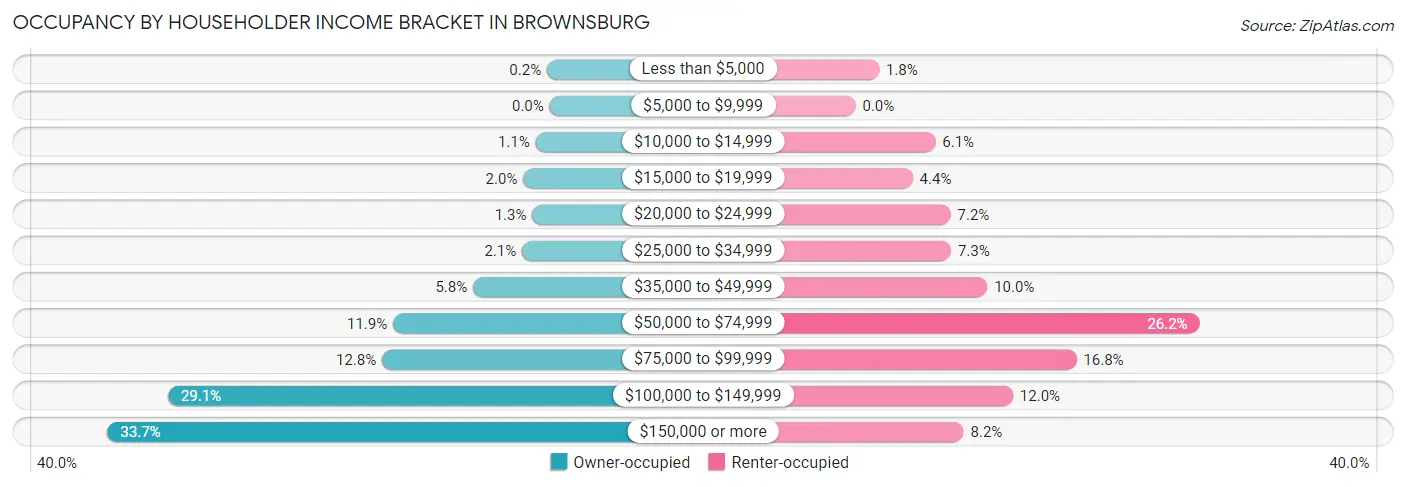
| Income Bracket | Owner-occupied | Renter-occupied |
| Less than $5,000 | 15 (0.2%) | 54 (1.8%) |
| $5,000 to $9,999 | 0 (0.0%) | 0 (0.0%) |
| $10,000 to $14,999 | 80 (1.1%) | 183 (6.1%) |
| $15,000 to $19,999 | 150 (2.0%) | 131 (4.3%) |
| $20,000 to $24,999 | 99 (1.3%) | 218 (7.2%) |
| $25,000 to $34,999 | 157 (2.1%) | 219 (7.3%) |
| $35,000 to $49,999 | 436 (5.8%) | 302 (10.0%) |
| $50,000 to $74,999 | 892 (11.9%) | 789 (26.2%) |
| $75,000 to $99,999 | 954 (12.8%) | 507 (16.8%) |
| $100,000 to $149,999 | 2,174 (29.1%) | 361 (12.0%) |
| $150,000 or more | 2,519 (33.7%) | 248 (8.2%) |
| Total | 7,476 (100.0%) | 3,012 (100.0%) |
Monthly Housing Cost Tiers in Brownsburg
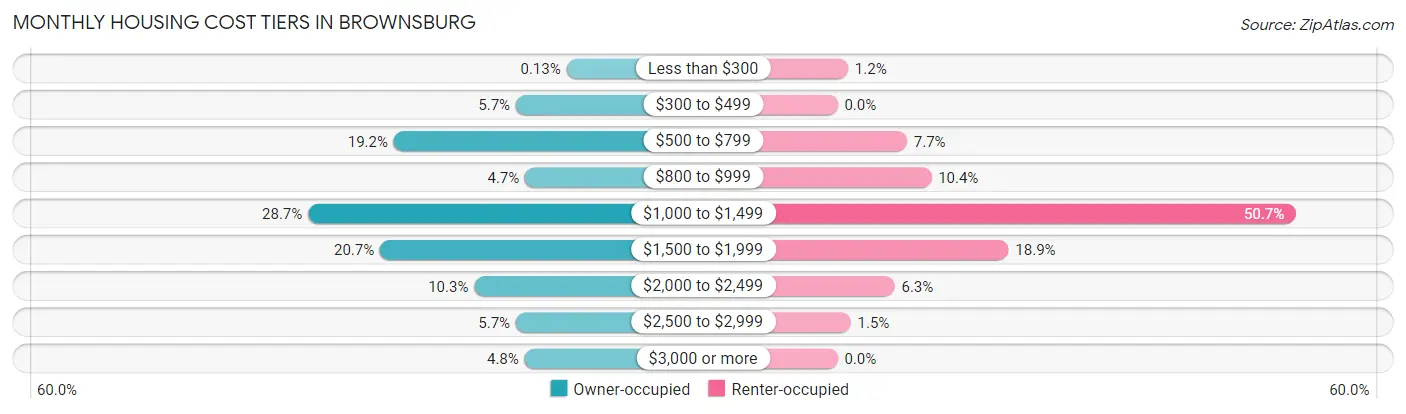
| Monthly Cost | Owner-occupied | Renter-occupied |
| Less than $300 | 10 (0.1%) | 35 (1.2%) |
| $300 to $499 | 428 (5.7%) | 0 (0.0%) |
| $500 to $799 | 1,436 (19.2%) | 231 (7.7%) |
| $800 to $999 | 352 (4.7%) | 312 (10.4%) |
| $1,000 to $1,499 | 2,144 (28.7%) | 1,526 (50.7%) |
| $1,500 to $1,999 | 1,550 (20.7%) | 569 (18.9%) |
| $2,000 to $2,499 | 772 (10.3%) | 190 (6.3%) |
| $2,500 to $2,999 | 428 (5.7%) | 44 (1.5%) |
| $3,000 or more | 356 (4.8%) | 0 (0.0%) |
| Total | 7,476 (100.0%) | 3,012 (100.0%) |
Physical Housing Characteristics in Brownsburg
Housing Structures in Brownsburg
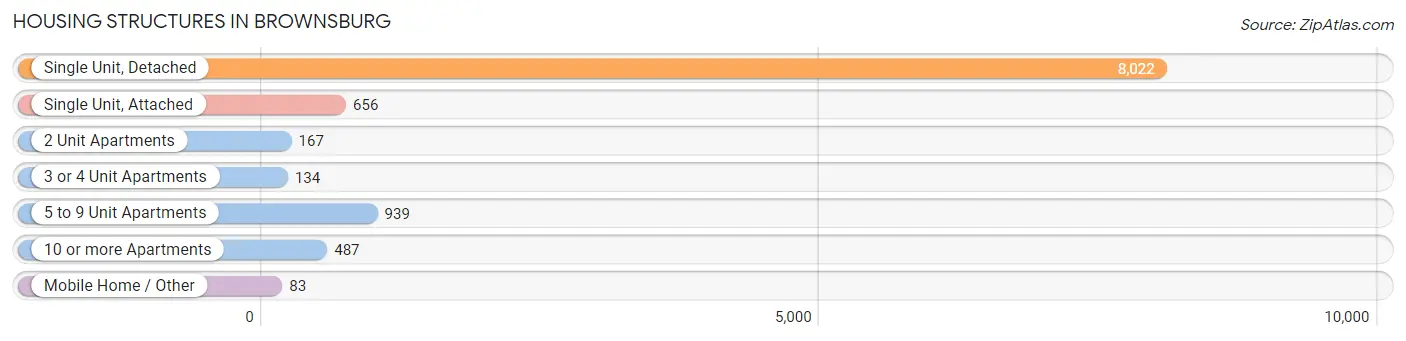
| Structure Type | # Housing Units | % Housing Units |
| Single Unit, Detached | 8,022 | 76.5% |
| Single Unit, Attached | 656 | 6.2% |
| 2 Unit Apartments | 167 | 1.6% |
| 3 or 4 Unit Apartments | 134 | 1.3% |
| 5 to 9 Unit Apartments | 939 | 8.9% |
| 10 or more Apartments | 487 | 4.6% |
| Mobile Home / Other | 83 | 0.8% |
| Total | 10,488 | 100.0% |
Housing Structures by Occupancy in Brownsburg
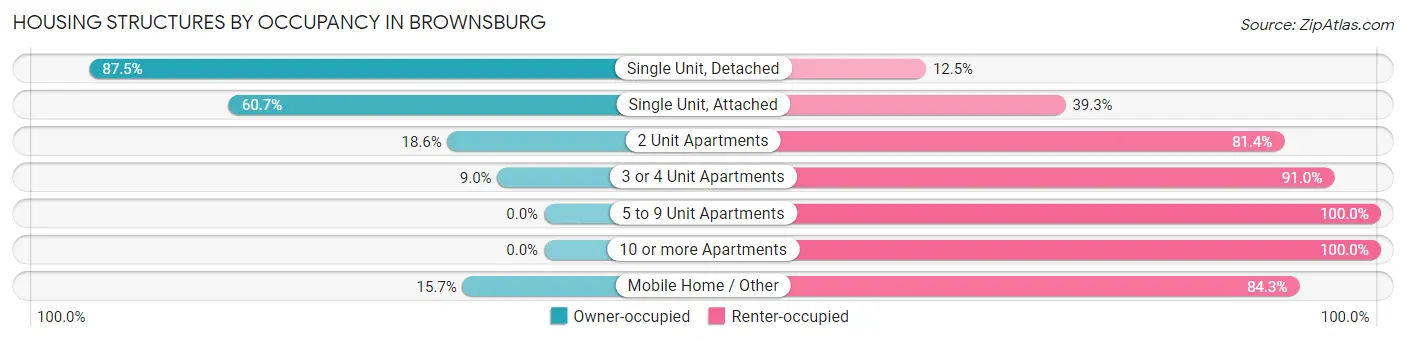
| Structure Type | Owner-occupied | Renter-occupied |
| Single Unit, Detached | 7,022 (87.5%) | 1,000 (12.5%) |
| Single Unit, Attached | 398 (60.7%) | 258 (39.3%) |
| 2 Unit Apartments | 31 (18.6%) | 136 (81.4%) |
| 3 or 4 Unit Apartments | 12 (9.0%) | 122 (91.0%) |
| 5 to 9 Unit Apartments | 0 (0.0%) | 939 (100.0%) |
| 10 or more Apartments | 0 (0.0%) | 487 (100.0%) |
| Mobile Home / Other | 13 (15.7%) | 70 (84.3%) |
| Total | 7,476 (71.3%) | 3,012 (28.7%) |
Housing Structures by Number of Rooms in Brownsburg
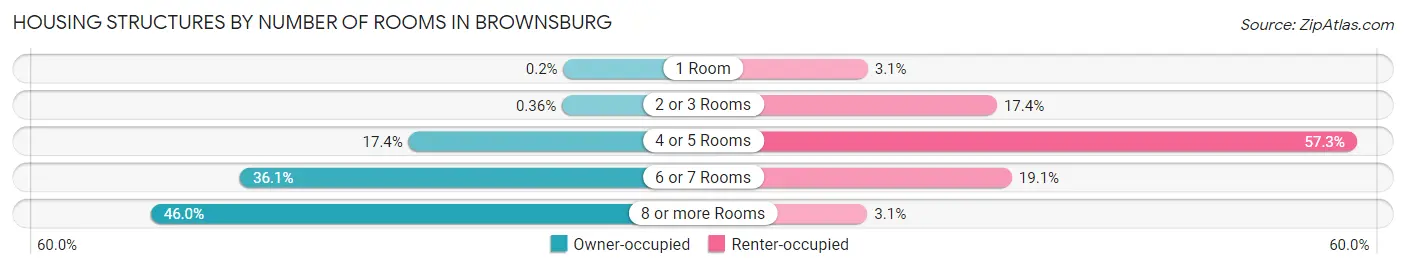
| Number of Rooms | Owner-occupied | Renter-occupied |
| 1 Room | 15 (0.2%) | 93 (3.1%) |
| 2 or 3 Rooms | 27 (0.4%) | 525 (17.4%) |
| 4 or 5 Rooms | 1,299 (17.4%) | 1,727 (57.3%) |
| 6 or 7 Rooms | 2,697 (36.1%) | 575 (19.1%) |
| 8 or more Rooms | 3,438 (46.0%) | 92 (3.0%) |
| Total | 7,476 (100.0%) | 3,012 (100.0%) |
Housing Structure by Heating Type in Brownsburg
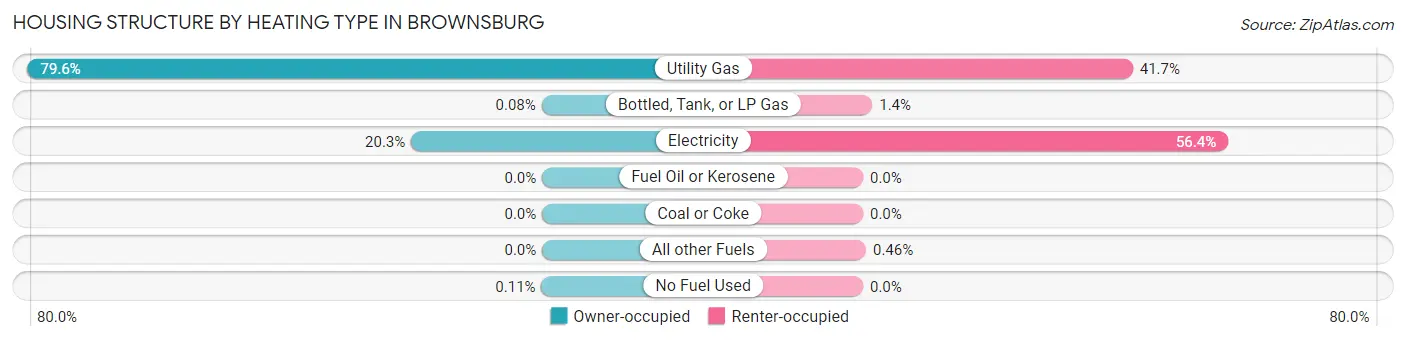
| Heating Type | Owner-occupied | Renter-occupied |
| Utility Gas | 5,948 (79.6%) | 1,256 (41.7%) |
| Bottled, Tank, or LP Gas | 6 (0.1%) | 43 (1.4%) |
| Electricity | 1,514 (20.3%) | 1,699 (56.4%) |
| Fuel Oil or Kerosene | 0 (0.0%) | 0 (0.0%) |
| Coal or Coke | 0 (0.0%) | 0 (0.0%) |
| All other Fuels | 0 (0.0%) | 14 (0.5%) |
| No Fuel Used | 8 (0.1%) | 0 (0.0%) |
| Total | 7,476 (100.0%) | 3,012 (100.0%) |
Household Vehicle Usage in Brownsburg
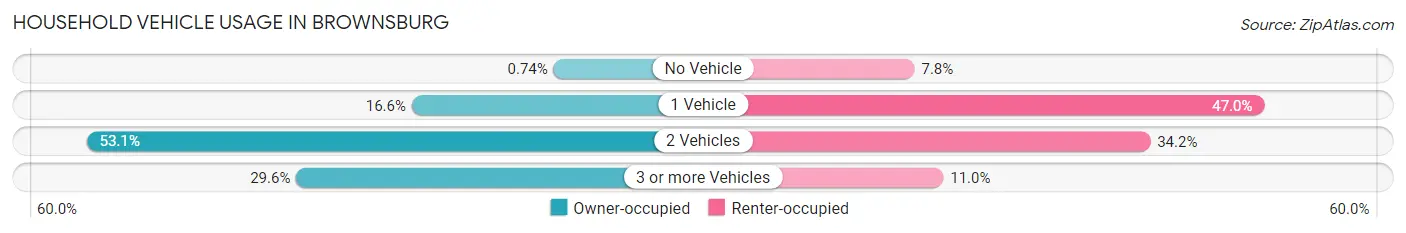
| Vehicles per Household | Owner-occupied | Renter-occupied |
| No Vehicle | 55 (0.7%) | 235 (7.8%) |
| 1 Vehicle | 1,243 (16.6%) | 1,415 (47.0%) |
| 2 Vehicles | 3,967 (53.1%) | 1,030 (34.2%) |
| 3 or more Vehicles | 2,211 (29.6%) | 332 (11.0%) |
| Total | 7,476 (100.0%) | 3,012 (100.0%) |
Real Estate & Mortgages in Brownsburg
Real Estate and Mortgage Overview in Brownsburg
| Characteristic | Without Mortgage | With Mortgage |
| Housing Units | 1,951 | 5,525 |
| Median Property Value | $260,900 | $250,700 |
| Median Household Income | $93,973 | $1,963 |
| Monthly Housing Costs | $626 | $356 |
| Real Estate Taxes | $2,321 | $40 |
Property Value by Mortgage Status in Brownsburg
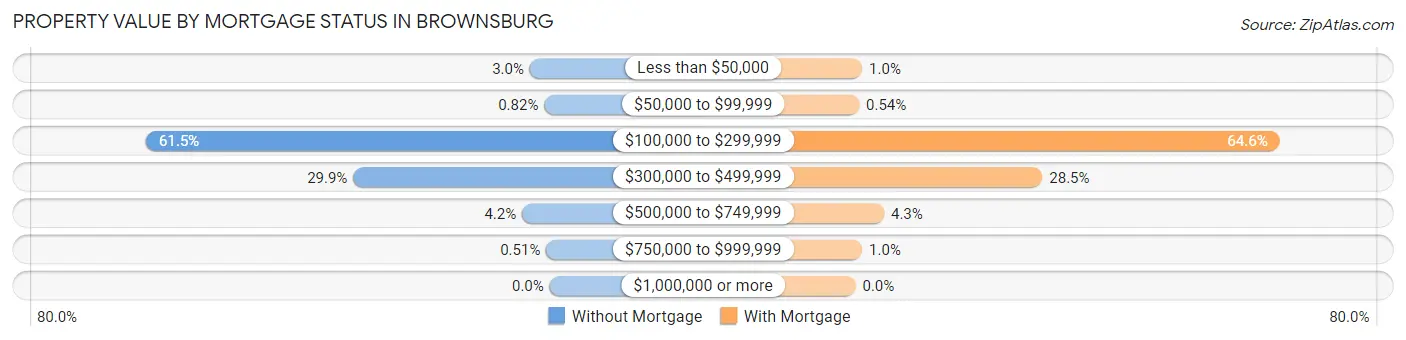
| Property Value | Without Mortgage | With Mortgage |
| Less than $50,000 | 59 (3.0%) | 56 (1.0%) |
| $50,000 to $99,999 | 16 (0.8%) | 30 (0.5%) |
| $100,000 to $299,999 | 1,200 (61.5%) | 3,570 (64.6%) |
| $300,000 to $499,999 | 584 (29.9%) | 1,573 (28.5%) |
| $500,000 to $749,999 | 82 (4.2%) | 240 (4.3%) |
| $750,000 to $999,999 | 10 (0.5%) | 56 (1.0%) |
| $1,000,000 or more | 0 (0.0%) | 0 (0.0%) |
| Total | 1,951 (100.0%) | 5,525 (100.0%) |
Household Income by Mortgage Status in Brownsburg
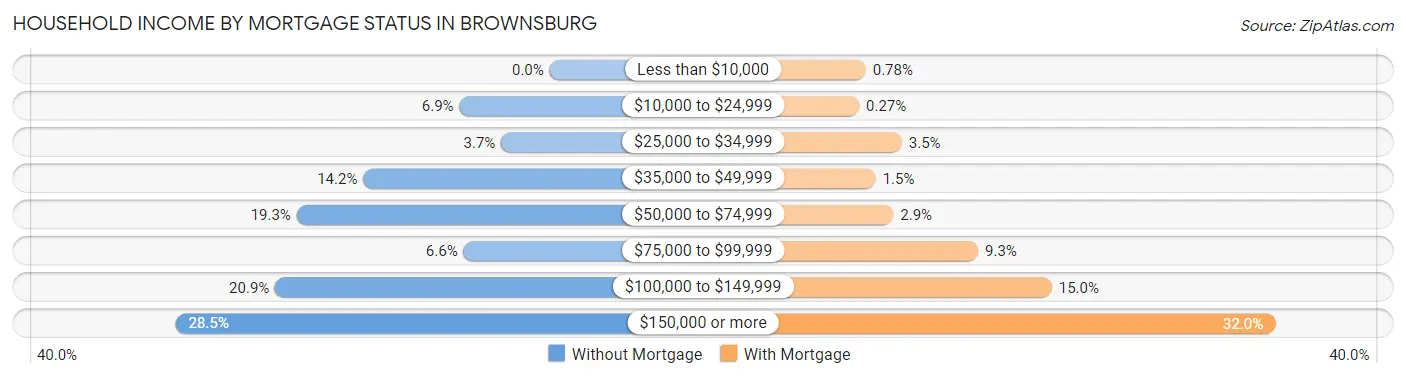
| Household Income | Without Mortgage | With Mortgage |
| Less than $10,000 | 0 (0.0%) | 43 (0.8%) |
| $10,000 to $24,999 | 134 (6.9%) | 15 (0.3%) |
| $25,000 to $34,999 | 72 (3.7%) | 195 (3.5%) |
| $35,000 to $49,999 | 277 (14.2%) | 85 (1.5%) |
| $50,000 to $74,999 | 376 (19.3%) | 159 (2.9%) |
| $75,000 to $99,999 | 128 (6.6%) | 516 (9.3%) |
| $100,000 to $149,999 | 408 (20.9%) | 826 (14.9%) |
| $150,000 or more | 556 (28.5%) | 1,766 (32.0%) |
| Total | 1,951 (100.0%) | 5,525 (100.0%) |
Property Value to Household Income Ratio in Brownsburg
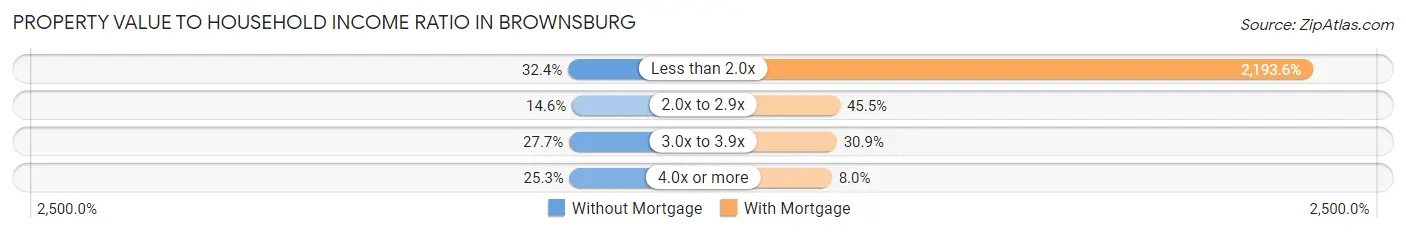
| Value-to-Income Ratio | Without Mortgage | With Mortgage |
| Less than 2.0x | 633 (32.4%) | 121,194 (2,193.6%) |
| 2.0x to 2.9x | 284 (14.6%) | 2,513 (45.5%) |
| 3.0x to 3.9x | 541 (27.7%) | 1,706 (30.9%) |
| 4.0x or more | 493 (25.3%) | 442 (8.0%) |
| Total | 1,951 (100.0%) | 5,525 (100.0%) |
Real Estate Taxes by Mortgage Status in Brownsburg
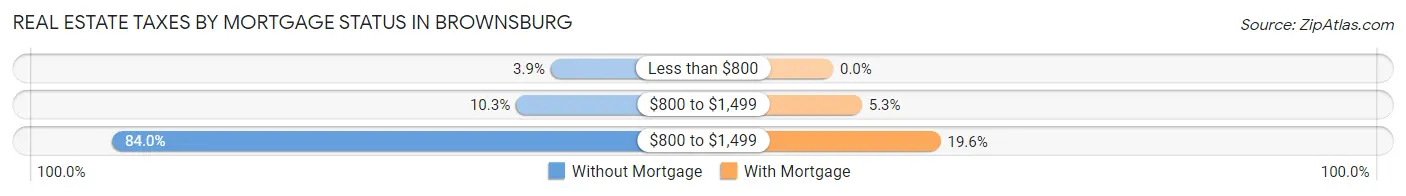
| Property Taxes | Without Mortgage | With Mortgage |
| Less than $800 | 76 (3.9%) | 0 (0.0%) |
| $800 to $1,499 | 200 (10.2%) | 290 (5.2%) |
| $800 to $1,499 | 1,639 (84.0%) | 1,085 (19.6%) |
| Total | 1,951 (100.0%) | 5,525 (100.0%) |
Health & Disability in Brownsburg
Health Insurance Coverage by Age in Brownsburg
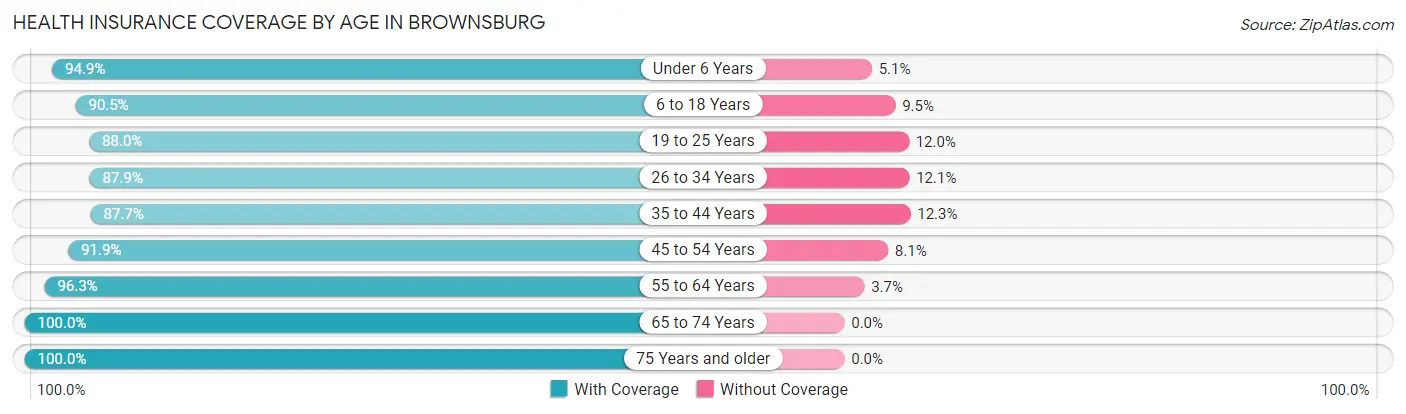
| Age Bracket | With Coverage | Without Coverage |
| Under 6 Years | 2,001 (94.9%) | 108 (5.1%) |
| 6 to 18 Years | 6,056 (90.5%) | 635 (9.5%) |
| 19 to 25 Years | 1,663 (88.0%) | 227 (12.0%) |
| 26 to 34 Years | 3,192 (87.9%) | 440 (12.1%) |
| 35 to 44 Years | 3,971 (87.7%) | 557 (12.3%) |
| 45 to 54 Years | 3,414 (91.9%) | 302 (8.1%) |
| 55 to 64 Years | 3,040 (96.3%) | 117 (3.7%) |
| 65 to 74 Years | 2,079 (100.0%) | 0 (0.0%) |
| 75 Years and older | 1,299 (100.0%) | 0 (0.0%) |
| Total | 26,715 (91.8%) | 2,386 (8.2%) |
Health Insurance Coverage by Citizenship Status in Brownsburg
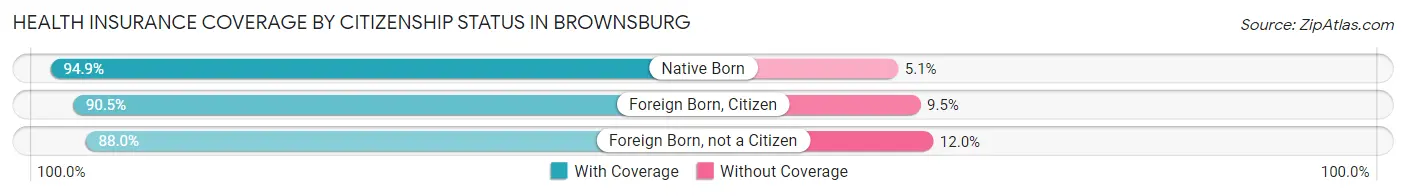
| Citizenship Status | With Coverage | Without Coverage |
| Native Born | 2,001 (94.9%) | 108 (5.1%) |
| Foreign Born, Citizen | 6,056 (90.5%) | 635 (9.5%) |
| Foreign Born, not a Citizen | 1,663 (88.0%) | 227 (12.0%) |
Health Insurance Coverage by Household Income in Brownsburg
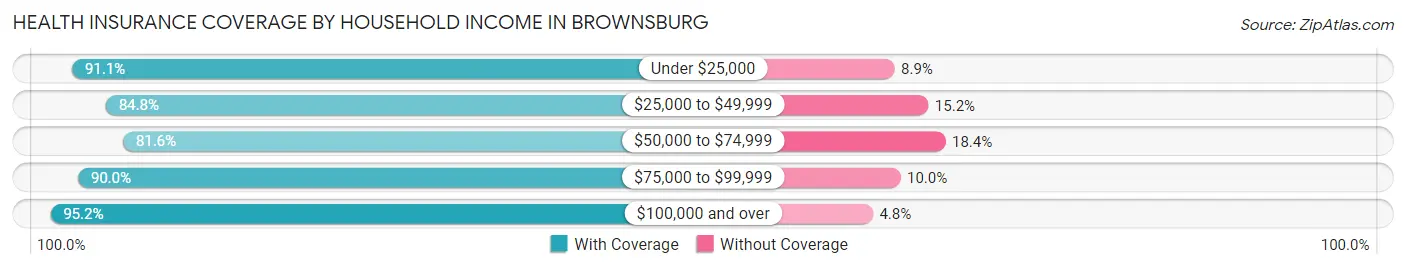
| Household Income | With Coverage | Without Coverage |
| Under $25,000 | 1,819 (91.1%) | 177 (8.9%) |
| $25,000 to $49,999 | 1,858 (84.8%) | 333 (15.2%) |
| $50,000 to $74,999 | 2,917 (81.6%) | 658 (18.4%) |
| $75,000 to $99,999 | 3,341 (90.0%) | 370 (10.0%) |
| $100,000 and over | 16,771 (95.2%) | 848 (4.8%) |
Public vs Private Health Insurance Coverage by Age in Brownsburg
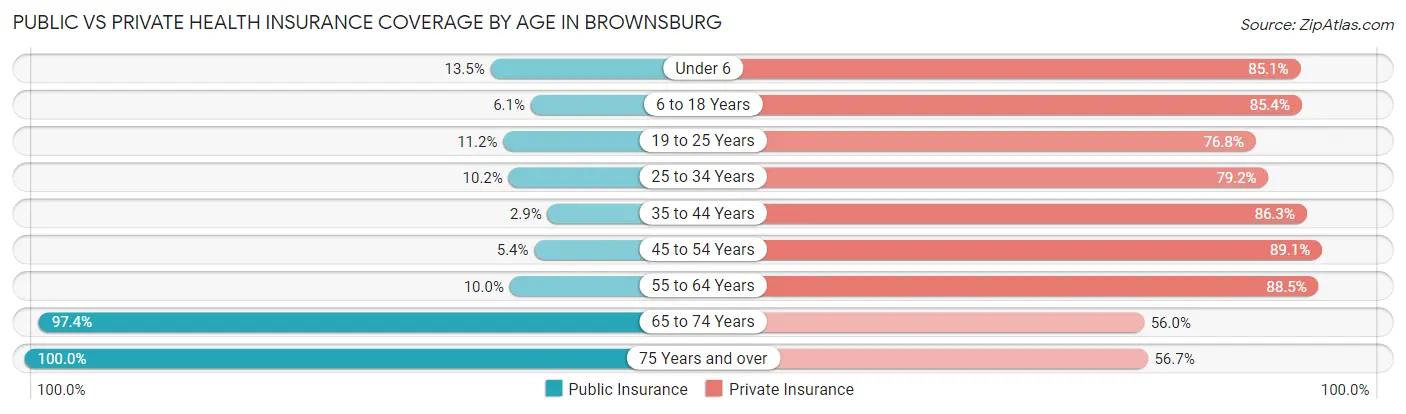
| Age Bracket | Public Insurance | Private Insurance |
| Under 6 | 285 (13.5%) | 1,795 (85.1%) |
| 6 to 18 Years | 405 (6.0%) | 5,713 (85.4%) |
| 19 to 25 Years | 211 (11.2%) | 1,452 (76.8%) |
| 25 to 34 Years | 369 (10.2%) | 2,876 (79.2%) |
| 35 to 44 Years | 133 (2.9%) | 3,908 (86.3%) |
| 45 to 54 Years | 200 (5.4%) | 3,312 (89.1%) |
| 55 to 64 Years | 314 (10.0%) | 2,794 (88.5%) |
| 65 to 74 Years | 2,024 (97.4%) | 1,165 (56.0%) |
| 75 Years and over | 1,299 (100.0%) | 737 (56.7%) |
| Total | 5,240 (18.0%) | 23,752 (81.6%) |
Disability Status by Sex by Age in Brownsburg
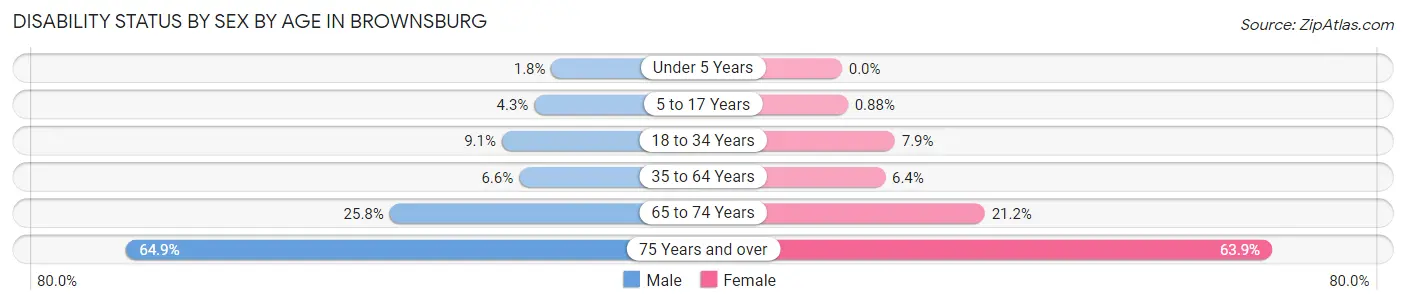
| Age Bracket | Male | Female |
| Under 5 Years | 16 (1.8%) | 0 (0.0%) |
| 5 to 17 Years | 168 (4.3%) | 24 (0.9%) |
| 18 to 34 Years | 284 (9.1%) | 237 (7.9%) |
| 35 to 64 Years | 366 (6.6%) | 375 (6.4%) |
| 65 to 74 Years | 241 (25.8%) | 243 (21.2%) |
| 75 Years and over | 340 (64.9%) | 495 (63.9%) |
Disability Class by Sex by Age in Brownsburg
Disability Class: Hearing Difficulty
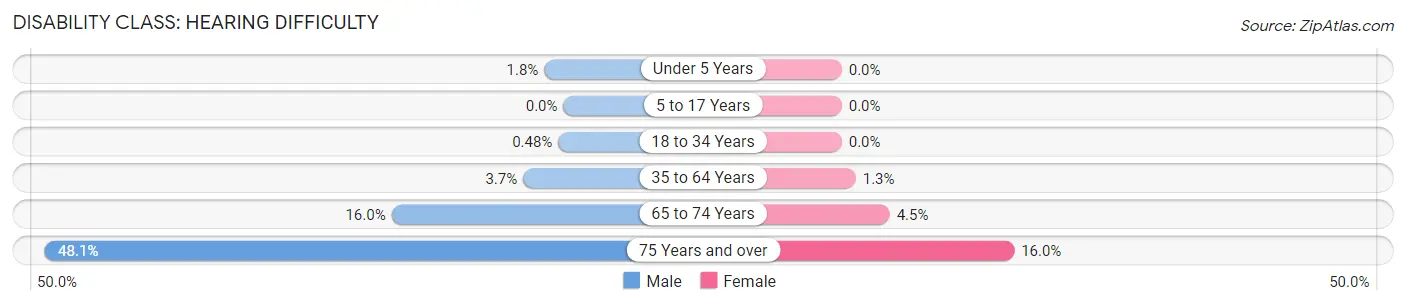
| Age Bracket | Male | Female |
| Under 5 Years | 16 (1.8%) | 0 (0.0%) |
| 5 to 17 Years | 0 (0.0%) | 0 (0.0%) |
| 18 to 34 Years | 15 (0.5%) | 0 (0.0%) |
| 35 to 64 Years | 208 (3.7%) | 76 (1.3%) |
| 65 to 74 Years | 149 (16.0%) | 51 (4.4%) |
| 75 Years and over | 252 (48.1%) | 124 (16.0%) |
Disability Class: Vision Difficulty
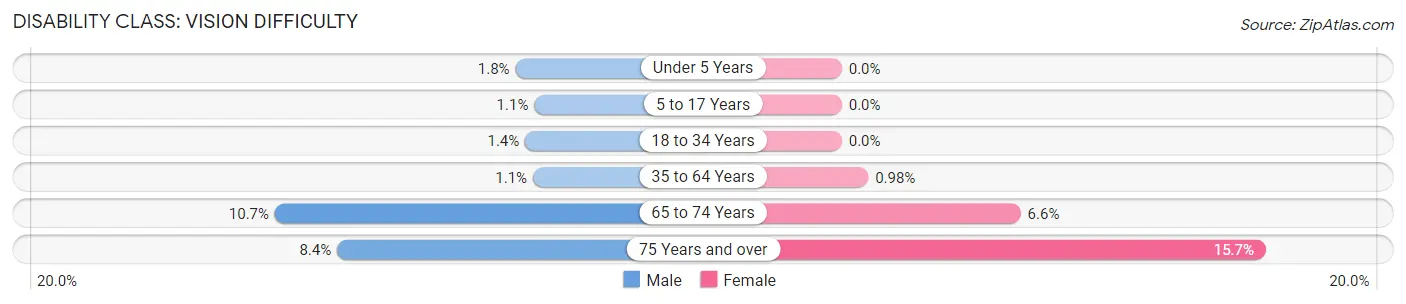
| Age Bracket | Male | Female |
| Under 5 Years | 16 (1.8%) | 0 (0.0%) |
| 5 to 17 Years | 42 (1.1%) | 0 (0.0%) |
| 18 to 34 Years | 44 (1.4%) | 0 (0.0%) |
| 35 to 64 Years | 63 (1.1%) | 57 (1.0%) |
| 65 to 74 Years | 100 (10.7%) | 76 (6.6%) |
| 75 Years and over | 44 (8.4%) | 122 (15.7%) |
Disability Class: Cognitive Difficulty
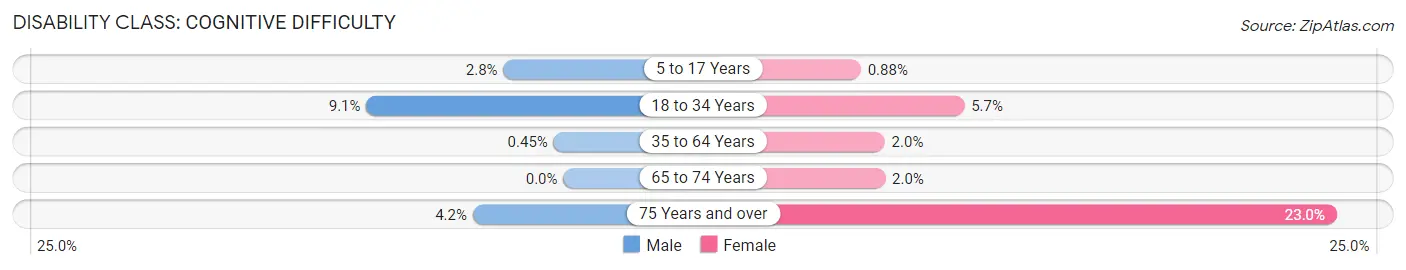
| Age Bracket | Male | Female |
| 5 to 17 Years | 108 (2.8%) | 24 (0.9%) |
| 18 to 34 Years | 284 (9.1%) | 171 (5.7%) |
| 35 to 64 Years | 25 (0.4%) | 116 (2.0%) |
| 65 to 74 Years | 0 (0.0%) | 23 (2.0%) |
| 75 Years and over | 22 (4.2%) | 178 (23.0%) |
Disability Class: Ambulatory Difficulty
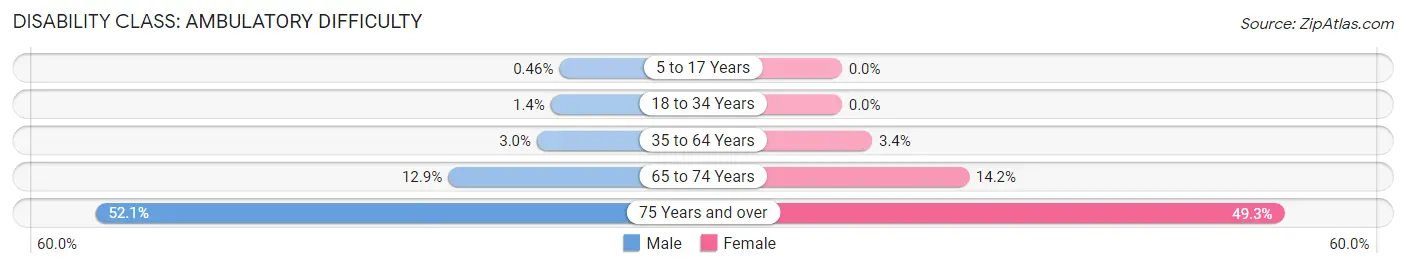
| Age Bracket | Male | Female |
| 5 to 17 Years | 18 (0.5%) | 0 (0.0%) |
| 18 to 34 Years | 44 (1.4%) | 0 (0.0%) |
| 35 to 64 Years | 164 (2.9%) | 197 (3.4%) |
| 65 to 74 Years | 120 (12.9%) | 162 (14.1%) |
| 75 Years and over | 273 (52.1%) | 382 (49.3%) |
Disability Class: Self-Care Difficulty
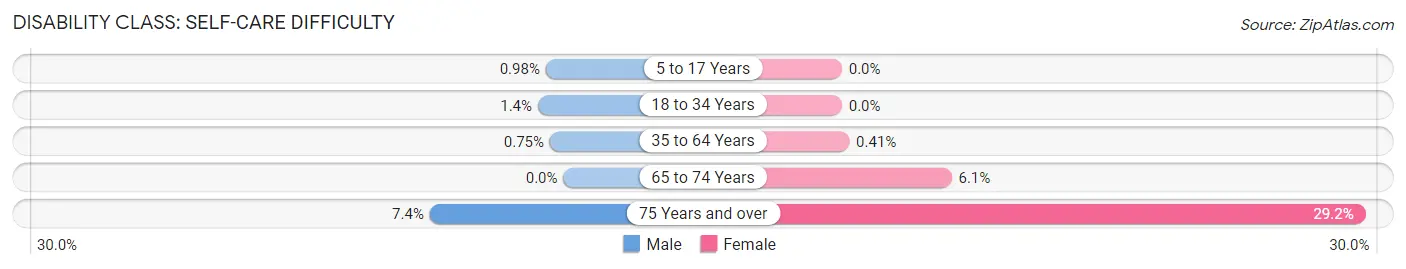
| Age Bracket | Male | Female |
| 5 to 17 Years | 38 (1.0%) | 0 (0.0%) |
| 18 to 34 Years | 44 (1.4%) | 0 (0.0%) |
| 35 to 64 Years | 42 (0.7%) | 24 (0.4%) |
| 65 to 74 Years | 0 (0.0%) | 70 (6.1%) |
| 75 Years and over | 39 (7.4%) | 226 (29.2%) |
Technology Access in Brownsburg
Computing Device Access in Brownsburg
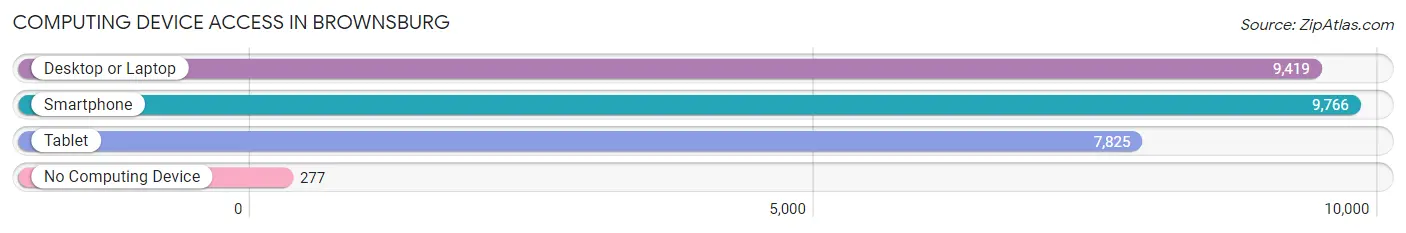
| Device Type | # Households | % Households |
| Desktop or Laptop | 9,419 | 89.8% |
| Smartphone | 9,766 | 93.1% |
| Tablet | 7,825 | 74.6% |
| No Computing Device | 277 | 2.6% |
| Total | 10,488 | 100.0% |
Internet Access in Brownsburg
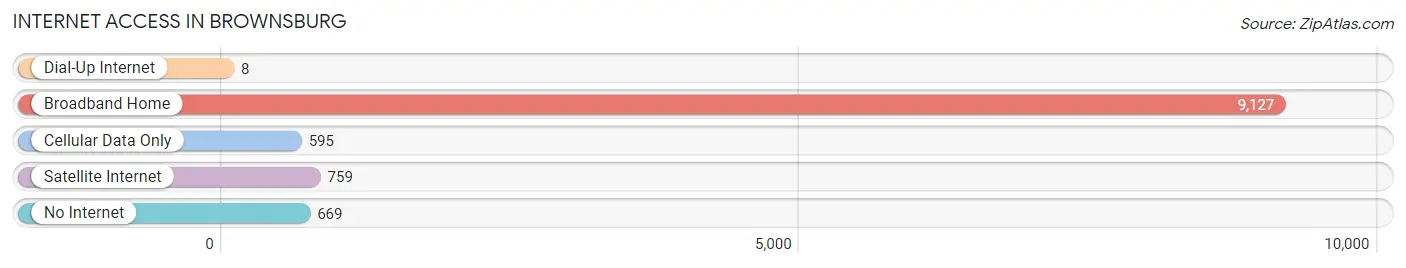
| Internet Type | # Households | % Households |
| Dial-Up Internet | 8 | 0.1% |
| Broadband Home | 9,127 | 87.0% |
| Cellular Data Only | 595 | 5.7% |
| Satellite Internet | 759 | 7.2% |
| No Internet | 669 | 6.4% |
| Total | 10,488 | 100.0% |
Brownsburg Summary
History
Brownsburg, Indiana is a small town located in Hendricks County, just west of Indianapolis. It was founded in 1824 by James B. Brown, who was a veteran of the War of 1812. He purchased the land from the government and named it Brownsburg in honor of his family. The town was officially incorporated in 1837.
In the early days, Brownsburg was a farming community, with the main crops being corn, wheat, and oats. The town also had a few small businesses, such as a blacksmith shop, a general store, and a post office. The first school in Brownsburg was established in 1845.
In the late 19th century, Brownsburg began to grow and develop. The railroad came to town in 1883, and the town was connected to Indianapolis by a trolley line in 1895. This allowed for more people to move to the area and for businesses to open. The town also had a few factories, including a brickyard and a canning factory.
In the early 20th century, Brownsburg continued to grow and develop. The town was connected to Indianapolis by a paved road in 1915, and the first high school was built in 1921. The town also had a few more factories, including a furniture factory and a paper mill.
In the late 20th century, Brownsburg continued to grow and develop. The town was connected to Indianapolis by an interstate highway in the 1970s, and the population grew from 2,000 in 1970 to over 10,000 in 2000. The town also had a few more businesses, including a shopping mall and a movie theater.
Geography
Brownsburg is located in central Indiana, in Hendricks County. It is situated just west of Indianapolis, and is bordered by the towns of Avon, Plainfield, and Danville. The town is located in the White River Valley, and is surrounded by rolling hills and farmland. The town is located at an elevation of 830 feet above sea level.
The climate in Brownsburg is humid continental, with hot summers and cold winters. The average temperature in the summer is around 80 degrees Fahrenheit, and the average temperature in the winter is around 30 degrees Fahrenheit. The town receives an average of 40 inches of precipitation per year.
Economy
The economy of Brownsburg is largely based on manufacturing and services. The town is home to several large companies, including a furniture manufacturer, a paper mill, and a canning factory. The town also has a few smaller businesses, such as restaurants, retail stores, and auto repair shops.
The town is also home to several large employers, including a hospital, a school district, and a state university. The town also has a few smaller employers, such as a golf course, a movie theater, and a shopping mall.
Demographics
As of the 2010 census, the population of Brownsburg was 21,285. The racial makeup of the town was 90.3% White, 4.2% African American, 0.3% Native American, 1.7% Asian, and 2.5% from other races. The median household income was $60,945, and the median family income was $71,945.
The town is home to a large number of families, with the median age being 37. The town also has a large number of young adults, with the median age of those aged 18-24 being 24. The town also has a large number of college-educated residents, with the median age of those with a bachelor's degree or higher being 37.
Common Questions
What is Per Capita Income in Brownsburg?
Per Capita income in Brownsburg is $43,962.
What is the Median Family Income in Brownsburg?
Median Family Income in Brownsburg is $112,663.
What is the Median Household income in Brownsburg?
Median Household Income in Brownsburg is $101,883.
What is Income or Wage Gap in Brownsburg?
Income or Wage Gap in Brownsburg is 27.3%.
Women in Brownsburg earn 72.7 cents for every dollar earned by a man.
What is Inequality or Gini Index in Brownsburg?
Inequality or Gini Index in Brownsburg is 0.38.
What is the Total Population of Brownsburg?
Total Population of Brownsburg is 29,379.
What is the Total Male Population of Brownsburg?
Total Male Population of Brownsburg is 15,041.
What is the Total Female Population of Brownsburg?
Total Female Population of Brownsburg is 14,338.
What is the Ratio of Males per 100 Females in Brownsburg?
There are 104.90 Males per 100 Females in Brownsburg.
What is the Ratio of Females per 100 Males in Brownsburg?
There are 95.33 Females per 100 Males in Brownsburg.
What is the Median Population Age in Brownsburg?
Median Population Age in Brownsburg is 35.7 Years.
What is the Average Family Size in Brownsburg
Average Family Size in Brownsburg is 3.1 People.
What is the Average Household Size in Brownsburg
Average Household Size in Brownsburg is 2.8 People.
How Large is the Labor Force in Brownsburg?
There are 15,878 People in the Labor Forcein in Brownsburg.
What is the Percentage of People in the Labor Force in Brownsburg?
72.5% of People are in the Labor Force in Brownsburg.
What is the Unemployment Rate in Brownsburg?
Unemployment Rate in Brownsburg is 1.2%.