Tonto Basin, AZ Map & Demographics
Tonto Basin Map
Tonto Basin Overview
$28,652
PER CAPITA INCOME
$51,420
AVG FAMILY INCOME
$49,567
AVG HOUSEHOLD INCOME
0.36
INEQUALITY / GINI INDEX
1,380
TOTAL POPULATION
607
MALE POPULATION
773
FEMALE POPULATION
78.53
MALES / 100 FEMALES
127.35
FEMALES / 100 MALES
70.5
MEDIAN AGE
2.4
AVG FAMILY SIZE
1.9
AVG HOUSEHOLD SIZE
222
LABOR FORCE [ PEOPLE ]
17.4%
PERCENT IN LABOR FORCE
Tonto Basin Zip Codes
Tonto Basin Area Codes
Income in Tonto Basin
Income Overview in Tonto Basin
Per Capita Income in Tonto Basin is $28,652, while median incomes of families and households are $51,420 and $49,567 respectively.
| Characteristic | Number | Measure |
| Per Capita Income | 1,380 | $28,652 |
| Median Family Income | 407 | $51,420 |
| Mean Family Income | 407 | $63,776 |
| Median Household Income | 746 | $49,567 |
| Mean Household Income | 746 | $53,106 |
| Income Deficit | 407 | $0 |
| Wage / Income Gap (%) | 1,380 | 0.00% |
| Wage / Income Gap ($) | 1,380 | 100.00¢ per $1 |
| Gini / Inequality Index | 1,380 | 0.36 |
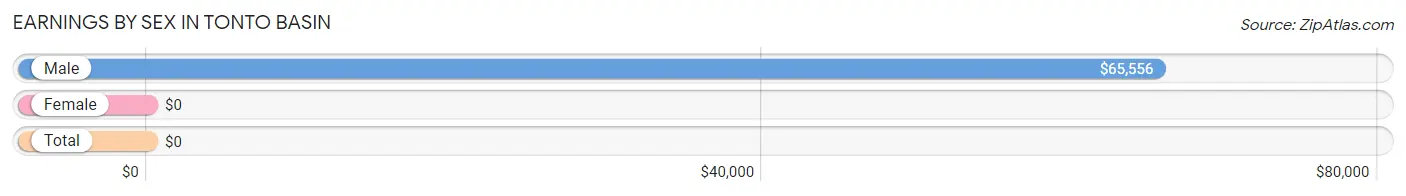
Earnings by Sex in Tonto Basin
| Sex | Number | Average Earnings |
| Male | 98 (44.3%) | $65,556 |
| Female | 123 (55.7%) | $0 |
| Total | 221 (100.0%) | $0 |
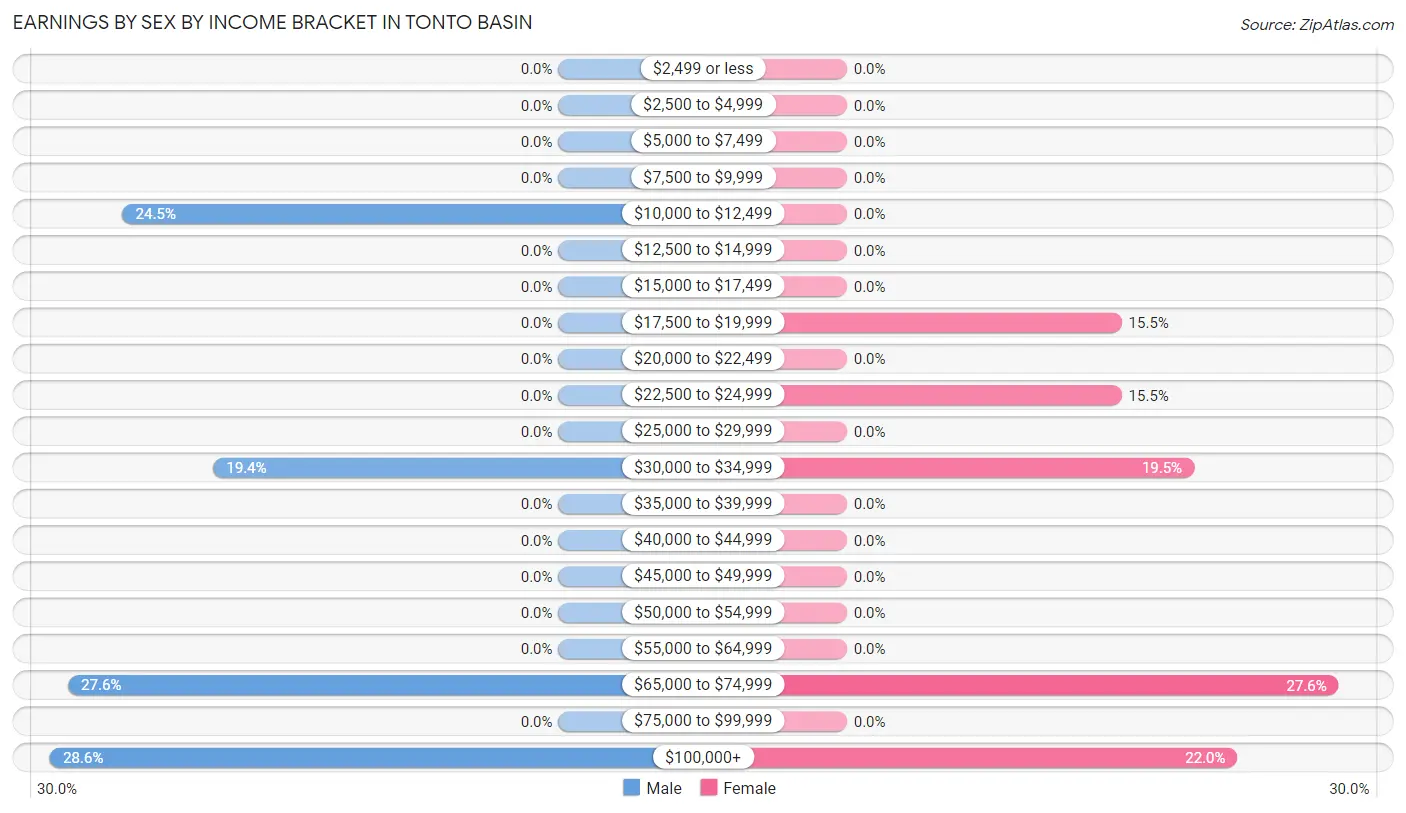
Earnings by Sex by Income Bracket in Tonto Basin
The most common earnings brackets in Tonto Basin are $100,000+ for men (28 | 28.6%) and $65,000 to $74,999 for women (34 | 27.6%).
| Income | Male | Female |
| $2,499 or less | 0 (0.0%) | 0 (0.0%) |
| $2,500 to $4,999 | 0 (0.0%) | 0 (0.0%) |
| $5,000 to $7,499 | 0 (0.0%) | 0 (0.0%) |
| $7,500 to $9,999 | 0 (0.0%) | 0 (0.0%) |
| $10,000 to $12,499 | 24 (24.5%) | 0 (0.0%) |
| $12,500 to $14,999 | 0 (0.0%) | 0 (0.0%) |
| $15,000 to $17,499 | 0 (0.0%) | 0 (0.0%) |
| $17,500 to $19,999 | 0 (0.0%) | 19 (15.4%) |
| $20,000 to $22,499 | 0 (0.0%) | 0 (0.0%) |
| $22,500 to $24,999 | 0 (0.0%) | 19 (15.4%) |
| $25,000 to $29,999 | 0 (0.0%) | 0 (0.0%) |
| $30,000 to $34,999 | 19 (19.4%) | 24 (19.5%) |
| $35,000 to $39,999 | 0 (0.0%) | 0 (0.0%) |
| $40,000 to $44,999 | 0 (0.0%) | 0 (0.0%) |
| $45,000 to $49,999 | 0 (0.0%) | 0 (0.0%) |
| $50,000 to $54,999 | 0 (0.0%) | 0 (0.0%) |
| $55,000 to $64,999 | 0 (0.0%) | 0 (0.0%) |
| $65,000 to $74,999 | 27 (27.6%) | 34 (27.6%) |
| $75,000 to $99,999 | 0 (0.0%) | 0 (0.0%) |
| $100,000+ | 28 (28.6%) | 27 (22.0%) |
| Total | 98 (100.0%) | 123 (100.0%) |
Earnings by Sex by Educational Attainment in Tonto Basin
| Educational Attainment | Male Income | Female Income |
| Less than High School | - | - |
| High School Diploma | - | - |
| College or Associate's Degree | - | - |
| Bachelor's Degree | - | - |
| Graduate Degree | - | - |
| Total | - | - |
Family Income in Tonto Basin
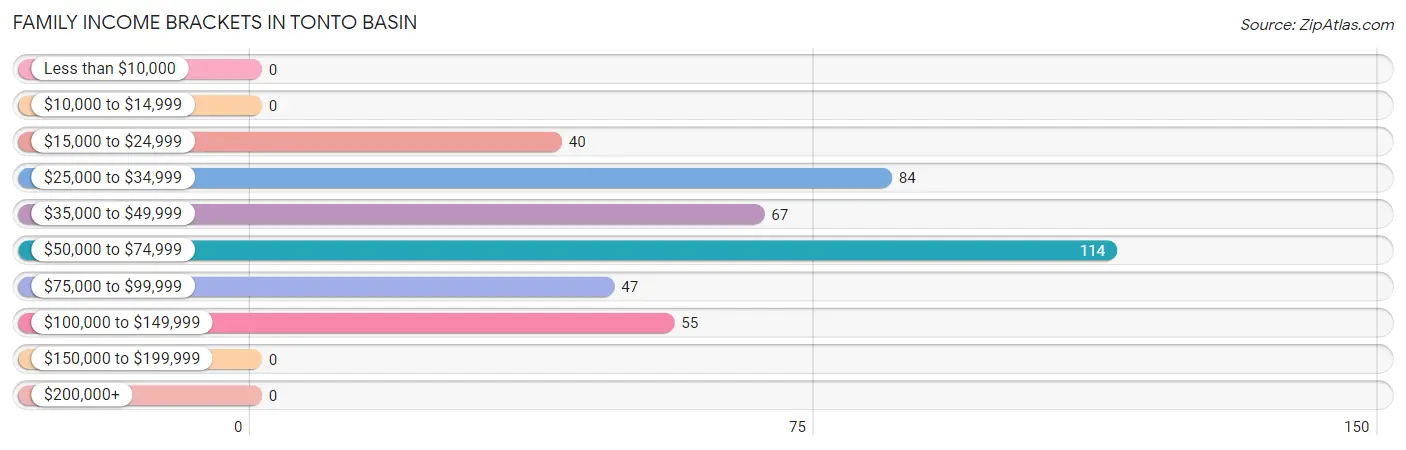
Family Income Brackets in Tonto Basin
According to the Tonto Basin family income data, there are 114 families falling into the $50,000 to $74,999 income range, which is the most common income bracket and makes up 28.0% of all families.
| Income Bracket | # Families | % Families |
| Less than $10,000 | 0 | 0.0% |
| $10,000 to $14,999 | 0 | 0.0% |
| $15,000 to $24,999 | 40 | 9.8% |
| $25,000 to $34,999 | 84 | 20.6% |
| $35,000 to $49,999 | 67 | 16.5% |
| $50,000 to $74,999 | 114 | 28.0% |
| $75,000 to $99,999 | 47 | 11.5% |
| $100,000 to $149,999 | 55 | 13.5% |
| $150,000 to $199,999 | 0 | 0.0% |
| $200,000+ | 0 | 0.0% |
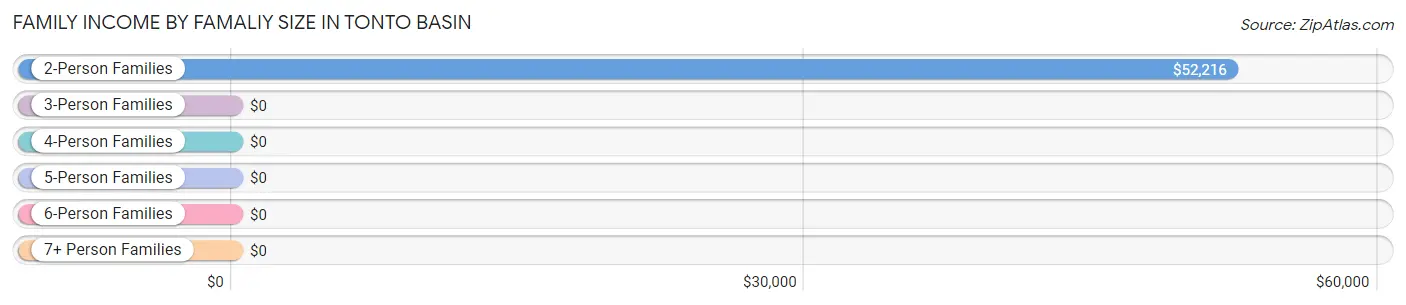
Family Income by Famaliy Size in Tonto Basin
2-person families (339 | 83.3%) account for the highest median family income in Tonto Basin with $52,216 per family, while 2-person families (339 | 83.3%) have the highest median income of $26,108 per family member.
| Income Bracket | # Families | Median Income |
| 2-Person Families | 339 (83.3%) | $52,216 |
| 3-Person Families | 41 (10.1%) | $0 |
| 4-Person Families | 0 (0.0%) | $0 |
| 5-Person Families | 0 (0.0%) | $0 |
| 6-Person Families | 27 (6.6%) | $0 |
| 7+ Person Families | 0 (0.0%) | $0 |
| Total | 407 (100.0%) | $51,420 |
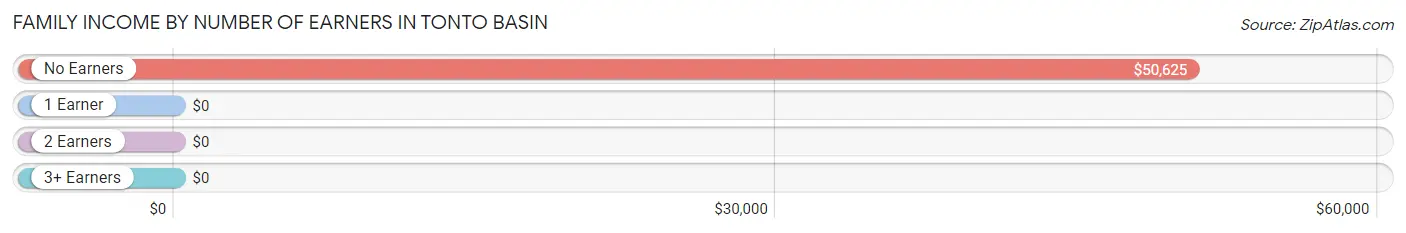
Family Income by Number of Earners in Tonto Basin
| Number of Earners | # Families | Median Income |
| No Earners | 311 (76.4%) | $50,625 |
| 1 Earner | 41 (10.1%) | $0 |
| 2 Earners | 28 (6.9%) | $0 |
| 3+ Earners | 27 (6.6%) | $0 |
| Total | 407 (100.0%) | $51,420 |
Household Income in Tonto Basin
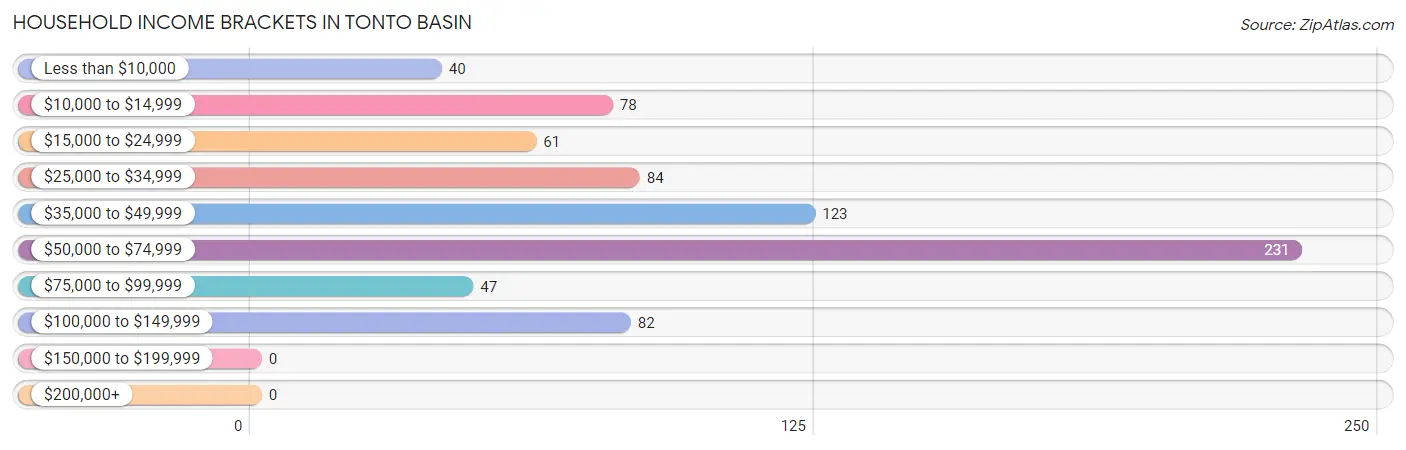
Household Income Brackets in Tonto Basin
With 231 households falling in the category, the $50,000 to $74,999 income range is the most frequent in Tonto Basin, accounting for 31.0% of all households.
| Income Bracket | # Households | % Households |
| Less than $10,000 | 40 | 5.4% |
| $10,000 to $14,999 | 78 | 10.5% |
| $15,000 to $24,999 | 61 | 8.2% |
| $25,000 to $34,999 | 84 | 11.3% |
| $35,000 to $49,999 | 123 | 16.5% |
| $50,000 to $74,999 | 231 | 31.0% |
| $75,000 to $99,999 | 47 | 6.3% |
| $100,000 to $149,999 | 82 | 11.0% |
| $150,000 to $199,999 | 0 | 0.0% |
| $200,000+ | 0 | 0.0% |
Household Income by Householder Age in Tonto Basin
The median household income in Tonto Basin is $49,567, with the highest median household income of $48,821 found in the 65+ years age bracket for the primary householder. A total of 566 households (75.9%) fall into this category.
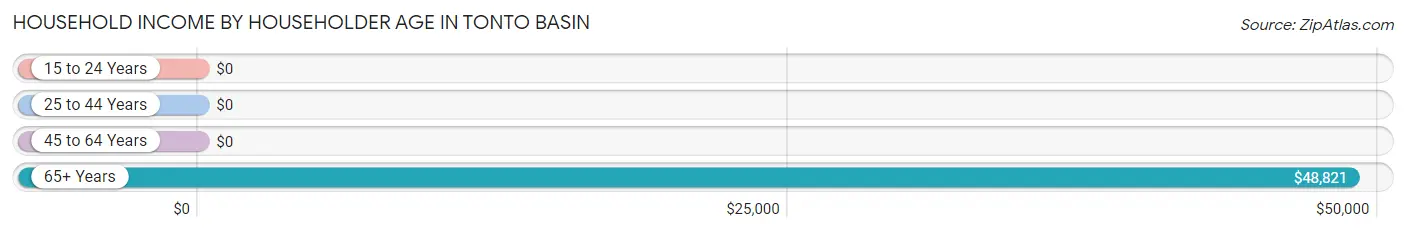
| Income Bracket | # Households | Median Income |
| 15 to 24 Years | 0 (0.0%) | $0 |
| 25 to 44 Years | 68 (9.1%) | $0 |
| 45 to 64 Years | 112 (15.0%) | $0 |
| 65+ Years | 566 (75.9%) | $48,821 |
| Total | 746 (100.0%) | $49,567 |
Poverty in Tonto Basin
Income Below Poverty by Sex and Age in Tonto Basin
With 10.5% poverty level for males and 23.4% for females among the residents of Tonto Basin, 35 to 44 year old males and 5 year old females are the most vulnerable to poverty, with 25 males (33.8%) and 19 females (100.0%) in their respective age groups living below the poverty level.
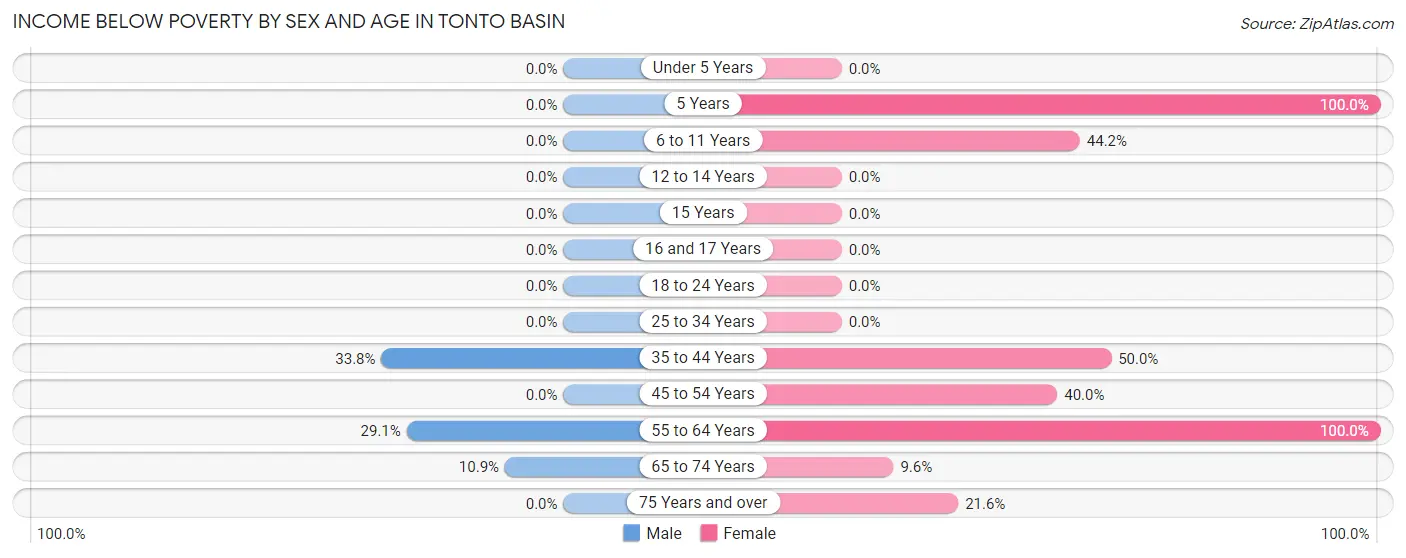
| Age Bracket | Male | Female |
| Under 5 Years | 0 (0.0%) | 0 (0.0%) |
| 5 Years | 0 (0.0%) | 19 (100.0%) |
| 6 to 11 Years | 0 (0.0%) | 19 (44.2%) |
| 12 to 14 Years | 0 (0.0%) | 0 (0.0%) |
| 15 Years | 0 (0.0%) | 0 (0.0%) |
| 16 and 17 Years | 0 (0.0%) | 0 (0.0%) |
| 18 to 24 Years | 0 (0.0%) | 0 (0.0%) |
| 25 to 34 Years | 0 (0.0%) | 0 (0.0%) |
| 35 to 44 Years | 25 (33.8%) | 19 (50.0%) |
| 45 to 54 Years | 0 (0.0%) | 18 (40.0%) |
| 55 to 64 Years | 16 (29.1%) | 37 (100.0%) |
| 65 to 74 Years | 23 (10.8%) | 26 (9.6%) |
| 75 Years and over | 0 (0.0%) | 43 (21.6%) |
| Total | 64 (10.5%) | 181 (23.4%) |
Income Above Poverty by Sex and Age in Tonto Basin
According to the poverty statistics in Tonto Basin, males aged 16 and 17 years and females aged 12 to 14 years are the age groups that are most secure financially, with 100.0% of males and 100.0% of females in these age groups living above the poverty line.
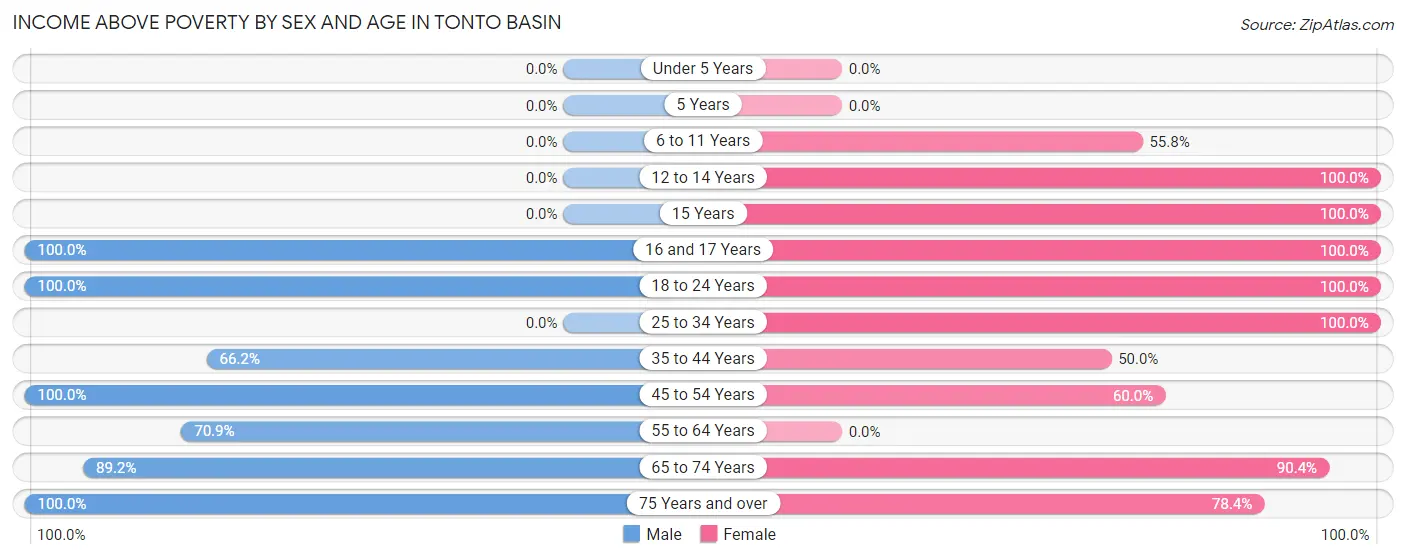
| Age Bracket | Male | Female |
| Under 5 Years | 0 (0.0%) | 0 (0.0%) |
| 5 Years | 0 (0.0%) | 0 (0.0%) |
| 6 to 11 Years | 0 (0.0%) | 24 (55.8%) |
| 12 to 14 Years | 0 (0.0%) | 23 (100.0%) |
| 15 Years | 0 (0.0%) | 22 (100.0%) |
| 16 and 17 Years | 24 (100.0%) | 18 (100.0%) |
| 18 to 24 Years | 19 (100.0%) | 24 (100.0%) |
| 25 to 34 Years | 0 (0.0%) | 34 (100.0%) |
| 35 to 44 Years | 49 (66.2%) | 19 (50.0%) |
| 45 to 54 Years | 28 (100.0%) | 27 (60.0%) |
| 55 to 64 Years | 39 (70.9%) | 0 (0.0%) |
| 65 to 74 Years | 189 (89.1%) | 245 (90.4%) |
| 75 Years and over | 195 (100.0%) | 156 (78.4%) |
| Total | 543 (89.5%) | 592 (76.6%) |
Income Below Poverty Among Married-Couple Families in Tonto Basin
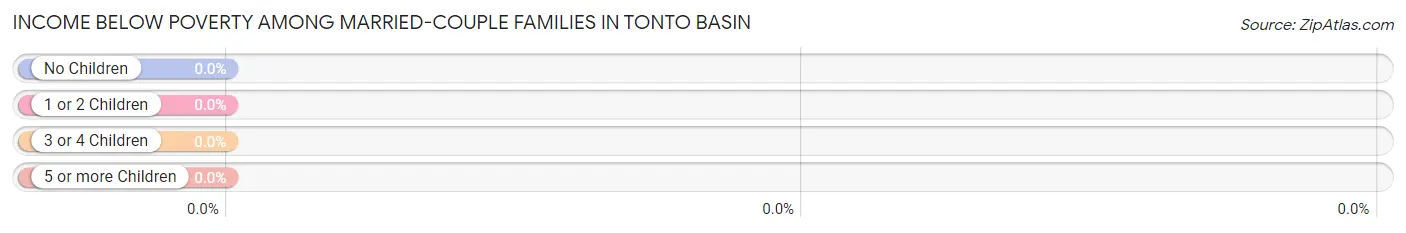
| Children | Above Poverty | Below Poverty |
| No Children | 290 (100.0%) | 0 (0.0%) |
| 1 or 2 Children | 22 (100.0%) | 0 (0.0%) |
| 3 or 4 Children | 27 (100.0%) | 0 (0.0%) |
| 5 or more Children | 0 (0.0%) | 0 (0.0%) |
| Total | 339 (100.0%) | 0 (0.0%) |
Income Below Poverty Among Single-Parent Households in Tonto Basin
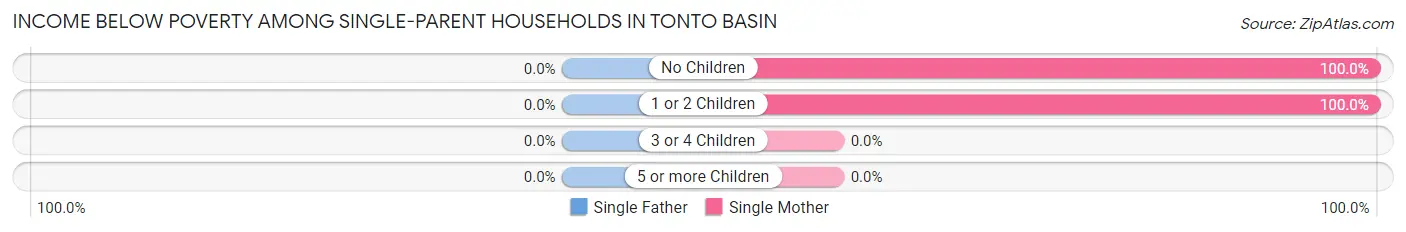
| Children | Single Father | Single Mother |
| No Children | 0 (0.0%) | 21 (100.0%) |
| 1 or 2 Children | 0 (0.0%) | 19 (100.0%) |
| 3 or 4 Children | 0 (0.0%) | 0 (0.0%) |
| 5 or more Children | 0 (0.0%) | 0 (0.0%) |
| Total | 0 (0.0%) | 40 (100.0%) |
Income Below Poverty Among Married-Couple vs Single-Parent Households in Tonto Basin
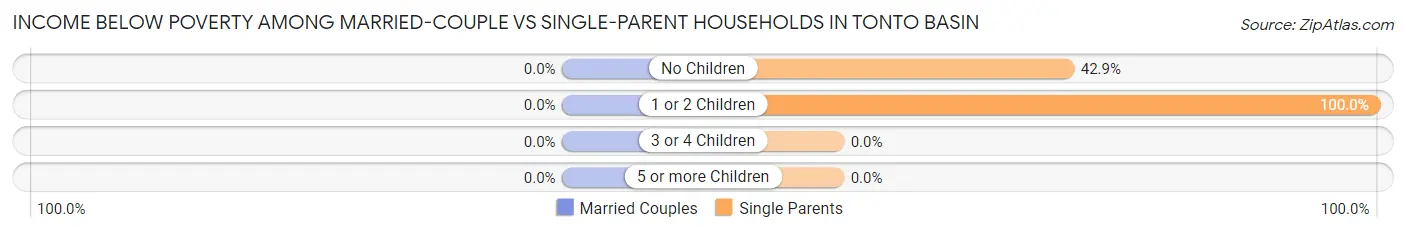
| Children | Married-Couple Families | Single-Parent Households |
| No Children | 0 (0.0%) | 21 (42.9%) |
| 1 or 2 Children | 0 (0.0%) | 19 (100.0%) |
| 3 or 4 Children | 0 (0.0%) | 0 (0.0%) |
| 5 or more Children | 0 (0.0%) | 0 (0.0%) |
| Total | 0 (0.0%) | 40 (58.8%) |
Race in Tonto Basin
The most populous races in Tonto Basin are White / Caucasian (1,354 | 98.1%), and Native / Alaskan (26 | 1.9%).
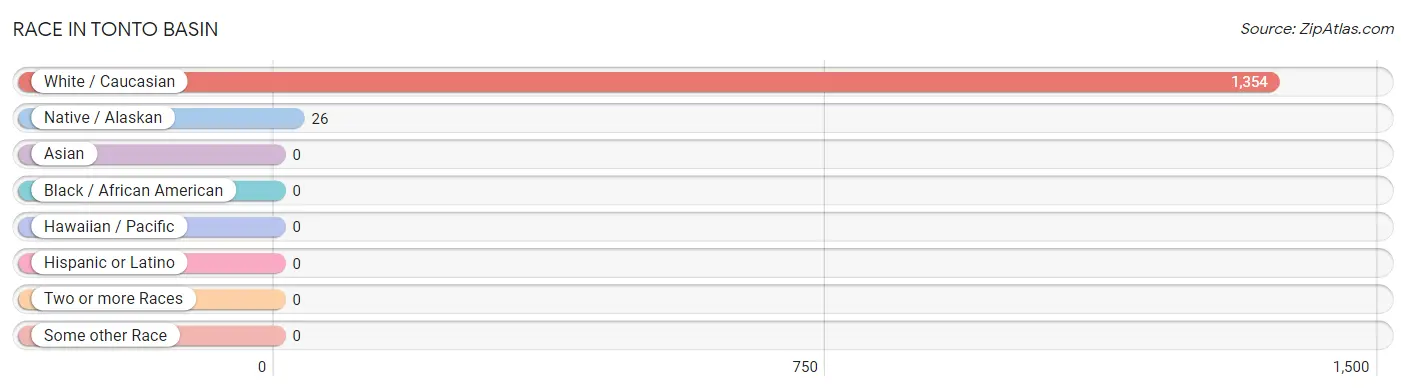
| Race | # Population | % Population |
| Asian | 0 | 0.0% |
| Black / African American | 0 | 0.0% |
| Hawaiian / Pacific | 0 | 0.0% |
| Hispanic or Latino | 0 | 0.0% |
| Native / Alaskan | 26 | 1.9% |
| White / Caucasian | 1,354 | 98.1% |
| Two or more Races | 0 | 0.0% |
| Some other Race | 0 | 0.0% |
| Total | 1,380 | 100.0% |
Ancestry in Tonto Basin
The most populous ancestries reported in Tonto Basin are German (508 | 36.8%), Irish (291 | 21.1%), English (151 | 10.9%), Dutch (90 | 6.5%), and Scottish (81 | 5.9%), together accounting for 81.2% of all Tonto Basin residents.
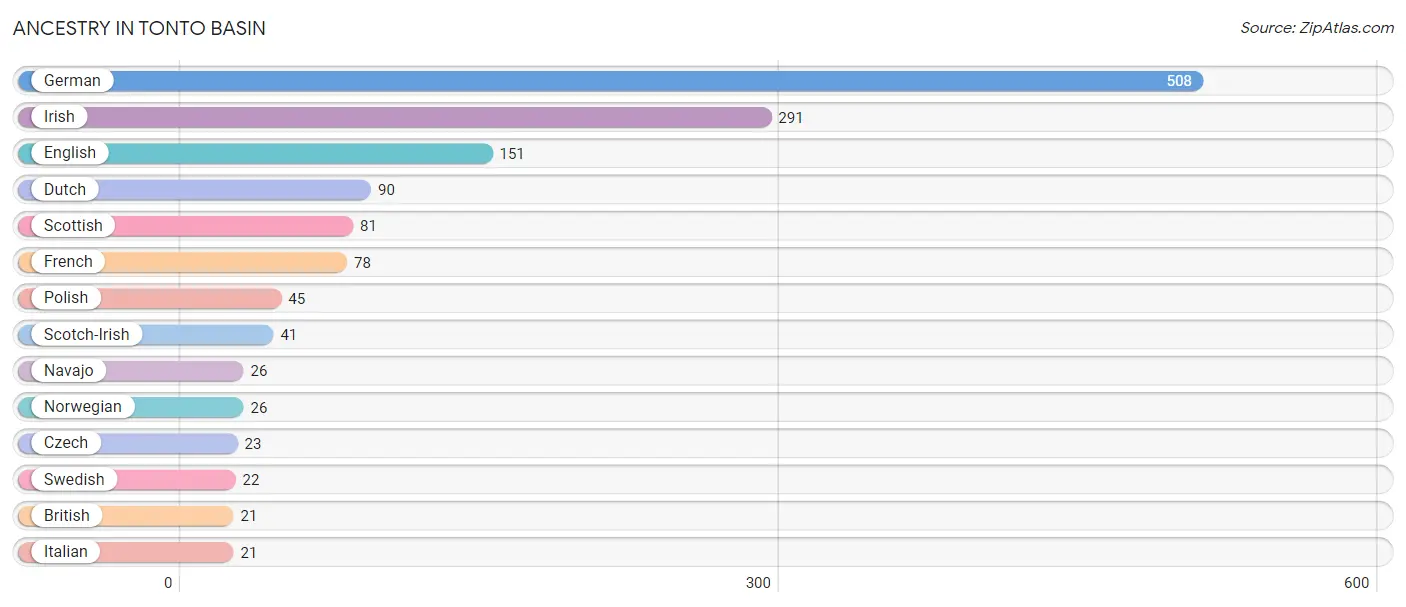
| Ancestry | # Population | % Population |
| British | 21 | 1.5% |
| Czech | 23 | 1.7% |
| Dutch | 90 | 6.5% |
| English | 151 | 10.9% |
| French | 78 | 5.7% |
| German | 508 | 36.8% |
| Irish | 291 | 21.1% |
| Italian | 21 | 1.5% |
| Navajo | 26 | 1.9% |
| Norwegian | 26 | 1.9% |
| Polish | 45 | 3.3% |
| Scotch-Irish | 41 | 3.0% |
| Scottish | 81 | 5.9% |
| Swedish | 22 | 1.6% | View All 14 Rows |
Immigrants in Tonto Basin

| Immigration Origin | # Population | % Population | View All 0 Rows |
Sex and Age in Tonto Basin
Sex and Age in Tonto Basin
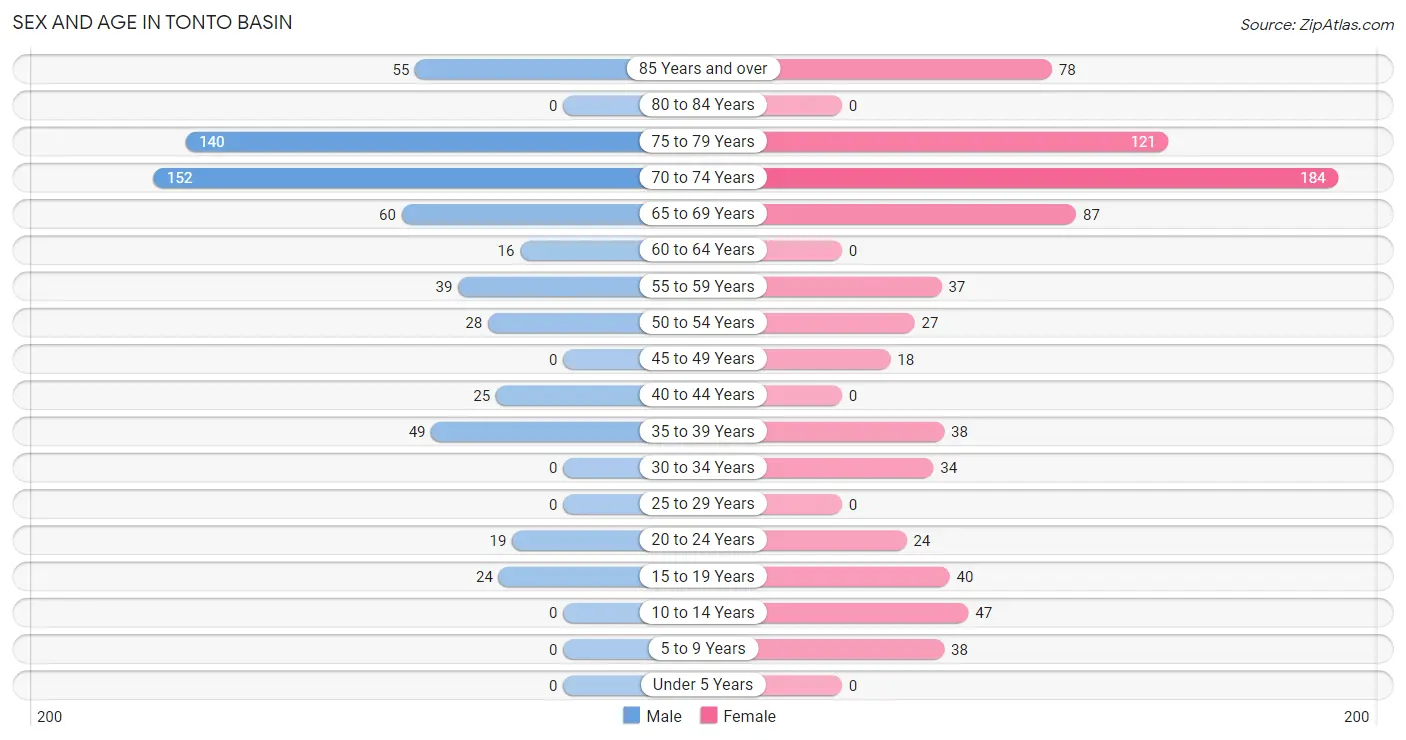
The most populous age groups in Tonto Basin are 70 to 74 Years (152 | 25.0%) for men and 70 to 74 Years (184 | 23.8%) for women.
| Age Bracket | Male | Female |
| Under 5 Years | 0 (0.0%) | 0 (0.0%) |
| 5 to 9 Years | 0 (0.0%) | 38 (4.9%) |
| 10 to 14 Years | 0 (0.0%) | 47 (6.1%) |
| 15 to 19 Years | 24 (4.0%) | 40 (5.2%) |
| 20 to 24 Years | 19 (3.1%) | 24 (3.1%) |
| 25 to 29 Years | 0 (0.0%) | 0 (0.0%) |
| 30 to 34 Years | 0 (0.0%) | 34 (4.4%) |
| 35 to 39 Years | 49 (8.1%) | 38 (4.9%) |
| 40 to 44 Years | 25 (4.1%) | 0 (0.0%) |
| 45 to 49 Years | 0 (0.0%) | 18 (2.3%) |
| 50 to 54 Years | 28 (4.6%) | 27 (3.5%) |
| 55 to 59 Years | 39 (6.4%) | 37 (4.8%) |
| 60 to 64 Years | 16 (2.6%) | 0 (0.0%) |
| 65 to 69 Years | 60 (9.9%) | 87 (11.3%) |
| 70 to 74 Years | 152 (25.0%) | 184 (23.8%) |
| 75 to 79 Years | 140 (23.1%) | 121 (15.7%) |
| 80 to 84 Years | 0 (0.0%) | 0 (0.0%) |
| 85 Years and over | 55 (9.1%) | 78 (10.1%) |
| Total | 607 (100.0%) | 773 (100.0%) |
Families and Households in Tonto Basin
Median Family Size in Tonto Basin
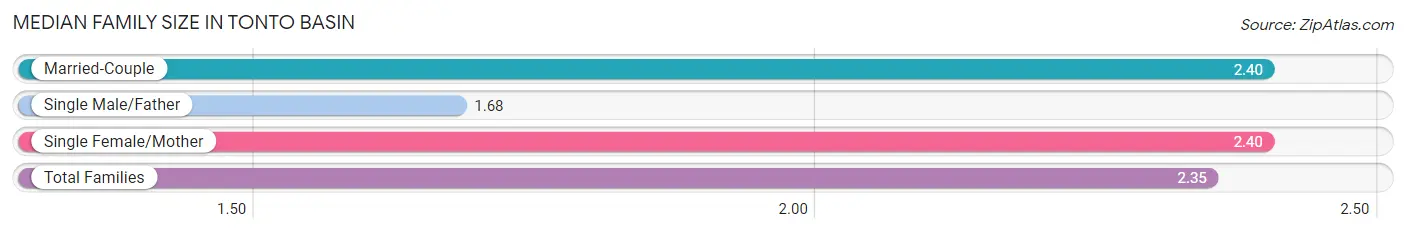
The median family size in Tonto Basin is 2.35 persons per family, with married-couple families (339 | 83.3%) accounting for the largest median family size of 2.4 persons per family. On the other hand, single male/father families (28 | 6.9%) represent the smallest median family size with 1.68 persons per family.
| Family Type | # Families | Family Size |
| Married-Couple | 339 (83.3%) | 2.40 |
| Single Male/Father | 28 (6.9%) | 1.68 |
| Single Female/Mother | 40 (9.8%) | 2.40 |
| Total Families | 407 (100.0%) | 2.35 |
Median Household Size in Tonto Basin
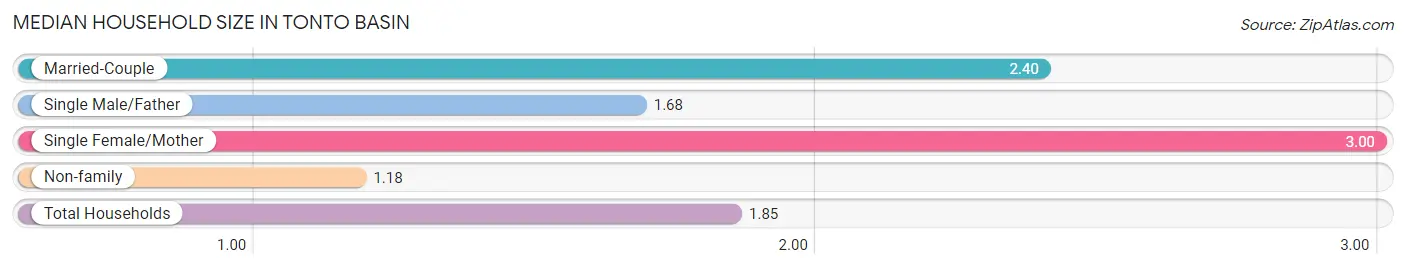
The median household size in Tonto Basin is 1.85 persons per household, with single female/mother households (40 | 5.4%) accounting for the largest median household size of 3 persons per household. non-family households (339 | 45.4%) represent the smallest median household size with 1.18 persons per household.
| Household Type | # Households | Household Size |
| Married-Couple | 339 (45.4%) | 2.40 |
| Single Male/Father | 28 (3.7%) | 1.68 |
| Single Female/Mother | 40 (5.4%) | 3.00 |
| Non-family | 339 (45.4%) | 1.18 |
| Total Households | 746 (100.0%) | 1.85 |
Household Size by Marriage Status in Tonto Basin
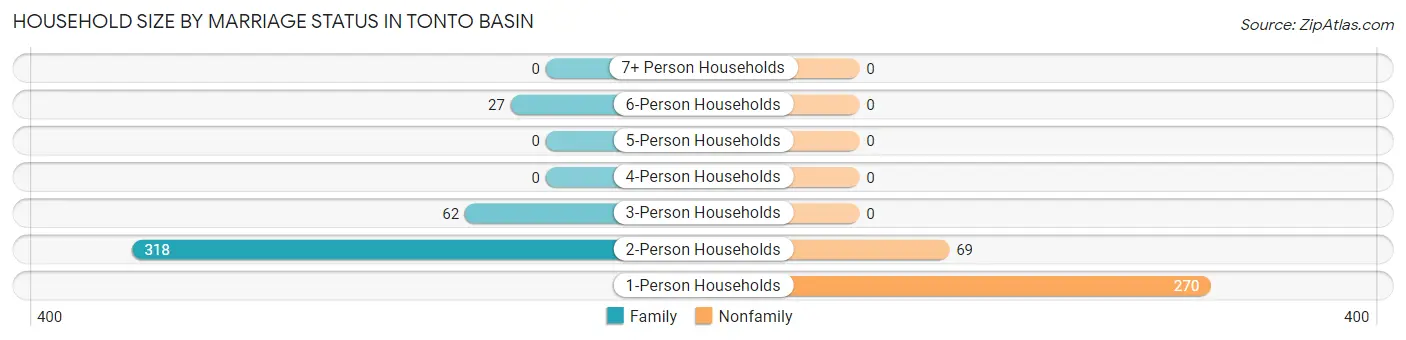
Out of a total of 746 households in Tonto Basin, 407 (54.6%) are family households, while 339 (45.4%) are nonfamily households. The most numerous type of family households are 2-person households, comprising 318, and the most common type of nonfamily households are 1-person households, comprising 270.
| Household Size | Family Households | Nonfamily Households |
| 1-Person Households | - | 270 (36.2%) |
| 2-Person Households | 318 (42.6%) | 69 (9.2%) |
| 3-Person Households | 62 (8.3%) | 0 (0.0%) |
| 4-Person Households | 0 (0.0%) | 0 (0.0%) |
| 5-Person Households | 0 (0.0%) | 0 (0.0%) |
| 6-Person Households | 27 (3.6%) | 0 (0.0%) |
| 7+ Person Households | 0 (0.0%) | 0 (0.0%) |
| Total | 407 (54.6%) | 339 (45.4%) |
Female Fertility in Tonto Basin
Fertility by Age in Tonto Basin
| Age Bracket | Women with Births | Births / 1,000 Women |
| 15 to 19 years | 0 (0.0%) | 0.0 |
| 20 to 34 years | 0 (0.0%) | 0.0 |
| 35 to 50 years | 0 (0.0%) | 0.0 |
| Total | 0 (0.0%) | 0.0 |
Fertility by Age by Marriage Status in Tonto Basin
| Age Bracket | Married | Unmarried |
| 15 to 19 years | 0 (0.0%) | 0 (0.0%) |
| 20 to 34 years | 0 (0.0%) | 0 (0.0%) |
| 35 to 50 years | 0 (0.0%) | 0 (0.0%) |
| Total | 0 (0.0%) | 0 (0.0%) |
Fertility by Education in Tonto Basin
| Educational Attainment | Women with Births | Births / 1,000 Women |
| Less than High School | 0 (0.0%) | 0.0 |
| High School Diploma | 0 (0.0%) | 0.0 |
| College or Associate's Degree | 0 (0.0%) | 0.0 |
| Bachelor's Degree | 0 (0.0%) | 0.0 |
| Graduate Degree | 0 (0.0%) | 0.0 |
| Total | 0 (0.0%) | 0.0 |
Fertility by Education by Marriage Status in Tonto Basin
| Educational Attainment | Married | Unmarried |
| Less than High School | 0 (0.0%) | 0 (0.0%) |
| High School Diploma | 0 (0.0%) | 0 (0.0%) |
| College or Associate's Degree | 0 (0.0%) | 0 (0.0%) |
| Bachelor's Degree | 0 (0.0%) | 0 (0.0%) |
| Graduate Degree | 0 (0.0%) | 0 (0.0%) |
| Total | 0 (0.0%) | 0 (0.0%) |
Employment Characteristics in Tonto Basin
Employment by Class of Employer in Tonto Basin
Among the 193 employed individuals in Tonto Basin, private company employees (113 | 58.6%), local government employees (46 | 23.8%), and not-for-profit organizations (34 | 17.6%) make up the most common classes of employment.
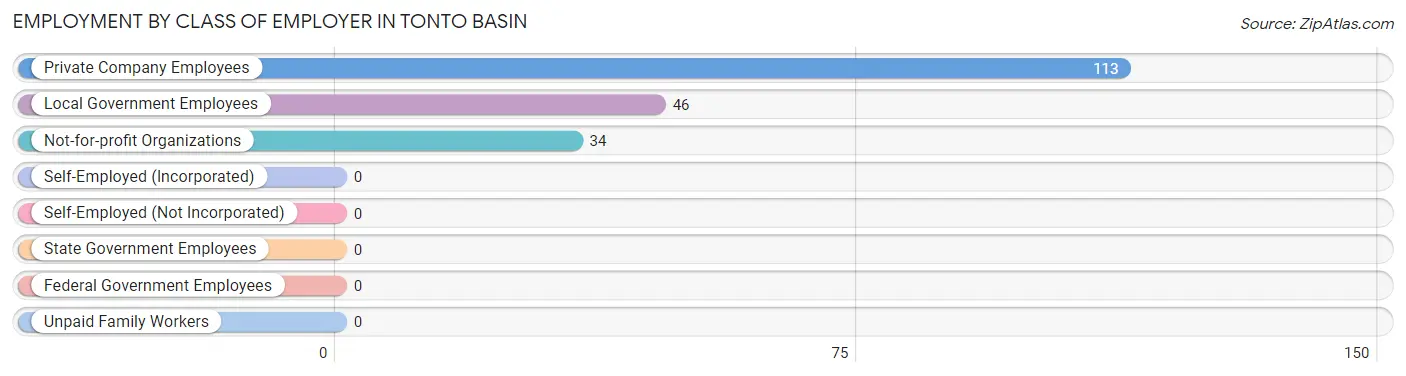
| Employer Class | # Employees | % Employees |
| Private Company Employees | 113 | 58.6% |
| Self-Employed (Incorporated) | 0 | 0.0% |
| Self-Employed (Not Incorporated) | 0 | 0.0% |
| Not-for-profit Organizations | 34 | 17.6% |
| Local Government Employees | 46 | 23.8% |
| State Government Employees | 0 | 0.0% |
| Federal Government Employees | 0 | 0.0% |
| Unpaid Family Workers | 0 | 0.0% |
| Total | 193 | 100.0% |
Employment Status by Age in Tonto Basin
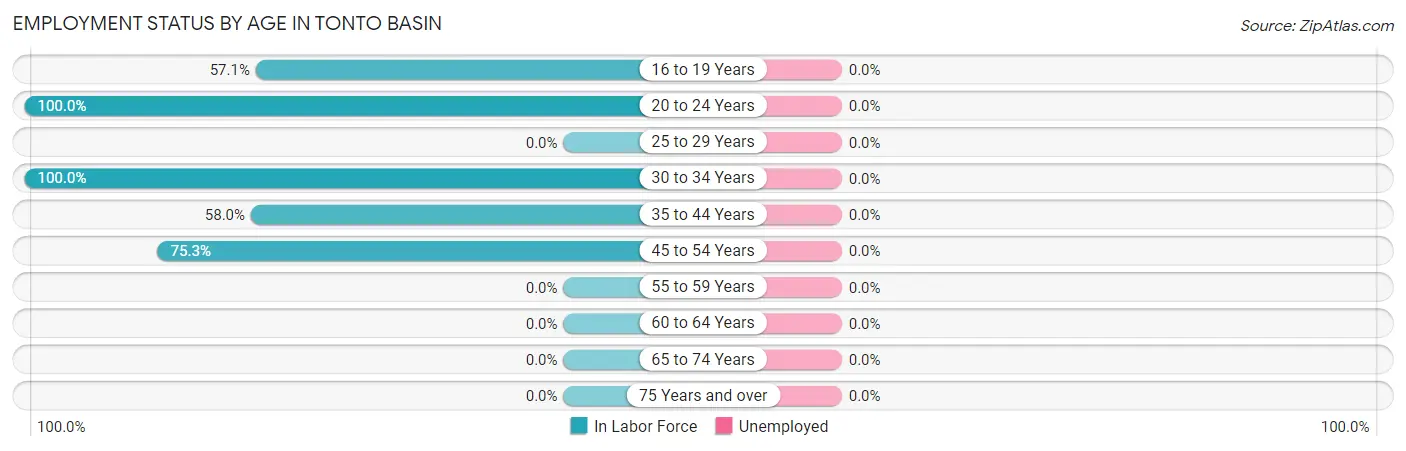
| Age Bracket | In Labor Force | Unemployed |
| 16 to 19 Years | 24 (57.1%) | 0 (0.0%) |
| 20 to 24 Years | 43 (100.0%) | 0 (0.0%) |
| 25 to 29 Years | 0 (0.0%) | 0 (0.0%) |
| 30 to 34 Years | 34 (100.0%) | 0 (0.0%) |
| 35 to 44 Years | 65 (58.0%) | 0 (0.0%) |
| 45 to 54 Years | 55 (75.3%) | 0 (0.0%) |
| 55 to 59 Years | 0 (0.0%) | 0 (0.0%) |
| 60 to 64 Years | 0 (0.0%) | 0 (0.0%) |
| 65 to 74 Years | 0 (0.0%) | 0 (0.0%) |
| 75 Years and over | 0 (0.0%) | 0 (0.0%) |
| Total | 222 (17.4%) | 0 (0.0%) |
Employment Status by Educational Attainment in Tonto Basin
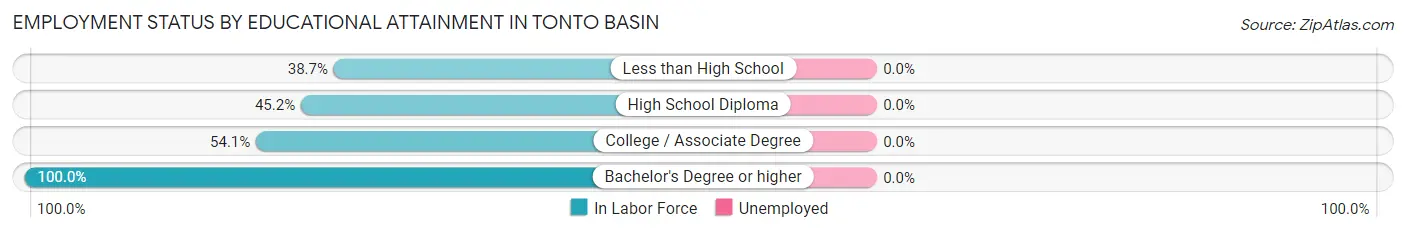
| Educational Attainment | In Labor Force | Unemployed |
| Less than High School | 53 (38.7%) | 0 (0.0%) |
| High School Diploma | 28 (45.2%) | 0 (0.0%) |
| College / Associate Degree | 46 (54.1%) | 0 (0.0%) |
| Bachelor's Degree or higher | 27 (100.0%) | 0 (0.0%) |
| Total | 154 (49.5%) | 0 (0.0%) |
Employment Occupations by Sex in Tonto Basin
Management, Business, Science and Arts Occupations
The most common Management, Business, Science and Arts occupations in Tonto Basin are Management (46 | 20.8%), and Health Diagnosing & Treating (34 | 15.4%).
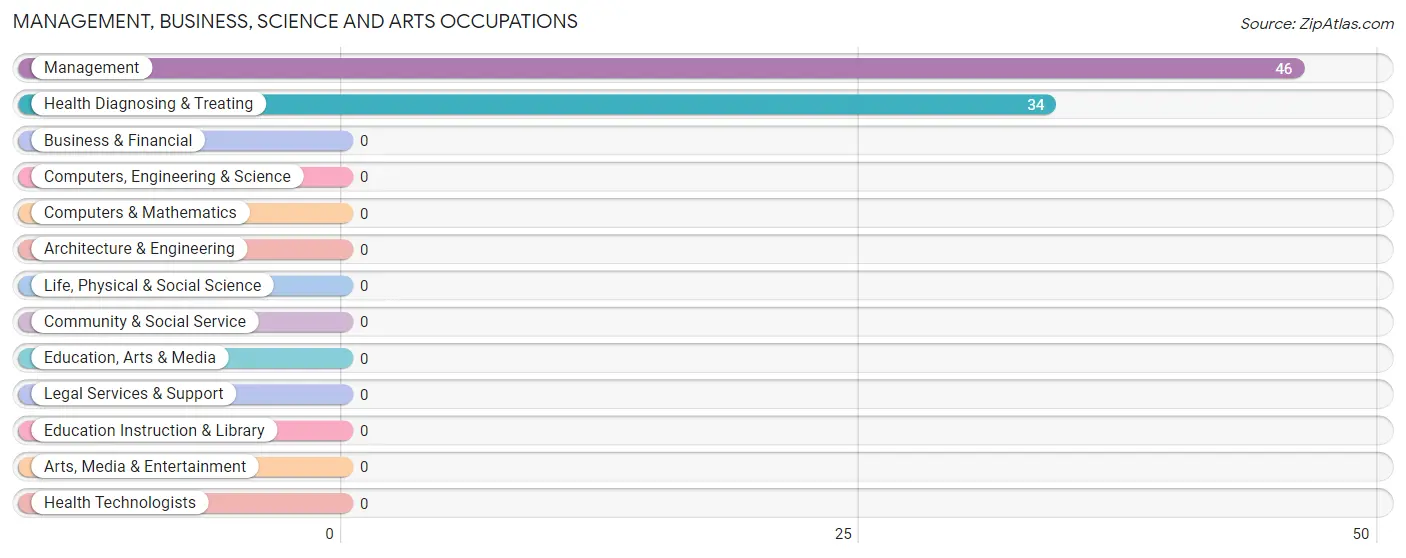
Management, Business, Science and Arts Occupations by Sex
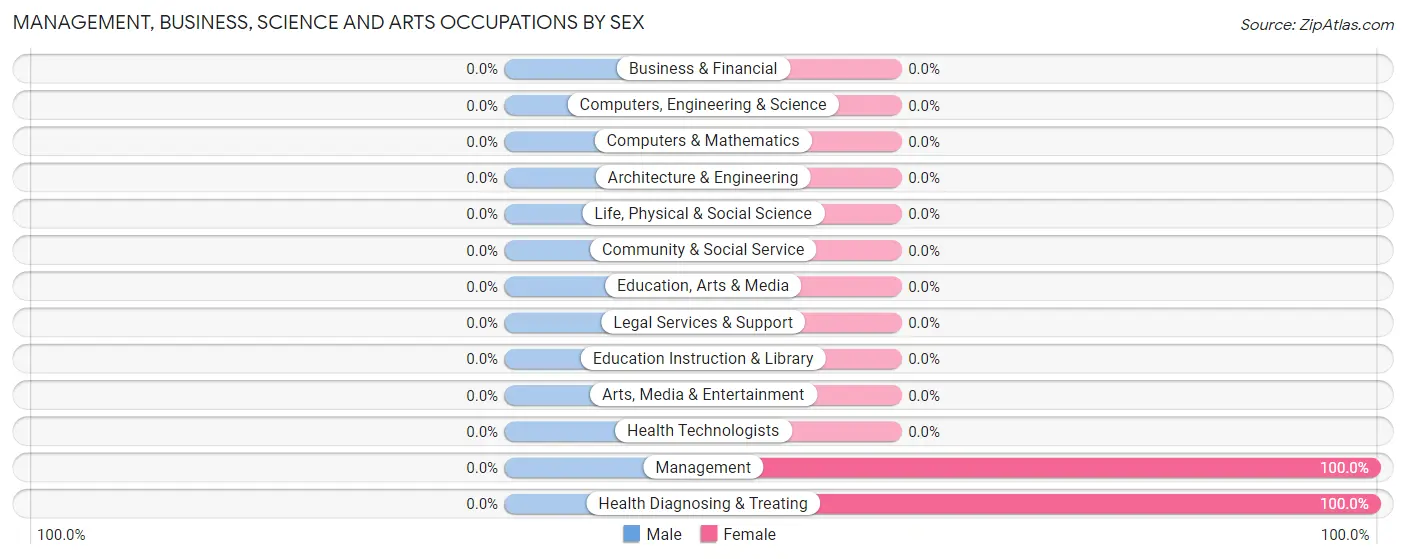
| Occupation | Male | Female |
| Management | 0 (0.0%) | 46 (100.0%) |
| Business & Financial | 0 (0.0%) | 0 (0.0%) |
| Computers, Engineering & Science | 0 (0.0%) | 0 (0.0%) |
| Computers & Mathematics | 0 (0.0%) | 0 (0.0%) |
| Architecture & Engineering | 0 (0.0%) | 0 (0.0%) |
| Life, Physical & Social Science | 0 (0.0%) | 0 (0.0%) |
| Community & Social Service | 0 (0.0%) | 0 (0.0%) |
| Education, Arts & Media | 0 (0.0%) | 0 (0.0%) |
| Legal Services & Support | 0 (0.0%) | 0 (0.0%) |
| Education Instruction & Library | 0 (0.0%) | 0 (0.0%) |
| Arts, Media & Entertainment | 0 (0.0%) | 0 (0.0%) |
| Health Diagnosing & Treating | 0 (0.0%) | 34 (100.0%) |
| Health Technologists | 0 (0.0%) | 0 (0.0%) |
| Total (Category) | 0 (0.0%) | 80 (100.0%) |
| Total (Overall) | 98 (44.3%) | 123 (55.7%) |
Services Occupations
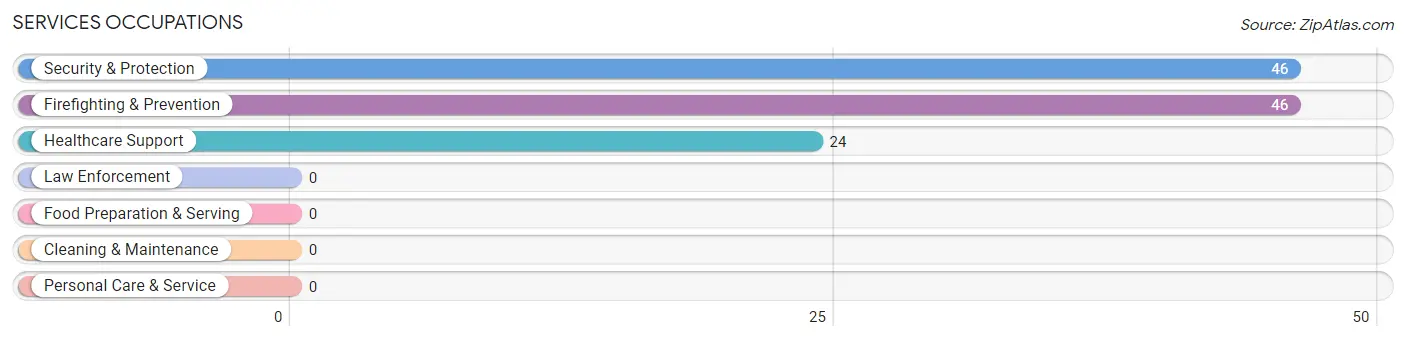
The most common Services occupations in Tonto Basin are Security & Protection (46 | 20.8%), Firefighting & Prevention (46 | 20.8%), and Healthcare Support (24 | 10.9%).
Services Occupations by Sex
Within the Services occupations in Tonto Basin, the most male-oriented occupations are Security & Protection (58.7%), and Firefighting & Prevention (58.7%), while the most female-oriented occupations are Healthcare Support (100.0%), Security & Protection (41.3%), and Firefighting & Prevention (41.3%).
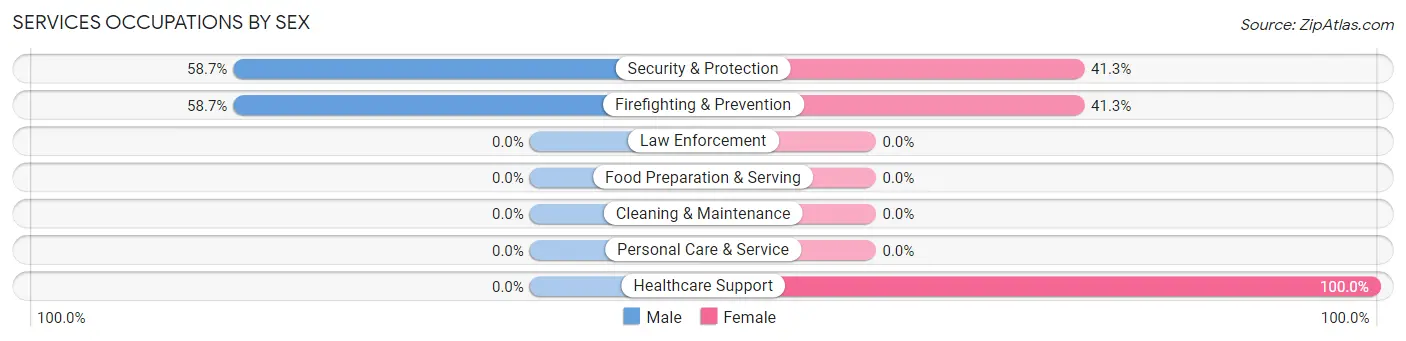
| Occupation | Male | Female |
| Healthcare Support | 0 (0.0%) | 24 (100.0%) |
| Security & Protection | 27 (58.7%) | 19 (41.3%) |
| Firefighting & Prevention | 27 (58.7%) | 19 (41.3%) |
| Law Enforcement | 0 (0.0%) | 0 (0.0%) |
| Food Preparation & Serving | 0 (0.0%) | 0 (0.0%) |
| Cleaning & Maintenance | 0 (0.0%) | 0 (0.0%) |
| Personal Care & Service | 0 (0.0%) | 0 (0.0%) |
| Total (Category) | 27 (38.6%) | 43 (61.4%) |
| Total (Overall) | 98 (44.3%) | 123 (55.7%) |
Sales and Office Occupations
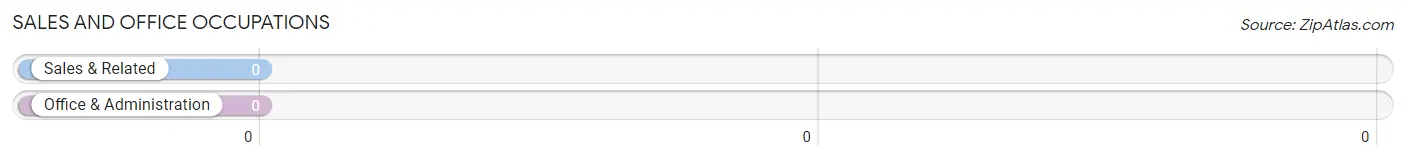
Sales and Office Occupations by Sex
| Occupation | Male | Female |
| Sales & Related | 0 (0.0%) | 0 (0.0%) |
| Office & Administration | 0 (0.0%) | 0 (0.0%) |
| Total (Category) | 0 (0.0%) | 0 (0.0%) |
| Total (Overall) | 98 (44.3%) | 123 (55.7%) |
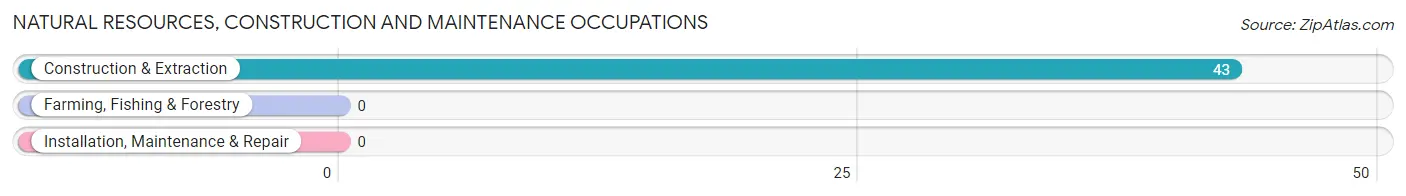
Natural Resources, Construction and Maintenance Occupations
The most common Natural Resources, Construction and Maintenance occupations in Tonto Basin are , and Construction & Extraction (43 | 19.5%).
Natural Resources, Construction and Maintenance Occupations by Sex
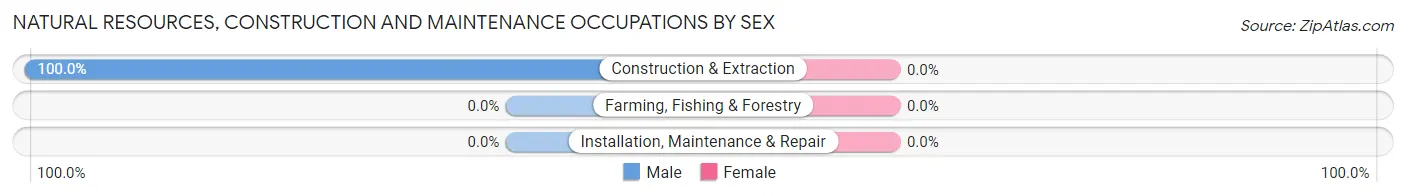
| Occupation | Male | Female |
| Farming, Fishing & Forestry | 0 (0.0%) | 0 (0.0%) |
| Construction & Extraction | 43 (100.0%) | 0 (0.0%) |
| Installation, Maintenance & Repair | 0 (0.0%) | 0 (0.0%) |
| Total (Category) | 43 (100.0%) | 0 (0.0%) |
| Total (Overall) | 98 (44.3%) | 123 (55.7%) |
Production, Transportation and Moving Occupations
The most common Production, Transportation and Moving occupations in Tonto Basin are , and Transportation (28 | 12.7%).
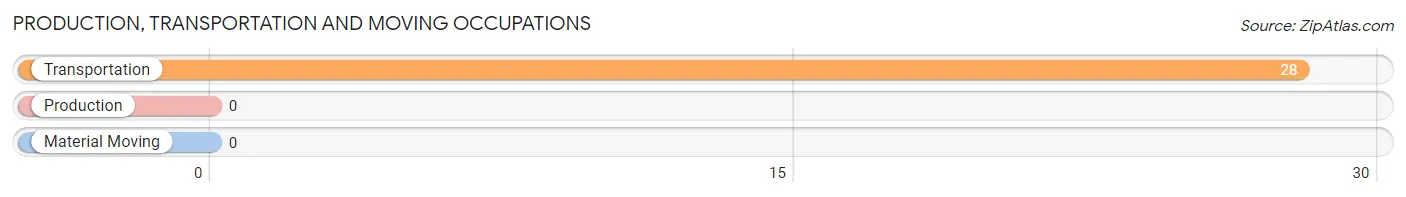
Production, Transportation and Moving Occupations by Sex
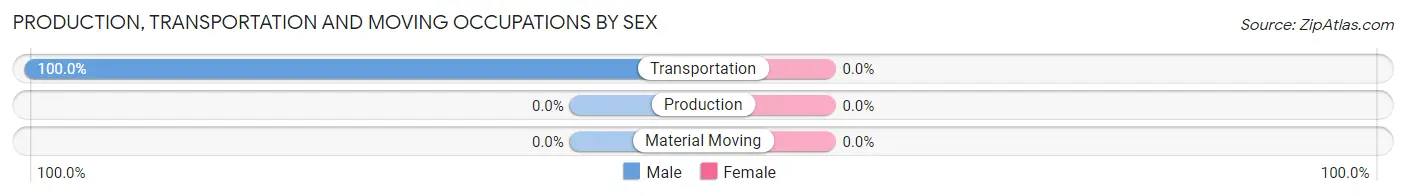
| Occupation | Male | Female |
| Production | 0 (0.0%) | 0 (0.0%) |
| Transportation | 28 (100.0%) | 0 (0.0%) |
| Material Moving | 0 (0.0%) | 0 (0.0%) |
| Total (Category) | 28 (100.0%) | 0 (0.0%) |
| Total (Overall) | 98 (44.3%) | 123 (55.7%) |
Employment Industries by Sex in Tonto Basin
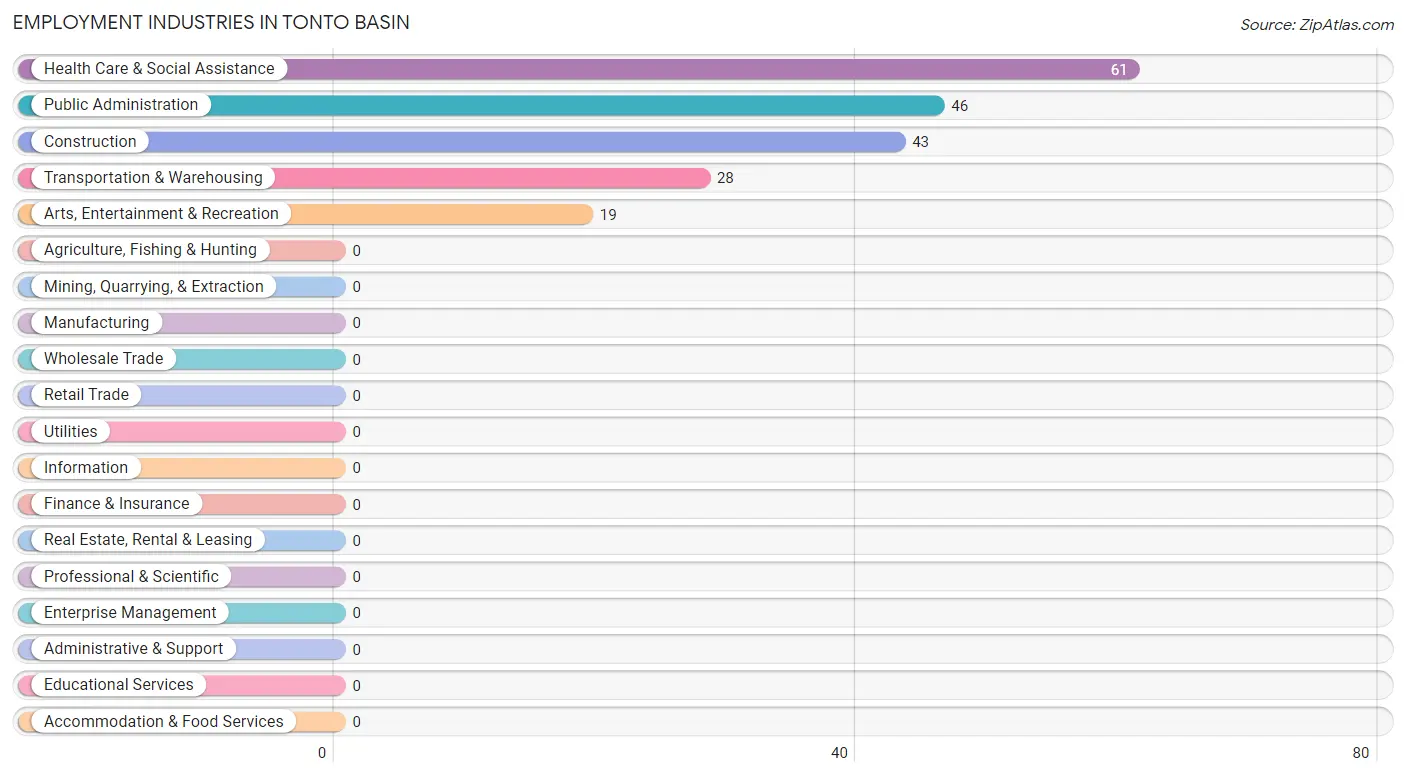
Employment Industries in Tonto Basin
The major employment industries in Tonto Basin include Health Care & Social Assistance (61 | 27.6%), Public Administration (46 | 20.8%), Construction (43 | 19.5%), Transportation & Warehousing (28 | 12.7%), and Arts, Entertainment & Recreation (19 | 8.6%).
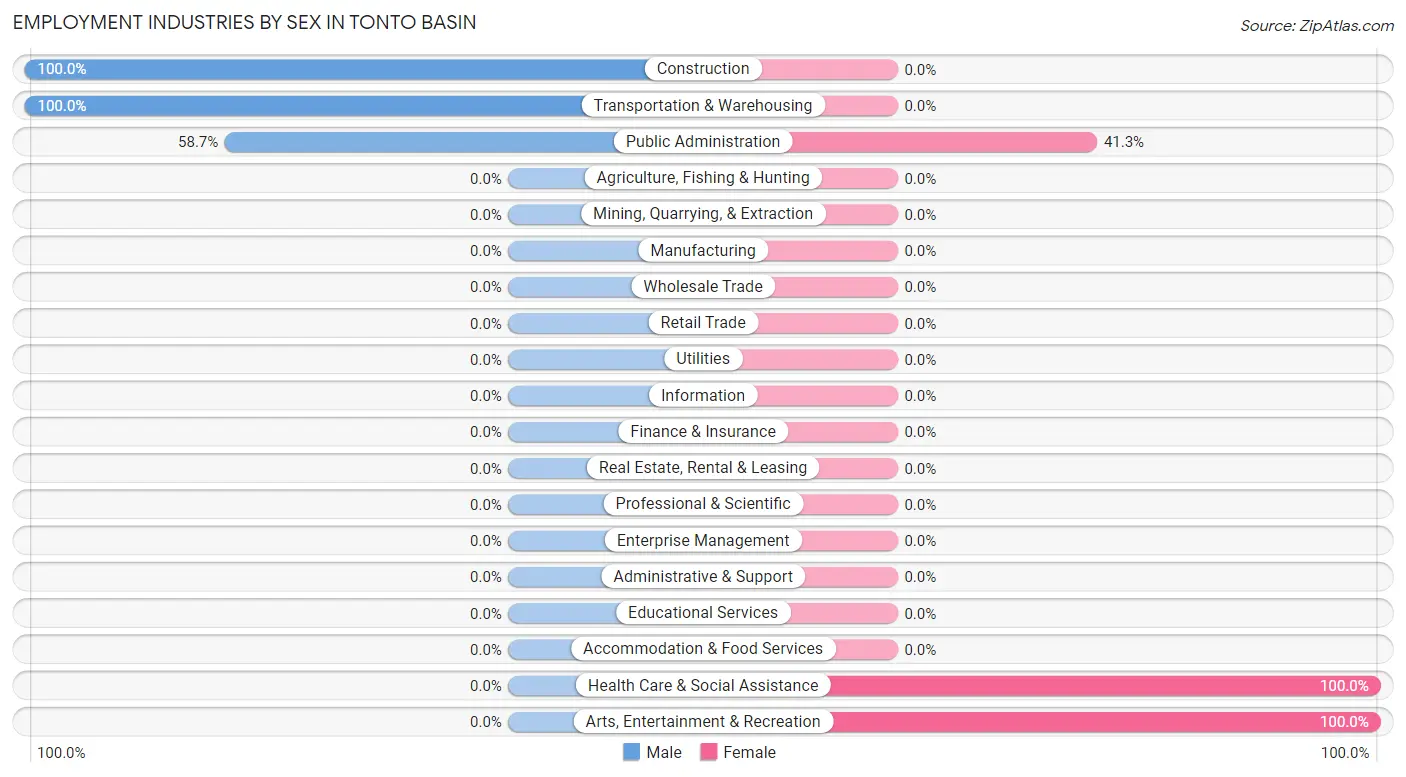
Employment Industries by Sex in Tonto Basin
The Tonto Basin industries that see more men than women are Construction (100.0%), Transportation & Warehousing (100.0%), and Public Administration (58.7%), whereas the industries that tend to have a higher number of women are Health Care & Social Assistance (100.0%), Arts, Entertainment & Recreation (100.0%), and Public Administration (41.3%).
| Industry | Male | Female |
| Agriculture, Fishing & Hunting | 0 (0.0%) | 0 (0.0%) |
| Mining, Quarrying, & Extraction | 0 (0.0%) | 0 (0.0%) |
| Construction | 43 (100.0%) | 0 (0.0%) |
| Manufacturing | 0 (0.0%) | 0 (0.0%) |
| Wholesale Trade | 0 (0.0%) | 0 (0.0%) |
| Retail Trade | 0 (0.0%) | 0 (0.0%) |
| Transportation & Warehousing | 28 (100.0%) | 0 (0.0%) |
| Utilities | 0 (0.0%) | 0 (0.0%) |
| Information | 0 (0.0%) | 0 (0.0%) |
| Finance & Insurance | 0 (0.0%) | 0 (0.0%) |
| Real Estate, Rental & Leasing | 0 (0.0%) | 0 (0.0%) |
| Professional & Scientific | 0 (0.0%) | 0 (0.0%) |
| Enterprise Management | 0 (0.0%) | 0 (0.0%) |
| Administrative & Support | 0 (0.0%) | 0 (0.0%) |
| Educational Services | 0 (0.0%) | 0 (0.0%) |
| Health Care & Social Assistance | 0 (0.0%) | 61 (100.0%) |
| Arts, Entertainment & Recreation | 0 (0.0%) | 19 (100.0%) |
| Accommodation & Food Services | 0 (0.0%) | 0 (0.0%) |
| Public Administration | 27 (58.7%) | 19 (41.3%) |
| Total | 98 (44.3%) | 123 (55.7%) |
Education in Tonto Basin
School Enrollment in Tonto Basin
The most common levels of schooling among the 125 students in Tonto Basin are high school (63 | 50.4%), middle school (24 | 19.2%), and kindergarten (19 | 15.2%).
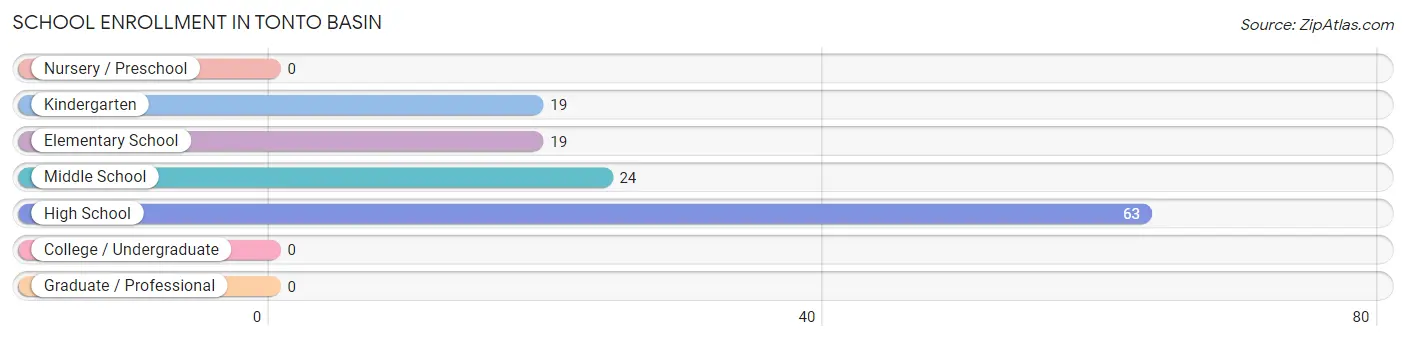
| School Level | # Students | % Students |
| Nursery / Preschool | 0 | 0.0% |
| Kindergarten | 19 | 15.2% |
| Elementary School | 19 | 15.2% |
| Middle School | 24 | 19.2% |
| High School | 63 | 50.4% |
| College / Undergraduate | 0 | 0.0% |
| Graduate / Professional | 0 | 0.0% |
| Total | 125 | 100.0% |
School Enrollment by Age by Funding Source in Tonto Basin
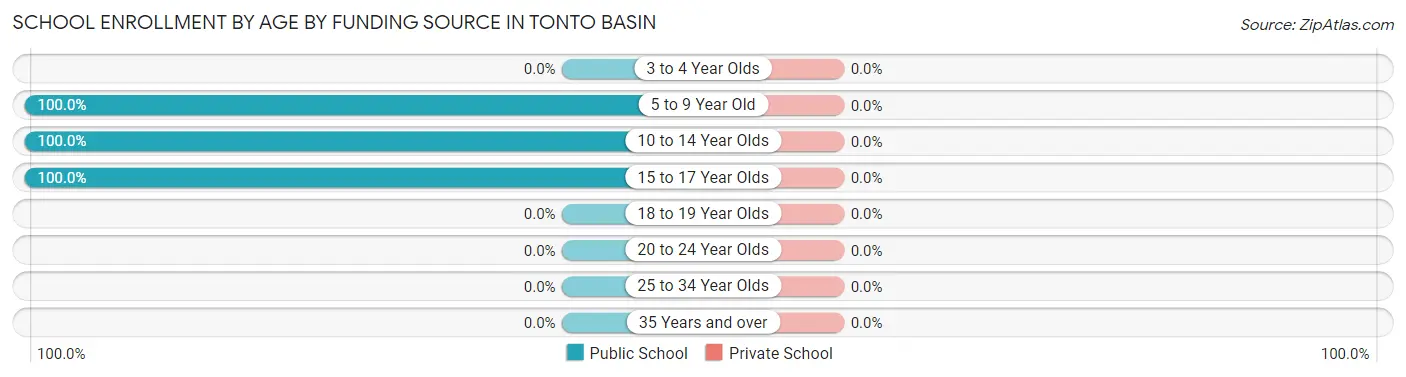
| Age Bracket | Public School | Private School |
| 3 to 4 Year Olds | 0 (0.0%) | 0 (0.0%) |
| 5 to 9 Year Old | 38 (100.0%) | 0 (0.0%) |
| 10 to 14 Year Olds | 47 (100.0%) | 0 (0.0%) |
| 15 to 17 Year Olds | 40 (100.0%) | 0 (0.0%) |
| 18 to 19 Year Olds | 0 (0.0%) | 0 (0.0%) |
| 20 to 24 Year Olds | 0 (0.0%) | 0 (0.0%) |
| 25 to 34 Year Olds | 0 (0.0%) | 0 (0.0%) |
| 35 Years and over | 0 (0.0%) | 0 (0.0%) |
| Total | 125 (100.0%) | 0 (0.0%) |
Educational Attainment by Field of Study in Tonto Basin
Business (70 | 62.5%), physical & health sciences (22 | 19.6%), and education (20 | 17.9%) are the most common fields of study among 112 individuals in Tonto Basin who have obtained a bachelor's degree or higher.
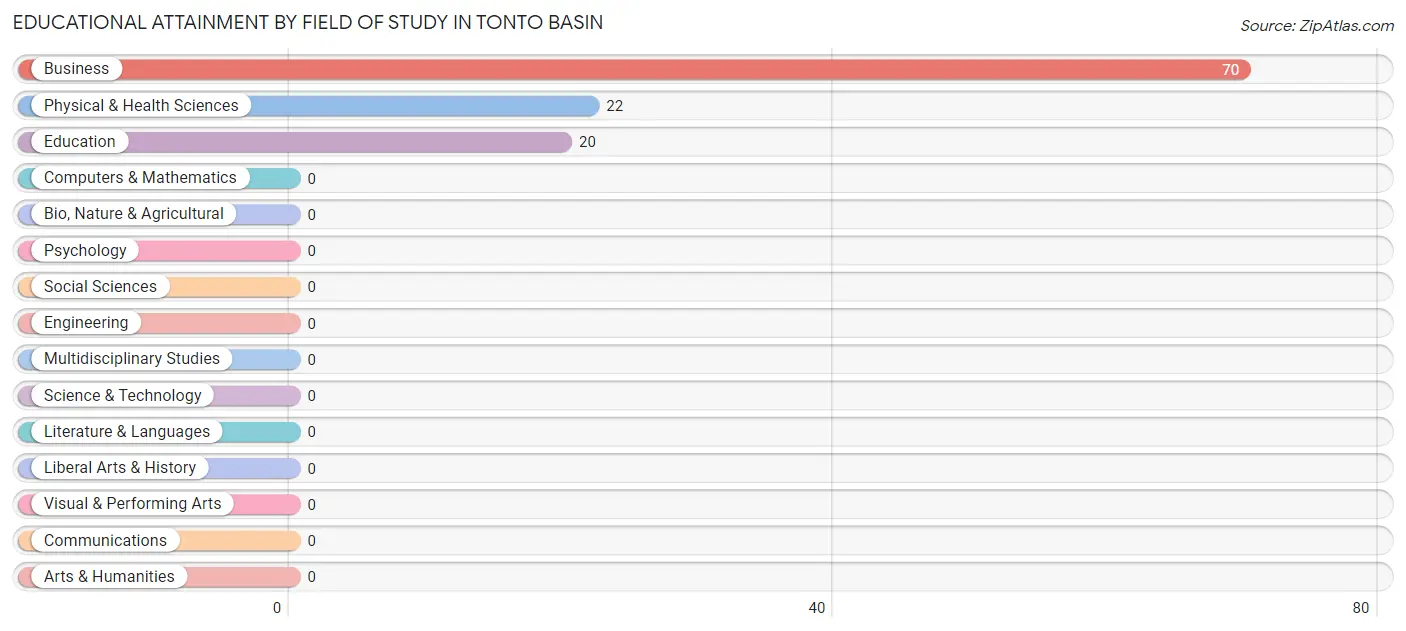
| Field of Study | # Graduates | % Graduates |
| Computers & Mathematics | 0 | 0.0% |
| Bio, Nature & Agricultural | 0 | 0.0% |
| Physical & Health Sciences | 22 | 19.6% |
| Psychology | 0 | 0.0% |
| Social Sciences | 0 | 0.0% |
| Engineering | 0 | 0.0% |
| Multidisciplinary Studies | 0 | 0.0% |
| Science & Technology | 0 | 0.0% |
| Business | 70 | 62.5% |
| Education | 20 | 17.9% |
| Literature & Languages | 0 | 0.0% |
| Liberal Arts & History | 0 | 0.0% |
| Visual & Performing Arts | 0 | 0.0% |
| Communications | 0 | 0.0% |
| Arts & Humanities | 0 | 0.0% |
| Total | 112 | 100.0% |
Transportation & Commute in Tonto Basin
Vehicle Availability by Sex in Tonto Basin
The most prevalent vehicle ownership categories in Tonto Basin are males with 5 or more vehicles (51, accounting for 72.9%) and females with 5 or more vehicles (34, making up 41.5%).
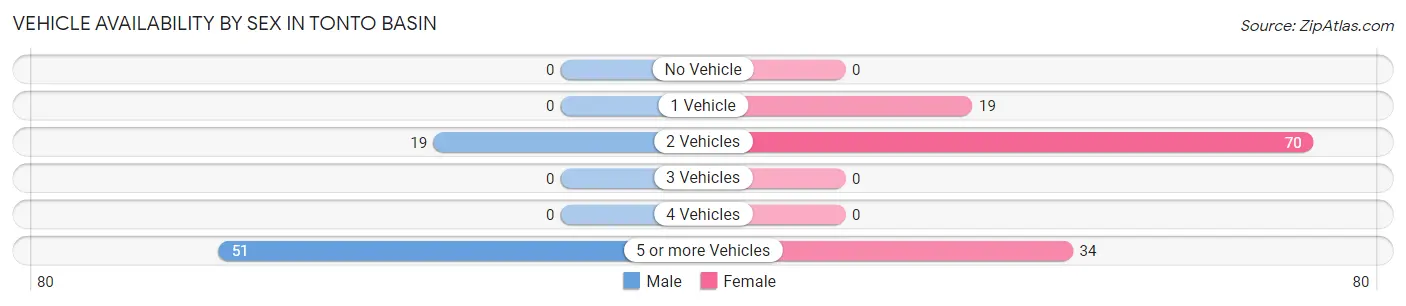
| Vehicles Available | Male | Female |
| No Vehicle | 0 (0.0%) | 0 (0.0%) |
| 1 Vehicle | 0 (0.0%) | 19 (15.4%) |
| 2 Vehicles | 19 (27.1%) | 70 (56.9%) |
| 3 Vehicles | 0 (0.0%) | 0 (0.0%) |
| 4 Vehicles | 0 (0.0%) | 0 (0.0%) |
| 5 or more Vehicles | 51 (72.9%) | 34 (27.6%) |
| Total | 70 (100.0%) | 123 (100.0%) |
Commute Time in Tonto Basin
The most frequently occuring commute durations in Tonto Basin are 35 to 39 minutes (61 commuters, 43.0%), 45 to 59 minutes (24 commuters, 16.9%), and 10 to 14 minutes (19 commuters, 13.4%).
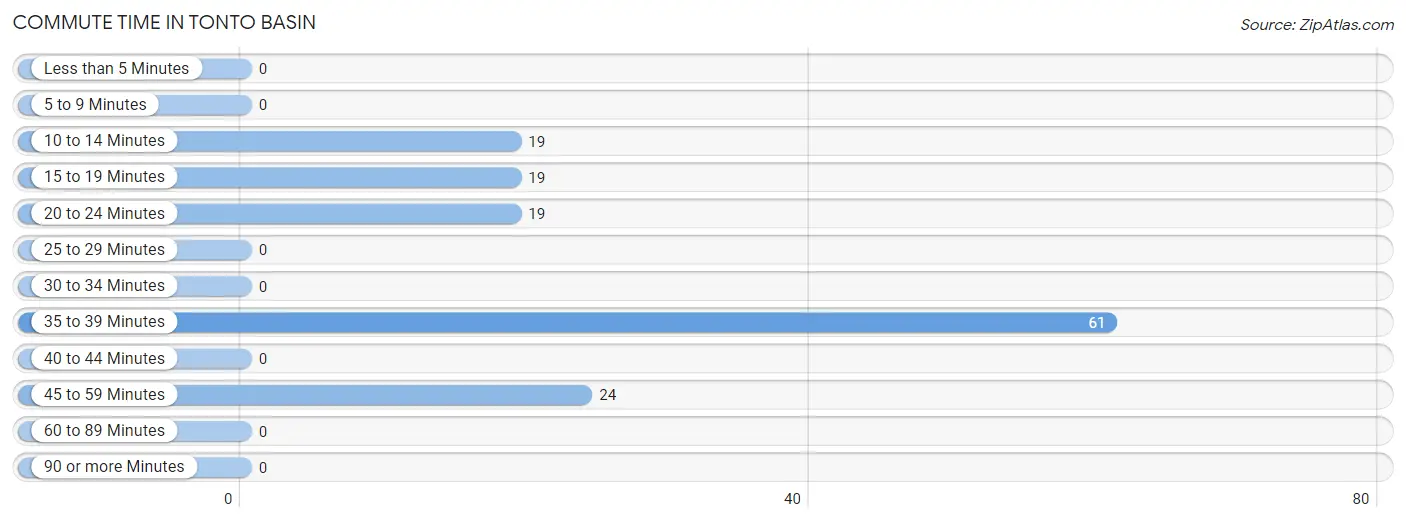
| Commute Time | # Commuters | % Commuters |
| Less than 5 Minutes | 0 | 0.0% |
| 5 to 9 Minutes | 0 | 0.0% |
| 10 to 14 Minutes | 19 | 13.4% |
| 15 to 19 Minutes | 19 | 13.4% |
| 20 to 24 Minutes | 19 | 13.4% |
| 25 to 29 Minutes | 0 | 0.0% |
| 30 to 34 Minutes | 0 | 0.0% |
| 35 to 39 Minutes | 61 | 43.0% |
| 40 to 44 Minutes | 0 | 0.0% |
| 45 to 59 Minutes | 24 | 16.9% |
| 60 to 89 Minutes | 0 | 0.0% |
| 90 or more Minutes | 0 | 0.0% |
Commute Time by Sex in Tonto Basin
The most common commute times in Tonto Basin are 35 to 39 minutes (27 commuters, 38.6%) for males and 35 to 39 minutes (34 commuters, 47.2%) for females.
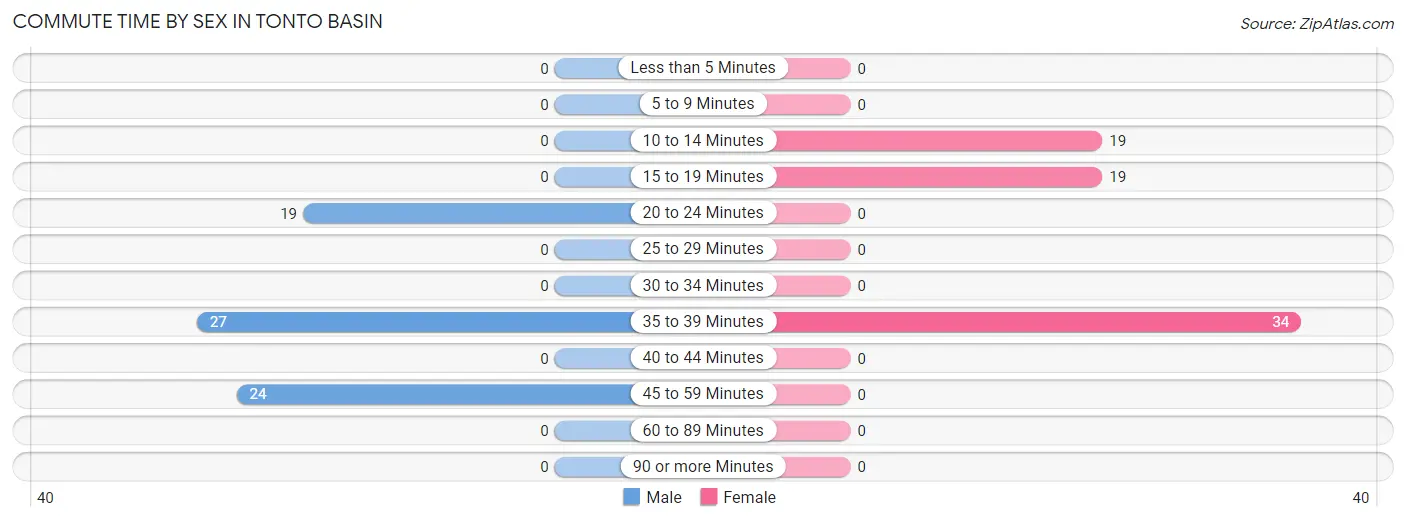
| Commute Time | Male | Female |
| Less than 5 Minutes | 0 (0.0%) | 0 (0.0%) |
| 5 to 9 Minutes | 0 (0.0%) | 0 (0.0%) |
| 10 to 14 Minutes | 0 (0.0%) | 19 (26.4%) |
| 15 to 19 Minutes | 0 (0.0%) | 19 (26.4%) |
| 20 to 24 Minutes | 19 (27.1%) | 0 (0.0%) |
| 25 to 29 Minutes | 0 (0.0%) | 0 (0.0%) |
| 30 to 34 Minutes | 0 (0.0%) | 0 (0.0%) |
| 35 to 39 Minutes | 27 (38.6%) | 34 (47.2%) |
| 40 to 44 Minutes | 0 (0.0%) | 0 (0.0%) |
| 45 to 59 Minutes | 24 (34.3%) | 0 (0.0%) |
| 60 to 89 Minutes | 0 (0.0%) | 0 (0.0%) |
| 90 or more Minutes | 0 (0.0%) | 0 (0.0%) |
Time of Departure to Work by Sex in Tonto Basin
The most frequent times of departure to work in Tonto Basin are 6:30 AM to 6:59 AM (27, 38.6%) for males and 6:30 AM to 6:59 AM (38, 52.8%) for females.
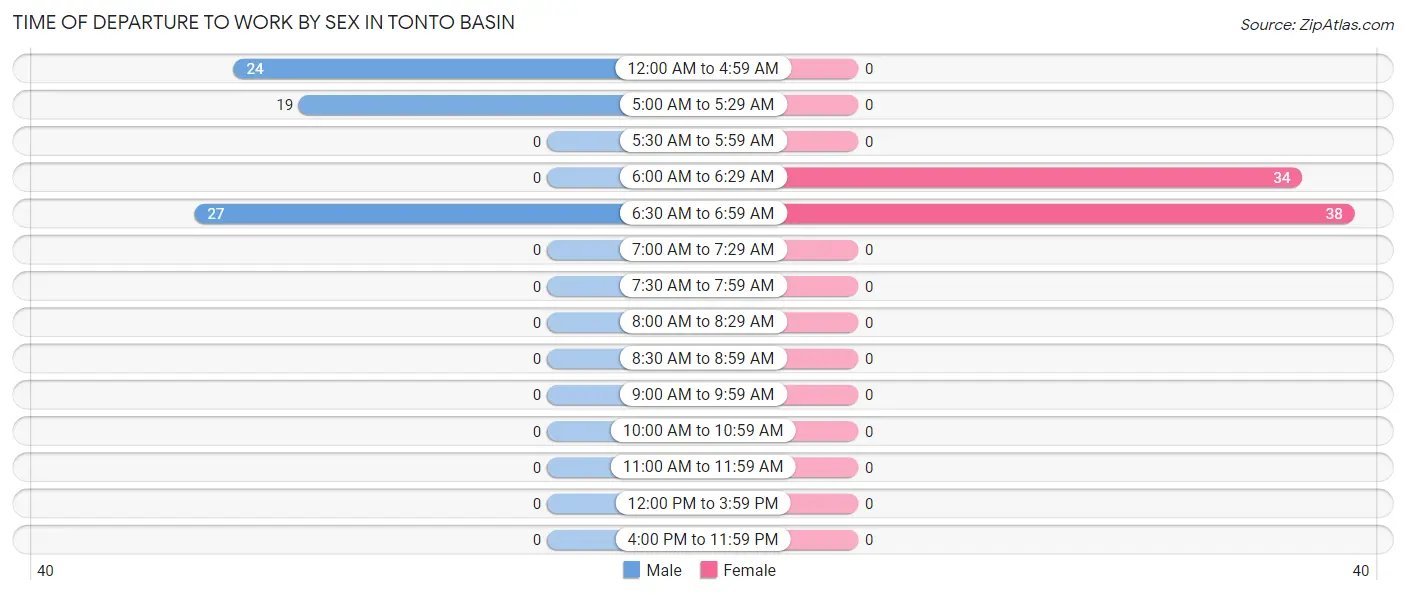
| Time of Departure | Male | Female |
| 12:00 AM to 4:59 AM | 24 (34.3%) | 0 (0.0%) |
| 5:00 AM to 5:29 AM | 19 (27.1%) | 0 (0.0%) |
| 5:30 AM to 5:59 AM | 0 (0.0%) | 0 (0.0%) |
| 6:00 AM to 6:29 AM | 0 (0.0%) | 34 (47.2%) |
| 6:30 AM to 6:59 AM | 27 (38.6%) | 38 (52.8%) |
| 7:00 AM to 7:29 AM | 0 (0.0%) | 0 (0.0%) |
| 7:30 AM to 7:59 AM | 0 (0.0%) | 0 (0.0%) |
| 8:00 AM to 8:29 AM | 0 (0.0%) | 0 (0.0%) |
| 8:30 AM to 8:59 AM | 0 (0.0%) | 0 (0.0%) |
| 9:00 AM to 9:59 AM | 0 (0.0%) | 0 (0.0%) |
| 10:00 AM to 10:59 AM | 0 (0.0%) | 0 (0.0%) |
| 11:00 AM to 11:59 AM | 0 (0.0%) | 0 (0.0%) |
| 12:00 PM to 3:59 PM | 0 (0.0%) | 0 (0.0%) |
| 4:00 PM to 11:59 PM | 0 (0.0%) | 0 (0.0%) |
| Total | 70 (100.0%) | 72 (100.0%) |
Housing Occupancy in Tonto Basin
Occupancy by Ownership in Tonto Basin
Of the total 746 dwellings in Tonto Basin, owner-occupied units account for 651 (87.3%), while renter-occupied units make up 95 (12.7%).
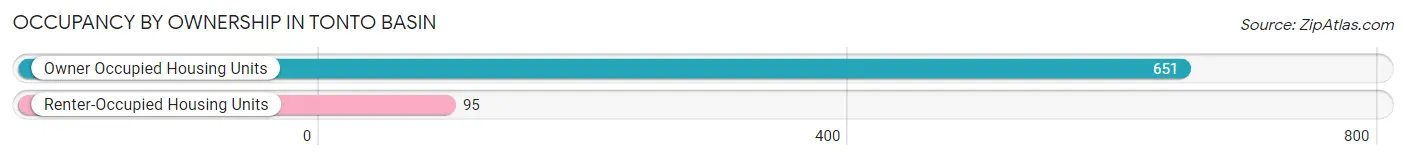
| Occupancy | # Housing Units | % Housing Units |
| Owner Occupied Housing Units | 651 | 87.3% |
| Renter-Occupied Housing Units | 95 | 12.7% |
| Total Occupied Housing Units | 746 | 100.0% |
Occupancy by Household Size in Tonto Basin
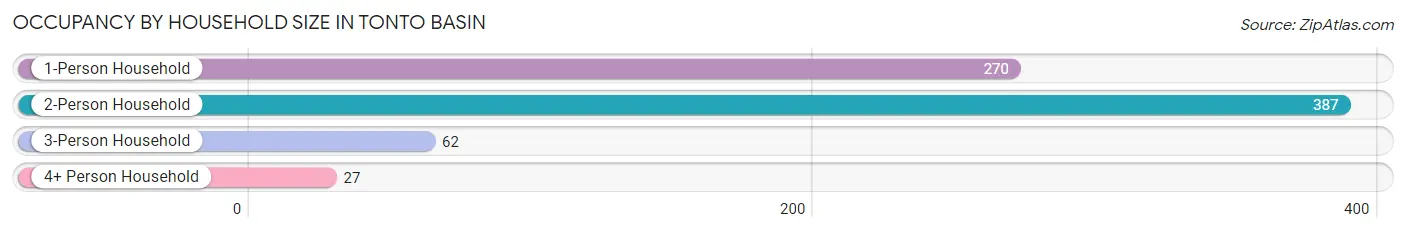
| Household Size | # Housing Units | % Housing Units |
| 1-Person Household | 270 | 36.2% |
| 2-Person Household | 387 | 51.9% |
| 3-Person Household | 62 | 8.3% |
| 4+ Person Household | 27 | 3.6% |
| Total Housing Units | 746 | 100.0% |
Occupancy by Ownership by Household Size in Tonto Basin
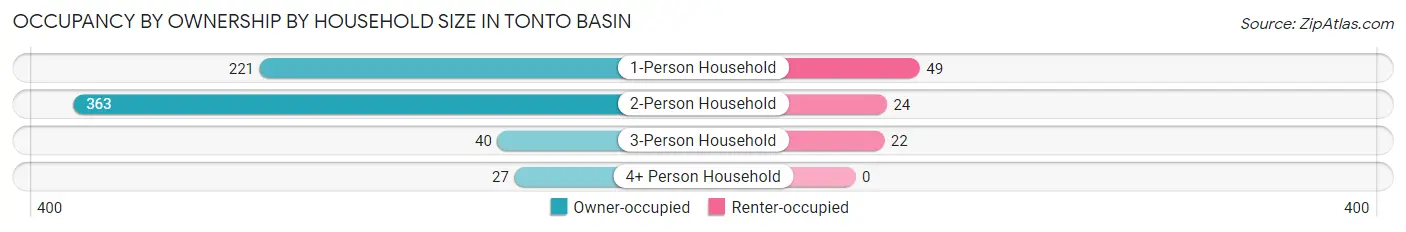
| Household Size | Owner-occupied | Renter-occupied |
| 1-Person Household | 221 (81.9%) | 49 (18.1%) |
| 2-Person Household | 363 (93.8%) | 24 (6.2%) |
| 3-Person Household | 40 (64.5%) | 22 (35.5%) |
| 4+ Person Household | 27 (100.0%) | 0 (0.0%) |
| Total Housing Units | 651 (87.3%) | 95 (12.7%) |
Occupancy by Educational Attainment in Tonto Basin
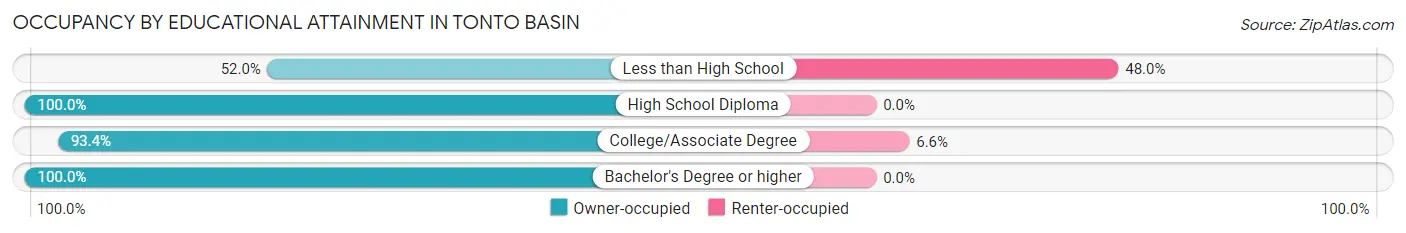
| Household Size | Owner-occupied | Renter-occupied |
| Less than High School | 78 (52.0%) | 72 (48.0%) |
| High School Diploma | 197 (100.0%) | 0 (0.0%) |
| College/Associate Degree | 327 (93.4%) | 23 (6.6%) |
| Bachelor's Degree or higher | 49 (100.0%) | 0 (0.0%) |
Occupancy by Age of Householder in Tonto Basin
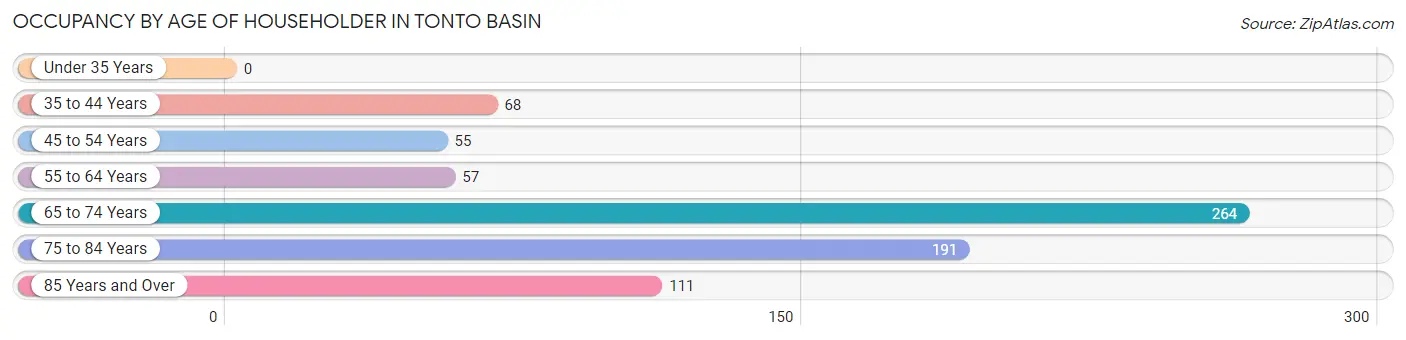
| Age Bracket | # Households | % Households |
| Under 35 Years | 0 | 0.0% |
| 35 to 44 Years | 68 | 9.1% |
| 45 to 54 Years | 55 | 7.4% |
| 55 to 64 Years | 57 | 7.6% |
| 65 to 74 Years | 264 | 35.4% |
| 75 to 84 Years | 191 | 25.6% |
| 85 Years and Over | 111 | 14.9% |
| Total | 746 | 100.0% |
Housing Finances in Tonto Basin
Median Income by Occupancy in Tonto Basin
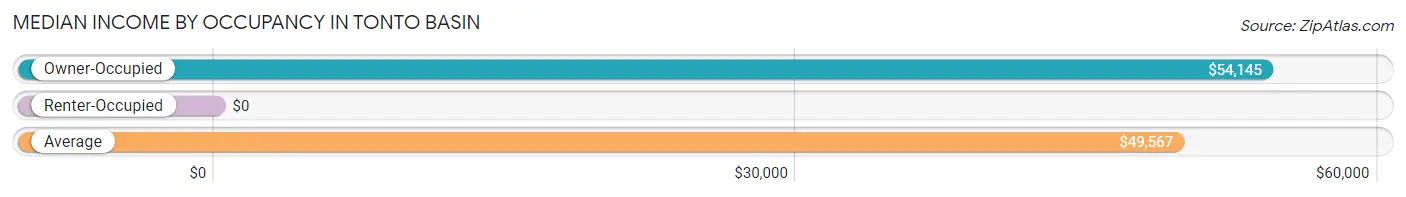
| Occupancy Type | # Households | Median Income |
| Owner-Occupied | 651 (87.3%) | $54,145 |
| Renter-Occupied | 95 (12.7%) | $0 |
| Average | 746 (100.0%) | $49,567 |
Occupancy by Householder Income Bracket in Tonto Basin
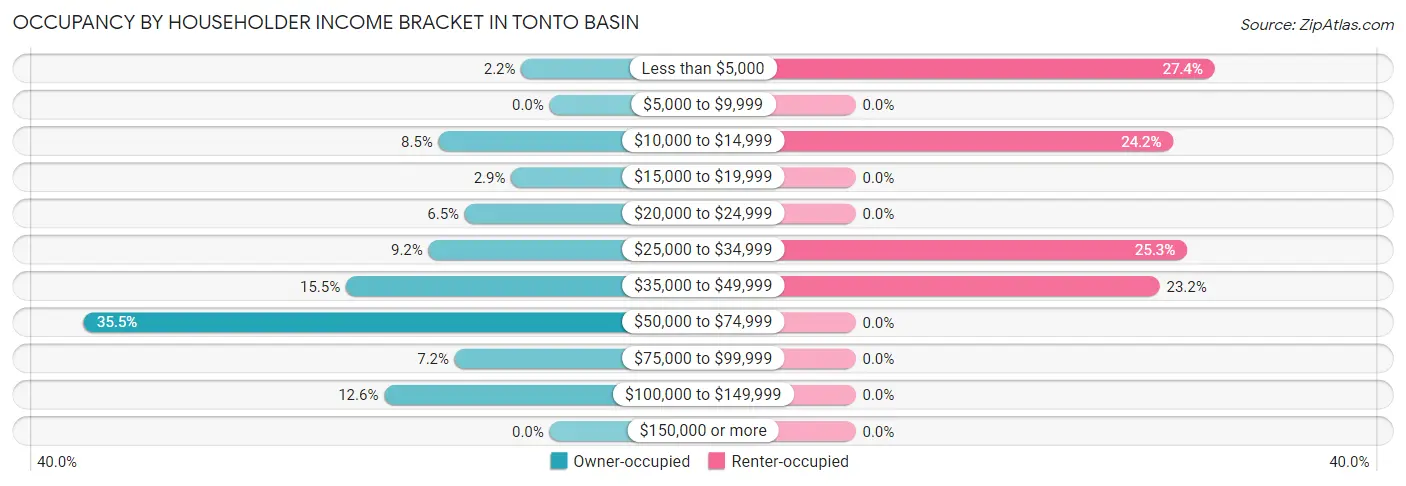
| Income Bracket | Owner-occupied | Renter-occupied |
| Less than $5,000 | 14 (2.1%) | 26 (27.4%) |
| $5,000 to $9,999 | 0 (0.0%) | 0 (0.0%) |
| $10,000 to $14,999 | 55 (8.5%) | 23 (24.2%) |
| $15,000 to $19,999 | 19 (2.9%) | 0 (0.0%) |
| $20,000 to $24,999 | 42 (6.5%) | 0 (0.0%) |
| $25,000 to $34,999 | 60 (9.2%) | 24 (25.3%) |
| $35,000 to $49,999 | 101 (15.5%) | 22 (23.2%) |
| $50,000 to $74,999 | 231 (35.5%) | 0 (0.0%) |
| $75,000 to $99,999 | 47 (7.2%) | 0 (0.0%) |
| $100,000 to $149,999 | 82 (12.6%) | 0 (0.0%) |
| $150,000 or more | 0 (0.0%) | 0 (0.0%) |
| Total | 651 (100.0%) | 95 (100.0%) |
Monthly Housing Cost Tiers in Tonto Basin
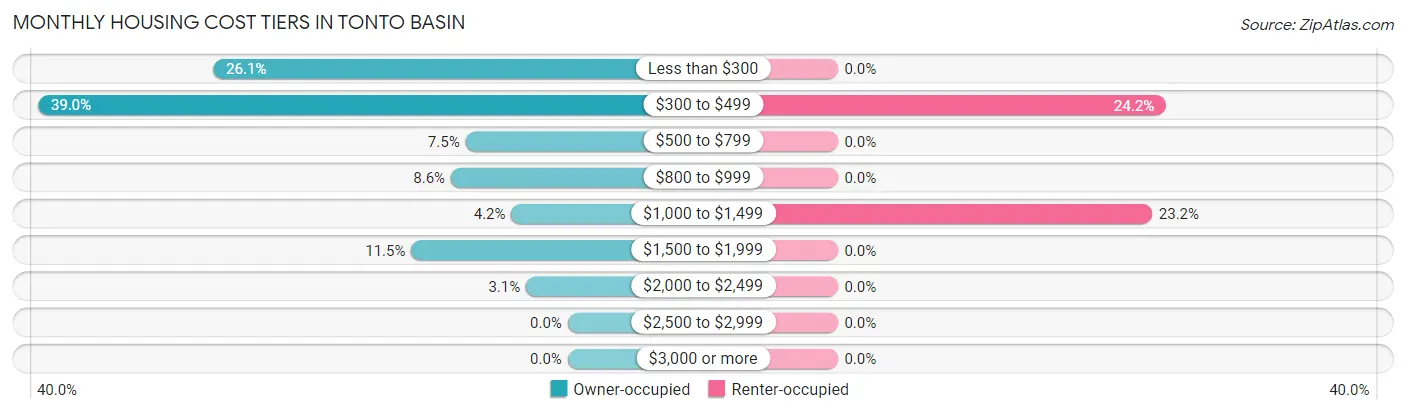
| Monthly Cost | Owner-occupied | Renter-occupied |
| Less than $300 | 170 (26.1%) | 0 (0.0%) |
| $300 to $499 | 254 (39.0%) | 23 (24.2%) |
| $500 to $799 | 49 (7.5%) | 0 (0.0%) |
| $800 to $999 | 56 (8.6%) | 0 (0.0%) |
| $1,000 to $1,499 | 27 (4.2%) | 22 (23.2%) |
| $1,500 to $1,999 | 75 (11.5%) | 0 (0.0%) |
| $2,000 to $2,499 | 20 (3.1%) | 0 (0.0%) |
| $2,500 to $2,999 | 0 (0.0%) | 0 (0.0%) |
| $3,000 or more | 0 (0.0%) | 0 (0.0%) |
| Total | 651 (100.0%) | 95 (100.0%) |
Physical Housing Characteristics in Tonto Basin
Housing Structures in Tonto Basin
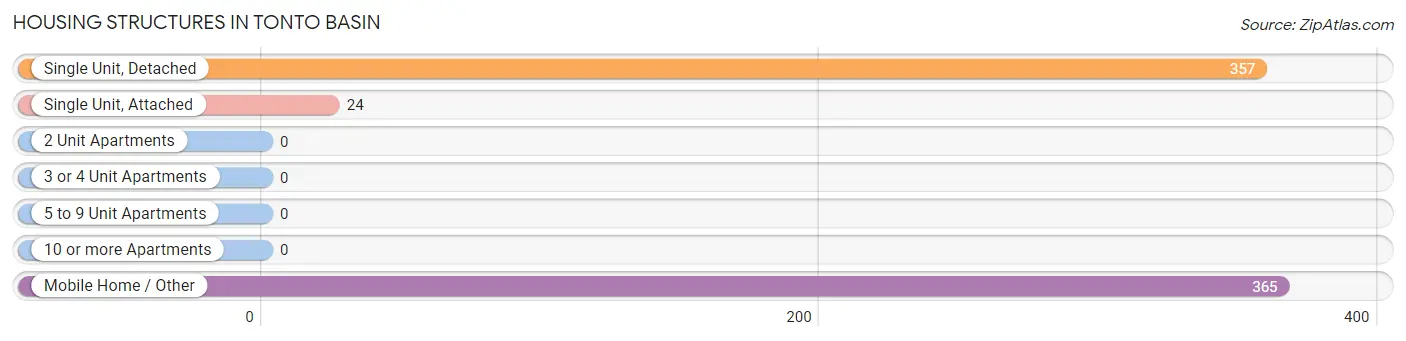
| Structure Type | # Housing Units | % Housing Units |
| Single Unit, Detached | 357 | 47.9% |
| Single Unit, Attached | 24 | 3.2% |
| 2 Unit Apartments | 0 | 0.0% |
| 3 or 4 Unit Apartments | 0 | 0.0% |
| 5 to 9 Unit Apartments | 0 | 0.0% |
| 10 or more Apartments | 0 | 0.0% |
| Mobile Home / Other | 365 | 48.9% |
| Total | 746 | 100.0% |
Housing Structures by Occupancy in Tonto Basin
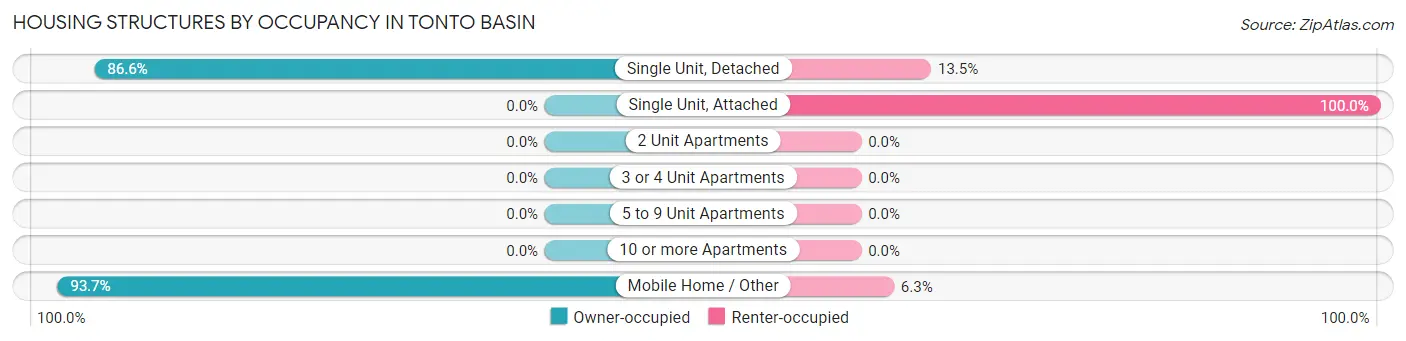
| Structure Type | Owner-occupied | Renter-occupied |
| Single Unit, Detached | 309 (86.6%) | 48 (13.5%) |
| Single Unit, Attached | 0 (0.0%) | 24 (100.0%) |
| 2 Unit Apartments | 0 (0.0%) | 0 (0.0%) |
| 3 or 4 Unit Apartments | 0 (0.0%) | 0 (0.0%) |
| 5 to 9 Unit Apartments | 0 (0.0%) | 0 (0.0%) |
| 10 or more Apartments | 0 (0.0%) | 0 (0.0%) |
| Mobile Home / Other | 342 (93.7%) | 23 (6.3%) |
| Total | 651 (87.3%) | 95 (12.7%) |
Housing Structures by Number of Rooms in Tonto Basin
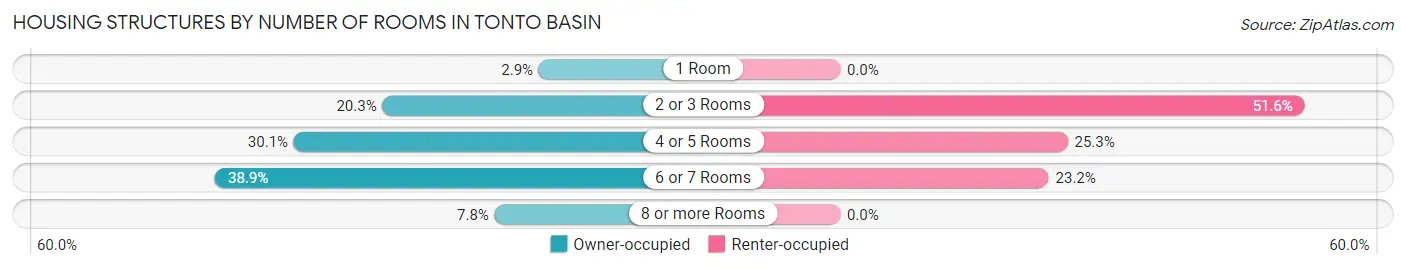
| Number of Rooms | Owner-occupied | Renter-occupied |
| 1 Room | 19 (2.9%) | 0 (0.0%) |
| 2 or 3 Rooms | 132 (20.3%) | 49 (51.6%) |
| 4 or 5 Rooms | 196 (30.1%) | 24 (25.3%) |
| 6 or 7 Rooms | 253 (38.9%) | 22 (23.2%) |
| 8 or more Rooms | 51 (7.8%) | 0 (0.0%) |
| Total | 651 (100.0%) | 95 (100.0%) |
Housing Structure by Heating Type in Tonto Basin
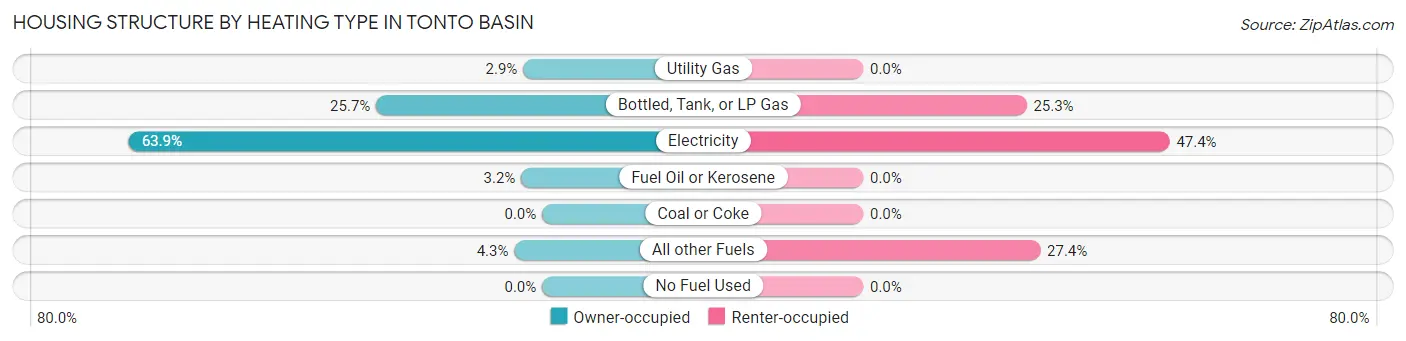
| Heating Type | Owner-occupied | Renter-occupied |
| Utility Gas | 19 (2.9%) | 0 (0.0%) |
| Bottled, Tank, or LP Gas | 167 (25.7%) | 24 (25.3%) |
| Electricity | 416 (63.9%) | 45 (47.4%) |
| Fuel Oil or Kerosene | 21 (3.2%) | 0 (0.0%) |
| Coal or Coke | 0 (0.0%) | 0 (0.0%) |
| All other Fuels | 28 (4.3%) | 26 (27.4%) |
| No Fuel Used | 0 (0.0%) | 0 (0.0%) |
| Total | 651 (100.0%) | 95 (100.0%) |
Household Vehicle Usage in Tonto Basin
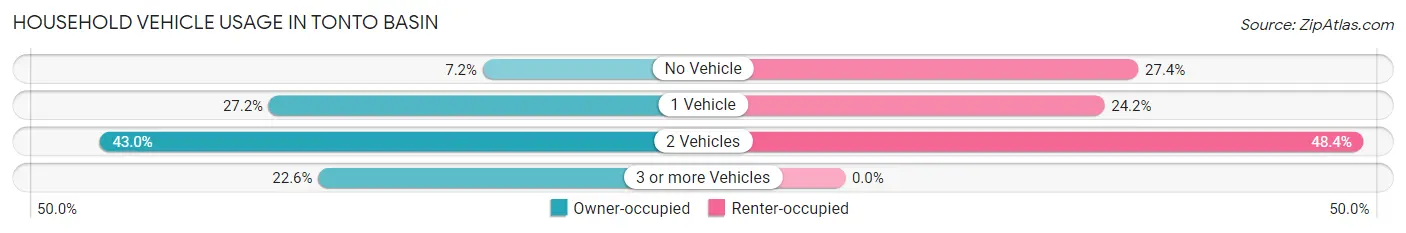
| Vehicles per Household | Owner-occupied | Renter-occupied |
| No Vehicle | 47 (7.2%) | 26 (27.4%) |
| 1 Vehicle | 177 (27.2%) | 23 (24.2%) |
| 2 Vehicles | 280 (43.0%) | 46 (48.4%) |
| 3 or more Vehicles | 147 (22.6%) | 0 (0.0%) |
| Total | 651 (100.0%) | 95 (100.0%) |
Real Estate & Mortgages in Tonto Basin
Real Estate and Mortgage Overview in Tonto Basin
| Characteristic | Without Mortgage | With Mortgage |
| Housing Units | 473 | 178 |
| Median Property Value | $166,500 | $355,800 |
| Median Household Income | $50,170 | $0 |
| Monthly Housing Costs | $343 | $0 |
| Real Estate Taxes | $1,128 | $0 |
Property Value by Mortgage Status in Tonto Basin
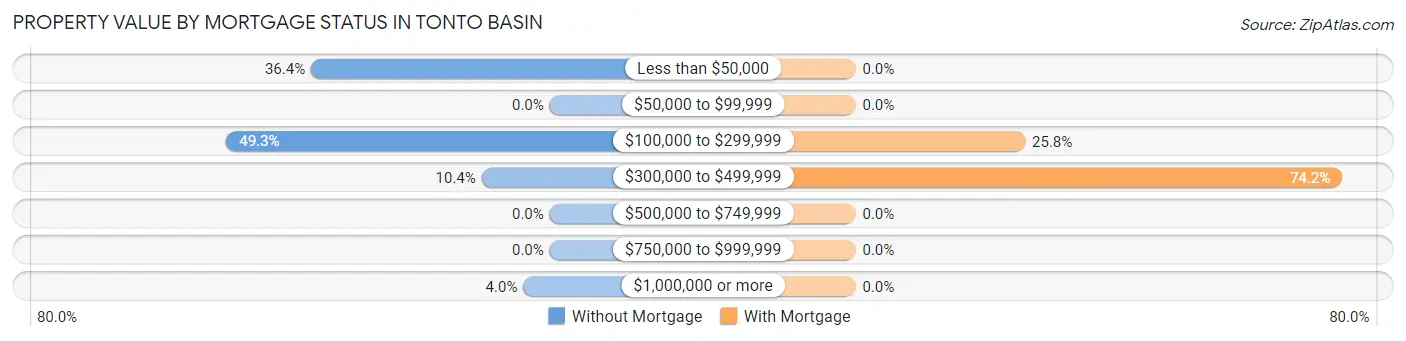
| Property Value | Without Mortgage | With Mortgage |
| Less than $50,000 | 172 (36.4%) | 0 (0.0%) |
| $50,000 to $99,999 | 0 (0.0%) | 0 (0.0%) |
| $100,000 to $299,999 | 233 (49.3%) | 46 (25.8%) |
| $300,000 to $499,999 | 49 (10.4%) | 132 (74.2%) |
| $500,000 to $749,999 | 0 (0.0%) | 0 (0.0%) |
| $750,000 to $999,999 | 0 (0.0%) | 0 (0.0%) |
| $1,000,000 or more | 19 (4.0%) | 0 (0.0%) |
| Total | 473 (100.0%) | 178 (100.0%) |
Household Income by Mortgage Status in Tonto Basin
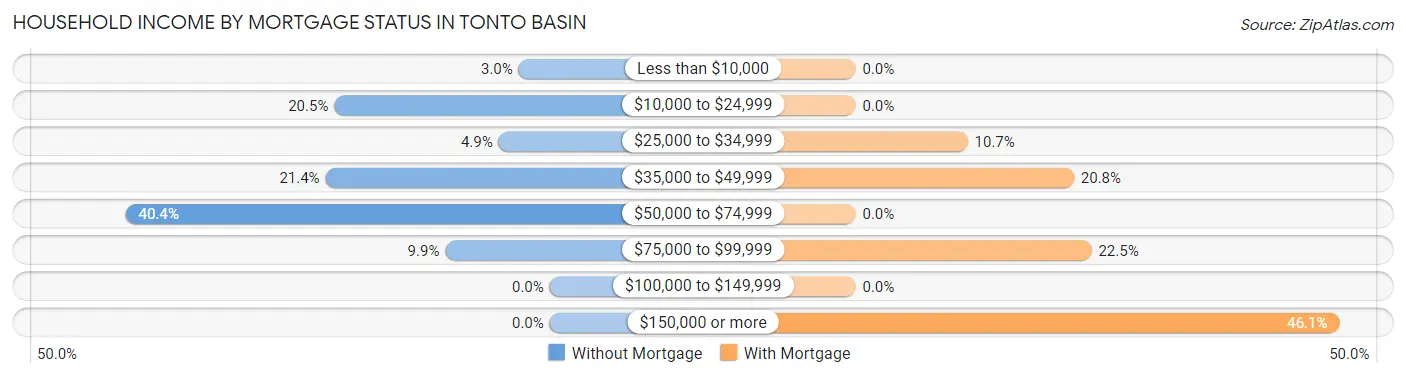
| Household Income | Without Mortgage | With Mortgage |
| Less than $10,000 | 14 (3.0%) | 0 (0.0%) |
| $10,000 to $24,999 | 97 (20.5%) | 0 (0.0%) |
| $25,000 to $34,999 | 23 (4.9%) | 19 (10.7%) |
| $35,000 to $49,999 | 101 (21.3%) | 37 (20.8%) |
| $50,000 to $74,999 | 191 (40.4%) | 0 (0.0%) |
| $75,000 to $99,999 | 47 (9.9%) | 40 (22.5%) |
| $100,000 to $149,999 | 0 (0.0%) | 0 (0.0%) |
| $150,000 or more | 0 (0.0%) | 82 (46.1%) |
| Total | 473 (100.0%) | 178 (100.0%) |
Property Value to Household Income Ratio in Tonto Basin
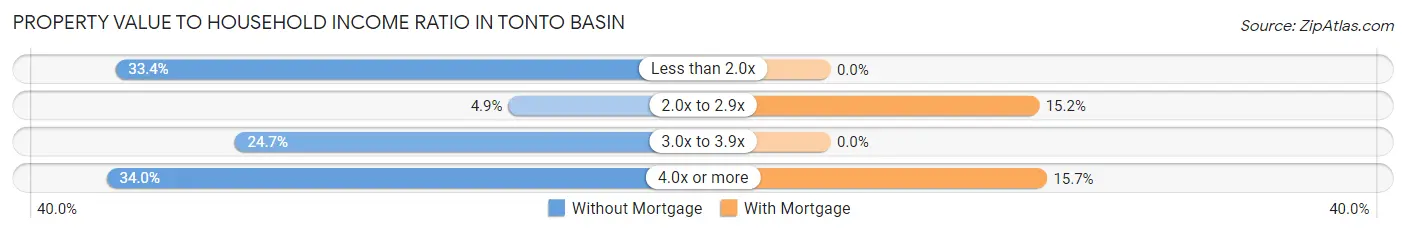
| Value-to-Income Ratio | Without Mortgage | With Mortgage |
| Less than 2.0x | 158 (33.4%) | 0 (0.0%) |
| 2.0x to 2.9x | 23 (4.9%) | 27 (15.2%) |
| 3.0x to 3.9x | 117 (24.7%) | 0 (0.0%) |
| 4.0x or more | 161 (34.0%) | 28 (15.7%) |
| Total | 473 (100.0%) | 178 (100.0%) |
Real Estate Taxes by Mortgage Status in Tonto Basin
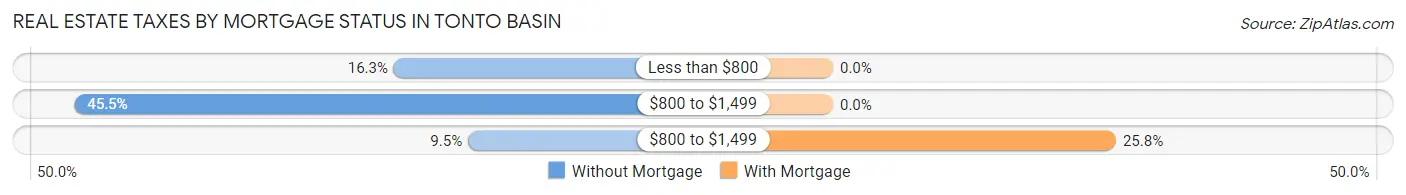
| Property Taxes | Without Mortgage | With Mortgage |
| Less than $800 | 77 (16.3%) | 0 (0.0%) |
| $800 to $1,499 | 215 (45.5%) | 0 (0.0%) |
| $800 to $1,499 | 45 (9.5%) | 46 (25.8%) |
| Total | 473 (100.0%) | 178 (100.0%) |
Health & Disability in Tonto Basin
Health Insurance Coverage by Age in Tonto Basin
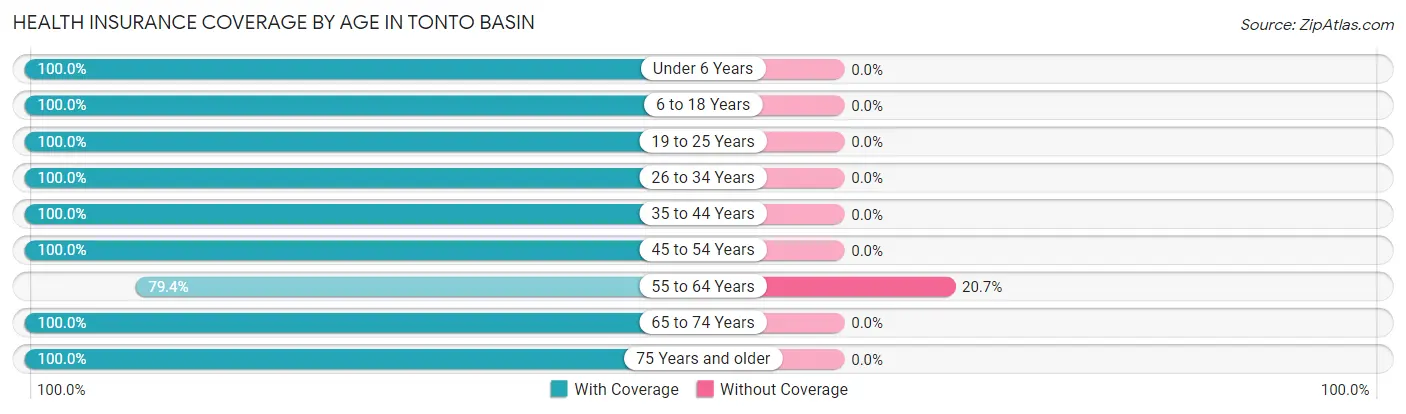
| Age Bracket | With Coverage | Without Coverage |
| Under 6 Years | 19 (100.0%) | 0 (0.0%) |
| 6 to 18 Years | 130 (100.0%) | 0 (0.0%) |
| 19 to 25 Years | 43 (100.0%) | 0 (0.0%) |
| 26 to 34 Years | 34 (100.0%) | 0 (0.0%) |
| 35 to 44 Years | 112 (100.0%) | 0 (0.0%) |
| 45 to 54 Years | 73 (100.0%) | 0 (0.0%) |
| 55 to 64 Years | 73 (79.3%) | 19 (20.6%) |
| 65 to 74 Years | 483 (100.0%) | 0 (0.0%) |
| 75 Years and older | 394 (100.0%) | 0 (0.0%) |
| Total | 1,361 (98.6%) | 19 (1.4%) |
Health Insurance Coverage by Citizenship Status in Tonto Basin
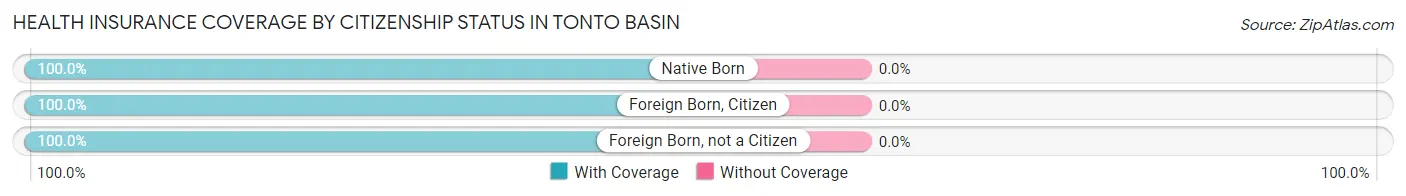
| Citizenship Status | With Coverage | Without Coverage |
| Native Born | 19 (100.0%) | 0 (0.0%) |
| Foreign Born, Citizen | 130 (100.0%) | 0 (0.0%) |
| Foreign Born, not a Citizen | 43 (100.0%) | 0 (0.0%) |
Health Insurance Coverage by Household Income in Tonto Basin
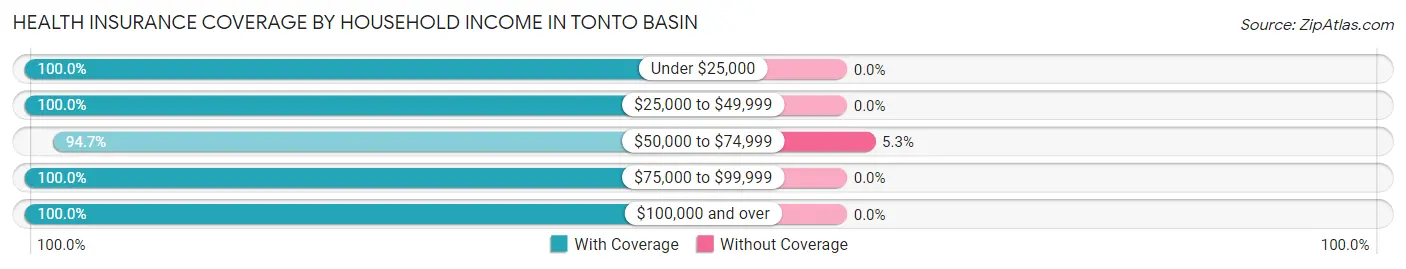
| Household Income | With Coverage | Without Coverage |
| Under $25,000 | 233 (100.0%) | 0 (0.0%) |
| $25,000 to $49,999 | 443 (100.0%) | 0 (0.0%) |
| $50,000 to $74,999 | 339 (94.7%) | 19 (5.3%) |
| $75,000 to $99,999 | 93 (100.0%) | 0 (0.0%) |
| $100,000 and over | 253 (100.0%) | 0 (0.0%) |
Public vs Private Health Insurance Coverage by Age in Tonto Basin
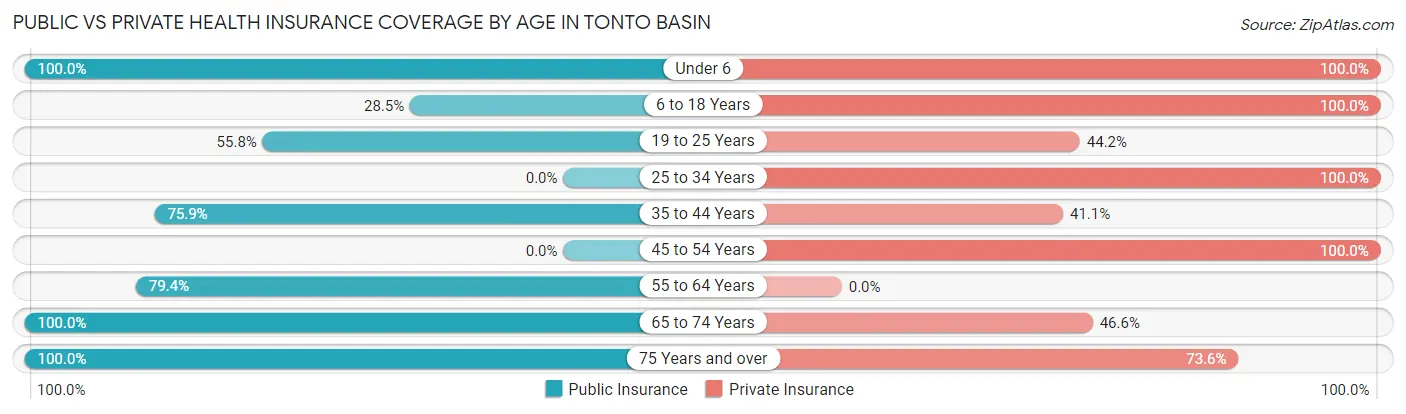
| Age Bracket | Public Insurance | Private Insurance |
| Under 6 | 19 (100.0%) | 19 (100.0%) |
| 6 to 18 Years | 37 (28.5%) | 130 (100.0%) |
| 19 to 25 Years | 24 (55.8%) | 19 (44.2%) |
| 25 to 34 Years | 0 (0.0%) | 34 (100.0%) |
| 35 to 44 Years | 85 (75.9%) | 46 (41.1%) |
| 45 to 54 Years | 0 (0.0%) | 73 (100.0%) |
| 55 to 64 Years | 73 (79.3%) | 0 (0.0%) |
| 65 to 74 Years | 483 (100.0%) | 225 (46.6%) |
| 75 Years and over | 394 (100.0%) | 290 (73.6%) |
| Total | 1,115 (80.8%) | 836 (60.6%) |
Disability Status by Sex by Age in Tonto Basin
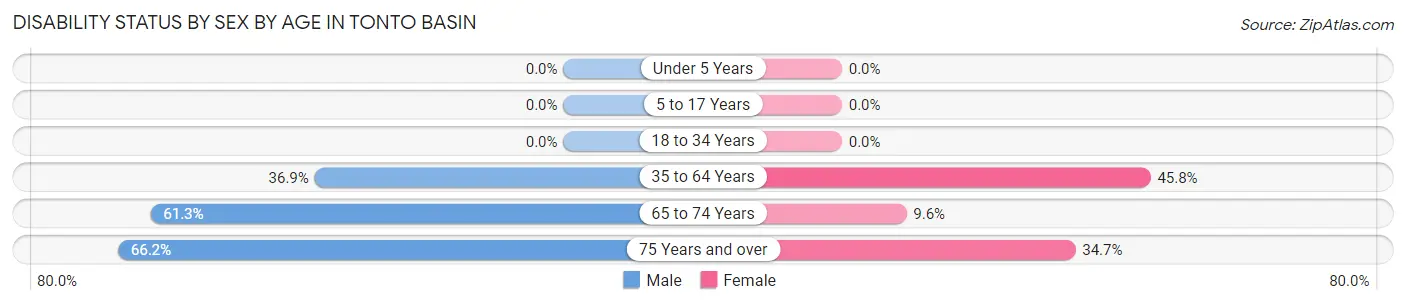
| Age Bracket | Male | Female |
| Under 5 Years | 0 (0.0%) | 0 (0.0%) |
| 5 to 17 Years | 0 (0.0%) | 0 (0.0%) |
| 18 to 34 Years | 0 (0.0%) | 0 (0.0%) |
| 35 to 64 Years | 58 (36.9%) | 55 (45.8%) |
| 65 to 74 Years | 130 (61.3%) | 26 (9.6%) |
| 75 Years and over | 129 (66.1%) | 69 (34.7%) |
Disability Class by Sex by Age in Tonto Basin
Disability Class: Hearing Difficulty
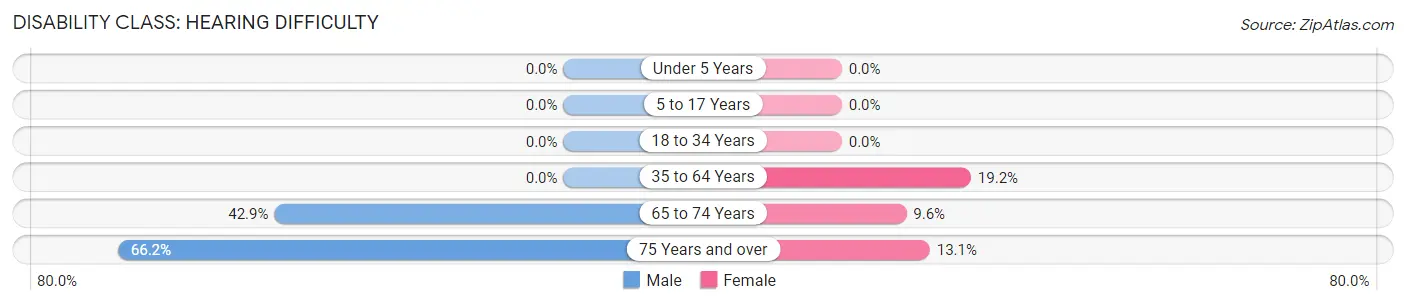
| Age Bracket | Male | Female |
| Under 5 Years | 0 (0.0%) | 0 (0.0%) |
| 5 to 17 Years | 0 (0.0%) | 0 (0.0%) |
| 18 to 34 Years | 0 (0.0%) | 0 (0.0%) |
| 35 to 64 Years | 0 (0.0%) | 23 (19.2%) |
| 65 to 74 Years | 91 (42.9%) | 26 (9.6%) |
| 75 Years and over | 129 (66.1%) | 26 (13.1%) |
Disability Class: Vision Difficulty
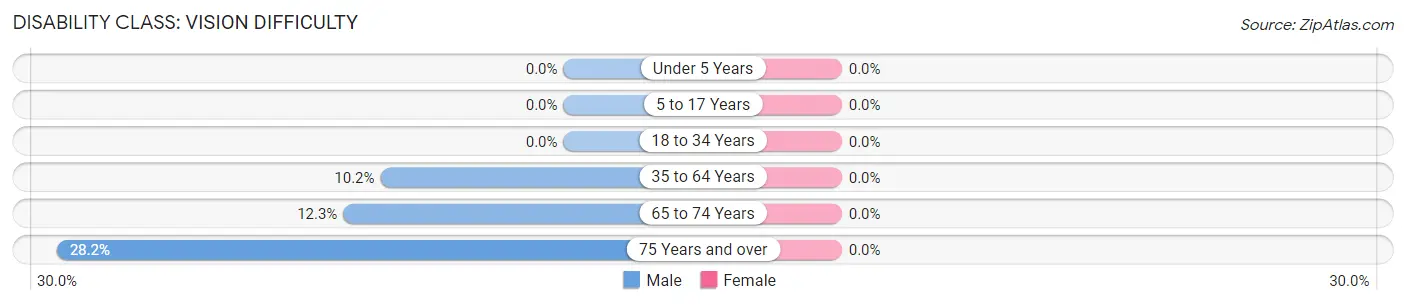
| Age Bracket | Male | Female |
| Under 5 Years | 0 (0.0%) | 0 (0.0%) |
| 5 to 17 Years | 0 (0.0%) | 0 (0.0%) |
| 18 to 34 Years | 0 (0.0%) | 0 (0.0%) |
| 35 to 64 Years | 16 (10.2%) | 0 (0.0%) |
| 65 to 74 Years | 26 (12.3%) | 0 (0.0%) |
| 75 Years and over | 55 (28.2%) | 0 (0.0%) |
Disability Class: Cognitive Difficulty
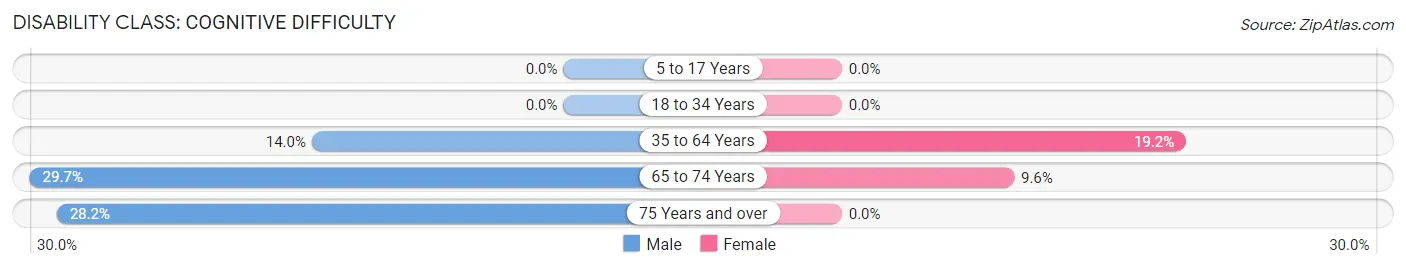
| Age Bracket | Male | Female |
| 5 to 17 Years | 0 (0.0%) | 0 (0.0%) |
| 18 to 34 Years | 0 (0.0%) | 0 (0.0%) |
| 35 to 64 Years | 22 (14.0%) | 23 (19.2%) |
| 65 to 74 Years | 63 (29.7%) | 26 (9.6%) |
| 75 Years and over | 55 (28.2%) | 0 (0.0%) |
Disability Class: Ambulatory Difficulty
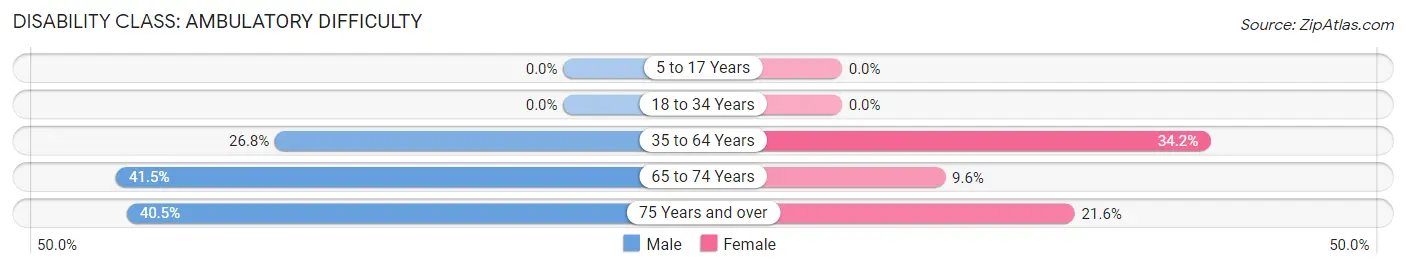
| Age Bracket | Male | Female |
| 5 to 17 Years | 0 (0.0%) | 0 (0.0%) |
| 18 to 34 Years | 0 (0.0%) | 0 (0.0%) |
| 35 to 64 Years | 42 (26.8%) | 41 (34.2%) |
| 65 to 74 Years | 88 (41.5%) | 26 (9.6%) |
| 75 Years and over | 79 (40.5%) | 43 (21.6%) |
Disability Class: Self-Care Difficulty
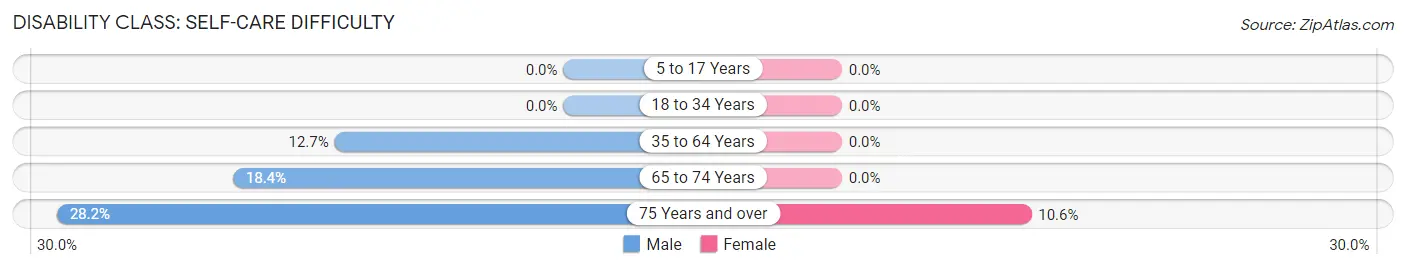
| Age Bracket | Male | Female |
| 5 to 17 Years | 0 (0.0%) | 0 (0.0%) |
| 18 to 34 Years | 0 (0.0%) | 0 (0.0%) |
| 35 to 64 Years | 20 (12.7%) | 0 (0.0%) |
| 65 to 74 Years | 39 (18.4%) | 0 (0.0%) |
| 75 Years and over | 55 (28.2%) | 21 (10.5%) |
Technology Access in Tonto Basin
Computing Device Access in Tonto Basin
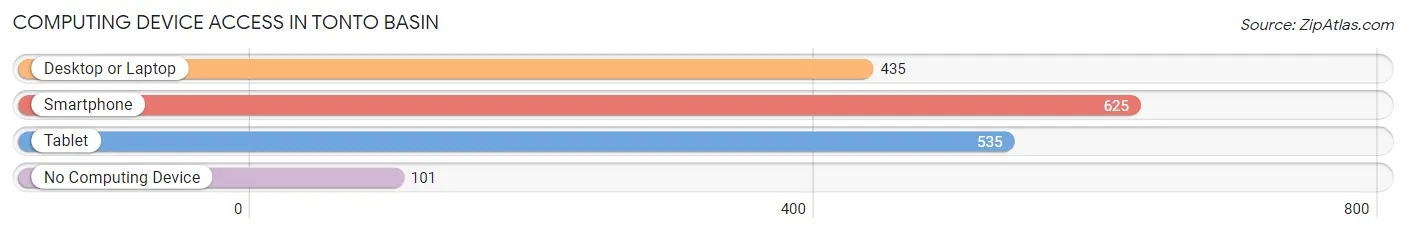
| Device Type | # Households | % Households |
| Desktop or Laptop | 435 | 58.3% |
| Smartphone | 625 | 83.8% |
| Tablet | 535 | 71.7% |
| No Computing Device | 101 | 13.5% |
| Total | 746 | 100.0% |
Internet Access in Tonto Basin
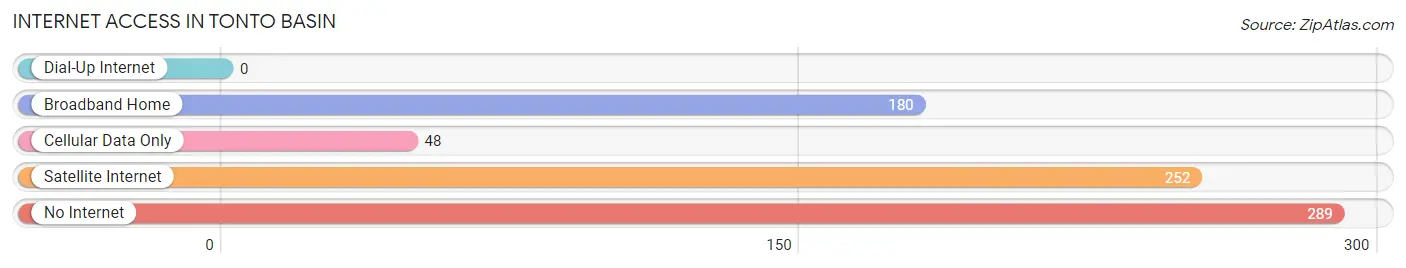
| Internet Type | # Households | % Households |
| Dial-Up Internet | 0 | 0.0% |
| Broadband Home | 180 | 24.1% |
| Cellular Data Only | 48 | 6.4% |
| Satellite Internet | 252 | 33.8% |
| No Internet | 289 | 38.7% |
| Total | 746 | 100.0% |
Tonto Basin Summary
Tonto Basin is a small rural community located in Gila County, Arizona. It is situated in the Tonto National Forest, approximately 90 miles northeast of Phoenix. The area is known for its scenic beauty, with the Tonto Creek running through the basin and the Mogollon Rim providing a stunning backdrop. The area is also home to a variety of wildlife, including deer, elk, and bighorn sheep.
History
The Tonto Basin area has been inhabited for thousands of years, with evidence of human activity dating back to the Paleo-Indian period. The area was home to the Yavapai and Apache tribes, who used the area for hunting and gathering. The first European settlers arrived in the area in the late 1800s, and the area was officially established as the Tonto Basin in 1883.
The area was initially used for ranching and farming, and the first post office was established in 1887. The area was also home to a number of mining operations, including copper, gold, and silver. The area was also home to a number of small towns, including Payson, Pine, and Strawberry.
Geography
Tonto Basin is located in Gila County, Arizona, approximately 90 miles northeast of Phoenix. The area is situated in the Tonto National Forest, and is surrounded by the Mogollon Rim to the north and the Sierra Ancha Mountains to the south. The area is known for its scenic beauty, with the Tonto Creek running through the basin and the Mogollon Rim providing a stunning backdrop.
The area has a semi-arid climate, with hot summers and mild winters. The average annual temperature is around 70 degrees Fahrenheit, with temperatures ranging from the low 40s in the winter to the high 90s in the summer. The area receives an average of 12 inches of precipitation per year, with most of it falling in the summer months.
Economy
The economy of Tonto Basin is largely based on tourism and recreation. The area is home to a number of recreational activities, including camping, fishing, hunting, and hiking. The area is also home to a number of resorts and lodges, as well as a number of restaurants and shops.
The area is also home to a number of mining operations, including copper, gold, and silver. The area is also home to a number of small businesses, including a number of ranches and farms.
Demographics
As of the 2010 census, the population of Tonto Basin was 1,424. The population is largely white (94.3%), with a small percentage of Native American (2.2%) and Hispanic (2.7%) residents. The median household income is $37,917, and the median age is 44.7 years.
Conclusion
Tonto Basin is a small rural community located in Gila County, Arizona. It is situated in the Tonto National Forest, approximately 90 miles northeast of Phoenix. The area is known for its scenic beauty, with the Tonto Creek running through the basin and the Mogollon Rim providing a stunning backdrop. The area is also home to a variety of wildlife, including deer, elk, and bighorn sheep. The economy of Tonto Basin is largely based on tourism and recreation, as well as mining operations and small businesses. The population of Tonto Basin is largely white, with a small percentage of Native American and Hispanic residents.
Common Questions
What is Per Capita Income in Tonto Basin?
Per Capita income in Tonto Basin is $28,652.
What is the Median Family Income in Tonto Basin?
Median Family Income in Tonto Basin is $51,420.
What is the Median Household income in Tonto Basin?
Median Household Income in Tonto Basin is $49,567.
What is Inequality or Gini Index in Tonto Basin?
Inequality or Gini Index in Tonto Basin is 0.36.
What is the Total Population of Tonto Basin?
Total Population of Tonto Basin is 1,380.
What is the Total Male Population of Tonto Basin?
Total Male Population of Tonto Basin is 607.
What is the Total Female Population of Tonto Basin?
Total Female Population of Tonto Basin is 773.
What is the Ratio of Males per 100 Females in Tonto Basin?
There are 78.53 Males per 100 Females in Tonto Basin.
What is the Ratio of Females per 100 Males in Tonto Basin?
There are 127.35 Females per 100 Males in Tonto Basin.
What is the Median Population Age in Tonto Basin?
Median Population Age in Tonto Basin is 70.5 Years.
What is the Average Family Size in Tonto Basin
Average Family Size in Tonto Basin is 2.4 People.
What is the Average Household Size in Tonto Basin
Average Household Size in Tonto Basin is 1.9 People.
How Large is the Labor Force in Tonto Basin?
There are 222 People in the Labor Forcein in Tonto Basin.
What is the Percentage of People in the Labor Force in Tonto Basin?
17.4% of People are in the Labor Force in Tonto Basin.