Chino Valley, AZ Map & Demographics
Chino Valley Map
Chino Valley Overview
$31,423
PER CAPITA INCOME
$69,919
AVG FAMILY INCOME
$55,682
AVG HOUSEHOLD INCOME
35.9%
WAGE / INCOME GAP [ % ]
64.1¢/ $1
WAGE / INCOME GAP [ $ ]
$10,725
FAMILY INCOME DEFICIT
0.37
INEQUALITY / GINI INDEX
13,120
TOTAL POPULATION
6,224
MALE POPULATION
6,896
FEMALE POPULATION
90.26
MALES / 100 FEMALES
110.80
FEMALES / 100 MALES
51.5
MEDIAN AGE
2.7
AVG FAMILY SIZE
2.3
AVG HOUSEHOLD SIZE
5,396
LABOR FORCE [ PEOPLE ]
48.4%
PERCENT IN LABOR FORCE
5.2%
UNEMPLOYMENT RATE
Chino Valley Zip Codes
Chino Valley Area Codes
Income in Chino Valley
Income Overview in Chino Valley
Per Capita Income in Chino Valley is $31,423, while median incomes of families and households are $69,919 and $55,682 respectively.
| Characteristic | Number | Measure |
| Per Capita Income | 13,120 | $31,423 |
| Median Family Income | 3,912 | $69,919 |
| Mean Family Income | 3,912 | $82,203 |
| Median Household Income | 5,624 | $55,682 |
| Mean Household Income | 5,624 | $71,180 |
| Income Deficit | 3,912 | $10,725 |
| Wage / Income Gap (%) | 13,120 | 35.91% |
| Wage / Income Gap ($) | 13,120 | 64.09¢ per $1 |
| Gini / Inequality Index | 13,120 | 0.37 |
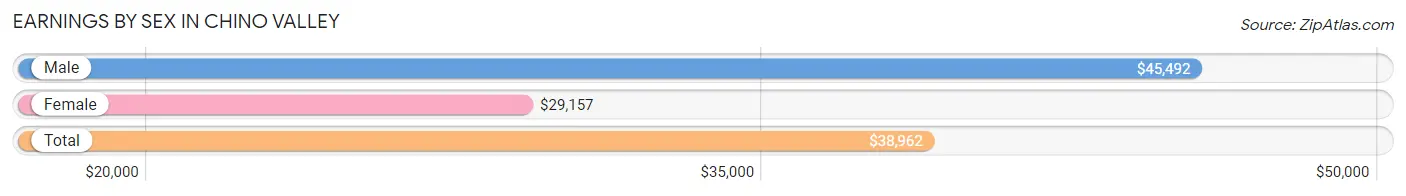
Earnings by Sex in Chino Valley
Average Earnings in Chino Valley are $38,962, $45,492 for men and $29,157 for women, a difference of 35.9%.
| Sex | Number | Average Earnings |
| Male | 2,732 (46.2%) | $45,492 |
| Female | 3,179 (53.8%) | $29,157 |
| Total | 5,911 (100.0%) | $38,962 |
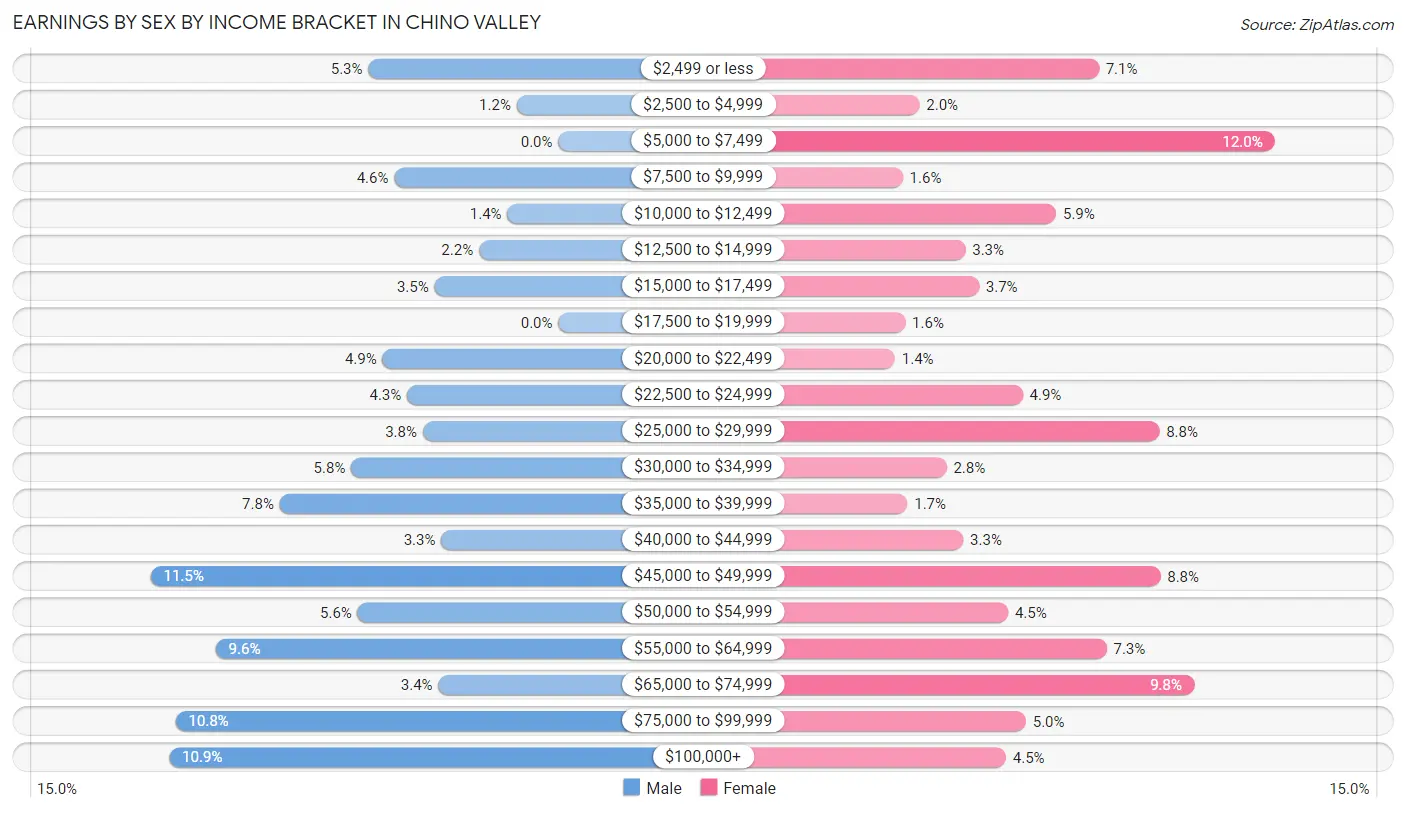
Earnings by Sex by Income Bracket in Chino Valley
The most common earnings brackets in Chino Valley are $45,000 to $49,999 for men (313 | 11.5%) and $5,000 to $7,499 for women (382 | 12.0%).
| Income | Male | Female |
| $2,499 or less | 146 (5.3%) | 225 (7.1%) |
| $2,500 to $4,999 | 32 (1.2%) | 65 (2.0%) |
| $5,000 to $7,499 | 0 (0.0%) | 382 (12.0%) |
| $7,500 to $9,999 | 126 (4.6%) | 50 (1.6%) |
| $10,000 to $12,499 | 39 (1.4%) | 187 (5.9%) |
| $12,500 to $14,999 | 61 (2.2%) | 106 (3.3%) |
| $15,000 to $17,499 | 95 (3.5%) | 118 (3.7%) |
| $17,500 to $19,999 | 0 (0.0%) | 52 (1.6%) |
| $20,000 to $22,499 | 135 (4.9%) | 43 (1.3%) |
| $22,500 to $24,999 | 116 (4.3%) | 157 (4.9%) |
| $25,000 to $29,999 | 104 (3.8%) | 279 (8.8%) |
| $30,000 to $34,999 | 159 (5.8%) | 89 (2.8%) |
| $35,000 to $39,999 | 214 (7.8%) | 54 (1.7%) |
| $40,000 to $44,999 | 90 (3.3%) | 104 (3.3%) |
| $45,000 to $49,999 | 313 (11.5%) | 280 (8.8%) |
| $50,000 to $54,999 | 154 (5.6%) | 144 (4.5%) |
| $55,000 to $64,999 | 263 (9.6%) | 232 (7.3%) |
| $65,000 to $74,999 | 92 (3.4%) | 310 (9.8%) |
| $75,000 to $99,999 | 294 (10.8%) | 160 (5.0%) |
| $100,000+ | 299 (10.9%) | 142 (4.5%) |
| Total | 2,732 (100.0%) | 3,179 (100.0%) |
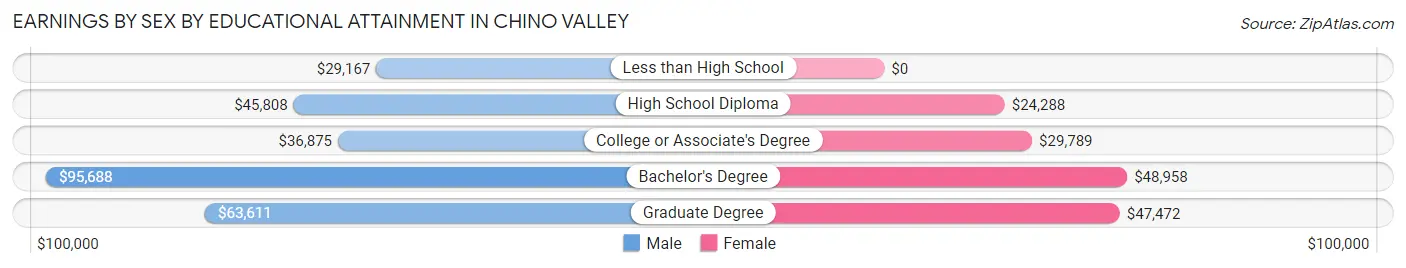
Earnings by Sex by Educational Attainment in Chino Valley
Average earnings in Chino Valley are $47,159 for men and $40,676 for women, a difference of 13.8%. Men with an educational attainment of bachelor's degree enjoy the highest average annual earnings of $95,688, while those with less than high school education earn the least with $29,167. Women with an educational attainment of bachelor's degree earn the most with the average annual earnings of $48,958, while those with high school diploma education have the smallest earnings of $24,288.
| Educational Attainment | Male Income | Female Income |
| Less than High School | $29,167 | $0 |
| High School Diploma | $45,808 | $24,288 |
| College or Associate's Degree | $36,875 | $29,789 |
| Bachelor's Degree | $95,688 | $48,958 |
| Graduate Degree | $63,611 | $47,472 |
| Total | $47,159 | $40,676 |
Family Income in Chino Valley
Family Income Brackets in Chino Valley
According to the Chino Valley family income data, there are 970 families falling into the $100,000 to $149,999 income range, which is the most common income bracket and makes up 24.8% of all families. Conversely, the $10,000 to $14,999 income bracket is the least frequent group with only 16 families (0.4%) belonging to this category.
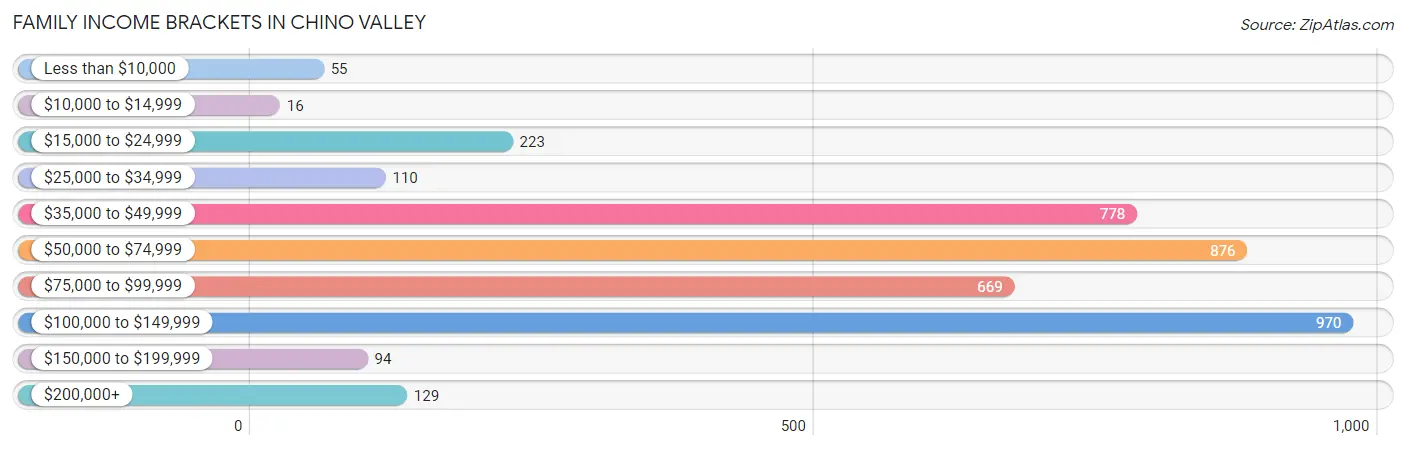
| Income Bracket | # Families | % Families |
| Less than $10,000 | 55 | 1.4% |
| $10,000 to $14,999 | 16 | 0.4% |
| $15,000 to $24,999 | 223 | 5.7% |
| $25,000 to $34,999 | 110 | 2.8% |
| $35,000 to $49,999 | 778 | 19.9% |
| $50,000 to $74,999 | 876 | 22.4% |
| $75,000 to $99,999 | 669 | 17.1% |
| $100,000 to $149,999 | 970 | 24.8% |
| $150,000 to $199,999 | 94 | 2.4% |
| $200,000+ | 129 | 3.3% |
Family Income by Famaliy Size in Chino Valley
4-person families (691 | 17.7%) account for the highest median family income in Chino Valley with $100,365 per family, while 2-person families (2,353 | 60.2%) have the highest median income of $33,656 per family member.
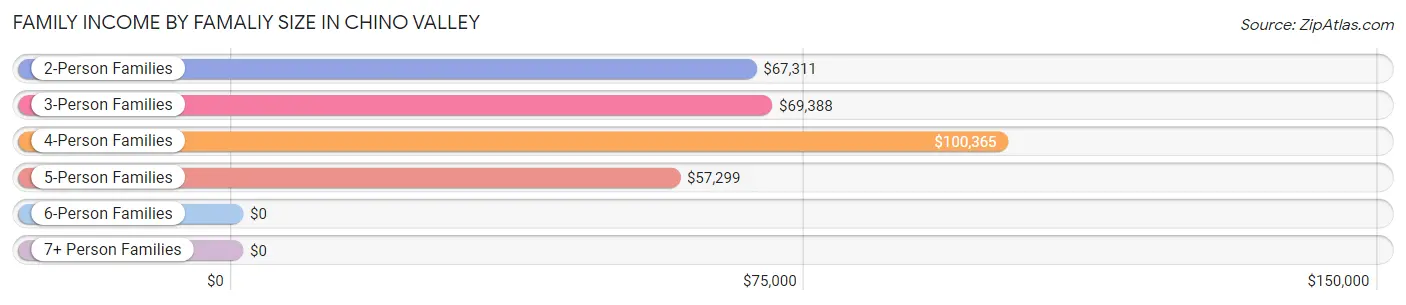
| Income Bracket | # Families | Median Income |
| 2-Person Families | 2,353 (60.2%) | $67,311 |
| 3-Person Families | 642 (16.4%) | $69,388 |
| 4-Person Families | 691 (17.7%) | $100,365 |
| 5-Person Families | 117 (3.0%) | $57,299 |
| 6-Person Families | 109 (2.8%) | $0 |
| 7+ Person Families | 0 (0.0%) | $0 |
| Total | 3,912 (100.0%) | $69,919 |
Family Income by Number of Earners in Chino Valley
The median family income in Chino Valley is $69,919, with families comprising 3+ earners (122) having the highest median family income of $197,500, while families with no earners (1,254) have the lowest median family income of $48,839, accounting for 3.1% and 32.1% of families, respectively.
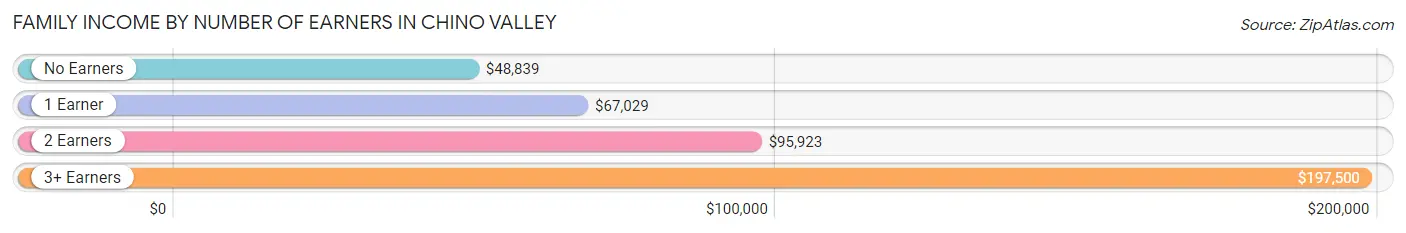
| Number of Earners | # Families | Median Income |
| No Earners | 1,254 (32.1%) | $48,839 |
| 1 Earner | 995 (25.4%) | $67,029 |
| 2 Earners | 1,541 (39.4%) | $95,923 |
| 3+ Earners | 122 (3.1%) | $197,500 |
| Total | 3,912 (100.0%) | $69,919 |
Household Income in Chino Valley
Household Income Brackets in Chino Valley
With 1,226 households falling in the category, the $50,000 to $74,999 income range is the most frequent in Chino Valley, accounting for 21.8% of all households. In contrast, only 79 households (1.4%) fall into the $10,000 to $14,999 income bracket, making it the least populous group.
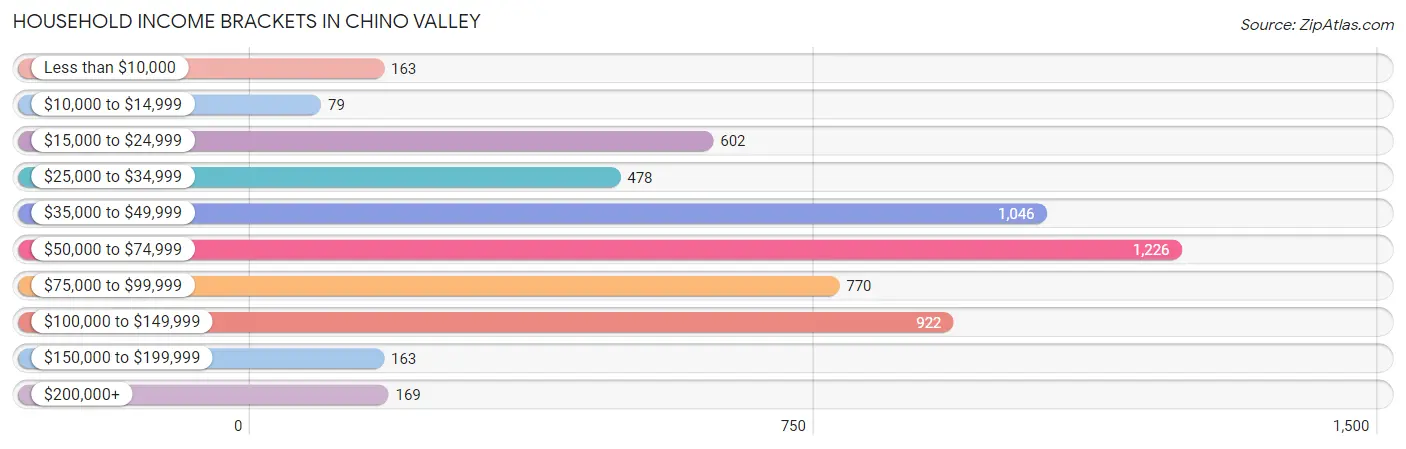
| Income Bracket | # Households | % Households |
| Less than $10,000 | 163 | 2.9% |
| $10,000 to $14,999 | 79 | 1.4% |
| $15,000 to $24,999 | 602 | 10.7% |
| $25,000 to $34,999 | 478 | 8.5% |
| $35,000 to $49,999 | 1,046 | 18.6% |
| $50,000 to $74,999 | 1,226 | 21.8% |
| $75,000 to $99,999 | 770 | 13.7% |
| $100,000 to $149,999 | 922 | 16.4% |
| $150,000 to $199,999 | 163 | 2.9% |
| $200,000+ | 169 | 3.0% |
Household Income by Householder Age in Chino Valley
The median household income in Chino Valley is $55,682, with the highest median household income of $115,101 found in the 15 to 24 years age bracket for the primary householder. A total of 164 households (2.9%) fall into this category. Meanwhile, the 65+ years age bracket for the primary householder has the lowest median household income of $45,036, with 2,424 households (43.1%) in this group.
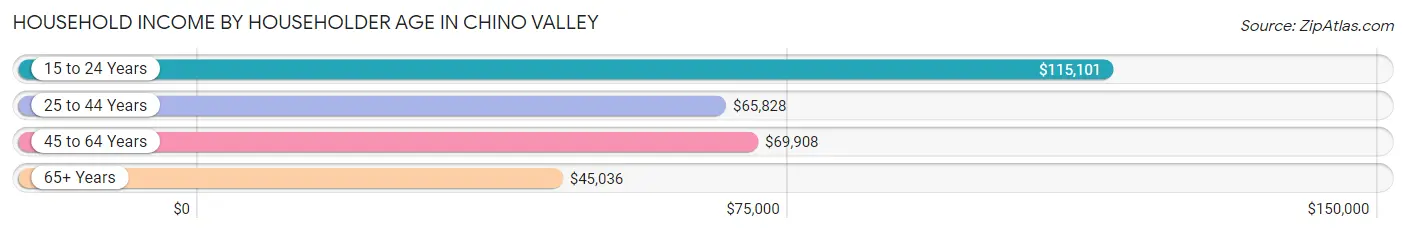
| Income Bracket | # Households | Median Income |
| 15 to 24 Years | 164 (2.9%) | $115,101 |
| 25 to 44 Years | 959 (17.1%) | $65,828 |
| 45 to 64 Years | 2,077 (36.9%) | $69,908 |
| 65+ Years | 2,424 (43.1%) | $45,036 |
| Total | 5,624 (100.0%) | $55,682 |
Poverty in Chino Valley
Income Below Poverty by Sex and Age in Chino Valley
With 6.4% poverty level for males and 9.3% for females among the residents of Chino Valley, 5 year old males and 5 year old females are the most vulnerable to poverty, with 40 males (100.0%) and 38 females (84.4%) in their respective age groups living below the poverty level.
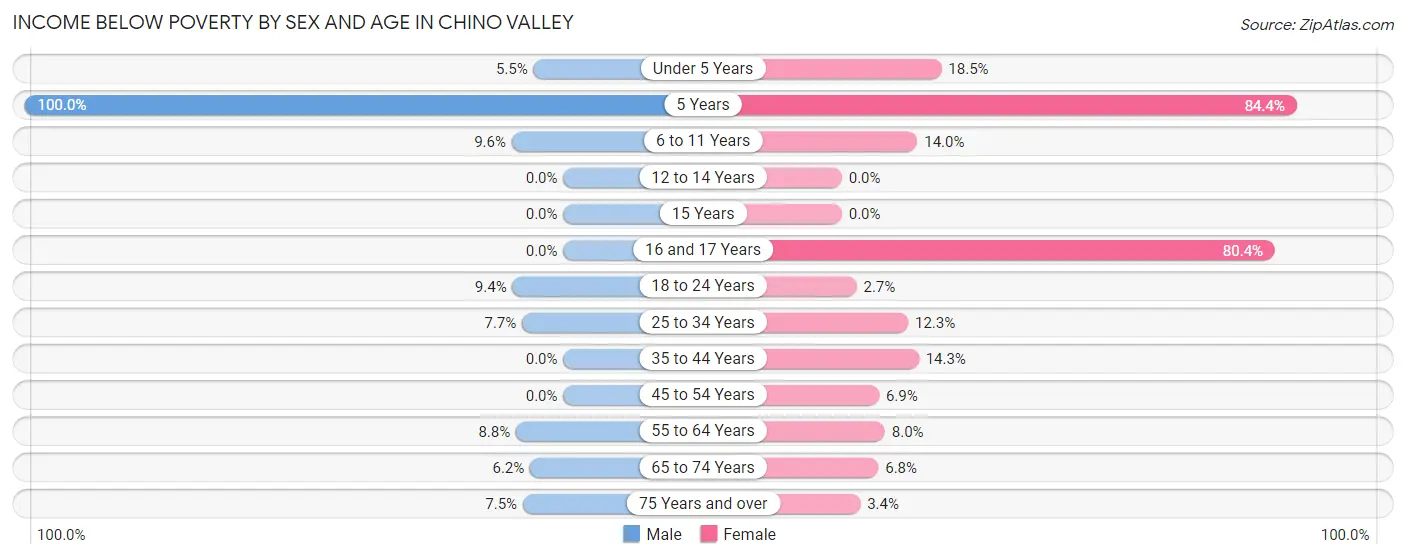
| Age Bracket | Male | Female |
| Under 5 Years | 18 (5.5%) | 71 (18.5%) |
| 5 Years | 40 (100.0%) | 38 (84.4%) |
| 6 to 11 Years | 41 (9.6%) | 38 (14.0%) |
| 12 to 14 Years | 0 (0.0%) | 0 (0.0%) |
| 15 Years | 0 (0.0%) | 0 (0.0%) |
| 16 and 17 Years | 0 (0.0%) | 41 (80.4%) |
| 18 to 24 Years | 51 (9.4%) | 14 (2.7%) |
| 25 to 34 Years | 55 (7.7%) | 68 (12.3%) |
| 35 to 44 Years | 0 (0.0%) | 103 (14.3%) |
| 45 to 54 Years | 0 (0.0%) | 62 (6.9%) |
| 55 to 64 Years | 80 (8.8%) | 98 (8.0%) |
| 65 to 74 Years | 71 (6.2%) | 77 (6.8%) |
| 75 Years and over | 43 (7.5%) | 26 (3.4%) |
| Total | 399 (6.4%) | 636 (9.3%) |
Income Above Poverty by Sex and Age in Chino Valley
According to the poverty statistics in Chino Valley, males aged 12 to 14 years and females aged 12 to 14 years are the age groups that are most secure financially, with 100.0% of males and 100.0% of females in these age groups living above the poverty line.
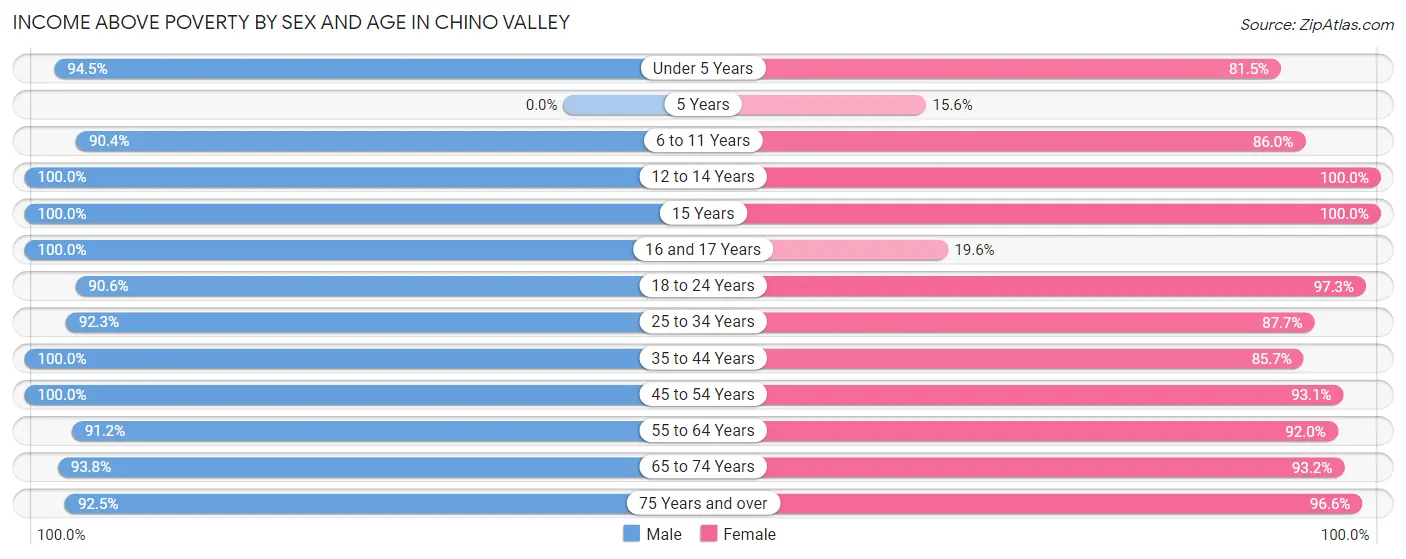
| Age Bracket | Male | Female |
| Under 5 Years | 308 (94.5%) | 313 (81.5%) |
| 5 Years | 0 (0.0%) | 7 (15.6%) |
| 6 to 11 Years | 388 (90.4%) | 233 (86.0%) |
| 12 to 14 Years | 117 (100.0%) | 240 (100.0%) |
| 15 Years | 26 (100.0%) | 53 (100.0%) |
| 16 and 17 Years | 213 (100.0%) | 10 (19.6%) |
| 18 to 24 Years | 489 (90.6%) | 499 (97.3%) |
| 25 to 34 Years | 663 (92.3%) | 485 (87.7%) |
| 35 to 44 Years | 362 (100.0%) | 619 (85.7%) |
| 45 to 54 Years | 804 (100.0%) | 837 (93.1%) |
| 55 to 64 Years | 831 (91.2%) | 1,128 (92.0%) |
| 65 to 74 Years | 1,079 (93.8%) | 1,060 (93.2%) |
| 75 Years and over | 530 (92.5%) | 735 (96.6%) |
| Total | 5,810 (93.6%) | 6,219 (90.7%) |
Income Below Poverty Among Married-Couple Families in Chino Valley
The poverty statistics for married-couple families in Chino Valley show that 3.7% or 109 of the total 2,914 families live below the poverty line. Families with 3 or 4 children have the highest poverty rate of 30.2%, comprising of 38 families. On the other hand, families with 1 or 2 children have the lowest poverty rate of 2.2%, which includes 14 families.
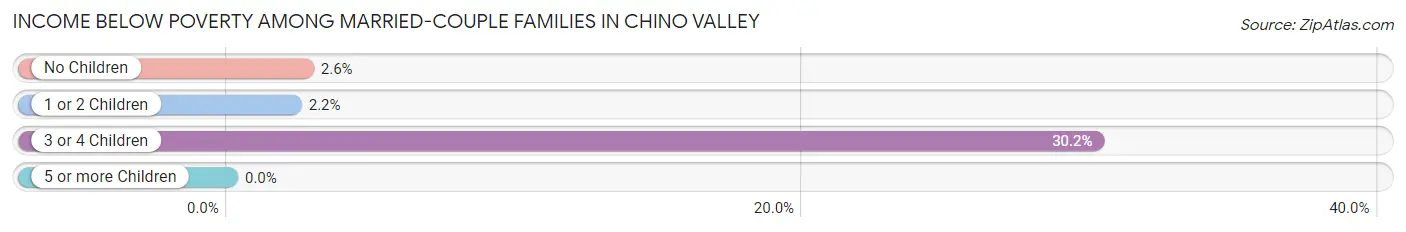
| Children | Above Poverty | Below Poverty |
| No Children | 2,100 (97.4%) | 57 (2.6%) |
| 1 or 2 Children | 617 (97.8%) | 14 (2.2%) |
| 3 or 4 Children | 88 (69.8%) | 38 (30.2%) |
| 5 or more Children | 0 (0.0%) | 0 (0.0%) |
| Total | 2,805 (96.3%) | 109 (3.7%) |
Income Below Poverty Among Single-Parent Households in Chino Valley
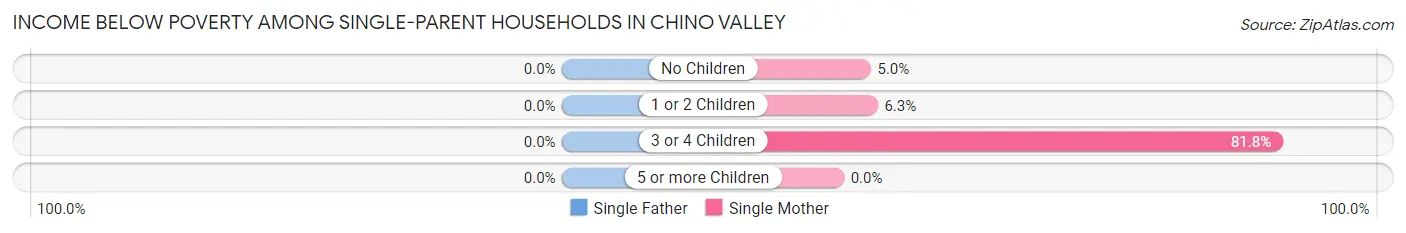
| Children | Single Father | Single Mother |
| No Children | 0 (0.0%) | 15 (5.0%) |
| 1 or 2 Children | 0 (0.0%) | 22 (6.3%) |
| 3 or 4 Children | 0 (0.0%) | 36 (81.8%) |
| 5 or more Children | 0 (0.0%) | 0 (0.0%) |
| Total | 0 (0.0%) | 73 (10.5%) |
Income Below Poverty Among Married-Couple vs Single-Parent Households in Chino Valley
The poverty data for Chino Valley shows that 109 of the married-couple family households (3.7%) and 73 of the single-parent households (7.3%) are living below the poverty level. Within the married-couple family households, those with 3 or 4 children have the highest poverty rate, with 38 households (30.2%) falling below the poverty line. Among the single-parent households, those with 3 or 4 children have the highest poverty rate, with 36 household (81.8%) living below poverty.
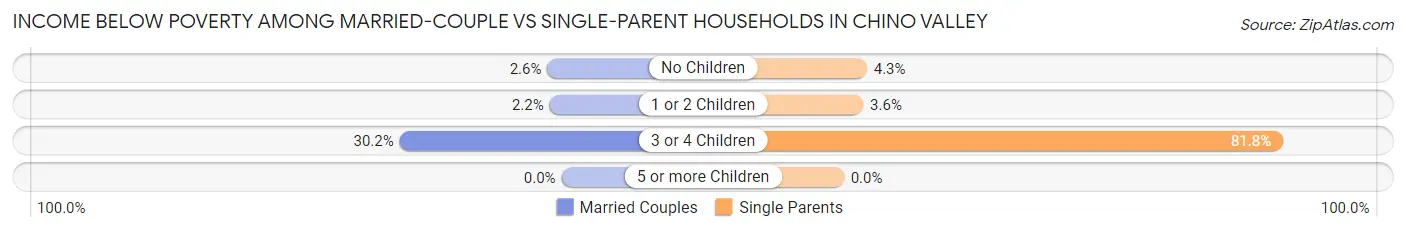
| Children | Married-Couple Families | Single-Parent Households |
| No Children | 57 (2.6%) | 15 (4.3%) |
| 1 or 2 Children | 14 (2.2%) | 22 (3.6%) |
| 3 or 4 Children | 38 (30.2%) | 36 (81.8%) |
| 5 or more Children | 0 (0.0%) | 0 (0.0%) |
| Total | 109 (3.7%) | 73 (7.3%) |
Race in Chino Valley
The most populous races in Chino Valley are White / Caucasian (11,512 | 87.7%), Hispanic or Latino (2,131 | 16.2%), and Two or more Races (1,041 | 7.9%).
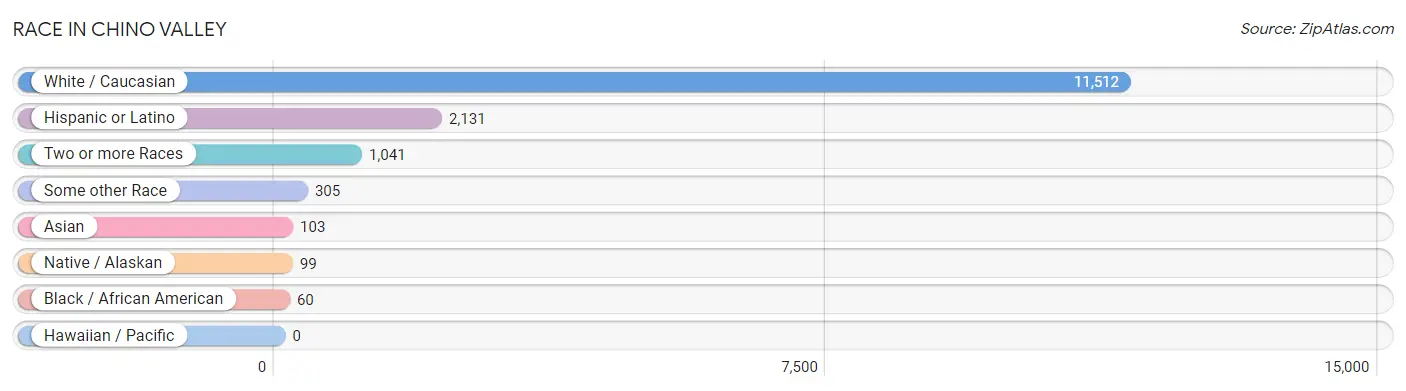
| Race | # Population | % Population |
| Asian | 103 | 0.8% |
| Black / African American | 60 | 0.5% |
| Hawaiian / Pacific | 0 | 0.0% |
| Hispanic or Latino | 2,131 | 16.2% |
| Native / Alaskan | 99 | 0.7% |
| White / Caucasian | 11,512 | 87.7% |
| Two or more Races | 1,041 | 7.9% |
| Some other Race | 305 | 2.3% |
| Total | 13,120 | 100.0% |
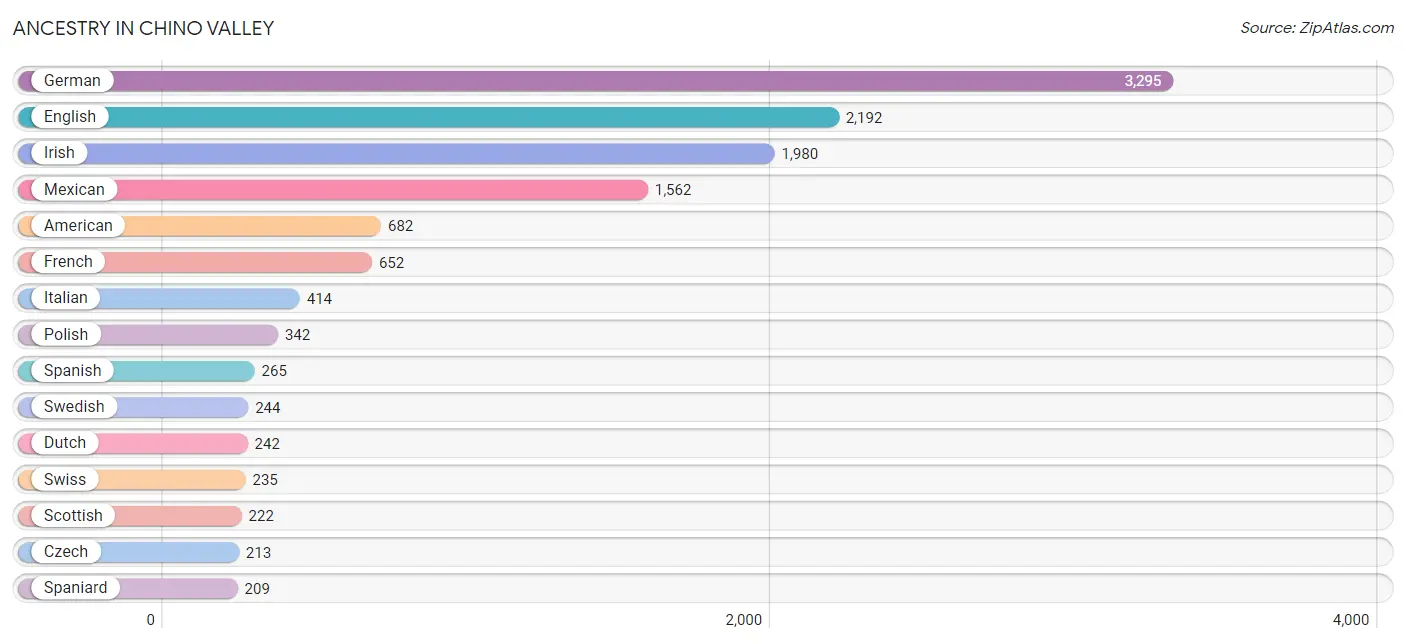
Ancestry in Chino Valley
The most populous ancestries reported in Chino Valley are German (3,295 | 25.1%), English (2,192 | 16.7%), Irish (1,980 | 15.1%), Mexican (1,562 | 11.9%), and American (682 | 5.2%), together accounting for 74.0% of all Chino Valley residents.
| Ancestry | # Population | % Population |
| American | 682 | 5.2% |
| Apache | 80 | 0.6% |
| Bhutanese | 44 | 0.3% |
| British | 93 | 0.7% |
| Burmese | 79 | 0.6% |
| Cajun | 7 | 0.1% |
| Canadian | 60 | 0.5% |
| Central American | 24 | 0.2% |
| Cherokee | 105 | 0.8% |
| Chippewa | 97 | 0.7% |
| Croatian | 18 | 0.1% |
| Czech | 213 | 1.6% |
| Danish | 195 | 1.5% |
| Dutch | 242 | 1.8% |
| English | 2,192 | 16.7% |
| European | 189 | 1.4% |
| Finnish | 49 | 0.4% |
| French | 652 | 5.0% |
| French Canadian | 32 | 0.2% |
| German | 3,295 | 25.1% |
| Greek | 49 | 0.4% |
| Hungarian | 180 | 1.4% |
| Irish | 1,980 | 15.1% |
| Italian | 414 | 3.2% |
| Korean | 47 | 0.4% |
| Lithuanian | 34 | 0.3% |
| Luxembourger | 11 | 0.1% |
| Malaysian | 7 | 0.1% |
| Mexican | 1,562 | 11.9% |
| Northern European | 33 | 0.3% |
| Norwegian | 135 | 1.0% |
| Polish | 342 | 2.6% |
| Portuguese | 45 | 0.3% |
| Puerto Rican | 70 | 0.5% |
| Russian | 42 | 0.3% |
| Salvadoran | 24 | 0.2% |
| Scandinavian | 80 | 0.6% |
| Scotch-Irish | 173 | 1.3% |
| Scottish | 222 | 1.7% |
| Slovak | 30 | 0.2% |
| Slovene | 28 | 0.2% |
| Spaniard | 209 | 1.6% |
| Spanish | 265 | 2.0% |
| Swedish | 244 | 1.9% |
| Swiss | 235 | 1.8% |
| Thai | 29 | 0.2% |
| Ukrainian | 38 | 0.3% |
| Welsh | 88 | 0.7% | View All 48 Rows |
Immigrants in Chino Valley
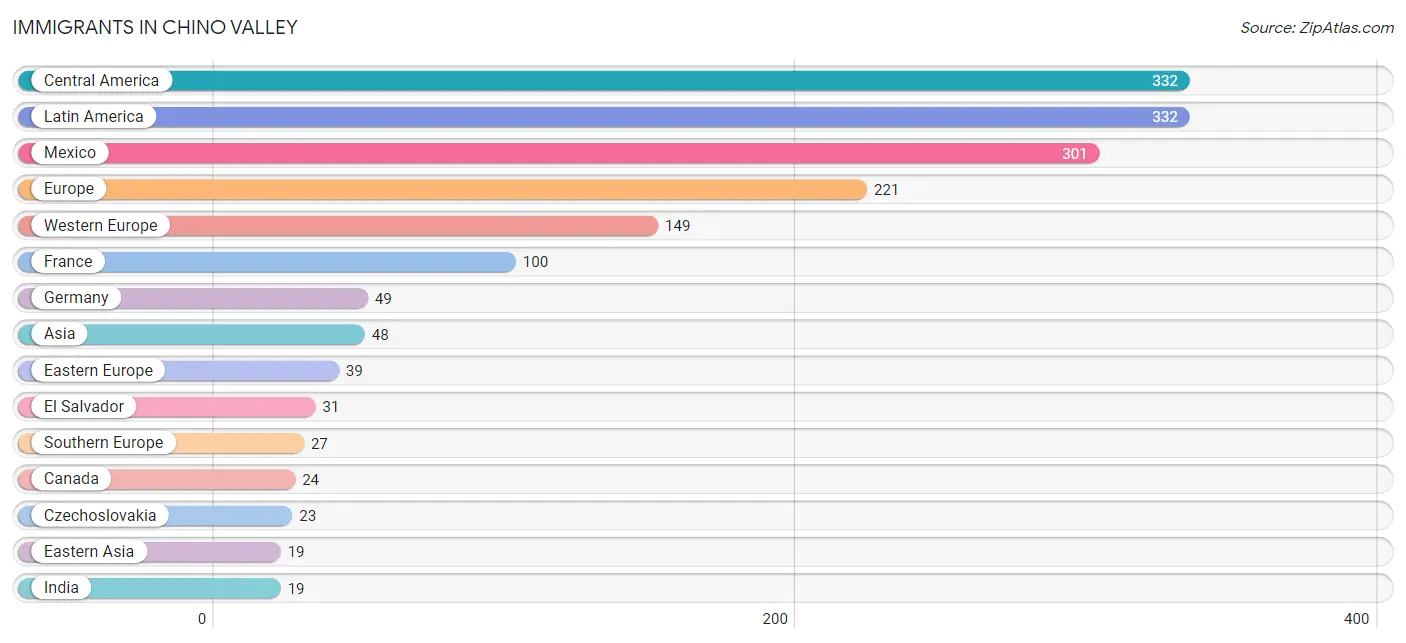
The most numerous immigrant groups reported in Chino Valley came from Central America (332 | 2.5%), Latin America (332 | 2.5%), Mexico (301 | 2.3%), Europe (221 | 1.7%), and Western Europe (149 | 1.1%), together accounting for 10.2% of all Chino Valley residents.
| Immigration Origin | # Population | % Population |
| Asia | 48 | 0.4% |
| Canada | 24 | 0.2% |
| Central America | 332 | 2.5% |
| Czechoslovakia | 23 | 0.2% |
| Eastern Asia | 19 | 0.1% |
| Eastern Europe | 39 | 0.3% |
| El Salvador | 31 | 0.2% |
| Europe | 221 | 1.7% |
| France | 100 | 0.8% |
| Germany | 49 | 0.4% |
| India | 19 | 0.1% |
| Italy | 17 | 0.1% |
| Japan | 19 | 0.1% |
| Latin America | 332 | 2.5% |
| Mexico | 301 | 2.3% |
| Northern Europe | 6 | 0.1% |
| Portugal | 10 | 0.1% |
| Russia | 16 | 0.1% |
| Saudi Arabia | 10 | 0.1% |
| South Central Asia | 19 | 0.1% |
| Southern Europe | 27 | 0.2% |
| Western Asia | 10 | 0.1% |
| Western Europe | 149 | 1.1% | View All 23 Rows |
Sex and Age in Chino Valley
Sex and Age in Chino Valley
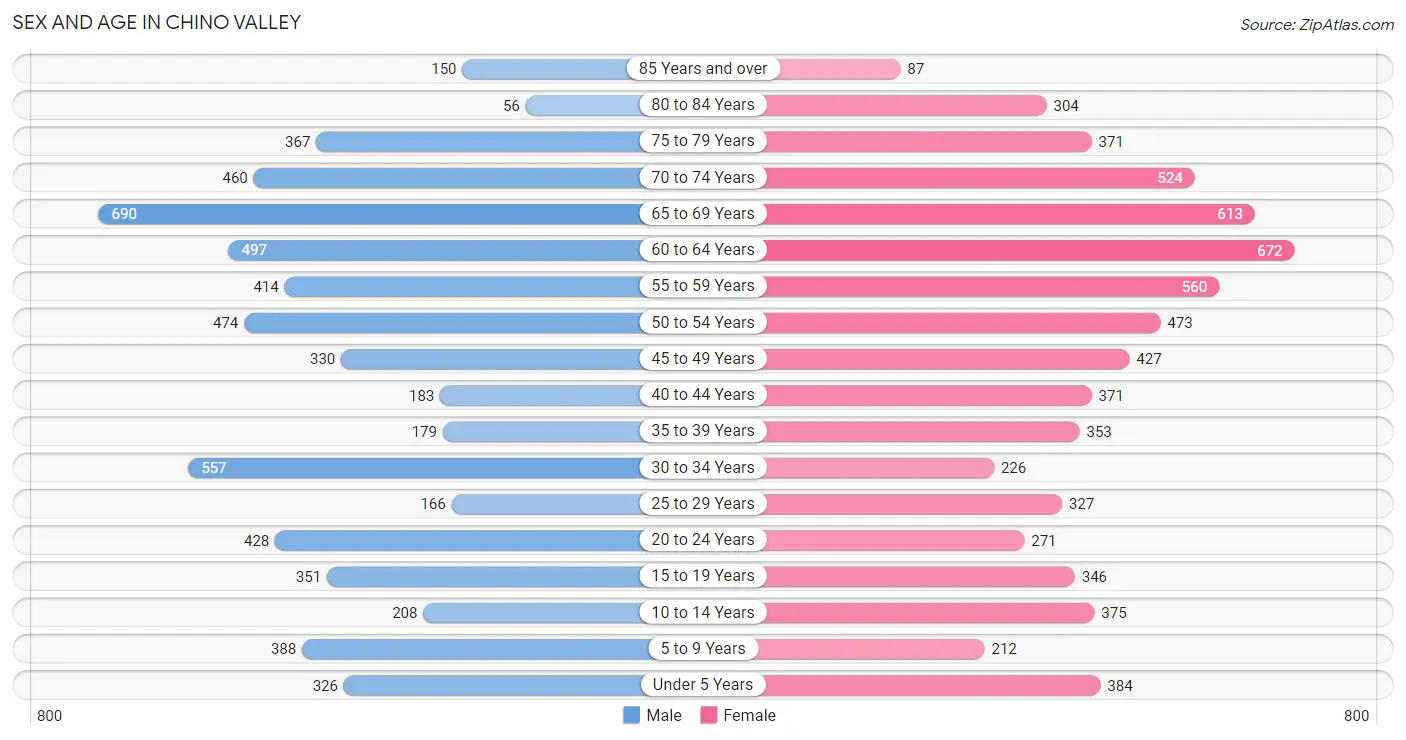
The most populous age groups in Chino Valley are 65 to 69 Years (690 | 11.1%) for men and 60 to 64 Years (672 | 9.7%) for women.
| Age Bracket | Male | Female |
| Under 5 Years | 326 (5.2%) | 384 (5.6%) |
| 5 to 9 Years | 388 (6.2%) | 212 (3.1%) |
| 10 to 14 Years | 208 (3.3%) | 375 (5.4%) |
| 15 to 19 Years | 351 (5.6%) | 346 (5.0%) |
| 20 to 24 Years | 428 (6.9%) | 271 (3.9%) |
| 25 to 29 Years | 166 (2.7%) | 327 (4.7%) |
| 30 to 34 Years | 557 (8.9%) | 226 (3.3%) |
| 35 to 39 Years | 179 (2.9%) | 353 (5.1%) |
| 40 to 44 Years | 183 (2.9%) | 371 (5.4%) |
| 45 to 49 Years | 330 (5.3%) | 427 (6.2%) |
| 50 to 54 Years | 474 (7.6%) | 473 (6.9%) |
| 55 to 59 Years | 414 (6.7%) | 560 (8.1%) |
| 60 to 64 Years | 497 (8.0%) | 672 (9.7%) |
| 65 to 69 Years | 690 (11.1%) | 613 (8.9%) |
| 70 to 74 Years | 460 (7.4%) | 524 (7.6%) |
| 75 to 79 Years | 367 (5.9%) | 371 (5.4%) |
| 80 to 84 Years | 56 (0.9%) | 304 (4.4%) |
| 85 Years and over | 150 (2.4%) | 87 (1.3%) |
| Total | 6,224 (100.0%) | 6,896 (100.0%) |
Families and Households in Chino Valley
Median Family Size in Chino Valley
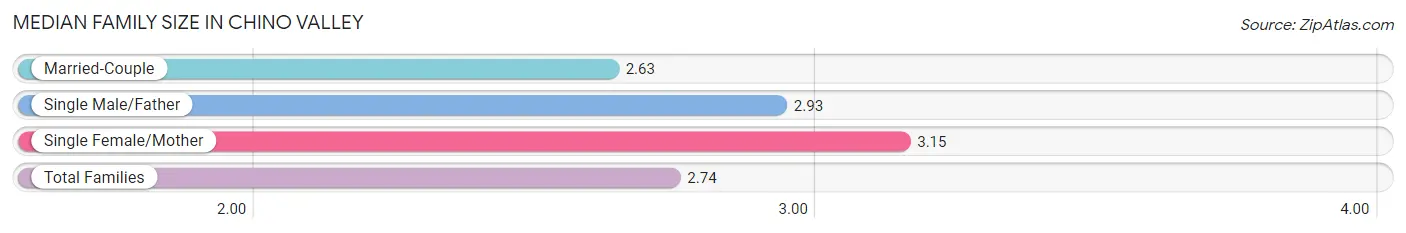
The median family size in Chino Valley is 2.74 persons per family, with single female/mother families (694 | 17.7%) accounting for the largest median family size of 3.15 persons per family. On the other hand, married-couple families (2,914 | 74.5%) represent the smallest median family size with 2.63 persons per family.
| Family Type | # Families | Family Size |
| Married-Couple | 2,914 (74.5%) | 2.63 |
| Single Male/Father | 304 (7.8%) | 2.93 |
| Single Female/Mother | 694 (17.7%) | 3.15 |
| Total Families | 3,912 (100.0%) | 2.74 |
Median Household Size in Chino Valley
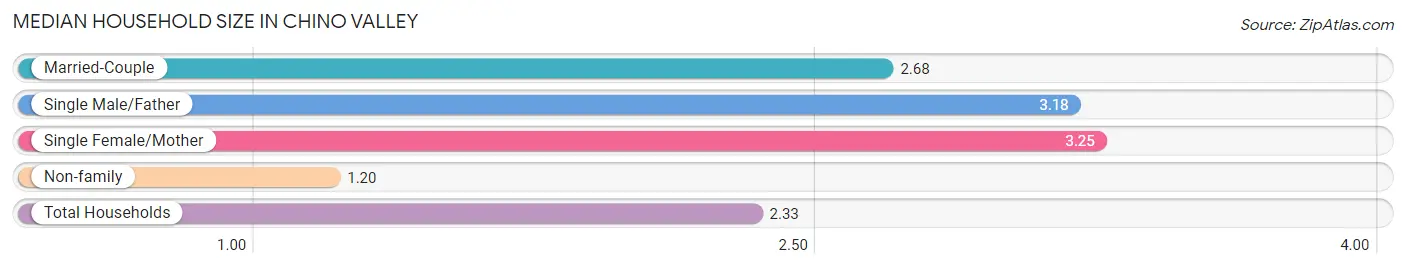
The median household size in Chino Valley is 2.33 persons per household, with single female/mother households (694 | 12.3%) accounting for the largest median household size of 3.25 persons per household. non-family households (1,712 | 30.4%) represent the smallest median household size with 1.20 persons per household.
| Household Type | # Households | Household Size |
| Married-Couple | 2,914 (51.8%) | 2.68 |
| Single Male/Father | 304 (5.4%) | 3.18 |
| Single Female/Mother | 694 (12.3%) | 3.25 |
| Non-family | 1,712 (30.4%) | 1.20 |
| Total Households | 5,624 (100.0%) | 2.33 |
Household Size by Marriage Status in Chino Valley
Out of a total of 5,624 households in Chino Valley, 3,912 (69.6%) are family households, while 1,712 (30.4%) are nonfamily households. The most numerous type of family households are 2-person households, comprising 2,214, and the most common type of nonfamily households are 1-person households, comprising 1,420.
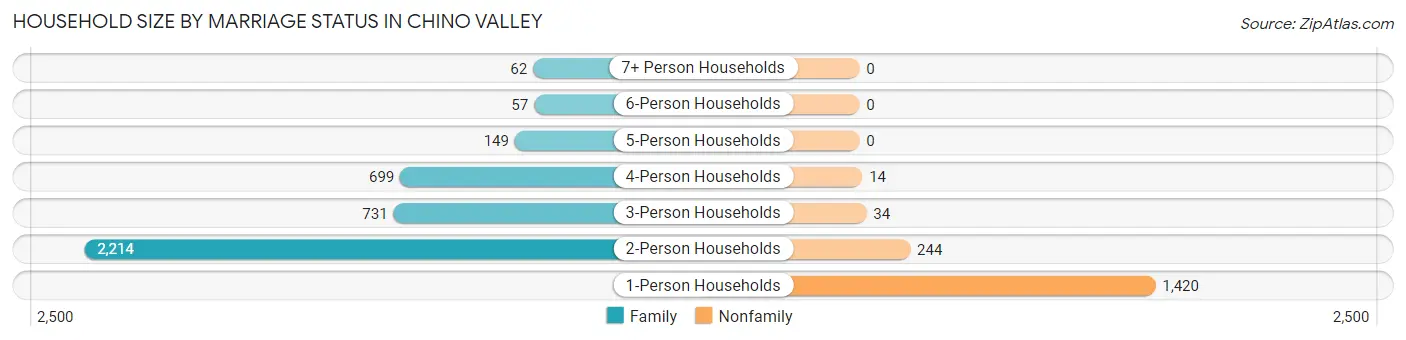
| Household Size | Family Households | Nonfamily Households |
| 1-Person Households | - | 1,420 (25.3%) |
| 2-Person Households | 2,214 (39.4%) | 244 (4.3%) |
| 3-Person Households | 731 (13.0%) | 34 (0.6%) |
| 4-Person Households | 699 (12.4%) | 14 (0.3%) |
| 5-Person Households | 149 (2.6%) | 0 (0.0%) |
| 6-Person Households | 57 (1.0%) | 0 (0.0%) |
| 7+ Person Households | 62 (1.1%) | 0 (0.0%) |
| Total | 3,912 (69.6%) | 1,712 (30.4%) |
Female Fertility in Chino Valley
Fertility by Age in Chino Valley
Average fertility rate in Chino Valley is 90.0 births per 1,000 women. Women in the age bracket of 20 to 34 years have the highest fertility rate with 239.0 births per 1,000 women. Women in the age bracket of 20 to 34 years acount for 93.4% of all women with births.
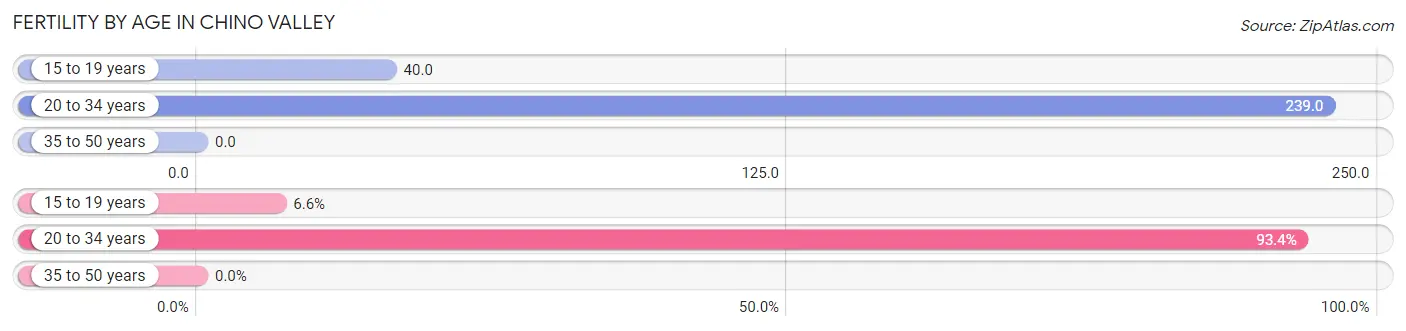
| Age Bracket | Women with Births | Births / 1,000 Women |
| 15 to 19 years | 14 (6.6%) | 40.0 |
| 20 to 34 years | 197 (93.4%) | 239.0 |
| 35 to 50 years | 0 (0.0%) | 0.0 |
| Total | 211 (100.0%) | 90.0 |
Fertility by Age by Marriage Status in Chino Valley
21.8% of women with births (211) in Chino Valley are married. The highest percentage of unmarried women with births falls into 20 to 34 years age bracket with 83.8% of them unmarried at the time of birth, while the lowest percentage of unmarried women with births belong to 15 to 19 years age bracket with 0.0% of them unmarried.
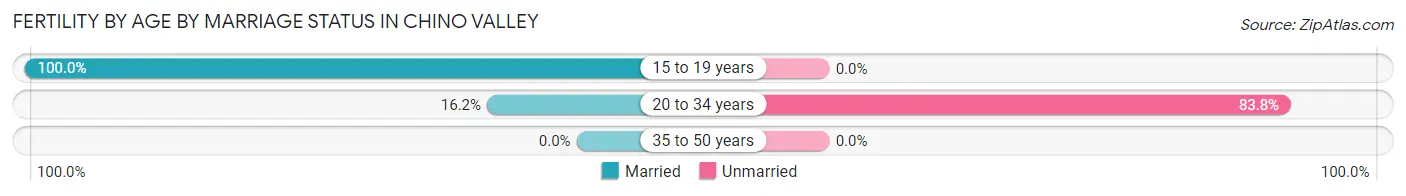
| Age Bracket | Married | Unmarried |
| 15 to 19 years | 14 (100.0%) | 0 (0.0%) |
| 20 to 34 years | 32 (16.2%) | 165 (83.8%) |
| 35 to 50 years | 0 (0.0%) | 0 (0.0%) |
| Total | 46 (21.8%) | 165 (78.2%) |
Fertility by Education in Chino Valley
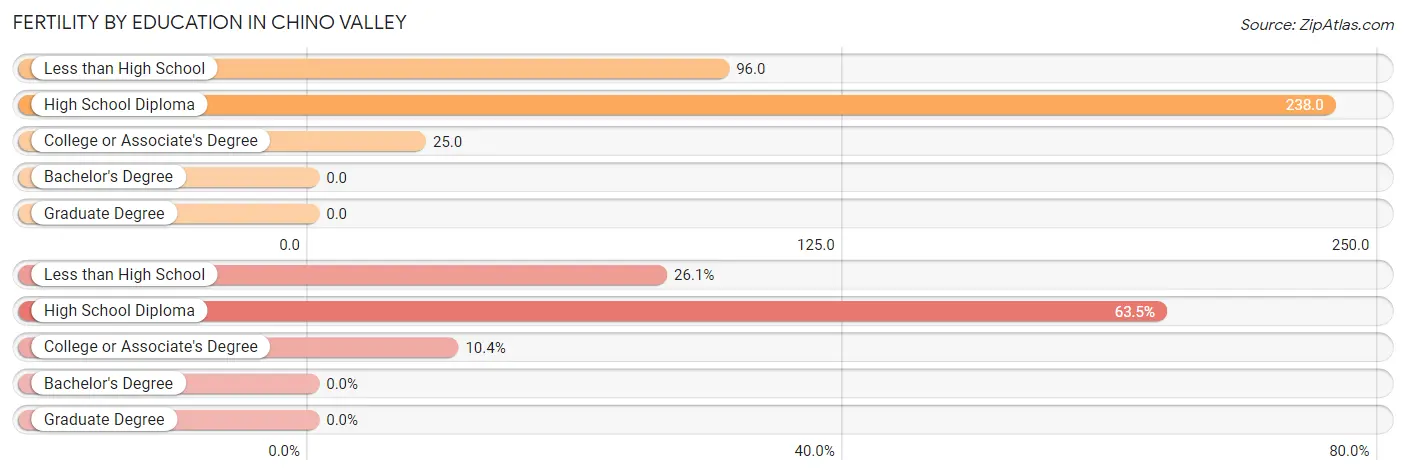
| Educational Attainment | Women with Births | Births / 1,000 Women |
| Less than High School | 55 (26.1%) | 96.0 |
| High School Diploma | 134 (63.5%) | 238.0 |
| College or Associate's Degree | 22 (10.4%) | 25.0 |
| Bachelor's Degree | 0 (0.0%) | 0.0 |
| Graduate Degree | 0 (0.0%) | 0.0 |
| Total | 211 (100.0%) | 90.0 |
Fertility by Education by Marriage Status in Chino Valley
78.2% of women with births in Chino Valley are unmarried. Women with the educational attainment of high school diploma are most likely to be married with 34.3% of them married at childbirth, while women with the educational attainment of less than high school are least likely to be married with 100.0% of them unmarried at childbirth.
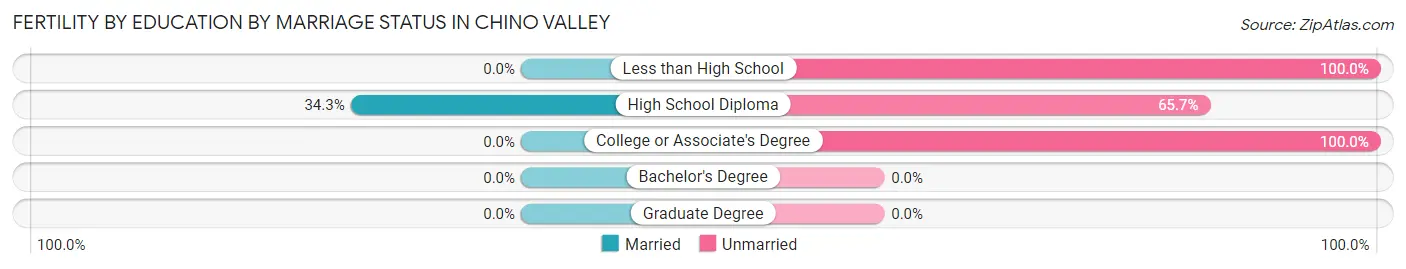
| Educational Attainment | Married | Unmarried |
| Less than High School | 0 (0.0%) | 55 (100.0%) |
| High School Diploma | 46 (34.3%) | 88 (65.7%) |
| College or Associate's Degree | 0 (0.0%) | 22 (100.0%) |
| Bachelor's Degree | 0 (0.0%) | 0 (0.0%) |
| Graduate Degree | 0 (0.0%) | 0 (0.0%) |
| Total | 46 (21.8%) | 165 (78.2%) |
Employment Characteristics in Chino Valley
Employment by Class of Employer in Chino Valley
Among the 5,011 employed individuals in Chino Valley, private company employees (3,091 | 61.7%), self-employed (not incorporated) (544 | 10.9%), and local government employees (540 | 10.8%) make up the most common classes of employment.
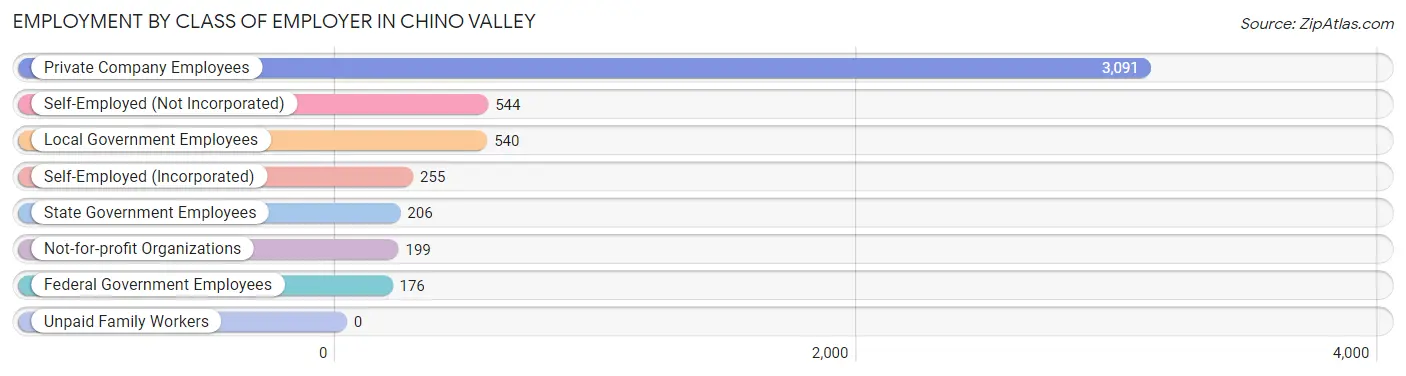
| Employer Class | # Employees | % Employees |
| Private Company Employees | 3,091 | 61.7% |
| Self-Employed (Incorporated) | 255 | 5.1% |
| Self-Employed (Not Incorporated) | 544 | 10.9% |
| Not-for-profit Organizations | 199 | 4.0% |
| Local Government Employees | 540 | 10.8% |
| State Government Employees | 206 | 4.1% |
| Federal Government Employees | 176 | 3.5% |
| Unpaid Family Workers | 0 | 0.0% |
| Total | 5,011 | 100.0% |
Employment Status by Age in Chino Valley
According to the labor force statistics for Chino Valley, out of the total population over 16 years of age (11,148), 48.4% or 5,396 individuals are in the labor force, with 5.2% or 281 of them unemployed. The age group with the highest labor force participation rate is 30 to 34 years, with 89.0% or 697 individuals in the labor force. Within the labor force, the 55 to 59 years age range has the highest percentage of unemployed individuals, with 11.4% or 68 of them being unemployed.
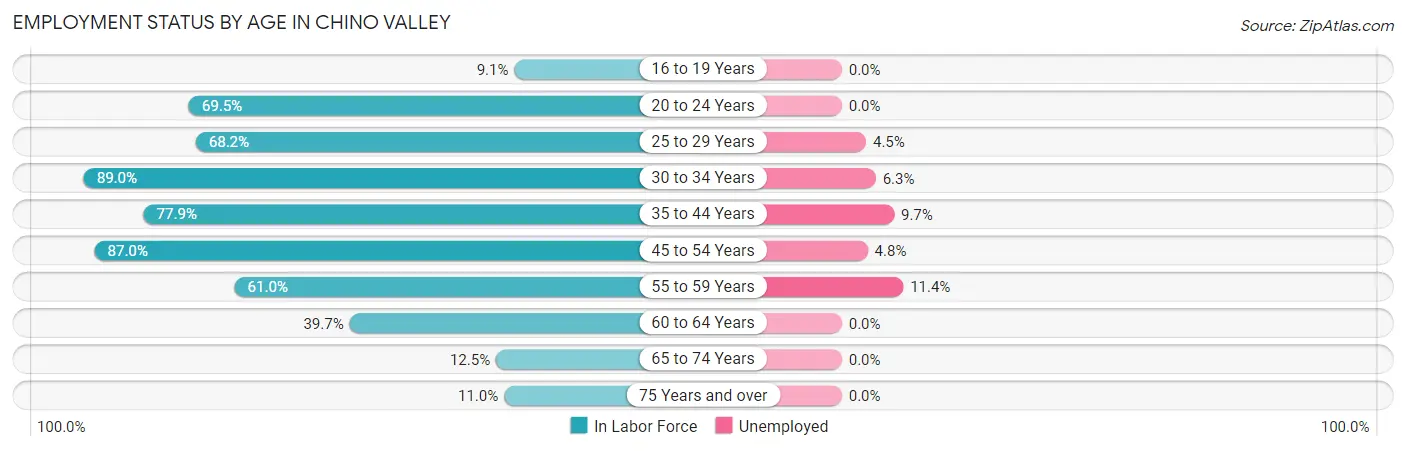
| Age Bracket | In Labor Force | Unemployed |
| 16 to 19 Years | 56 (9.1%) | 0 (0.0%) |
| 20 to 24 Years | 486 (69.5%) | 0 (0.0%) |
| 25 to 29 Years | 336 (68.2%) | 15 (4.5%) |
| 30 to 34 Years | 697 (89.0%) | 44 (6.3%) |
| 35 to 44 Years | 846 (77.9%) | 82 (9.7%) |
| 45 to 54 Years | 1,482 (87.0%) | 71 (4.8%) |
| 55 to 59 Years | 594 (61.0%) | 68 (11.4%) |
| 60 to 64 Years | 464 (39.7%) | 0 (0.0%) |
| 65 to 74 Years | 286 (12.5%) | 0 (0.0%) |
| 75 Years and over | 147 (11.0%) | 0 (0.0%) |
| Total | 5,396 (48.4%) | 281 (5.2%) |
Employment Status by Educational Attainment in Chino Valley
According to labor force statistics for Chino Valley, 71.2% of individuals (4,421) out of the total population between 25 and 64 years of age (6,209) are in the labor force, with 6.3% or 279 of them being unemployed. The group with the highest labor force participation rate are those with the educational attainment of bachelor's degree or higher, with 85.6% or 1,016 individuals in the labor force. Within the labor force, individuals with college / associate degree education have the highest percentage of unemployment, with 9.8% or 170 of them being unemployed.
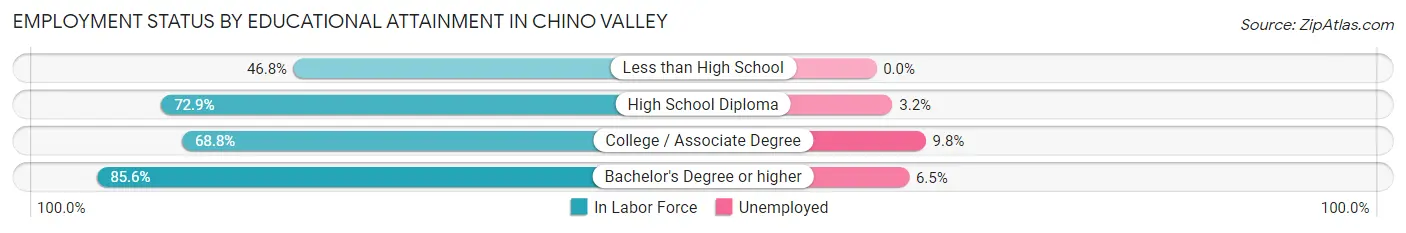
| Educational Attainment | In Labor Force | Unemployed |
| Less than High School | 280 (46.8%) | 0 (0.0%) |
| High School Diploma | 1,392 (72.9%) | 61 (3.2%) |
| College / Associate Degree | 1,730 (68.8%) | 246 (9.8%) |
| Bachelor's Degree or higher | 1,016 (85.6%) | 77 (6.5%) |
| Total | 4,421 (71.2%) | 391 (6.3%) |
Employment Occupations by Sex in Chino Valley
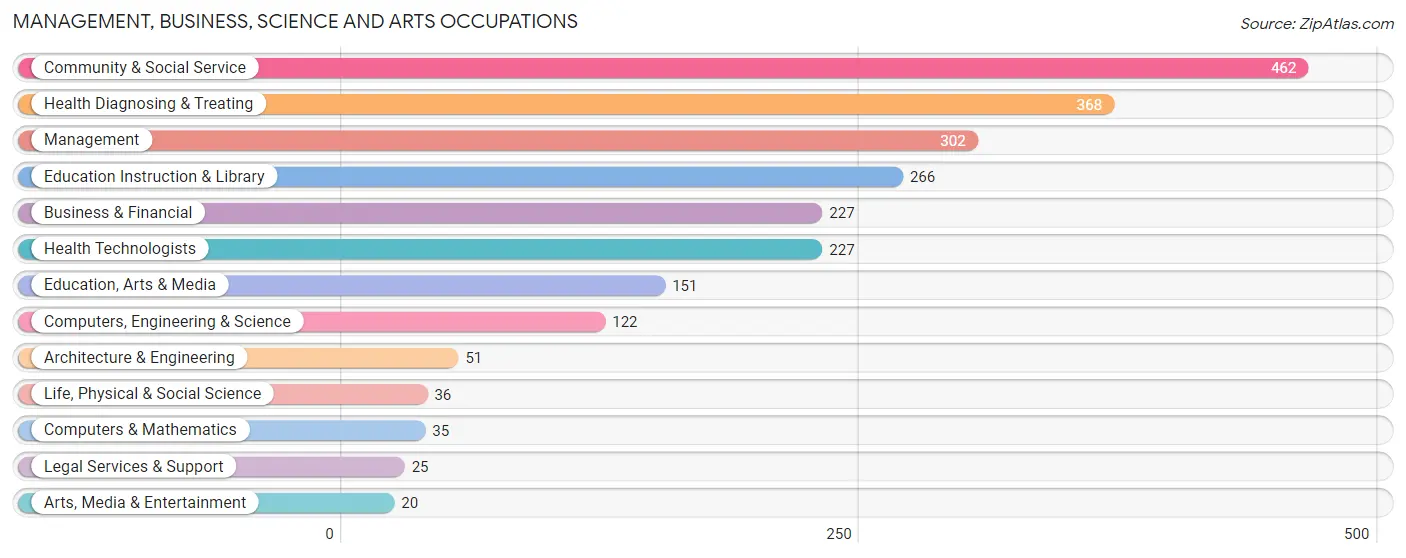
Management, Business, Science and Arts Occupations
The most common Management, Business, Science and Arts occupations in Chino Valley are Community & Social Service (462 | 9.0%), Health Diagnosing & Treating (368 | 7.2%), Management (302 | 5.9%), Education Instruction & Library (266 | 5.2%), and Business & Financial (227 | 4.4%).
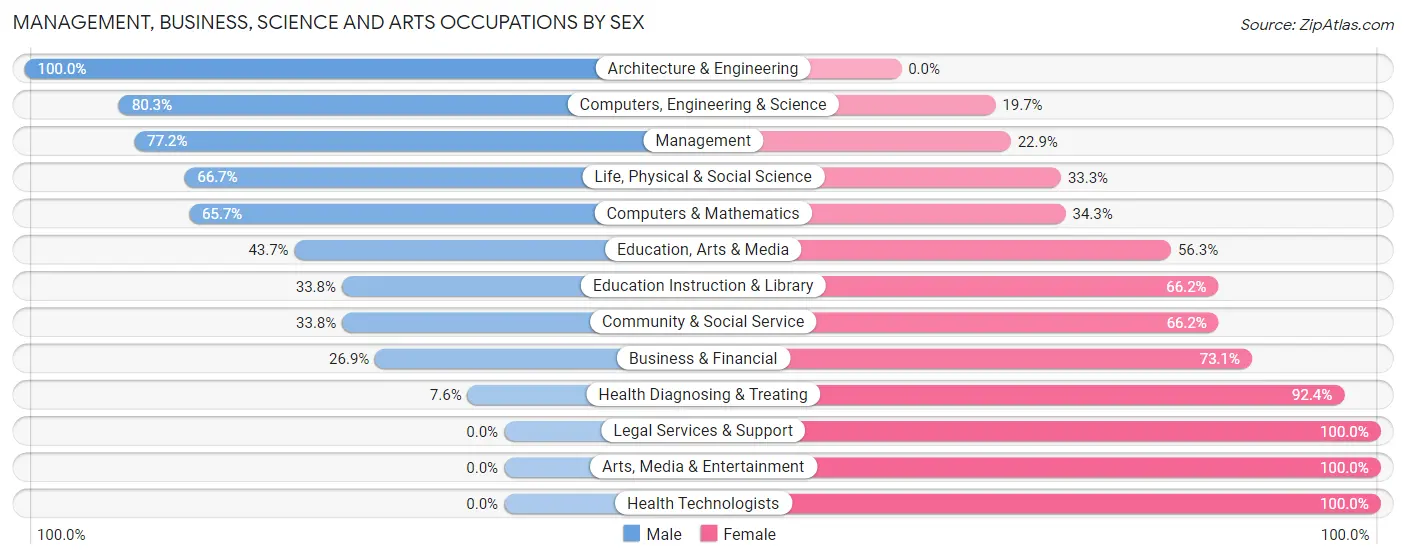
Management, Business, Science and Arts Occupations by Sex
Within the Management, Business, Science and Arts occupations in Chino Valley, the most male-oriented occupations are Architecture & Engineering (100.0%), Computers, Engineering & Science (80.3%), and Management (77.1%), while the most female-oriented occupations are Legal Services & Support (100.0%), Arts, Media & Entertainment (100.0%), and Health Technologists (100.0%).
| Occupation | Male | Female |
| Management | 233 (77.1%) | 69 (22.9%) |
| Business & Financial | 61 (26.9%) | 166 (73.1%) |
| Computers, Engineering & Science | 98 (80.3%) | 24 (19.7%) |
| Computers & Mathematics | 23 (65.7%) | 12 (34.3%) |
| Architecture & Engineering | 51 (100.0%) | 0 (0.0%) |
| Life, Physical & Social Science | 24 (66.7%) | 12 (33.3%) |
| Community & Social Service | 156 (33.8%) | 306 (66.2%) |
| Education, Arts & Media | 66 (43.7%) | 85 (56.3%) |
| Legal Services & Support | 0 (0.0%) | 25 (100.0%) |
| Education Instruction & Library | 90 (33.8%) | 176 (66.2%) |
| Arts, Media & Entertainment | 0 (0.0%) | 20 (100.0%) |
| Health Diagnosing & Treating | 28 (7.6%) | 340 (92.4%) |
| Health Technologists | 0 (0.0%) | 227 (100.0%) |
| Total (Category) | 576 (38.9%) | 905 (61.1%) |
| Total (Overall) | 2,450 (47.9%) | 2,663 (52.1%) |
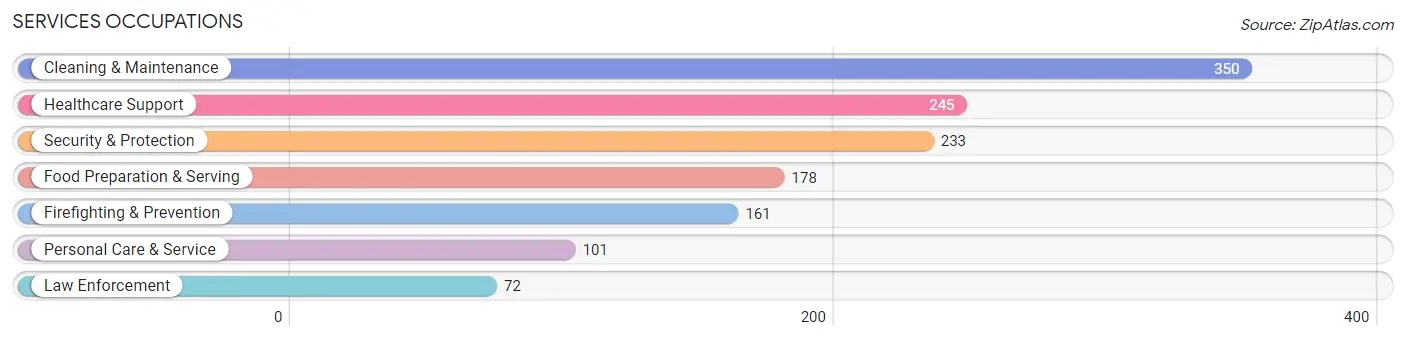
Services Occupations
The most common Services occupations in Chino Valley are Cleaning & Maintenance (350 | 6.9%), Healthcare Support (245 | 4.8%), Security & Protection (233 | 4.6%), Food Preparation & Serving (178 | 3.5%), and Firefighting & Prevention (161 | 3.2%).
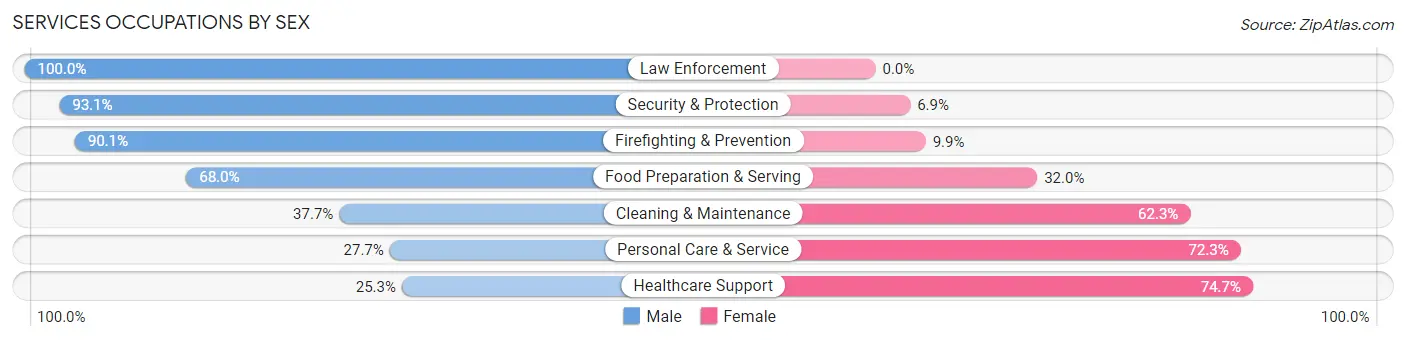
Services Occupations by Sex
Within the Services occupations in Chino Valley, the most male-oriented occupations are Law Enforcement (100.0%), Security & Protection (93.1%), and Firefighting & Prevention (90.1%), while the most female-oriented occupations are Healthcare Support (74.7%), Personal Care & Service (72.3%), and Cleaning & Maintenance (62.3%).
| Occupation | Male | Female |
| Healthcare Support | 62 (25.3%) | 183 (74.7%) |
| Security & Protection | 217 (93.1%) | 16 (6.9%) |
| Firefighting & Prevention | 145 (90.1%) | 16 (9.9%) |
| Law Enforcement | 72 (100.0%) | 0 (0.0%) |
| Food Preparation & Serving | 121 (68.0%) | 57 (32.0%) |
| Cleaning & Maintenance | 132 (37.7%) | 218 (62.3%) |
| Personal Care & Service | 28 (27.7%) | 73 (72.3%) |
| Total (Category) | 560 (50.6%) | 547 (49.4%) |
| Total (Overall) | 2,450 (47.9%) | 2,663 (52.1%) |
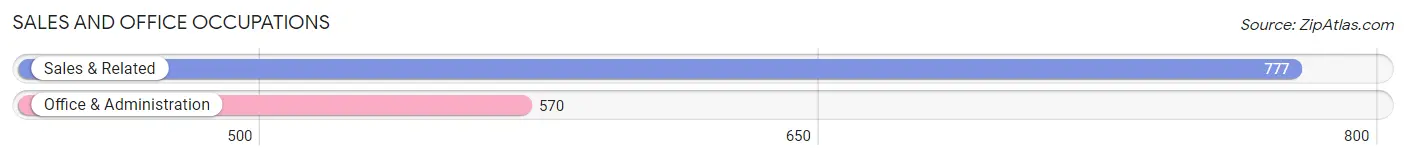
Sales and Office Occupations
The most common Sales and Office occupations in Chino Valley are Sales & Related (777 | 15.2%), and Office & Administration (570 | 11.2%).
Sales and Office Occupations by Sex

| Occupation | Male | Female |
| Sales & Related | 216 (27.8%) | 561 (72.2%) |
| Office & Administration | 87 (15.3%) | 483 (84.7%) |
| Total (Category) | 303 (22.5%) | 1,044 (77.5%) |
| Total (Overall) | 2,450 (47.9%) | 2,663 (52.1%) |
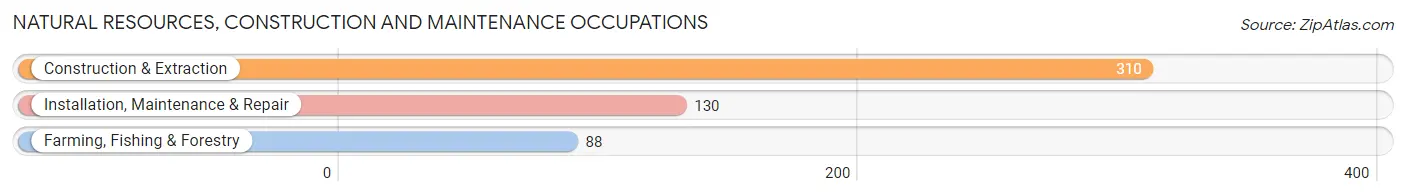
Natural Resources, Construction and Maintenance Occupations
The most common Natural Resources, Construction and Maintenance occupations in Chino Valley are Construction & Extraction (310 | 6.1%), Installation, Maintenance & Repair (130 | 2.5%), and Farming, Fishing & Forestry (88 | 1.7%).
Natural Resources, Construction and Maintenance Occupations by Sex
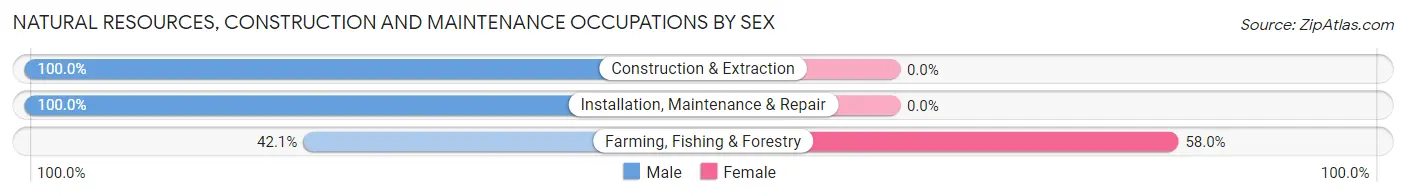
| Occupation | Male | Female |
| Farming, Fishing & Forestry | 37 (42.0%) | 51 (58.0%) |
| Construction & Extraction | 310 (100.0%) | 0 (0.0%) |
| Installation, Maintenance & Repair | 130 (100.0%) | 0 (0.0%) |
| Total (Category) | 477 (90.3%) | 51 (9.7%) |
| Total (Overall) | 2,450 (47.9%) | 2,663 (52.1%) |
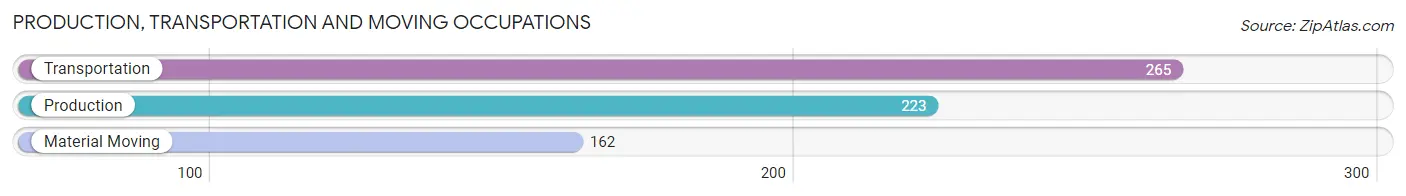
Production, Transportation and Moving Occupations
The most common Production, Transportation and Moving occupations in Chino Valley are Transportation (265 | 5.2%), Production (223 | 4.4%), and Material Moving (162 | 3.2%).
Production, Transportation and Moving Occupations by Sex
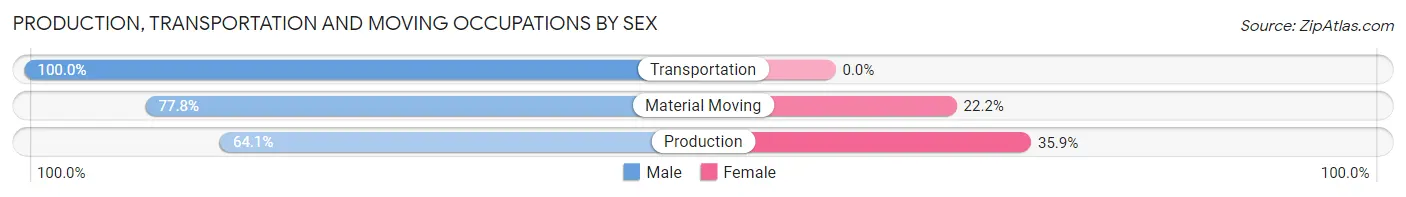
| Occupation | Male | Female |
| Production | 143 (64.1%) | 80 (35.9%) |
| Transportation | 265 (100.0%) | 0 (0.0%) |
| Material Moving | 126 (77.8%) | 36 (22.2%) |
| Total (Category) | 534 (82.2%) | 116 (17.8%) |
| Total (Overall) | 2,450 (47.9%) | 2,663 (52.1%) |
Employment Industries by Sex in Chino Valley
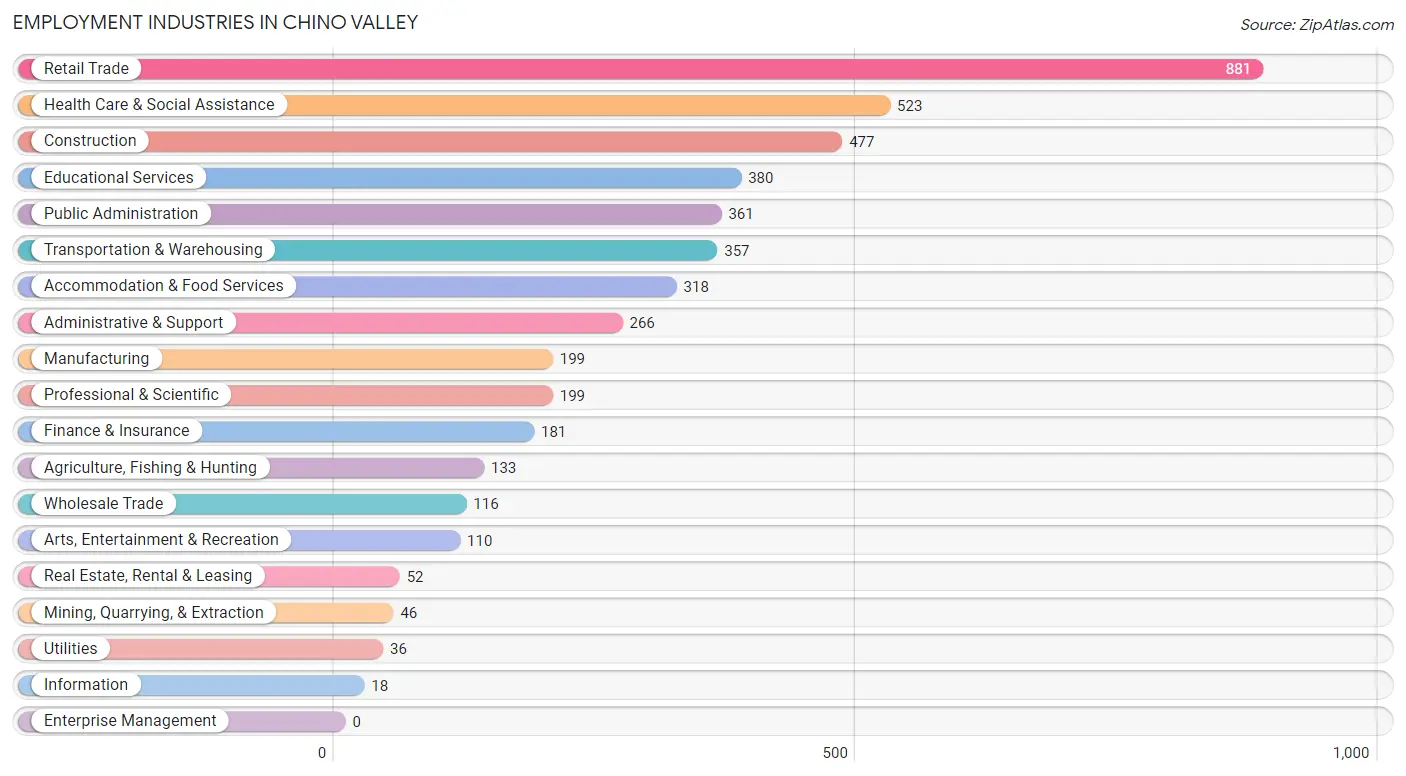
Employment Industries in Chino Valley
The major employment industries in Chino Valley include Retail Trade (881 | 17.2%), Health Care & Social Assistance (523 | 10.2%), Construction (477 | 9.3%), Educational Services (380 | 7.4%), and Public Administration (361 | 7.1%).
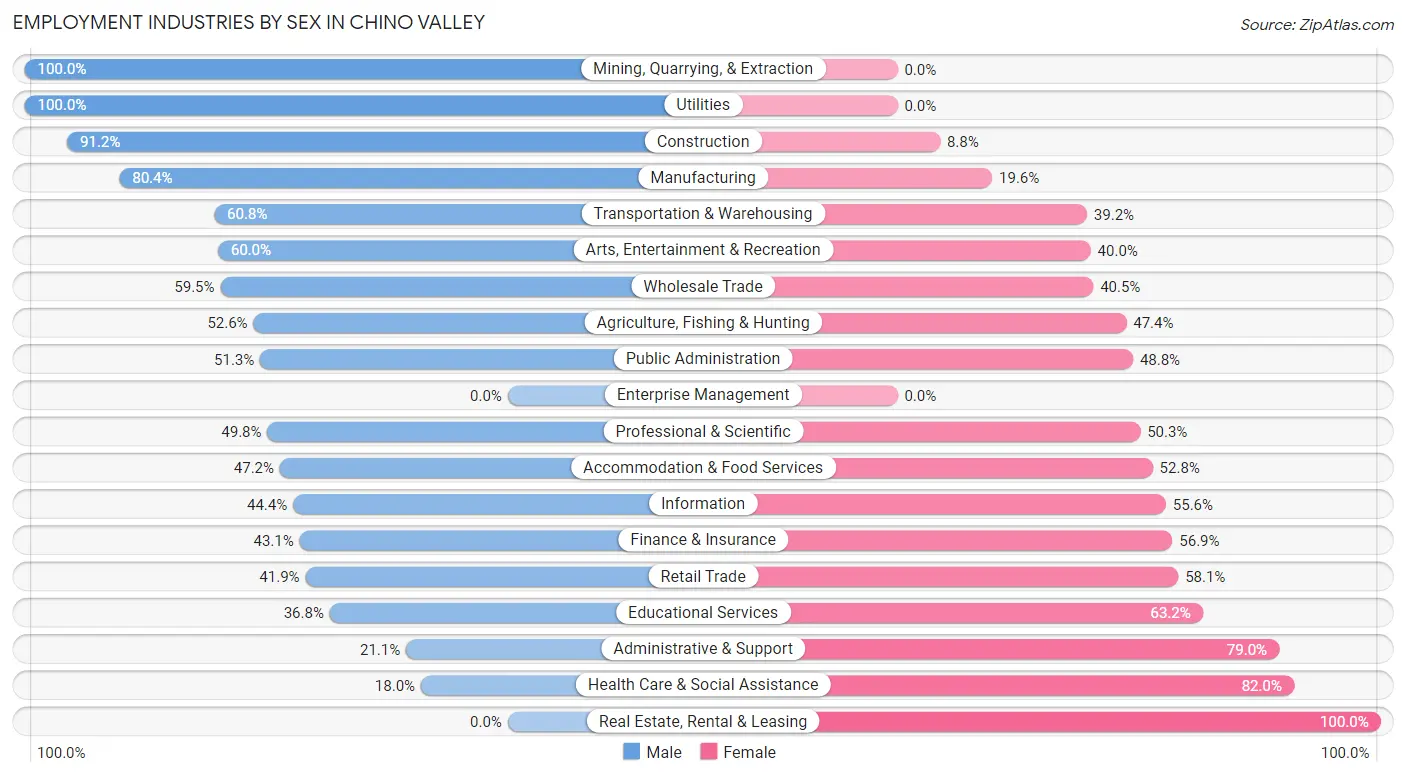
Employment Industries by Sex in Chino Valley
The Chino Valley industries that see more men than women are Mining, Quarrying, & Extraction (100.0%), Utilities (100.0%), and Construction (91.2%), whereas the industries that tend to have a higher number of women are Real Estate, Rental & Leasing (100.0%), Health Care & Social Assistance (82.0%), and Administrative & Support (78.9%).
| Industry | Male | Female |
| Agriculture, Fishing & Hunting | 70 (52.6%) | 63 (47.4%) |
| Mining, Quarrying, & Extraction | 46 (100.0%) | 0 (0.0%) |
| Construction | 435 (91.2%) | 42 (8.8%) |
| Manufacturing | 160 (80.4%) | 39 (19.6%) |
| Wholesale Trade | 69 (59.5%) | 47 (40.5%) |
| Retail Trade | 369 (41.9%) | 512 (58.1%) |
| Transportation & Warehousing | 217 (60.8%) | 140 (39.2%) |
| Utilities | 36 (100.0%) | 0 (0.0%) |
| Information | 8 (44.4%) | 10 (55.6%) |
| Finance & Insurance | 78 (43.1%) | 103 (56.9%) |
| Real Estate, Rental & Leasing | 0 (0.0%) | 52 (100.0%) |
| Professional & Scientific | 99 (49.7%) | 100 (50.2%) |
| Enterprise Management | 0 (0.0%) | 0 (0.0%) |
| Administrative & Support | 56 (21.0%) | 210 (78.9%) |
| Educational Services | 140 (36.8%) | 240 (63.2%) |
| Health Care & Social Assistance | 94 (18.0%) | 429 (82.0%) |
| Arts, Entertainment & Recreation | 66 (60.0%) | 44 (40.0%) |
| Accommodation & Food Services | 150 (47.2%) | 168 (52.8%) |
| Public Administration | 185 (51.2%) | 176 (48.7%) |
| Total | 2,450 (47.9%) | 2,663 (52.1%) |
Education in Chino Valley
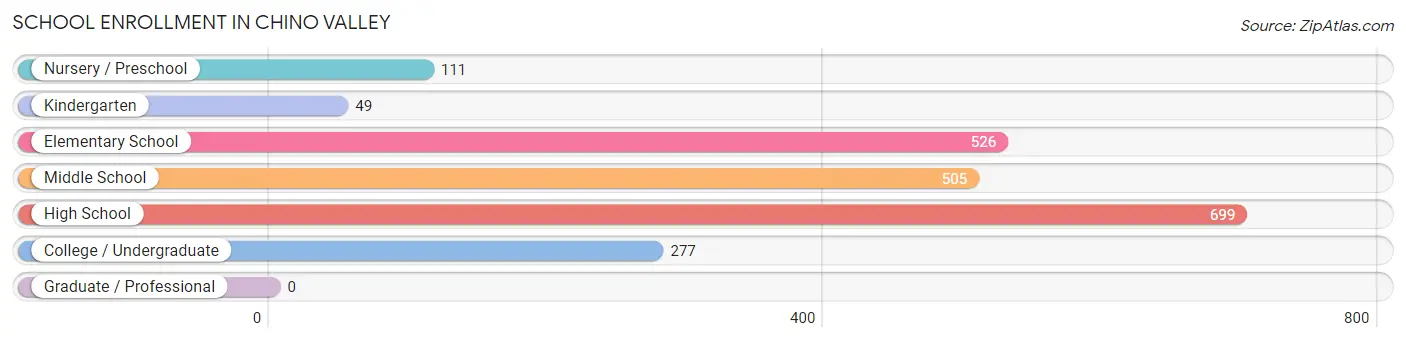
School Enrollment in Chino Valley
The most common levels of schooling among the 2,167 students in Chino Valley are high school (699 | 32.3%), elementary school (526 | 24.3%), and middle school (505 | 23.3%).
| School Level | # Students | % Students |
| Nursery / Preschool | 111 | 5.1% |
| Kindergarten | 49 | 2.3% |
| Elementary School | 526 | 24.3% |
| Middle School | 505 | 23.3% |
| High School | 699 | 32.3% |
| College / Undergraduate | 277 | 12.8% |
| Graduate / Professional | 0 | 0.0% |
| Total | 2,167 | 100.0% |
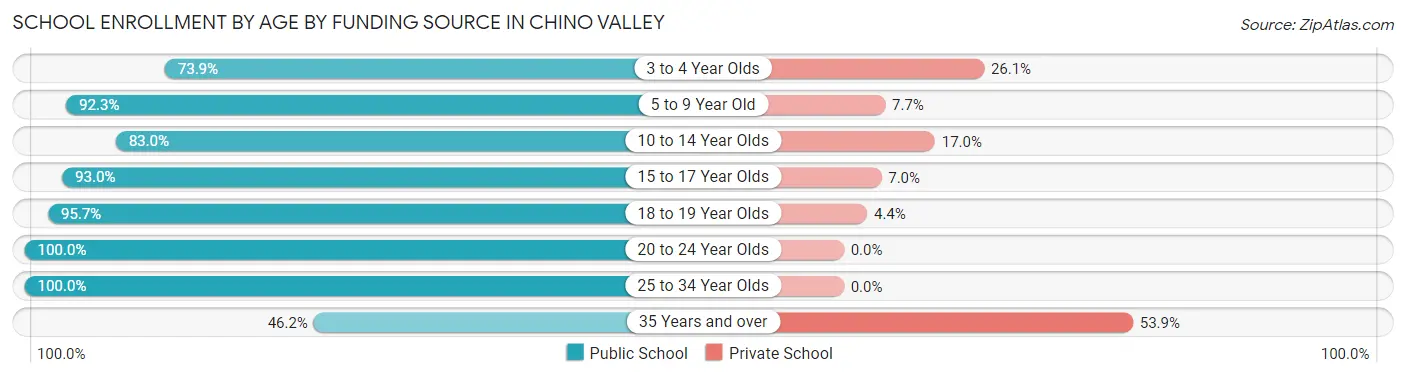
School Enrollment by Age by Funding Source in Chino Valley
Out of a total of 2,167 students who are enrolled in schools in Chino Valley, 215 (9.9%) attend a private institution, while the remaining 1,952 (90.1%) are enrolled in public schools. The age group of 35 years and over has the highest likelihood of being enrolled in private schools, with 7 (53.8% in the age bracket) enrolled. Conversely, the age group of 20 to 24 year olds has the lowest likelihood of being enrolled in a private school, with 191 (100.0% in the age bracket) attending a public institution.
| Age Bracket | Public School | Private School |
| 3 to 4 Year Olds | 82 (73.9%) | 29 (26.1%) |
| 5 to 9 Year Old | 490 (92.3%) | 41 (7.7%) |
| 10 to 14 Year Olds | 484 (83.0%) | 99 (17.0%) |
| 15 to 17 Year Olds | 319 (93.0%) | 24 (7.0%) |
| 18 to 19 Year Olds | 308 (95.7%) | 14 (4.3%) |
| 20 to 24 Year Olds | 191 (100.0%) | 0 (0.0%) |
| 25 to 34 Year Olds | 73 (100.0%) | 0 (0.0%) |
| 35 Years and over | 6 (46.2%) | 7 (53.8%) |
| Total | 1,952 (90.1%) | 215 (9.9%) |
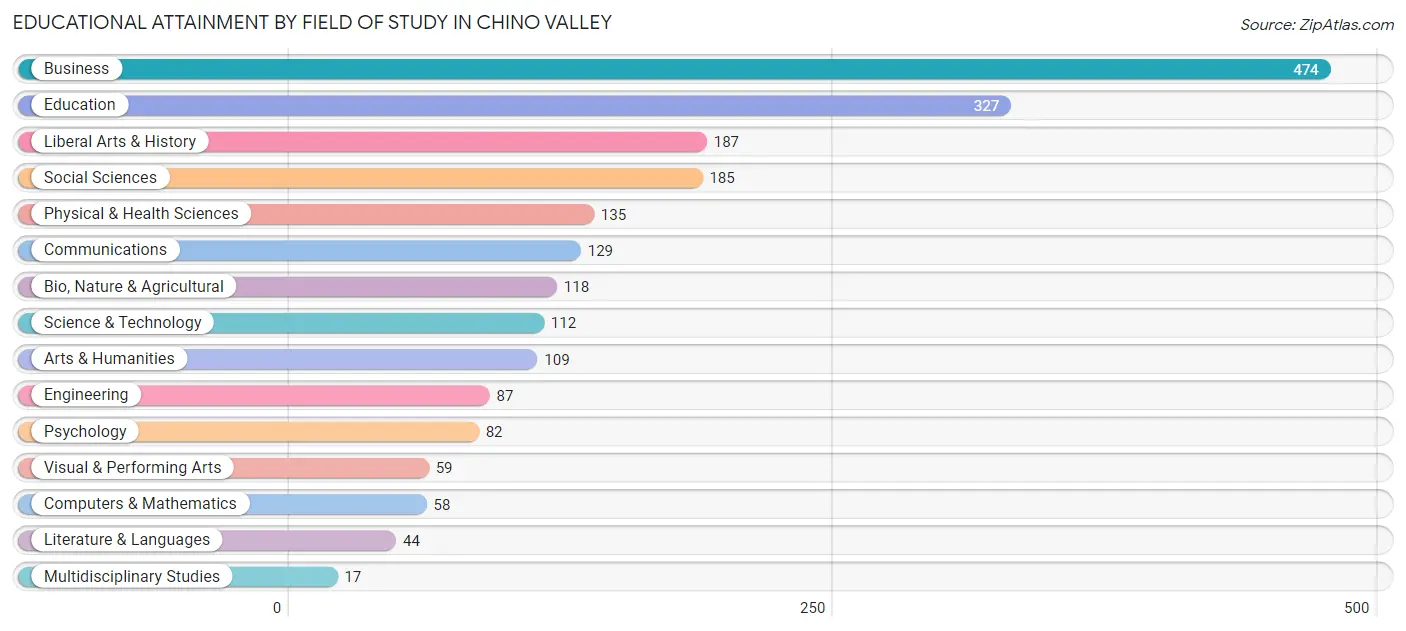
Educational Attainment by Field of Study in Chino Valley
Business (474 | 22.3%), education (327 | 15.4%), liberal arts & history (187 | 8.8%), social sciences (185 | 8.7%), and physical & health sciences (135 | 6.4%) are the most common fields of study among 2,123 individuals in Chino Valley who have obtained a bachelor's degree or higher.
| Field of Study | # Graduates | % Graduates |
| Computers & Mathematics | 58 | 2.7% |
| Bio, Nature & Agricultural | 118 | 5.6% |
| Physical & Health Sciences | 135 | 6.4% |
| Psychology | 82 | 3.9% |
| Social Sciences | 185 | 8.7% |
| Engineering | 87 | 4.1% |
| Multidisciplinary Studies | 17 | 0.8% |
| Science & Technology | 112 | 5.3% |
| Business | 474 | 22.3% |
| Education | 327 | 15.4% |
| Literature & Languages | 44 | 2.1% |
| Liberal Arts & History | 187 | 8.8% |
| Visual & Performing Arts | 59 | 2.8% |
| Communications | 129 | 6.1% |
| Arts & Humanities | 109 | 5.1% |
| Total | 2,123 | 100.0% |
Transportation & Commute in Chino Valley
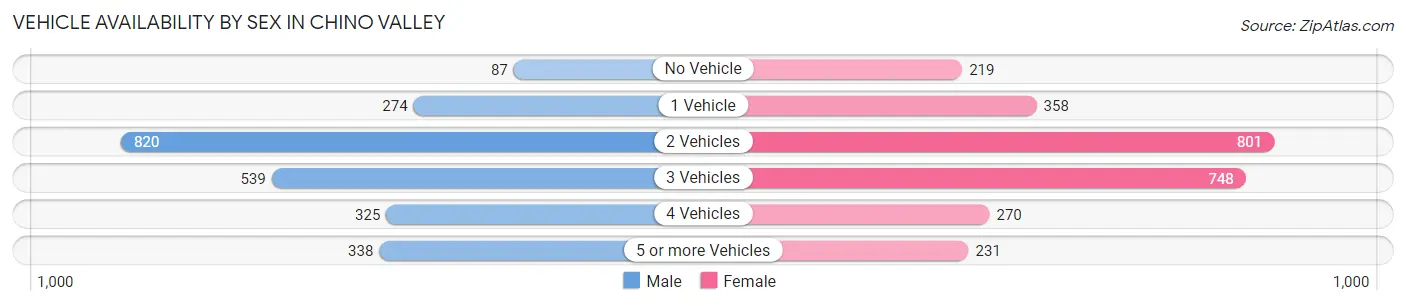
Vehicle Availability by Sex in Chino Valley
The most prevalent vehicle ownership categories in Chino Valley are males with 2 vehicles (820, accounting for 34.4%) and females with 2 vehicles (801, making up 31.2%).
| Vehicles Available | Male | Female |
| No Vehicle | 87 (3.6%) | 219 (8.3%) |
| 1 Vehicle | 274 (11.5%) | 358 (13.6%) |
| 2 Vehicles | 820 (34.4%) | 801 (30.5%) |
| 3 Vehicles | 539 (22.6%) | 748 (28.5%) |
| 4 Vehicles | 325 (13.6%) | 270 (10.3%) |
| 5 or more Vehicles | 338 (14.2%) | 231 (8.8%) |
| Total | 2,383 (100.0%) | 2,627 (100.0%) |
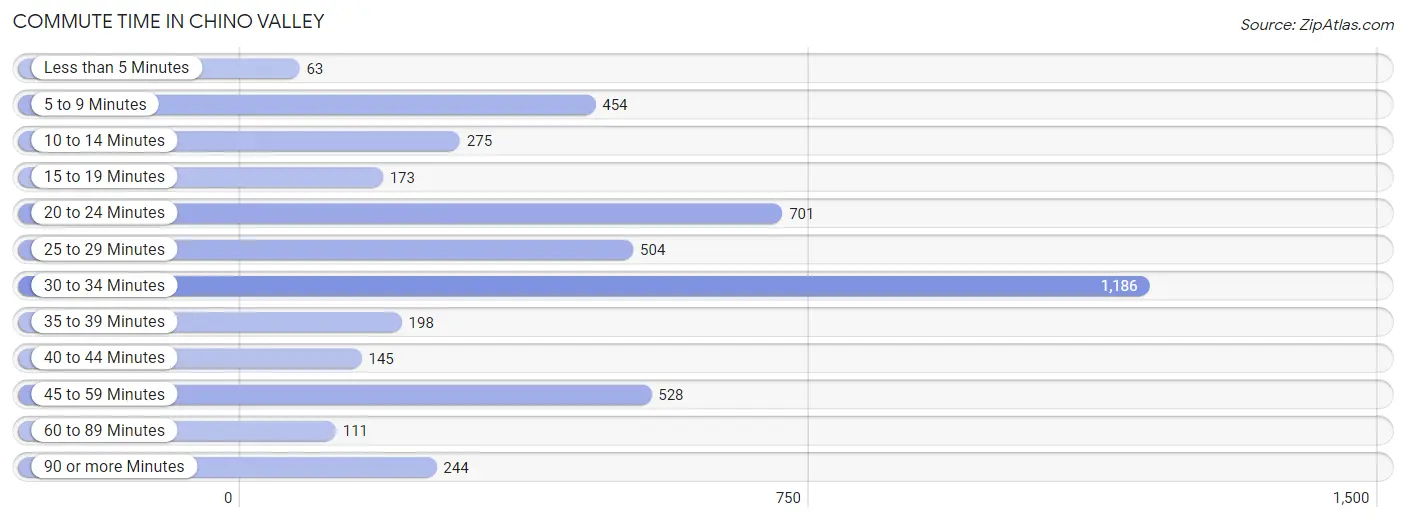
Commute Time in Chino Valley
The most frequently occuring commute durations in Chino Valley are 30 to 34 minutes (1,186 commuters, 25.9%), 20 to 24 minutes (701 commuters, 15.3%), and 45 to 59 minutes (528 commuters, 11.5%).
| Commute Time | # Commuters | % Commuters |
| Less than 5 Minutes | 63 | 1.4% |
| 5 to 9 Minutes | 454 | 9.9% |
| 10 to 14 Minutes | 275 | 6.0% |
| 15 to 19 Minutes | 173 | 3.8% |
| 20 to 24 Minutes | 701 | 15.3% |
| 25 to 29 Minutes | 504 | 11.0% |
| 30 to 34 Minutes | 1,186 | 25.9% |
| 35 to 39 Minutes | 198 | 4.3% |
| 40 to 44 Minutes | 145 | 3.2% |
| 45 to 59 Minutes | 528 | 11.5% |
| 60 to 89 Minutes | 111 | 2.4% |
| 90 or more Minutes | 244 | 5.3% |
Commute Time by Sex in Chino Valley
The most common commute times in Chino Valley are 30 to 34 minutes (498 commuters, 23.7%) for males and 30 to 34 minutes (688 commuters, 27.7%) for females.
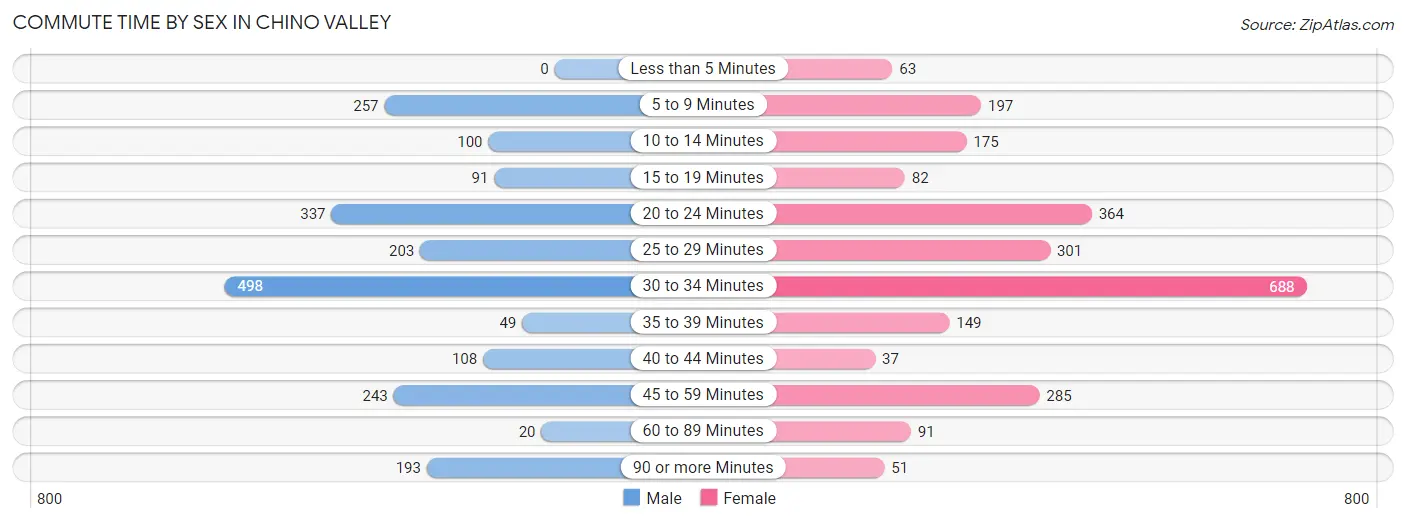
| Commute Time | Male | Female |
| Less than 5 Minutes | 0 (0.0%) | 63 (2.5%) |
| 5 to 9 Minutes | 257 (12.2%) | 197 (7.9%) |
| 10 to 14 Minutes | 100 (4.8%) | 175 (7.0%) |
| 15 to 19 Minutes | 91 (4.3%) | 82 (3.3%) |
| 20 to 24 Minutes | 337 (16.1%) | 364 (14.7%) |
| 25 to 29 Minutes | 203 (9.7%) | 301 (12.1%) |
| 30 to 34 Minutes | 498 (23.7%) | 688 (27.7%) |
| 35 to 39 Minutes | 49 (2.3%) | 149 (6.0%) |
| 40 to 44 Minutes | 108 (5.1%) | 37 (1.5%) |
| 45 to 59 Minutes | 243 (11.6%) | 285 (11.5%) |
| 60 to 89 Minutes | 20 (0.9%) | 91 (3.7%) |
| 90 or more Minutes | 193 (9.2%) | 51 (2.1%) |
Time of Departure to Work by Sex in Chino Valley
The most frequent times of departure to work in Chino Valley are 7:30 AM to 7:59 AM (364, 17.3%) for males and 7:30 AM to 7:59 AM (355, 14.3%) for females.
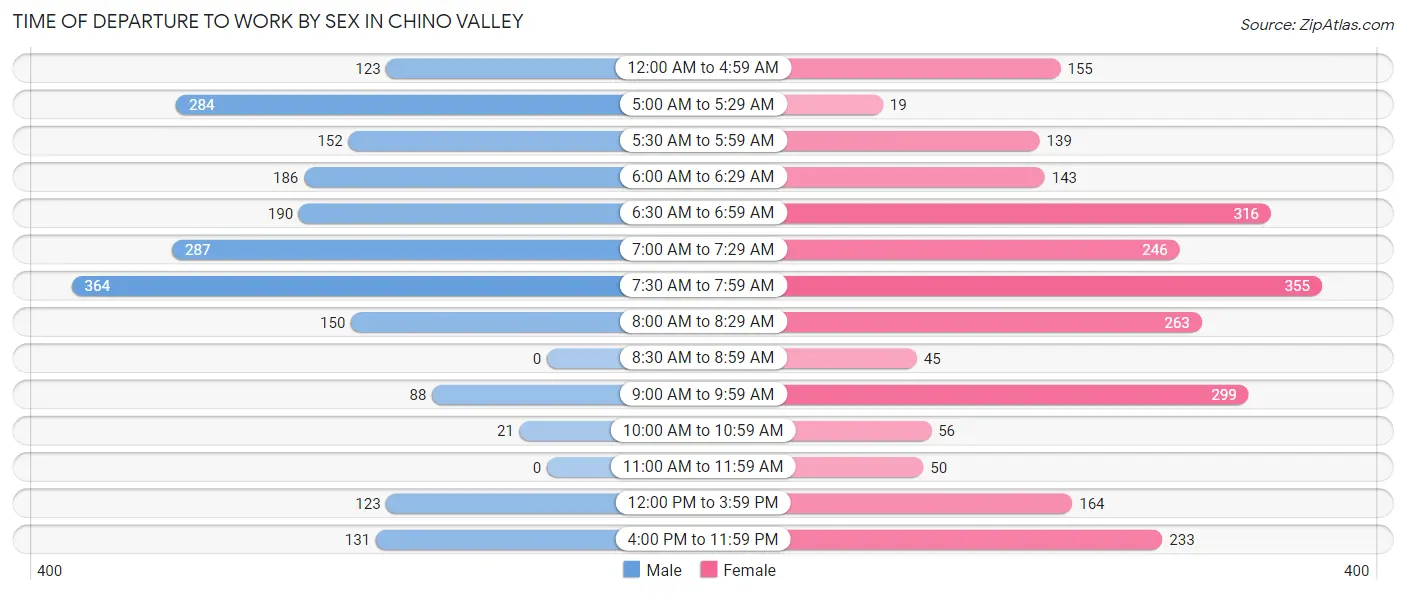
| Time of Departure | Male | Female |
| 12:00 AM to 4:59 AM | 123 (5.9%) | 155 (6.2%) |
| 5:00 AM to 5:29 AM | 284 (13.5%) | 19 (0.8%) |
| 5:30 AM to 5:59 AM | 152 (7.2%) | 139 (5.6%) |
| 6:00 AM to 6:29 AM | 186 (8.9%) | 143 (5.8%) |
| 6:30 AM to 6:59 AM | 190 (9.0%) | 316 (12.7%) |
| 7:00 AM to 7:29 AM | 287 (13.7%) | 246 (9.9%) |
| 7:30 AM to 7:59 AM | 364 (17.3%) | 355 (14.3%) |
| 8:00 AM to 8:29 AM | 150 (7.1%) | 263 (10.6%) |
| 8:30 AM to 8:59 AM | 0 (0.0%) | 45 (1.8%) |
| 9:00 AM to 9:59 AM | 88 (4.2%) | 299 (12.0%) |
| 10:00 AM to 10:59 AM | 21 (1.0%) | 56 (2.3%) |
| 11:00 AM to 11:59 AM | 0 (0.0%) | 50 (2.0%) |
| 12:00 PM to 3:59 PM | 123 (5.9%) | 164 (6.6%) |
| 4:00 PM to 11:59 PM | 131 (6.2%) | 233 (9.4%) |
| Total | 2,099 (100.0%) | 2,483 (100.0%) |
Housing Occupancy in Chino Valley
Occupancy by Ownership in Chino Valley
Of the total 5,624 dwellings in Chino Valley, owner-occupied units account for 4,253 (75.6%), while renter-occupied units make up 1,371 (24.4%).
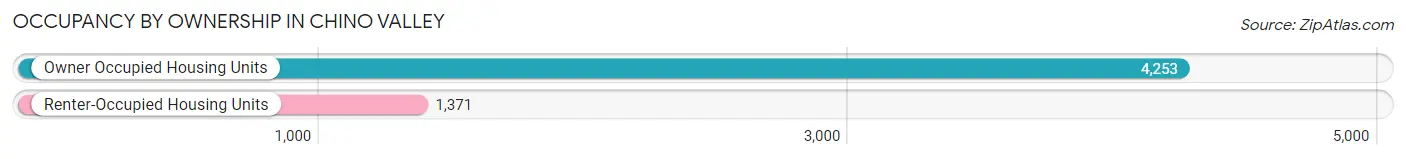
| Occupancy | # Housing Units | % Housing Units |
| Owner Occupied Housing Units | 4,253 | 75.6% |
| Renter-Occupied Housing Units | 1,371 | 24.4% |
| Total Occupied Housing Units | 5,624 | 100.0% |
Occupancy by Household Size in Chino Valley
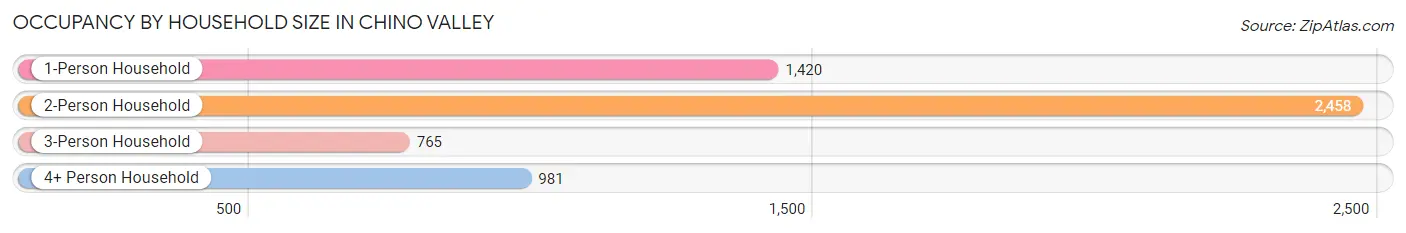
| Household Size | # Housing Units | % Housing Units |
| 1-Person Household | 1,420 | 25.3% |
| 2-Person Household | 2,458 | 43.7% |
| 3-Person Household | 765 | 13.6% |
| 4+ Person Household | 981 | 17.4% |
| Total Housing Units | 5,624 | 100.0% |
Occupancy by Ownership by Household Size in Chino Valley
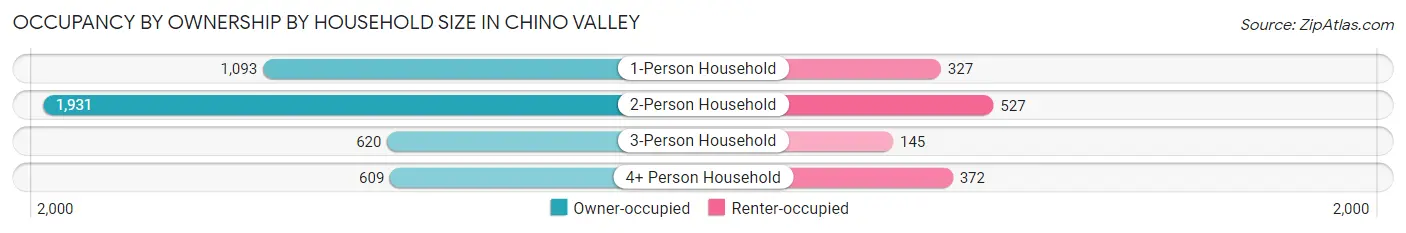
| Household Size | Owner-occupied | Renter-occupied |
| 1-Person Household | 1,093 (77.0%) | 327 (23.0%) |
| 2-Person Household | 1,931 (78.6%) | 527 (21.4%) |
| 3-Person Household | 620 (81.0%) | 145 (19.0%) |
| 4+ Person Household | 609 (62.1%) | 372 (37.9%) |
| Total Housing Units | 4,253 (75.6%) | 1,371 (24.4%) |
Occupancy by Educational Attainment in Chino Valley
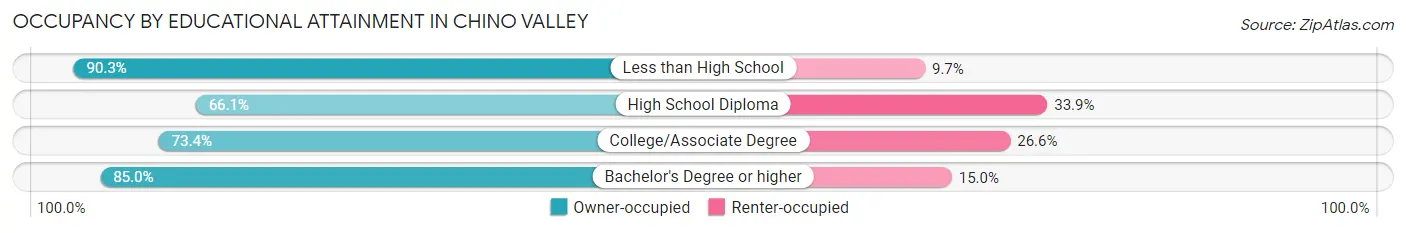
| Household Size | Owner-occupied | Renter-occupied |
| Less than High School | 373 (90.3%) | 40 (9.7%) |
| High School Diploma | 810 (66.1%) | 416 (33.9%) |
| College/Associate Degree | 2,010 (73.4%) | 728 (26.6%) |
| Bachelor's Degree or higher | 1,060 (85.0%) | 187 (15.0%) |
Occupancy by Age of Householder in Chino Valley
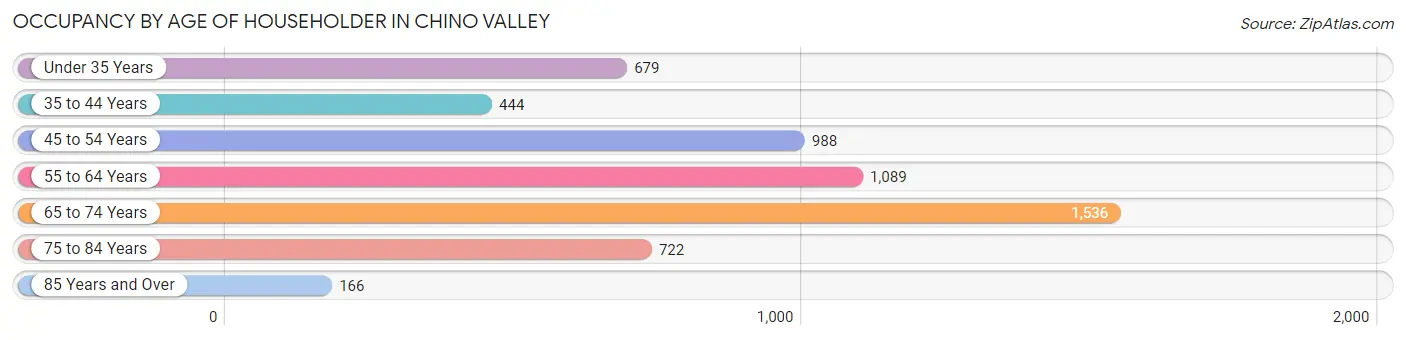
| Age Bracket | # Households | % Households |
| Under 35 Years | 679 | 12.1% |
| 35 to 44 Years | 444 | 7.9% |
| 45 to 54 Years | 988 | 17.6% |
| 55 to 64 Years | 1,089 | 19.4% |
| 65 to 74 Years | 1,536 | 27.3% |
| 75 to 84 Years | 722 | 12.8% |
| 85 Years and Over | 166 | 2.9% |
| Total | 5,624 | 100.0% |
Housing Finances in Chino Valley
Median Income by Occupancy in Chino Valley
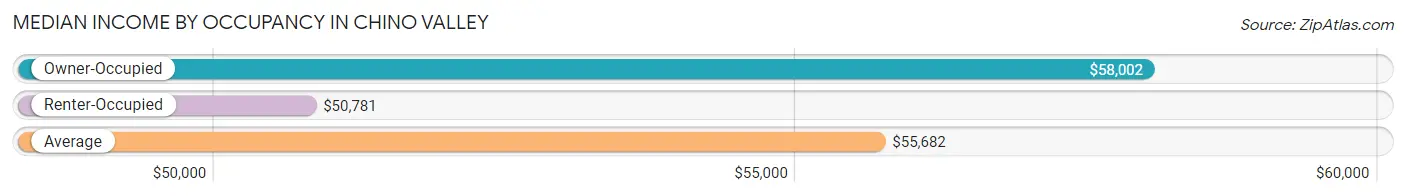
| Occupancy Type | # Households | Median Income |
| Owner-Occupied | 4,253 (75.6%) | $58,002 |
| Renter-Occupied | 1,371 (24.4%) | $50,781 |
| Average | 5,624 (100.0%) | $55,682 |
Occupancy by Householder Income Bracket in Chino Valley
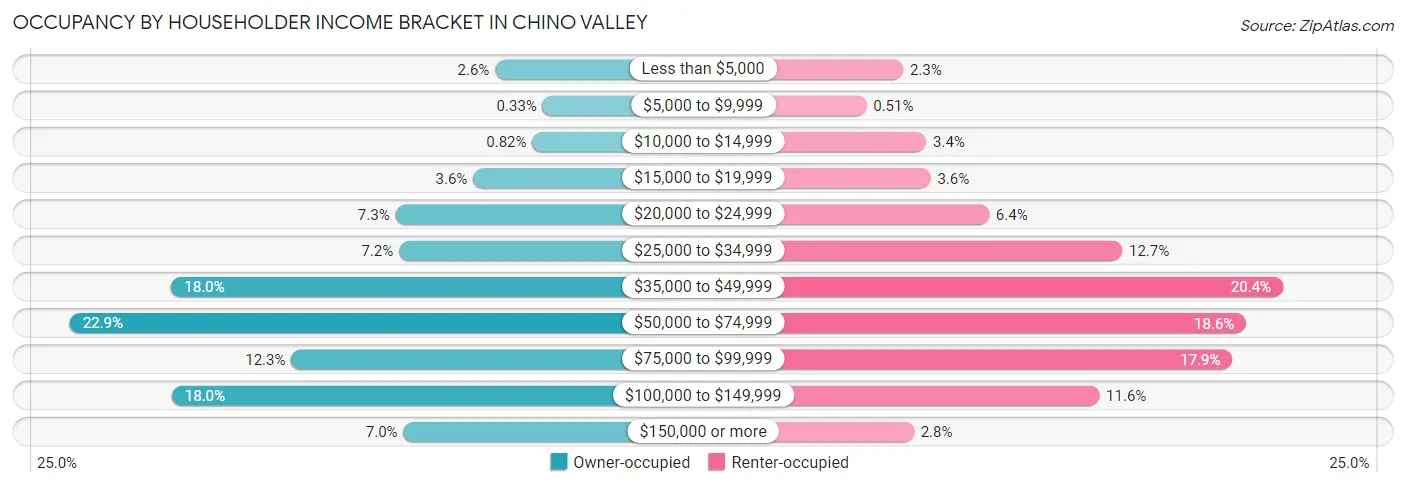
| Income Bracket | Owner-occupied | Renter-occupied |
| Less than $5,000 | 110 (2.6%) | 31 (2.3%) |
| $5,000 to $9,999 | 14 (0.3%) | 7 (0.5%) |
| $10,000 to $14,999 | 35 (0.8%) | 46 (3.4%) |
| $15,000 to $19,999 | 155 (3.6%) | 49 (3.6%) |
| $20,000 to $24,999 | 312 (7.3%) | 87 (6.4%) |
| $25,000 to $34,999 | 305 (7.2%) | 174 (12.7%) |
| $35,000 to $49,999 | 766 (18.0%) | 279 (20.3%) |
| $50,000 to $74,999 | 972 (22.9%) | 255 (18.6%) |
| $75,000 to $99,999 | 523 (12.3%) | 246 (17.9%) |
| $100,000 to $149,999 | 765 (18.0%) | 159 (11.6%) |
| $150,000 or more | 296 (7.0%) | 38 (2.8%) |
| Total | 4,253 (100.0%) | 1,371 (100.0%) |
Monthly Housing Cost Tiers in Chino Valley
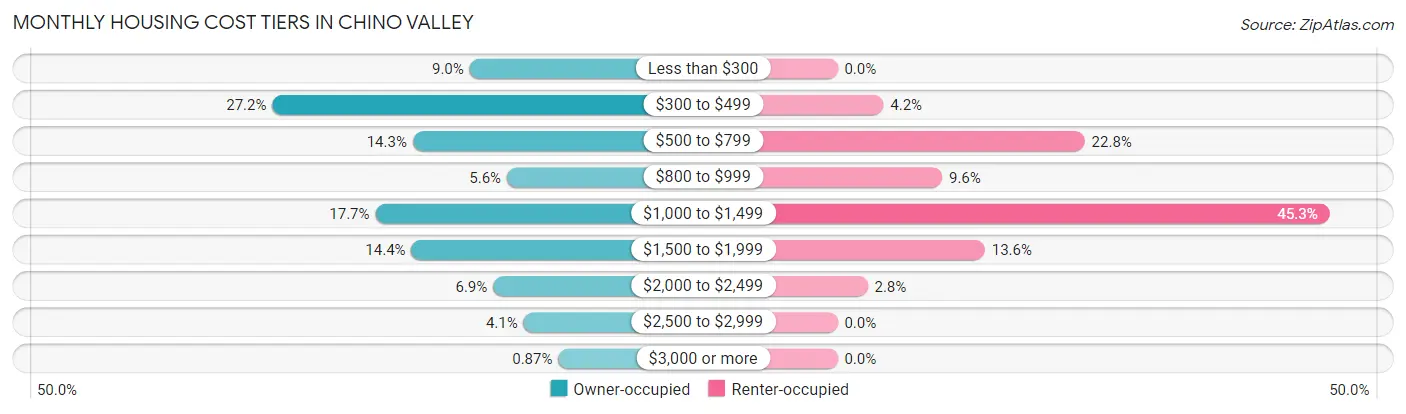
| Monthly Cost | Owner-occupied | Renter-occupied |
| Less than $300 | 384 (9.0%) | 0 (0.0%) |
| $300 to $499 | 1,157 (27.2%) | 58 (4.2%) |
| $500 to $799 | 607 (14.3%) | 312 (22.8%) |
| $800 to $999 | 238 (5.6%) | 132 (9.6%) |
| $1,000 to $1,499 | 753 (17.7%) | 621 (45.3%) |
| $1,500 to $1,999 | 612 (14.4%) | 186 (13.6%) |
| $2,000 to $2,499 | 292 (6.9%) | 38 (2.8%) |
| $2,500 to $2,999 | 173 (4.1%) | 0 (0.0%) |
| $3,000 or more | 37 (0.9%) | 0 (0.0%) |
| Total | 4,253 (100.0%) | 1,371 (100.0%) |
Physical Housing Characteristics in Chino Valley
Housing Structures in Chino Valley
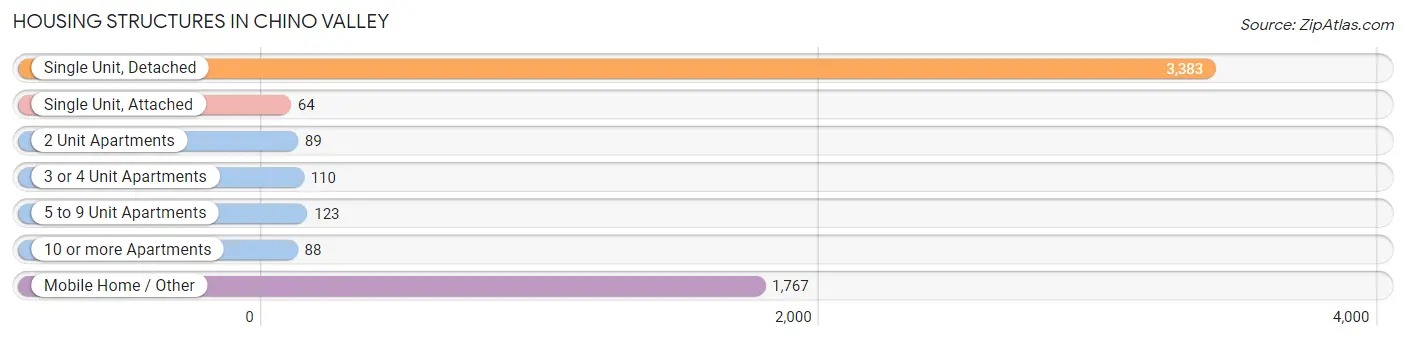
| Structure Type | # Housing Units | % Housing Units |
| Single Unit, Detached | 3,383 | 60.2% |
| Single Unit, Attached | 64 | 1.1% |
| 2 Unit Apartments | 89 | 1.6% |
| 3 or 4 Unit Apartments | 110 | 2.0% |
| 5 to 9 Unit Apartments | 123 | 2.2% |
| 10 or more Apartments | 88 | 1.6% |
| Mobile Home / Other | 1,767 | 31.4% |
| Total | 5,624 | 100.0% |
Housing Structures by Occupancy in Chino Valley
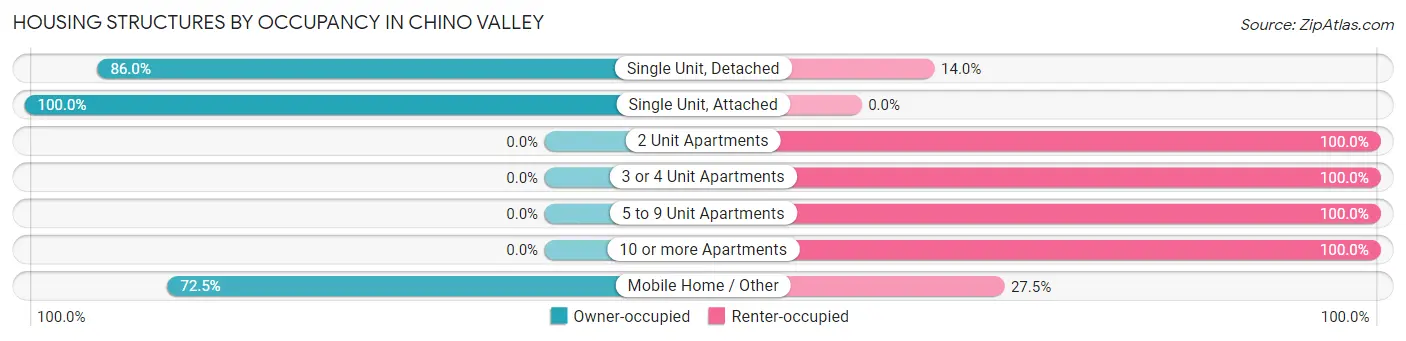
| Structure Type | Owner-occupied | Renter-occupied |
| Single Unit, Detached | 2,908 (86.0%) | 475 (14.0%) |
| Single Unit, Attached | 64 (100.0%) | 0 (0.0%) |
| 2 Unit Apartments | 0 (0.0%) | 89 (100.0%) |
| 3 or 4 Unit Apartments | 0 (0.0%) | 110 (100.0%) |
| 5 to 9 Unit Apartments | 0 (0.0%) | 123 (100.0%) |
| 10 or more Apartments | 0 (0.0%) | 88 (100.0%) |
| Mobile Home / Other | 1,281 (72.5%) | 486 (27.5%) |
| Total | 4,253 (75.6%) | 1,371 (24.4%) |
Housing Structures by Number of Rooms in Chino Valley
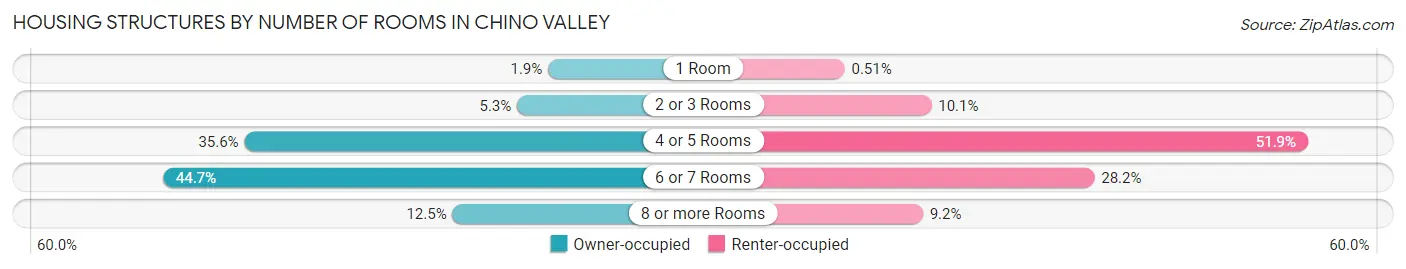
| Number of Rooms | Owner-occupied | Renter-occupied |
| 1 Room | 81 (1.9%) | 7 (0.5%) |
| 2 or 3 Rooms | 227 (5.3%) | 139 (10.1%) |
| 4 or 5 Rooms | 1,514 (35.6%) | 712 (51.9%) |
| 6 or 7 Rooms | 1,899 (44.7%) | 387 (28.2%) |
| 8 or more Rooms | 532 (12.5%) | 126 (9.2%) |
| Total | 4,253 (100.0%) | 1,371 (100.0%) |
Housing Structure by Heating Type in Chino Valley
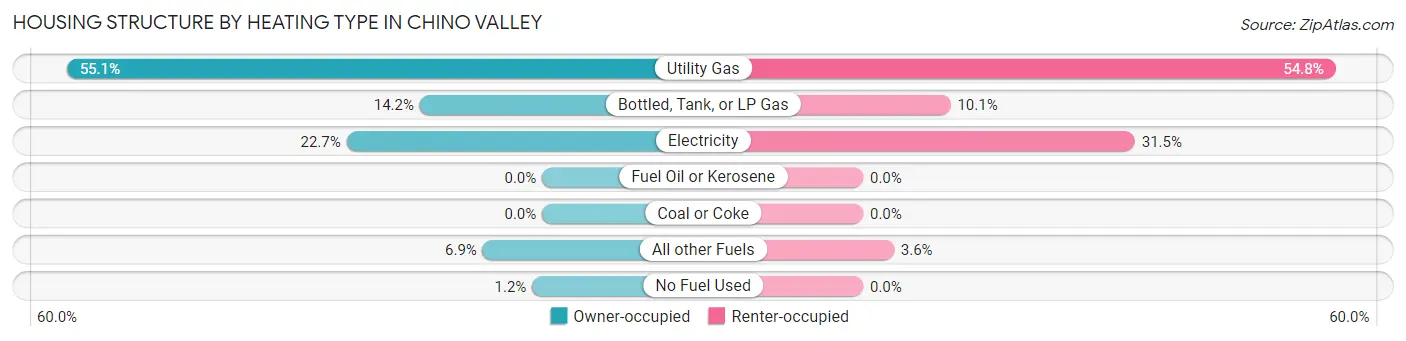
| Heating Type | Owner-occupied | Renter-occupied |
| Utility Gas | 2,344 (55.1%) | 751 (54.8%) |
| Bottled, Tank, or LP Gas | 603 (14.2%) | 139 (10.1%) |
| Electricity | 964 (22.7%) | 432 (31.5%) |
| Fuel Oil or Kerosene | 0 (0.0%) | 0 (0.0%) |
| Coal or Coke | 0 (0.0%) | 0 (0.0%) |
| All other Fuels | 293 (6.9%) | 49 (3.6%) |
| No Fuel Used | 49 (1.1%) | 0 (0.0%) |
| Total | 4,253 (100.0%) | 1,371 (100.0%) |
Household Vehicle Usage in Chino Valley
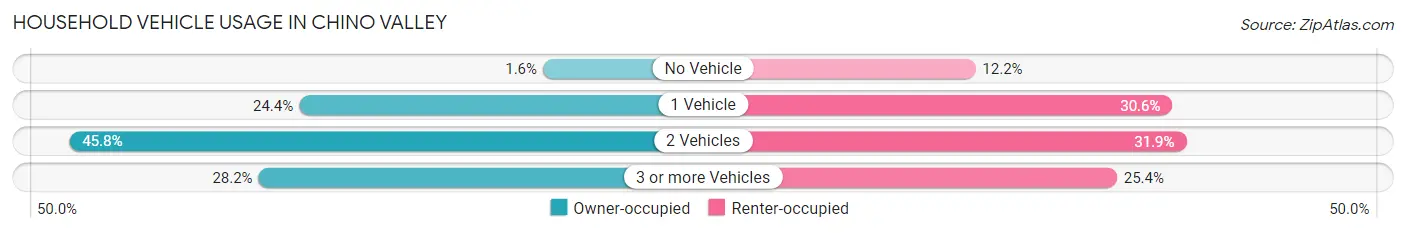
| Vehicles per Household | Owner-occupied | Renter-occupied |
| No Vehicle | 69 (1.6%) | 167 (12.2%) |
| 1 Vehicle | 1,037 (24.4%) | 419 (30.6%) |
| 2 Vehicles | 1,949 (45.8%) | 437 (31.9%) |
| 3 or more Vehicles | 1,198 (28.2%) | 348 (25.4%) |
| Total | 4,253 (100.0%) | 1,371 (100.0%) |
Real Estate & Mortgages in Chino Valley
Real Estate and Mortgage Overview in Chino Valley
| Characteristic | Without Mortgage | With Mortgage |
| Housing Units | 1,950 | 2,303 |
| Median Property Value | $282,900 | $370,000 |
| Median Household Income | $41,919 | $182 |
| Monthly Housing Costs | $413 | $37 |
| Real Estate Taxes | $1,367 | $14 |
Property Value by Mortgage Status in Chino Valley
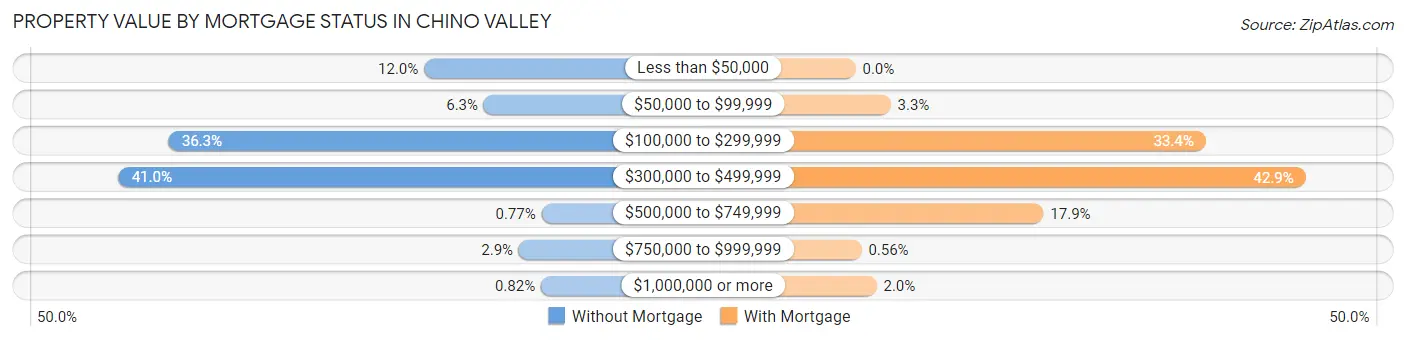
| Property Value | Without Mortgage | With Mortgage |
| Less than $50,000 | 233 (11.9%) | 0 (0.0%) |
| $50,000 to $99,999 | 122 (6.3%) | 77 (3.3%) |
| $100,000 to $299,999 | 707 (36.3%) | 768 (33.4%) |
| $300,000 to $499,999 | 800 (41.0%) | 987 (42.9%) |
| $500,000 to $749,999 | 15 (0.8%) | 412 (17.9%) |
| $750,000 to $999,999 | 57 (2.9%) | 13 (0.6%) |
| $1,000,000 or more | 16 (0.8%) | 46 (2.0%) |
| Total | 1,950 (100.0%) | 2,303 (100.0%) |
Household Income by Mortgage Status in Chino Valley
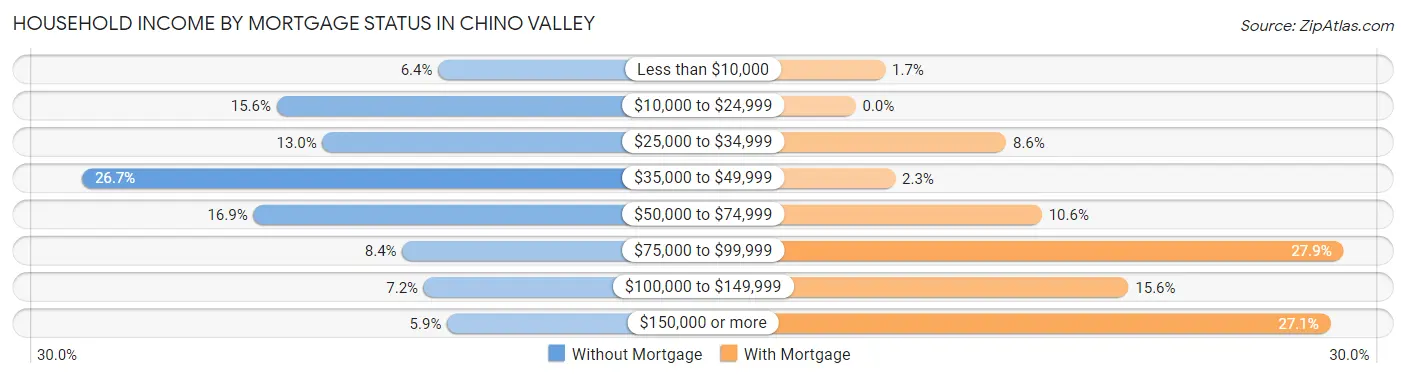
| Household Income | Without Mortgage | With Mortgage |
| Less than $10,000 | 124 (6.4%) | 39 (1.7%) |
| $10,000 to $24,999 | 304 (15.6%) | 0 (0.0%) |
| $25,000 to $34,999 | 253 (13.0%) | 198 (8.6%) |
| $35,000 to $49,999 | 521 (26.7%) | 52 (2.3%) |
| $50,000 to $74,999 | 330 (16.9%) | 245 (10.6%) |
| $75,000 to $99,999 | 164 (8.4%) | 642 (27.9%) |
| $100,000 to $149,999 | 140 (7.2%) | 359 (15.6%) |
| $150,000 or more | 114 (5.9%) | 625 (27.1%) |
| Total | 1,950 (100.0%) | 2,303 (100.0%) |
Property Value to Household Income Ratio in Chino Valley
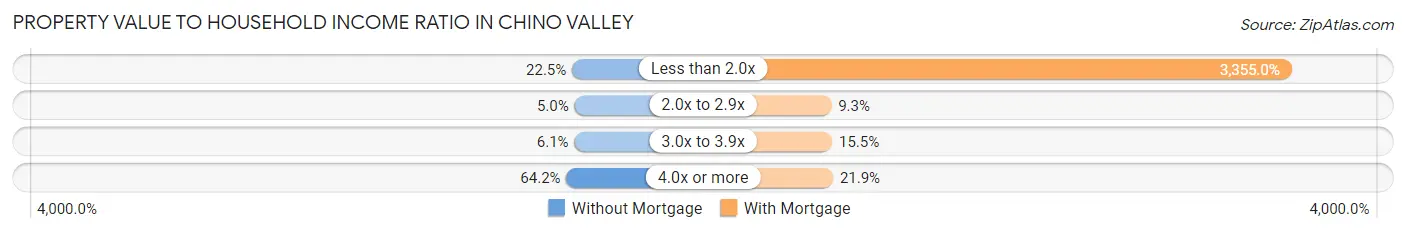
| Value-to-Income Ratio | Without Mortgage | With Mortgage |
| Less than 2.0x | 438 (22.5%) | 77,266 (3,355.0%) |
| 2.0x to 2.9x | 97 (5.0%) | 214 (9.3%) |
| 3.0x to 3.9x | 118 (6.0%) | 357 (15.5%) |
| 4.0x or more | 1,251 (64.1%) | 504 (21.9%) |
| Total | 1,950 (100.0%) | 2,303 (100.0%) |
Real Estate Taxes by Mortgage Status in Chino Valley
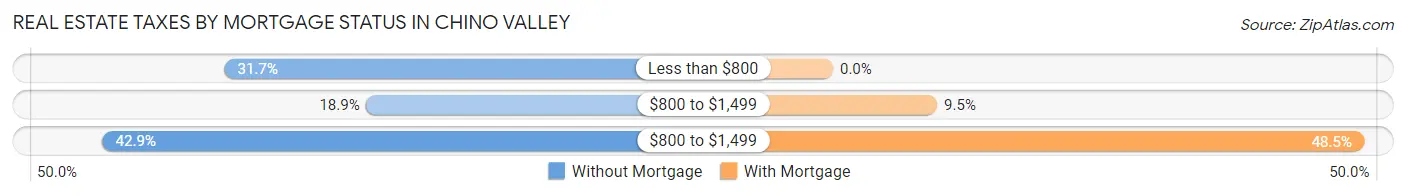
| Property Taxes | Without Mortgage | With Mortgage |
| Less than $800 | 619 (31.7%) | 0 (0.0%) |
| $800 to $1,499 | 368 (18.9%) | 219 (9.5%) |
| $800 to $1,499 | 836 (42.9%) | 1,116 (48.5%) |
| Total | 1,950 (100.0%) | 2,303 (100.0%) |
Health & Disability in Chino Valley
Health Insurance Coverage by Age in Chino Valley
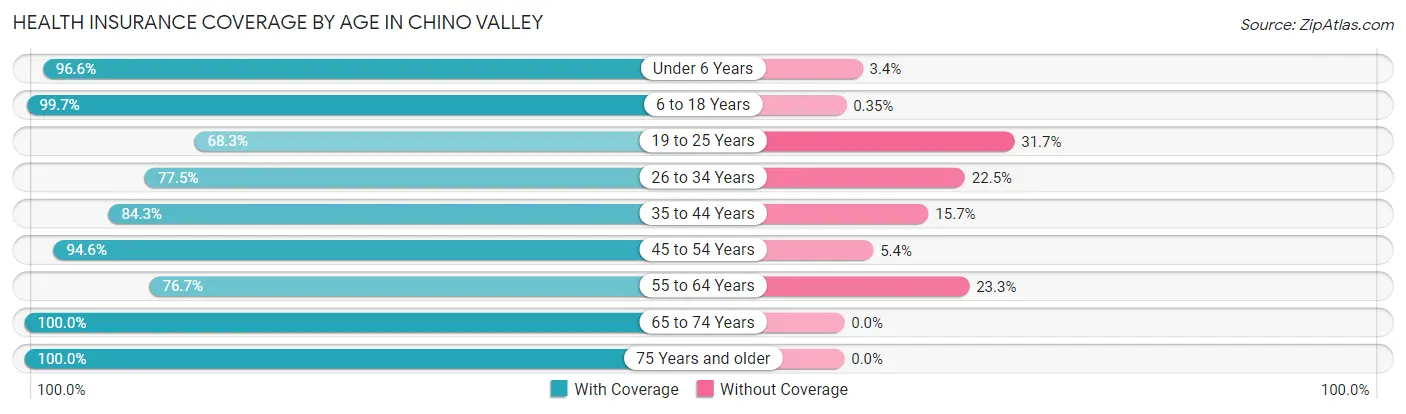
| Age Bracket | With Coverage | Without Coverage |
| Under 6 Years | 768 (96.6%) | 27 (3.4%) |
| 6 to 18 Years | 1,706 (99.7%) | 6 (0.4%) |
| 19 to 25 Years | 573 (68.3%) | 266 (31.7%) |
| 26 to 34 Years | 941 (77.5%) | 273 (22.5%) |
| 35 to 44 Years | 914 (84.3%) | 170 (15.7%) |
| 45 to 54 Years | 1,611 (94.6%) | 92 (5.4%) |
| 55 to 64 Years | 1,639 (76.7%) | 498 (23.3%) |
| 65 to 74 Years | 2,287 (100.0%) | 0 (0.0%) |
| 75 Years and older | 1,334 (100.0%) | 0 (0.0%) |
| Total | 11,773 (89.8%) | 1,332 (10.2%) |
Health Insurance Coverage by Citizenship Status in Chino Valley

| Citizenship Status | With Coverage | Without Coverage |
| Native Born | 768 (96.6%) | 27 (3.4%) |
| Foreign Born, Citizen | 1,706 (99.7%) | 6 (0.4%) |
| Foreign Born, not a Citizen | 573 (68.3%) | 266 (31.7%) |
Health Insurance Coverage by Household Income in Chino Valley
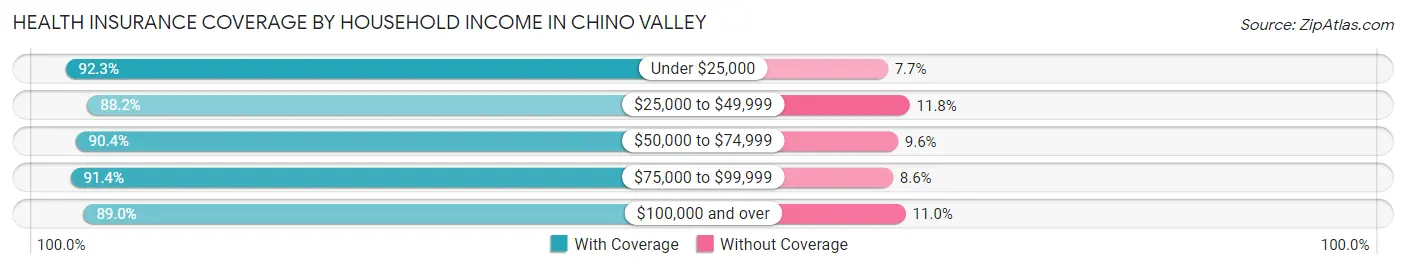
| Household Income | With Coverage | Without Coverage |
| Under $25,000 | 1,203 (92.3%) | 100 (7.7%) |
| $25,000 to $49,999 | 2,474 (88.2%) | 330 (11.8%) |
| $50,000 to $74,999 | 2,637 (90.4%) | 279 (9.6%) |
| $75,000 to $99,999 | 1,822 (91.4%) | 172 (8.6%) |
| $100,000 and over | 3,630 (89.0%) | 450 (11.0%) |
Public vs Private Health Insurance Coverage by Age in Chino Valley
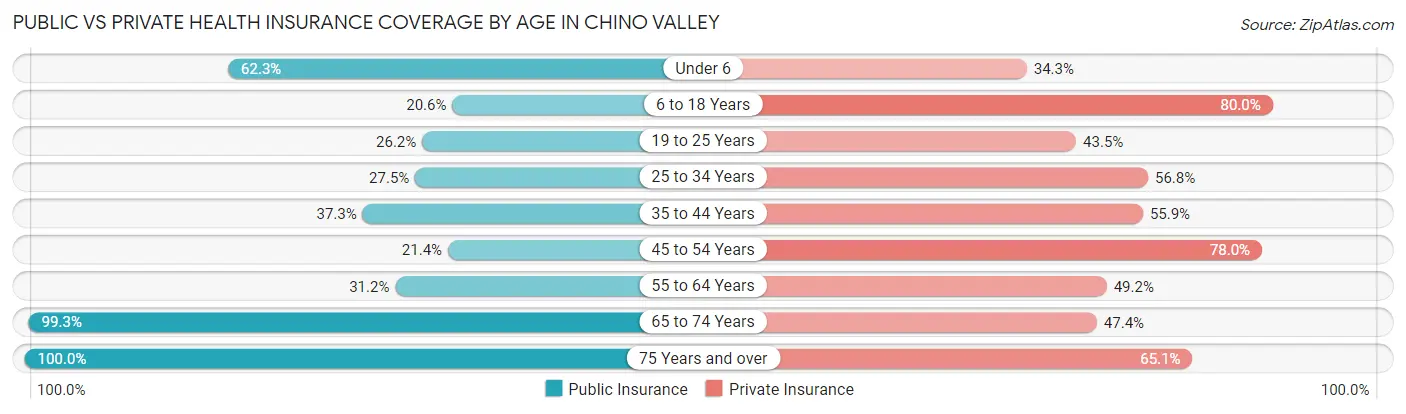
| Age Bracket | Public Insurance | Private Insurance |
| Under 6 | 495 (62.3%) | 273 (34.3%) |
| 6 to 18 Years | 353 (20.6%) | 1,369 (80.0%) |
| 19 to 25 Years | 220 (26.2%) | 365 (43.5%) |
| 25 to 34 Years | 334 (27.5%) | 690 (56.8%) |
| 35 to 44 Years | 404 (37.3%) | 606 (55.9%) |
| 45 to 54 Years | 365 (21.4%) | 1,328 (78.0%) |
| 55 to 64 Years | 667 (31.2%) | 1,051 (49.2%) |
| 65 to 74 Years | 2,270 (99.3%) | 1,083 (47.3%) |
| 75 Years and over | 1,334 (100.0%) | 868 (65.1%) |
| Total | 6,442 (49.2%) | 7,633 (58.2%) |
Disability Status by Sex by Age in Chino Valley
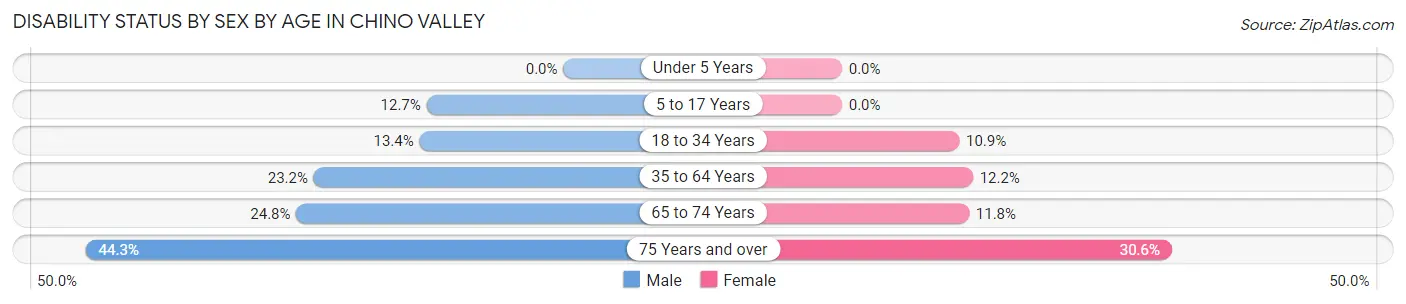
| Age Bracket | Male | Female |
| Under 5 Years | 0 (0.0%) | 0 (0.0%) |
| 5 to 17 Years | 106 (12.7%) | 0 (0.0%) |
| 18 to 34 Years | 168 (13.4%) | 116 (10.9%) |
| 35 to 64 Years | 481 (23.2%) | 346 (12.1%) |
| 65 to 74 Years | 285 (24.8%) | 134 (11.8%) |
| 75 Years and over | 254 (44.3%) | 233 (30.6%) |
Disability Class by Sex by Age in Chino Valley
Disability Class: Hearing Difficulty
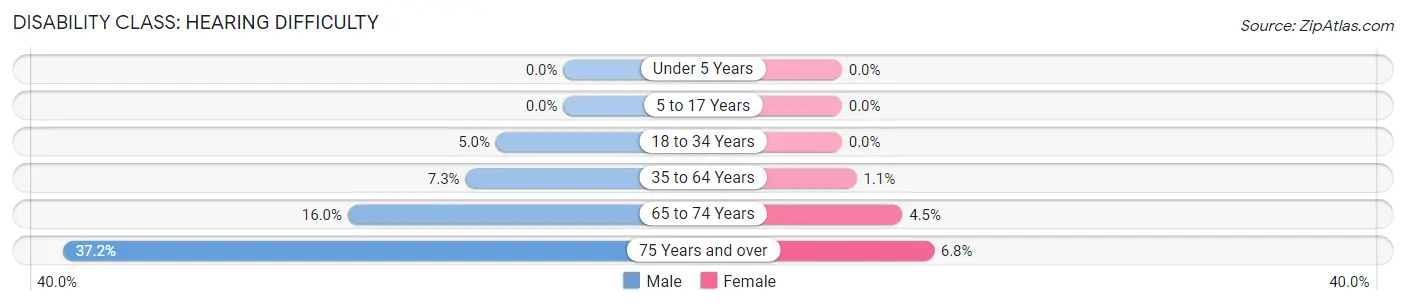
| Age Bracket | Male | Female |
| Under 5 Years | 0 (0.0%) | 0 (0.0%) |
| 5 to 17 Years | 0 (0.0%) | 0 (0.0%) |
| 18 to 34 Years | 63 (5.0%) | 0 (0.0%) |
| 35 to 64 Years | 151 (7.3%) | 31 (1.1%) |
| 65 to 74 Years | 184 (16.0%) | 51 (4.5%) |
| 75 Years and over | 213 (37.2%) | 52 (6.8%) |
Disability Class: Vision Difficulty
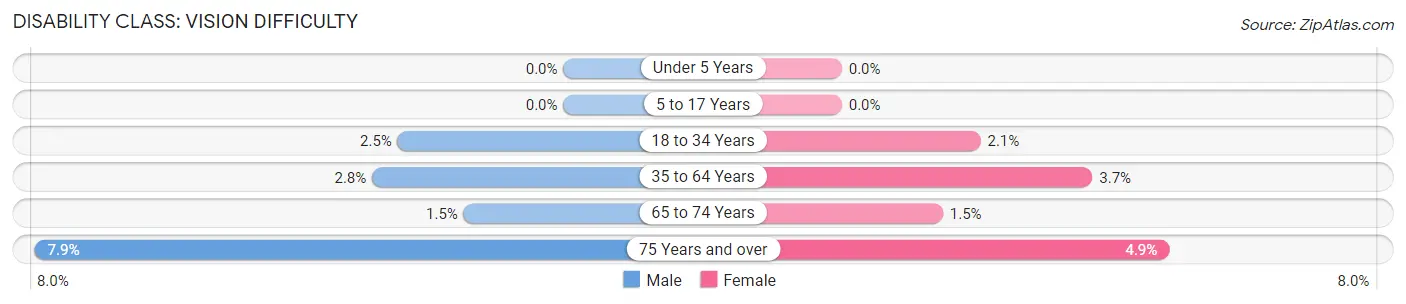
| Age Bracket | Male | Female |
| Under 5 Years | 0 (0.0%) | 0 (0.0%) |
| 5 to 17 Years | 0 (0.0%) | 0 (0.0%) |
| 18 to 34 Years | 31 (2.5%) | 22 (2.1%) |
| 35 to 64 Years | 59 (2.8%) | 106 (3.7%) |
| 65 to 74 Years | 17 (1.5%) | 17 (1.5%) |
| 75 Years and over | 45 (7.9%) | 37 (4.9%) |
Disability Class: Cognitive Difficulty
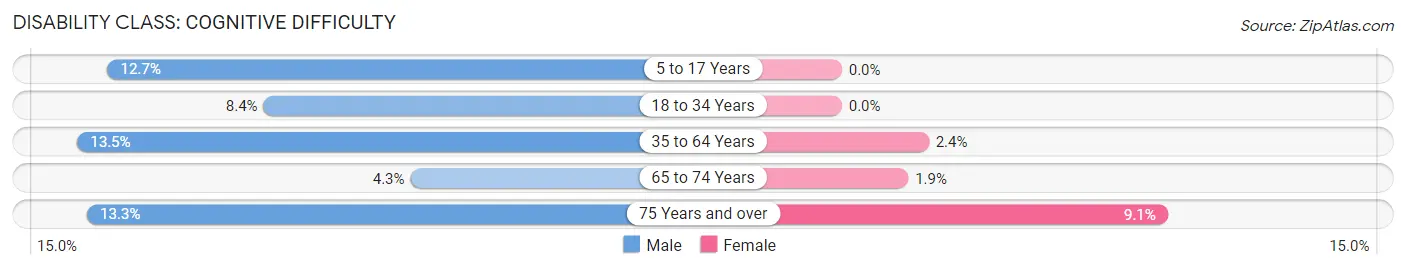
| Age Bracket | Male | Female |
| 5 to 17 Years | 106 (12.7%) | 0 (0.0%) |
| 18 to 34 Years | 105 (8.4%) | 0 (0.0%) |
| 35 to 64 Years | 281 (13.5%) | 69 (2.4%) |
| 65 to 74 Years | 49 (4.3%) | 21 (1.8%) |
| 75 Years and over | 76 (13.3%) | 69 (9.1%) |
Disability Class: Ambulatory Difficulty
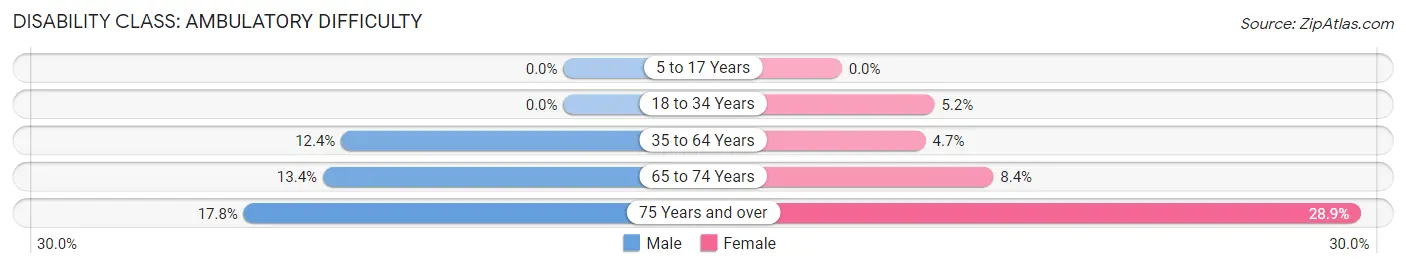
| Age Bracket | Male | Female |
| 5 to 17 Years | 0 (0.0%) | 0 (0.0%) |
| 18 to 34 Years | 0 (0.0%) | 55 (5.2%) |
| 35 to 64 Years | 257 (12.4%) | 133 (4.7%) |
| 65 to 74 Years | 154 (13.4%) | 96 (8.4%) |
| 75 Years and over | 102 (17.8%) | 220 (28.9%) |
Disability Class: Self-Care Difficulty
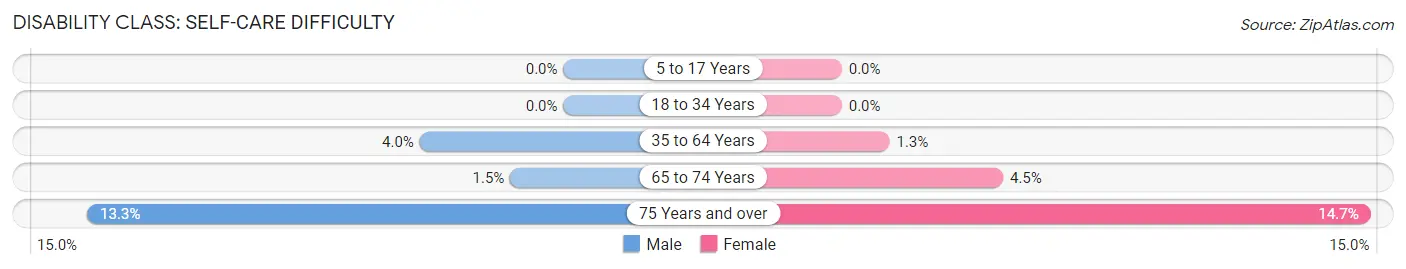
| Age Bracket | Male | Female |
| 5 to 17 Years | 0 (0.0%) | 0 (0.0%) |
| 18 to 34 Years | 0 (0.0%) | 0 (0.0%) |
| 35 to 64 Years | 83 (4.0%) | 38 (1.3%) |
| 65 to 74 Years | 17 (1.5%) | 51 (4.5%) |
| 75 Years and over | 76 (13.3%) | 112 (14.7%) |
Technology Access in Chino Valley
Computing Device Access in Chino Valley
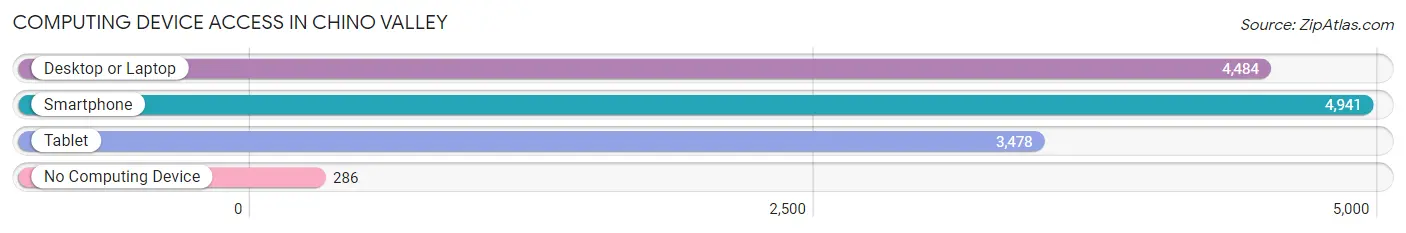
| Device Type | # Households | % Households |
| Desktop or Laptop | 4,484 | 79.7% |
| Smartphone | 4,941 | 87.9% |
| Tablet | 3,478 | 61.8% |
| No Computing Device | 286 | 5.1% |
| Total | 5,624 | 100.0% |
Internet Access in Chino Valley
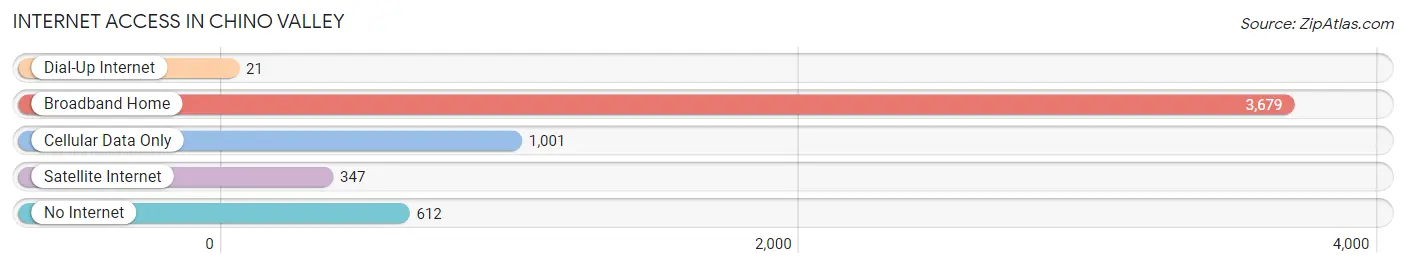
| Internet Type | # Households | % Households |
| Dial-Up Internet | 21 | 0.4% |
| Broadband Home | 3,679 | 65.4% |
| Cellular Data Only | 1,001 | 17.8% |
| Satellite Internet | 347 | 6.2% |
| No Internet | 612 | 10.9% |
| Total | 5,624 | 100.0% |
Chino Valley Summary
Chino Valley, Arizona is a small town located in Yavapai County, Arizona. It is situated in the Verde Valley, approximately 20 miles south of Prescott, Arizona. The town was founded in 1875 and is the oldest settlement in the Verde Valley. The town is known for its rich history, beautiful geography, diverse economy, and unique demographics.
History
Chino Valley was founded in 1875 by a group of settlers from the nearby town of Prescott. The settlers were looking for a place to settle and raise their families. The town was originally called “Chino” after the nearby Chino Creek. The name was later changed to Chino Valley to differentiate it from other towns in the area.
The town was initially a farming community, with the main crops being wheat, barley, and alfalfa. The town also had a small sawmill and a few stores. In the early 1900s, the town began to grow and develop. The first school was built in 1906 and the first post office was established in 1907.
The town continued to grow and develop throughout the 20th century. In the 1950s, the town began to attract retirees and tourists. The town was incorporated in 1960 and has since become a popular destination for retirees and tourists.
Geography
Chino Valley is located in the Verde Valley, approximately 20 miles south of Prescott, Arizona. The town is situated in a valley surrounded by mountains and hills. The town is located at an elevation of 4,800 feet and has a mild climate with hot summers and cool winters.
The town is located near several natural attractions, including the Granite Mountain Wilderness, the Sycamore Canyon Wilderness, and the Prescott National Forest. The town is also located near several lakes, including Lynx Lake, Watson Lake, and Granite Basin Lake.
Economy
Chino Valley’s economy is largely based on tourism and retirement. The town is home to several resorts, golf courses, and other attractions that attract tourists and retirees from all over the world. The town is also home to several businesses, including restaurants, retail stores, and professional services.
The town is also home to several manufacturing and industrial businesses. The town is home to several companies that produce furniture, electronics, and other products. The town is also home to several agricultural businesses, including cattle ranches, dairy farms, and hay farms.
Demographics
As of the 2010 census, the population of Chino Valley was 10,817. The town has a diverse population, with the majority of the population being white (83.3%), followed by Hispanic or Latino (7.7%), Native American (2.2%), and Asian (1.2%).
The median household income in Chino Valley is $45,845, which is slightly higher than the national median of $50,046. The median age in Chino Valley is 44.7, which is slightly higher than the national median of 37.7.
Conclusion
Chino Valley, Arizona is a small town located in Yavapai County, Arizona. The town is known for its rich history, beautiful geography, diverse economy, and unique demographics. The town is home to several resorts, golf courses, and other attractions that attract tourists and retirees from all over the world. The town is also home to several businesses, including restaurants, retail stores, and professional services. The town has a diverse population, with the majority of the population being white, followed by Hispanic or Latino, Native American, and Asian. The median household income in Chino Valley is $45,845, which is slightly higher than the national median.
Common Questions
What is Per Capita Income in Chino Valley?
Per Capita income in Chino Valley is $31,423.
What is the Median Family Income in Chino Valley?
Median Family Income in Chino Valley is $69,919.
What is the Median Household income in Chino Valley?
Median Household Income in Chino Valley is $55,682.
What is Income or Wage Gap in Chino Valley?
Income or Wage Gap in Chino Valley is 35.9%.
Women in Chino Valley earn 64.1 cents for every dollar earned by a man.
What is Family Income Deficit in Chino Valley?
Family Income Deficit in Chino Valley is $10,725.
Families that are below poverty line in Chino Valley earn $10,725 less on average than the poverty threshold level.
What is Inequality or Gini Index in Chino Valley?
Inequality or Gini Index in Chino Valley is 0.37.
What is the Total Population of Chino Valley?
Total Population of Chino Valley is 13,120.
What is the Total Male Population of Chino Valley?
Total Male Population of Chino Valley is 6,224.
What is the Total Female Population of Chino Valley?
Total Female Population of Chino Valley is 6,896.
What is the Ratio of Males per 100 Females in Chino Valley?
There are 90.26 Males per 100 Females in Chino Valley.
What is the Ratio of Females per 100 Males in Chino Valley?
There are 110.80 Females per 100 Males in Chino Valley.
What is the Median Population Age in Chino Valley?
Median Population Age in Chino Valley is 51.5 Years.
What is the Average Family Size in Chino Valley
Average Family Size in Chino Valley is 2.7 People.
What is the Average Household Size in Chino Valley
Average Household Size in Chino Valley is 2.3 People.
How Large is the Labor Force in Chino Valley?
There are 5,396 People in the Labor Forcein in Chino Valley.
What is the Percentage of People in the Labor Force in Chino Valley?
48.4% of People are in the Labor Force in Chino Valley.
What is the Unemployment Rate in Chino Valley?
Unemployment Rate in Chino Valley is 5.2%.