Zip Codes with the Highest Percentage of Population Employed in Health Diagnosing & Treating in Phoenix, AZ
RELATED REPORTS & OPTIONS
Health Diagnosing & Treating
Phoenix
Compare Zip Codes
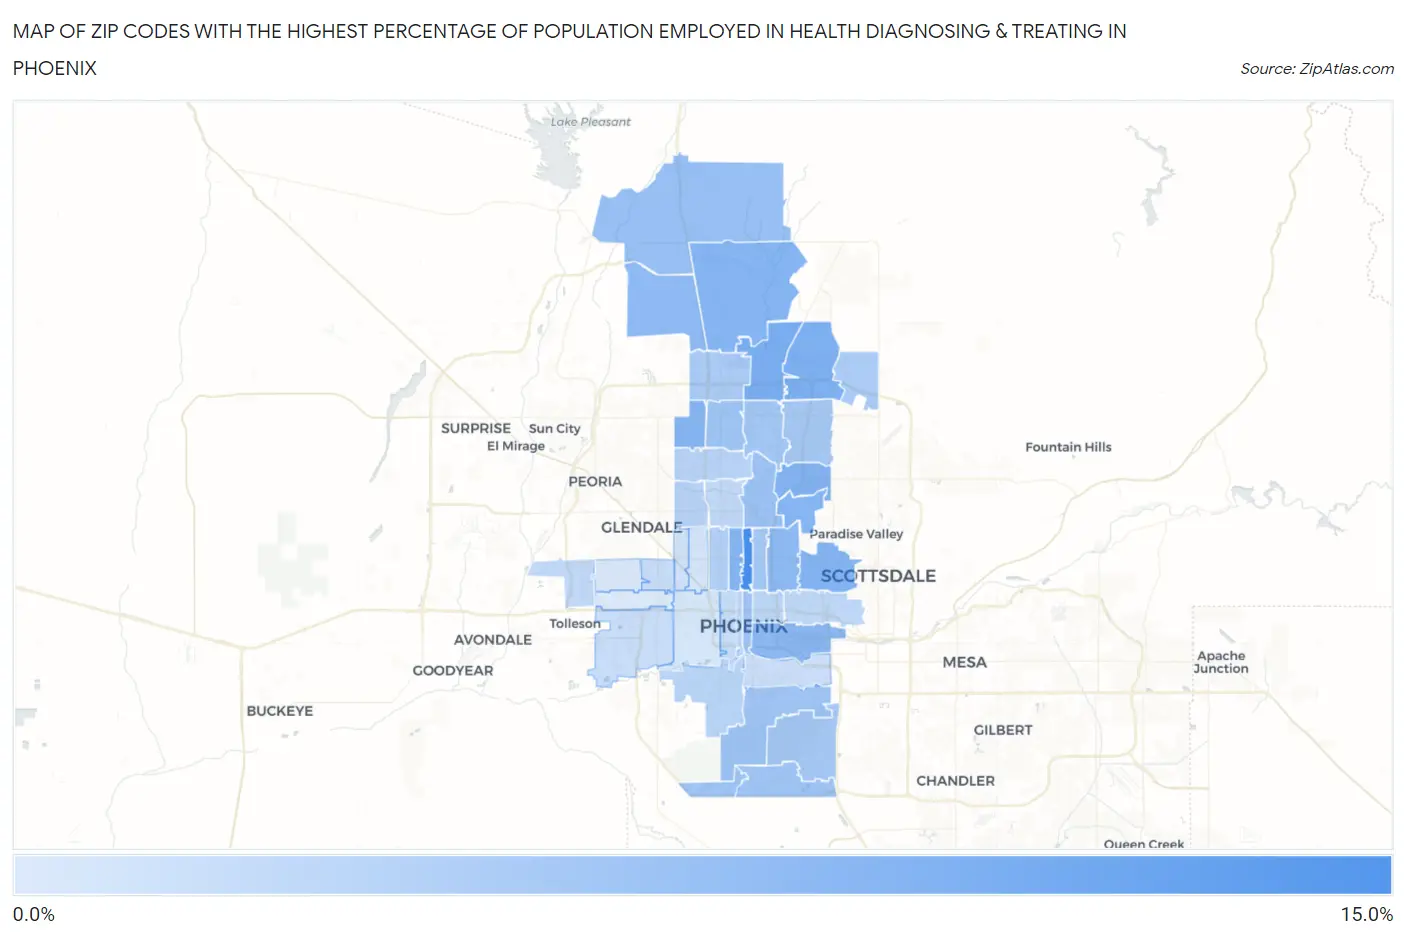
Map of Zip Codes with the Highest Percentage of Population Employed in Health Diagnosing & Treating in Phoenix
1.4%
14.1%
Zip Codes with the Highest Percentage of Population Employed in Health Diagnosing & Treating in Phoenix, AZ
| Zip Code | % Employed | vs State | vs National | |
| 1. | 85012 | 14.1% | 5.9%(+8.21)#11 | 6.2%(+7.85)#1,383 |
| 2. | 85024 | 9.6% | 5.9%(+3.71)#42 | 6.2%(+3.34)#4,416 |
| 3. | 85050 | 9.3% | 5.9%(+3.40)#49 | 6.2%(+3.03)#4,897 |
| 4. | 85028 | 8.8% | 5.9%(+2.87)#58 | 6.2%(+2.51)#5,825 |
| 5. | 85085 | 8.6% | 5.9%(+2.74)#61 | 6.2%(+2.38)#6,086 |
| 6. | 85013 | 8.6% | 5.9%(+2.72)#62 | 6.2%(+2.36)#6,126 |
| 7. | 85018 | 8.6% | 5.9%(+2.71)#63 | 6.2%(+2.35)#6,152 |
| 8. | 85053 | 8.4% | 5.9%(+2.54)#66 | 6.2%(+2.17)#6,495 |
| 9. | 85034 | 8.1% | 5.9%(+2.22)#74 | 6.2%(+1.86)#7,243 |
| 10. | 85016 | 7.9% | 5.9%(+2.04)#79 | 6.2%(+1.68)#7,694 |
| 11. | 85083 | 7.9% | 5.9%(+1.97)#81 | 6.2%(+1.61)#7,877 |
| 12. | 85086 | 7.1% | 5.9%(+1.18)#107 | 6.2%(+0.817)#10,158 |
| 13. | 85020 | 6.8% | 5.9%(+0.890)#119 | 6.2%(+0.527)#11,086 |
| 14. | 85023 | 6.5% | 5.9%(+0.601)#130 | 6.2%(+0.237)#12,086 |
| 15. | 85004 | 6.4% | 5.9%(+0.548)#132 | 6.2%(+0.184)#12,278 |
| 16. | 85048 | 6.3% | 5.9%(+0.434)#140 | 6.2%(+0.071)#12,710 |
| 17. | 85045 | 6.2% | 5.9%(+0.361)#145 | 6.2%(-0.002)#12,986 |
| 18. | 85042 | 6.2% | 5.9%(+0.348)#146 | 6.2%(-0.015)#13,048 |
| 19. | 85022 | 6.1% | 5.9%(+0.248)#150 | 6.2%(-0.115)#13,406 |
| 20. | 85014 | 5.9% | 5.9%(+0.048)#161 | 6.2%(-0.316)#14,117 |
| 21. | 85044 | 5.9% | 5.9%(+0.017)#164 | 6.2%(-0.346)#14,228 |
| 22. | 85032 | 5.9% | 5.9%(+0.011)#166 | 6.2%(-0.353)#14,252 |
| 23. | 85027 | 5.6% | 5.9%(-0.270)#180 | 6.2%(-0.634)#15,353 |
| 24. | 85054 | 5.4% | 5.9%(-0.529)#192 | 6.2%(-0.893)#16,356 |
| 25. | 85015 | 4.7% | 5.9%(-1.19)#211 | 6.2%(-1.55)#18,883 |
| 26. | 85029 | 4.4% | 5.9%(-1.51)#231 | 6.2%(-1.88)#20,102 |
| 27. | 85051 | 4.3% | 5.9%(-1.56)#234 | 6.2%(-1.92)#20,254 |
| 28. | 85041 | 4.3% | 5.9%(-1.63)#237 | 6.2%(-1.99)#20,511 |
| 29. | 85006 | 4.0% | 5.9%(-1.84)#243 | 6.2%(-2.20)#21,240 |
| 30. | 85008 | 3.7% | 5.9%(-2.14)#253 | 6.2%(-2.50)#22,167 |
| 31. | 85021 | 3.7% | 5.9%(-2.23)#255 | 6.2%(-2.59)#22,451 |
| 32. | 85037 | 3.6% | 5.9%(-2.30)#257 | 6.2%(-2.66)#22,671 |
| 33. | 85003 | 3.5% | 5.9%(-2.33)#259 | 6.2%(-2.70)#22,770 |
| 34. | 85007 | 3.2% | 5.9%(-2.64)#270 | 6.2%(-3.01)#23,667 |
| 35. | 85031 | 3.1% | 5.9%(-2.79)#277 | 6.2%(-3.15)#24,088 |
| 36. | 85043 | 3.0% | 5.9%(-2.86)#279 | 6.2%(-3.23)#24,272 |
| 37. | 85040 | 2.9% | 5.9%(-2.96)#284 | 6.2%(-3.32)#24,530 |
| 38. | 85019 | 2.3% | 5.9%(-3.55)#302 | 6.2%(-3.92)#25,854 |
| 39. | 85017 | 2.1% | 5.9%(-3.78)#306 | 6.2%(-4.15)#26,299 |
| 40. | 85009 | 1.9% | 5.9%(-3.96)#313 | 6.2%(-4.32)#26,601 |
| 41. | 85033 | 1.6% | 5.9%(-4.28)#324 | 6.2%(-4.65)#27,082 |
| 42. | 85035 | 1.4% | 5.9%(-4.50)#329 | 6.2%(-4.86)#27,351 |
1
Common Questions
What are the Top 10 Zip Codes with the Highest Percentage of Population Employed in Health Diagnosing & Treating in Phoenix, AZ?
Top 10 Zip Codes with the Highest Percentage of Population Employed in Health Diagnosing & Treating in Phoenix, AZ are:
What zip code has the Highest Percentage of Population Employed in Health Diagnosing & Treating in Phoenix, AZ?
85012 has the Highest Percentage of Population Employed in Health Diagnosing & Treating in Phoenix, AZ with 14.1%.
What is the Percentage of Population Employed in Health Diagnosing & Treating in Phoenix, AZ?
Percentage of Population Employed in Health Diagnosing & Treating in Phoenix is 5.5%.
What is the Percentage of Population Employed in Health Diagnosing & Treating in Arizona?
Percentage of Population Employed in Health Diagnosing & Treating in Arizona is 5.9%.
What is the Percentage of Population Employed in Health Diagnosing & Treating in the United States?
Percentage of Population Employed in Health Diagnosing & Treating in the United States is 6.2%.