Congress, AZ Map & Demographics
Congress Map
Congress Overview
$39,998
PER CAPITA INCOME
$67,250
AVG FAMILY INCOME
$61,563
AVG HOUSEHOLD INCOME
0.47
INEQUALITY / GINI INDEX
1,512
TOTAL POPULATION
789
MALE POPULATION
723
FEMALE POPULATION
109.13
MALES / 100 FEMALES
91.63
FEMALES / 100 MALES
69.7
MEDIAN AGE
2.4
AVG FAMILY SIZE
2.1
AVG HOUSEHOLD SIZE
326
LABOR FORCE [ PEOPLE ]
23.3%
PERCENT IN LABOR FORCE
Congress Zip Codes
Congress Area Codes
Income in Congress
Income Overview in Congress
Per Capita Income in Congress is $39,998, while median incomes of families and households are $67,250 and $61,563 respectively.
| Characteristic | Number | Measure |
| Per Capita Income | 1,512 | $39,998 |
| Median Family Income | 572 | $67,250 |
| Mean Family Income | 572 | $98,062 |
| Median Household Income | 734 | $61,563 |
| Mean Household Income | 734 | $82,267 |
| Income Deficit | 572 | $0 |
| Wage / Income Gap (%) | 1,512 | 0.00% |
| Wage / Income Gap ($) | 1,512 | 100.00¢ per $1 |
| Gini / Inequality Index | 1,512 | 0.47 |
Earnings by Sex in Congress
| Sex | Number | Average Earnings |
| Male | 197 (51.0%) | $0 |
| Female | 189 (49.0%) | $0 |
| Total | 386 (100.0%) | $0 |
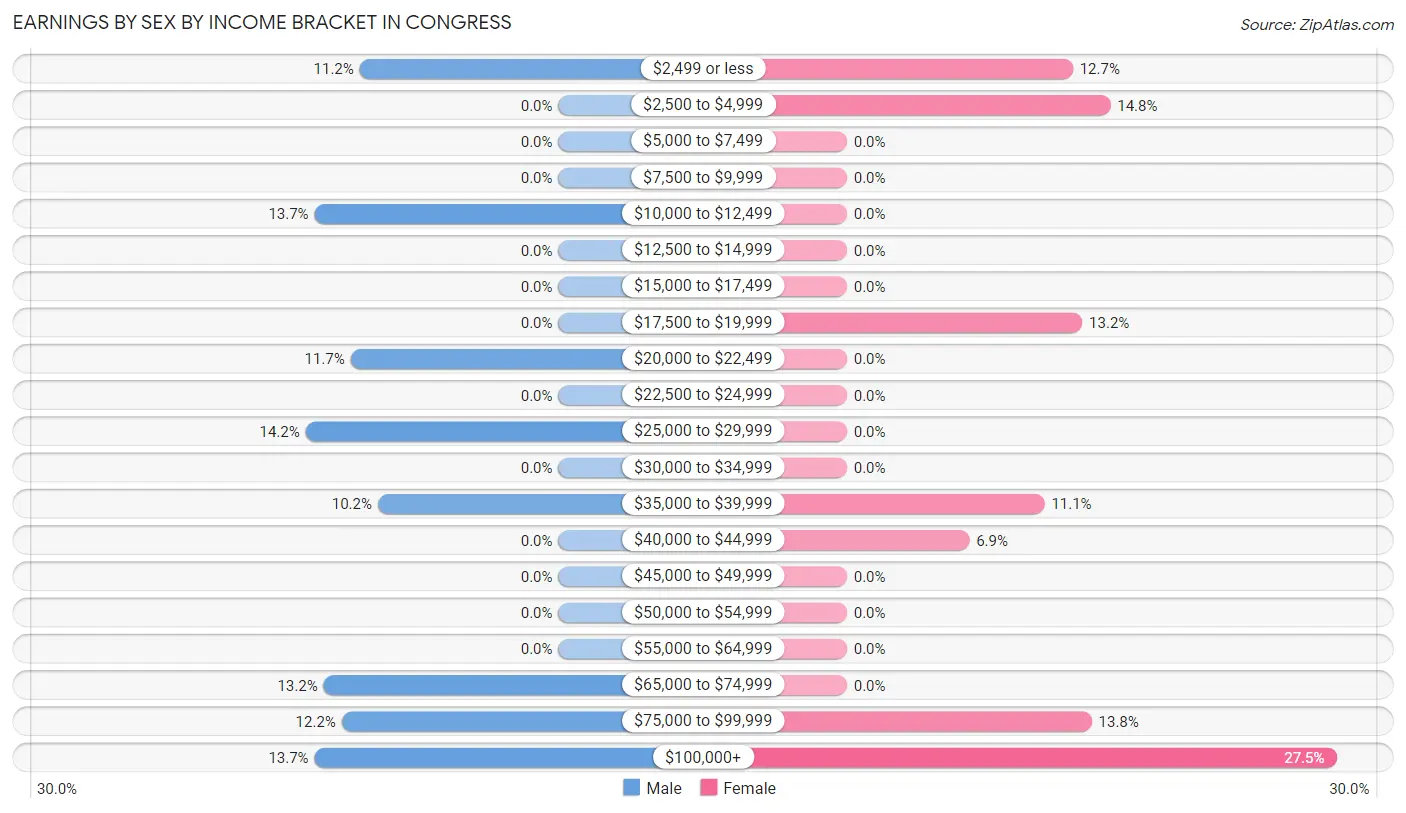
Earnings by Sex by Income Bracket in Congress
The most common earnings brackets in Congress are $25,000 to $29,999 for men (28 | 14.2%) and $100,000+ for women (52 | 27.5%).
| Income | Male | Female |
| $2,499 or less | 22 (11.2%) | 24 (12.7%) |
| $2,500 to $4,999 | 0 (0.0%) | 28 (14.8%) |
| $5,000 to $7,499 | 0 (0.0%) | 0 (0.0%) |
| $7,500 to $9,999 | 0 (0.0%) | 0 (0.0%) |
| $10,000 to $12,499 | 27 (13.7%) | 0 (0.0%) |
| $12,500 to $14,999 | 0 (0.0%) | 0 (0.0%) |
| $15,000 to $17,499 | 0 (0.0%) | 0 (0.0%) |
| $17,500 to $19,999 | 0 (0.0%) | 25 (13.2%) |
| $20,000 to $22,499 | 23 (11.7%) | 0 (0.0%) |
| $22,500 to $24,999 | 0 (0.0%) | 0 (0.0%) |
| $25,000 to $29,999 | 28 (14.2%) | 0 (0.0%) |
| $30,000 to $34,999 | 0 (0.0%) | 0 (0.0%) |
| $35,000 to $39,999 | 20 (10.2%) | 21 (11.1%) |
| $40,000 to $44,999 | 0 (0.0%) | 13 (6.9%) |
| $45,000 to $49,999 | 0 (0.0%) | 0 (0.0%) |
| $50,000 to $54,999 | 0 (0.0%) | 0 (0.0%) |
| $55,000 to $64,999 | 0 (0.0%) | 0 (0.0%) |
| $65,000 to $74,999 | 26 (13.2%) | 0 (0.0%) |
| $75,000 to $99,999 | 24 (12.2%) | 26 (13.8%) |
| $100,000+ | 27 (13.7%) | 52 (27.5%) |
| Total | 197 (100.0%) | 189 (100.0%) |
Earnings by Sex by Educational Attainment in Congress
| Educational Attainment | Male Income | Female Income |
| Less than High School | - | - |
| High School Diploma | - | - |
| College or Associate's Degree | - | - |
| Bachelor's Degree | - | - |
| Graduate Degree | - | - |
| Total | - | - |
Family Income in Congress
Family Income Brackets in Congress
According to the Congress family income data, there are 159 families falling into the $100,000 to $149,999 income range, which is the most common income bracket and makes up 27.8% of all families.
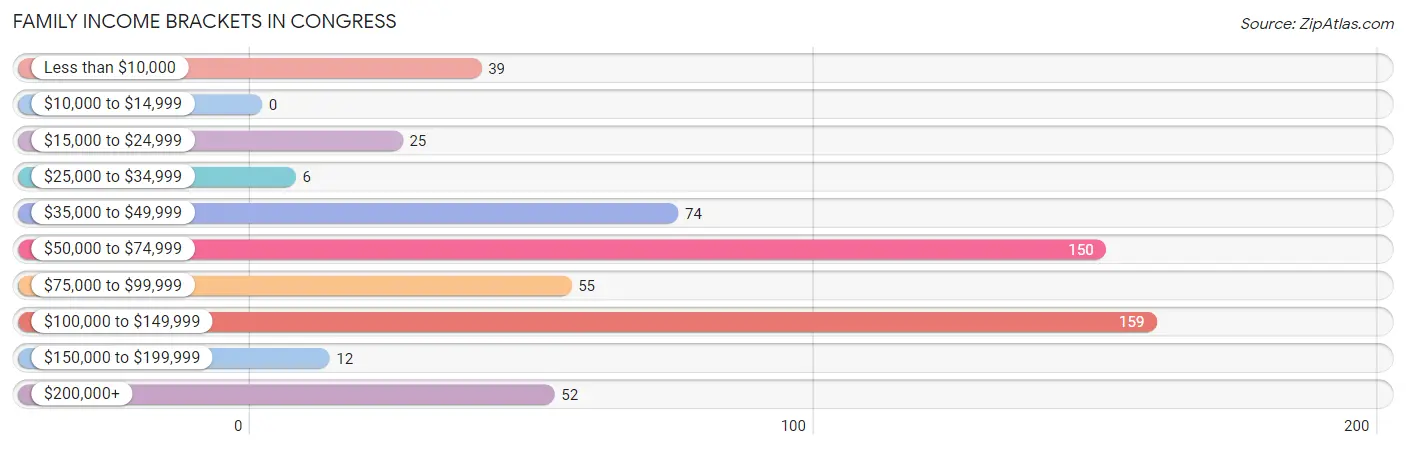
| Income Bracket | # Families | % Families |
| Less than $10,000 | 39 | 6.8% |
| $10,000 to $14,999 | 0 | 0.0% |
| $15,000 to $24,999 | 25 | 4.4% |
| $25,000 to $34,999 | 6 | 1.0% |
| $35,000 to $49,999 | 74 | 12.9% |
| $50,000 to $74,999 | 150 | 26.2% |
| $75,000 to $99,999 | 55 | 9.6% |
| $100,000 to $149,999 | 159 | 27.8% |
| $150,000 to $199,999 | 12 | 2.1% |
| $200,000+ | 52 | 9.1% |
Family Income by Famaliy Size in Congress
2-person families (521 | 91.1%) account for the highest median family income in Congress with $78,050 per family, while 2-person families (521 | 91.1%) have the highest median income of $39,025 per family member.
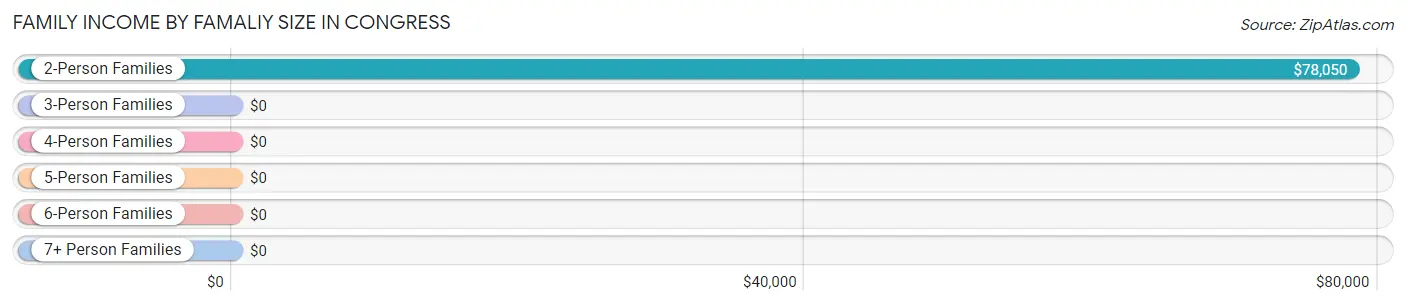
| Income Bracket | # Families | Median Income |
| 2-Person Families | 521 (91.1%) | $78,050 |
| 3-Person Families | 0 (0.0%) | $0 |
| 4-Person Families | 12 (2.1%) | $0 |
| 5-Person Families | 39 (6.8%) | $0 |
| 6-Person Families | 0 (0.0%) | $0 |
| 7+ Person Families | 0 (0.0%) | $0 |
| Total | 572 (100.0%) | $67,250 |
Family Income by Number of Earners in Congress
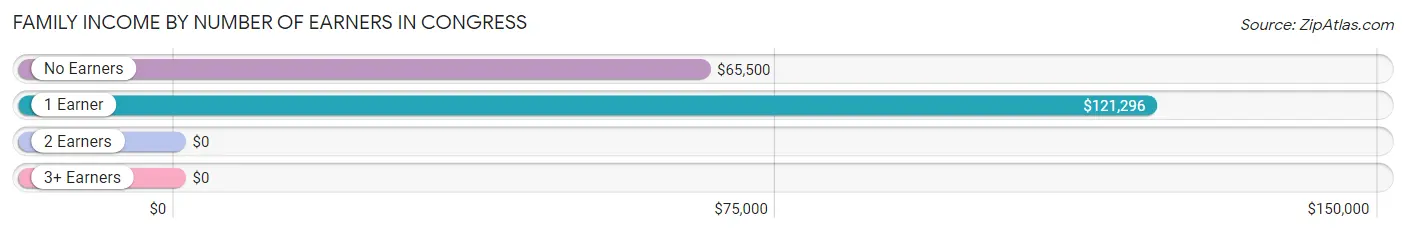
| Number of Earners | # Families | Median Income |
| No Earners | 354 (61.9%) | $65,500 |
| 1 Earner | 130 (22.7%) | $121,296 |
| 2 Earners | 76 (13.3%) | $0 |
| 3+ Earners | 12 (2.1%) | $0 |
| Total | 572 (100.0%) | $67,250 |
Household Income in Congress
Household Income Brackets in Congress
With 174 households falling in the category, the $50,000 to $74,999 income range is the most frequent in Congress, accounting for 23.7% of all households.
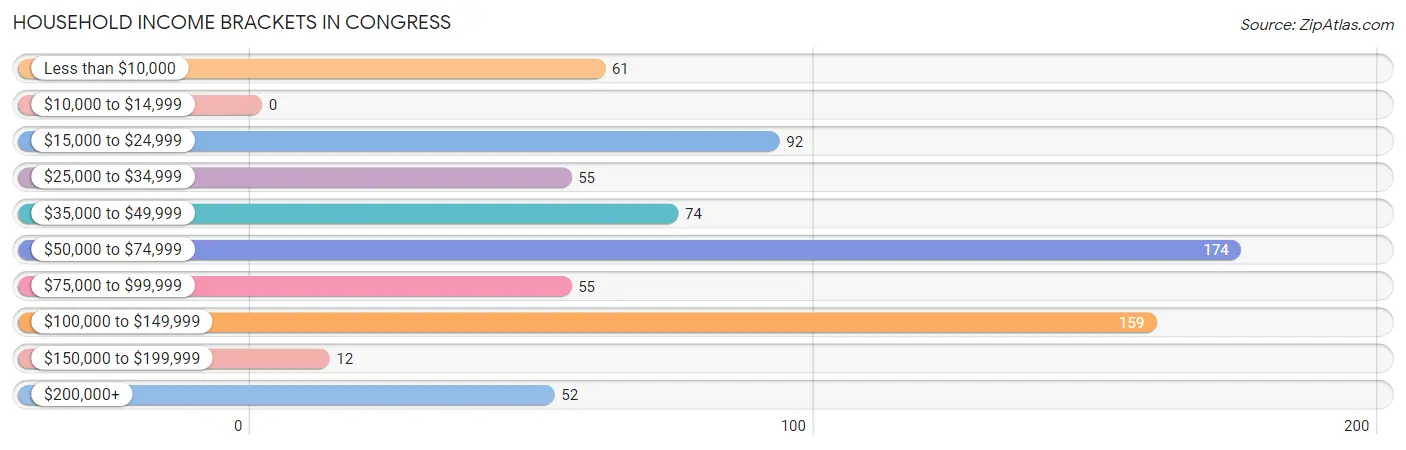
| Income Bracket | # Households | % Households |
| Less than $10,000 | 61 | 8.3% |
| $10,000 to $14,999 | 0 | 0.0% |
| $15,000 to $24,999 | 92 | 12.5% |
| $25,000 to $34,999 | 55 | 7.5% |
| $35,000 to $49,999 | 74 | 10.1% |
| $50,000 to $74,999 | 174 | 23.7% |
| $75,000 to $99,999 | 55 | 7.5% |
| $100,000 to $149,999 | 159 | 21.7% |
| $150,000 to $199,999 | 12 | 1.6% |
| $200,000+ | 52 | 7.1% |
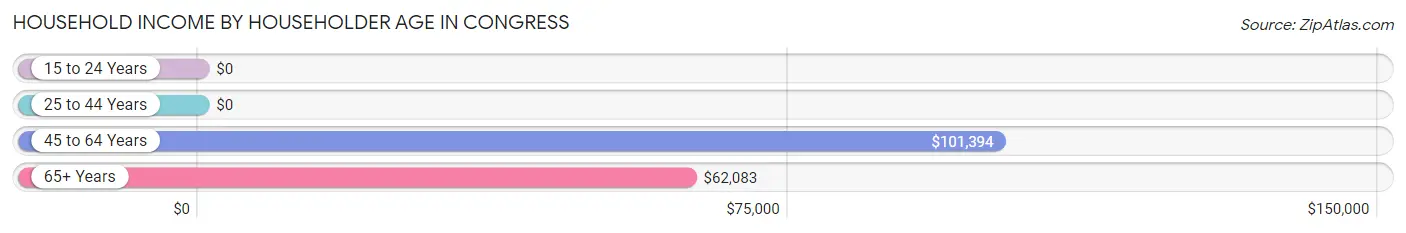
Household Income by Householder Age in Congress
The median household income in Congress is $61,563, with the highest median household income of $101,394 found in the 45 to 64 years age bracket for the primary householder. A total of 235 households (32.0%) fall into this category.
| Income Bracket | # Households | Median Income |
| 15 to 24 Years | 0 (0.0%) | $0 |
| 25 to 44 Years | 39 (5.3%) | $0 |
| 45 to 64 Years | 235 (32.0%) | $101,394 |
| 65+ Years | 460 (62.7%) | $62,083 |
| Total | 734 (100.0%) | $61,563 |
Poverty in Congress
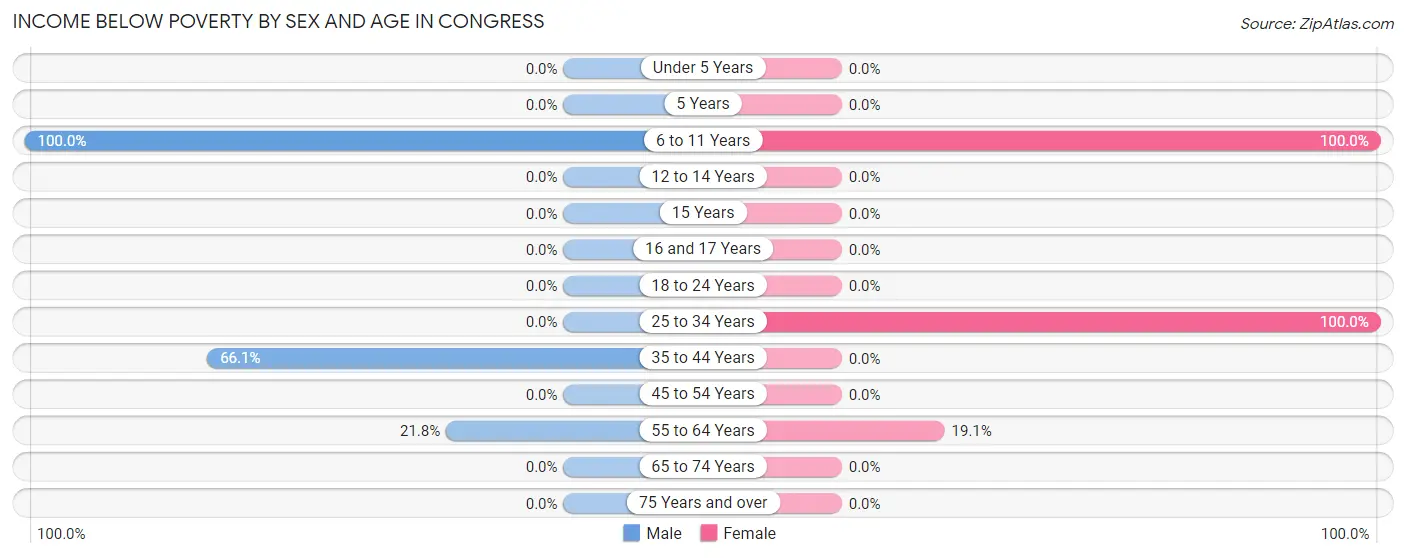
Income Below Poverty by Sex and Age in Congress
With 17.0% poverty level for males and 17.0% for females among the residents of Congress, 6 to 11 year old males and 6 to 11 year old females are the most vulnerable to poverty, with 73 males (100.0%) and 38 females (100.0%) in their respective age groups living below the poverty level.
| Age Bracket | Male | Female |
| Under 5 Years | 0 (0.0%) | 0 (0.0%) |
| 5 Years | 0 (0.0%) | 0 (0.0%) |
| 6 to 11 Years | 73 (100.0%) | 38 (100.0%) |
| 12 to 14 Years | 0 (0.0%) | 0 (0.0%) |
| 15 Years | 0 (0.0%) | 0 (0.0%) |
| 16 and 17 Years | 0 (0.0%) | 0 (0.0%) |
| 18 to 24 Years | 0 (0.0%) | 0 (0.0%) |
| 25 to 34 Years | 0 (0.0%) | 60 (100.0%) |
| 35 to 44 Years | 39 (66.1%) | 0 (0.0%) |
| 45 to 54 Years | 0 (0.0%) | 0 (0.0%) |
| 55 to 64 Years | 22 (21.8%) | 25 (19.1%) |
| 65 to 74 Years | 0 (0.0%) | 0 (0.0%) |
| 75 Years and over | 0 (0.0%) | 0 (0.0%) |
| Total | 134 (17.0%) | 123 (17.0%) |
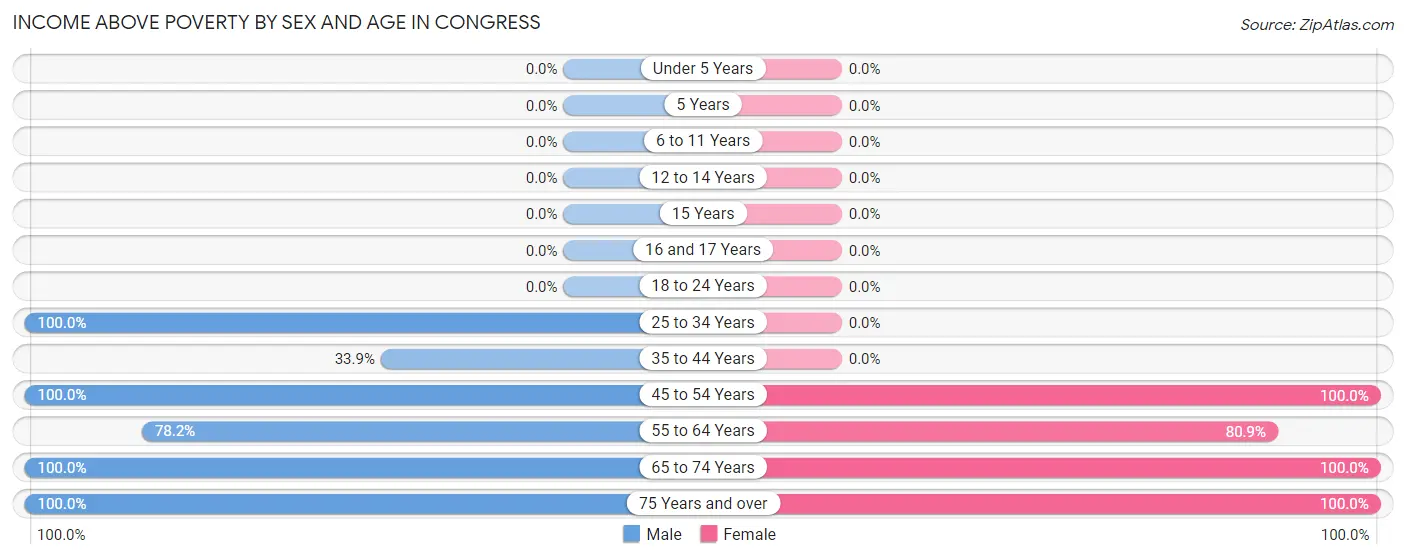
Income Above Poverty by Sex and Age in Congress
According to the poverty statistics in Congress, males aged 25 to 34 years and females aged 45 to 54 years are the age groups that are most secure financially, with 100.0% of males and 100.0% of females in these age groups living above the poverty line.
| Age Bracket | Male | Female |
| Under 5 Years | 0 (0.0%) | 0 (0.0%) |
| 5 Years | 0 (0.0%) | 0 (0.0%) |
| 6 to 11 Years | 0 (0.0%) | 0 (0.0%) |
| 12 to 14 Years | 0 (0.0%) | 0 (0.0%) |
| 15 Years | 0 (0.0%) | 0 (0.0%) |
| 16 and 17 Years | 0 (0.0%) | 0 (0.0%) |
| 18 to 24 Years | 0 (0.0%) | 0 (0.0%) |
| 25 to 34 Years | 23 (100.0%) | 0 (0.0%) |
| 35 to 44 Years | 20 (33.9%) | 0 (0.0%) |
| 45 to 54 Years | 53 (100.0%) | 25 (100.0%) |
| 55 to 64 Years | 79 (78.2%) | 106 (80.9%) |
| 65 to 74 Years | 217 (100.0%) | 324 (100.0%) |
| 75 Years and over | 263 (100.0%) | 145 (100.0%) |
| Total | 655 (83.0%) | 600 (83.0%) |
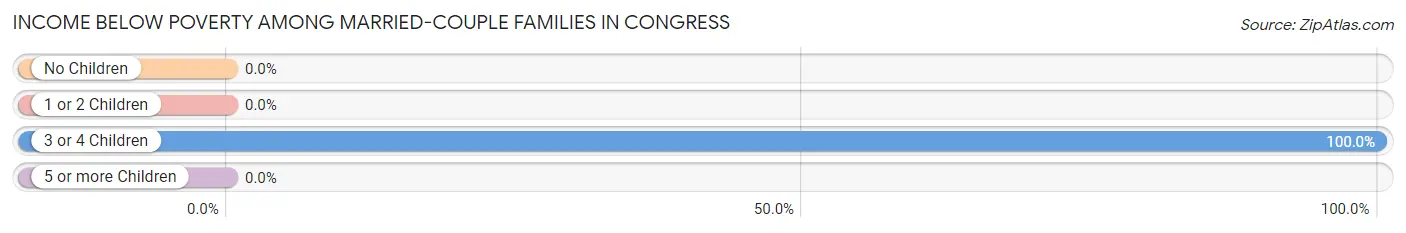
Income Below Poverty Among Married-Couple Families in Congress
The poverty statistics for married-couple families in Congress show that 7.5% or 39 of the total 521 families live below the poverty line. Families with 3 or 4 children have the highest poverty rate of 100.0%, comprising of 39 families. On the other hand, families with no children have the lowest poverty rate of 0.0%, which includes 0 families.
| Children | Above Poverty | Below Poverty |
| No Children | 482 (100.0%) | 0 (0.0%) |
| 1 or 2 Children | 0 (0.0%) | 0 (0.0%) |
| 3 or 4 Children | 0 (0.0%) | 39 (100.0%) |
| 5 or more Children | 0 (0.0%) | 0 (0.0%) |
| Total | 482 (92.5%) | 39 (7.5%) |
Income Below Poverty Among Single-Parent Households in Congress
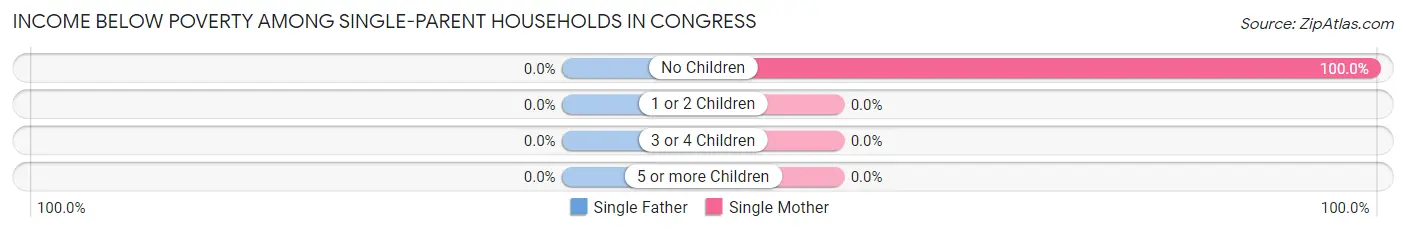
| Children | Single Father | Single Mother |
| No Children | 0 (0.0%) | 25 (100.0%) |
| 1 or 2 Children | 0 (0.0%) | 0 (0.0%) |
| 3 or 4 Children | 0 (0.0%) | 0 (0.0%) |
| 5 or more Children | 0 (0.0%) | 0 (0.0%) |
| Total | 0 (0.0%) | 25 (100.0%) |
Income Below Poverty Among Married-Couple vs Single-Parent Households in Congress
The poverty data for Congress shows that 39 of the married-couple family households (7.5%) and 25 of the single-parent households (49.0%) are living below the poverty level. Within the married-couple family households, those with 3 or 4 children have the highest poverty rate, with 39 households (100.0%) falling below the poverty line. Among the single-parent households, those with no children have the highest poverty rate, with 25 household (49.0%) living below poverty.
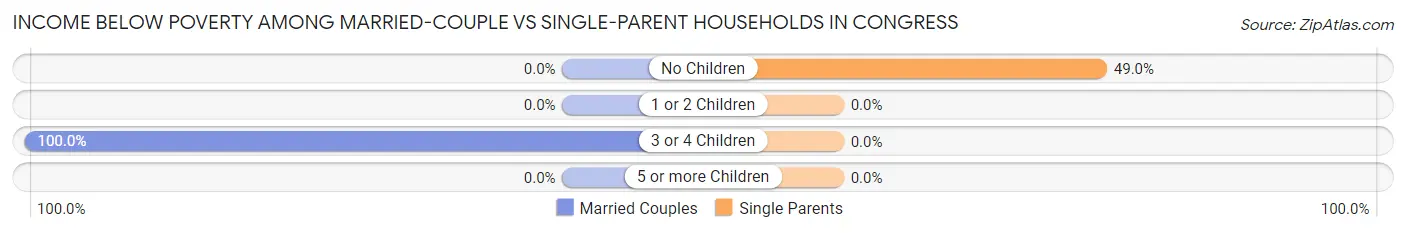
| Children | Married-Couple Families | Single-Parent Households |
| No Children | 0 (0.0%) | 25 (49.0%) |
| 1 or 2 Children | 0 (0.0%) | 0 (0.0%) |
| 3 or 4 Children | 39 (100.0%) | 0 (0.0%) |
| 5 or more Children | 0 (0.0%) | 0 (0.0%) |
| Total | 39 (7.5%) | 25 (49.0%) |
Race in Congress
The most populous races in Congress are White / Caucasian (1,382 | 91.4%), Two or more Races (68 | 4.5%), and Some other Race (62 | 4.1%).
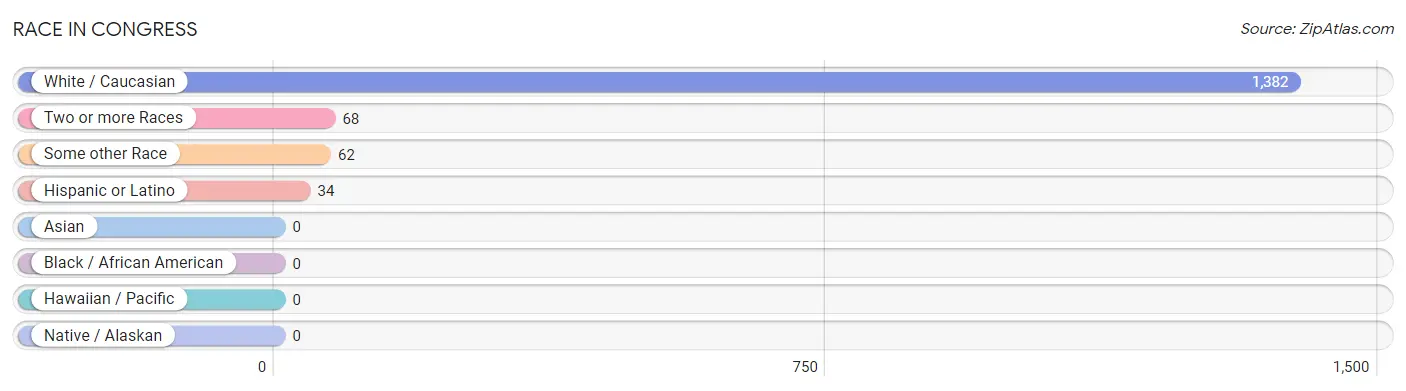
| Race | # Population | % Population |
| Asian | 0 | 0.0% |
| Black / African American | 0 | 0.0% |
| Hawaiian / Pacific | 0 | 0.0% |
| Hispanic or Latino | 34 | 2.2% |
| Native / Alaskan | 0 | 0.0% |
| White / Caucasian | 1,382 | 91.4% |
| Two or more Races | 68 | 4.5% |
| Some other Race | 62 | 4.1% |
| Total | 1,512 | 100.0% |
Ancestry in Congress
The most populous ancestries reported in Congress are English (397 | 26.3%), Irish (350 | 23.2%), German (307 | 20.3%), Scottish (77 | 5.1%), and Swedish (56 | 3.7%), together accounting for 78.5% of all Congress residents.
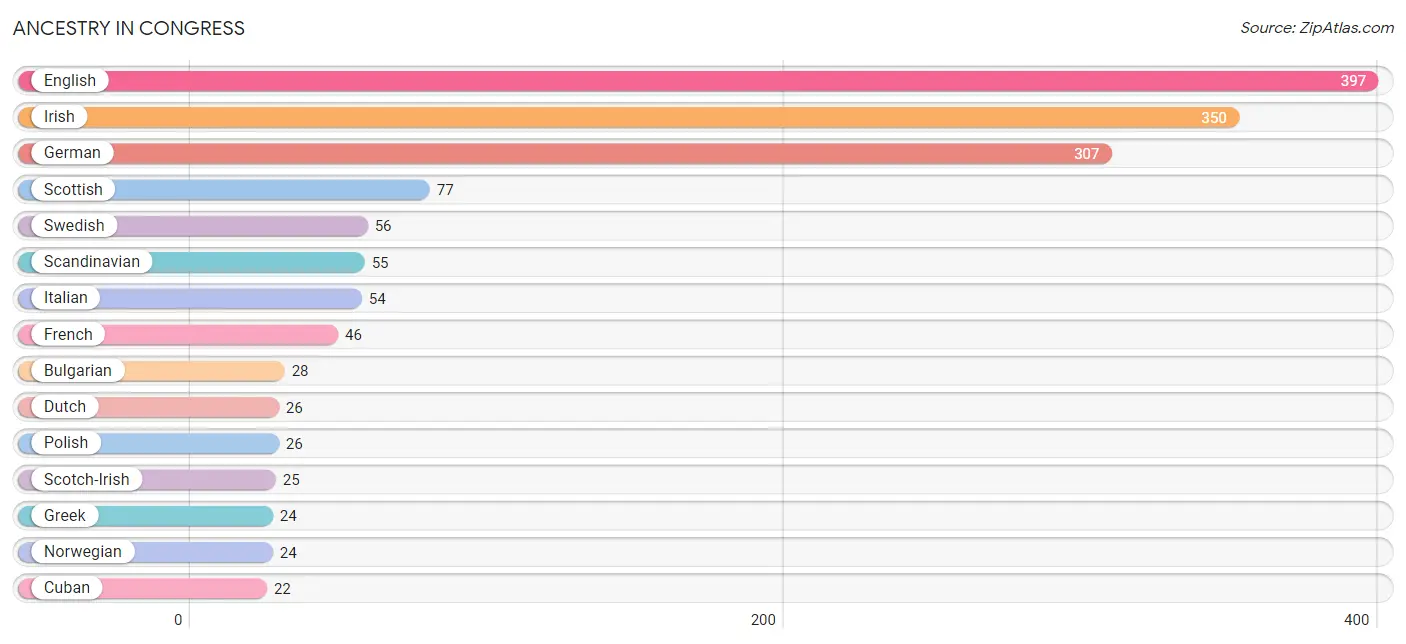
| Ancestry | # Population | % Population |
| Bulgarian | 28 | 1.8% |
| Cuban | 22 | 1.5% |
| Dutch | 26 | 1.7% |
| English | 397 | 26.3% |
| French | 46 | 3.0% |
| German | 307 | 20.3% |
| Greek | 24 | 1.6% |
| Irish | 350 | 23.2% |
| Italian | 54 | 3.6% |
| Mexican | 12 | 0.8% |
| Norwegian | 24 | 1.6% |
| Polish | 26 | 1.7% |
| Scandinavian | 55 | 3.6% |
| Scotch-Irish | 25 | 1.7% |
| Scottish | 77 | 5.1% |
| Swedish | 56 | 3.7% |
| Ukrainian | 6 | 0.4% | View All 17 Rows |
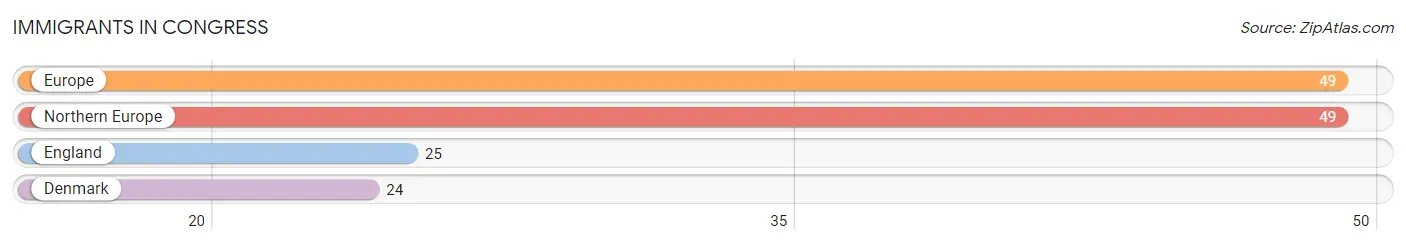
Immigrants in Congress
The most numerous immigrant groups reported in Congress came from Europe (49 | 3.2%), Northern Europe (49 | 3.2%), England (25 | 1.7%), and Denmark (24 | 1.6%), together accounting for 9.7% of all Congress residents.
| Immigration Origin | # Population | % Population |
| Denmark | 24 | 1.6% |
| England | 25 | 1.7% |
| Europe | 49 | 3.2% |
| Northern Europe | 49 | 3.2% | View All 4 Rows |
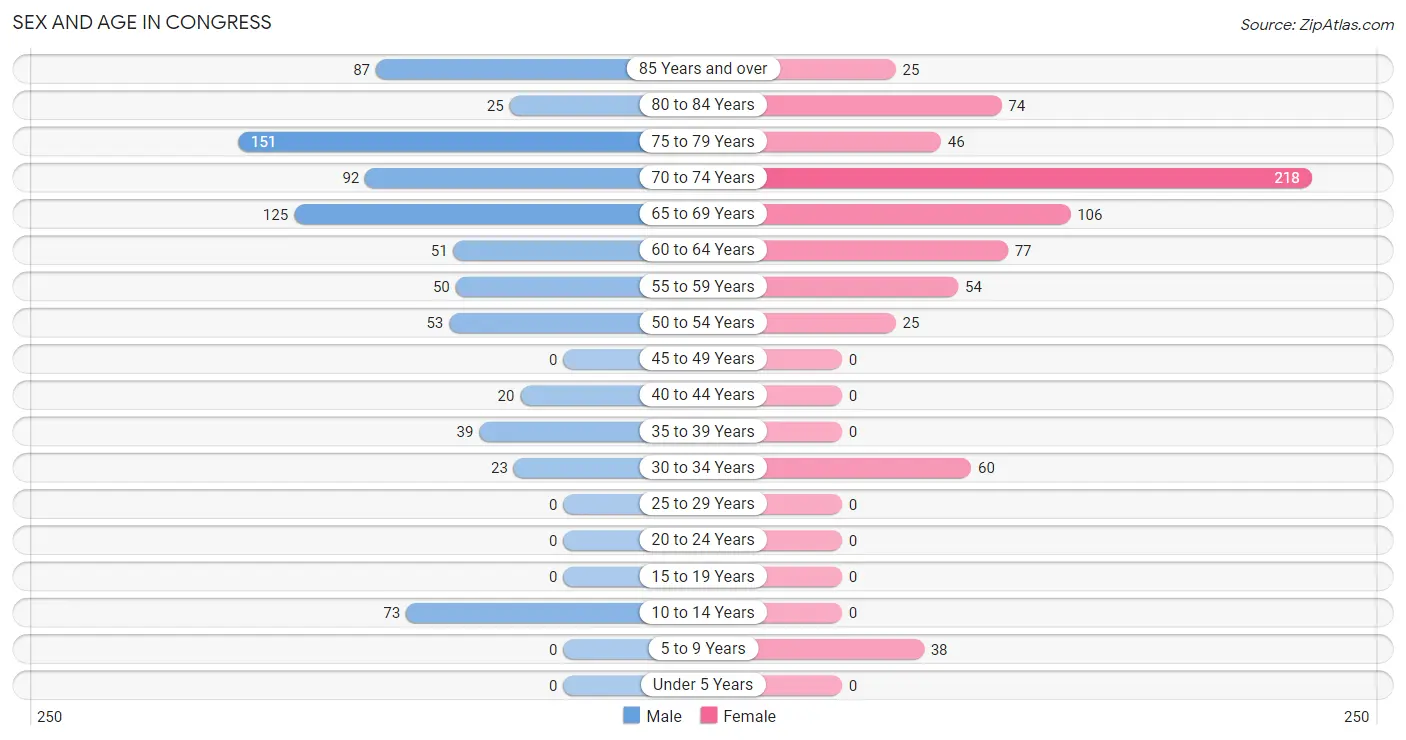
Sex and Age in Congress
Sex and Age in Congress
The most populous age groups in Congress are 75 to 79 Years (151 | 19.1%) for men and 70 to 74 Years (218 | 30.1%) for women.
| Age Bracket | Male | Female |
| Under 5 Years | 0 (0.0%) | 0 (0.0%) |
| 5 to 9 Years | 0 (0.0%) | 38 (5.3%) |
| 10 to 14 Years | 73 (9.2%) | 0 (0.0%) |
| 15 to 19 Years | 0 (0.0%) | 0 (0.0%) |
| 20 to 24 Years | 0 (0.0%) | 0 (0.0%) |
| 25 to 29 Years | 0 (0.0%) | 0 (0.0%) |
| 30 to 34 Years | 23 (2.9%) | 60 (8.3%) |
| 35 to 39 Years | 39 (4.9%) | 0 (0.0%) |
| 40 to 44 Years | 20 (2.5%) | 0 (0.0%) |
| 45 to 49 Years | 0 (0.0%) | 0 (0.0%) |
| 50 to 54 Years | 53 (6.7%) | 25 (3.5%) |
| 55 to 59 Years | 50 (6.3%) | 54 (7.5%) |
| 60 to 64 Years | 51 (6.5%) | 77 (10.6%) |
| 65 to 69 Years | 125 (15.8%) | 106 (14.7%) |
| 70 to 74 Years | 92 (11.7%) | 218 (30.1%) |
| 75 to 79 Years | 151 (19.1%) | 46 (6.4%) |
| 80 to 84 Years | 25 (3.2%) | 74 (10.2%) |
| 85 Years and over | 87 (11.0%) | 25 (3.5%) |
| Total | 789 (100.0%) | 723 (100.0%) |
Families and Households in Congress
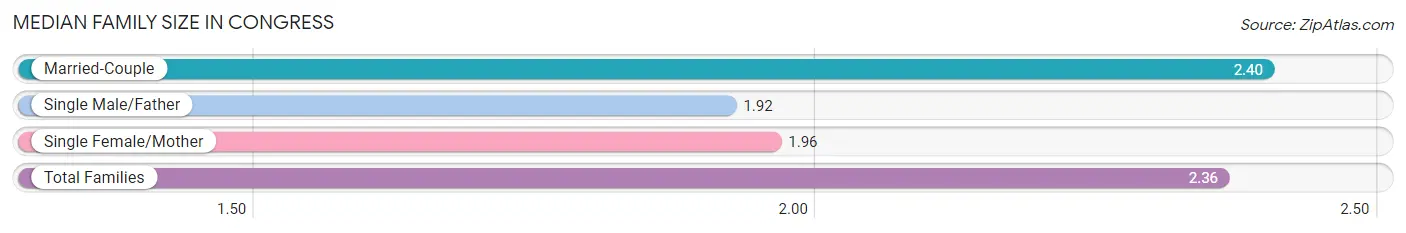
Median Family Size in Congress
The median family size in Congress is 2.36 persons per family, with married-couple families (521 | 91.1%) accounting for the largest median family size of 2.4 persons per family. On the other hand, single male/father families (26 | 4.5%) represent the smallest median family size with 1.92 persons per family.
| Family Type | # Families | Family Size |
| Married-Couple | 521 (91.1%) | 2.40 |
| Single Male/Father | 26 (4.5%) | 1.92 |
| Single Female/Mother | 25 (4.4%) | 1.96 |
| Total Families | 572 (100.0%) | 2.36 |
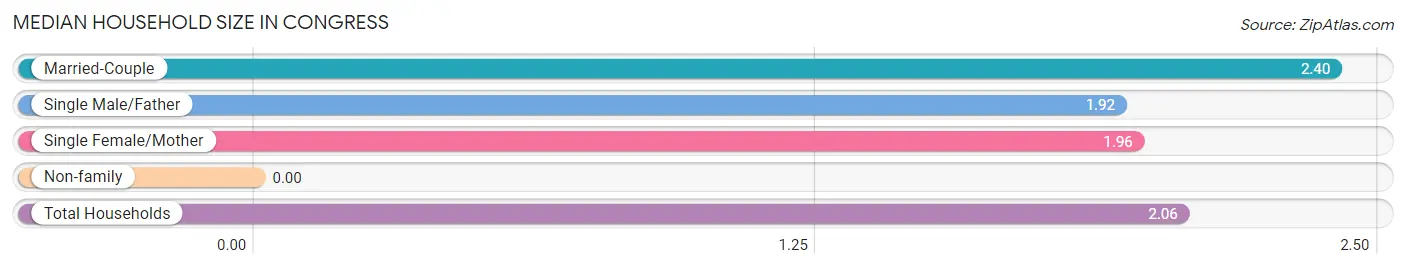
Median Household Size in Congress
| Household Type | # Households | Household Size |
| Married-Couple | 521 (71.0%) | 2.40 |
| Single Male/Father | 26 (3.5%) | 1.92 |
| Single Female/Mother | 25 (3.4%) | 1.96 |
| Non-family | 162 (22.1%) | - |
| Total Households | 734 (100.0%) | 2.06 |
Household Size by Marriage Status in Congress
Out of a total of 734 households in Congress, 572 (77.9%) are family households, while 162 (22.1%) are nonfamily households. The most numerous type of family households are 2-person households, comprising 521, and the most common type of nonfamily households are 1-person households, comprising 162.
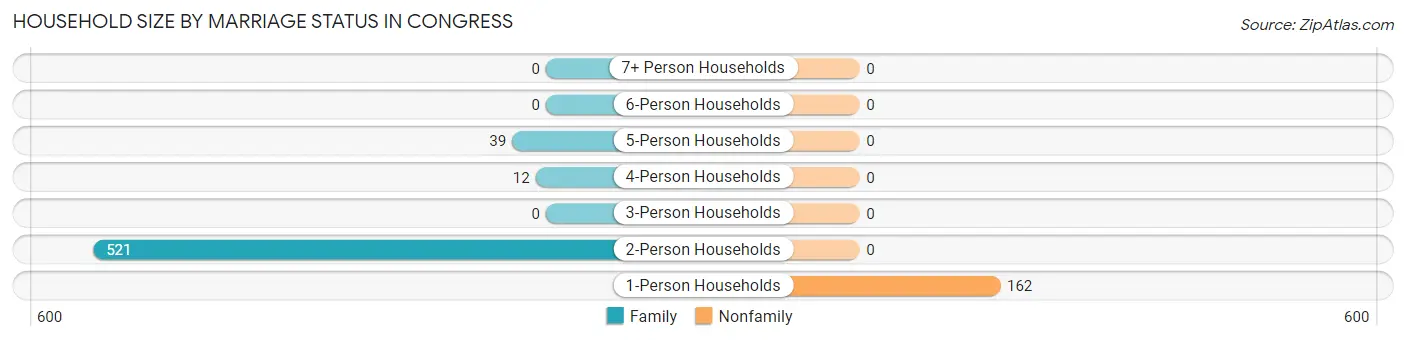
| Household Size | Family Households | Nonfamily Households |
| 1-Person Households | - | 162 (22.1%) |
| 2-Person Households | 521 (71.0%) | 0 (0.0%) |
| 3-Person Households | 0 (0.0%) | 0 (0.0%) |
| 4-Person Households | 12 (1.6%) | 0 (0.0%) |
| 5-Person Households | 39 (5.3%) | 0 (0.0%) |
| 6-Person Households | 0 (0.0%) | 0 (0.0%) |
| 7+ Person Households | 0 (0.0%) | 0 (0.0%) |
| Total | 572 (77.9%) | 162 (22.1%) |
Female Fertility in Congress
Fertility by Age in Congress
| Age Bracket | Women with Births | Births / 1,000 Women |
| 15 to 19 years | 0 (0.0%) | 0.0 |
| 20 to 34 years | 0 (0.0%) | 0.0 |
| 35 to 50 years | 0 (0.0%) | 0.0 |
| Total | 0 (0.0%) | 0.0 |
Fertility by Age by Marriage Status in Congress
| Age Bracket | Married | Unmarried |
| 15 to 19 years | 0 (0.0%) | 0 (0.0%) |
| 20 to 34 years | 0 (0.0%) | 0 (0.0%) |
| 35 to 50 years | 0 (0.0%) | 0 (0.0%) |
| Total | 0 (0.0%) | 0 (0.0%) |
Fertility by Education in Congress
| Educational Attainment | Women with Births | Births / 1,000 Women |
| Less than High School | 0 (0.0%) | 0.0 |
| High School Diploma | 0 (0.0%) | 0.0 |
| College or Associate's Degree | 0 (0.0%) | 0.0 |
| Bachelor's Degree | 0 (0.0%) | 0.0 |
| Graduate Degree | 0 (0.0%) | 0.0 |
| Total | 0 (0.0%) | 0.0 |
Fertility by Education by Marriage Status in Congress
| Educational Attainment | Married | Unmarried |
| Less than High School | 0 (0.0%) | 0 (0.0%) |
| High School Diploma | 0 (0.0%) | 0 (0.0%) |
| College or Associate's Degree | 0 (0.0%) | 0 (0.0%) |
| Bachelor's Degree | 0 (0.0%) | 0 (0.0%) |
| Graduate Degree | 0 (0.0%) | 0 (0.0%) |
| Total | 0 (0.0%) | 0 (0.0%) |
Employment Characteristics in Congress
Employment by Class of Employer in Congress
Among the 327 employed individuals in Congress, private company employees (199 | 60.9%), local government employees (51 | 15.6%), and self-employed (incorporated) (27 | 8.3%) make up the most common classes of employment.
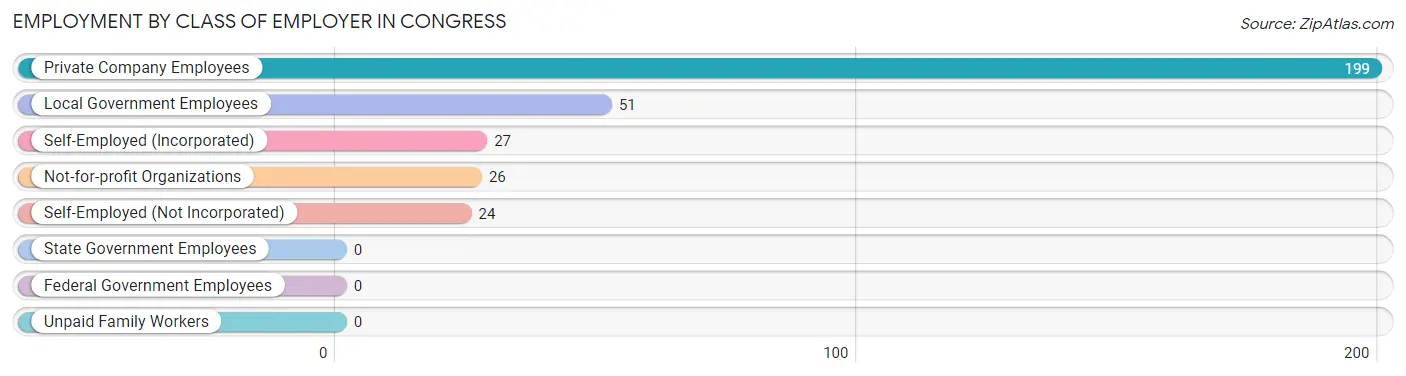
| Employer Class | # Employees | % Employees |
| Private Company Employees | 199 | 60.9% |
| Self-Employed (Incorporated) | 27 | 8.3% |
| Self-Employed (Not Incorporated) | 24 | 7.3% |
| Not-for-profit Organizations | 26 | 8.0% |
| Local Government Employees | 51 | 15.6% |
| State Government Employees | 0 | 0.0% |
| Federal Government Employees | 0 | 0.0% |
| Unpaid Family Workers | 0 | 0.0% |
| Total | 327 | 100.0% |
Employment Status by Age in Congress
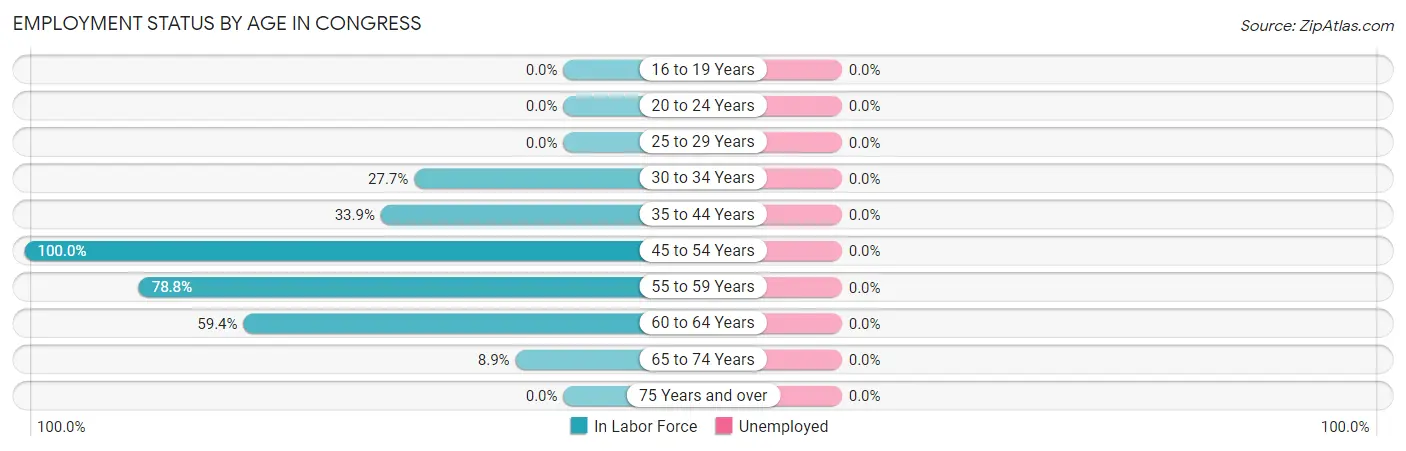
| Age Bracket | In Labor Force | Unemployed |
| 16 to 19 Years | 0 (0.0%) | 0 (0.0%) |
| 20 to 24 Years | 0 (0.0%) | 0 (0.0%) |
| 25 to 29 Years | 0 (0.0%) | 0 (0.0%) |
| 30 to 34 Years | 23 (27.7%) | 0 (0.0%) |
| 35 to 44 Years | 20 (33.9%) | 0 (0.0%) |
| 45 to 54 Years | 78 (100.0%) | 0 (0.0%) |
| 55 to 59 Years | 82 (78.8%) | 0 (0.0%) |
| 60 to 64 Years | 76 (59.4%) | 0 (0.0%) |
| 65 to 74 Years | 48 (8.9%) | 0 (0.0%) |
| 75 Years and over | 0 (0.0%) | 0 (0.0%) |
| Total | 326 (23.3%) | 0 (0.0%) |
Employment Status by Educational Attainment in Congress
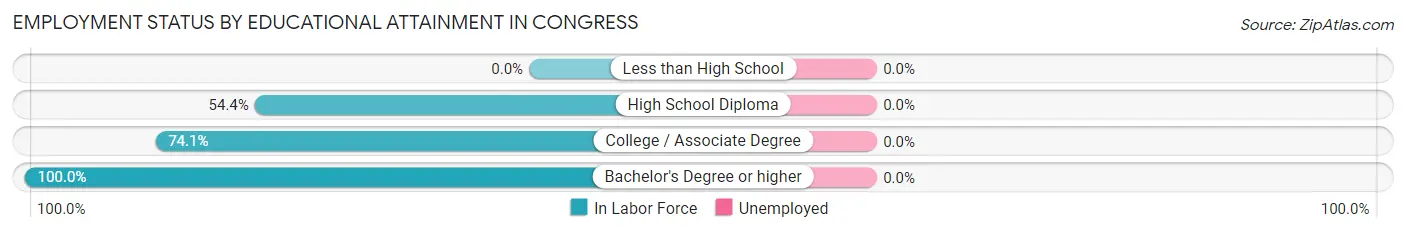
| Educational Attainment | In Labor Force | Unemployed |
| Less than High School | 0 (0.0%) | 0 (0.0%) |
| High School Diploma | 43 (54.4%) | 0 (0.0%) |
| College / Associate Degree | 209 (74.1%) | 0 (0.0%) |
| Bachelor's Degree or higher | 27 (100.0%) | 0 (0.0%) |
| Total | 279 (61.7%) | 0 (0.0%) |
Employment Occupations by Sex in Congress
Management, Business, Science and Arts Occupations
The most common Management, Business, Science and Arts occupations in Congress are Management (124 | 37.9%), and Health Diagnosing & Treating (26 | 8.0%).
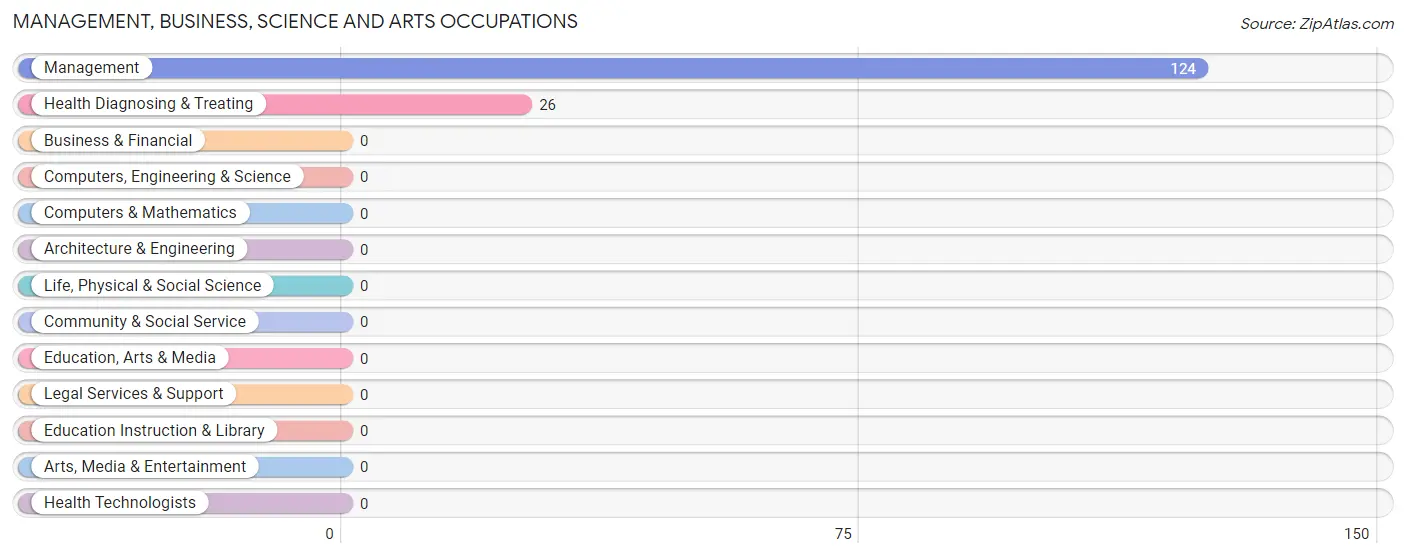
Management, Business, Science and Arts Occupations by Sex
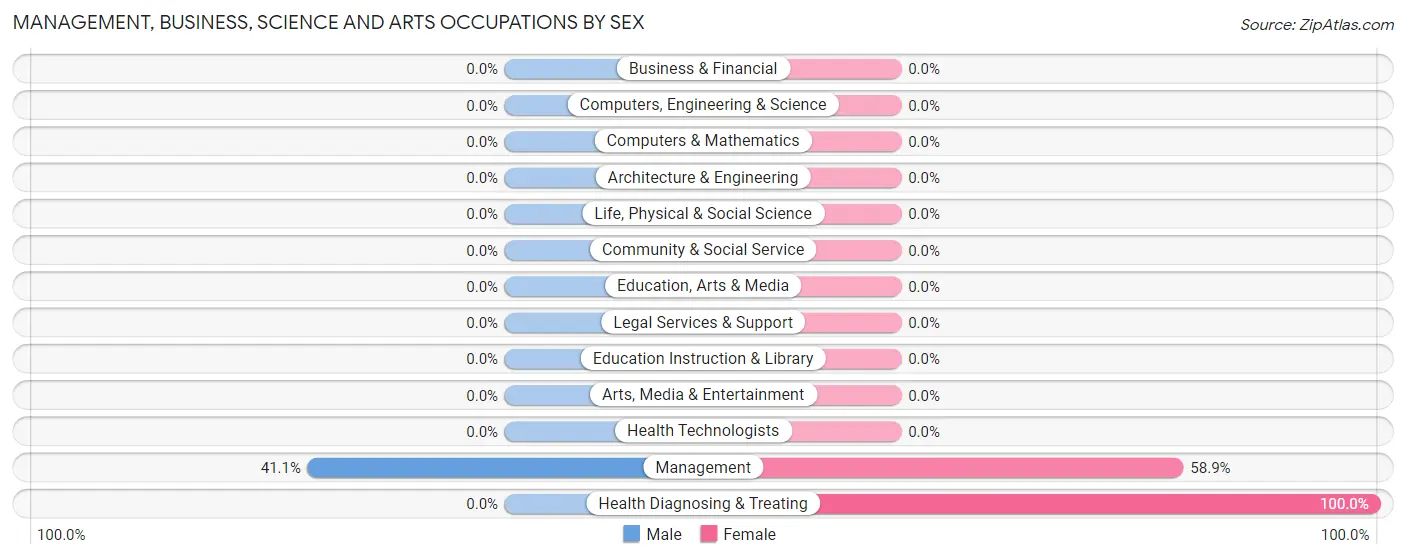
| Occupation | Male | Female |
| Management | 51 (41.1%) | 73 (58.9%) |
| Business & Financial | 0 (0.0%) | 0 (0.0%) |
| Computers, Engineering & Science | 0 (0.0%) | 0 (0.0%) |
| Computers & Mathematics | 0 (0.0%) | 0 (0.0%) |
| Architecture & Engineering | 0 (0.0%) | 0 (0.0%) |
| Life, Physical & Social Science | 0 (0.0%) | 0 (0.0%) |
| Community & Social Service | 0 (0.0%) | 0 (0.0%) |
| Education, Arts & Media | 0 (0.0%) | 0 (0.0%) |
| Legal Services & Support | 0 (0.0%) | 0 (0.0%) |
| Education Instruction & Library | 0 (0.0%) | 0 (0.0%) |
| Arts, Media & Entertainment | 0 (0.0%) | 0 (0.0%) |
| Health Diagnosing & Treating | 0 (0.0%) | 26 (100.0%) |
| Health Technologists | 0 (0.0%) | 0 (0.0%) |
| Total (Category) | 51 (34.0%) | 99 (66.0%) |
| Total (Overall) | 175 (53.5%) | 152 (46.5%) |
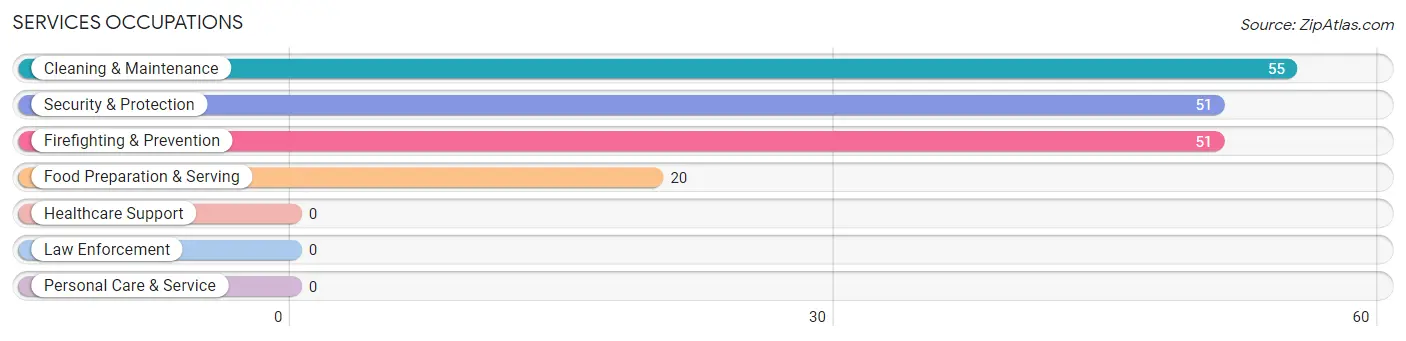
Services Occupations
The most common Services occupations in Congress are Cleaning & Maintenance (55 | 16.8%), Security & Protection (51 | 15.6%), Firefighting & Prevention (51 | 15.6%), and Food Preparation & Serving (20 | 6.1%).
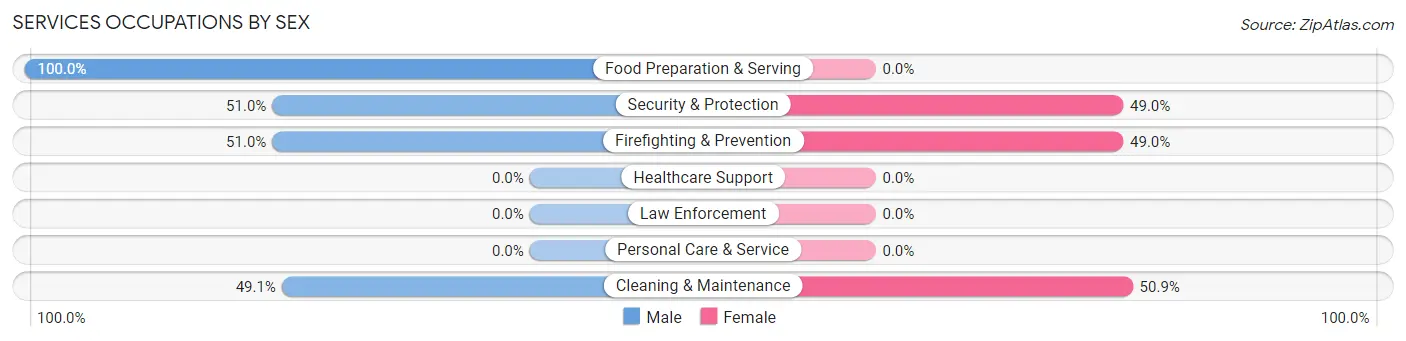
Services Occupations by Sex
Within the Services occupations in Congress, the most male-oriented occupations are Food Preparation & Serving (100.0%), Security & Protection (51.0%), and Firefighting & Prevention (51.0%), while the most female-oriented occupations are Cleaning & Maintenance (50.9%), Security & Protection (49.0%), and Firefighting & Prevention (49.0%).
| Occupation | Male | Female |
| Healthcare Support | 0 (0.0%) | 0 (0.0%) |
| Security & Protection | 26 (51.0%) | 25 (49.0%) |
| Firefighting & Prevention | 26 (51.0%) | 25 (49.0%) |
| Law Enforcement | 0 (0.0%) | 0 (0.0%) |
| Food Preparation & Serving | 20 (100.0%) | 0 (0.0%) |
| Cleaning & Maintenance | 27 (49.1%) | 28 (50.9%) |
| Personal Care & Service | 0 (0.0%) | 0 (0.0%) |
| Total (Category) | 73 (57.9%) | 53 (42.1%) |
| Total (Overall) | 175 (53.5%) | 152 (46.5%) |
Sales and Office Occupations
The most common Sales and Office occupations in Congress are , and Office & Administration (23 | 7.0%).
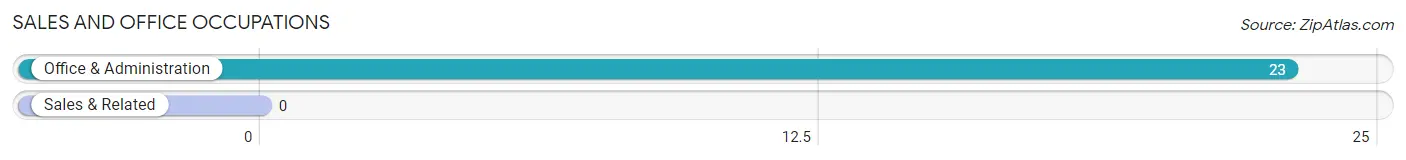
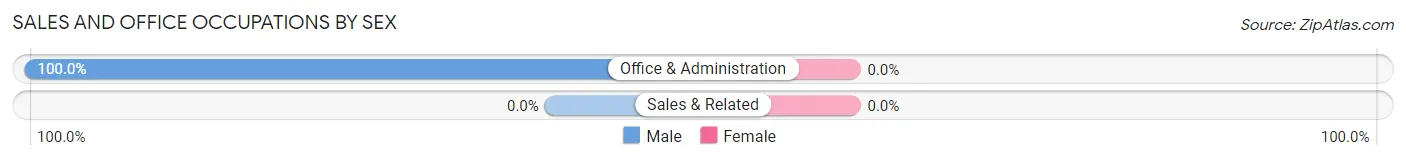
Sales and Office Occupations by Sex
| Occupation | Male | Female |
| Sales & Related | 0 (0.0%) | 0 (0.0%) |
| Office & Administration | 23 (100.0%) | 0 (0.0%) |
| Total (Category) | 23 (100.0%) | 0 (0.0%) |
| Total (Overall) | 175 (53.5%) | 152 (46.5%) |
Natural Resources, Construction and Maintenance Occupations
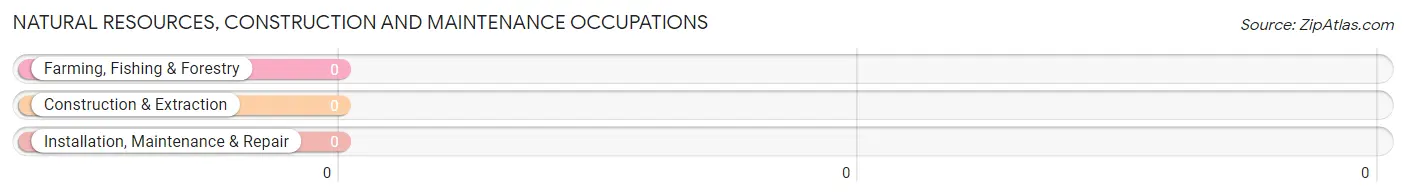
Natural Resources, Construction and Maintenance Occupations by Sex
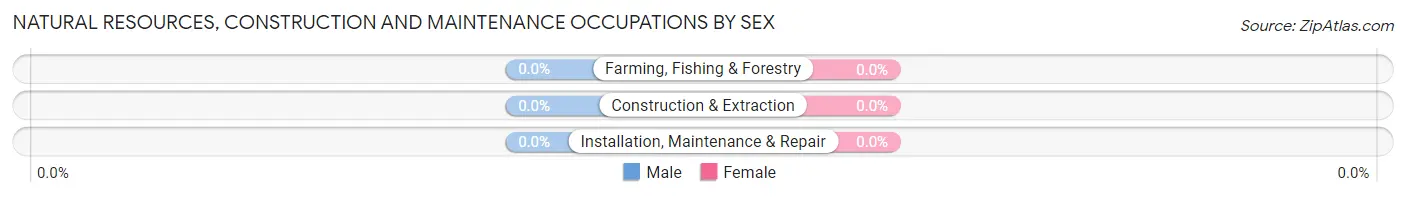
| Occupation | Male | Female |
| Farming, Fishing & Forestry | 0 (0.0%) | 0 (0.0%) |
| Construction & Extraction | 0 (0.0%) | 0 (0.0%) |
| Installation, Maintenance & Repair | 0 (0.0%) | 0 (0.0%) |
| Total (Category) | 0 (0.0%) | 0 (0.0%) |
| Total (Overall) | 175 (53.5%) | 152 (46.5%) |
Production, Transportation and Moving Occupations
The most common Production, Transportation and Moving occupations in Congress are , and Material Moving (28 | 8.6%).
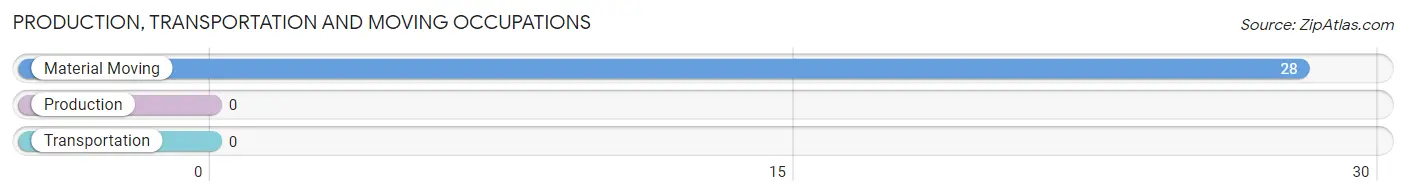
Production, Transportation and Moving Occupations by Sex
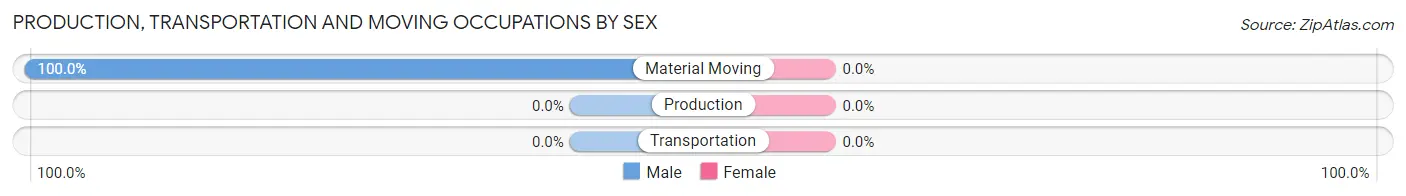
| Occupation | Male | Female |
| Production | 0 (0.0%) | 0 (0.0%) |
| Transportation | 0 (0.0%) | 0 (0.0%) |
| Material Moving | 28 (100.0%) | 0 (0.0%) |
| Total (Category) | 28 (100.0%) | 0 (0.0%) |
| Total (Overall) | 175 (53.5%) | 152 (46.5%) |
Employment Industries by Sex in Congress
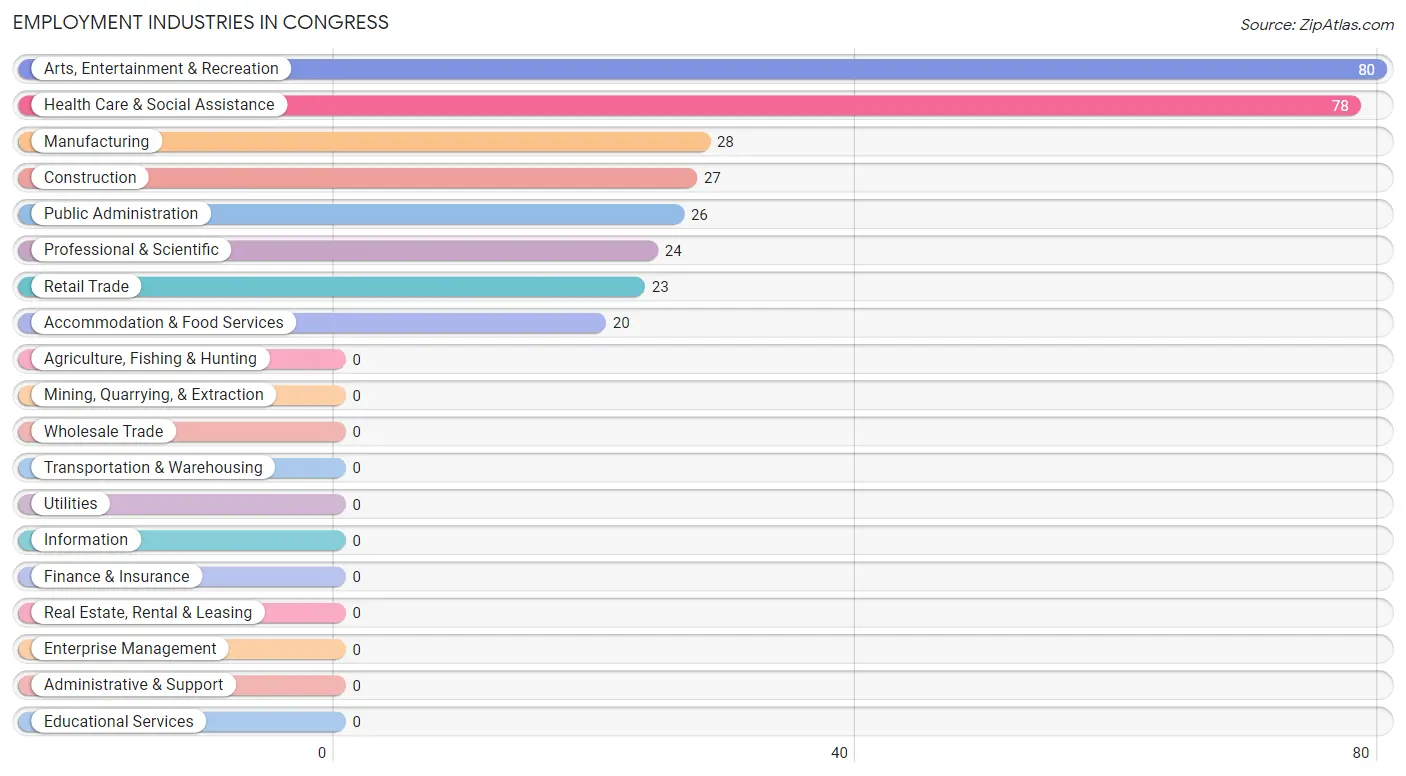
Employment Industries in Congress
The major employment industries in Congress include Arts, Entertainment & Recreation (80 | 24.5%), Health Care & Social Assistance (78 | 23.8%), Manufacturing (28 | 8.6%), Construction (27 | 8.3%), and Public Administration (26 | 8.0%).
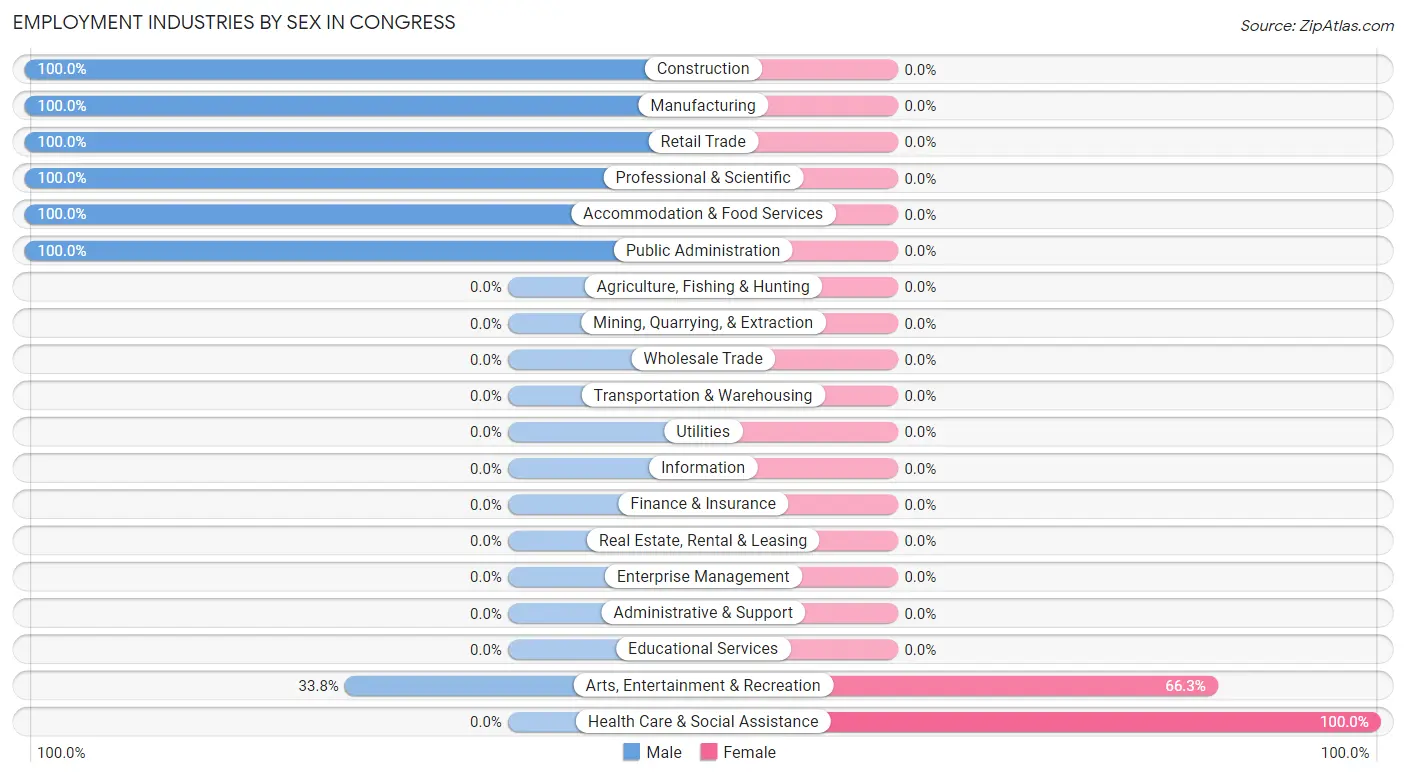
Employment Industries by Sex in Congress
The Congress industries that see more men than women are Construction (100.0%), Manufacturing (100.0%), and Retail Trade (100.0%), whereas the industries that tend to have a higher number of women are Health Care & Social Assistance (100.0%), and Arts, Entertainment & Recreation (66.2%).
| Industry | Male | Female |
| Agriculture, Fishing & Hunting | 0 (0.0%) | 0 (0.0%) |
| Mining, Quarrying, & Extraction | 0 (0.0%) | 0 (0.0%) |
| Construction | 27 (100.0%) | 0 (0.0%) |
| Manufacturing | 28 (100.0%) | 0 (0.0%) |
| Wholesale Trade | 0 (0.0%) | 0 (0.0%) |
| Retail Trade | 23 (100.0%) | 0 (0.0%) |
| Transportation & Warehousing | 0 (0.0%) | 0 (0.0%) |
| Utilities | 0 (0.0%) | 0 (0.0%) |
| Information | 0 (0.0%) | 0 (0.0%) |
| Finance & Insurance | 0 (0.0%) | 0 (0.0%) |
| Real Estate, Rental & Leasing | 0 (0.0%) | 0 (0.0%) |
| Professional & Scientific | 24 (100.0%) | 0 (0.0%) |
| Enterprise Management | 0 (0.0%) | 0 (0.0%) |
| Administrative & Support | 0 (0.0%) | 0 (0.0%) |
| Educational Services | 0 (0.0%) | 0 (0.0%) |
| Health Care & Social Assistance | 0 (0.0%) | 78 (100.0%) |
| Arts, Entertainment & Recreation | 27 (33.8%) | 53 (66.2%) |
| Accommodation & Food Services | 20 (100.0%) | 0 (0.0%) |
| Public Administration | 26 (100.0%) | 0 (0.0%) |
| Total | 175 (53.5%) | 152 (46.5%) |
Education in Congress
School Enrollment in Congress
The most common levels of schooling among the 133 students in Congress are elementary school (74 | 55.6%), middle school (37 | 27.8%), and college / undergraduate (22 | 16.5%).
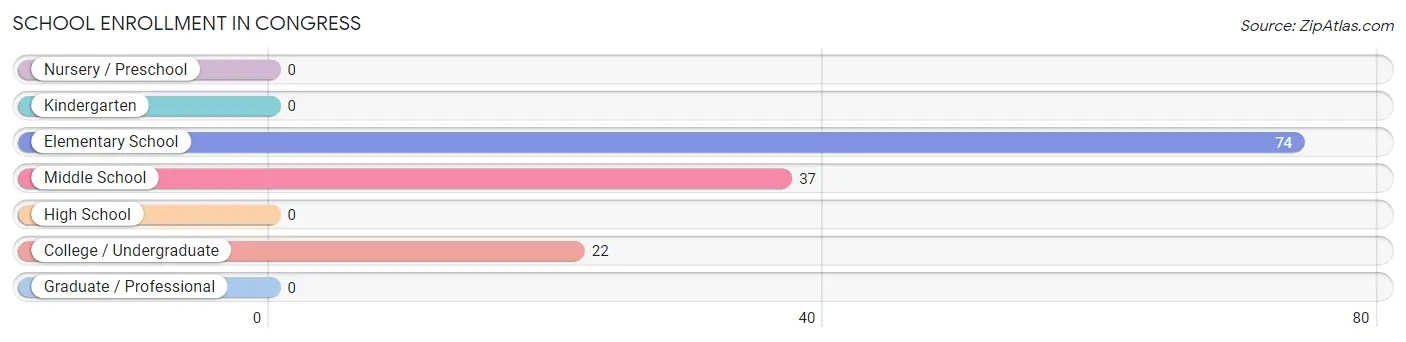
| School Level | # Students | % Students |
| Nursery / Preschool | 0 | 0.0% |
| Kindergarten | 0 | 0.0% |
| Elementary School | 74 | 55.6% |
| Middle School | 37 | 27.8% |
| High School | 0 | 0.0% |
| College / Undergraduate | 22 | 16.5% |
| Graduate / Professional | 0 | 0.0% |
| Total | 133 | 100.0% |
School Enrollment by Age by Funding Source in Congress
Out of a total of 133 students who are enrolled in schools in Congress, 58 (43.6%) attend a private institution, while the remaining 75 (56.4%) are enrolled in public schools. The age group of 35 years and over has the highest likelihood of being enrolled in private schools, with 22 (100.0% in the age bracket) enrolled. Conversely, the age group of 5 to 9 year old has the lowest likelihood of being enrolled in a private school, with 38 (100.0% in the age bracket) attending a public institution.
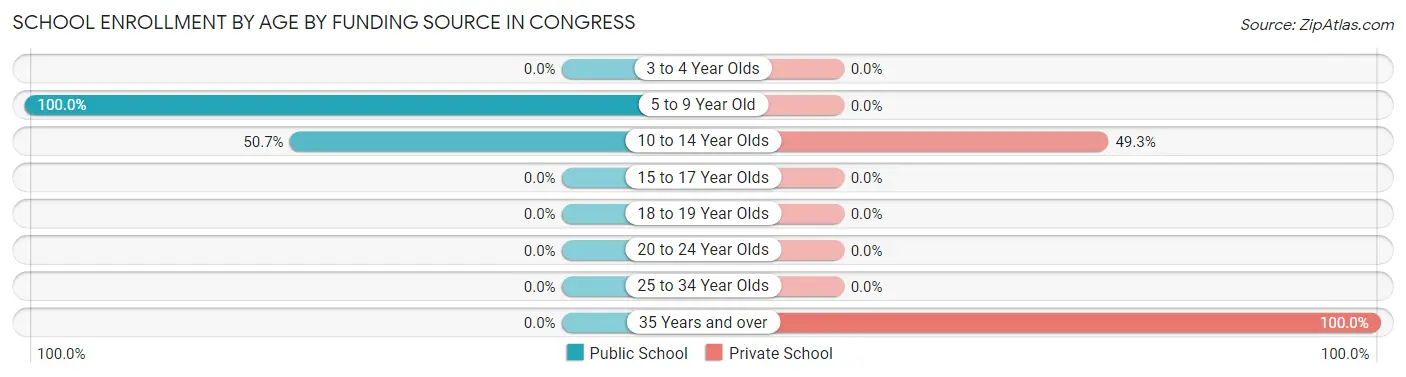
| Age Bracket | Public School | Private School |
| 3 to 4 Year Olds | 0 (0.0%) | 0 (0.0%) |
| 5 to 9 Year Old | 38 (100.0%) | 0 (0.0%) |
| 10 to 14 Year Olds | 37 (50.7%) | 36 (49.3%) |
| 15 to 17 Year Olds | 0 (0.0%) | 0 (0.0%) |
| 18 to 19 Year Olds | 0 (0.0%) | 0 (0.0%) |
| 20 to 24 Year Olds | 0 (0.0%) | 0 (0.0%) |
| 25 to 34 Year Olds | 0 (0.0%) | 0 (0.0%) |
| 35 Years and over | 0 (0.0%) | 22 (100.0%) |
| Total | 75 (56.4%) | 58 (43.6%) |
Educational Attainment by Field of Study in Congress
Liberal arts & history (94 | 37.1%), education (68 | 26.9%), social sciences (33 | 13.0%), engineering (24 | 9.5%), and science & technology (21 | 8.3%) are the most common fields of study among 253 individuals in Congress who have obtained a bachelor's degree or higher.

| Field of Study | # Graduates | % Graduates |
| Computers & Mathematics | 0 | 0.0% |
| Bio, Nature & Agricultural | 13 | 5.1% |
| Physical & Health Sciences | 0 | 0.0% |
| Psychology | 0 | 0.0% |
| Social Sciences | 33 | 13.0% |
| Engineering | 24 | 9.5% |
| Multidisciplinary Studies | 0 | 0.0% |
| Science & Technology | 21 | 8.3% |
| Business | 0 | 0.0% |
| Education | 68 | 26.9% |
| Literature & Languages | 0 | 0.0% |
| Liberal Arts & History | 94 | 37.1% |
| Visual & Performing Arts | 0 | 0.0% |
| Communications | 0 | 0.0% |
| Arts & Humanities | 0 | 0.0% |
| Total | 253 | 100.0% |
Transportation & Commute in Congress
Vehicle Availability by Sex in Congress
The most prevalent vehicle ownership categories in Congress are males with 3 vehicles (96, accounting for 54.9%) and females with 3 vehicles (80, making up 63.2%).
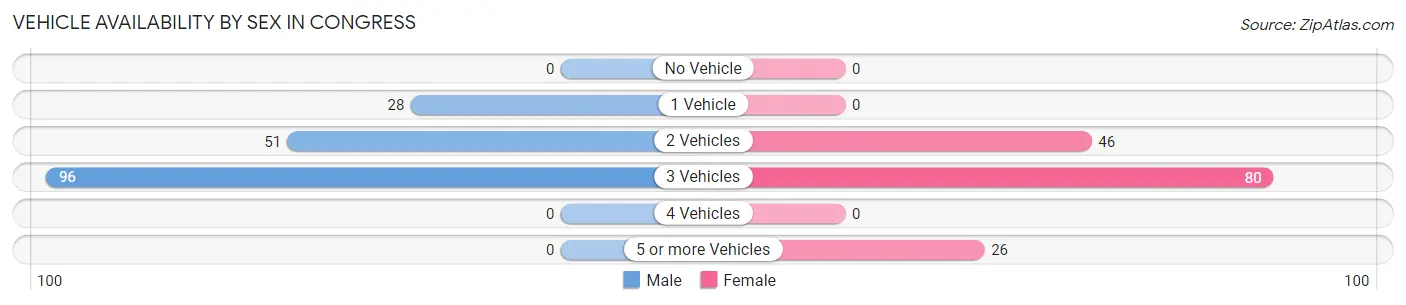
| Vehicles Available | Male | Female |
| No Vehicle | 0 (0.0%) | 0 (0.0%) |
| 1 Vehicle | 28 (16.0%) | 0 (0.0%) |
| 2 Vehicles | 51 (29.1%) | 46 (30.3%) |
| 3 Vehicles | 96 (54.9%) | 80 (52.6%) |
| 4 Vehicles | 0 (0.0%) | 0 (0.0%) |
| 5 or more Vehicles | 0 (0.0%) | 26 (17.1%) |
| Total | 175 (100.0%) | 152 (100.0%) |
Commute Time in Congress
The most frequently occuring commute durations in Congress are 25 to 29 minutes (55 commuters, 18.1%), 30 to 34 minutes (52 commuters, 17.2%), and 20 to 24 minutes (46 commuters, 15.2%).
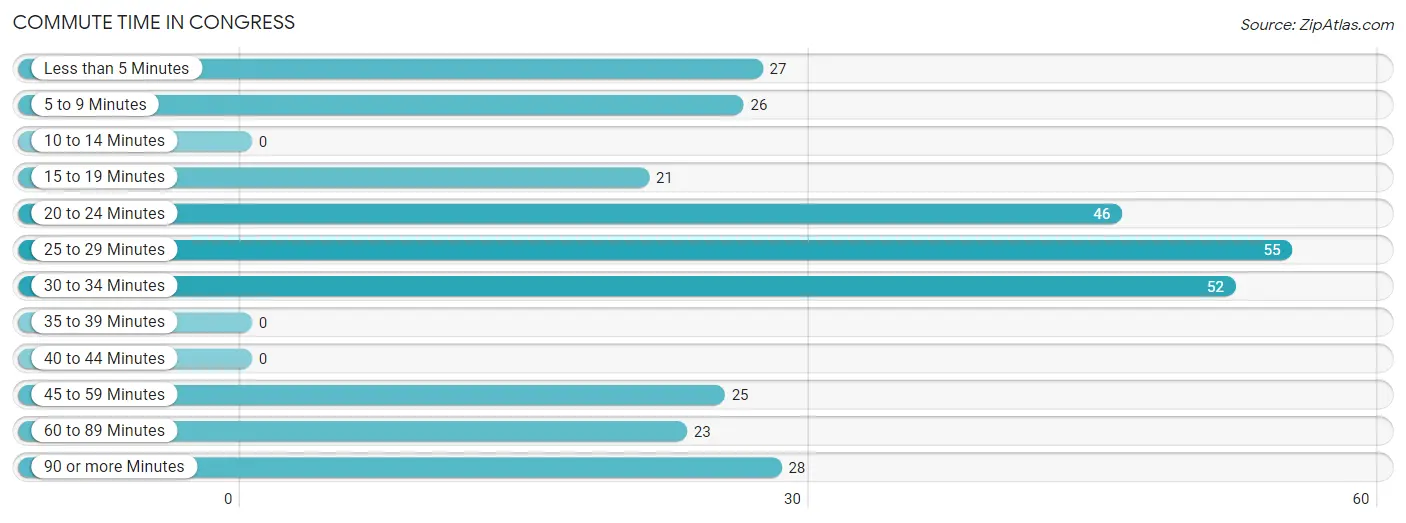
| Commute Time | # Commuters | % Commuters |
| Less than 5 Minutes | 27 | 8.9% |
| 5 to 9 Minutes | 26 | 8.6% |
| 10 to 14 Minutes | 0 | 0.0% |
| 15 to 19 Minutes | 21 | 6.9% |
| 20 to 24 Minutes | 46 | 15.2% |
| 25 to 29 Minutes | 55 | 18.1% |
| 30 to 34 Minutes | 52 | 17.2% |
| 35 to 39 Minutes | 0 | 0.0% |
| 40 to 44 Minutes | 0 | 0.0% |
| 45 to 59 Minutes | 25 | 8.3% |
| 60 to 89 Minutes | 23 | 7.6% |
| 90 or more Minutes | 28 | 9.2% |
Commute Time by Sex in Congress
The most common commute times in Congress are 90 or more minutes (28 commuters, 18.5%) for males and 30 to 34 minutes (52 commuters, 34.2%) for females.
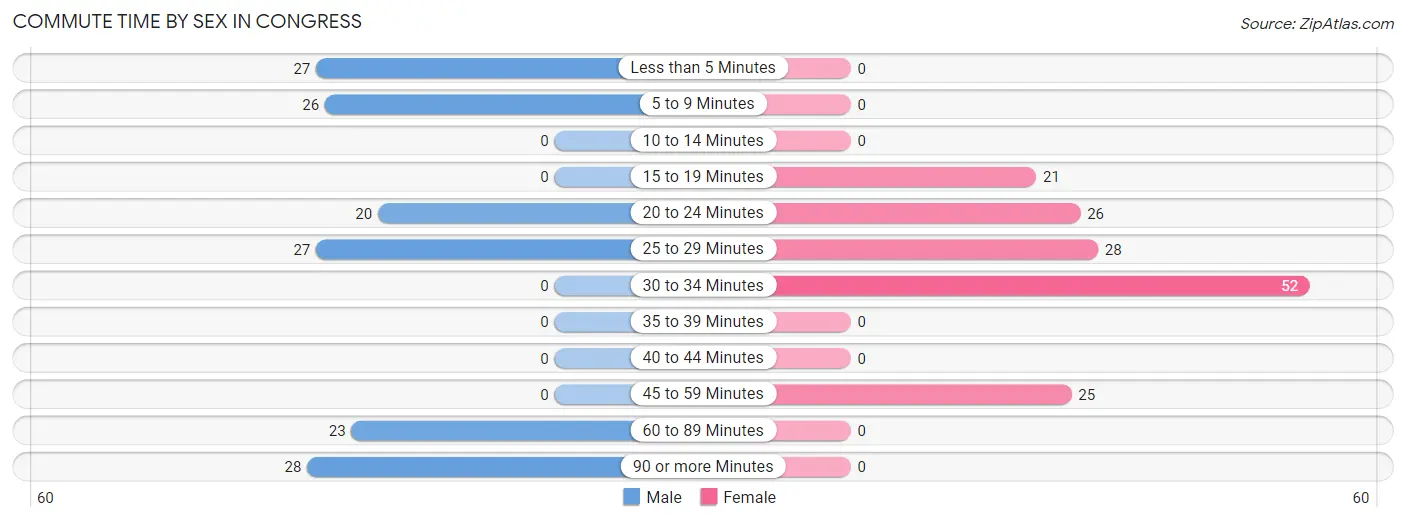
| Commute Time | Male | Female |
| Less than 5 Minutes | 27 (17.9%) | 0 (0.0%) |
| 5 to 9 Minutes | 26 (17.2%) | 0 (0.0%) |
| 10 to 14 Minutes | 0 (0.0%) | 0 (0.0%) |
| 15 to 19 Minutes | 0 (0.0%) | 21 (13.8%) |
| 20 to 24 Minutes | 20 (13.3%) | 26 (17.1%) |
| 25 to 29 Minutes | 27 (17.9%) | 28 (18.4%) |
| 30 to 34 Minutes | 0 (0.0%) | 52 (34.2%) |
| 35 to 39 Minutes | 0 (0.0%) | 0 (0.0%) |
| 40 to 44 Minutes | 0 (0.0%) | 0 (0.0%) |
| 45 to 59 Minutes | 0 (0.0%) | 25 (16.5%) |
| 60 to 89 Minutes | 23 (15.2%) | 0 (0.0%) |
| 90 or more Minutes | 28 (18.5%) | 0 (0.0%) |
Time of Departure to Work by Sex in Congress
The most frequent times of departure to work in Congress are 12:00 AM to 4:59 AM (51, 33.8%) for males and 6:30 AM to 6:59 AM (78, 51.3%) for females.
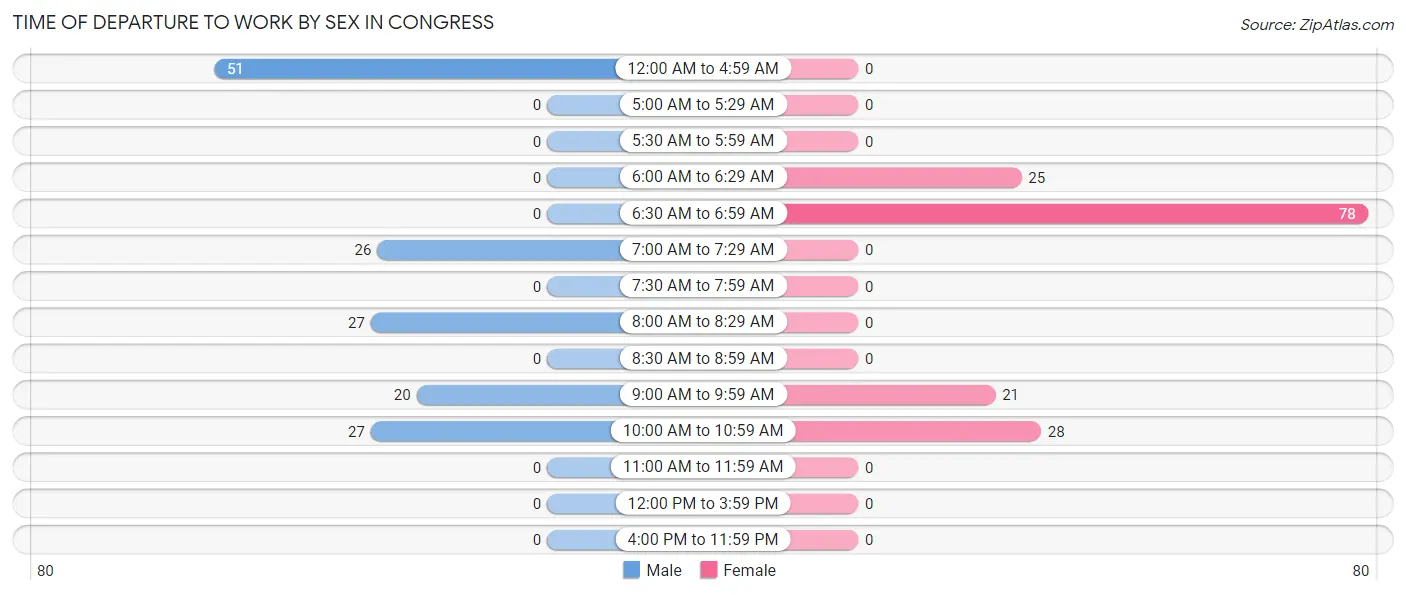
| Time of Departure | Male | Female |
| 12:00 AM to 4:59 AM | 51 (33.8%) | 0 (0.0%) |
| 5:00 AM to 5:29 AM | 0 (0.0%) | 0 (0.0%) |
| 5:30 AM to 5:59 AM | 0 (0.0%) | 0 (0.0%) |
| 6:00 AM to 6:29 AM | 0 (0.0%) | 25 (16.5%) |
| 6:30 AM to 6:59 AM | 0 (0.0%) | 78 (51.3%) |
| 7:00 AM to 7:29 AM | 26 (17.2%) | 0 (0.0%) |
| 7:30 AM to 7:59 AM | 0 (0.0%) | 0 (0.0%) |
| 8:00 AM to 8:29 AM | 27 (17.9%) | 0 (0.0%) |
| 8:30 AM to 8:59 AM | 0 (0.0%) | 0 (0.0%) |
| 9:00 AM to 9:59 AM | 20 (13.3%) | 21 (13.8%) |
| 10:00 AM to 10:59 AM | 27 (17.9%) | 28 (18.4%) |
| 11:00 AM to 11:59 AM | 0 (0.0%) | 0 (0.0%) |
| 12:00 PM to 3:59 PM | 0 (0.0%) | 0 (0.0%) |
| 4:00 PM to 11:59 PM | 0 (0.0%) | 0 (0.0%) |
| Total | 151 (100.0%) | 152 (100.0%) |
Housing Occupancy in Congress
Occupancy by Ownership in Congress
Of the total 734 dwellings in Congress, owner-occupied units account for 656 (89.4%), while renter-occupied units make up 78 (10.6%).
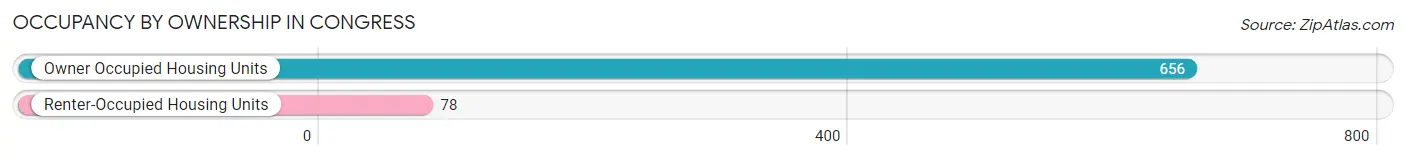
| Occupancy | # Housing Units | % Housing Units |
| Owner Occupied Housing Units | 656 | 89.4% |
| Renter-Occupied Housing Units | 78 | 10.6% |
| Total Occupied Housing Units | 734 | 100.0% |
Occupancy by Household Size in Congress
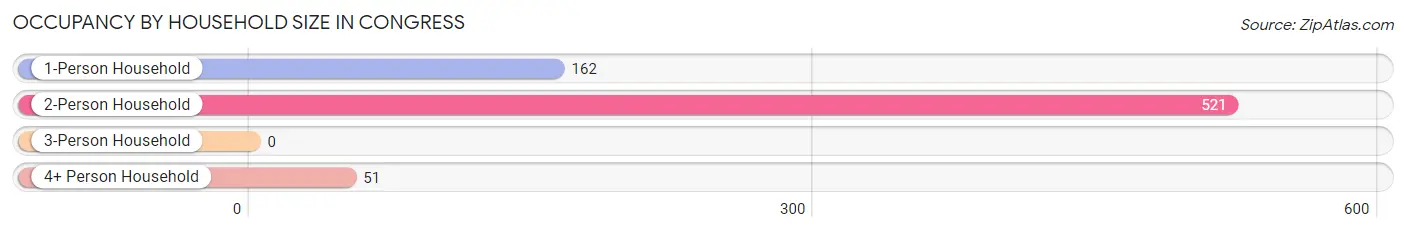
| Household Size | # Housing Units | % Housing Units |
| 1-Person Household | 162 | 22.1% |
| 2-Person Household | 521 | 71.0% |
| 3-Person Household | 0 | 0.0% |
| 4+ Person Household | 51 | 7.0% |
| Total Housing Units | 734 | 100.0% |
Occupancy by Ownership by Household Size in Congress
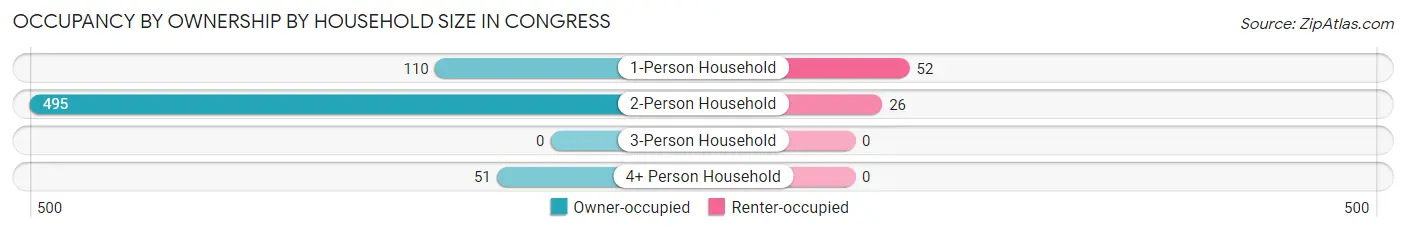
| Household Size | Owner-occupied | Renter-occupied |
| 1-Person Household | 110 (67.9%) | 52 (32.1%) |
| 2-Person Household | 495 (95.0%) | 26 (5.0%) |
| 3-Person Household | 0 (0.0%) | 0 (0.0%) |
| 4+ Person Household | 51 (100.0%) | 0 (0.0%) |
| Total Housing Units | 656 (89.4%) | 78 (10.6%) |
Occupancy by Educational Attainment in Congress
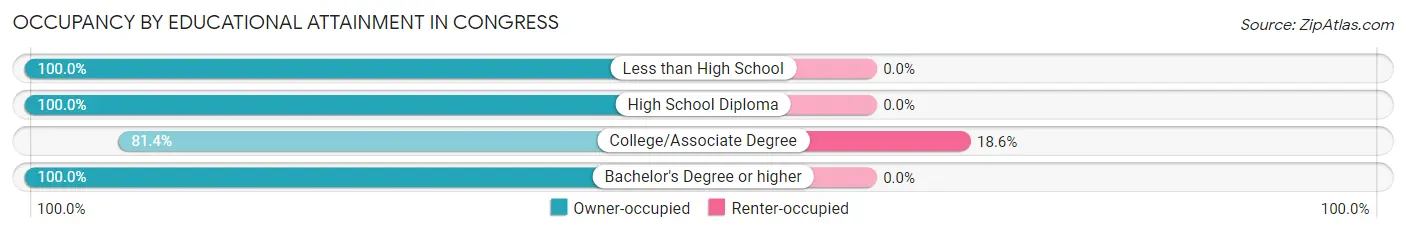
| Household Size | Owner-occupied | Renter-occupied |
| Less than High School | 85 (100.0%) | 0 (0.0%) |
| High School Diploma | 89 (100.0%) | 0 (0.0%) |
| College/Associate Degree | 341 (81.4%) | 78 (18.6%) |
| Bachelor's Degree or higher | 141 (100.0%) | 0 (0.0%) |
Occupancy by Age of Householder in Congress
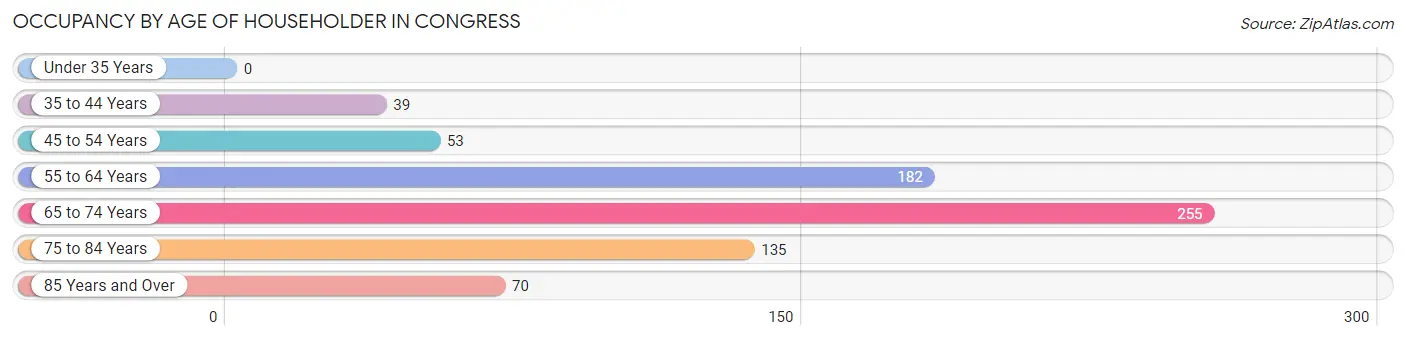
| Age Bracket | # Households | % Households |
| Under 35 Years | 0 | 0.0% |
| 35 to 44 Years | 39 | 5.3% |
| 45 to 54 Years | 53 | 7.2% |
| 55 to 64 Years | 182 | 24.8% |
| 65 to 74 Years | 255 | 34.7% |
| 75 to 84 Years | 135 | 18.4% |
| 85 Years and Over | 70 | 9.5% |
| Total | 734 | 100.0% |
Housing Finances in Congress
Median Income by Occupancy in Congress
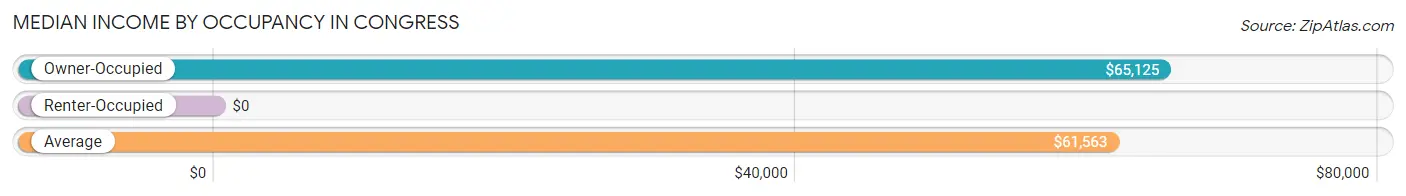
| Occupancy Type | # Households | Median Income |
| Owner-Occupied | 656 (89.4%) | $65,125 |
| Renter-Occupied | 78 (10.6%) | $0 |
| Average | 734 (100.0%) | $61,563 |
Occupancy by Householder Income Bracket in Congress
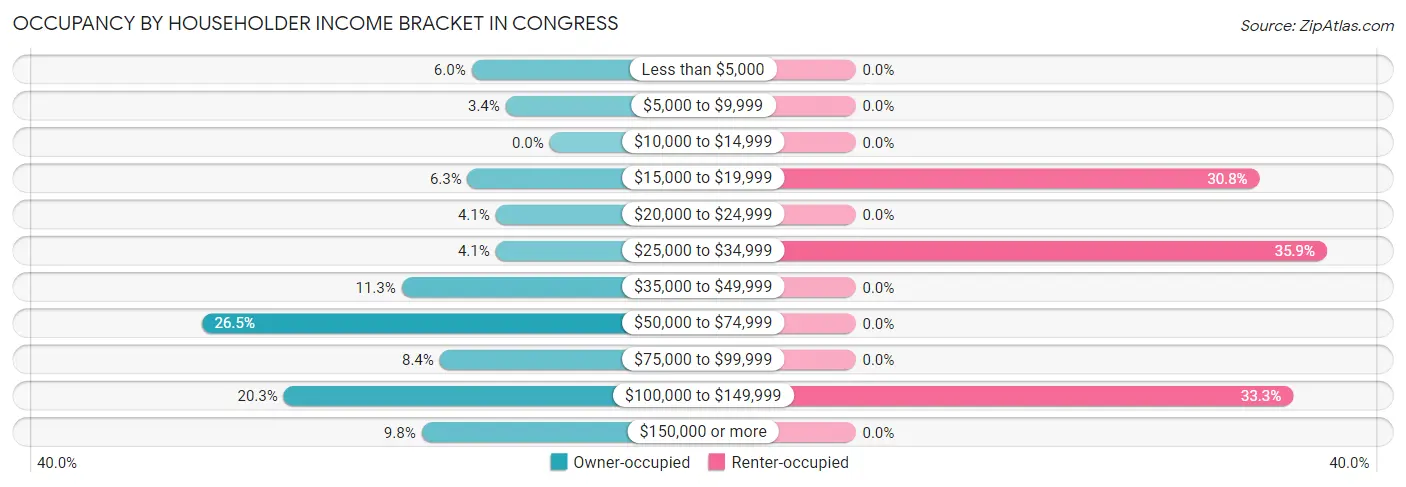
| Income Bracket | Owner-occupied | Renter-occupied |
| Less than $5,000 | 39 (5.9%) | 0 (0.0%) |
| $5,000 to $9,999 | 22 (3.4%) | 0 (0.0%) |
| $10,000 to $14,999 | 0 (0.0%) | 0 (0.0%) |
| $15,000 to $19,999 | 41 (6.2%) | 24 (30.8%) |
| $20,000 to $24,999 | 27 (4.1%) | 0 (0.0%) |
| $25,000 to $34,999 | 27 (4.1%) | 28 (35.9%) |
| $35,000 to $49,999 | 74 (11.3%) | 0 (0.0%) |
| $50,000 to $74,999 | 174 (26.5%) | 0 (0.0%) |
| $75,000 to $99,999 | 55 (8.4%) | 0 (0.0%) |
| $100,000 to $149,999 | 133 (20.3%) | 26 (33.3%) |
| $150,000 or more | 64 (9.8%) | 0 (0.0%) |
| Total | 656 (100.0%) | 78 (100.0%) |
Monthly Housing Cost Tiers in Congress
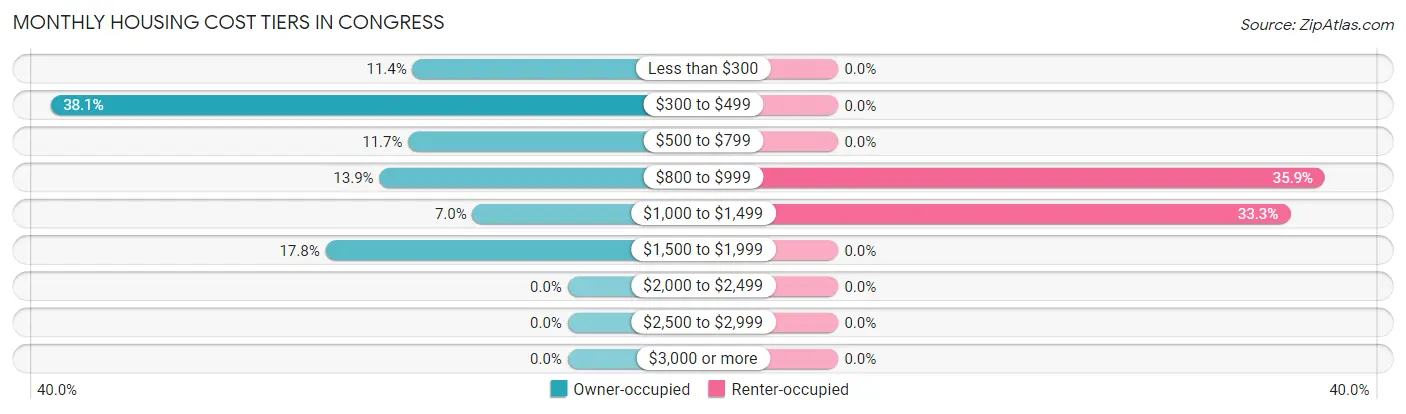
| Monthly Cost | Owner-occupied | Renter-occupied |
| Less than $300 | 75 (11.4%) | 0 (0.0%) |
| $300 to $499 | 250 (38.1%) | 0 (0.0%) |
| $500 to $799 | 77 (11.7%) | 0 (0.0%) |
| $800 to $999 | 91 (13.9%) | 28 (35.9%) |
| $1,000 to $1,499 | 46 (7.0%) | 26 (33.3%) |
| $1,500 to $1,999 | 117 (17.8%) | 0 (0.0%) |
| $2,000 to $2,499 | 0 (0.0%) | 0 (0.0%) |
| $2,500 to $2,999 | 0 (0.0%) | 0 (0.0%) |
| $3,000 or more | 0 (0.0%) | 0 (0.0%) |
| Total | 656 (100.0%) | 78 (100.0%) |
Physical Housing Characteristics in Congress
Housing Structures in Congress
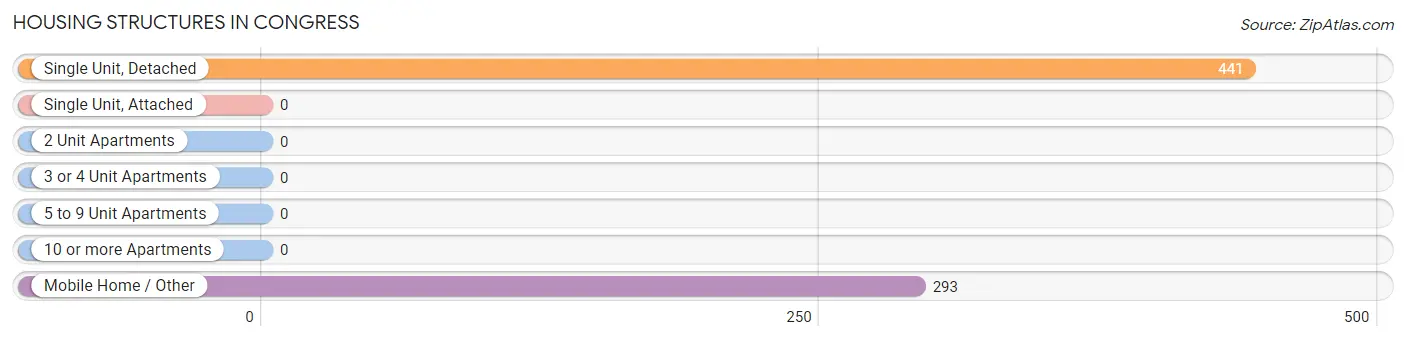
| Structure Type | # Housing Units | % Housing Units |
| Single Unit, Detached | 441 | 60.1% |
| Single Unit, Attached | 0 | 0.0% |
| 2 Unit Apartments | 0 | 0.0% |
| 3 or 4 Unit Apartments | 0 | 0.0% |
| 5 to 9 Unit Apartments | 0 | 0.0% |
| 10 or more Apartments | 0 | 0.0% |
| Mobile Home / Other | 293 | 39.9% |
| Total | 734 | 100.0% |
Housing Structures by Occupancy in Congress
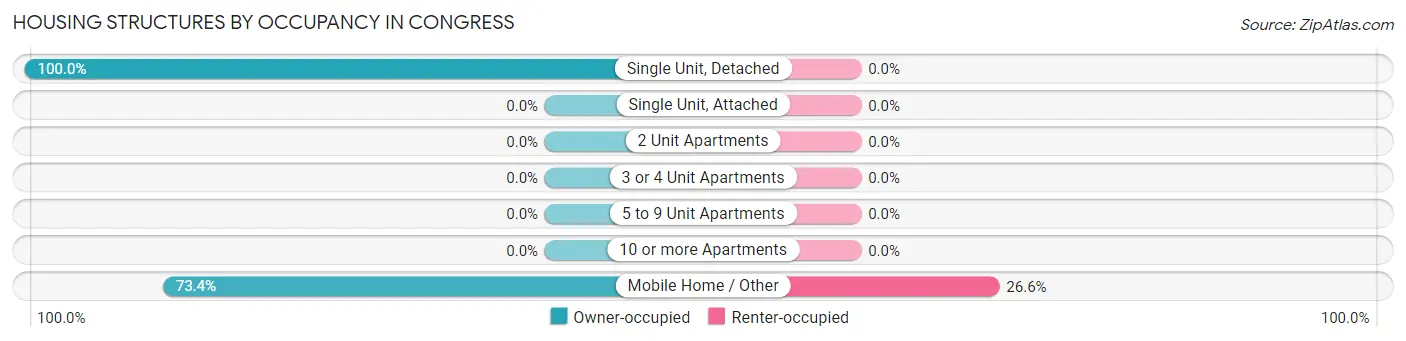
| Structure Type | Owner-occupied | Renter-occupied |
| Single Unit, Detached | 441 (100.0%) | 0 (0.0%) |
| Single Unit, Attached | 0 (0.0%) | 0 (0.0%) |
| 2 Unit Apartments | 0 (0.0%) | 0 (0.0%) |
| 3 or 4 Unit Apartments | 0 (0.0%) | 0 (0.0%) |
| 5 to 9 Unit Apartments | 0 (0.0%) | 0 (0.0%) |
| 10 or more Apartments | 0 (0.0%) | 0 (0.0%) |
| Mobile Home / Other | 215 (73.4%) | 78 (26.6%) |
| Total | 656 (89.4%) | 78 (10.6%) |
Housing Structures by Number of Rooms in Congress
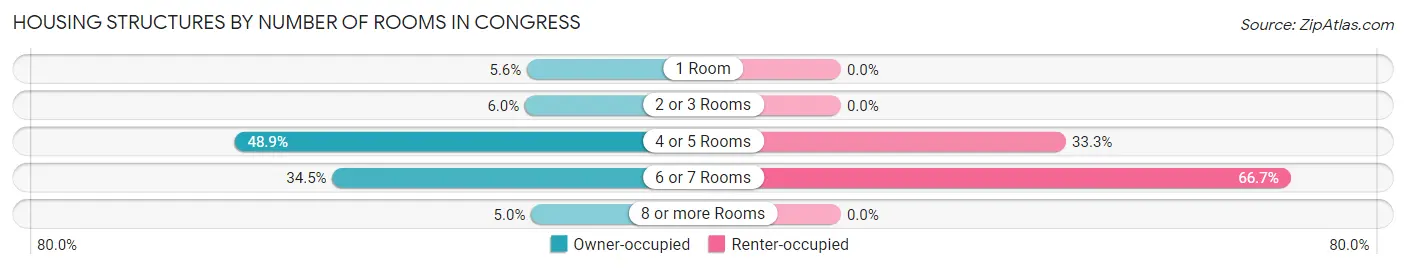
| Number of Rooms | Owner-occupied | Renter-occupied |
| 1 Room | 37 (5.6%) | 0 (0.0%) |
| 2 or 3 Rooms | 39 (5.9%) | 0 (0.0%) |
| 4 or 5 Rooms | 321 (48.9%) | 26 (33.3%) |
| 6 or 7 Rooms | 226 (34.4%) | 52 (66.7%) |
| 8 or more Rooms | 33 (5.0%) | 0 (0.0%) |
| Total | 656 (100.0%) | 78 (100.0%) |
Housing Structure by Heating Type in Congress
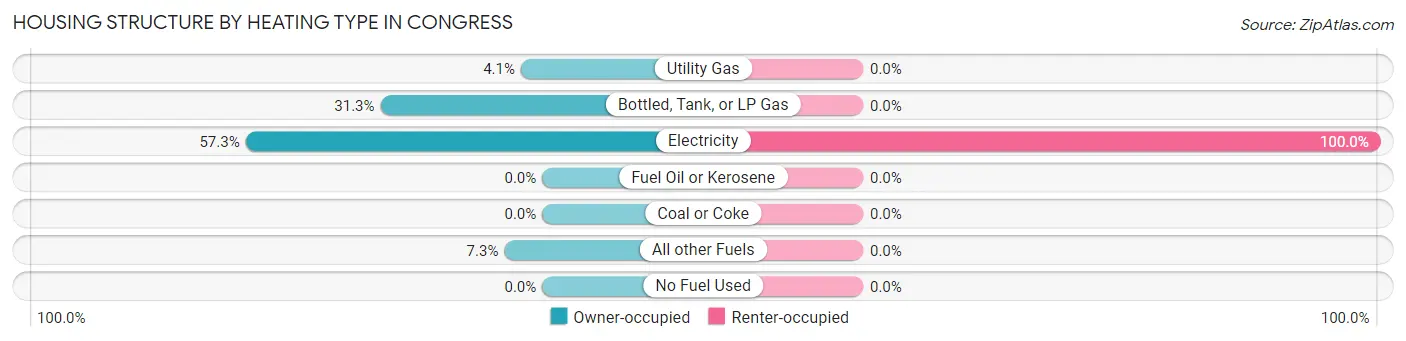
| Heating Type | Owner-occupied | Renter-occupied |
| Utility Gas | 27 (4.1%) | 0 (0.0%) |
| Bottled, Tank, or LP Gas | 205 (31.2%) | 0 (0.0%) |
| Electricity | 376 (57.3%) | 78 (100.0%) |
| Fuel Oil or Kerosene | 0 (0.0%) | 0 (0.0%) |
| Coal or Coke | 0 (0.0%) | 0 (0.0%) |
| All other Fuels | 48 (7.3%) | 0 (0.0%) |
| No Fuel Used | 0 (0.0%) | 0 (0.0%) |
| Total | 656 (100.0%) | 78 (100.0%) |
Household Vehicle Usage in Congress
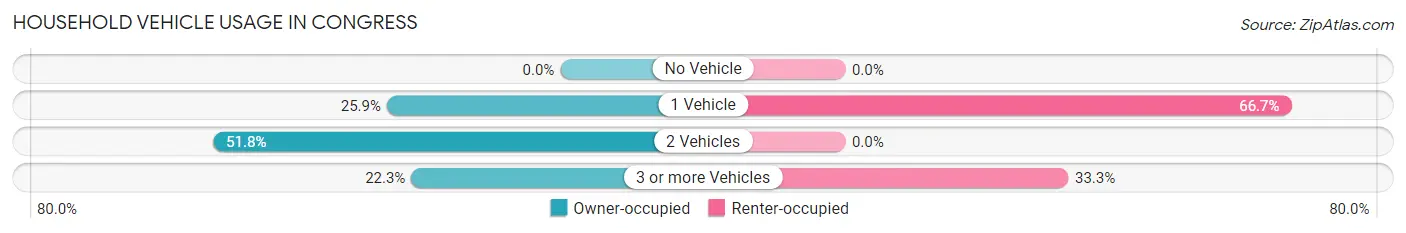
| Vehicles per Household | Owner-occupied | Renter-occupied |
| No Vehicle | 0 (0.0%) | 0 (0.0%) |
| 1 Vehicle | 170 (25.9%) | 52 (66.7%) |
| 2 Vehicles | 340 (51.8%) | 0 (0.0%) |
| 3 or more Vehicles | 146 (22.3%) | 26 (33.3%) |
| Total | 656 (100.0%) | 78 (100.0%) |
Real Estate & Mortgages in Congress
Real Estate and Mortgage Overview in Congress
| Characteristic | Without Mortgage | With Mortgage |
| Housing Units | 451 | 205 |
| Median Property Value | $241,000 | $166,700 |
| Median Household Income | $65,203 | $0 |
| Monthly Housing Costs | $439 | $0 |
| Real Estate Taxes | $1,715 | $0 |
Property Value by Mortgage Status in Congress
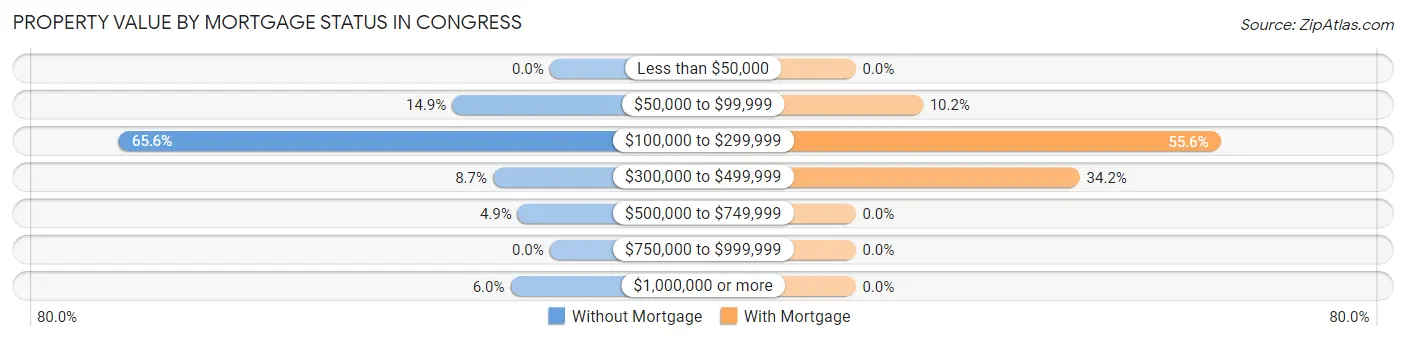
| Property Value | Without Mortgage | With Mortgage |
| Less than $50,000 | 0 (0.0%) | 0 (0.0%) |
| $50,000 to $99,999 | 67 (14.9%) | 21 (10.2%) |
| $100,000 to $299,999 | 296 (65.6%) | 114 (55.6%) |
| $300,000 to $499,999 | 39 (8.6%) | 70 (34.2%) |
| $500,000 to $749,999 | 22 (4.9%) | 0 (0.0%) |
| $750,000 to $999,999 | 0 (0.0%) | 0 (0.0%) |
| $1,000,000 or more | 27 (6.0%) | 0 (0.0%) |
| Total | 451 (100.0%) | 205 (100.0%) |
Household Income by Mortgage Status in Congress
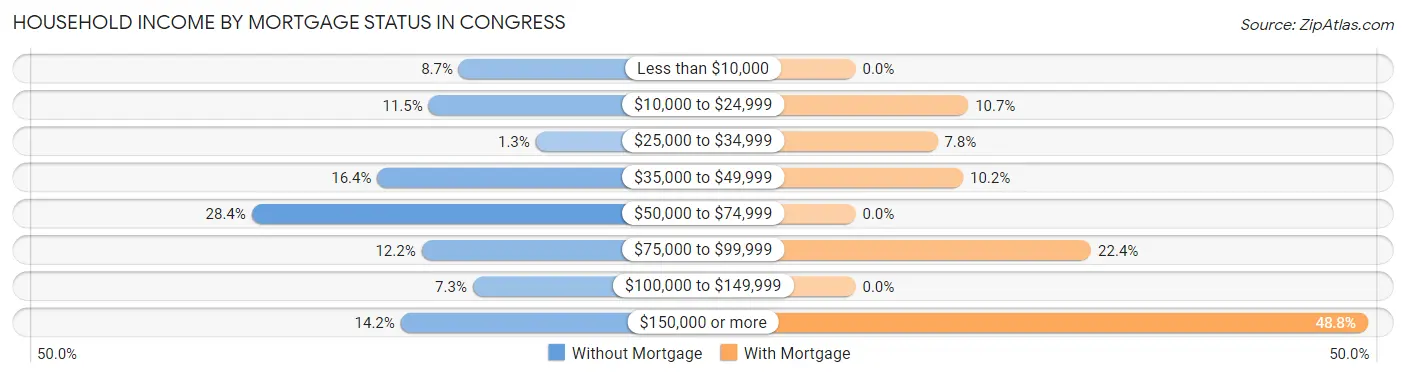
| Household Income | Without Mortgage | With Mortgage |
| Less than $10,000 | 39 (8.6%) | 0 (0.0%) |
| $10,000 to $24,999 | 52 (11.5%) | 22 (10.7%) |
| $25,000 to $34,999 | 6 (1.3%) | 16 (7.8%) |
| $35,000 to $49,999 | 74 (16.4%) | 21 (10.2%) |
| $50,000 to $74,999 | 128 (28.4%) | 0 (0.0%) |
| $75,000 to $99,999 | 55 (12.2%) | 46 (22.4%) |
| $100,000 to $149,999 | 33 (7.3%) | 0 (0.0%) |
| $150,000 or more | 64 (14.2%) | 100 (48.8%) |
| Total | 451 (100.0%) | 205 (100.0%) |
Property Value to Household Income Ratio in Congress
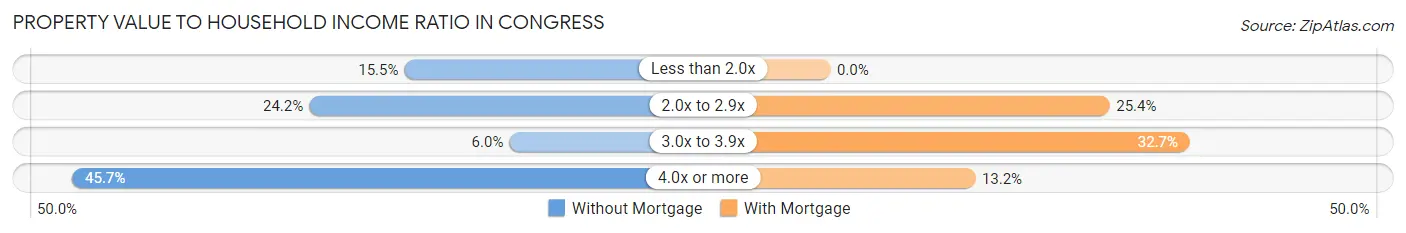
| Value-to-Income Ratio | Without Mortgage | With Mortgage |
| Less than 2.0x | 70 (15.5%) | 0 (0.0%) |
| 2.0x to 2.9x | 109 (24.2%) | 52 (25.4%) |
| 3.0x to 3.9x | 27 (6.0%) | 67 (32.7%) |
| 4.0x or more | 206 (45.7%) | 27 (13.2%) |
| Total | 451 (100.0%) | 205 (100.0%) |
Real Estate Taxes by Mortgage Status in Congress
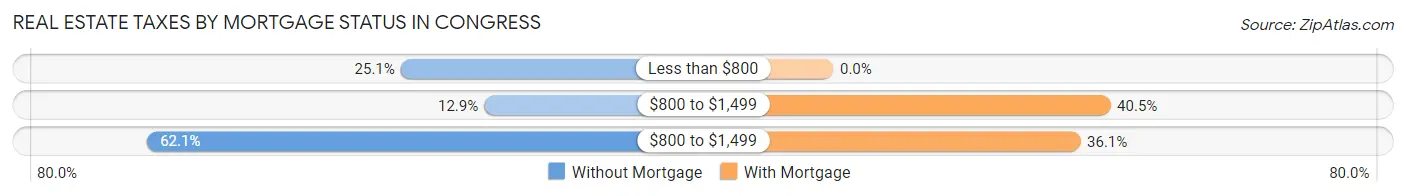
| Property Taxes | Without Mortgage | With Mortgage |
| Less than $800 | 113 (25.1%) | 0 (0.0%) |
| $800 to $1,499 | 58 (12.9%) | 83 (40.5%) |
| $800 to $1,499 | 280 (62.1%) | 74 (36.1%) |
| Total | 451 (100.0%) | 205 (100.0%) |
Health & Disability in Congress
Health Insurance Coverage by Age in Congress
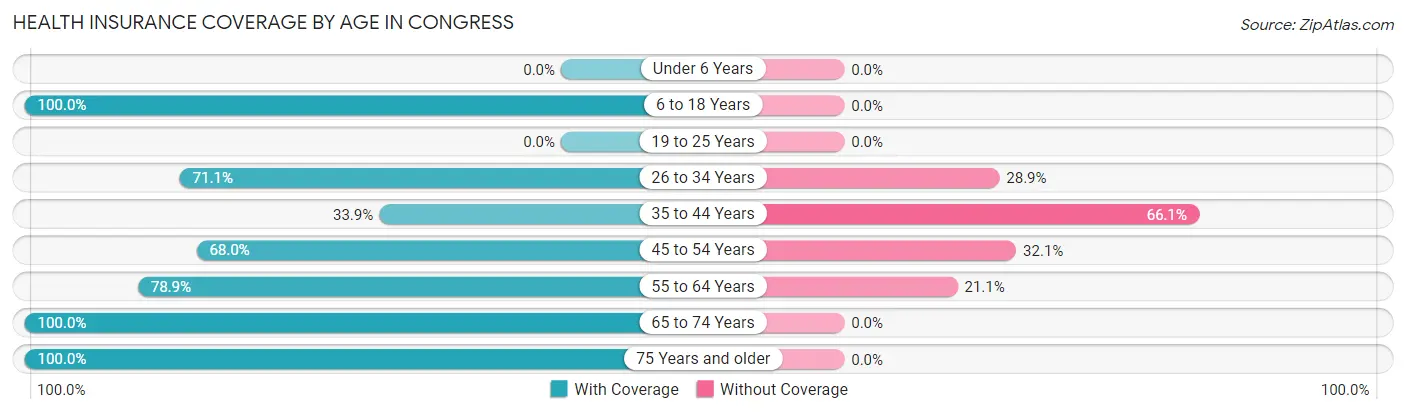
| Age Bracket | With Coverage | Without Coverage |
| Under 6 Years | 0 (0.0%) | 0 (0.0%) |
| 6 to 18 Years | 111 (100.0%) | 0 (0.0%) |
| 19 to 25 Years | 0 (0.0%) | 0 (0.0%) |
| 26 to 34 Years | 59 (71.1%) | 24 (28.9%) |
| 35 to 44 Years | 20 (33.9%) | 39 (66.1%) |
| 45 to 54 Years | 53 (67.9%) | 25 (32.1%) |
| 55 to 64 Years | 183 (78.9%) | 49 (21.1%) |
| 65 to 74 Years | 541 (100.0%) | 0 (0.0%) |
| 75 Years and older | 408 (100.0%) | 0 (0.0%) |
| Total | 1,375 (90.9%) | 137 (9.1%) |
Health Insurance Coverage by Citizenship Status in Congress
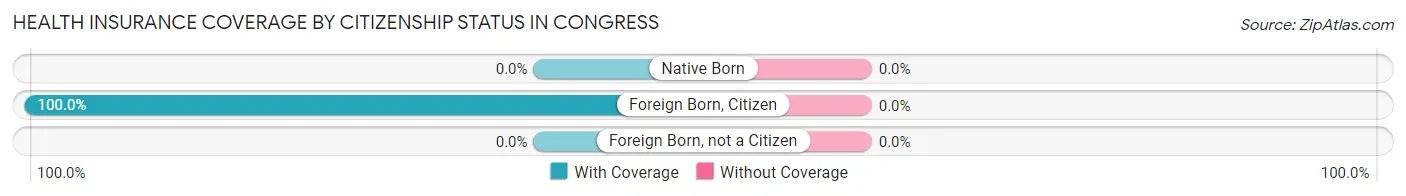
| Citizenship Status | With Coverage | Without Coverage |
| Native Born | 0 (0.0%) | 0 (0.0%) |
| Foreign Born, Citizen | 111 (100.0%) | 0 (0.0%) |
| Foreign Born, not a Citizen | 0 (0.0%) | 0 (0.0%) |
Health Insurance Coverage by Household Income in Congress
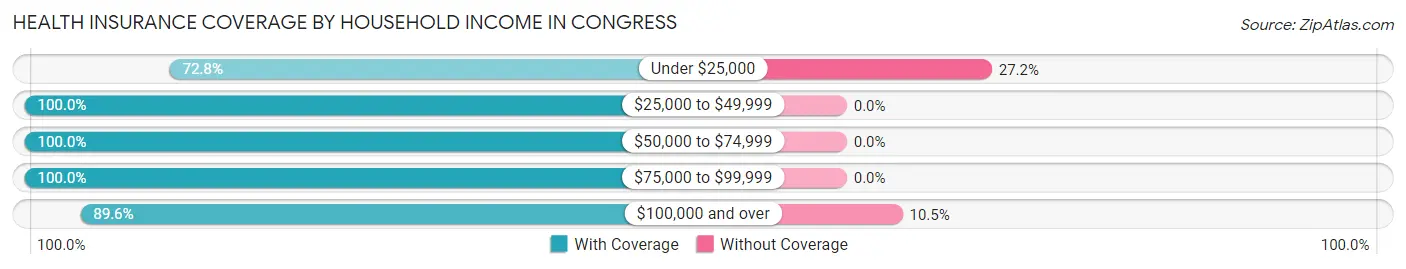
| Household Income | With Coverage | Without Coverage |
| Under $25,000 | 236 (72.8%) | 88 (27.2%) |
| $25,000 to $49,999 | 230 (100.0%) | 0 (0.0%) |
| $50,000 to $74,999 | 329 (100.0%) | 0 (0.0%) |
| $75,000 to $99,999 | 160 (100.0%) | 0 (0.0%) |
| $100,000 and over | 420 (89.5%) | 49 (10.4%) |
Public vs Private Health Insurance Coverage by Age in Congress
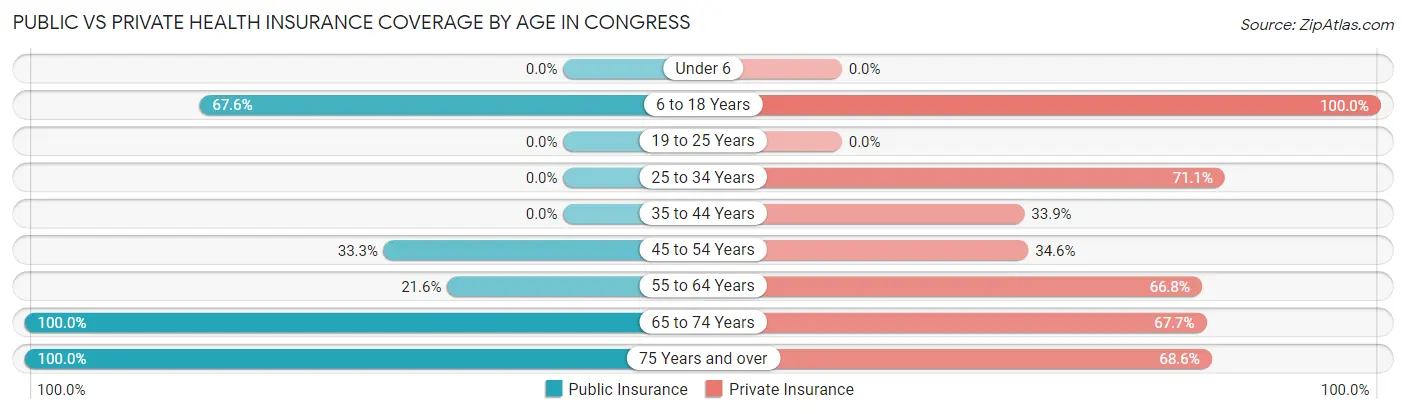
| Age Bracket | Public Insurance | Private Insurance |
| Under 6 | 0 (0.0%) | 0 (0.0%) |
| 6 to 18 Years | 75 (67.6%) | 111 (100.0%) |
| 19 to 25 Years | 0 (0.0%) | 0 (0.0%) |
| 25 to 34 Years | 0 (0.0%) | 59 (71.1%) |
| 35 to 44 Years | 0 (0.0%) | 20 (33.9%) |
| 45 to 54 Years | 26 (33.3%) | 27 (34.6%) |
| 55 to 64 Years | 50 (21.5%) | 155 (66.8%) |
| 65 to 74 Years | 541 (100.0%) | 366 (67.6%) |
| 75 Years and over | 408 (100.0%) | 280 (68.6%) |
| Total | 1,100 (72.8%) | 1,018 (67.3%) |
Disability Status by Sex by Age in Congress
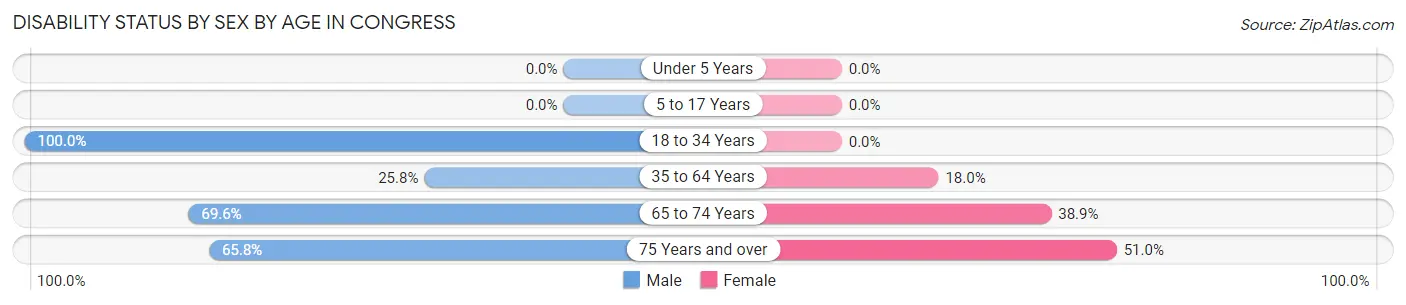
| Age Bracket | Male | Female |
| Under 5 Years | 0 (0.0%) | 0 (0.0%) |
| 5 to 17 Years | 0 (0.0%) | 0 (0.0%) |
| 18 to 34 Years | 23 (100.0%) | 0 (0.0%) |
| 35 to 64 Years | 55 (25.8%) | 28 (17.9%) |
| 65 to 74 Years | 151 (69.6%) | 126 (38.9%) |
| 75 Years and over | 173 (65.8%) | 74 (51.0%) |
Disability Class by Sex by Age in Congress
Disability Class: Hearing Difficulty
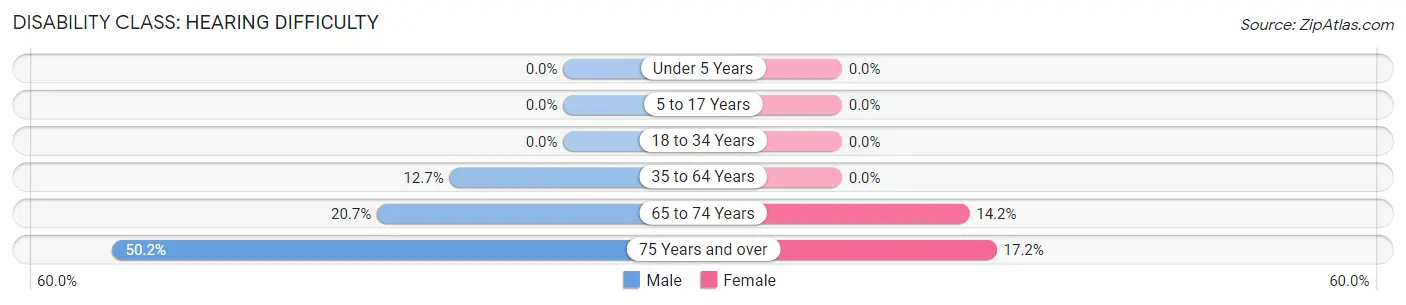
| Age Bracket | Male | Female |
| Under 5 Years | 0 (0.0%) | 0 (0.0%) |
| 5 to 17 Years | 0 (0.0%) | 0 (0.0%) |
| 18 to 34 Years | 0 (0.0%) | 0 (0.0%) |
| 35 to 64 Years | 27 (12.7%) | 0 (0.0%) |
| 65 to 74 Years | 45 (20.7%) | 46 (14.2%) |
| 75 Years and over | 132 (50.2%) | 25 (17.2%) |
Disability Class: Vision Difficulty
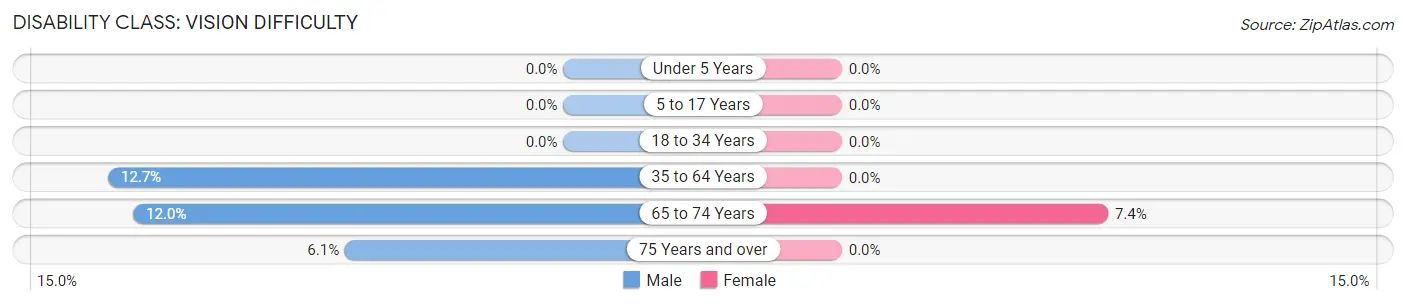
| Age Bracket | Male | Female |
| Under 5 Years | 0 (0.0%) | 0 (0.0%) |
| 5 to 17 Years | 0 (0.0%) | 0 (0.0%) |
| 18 to 34 Years | 0 (0.0%) | 0 (0.0%) |
| 35 to 64 Years | 27 (12.7%) | 0 (0.0%) |
| 65 to 74 Years | 26 (12.0%) | 24 (7.4%) |
| 75 Years and over | 16 (6.1%) | 0 (0.0%) |
Disability Class: Cognitive Difficulty
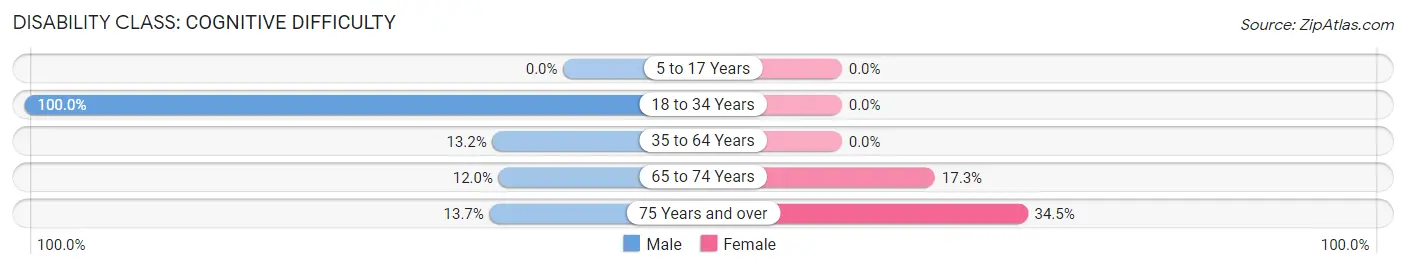
| Age Bracket | Male | Female |
| 5 to 17 Years | 0 (0.0%) | 0 (0.0%) |
| 18 to 34 Years | 23 (100.0%) | 0 (0.0%) |
| 35 to 64 Years | 28 (13.2%) | 0 (0.0%) |
| 65 to 74 Years | 26 (12.0%) | 56 (17.3%) |
| 75 Years and over | 36 (13.7%) | 50 (34.5%) |
Disability Class: Ambulatory Difficulty
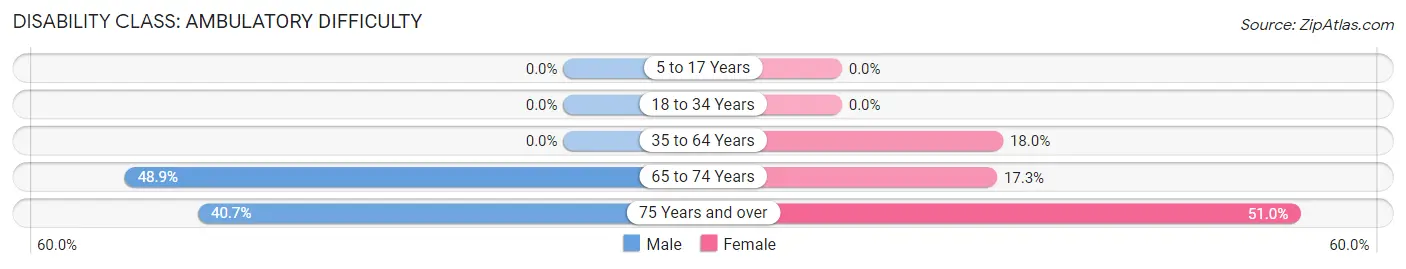
| Age Bracket | Male | Female |
| 5 to 17 Years | 0 (0.0%) | 0 (0.0%) |
| 18 to 34 Years | 0 (0.0%) | 0 (0.0%) |
| 35 to 64 Years | 0 (0.0%) | 28 (17.9%) |
| 65 to 74 Years | 106 (48.8%) | 56 (17.3%) |
| 75 Years and over | 107 (40.7%) | 74 (51.0%) |
Disability Class: Self-Care Difficulty
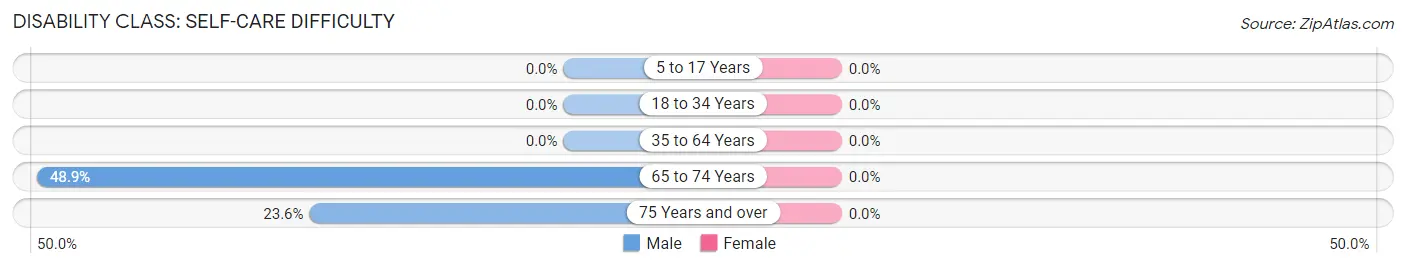
| Age Bracket | Male | Female |
| 5 to 17 Years | 0 (0.0%) | 0 (0.0%) |
| 18 to 34 Years | 0 (0.0%) | 0 (0.0%) |
| 35 to 64 Years | 0 (0.0%) | 0 (0.0%) |
| 65 to 74 Years | 106 (48.8%) | 0 (0.0%) |
| 75 Years and over | 62 (23.6%) | 0 (0.0%) |
Technology Access in Congress
Computing Device Access in Congress
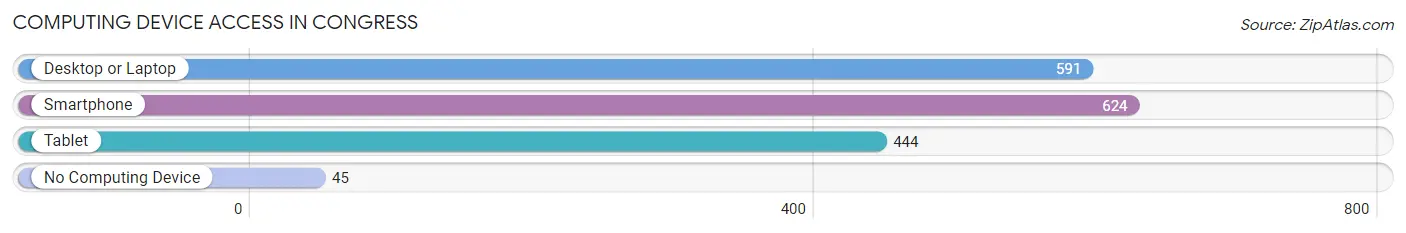
| Device Type | # Households | % Households |
| Desktop or Laptop | 591 | 80.5% |
| Smartphone | 624 | 85.0% |
| Tablet | 444 | 60.5% |
| No Computing Device | 45 | 6.1% |
| Total | 734 | 100.0% |
Internet Access in Congress
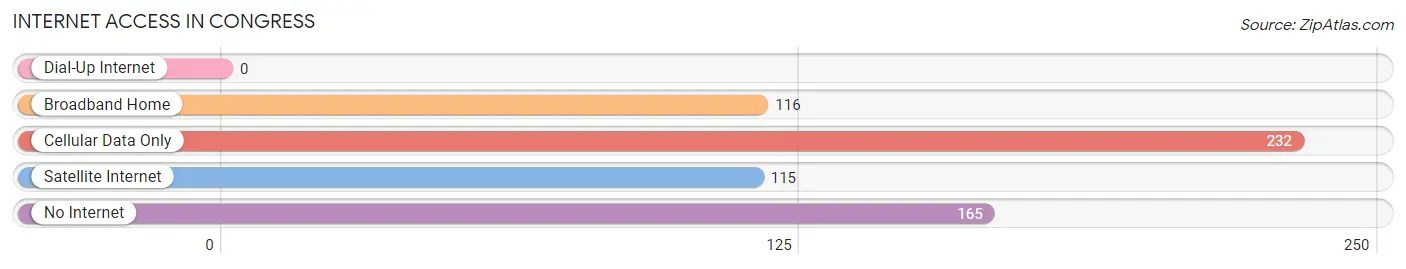
| Internet Type | # Households | % Households |
| Dial-Up Internet | 0 | 0.0% |
| Broadband Home | 116 | 15.8% |
| Cellular Data Only | 232 | 31.6% |
| Satellite Internet | 115 | 15.7% |
| No Internet | 165 | 22.5% |
| Total | 734 | 100.0% |
Congress Summary
Arizona is a state located in the southwestern region of the United States. It is the sixth largest state in the country and is bordered by California, Nevada, Utah, New Mexico, and Mexico. Arizona is known for its desert climate, its diverse geography, and its rich history.
Arizona was admitted to the Union as the 48th state on February 14, 1912. It was the last of the contiguous states to be admitted to the Union. Arizona is divided into 15 counties and is home to over 7 million people. The state capital is Phoenix, which is the largest city in the state.
Arizona has a rich history that dates back to the early Native American tribes that inhabited the area. The first Europeans to explore the area were Spanish explorers in the 16th century. The area was later claimed by Mexico in 1821 and became part of the United States in 1848 after the Mexican-American War.
Arizona is known for its desert climate, which is characterized by hot summers and mild winters. The state is home to a variety of landscapes, including mountains, canyons, forests, and deserts. The Grand Canyon, located in northern Arizona, is one of the most iconic natural landmarks in the United States.
The economy of Arizona is largely based on tourism, agriculture, and manufacturing. The state is home to a number of large companies, including Intel, Honeywell, and US Airways. Arizona is also home to a number of military bases, including Luke Air Force Base and Davis-Monthan Air Force Base.
The population of Arizona is diverse and includes a large Hispanic population. According to the 2010 census, the population of Arizona was 6,392,017, with a median age of 35.7 years. The largest cities in the state are Phoenix, Tucson, Mesa, and Glendale.
Arizona is represented in the United States Congress by two senators and nine representatives. The state is also represented in the House of Representatives by five representatives.
Arizona is a state with a rich history, diverse geography, and a vibrant economy. It is home to a variety of cultures and is a great place to live and work. With its beautiful landscapes, vibrant cities, and diverse population, Arizona is a great place to call home.
Common Questions
What is Per Capita Income in Congress?
Per Capita income in Congress is $39,998.
What is the Median Family Income in Congress?
Median Family Income in Congress is $67,250.
What is the Median Household income in Congress?
Median Household Income in Congress is $61,563.
What is Inequality or Gini Index in Congress?
Inequality or Gini Index in Congress is 0.47.
What is the Total Population of Congress?
Total Population of Congress is 1,512.
What is the Total Male Population of Congress?
Total Male Population of Congress is 789.
What is the Total Female Population of Congress?
Total Female Population of Congress is 723.
What is the Ratio of Males per 100 Females in Congress?
There are 109.13 Males per 100 Females in Congress.
What is the Ratio of Females per 100 Males in Congress?
There are 91.63 Females per 100 Males in Congress.
What is the Median Population Age in Congress?
Median Population Age in Congress is 69.7 Years.
What is the Average Family Size in Congress
Average Family Size in Congress is 2.4 People.
What is the Average Household Size in Congress
Average Household Size in Congress is 2.1 People.
How Large is the Labor Force in Congress?
There are 326 People in the Labor Forcein in Congress.
What is the Percentage of People in the Labor Force in Congress?
23.3% of People are in the Labor Force in Congress.