Wickenburg, AZ Map & Demographics
Wickenburg Map
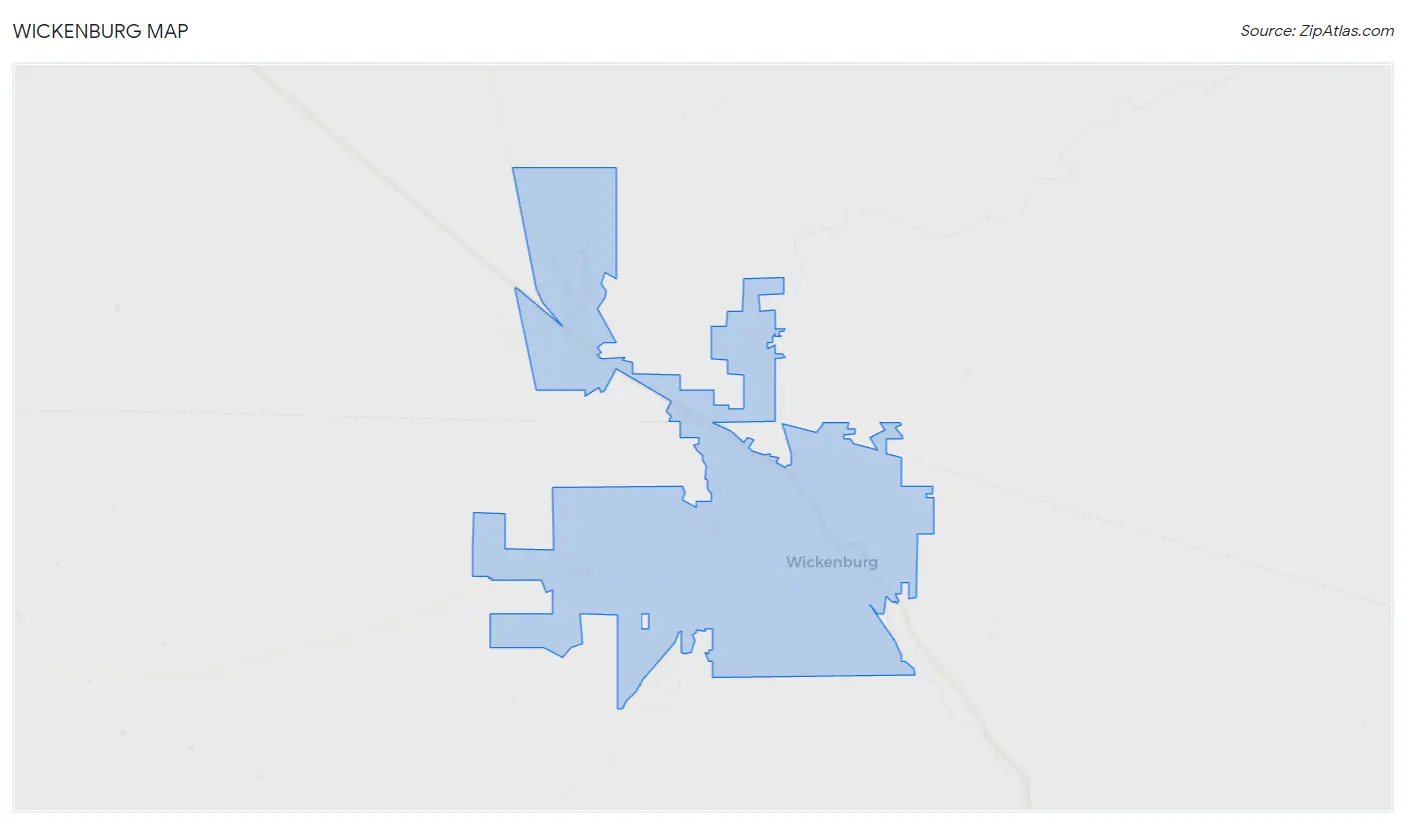
Wickenburg Overview
$47,219
PER CAPITA INCOME
$95,929
AVG FAMILY INCOME
$63,301
AVG HOUSEHOLD INCOME
14.1%
WAGE / INCOME GAP [ % ]
85.9¢/ $1
WAGE / INCOME GAP [ $ ]
0.51
INEQUALITY / GINI INDEX
7,600
TOTAL POPULATION
3,669
MALE POPULATION
3,931
FEMALE POPULATION
93.34
MALES / 100 FEMALES
107.14
FEMALES / 100 MALES
64.4
MEDIAN AGE
2.5
AVG FAMILY SIZE
1.9
AVG HOUSEHOLD SIZE
3,024
LABOR FORCE [ PEOPLE ]
44.4%
PERCENT IN LABOR FORCE
1.0%
UNEMPLOYMENT RATE
Wickenburg Zip Codes
Wickenburg Area Codes
Income in Wickenburg
Income Overview in Wickenburg
Per Capita Income in Wickenburg is $47,219, while median incomes of families and households are $95,929 and $63,301 respectively.
| Characteristic | Number | Measure |
| Per Capita Income | 7,600 | $47,219 |
| Median Family Income | 2,154 | $95,929 |
| Mean Family Income | 2,154 | $119,445 |
| Median Household Income | 3,825 | $63,301 |
| Mean Household Income | 3,825 | $91,347 |
| Income Deficit | 2,154 | $0 |
| Wage / Income Gap (%) | 7,600 | 14.07% |
| Wage / Income Gap ($) | 7,600 | 85.93¢ per $1 |
| Gini / Inequality Index | 7,600 | 0.51 |
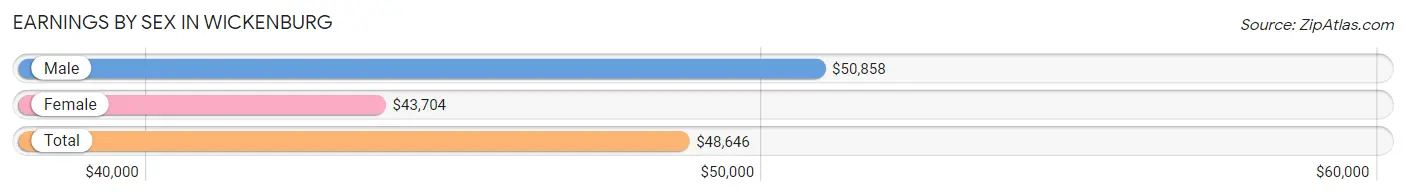
Earnings by Sex in Wickenburg
Average Earnings in Wickenburg are $48,646, $50,858 for men and $43,704 for women, a difference of 14.1%.
| Sex | Number | Average Earnings |
| Male | 1,468 (44.0%) | $50,858 |
| Female | 1,866 (56.0%) | $43,704 |
| Total | 3,334 (100.0%) | $48,646 |
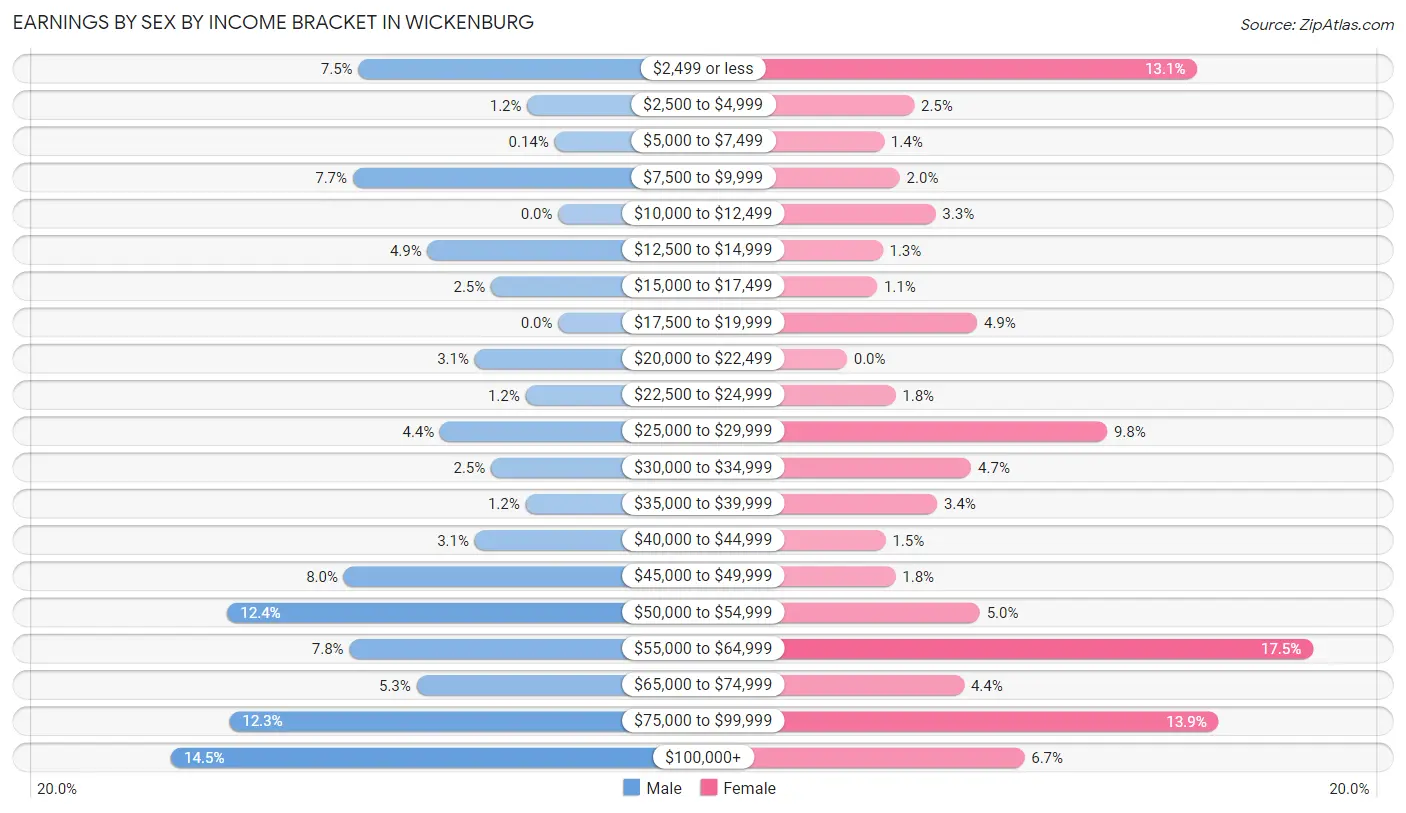
Earnings by Sex by Income Bracket in Wickenburg
The most common earnings brackets in Wickenburg are $100,000+ for men (213 | 14.5%) and $55,000 to $64,999 for women (326 | 17.5%).
| Income | Male | Female |
| $2,499 or less | 110 (7.5%) | 245 (13.1%) |
| $2,500 to $4,999 | 17 (1.2%) | 47 (2.5%) |
| $5,000 to $7,499 | 2 (0.1%) | 26 (1.4%) |
| $7,500 to $9,999 | 113 (7.7%) | 37 (2.0%) |
| $10,000 to $12,499 | 0 (0.0%) | 62 (3.3%) |
| $12,500 to $14,999 | 72 (4.9%) | 25 (1.3%) |
| $15,000 to $17,499 | 37 (2.5%) | 21 (1.1%) |
| $17,500 to $19,999 | 0 (0.0%) | 91 (4.9%) |
| $20,000 to $22,499 | 46 (3.1%) | 0 (0.0%) |
| $22,500 to $24,999 | 18 (1.2%) | 34 (1.8%) |
| $25,000 to $29,999 | 65 (4.4%) | 182 (9.8%) |
| $30,000 to $34,999 | 37 (2.5%) | 87 (4.7%) |
| $35,000 to $39,999 | 18 (1.2%) | 63 (3.4%) |
| $40,000 to $44,999 | 46 (3.1%) | 27 (1.5%) |
| $45,000 to $49,999 | 118 (8.0%) | 34 (1.8%) |
| $50,000 to $54,999 | 182 (12.4%) | 93 (5.0%) |
| $55,000 to $64,999 | 115 (7.8%) | 326 (17.5%) |
| $65,000 to $74,999 | 78 (5.3%) | 82 (4.4%) |
| $75,000 to $99,999 | 181 (12.3%) | 260 (13.9%) |
| $100,000+ | 213 (14.5%) | 124 (6.7%) |
| Total | 1,468 (100.0%) | 1,866 (100.0%) |
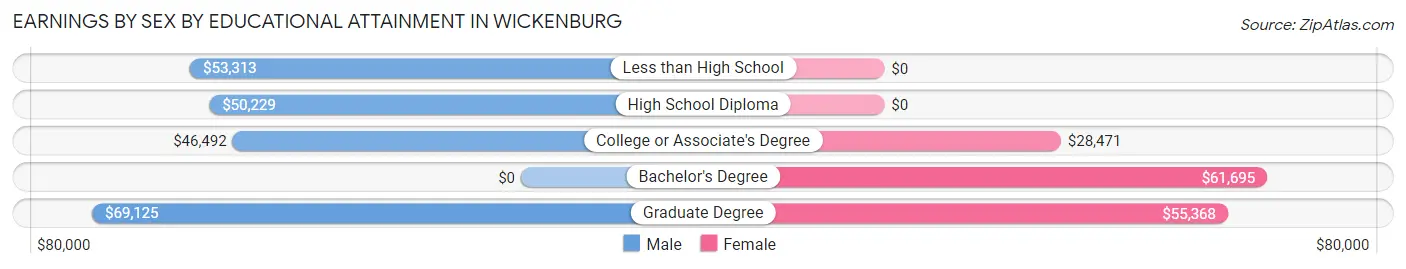
Earnings by Sex by Educational Attainment in Wickenburg
Average earnings in Wickenburg are $51,115 for men and $47,169 for women, a difference of 7.7%. Men with an educational attainment of graduate degree enjoy the highest average annual earnings of $69,125, while those with college or associate's degree education earn the least with $46,492. Women with an educational attainment of bachelor's degree earn the most with the average annual earnings of $61,695, while those with college or associate's degree education have the smallest earnings of $28,471.
| Educational Attainment | Male Income | Female Income |
| Less than High School | $53,313 | $0 |
| High School Diploma | $50,229 | $0 |
| College or Associate's Degree | $46,492 | $28,471 |
| Bachelor's Degree | - | - |
| Graduate Degree | $69,125 | $55,368 |
| Total | $51,115 | $47,169 |
Family Income in Wickenburg
Family Income Brackets in Wickenburg
According to the Wickenburg family income data, there are 545 families falling into the $100,000 to $149,999 income range, which is the most common income bracket and makes up 25.3% of all families. Conversely, the $25,000 to $34,999 income bracket is the least frequent group with only 54 families (2.5%) belonging to this category.
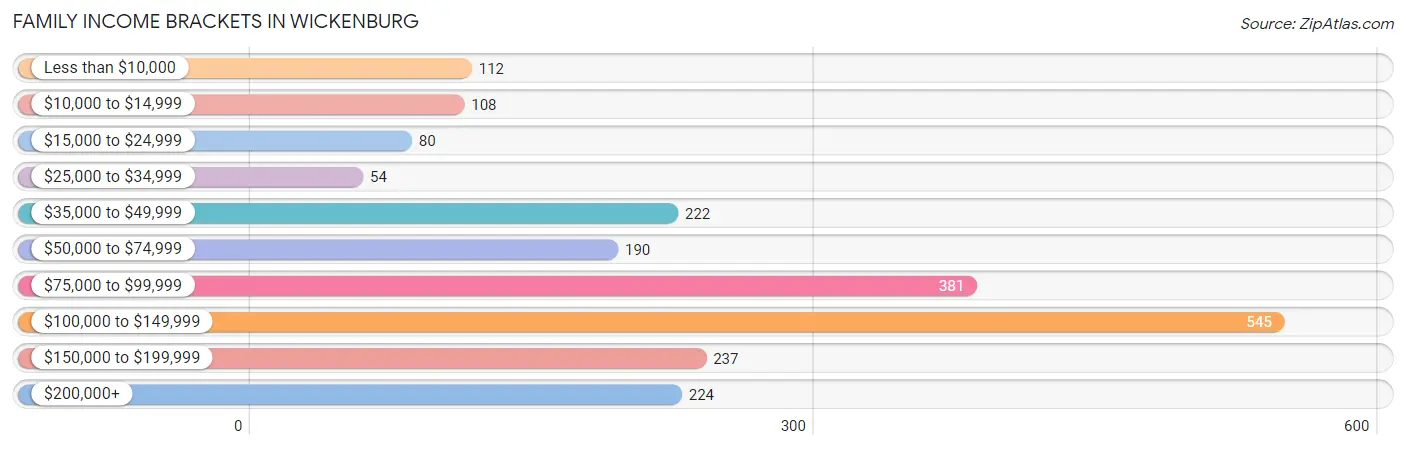
| Income Bracket | # Families | % Families |
| Less than $10,000 | 112 | 5.2% |
| $10,000 to $14,999 | 108 | 5.0% |
| $15,000 to $24,999 | 80 | 3.7% |
| $25,000 to $34,999 | 54 | 2.5% |
| $35,000 to $49,999 | 222 | 10.3% |
| $50,000 to $74,999 | 190 | 8.8% |
| $75,000 to $99,999 | 381 | 17.7% |
| $100,000 to $149,999 | 545 | 25.3% |
| $150,000 to $199,999 | 237 | 11.0% |
| $200,000+ | 224 | 10.4% |
Family Income by Famaliy Size in Wickenburg
3-person families (256 | 11.9%) account for the highest median family income in Wickenburg with $121,250 per family, while 2-person families (1,532 | 71.1%) have the highest median income of $46,932 per family member.
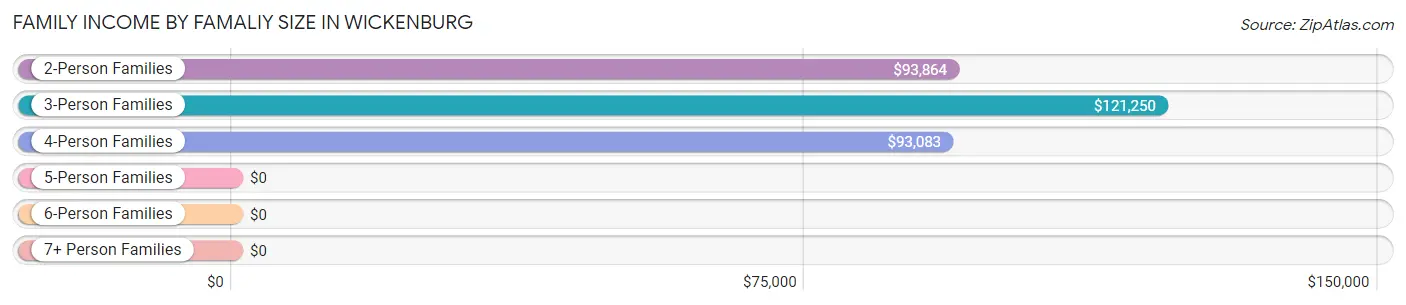
| Income Bracket | # Families | Median Income |
| 2-Person Families | 1,532 (71.1%) | $93,864 |
| 3-Person Families | 256 (11.9%) | $121,250 |
| 4-Person Families | 323 (15.0%) | $93,083 |
| 5-Person Families | 21 (1.0%) | $0 |
| 6-Person Families | 0 (0.0%) | $0 |
| 7+ Person Families | 22 (1.0%) | $0 |
| Total | 2,154 (100.0%) | $95,929 |
Family Income by Number of Earners in Wickenburg
The median family income in Wickenburg is $95,929, with families comprising 3+ earners (139) having the highest median family income of $139,063, while families with no earners (806) have the lowest median family income of $46,458, accounting for 6.5% and 37.4% of families, respectively.
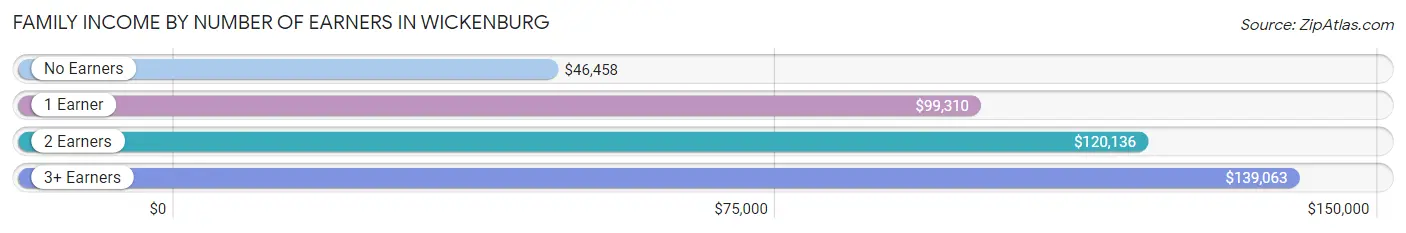
| Number of Earners | # Families | Median Income |
| No Earners | 806 (37.4%) | $46,458 |
| 1 Earner | 516 (24.0%) | $99,310 |
| 2 Earners | 693 (32.2%) | $120,136 |
| 3+ Earners | 139 (6.5%) | $139,063 |
| Total | 2,154 (100.0%) | $95,929 |
Household Income in Wickenburg
Household Income Brackets in Wickenburg
With 585 households falling in the category, the $50,000 to $74,999 income range is the most frequent in Wickenburg, accounting for 15.3% of all households. In contrast, only 199 households (5.2%) fall into the $10,000 to $14,999 income bracket, making it the least populous group.
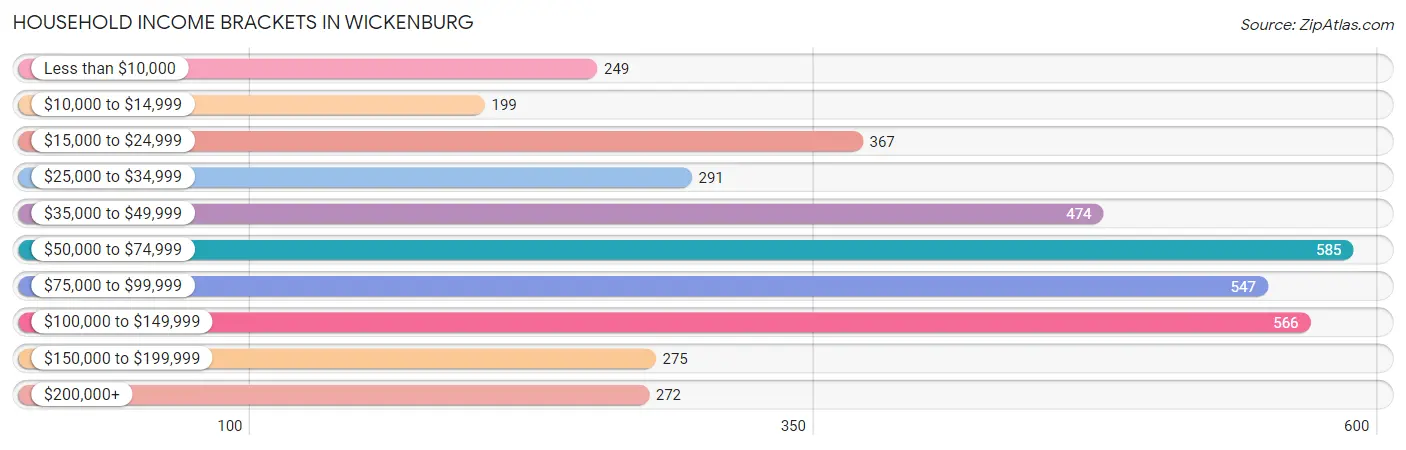
| Income Bracket | # Households | % Households |
| Less than $10,000 | 249 | 6.5% |
| $10,000 to $14,999 | 199 | 5.2% |
| $15,000 to $24,999 | 367 | 9.6% |
| $25,000 to $34,999 | 291 | 7.6% |
| $35,000 to $49,999 | 474 | 12.4% |
| $50,000 to $74,999 | 585 | 15.3% |
| $75,000 to $99,999 | 547 | 14.3% |
| $100,000 to $149,999 | 566 | 14.8% |
| $150,000 to $199,999 | 275 | 7.2% |
| $200,000+ | 272 | 7.1% |
Household Income by Householder Age in Wickenburg
The median household income in Wickenburg is $63,301, with the highest median household income of $84,625 found in the 45 to 64 years age bracket for the primary householder. A total of 996 households (26.0%) fall into this category. Meanwhile, the 15 to 24 years age bracket for the primary householder has the lowest median household income of $0, with 56 households (1.5%) in this group.
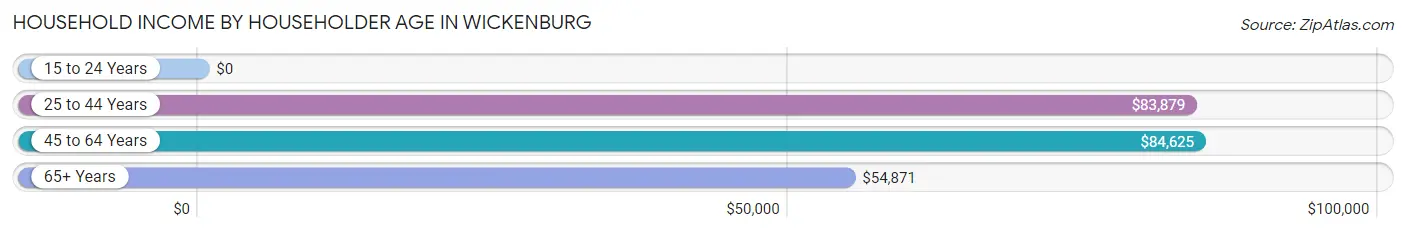
| Income Bracket | # Households | Median Income |
| 15 to 24 Years | 56 (1.5%) | $0 |
| 25 to 44 Years | 392 (10.2%) | $83,879 |
| 45 to 64 Years | 996 (26.0%) | $84,625 |
| 65+ Years | 2,381 (62.3%) | $54,871 |
| Total | 3,825 (100.0%) | $63,301 |
Poverty in Wickenburg
Income Below Poverty by Sex and Age in Wickenburg
With 16.5% poverty level for males and 12.1% for females among the residents of Wickenburg, 15 year old males and 18 to 24 year old females are the most vulnerable to poverty, with 68 males (75.6%) and 82 females (81.2%) in their respective age groups living below the poverty level.
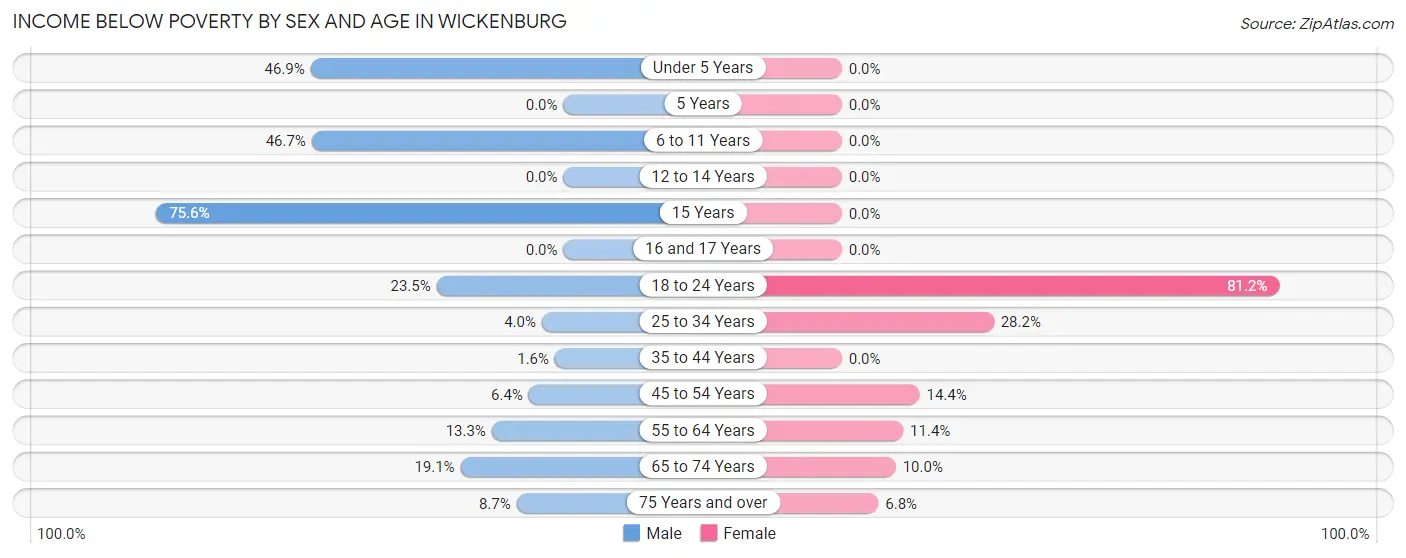
| Age Bracket | Male | Female |
| Under 5 Years | 76 (46.9%) | 0 (0.0%) |
| 5 Years | 0 (0.0%) | 0 (0.0%) |
| 6 to 11 Years | 71 (46.7%) | 0 (0.0%) |
| 12 to 14 Years | 0 (0.0%) | 0 (0.0%) |
| 15 Years | 68 (75.6%) | 0 (0.0%) |
| 16 and 17 Years | 0 (0.0%) | 0 (0.0%) |
| 18 to 24 Years | 8 (23.5%) | 82 (81.2%) |
| 25 to 34 Years | 8 (4.0%) | 97 (28.2%) |
| 35 to 44 Years | 3 (1.6%) | 0 (0.0%) |
| 45 to 54 Years | 17 (6.4%) | 42 (14.4%) |
| 55 to 64 Years | 100 (13.3%) | 90 (11.4%) |
| 65 to 74 Years | 192 (19.1%) | 105 (10.0%) |
| 75 Years and over | 62 (8.7%) | 57 (6.8%) |
| Total | 605 (16.5%) | 473 (12.1%) |
Income Above Poverty by Sex and Age in Wickenburg
According to the poverty statistics in Wickenburg, males aged 12 to 14 years and females aged 5 years are the age groups that are most secure financially, with 100.0% of males and 100.0% of females in these age groups living above the poverty line.
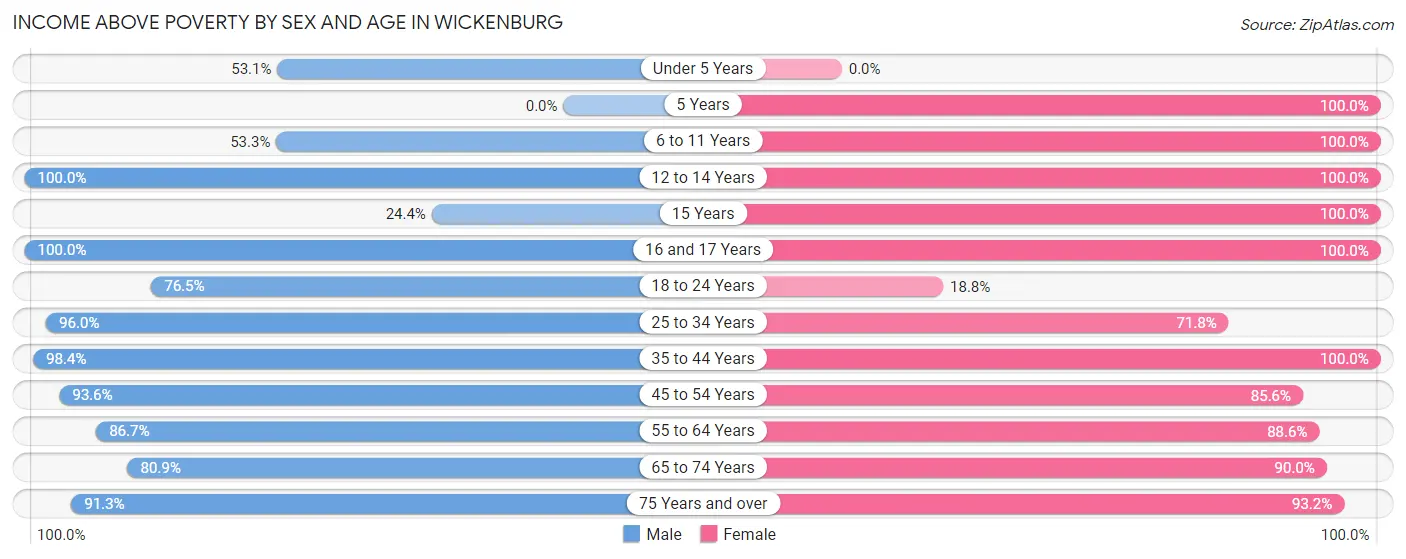
| Age Bracket | Male | Female |
| Under 5 Years | 86 (53.1%) | 0 (0.0%) |
| 5 Years | 0 (0.0%) | 70 (100.0%) |
| 6 to 11 Years | 81 (53.3%) | 123 (100.0%) |
| 12 to 14 Years | 85 (100.0%) | 92 (100.0%) |
| 15 Years | 22 (24.4%) | 16 (100.0%) |
| 16 and 17 Years | 21 (100.0%) | 25 (100.0%) |
| 18 to 24 Years | 26 (76.5%) | 19 (18.8%) |
| 25 to 34 Years | 192 (96.0%) | 247 (71.8%) |
| 35 to 44 Years | 187 (98.4%) | 178 (100.0%) |
| 45 to 54 Years | 247 (93.6%) | 249 (85.6%) |
| 55 to 64 Years | 652 (86.7%) | 700 (88.6%) |
| 65 to 74 Years | 813 (80.9%) | 944 (90.0%) |
| 75 Years and over | 652 (91.3%) | 784 (93.2%) |
| Total | 3,064 (83.5%) | 3,447 (87.9%) |
Income Below Poverty Among Married-Couple Families in Wickenburg
The poverty statistics for married-couple families in Wickenburg show that 8.1% or 161 of the total 1,995 families live below the poverty line. Families with no children have the highest poverty rate of 9.6%, comprising of 161 families. On the other hand, families with 1 or 2 children have the lowest poverty rate of 0.0%, which includes 0 families.
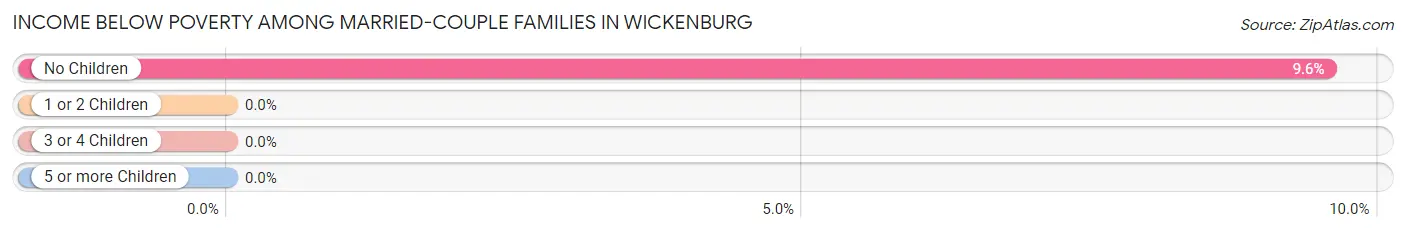
| Children | Above Poverty | Below Poverty |
| No Children | 1,523 (90.4%) | 161 (9.6%) |
| 1 or 2 Children | 289 (100.0%) | 0 (0.0%) |
| 3 or 4 Children | 0 (0.0%) | 0 (0.0%) |
| 5 or more Children | 22 (100.0%) | 0 (0.0%) |
| Total | 1,834 (91.9%) | 161 (8.1%) |
Income Below Poverty Among Single-Parent Households in Wickenburg
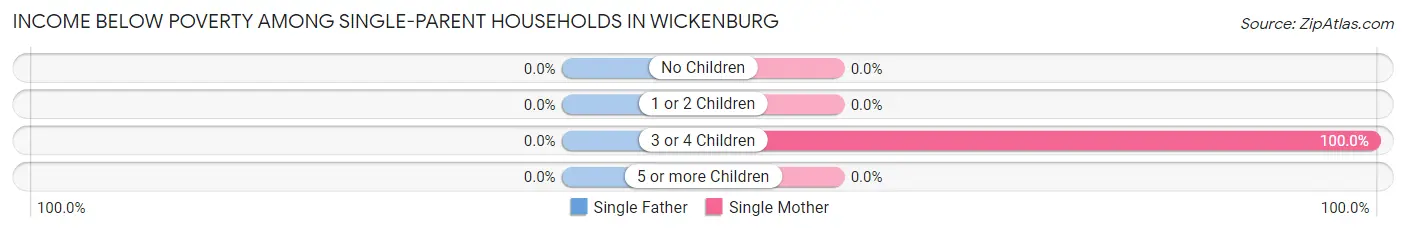
| Children | Single Father | Single Mother |
| No Children | 0 (0.0%) | 0 (0.0%) |
| 1 or 2 Children | 0 (0.0%) | 0 (0.0%) |
| 3 or 4 Children | 0 (0.0%) | 77 (100.0%) |
| 5 or more Children | 0 (0.0%) | 0 (0.0%) |
| Total | 0 (0.0%) | 77 (69.4%) |
Income Below Poverty Among Married-Couple vs Single-Parent Households in Wickenburg
The poverty data for Wickenburg shows that 161 of the married-couple family households (8.1%) and 77 of the single-parent households (48.4%) are living below the poverty level. Within the married-couple family households, those with no children have the highest poverty rate, with 161 households (9.6%) falling below the poverty line. Among the single-parent households, those with 3 or 4 children have the highest poverty rate, with 77 household (100.0%) living below poverty.
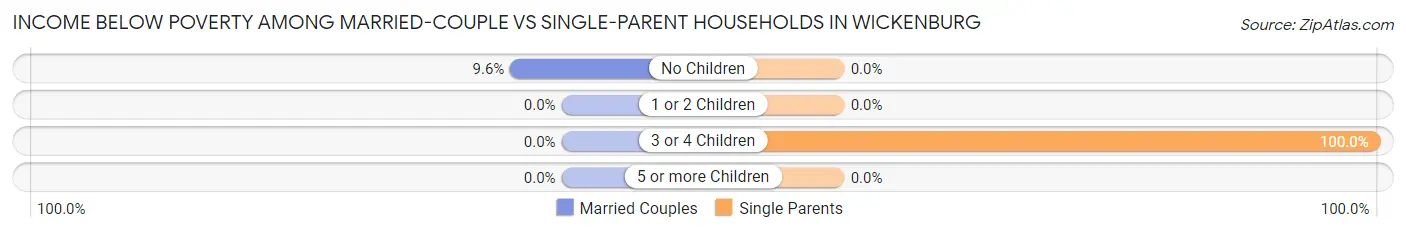
| Children | Married-Couple Families | Single-Parent Households |
| No Children | 161 (9.6%) | 0 (0.0%) |
| 1 or 2 Children | 0 (0.0%) | 0 (0.0%) |
| 3 or 4 Children | 0 (0.0%) | 77 (100.0%) |
| 5 or more Children | 0 (0.0%) | 0 (0.0%) |
| Total | 161 (8.1%) | 77 (48.4%) |
Race in Wickenburg
The most populous races in Wickenburg are White / Caucasian (7,301 | 96.1%), Hispanic or Latino (635 | 8.4%), and Two or more Races (157 | 2.1%).
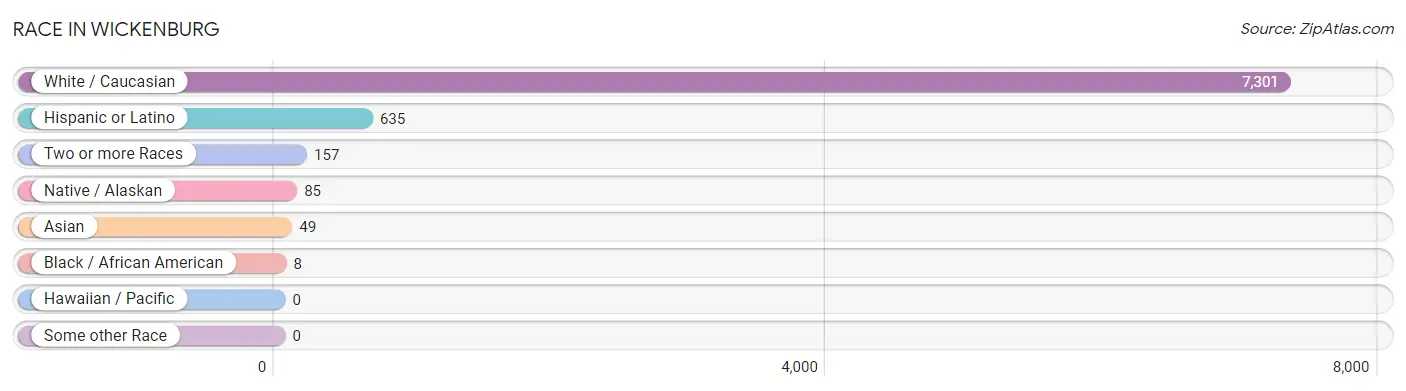
| Race | # Population | % Population |
| Asian | 49 | 0.6% |
| Black / African American | 8 | 0.1% |
| Hawaiian / Pacific | 0 | 0.0% |
| Hispanic or Latino | 635 | 8.4% |
| Native / Alaskan | 85 | 1.1% |
| White / Caucasian | 7,301 | 96.1% |
| Two or more Races | 157 | 2.1% |
| Some other Race | 0 | 0.0% |
| Total | 7,600 | 100.0% |
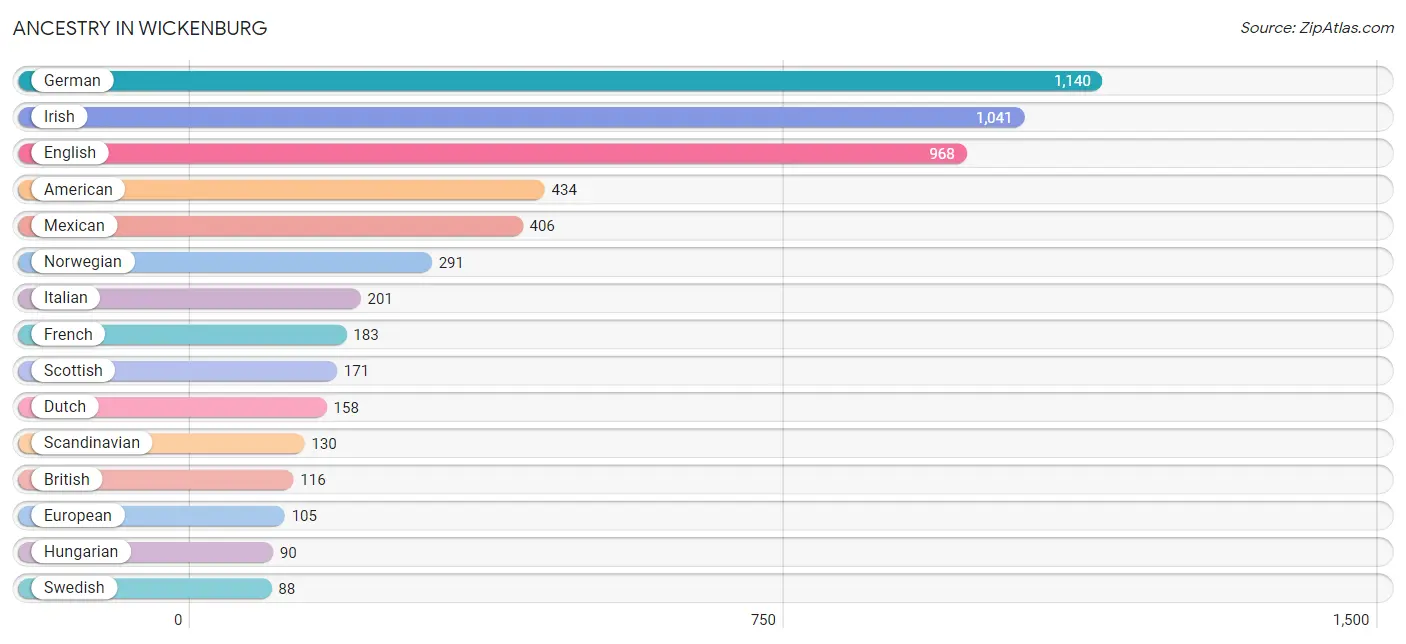
Ancestry in Wickenburg
The most populous ancestries reported in Wickenburg are German (1,140 | 15.0%), Irish (1,041 | 13.7%), English (968 | 12.7%), American (434 | 5.7%), and Mexican (406 | 5.3%), together accounting for 52.5% of all Wickenburg residents.
| Ancestry | # Population | % Population |
| Albanian | 9 | 0.1% |
| American | 434 | 5.7% |
| Bhutanese | 20 | 0.3% |
| Brazilian | 46 | 0.6% |
| British | 116 | 1.5% |
| Canadian | 22 | 0.3% |
| Creek | 50 | 0.7% |
| Cuban | 17 | 0.2% |
| Czech | 48 | 0.6% |
| Danish | 66 | 0.9% |
| Dominican | 32 | 0.4% |
| Dutch | 158 | 2.1% |
| English | 968 | 12.7% |
| European | 105 | 1.4% |
| French | 183 | 2.4% |
| French Canadian | 21 | 0.3% |
| German | 1,140 | 15.0% |
| Greek | 19 | 0.3% |
| Hungarian | 90 | 1.2% |
| Indian (Asian) | 3 | 0.0% |
| Irish | 1,041 | 13.7% |
| Italian | 201 | 2.6% |
| Korean | 26 | 0.3% |
| Mexican | 406 | 5.3% |
| Native Hawaiian | 26 | 0.3% |
| Norwegian | 291 | 3.8% |
| Pima | 10 | 0.1% |
| Polish | 87 | 1.1% |
| Portuguese | 26 | 0.3% |
| Puget Sound Salish | 8 | 0.1% |
| Russian | 23 | 0.3% |
| Scandinavian | 130 | 1.7% |
| Scotch-Irish | 76 | 1.0% |
| Scottish | 171 | 2.2% |
| Spaniard | 51 | 0.7% |
| Spanish | 73 | 1.0% |
| Swedish | 88 | 1.2% |
| Swiss | 16 | 0.2% |
| Tohono O'Odham | 14 | 0.2% |
| Welsh | 42 | 0.5% |
| Yaqui | 14 | 0.2% |
| Yugoslavian | 22 | 0.3% | View All 42 Rows |
Immigrants in Wickenburg
The most numerous immigrant groups reported in Wickenburg came from Latin America (112 | 1.5%), Central America (80 | 1.1%), Mexico (80 | 1.1%), Canada (67 | 0.9%), and Europe (37 | 0.5%), together accounting for 4.9% of all Wickenburg residents.
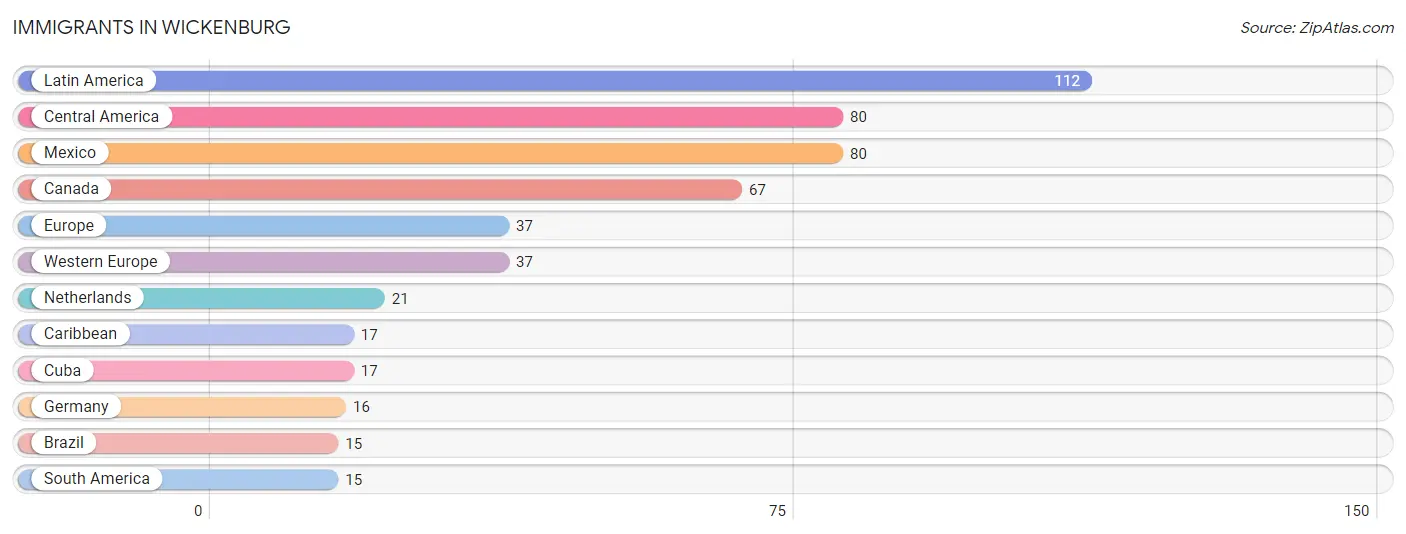
| Immigration Origin | # Population | % Population |
| Brazil | 15 | 0.2% |
| Canada | 67 | 0.9% |
| Caribbean | 17 | 0.2% |
| Central America | 80 | 1.1% |
| Cuba | 17 | 0.2% |
| Europe | 37 | 0.5% |
| Germany | 16 | 0.2% |
| Latin America | 112 | 1.5% |
| Mexico | 80 | 1.1% |
| Netherlands | 21 | 0.3% |
| South America | 15 | 0.2% |
| Western Europe | 37 | 0.5% | View All 12 Rows |
Sex and Age in Wickenburg
Sex and Age in Wickenburg
The most populous age groups in Wickenburg are 65 to 69 Years (572 | 15.6%) for men and 65 to 69 Years (735 | 18.7%) for women.
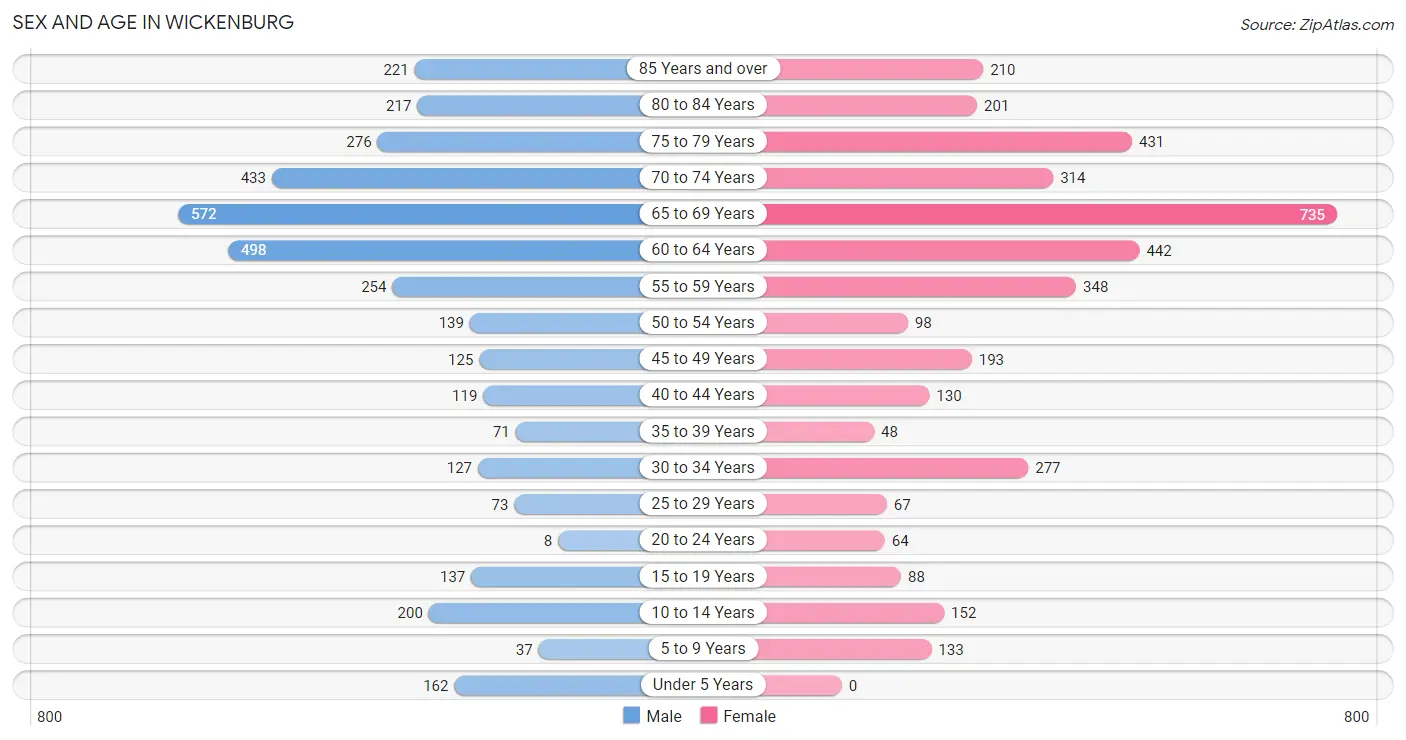
| Age Bracket | Male | Female |
| Under 5 Years | 162 (4.4%) | 0 (0.0%) |
| 5 to 9 Years | 37 (1.0%) | 133 (3.4%) |
| 10 to 14 Years | 200 (5.4%) | 152 (3.9%) |
| 15 to 19 Years | 137 (3.7%) | 88 (2.2%) |
| 20 to 24 Years | 8 (0.2%) | 64 (1.6%) |
| 25 to 29 Years | 73 (2.0%) | 67 (1.7%) |
| 30 to 34 Years | 127 (3.5%) | 277 (7.0%) |
| 35 to 39 Years | 71 (1.9%) | 48 (1.2%) |
| 40 to 44 Years | 119 (3.2%) | 130 (3.3%) |
| 45 to 49 Years | 125 (3.4%) | 193 (4.9%) |
| 50 to 54 Years | 139 (3.8%) | 98 (2.5%) |
| 55 to 59 Years | 254 (6.9%) | 348 (8.8%) |
| 60 to 64 Years | 498 (13.6%) | 442 (11.2%) |
| 65 to 69 Years | 572 (15.6%) | 735 (18.7%) |
| 70 to 74 Years | 433 (11.8%) | 314 (8.0%) |
| 75 to 79 Years | 276 (7.5%) | 431 (11.0%) |
| 80 to 84 Years | 217 (5.9%) | 201 (5.1%) |
| 85 Years and over | 221 (6.0%) | 210 (5.3%) |
| Total | 3,669 (100.0%) | 3,931 (100.0%) |
Families and Households in Wickenburg
Median Family Size in Wickenburg
The median family size in Wickenburg is 2.52 persons per family, with single female/mother families (111 | 5.1%) accounting for the largest median family size of 3.83 persons per family. On the other hand, married-couple families (1,995 | 92.6%) represent the smallest median family size with 2.44 persons per family.
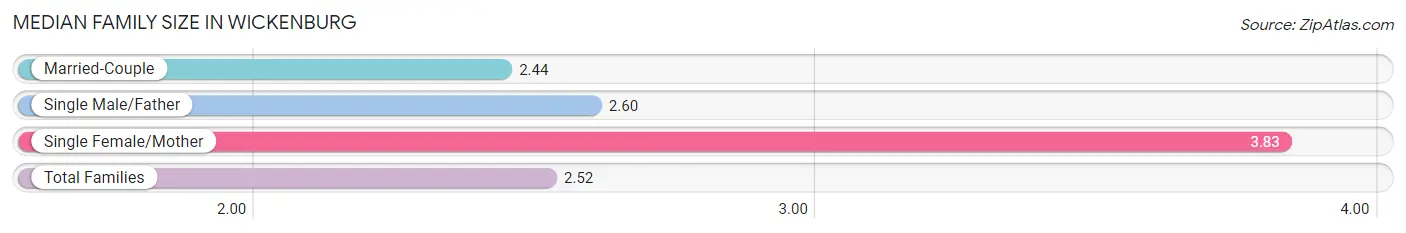
| Family Type | # Families | Family Size |
| Married-Couple | 1,995 (92.6%) | 2.44 |
| Single Male/Father | 48 (2.2%) | 2.60 |
| Single Female/Mother | 111 (5.1%) | 3.83 |
| Total Families | 2,154 (100.0%) | 2.52 |
Median Household Size in Wickenburg
The median household size in Wickenburg is 1.95 persons per household, with single female/mother households (111 | 2.9%) accounting for the largest median household size of 3.99 persons per household. non-family households (1,671 | 43.7%) represent the smallest median household size with 1.20 persons per household.
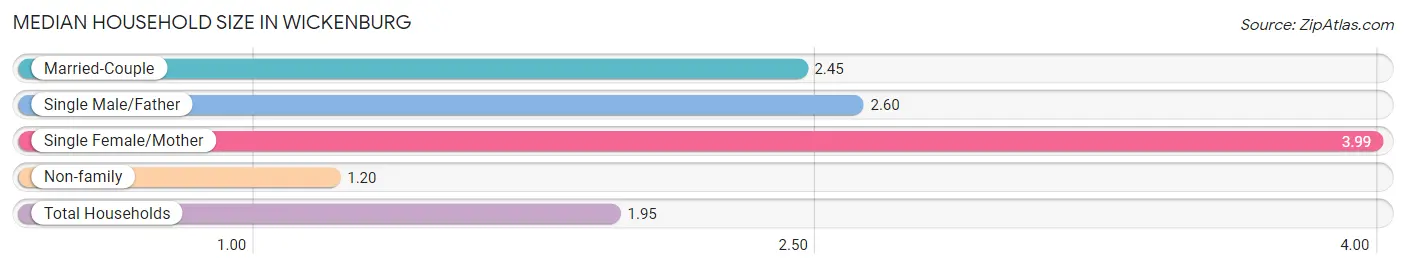
| Household Type | # Households | Household Size |
| Married-Couple | 1,995 (52.2%) | 2.45 |
| Single Male/Father | 48 (1.3%) | 2.60 |
| Single Female/Mother | 111 (2.9%) | 3.99 |
| Non-family | 1,671 (43.7%) | 1.20 |
| Total Households | 3,825 (100.0%) | 1.95 |
Household Size by Marriage Status in Wickenburg
Out of a total of 3,825 households in Wickenburg, 2,154 (56.3%) are family households, while 1,671 (43.7%) are nonfamily households. The most numerous type of family households are 2-person households, comprising 1,512, and the most common type of nonfamily households are 1-person households, comprising 1,350.
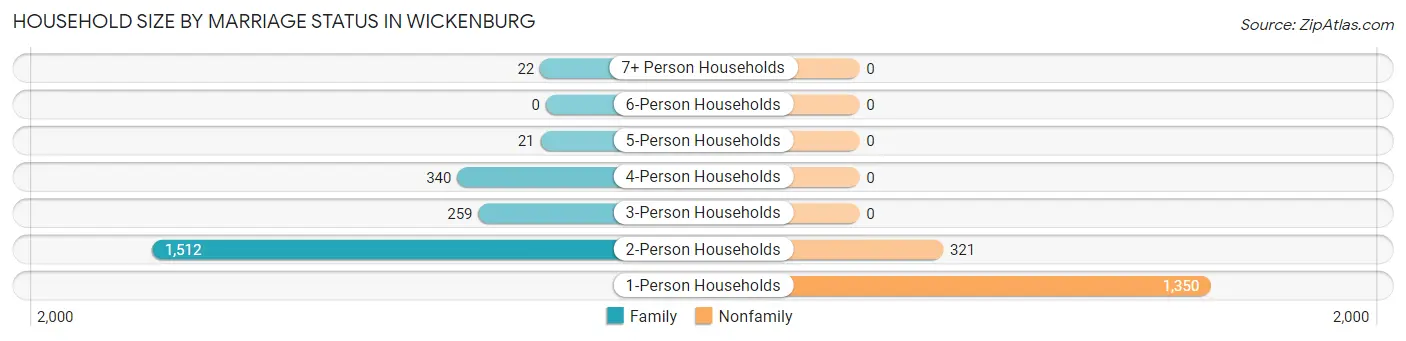
| Household Size | Family Households | Nonfamily Households |
| 1-Person Households | - | 1,350 (35.3%) |
| 2-Person Households | 1,512 (39.5%) | 321 (8.4%) |
| 3-Person Households | 259 (6.8%) | 0 (0.0%) |
| 4-Person Households | 340 (8.9%) | 0 (0.0%) |
| 5-Person Households | 21 (0.5%) | 0 (0.0%) |
| 6-Person Households | 0 (0.0%) | 0 (0.0%) |
| 7+ Person Households | 22 (0.6%) | 0 (0.0%) |
| Total | 2,154 (56.3%) | 1,671 (43.7%) |
Female Fertility in Wickenburg
Fertility by Age in Wickenburg
| Age Bracket | Women with Births | Births / 1,000 Women |
| 15 to 19 years | 0 (0.0%) | 0.0 |
| 20 to 34 years | 0 (0.0%) | 0.0 |
| 35 to 50 years | 0 (0.0%) | 0.0 |
| Total | 0 (0.0%) | 0.0 |
Fertility by Age by Marriage Status in Wickenburg
| Age Bracket | Married | Unmarried |
| 15 to 19 years | 0 (0.0%) | 0 (0.0%) |
| 20 to 34 years | 0 (0.0%) | 0 (0.0%) |
| 35 to 50 years | 0 (0.0%) | 0 (0.0%) |
| Total | 0 (0.0%) | 0 (0.0%) |
Fertility by Education in Wickenburg
| Educational Attainment | Women with Births | Births / 1,000 Women |
| Less than High School | 0 (0.0%) | 0.0 |
| High School Diploma | 0 (0.0%) | 0.0 |
| College or Associate's Degree | 0 (0.0%) | 0.0 |
| Bachelor's Degree | 0 (0.0%) | 0.0 |
| Graduate Degree | 0 (0.0%) | 0.0 |
| Total | 0 (0.0%) | 0.0 |
Fertility by Education by Marriage Status in Wickenburg
| Educational Attainment | Married | Unmarried |
| Less than High School | 0 (0.0%) | 0 (0.0%) |
| High School Diploma | 0 (0.0%) | 0 (0.0%) |
| College or Associate's Degree | 0 (0.0%) | 0 (0.0%) |
| Bachelor's Degree | 0 (0.0%) | 0 (0.0%) |
| Graduate Degree | 0 (0.0%) | 0 (0.0%) |
| Total | 0 (0.0%) | 0 (0.0%) |
Employment Characteristics in Wickenburg
Employment by Class of Employer in Wickenburg
Among the 2,991 employed individuals in Wickenburg, private company employees (1,686 | 56.4%), not-for-profit organizations (441 | 14.7%), and self-employed (not incorporated) (320 | 10.7%) make up the most common classes of employment.
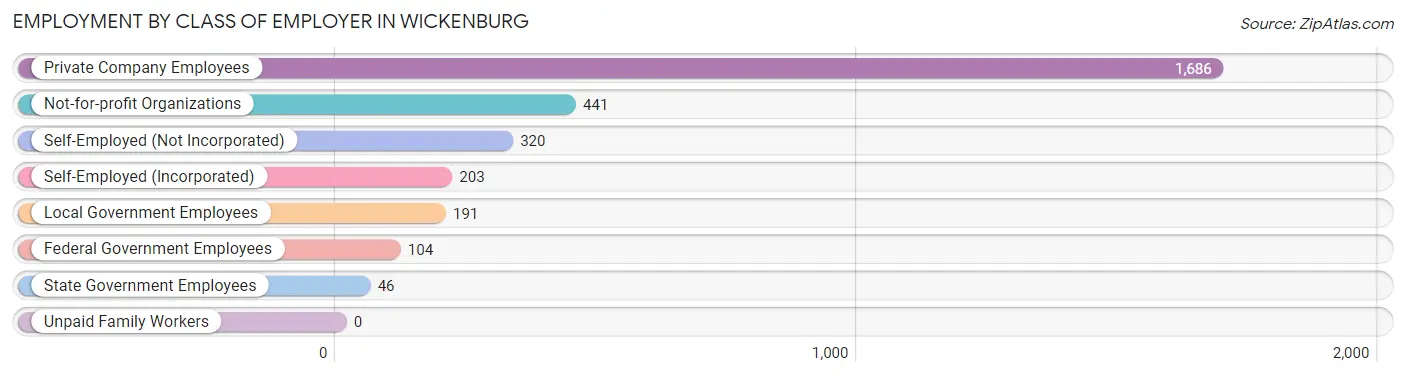
| Employer Class | # Employees | % Employees |
| Private Company Employees | 1,686 | 56.4% |
| Self-Employed (Incorporated) | 203 | 6.8% |
| Self-Employed (Not Incorporated) | 320 | 10.7% |
| Not-for-profit Organizations | 441 | 14.7% |
| Local Government Employees | 191 | 6.4% |
| State Government Employees | 46 | 1.5% |
| Federal Government Employees | 104 | 3.5% |
| Unpaid Family Workers | 0 | 0.0% |
| Total | 2,991 | 100.0% |
Employment Status by Age in Wickenburg
According to the labor force statistics for Wickenburg, out of the total population over 16 years of age (6,810), 44.4% or 3,024 individuals are in the labor force, with 1.0% or 30 of them unemployed. The age group with the highest labor force participation rate is 30 to 34 years, with 96.0% or 388 individuals in the labor force. Within the labor force, the 45 to 54 years age range has the highest percentage of unemployed individuals, with 3.4% or 16 of them being unemployed.
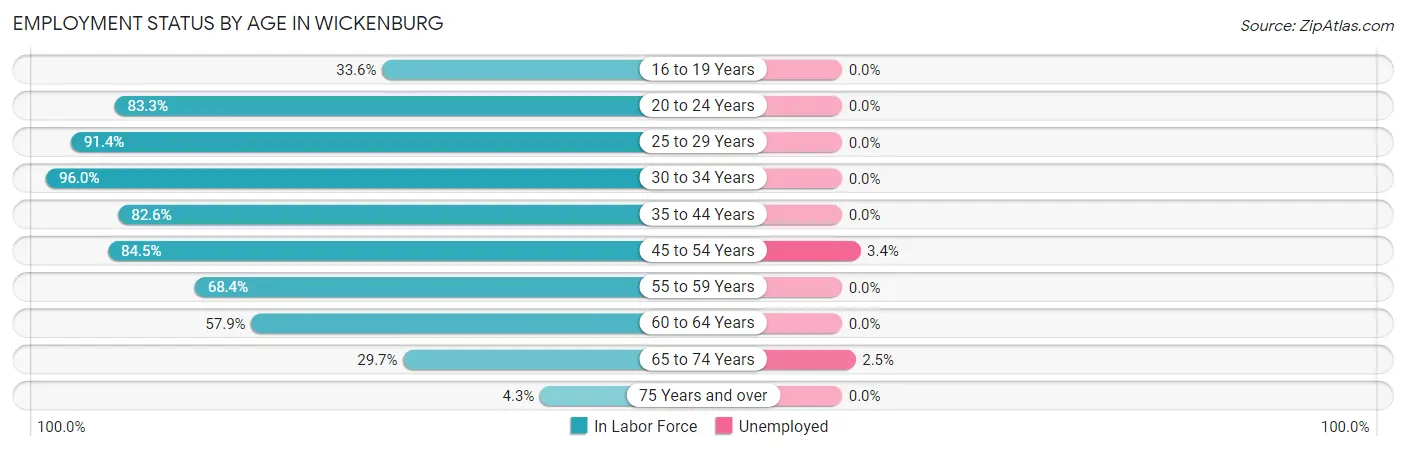
| Age Bracket | In Labor Force | Unemployed |
| 16 to 19 Years | 40 (33.6%) | 0 (0.0%) |
| 20 to 24 Years | 60 (83.3%) | 0 (0.0%) |
| 25 to 29 Years | 128 (91.4%) | 0 (0.0%) |
| 30 to 34 Years | 388 (96.0%) | 0 (0.0%) |
| 35 to 44 Years | 304 (82.6%) | 0 (0.0%) |
| 45 to 54 Years | 469 (84.5%) | 16 (3.4%) |
| 55 to 59 Years | 412 (68.4%) | 0 (0.0%) |
| 60 to 64 Years | 544 (57.9%) | 0 (0.0%) |
| 65 to 74 Years | 610 (29.7%) | 15 (2.5%) |
| 75 Years and over | 67 (4.3%) | 0 (0.0%) |
| Total | 3,024 (44.4%) | 30 (1.0%) |
Employment Status by Educational Attainment in Wickenburg
According to labor force statistics for Wickenburg, 74.6% of individuals (2,245) out of the total population between 25 and 64 years of age (3,009) are in the labor force, with 0.7% or 16 of them being unemployed. The group with the highest labor force participation rate are those with the educational attainment of bachelor's degree or higher, with 78.2% or 679 individuals in the labor force. Within the labor force, individuals with college / associate degree education have the highest percentage of unemployment, with 2.5% or 16 of them being unemployed.
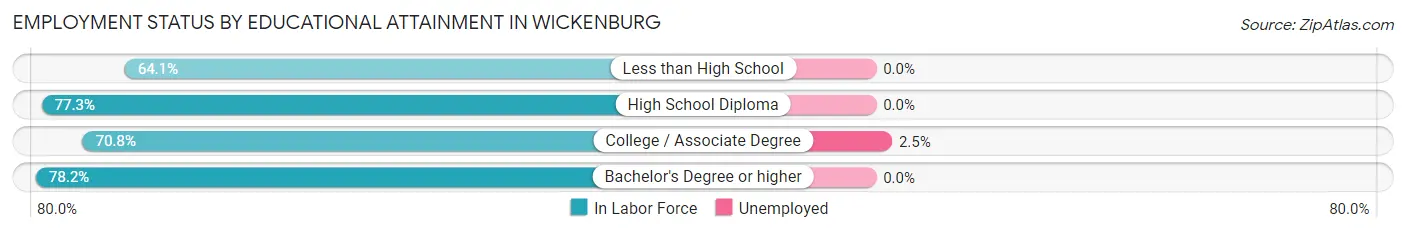
| Educational Attainment | In Labor Force | Unemployed |
| Less than High School | 143 (64.1%) | 0 (0.0%) |
| High School Diploma | 767 (77.3%) | 0 (0.0%) |
| College / Associate Degree | 656 (70.8%) | 23 (2.5%) |
| Bachelor's Degree or higher | 679 (78.2%) | 0 (0.0%) |
| Total | 2,245 (74.6%) | 21 (0.7%) |
Employment Occupations by Sex in Wickenburg
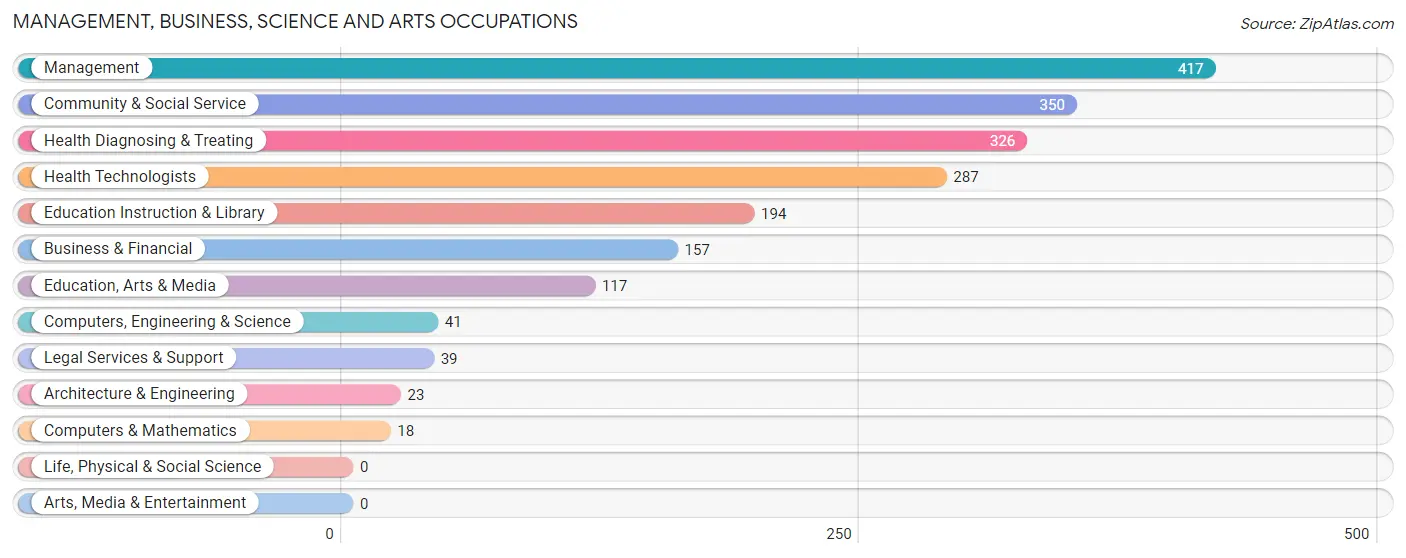
Management, Business, Science and Arts Occupations
The most common Management, Business, Science and Arts occupations in Wickenburg are Management (417 | 14.0%), Community & Social Service (350 | 11.7%), Health Diagnosing & Treating (326 | 10.9%), Health Technologists (287 | 9.6%), and Education Instruction & Library (194 | 6.5%).
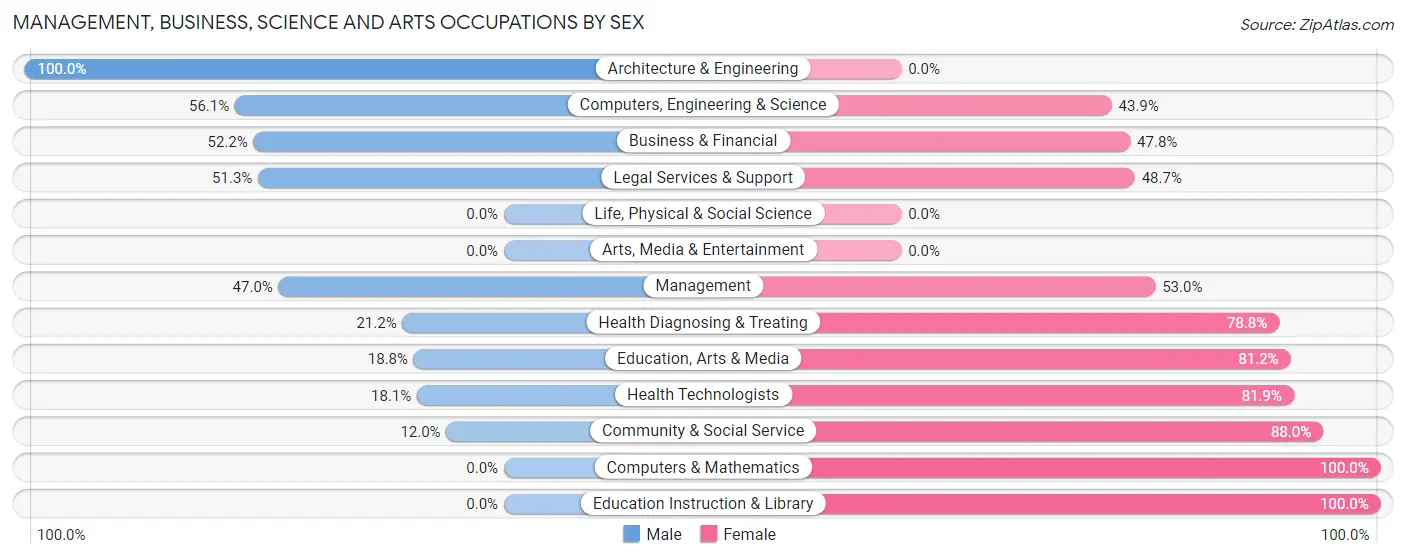
Management, Business, Science and Arts Occupations by Sex
Within the Management, Business, Science and Arts occupations in Wickenburg, the most male-oriented occupations are Architecture & Engineering (100.0%), Computers, Engineering & Science (56.1%), and Business & Financial (52.2%), while the most female-oriented occupations are Computers & Mathematics (100.0%), Education Instruction & Library (100.0%), and Community & Social Service (88.0%).
| Occupation | Male | Female |
| Management | 196 (47.0%) | 221 (53.0%) |
| Business & Financial | 82 (52.2%) | 75 (47.8%) |
| Computers, Engineering & Science | 23 (56.1%) | 18 (43.9%) |
| Computers & Mathematics | 0 (0.0%) | 18 (100.0%) |
| Architecture & Engineering | 23 (100.0%) | 0 (0.0%) |
| Life, Physical & Social Science | 0 (0.0%) | 0 (0.0%) |
| Community & Social Service | 42 (12.0%) | 308 (88.0%) |
| Education, Arts & Media | 22 (18.8%) | 95 (81.2%) |
| Legal Services & Support | 20 (51.3%) | 19 (48.7%) |
| Education Instruction & Library | 0 (0.0%) | 194 (100.0%) |
| Arts, Media & Entertainment | 0 (0.0%) | 0 (0.0%) |
| Health Diagnosing & Treating | 69 (21.2%) | 257 (78.8%) |
| Health Technologists | 52 (18.1%) | 235 (81.9%) |
| Total (Category) | 412 (31.9%) | 879 (68.1%) |
| Total (Overall) | 1,289 (43.1%) | 1,698 (56.9%) |
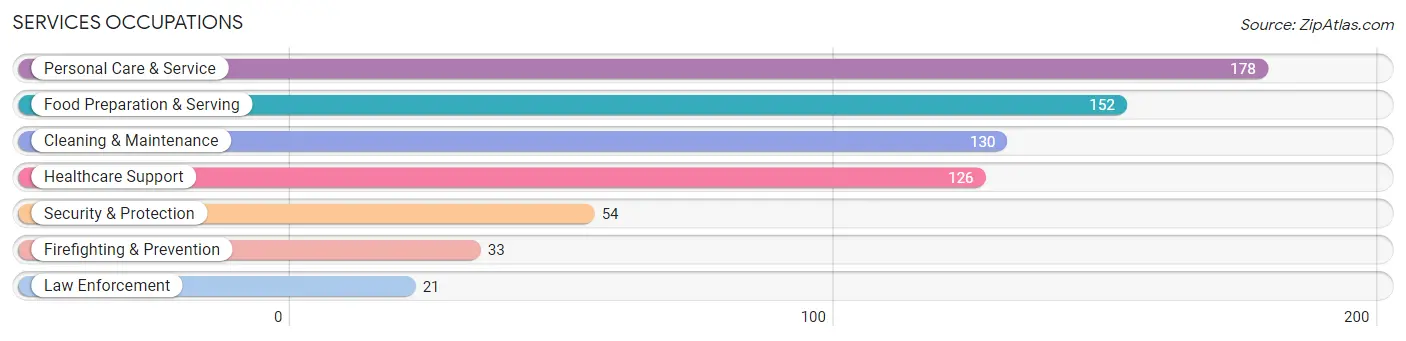
Services Occupations
The most common Services occupations in Wickenburg are Personal Care & Service (178 | 6.0%), Food Preparation & Serving (152 | 5.1%), Cleaning & Maintenance (130 | 4.3%), Healthcare Support (126 | 4.2%), and Security & Protection (54 | 1.8%).
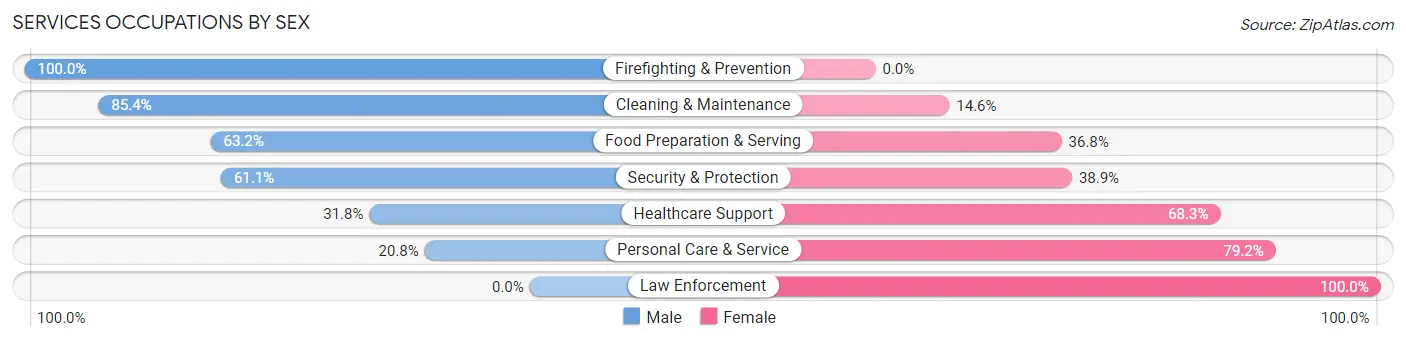
Services Occupations by Sex
Within the Services occupations in Wickenburg, the most male-oriented occupations are Firefighting & Prevention (100.0%), Cleaning & Maintenance (85.4%), and Food Preparation & Serving (63.2%), while the most female-oriented occupations are Law Enforcement (100.0%), Personal Care & Service (79.2%), and Healthcare Support (68.2%).
| Occupation | Male | Female |
| Healthcare Support | 40 (31.8%) | 86 (68.2%) |
| Security & Protection | 33 (61.1%) | 21 (38.9%) |
| Firefighting & Prevention | 33 (100.0%) | 0 (0.0%) |
| Law Enforcement | 0 (0.0%) | 21 (100.0%) |
| Food Preparation & Serving | 96 (63.2%) | 56 (36.8%) |
| Cleaning & Maintenance | 111 (85.4%) | 19 (14.6%) |
| Personal Care & Service | 37 (20.8%) | 141 (79.2%) |
| Total (Category) | 317 (49.5%) | 323 (50.5%) |
| Total (Overall) | 1,289 (43.1%) | 1,698 (56.9%) |
Sales and Office Occupations
The most common Sales and Office occupations in Wickenburg are Sales & Related (310 | 10.4%), and Office & Administration (253 | 8.5%).
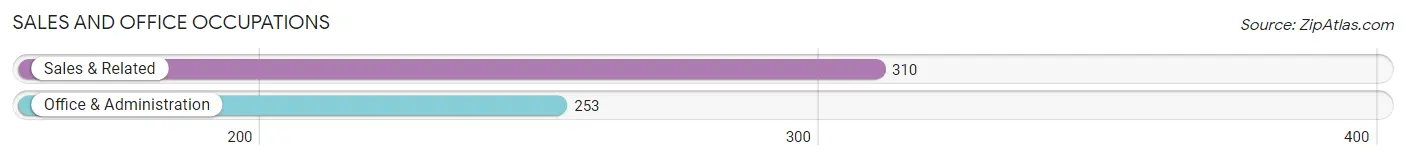
Sales and Office Occupations by Sex
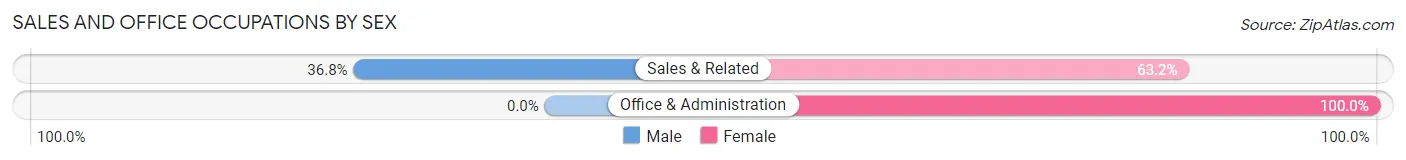
| Occupation | Male | Female |
| Sales & Related | 114 (36.8%) | 196 (63.2%) |
| Office & Administration | 0 (0.0%) | 253 (100.0%) |
| Total (Category) | 114 (20.3%) | 449 (79.7%) |
| Total (Overall) | 1,289 (43.1%) | 1,698 (56.9%) |
Natural Resources, Construction and Maintenance Occupations
The most common Natural Resources, Construction and Maintenance occupations in Wickenburg are Construction & Extraction (314 | 10.5%), and Installation, Maintenance & Repair (49 | 1.6%).
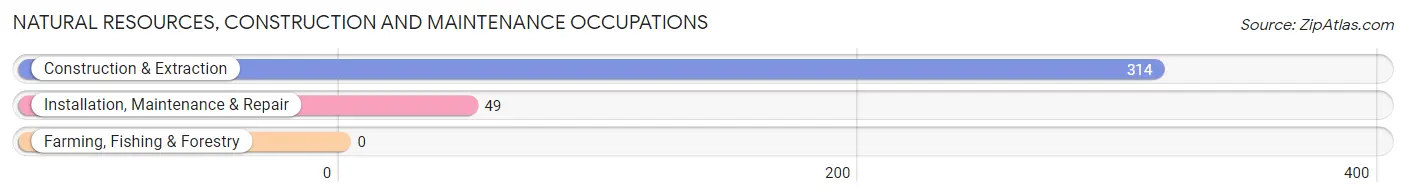
Natural Resources, Construction and Maintenance Occupations by Sex
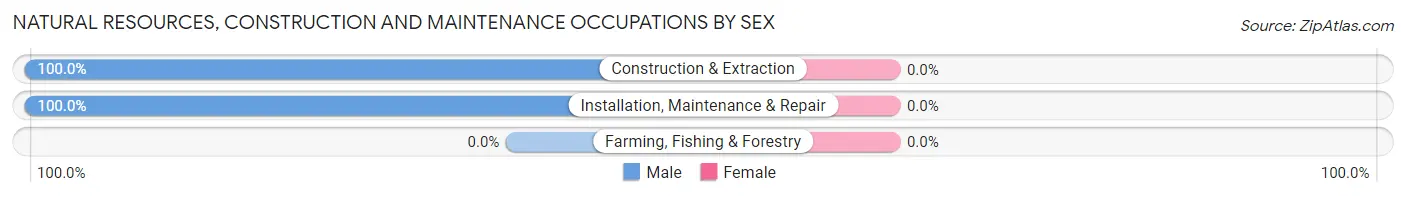
| Occupation | Male | Female |
| Farming, Fishing & Forestry | 0 (0.0%) | 0 (0.0%) |
| Construction & Extraction | 314 (100.0%) | 0 (0.0%) |
| Installation, Maintenance & Repair | 49 (100.0%) | 0 (0.0%) |
| Total (Category) | 363 (100.0%) | 0 (0.0%) |
| Total (Overall) | 1,289 (43.1%) | 1,698 (56.9%) |
Production, Transportation and Moving Occupations
The most common Production, Transportation and Moving occupations in Wickenburg are Transportation (51 | 1.7%), Production (40 | 1.3%), and Material Moving (39 | 1.3%).
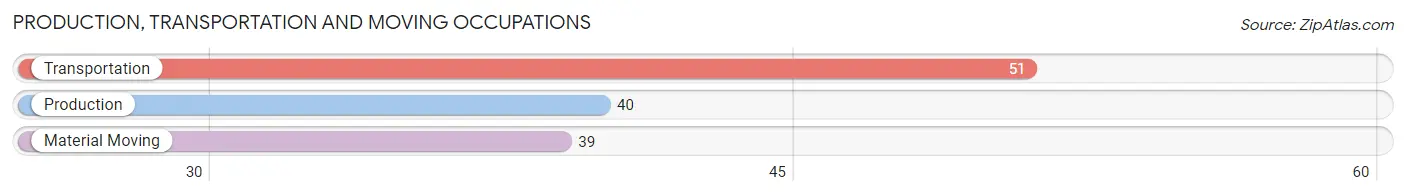
Production, Transportation and Moving Occupations by Sex
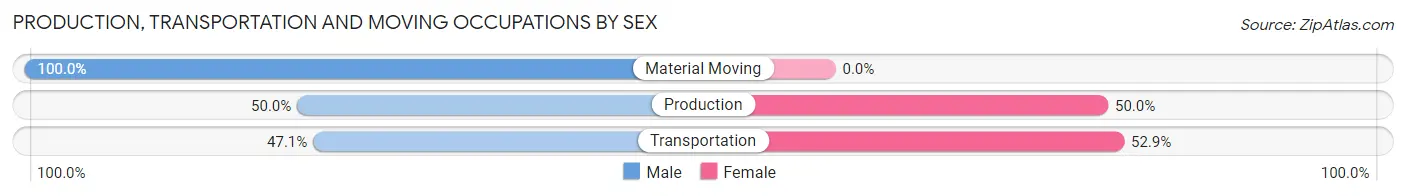
| Occupation | Male | Female |
| Production | 20 (50.0%) | 20 (50.0%) |
| Transportation | 24 (47.1%) | 27 (52.9%) |
| Material Moving | 39 (100.0%) | 0 (0.0%) |
| Total (Category) | 83 (63.8%) | 47 (36.1%) |
| Total (Overall) | 1,289 (43.1%) | 1,698 (56.9%) |
Employment Industries by Sex in Wickenburg
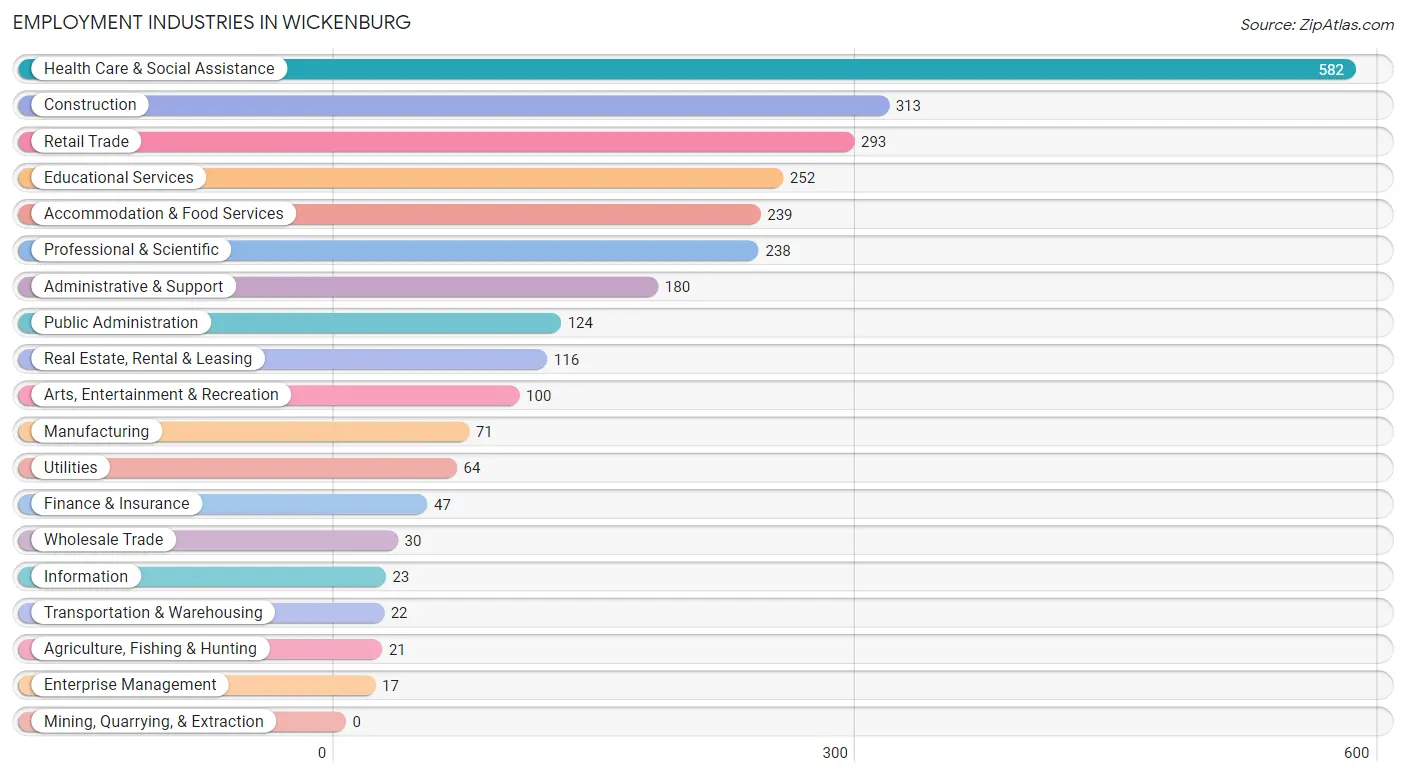
Employment Industries in Wickenburg
The major employment industries in Wickenburg include Health Care & Social Assistance (582 | 19.5%), Construction (313 | 10.5%), Retail Trade (293 | 9.8%), Educational Services (252 | 8.4%), and Accommodation & Food Services (239 | 8.0%).
Employment Industries by Sex in Wickenburg
The Wickenburg industries that see more men than women are Information (100.0%), Construction (94.9%), and Arts, Entertainment & Recreation (74.0%), whereas the industries that tend to have a higher number of women are Agriculture, Fishing & Hunting (100.0%), Wholesale Trade (100.0%), and Transportation & Warehousing (100.0%).
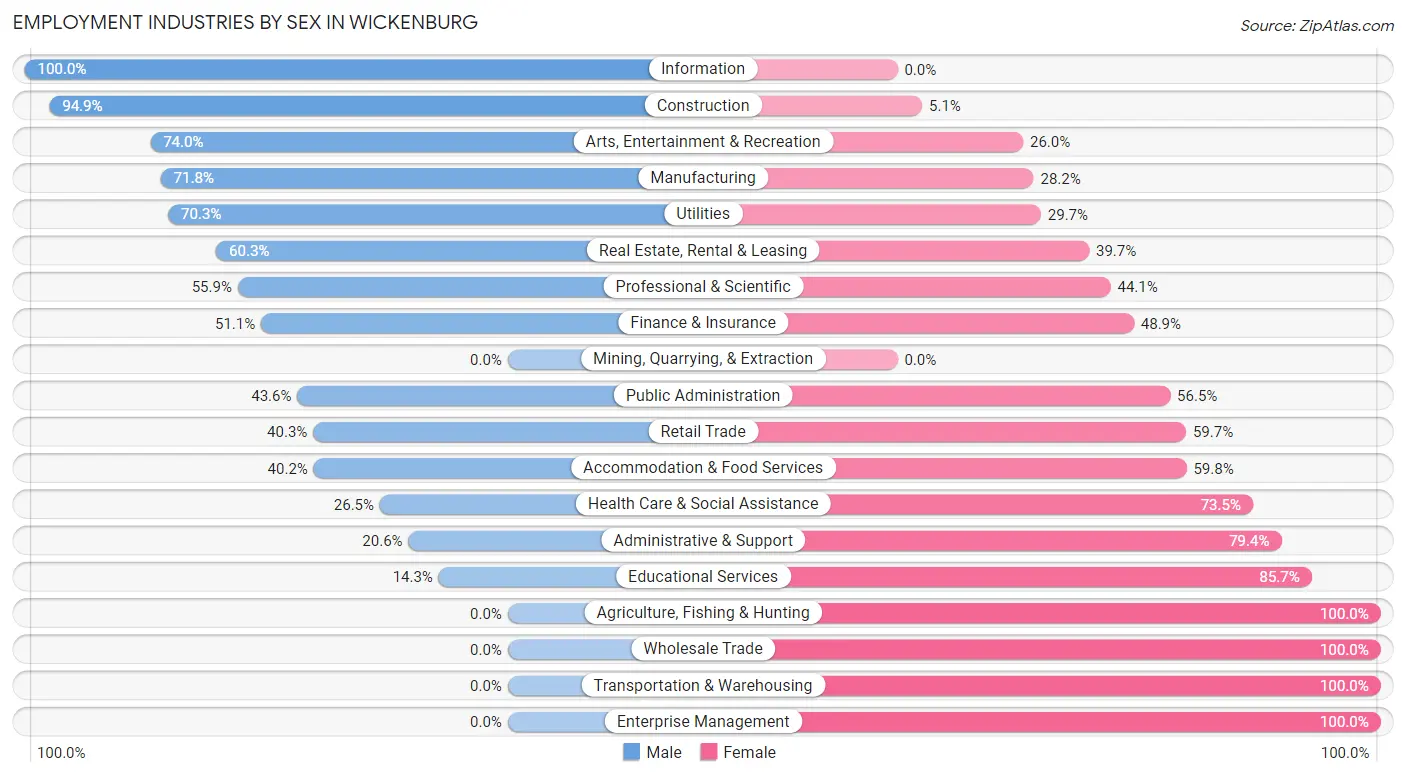
| Industry | Male | Female |
| Agriculture, Fishing & Hunting | 0 (0.0%) | 21 (100.0%) |
| Mining, Quarrying, & Extraction | 0 (0.0%) | 0 (0.0%) |
| Construction | 297 (94.9%) | 16 (5.1%) |
| Manufacturing | 51 (71.8%) | 20 (28.2%) |
| Wholesale Trade | 0 (0.0%) | 30 (100.0%) |
| Retail Trade | 118 (40.3%) | 175 (59.7%) |
| Transportation & Warehousing | 0 (0.0%) | 22 (100.0%) |
| Utilities | 45 (70.3%) | 19 (29.7%) |
| Information | 23 (100.0%) | 0 (0.0%) |
| Finance & Insurance | 24 (51.1%) | 23 (48.9%) |
| Real Estate, Rental & Leasing | 70 (60.3%) | 46 (39.7%) |
| Professional & Scientific | 133 (55.9%) | 105 (44.1%) |
| Enterprise Management | 0 (0.0%) | 17 (100.0%) |
| Administrative & Support | 37 (20.6%) | 143 (79.4%) |
| Educational Services | 36 (14.3%) | 216 (85.7%) |
| Health Care & Social Assistance | 154 (26.5%) | 428 (73.5%) |
| Arts, Entertainment & Recreation | 74 (74.0%) | 26 (26.0%) |
| Accommodation & Food Services | 96 (40.2%) | 143 (59.8%) |
| Public Administration | 54 (43.5%) | 70 (56.5%) |
| Total | 1,289 (43.1%) | 1,698 (56.9%) |
Education in Wickenburg
School Enrollment in Wickenburg
The most common levels of schooling among the 818 students in Wickenburg are middle school (259 | 31.7%), high school (236 | 28.8%), and elementary school (122 | 14.9%).
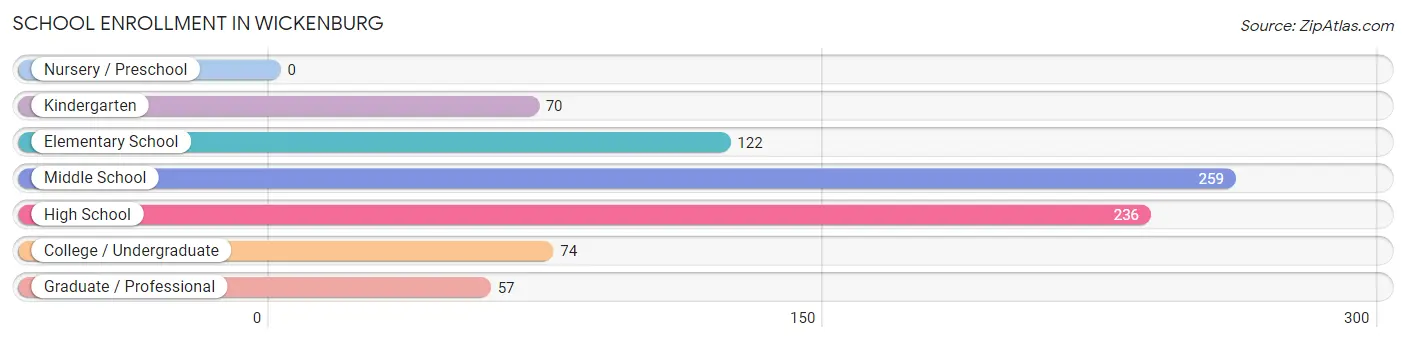
| School Level | # Students | % Students |
| Nursery / Preschool | 0 | 0.0% |
| Kindergarten | 70 | 8.6% |
| Elementary School | 122 | 14.9% |
| Middle School | 259 | 31.7% |
| High School | 236 | 28.8% |
| College / Undergraduate | 74 | 9.0% |
| Graduate / Professional | 57 | 7.0% |
| Total | 818 | 100.0% |
School Enrollment by Age by Funding Source in Wickenburg
Out of a total of 818 students who are enrolled in schools in Wickenburg, 136 (16.6%) attend a private institution, while the remaining 682 (83.4%) are enrolled in public schools. The age group of 35 years and over has the highest likelihood of being enrolled in private schools, with 65 (75.6% in the age bracket) enrolled. Conversely, the age group of 5 to 9 year old has the lowest likelihood of being enrolled in a private school, with 170 (100.0% in the age bracket) attending a public institution.
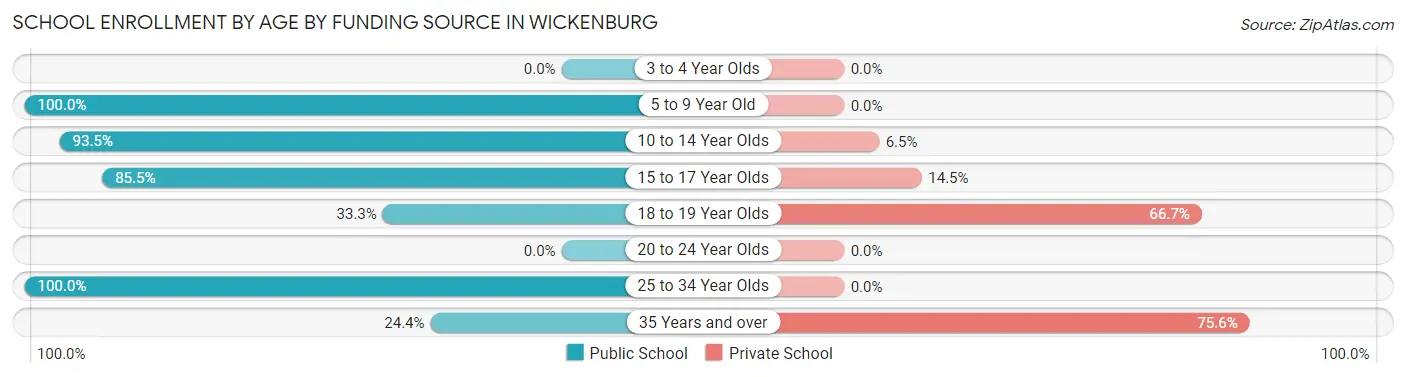
| Age Bracket | Public School | Private School |
| 3 to 4 Year Olds | 0 (0.0%) | 0 (0.0%) |
| 5 to 9 Year Old | 170 (100.0%) | 0 (0.0%) |
| 10 to 14 Year Olds | 329 (93.5%) | 23 (6.5%) |
| 15 to 17 Year Olds | 130 (85.5%) | 22 (14.5%) |
| 18 to 19 Year Olds | 13 (33.3%) | 26 (66.7%) |
| 20 to 24 Year Olds | 0 (0.0%) | 0 (0.0%) |
| 25 to 34 Year Olds | 19 (100.0%) | 0 (0.0%) |
| 35 Years and over | 21 (24.4%) | 65 (75.6%) |
| Total | 682 (83.4%) | 136 (16.6%) |
Educational Attainment by Field of Study in Wickenburg
Education (581 | 27.2%), business (440 | 20.6%), science & technology (328 | 15.4%), social sciences (172 | 8.1%), and liberal arts & history (114 | 5.3%) are the most common fields of study among 2,134 individuals in Wickenburg who have obtained a bachelor's degree or higher.
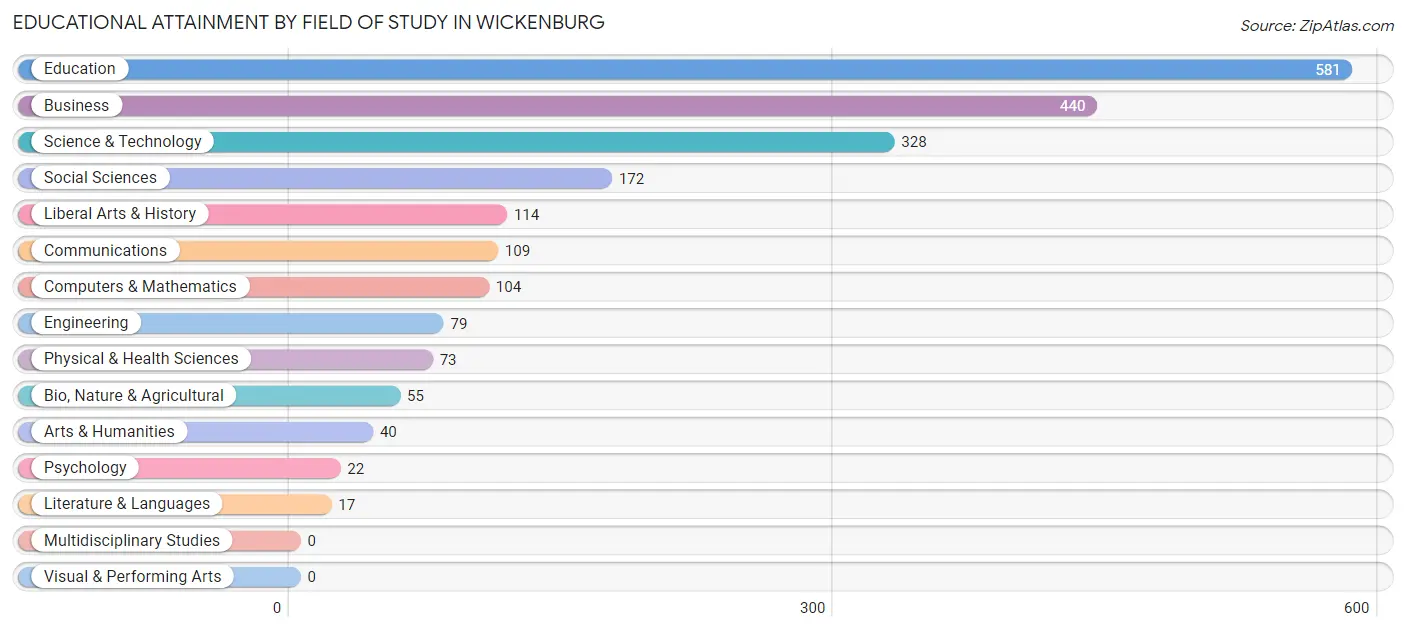
| Field of Study | # Graduates | % Graduates |
| Computers & Mathematics | 104 | 4.9% |
| Bio, Nature & Agricultural | 55 | 2.6% |
| Physical & Health Sciences | 73 | 3.4% |
| Psychology | 22 | 1.0% |
| Social Sciences | 172 | 8.1% |
| Engineering | 79 | 3.7% |
| Multidisciplinary Studies | 0 | 0.0% |
| Science & Technology | 328 | 15.4% |
| Business | 440 | 20.6% |
| Education | 581 | 27.2% |
| Literature & Languages | 17 | 0.8% |
| Liberal Arts & History | 114 | 5.3% |
| Visual & Performing Arts | 0 | 0.0% |
| Communications | 109 | 5.1% |
| Arts & Humanities | 40 | 1.9% |
| Total | 2,134 | 100.0% |
Transportation & Commute in Wickenburg
Vehicle Availability by Sex in Wickenburg
The most prevalent vehicle ownership categories in Wickenburg are males with 2 vehicles (396, accounting for 30.7%) and females with 2 vehicles (477, making up 23.4%).
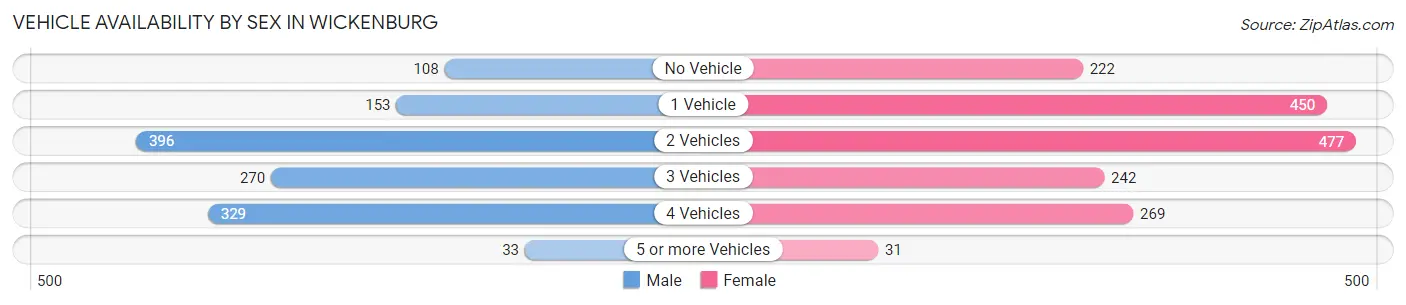
| Vehicles Available | Male | Female |
| No Vehicle | 108 (8.4%) | 222 (13.1%) |
| 1 Vehicle | 153 (11.9%) | 450 (26.6%) |
| 2 Vehicles | 396 (30.7%) | 477 (28.2%) |
| 3 Vehicles | 270 (20.9%) | 242 (14.3%) |
| 4 Vehicles | 329 (25.5%) | 269 (15.9%) |
| 5 or more Vehicles | 33 (2.6%) | 31 (1.8%) |
| Total | 1,289 (100.0%) | 1,691 (100.0%) |
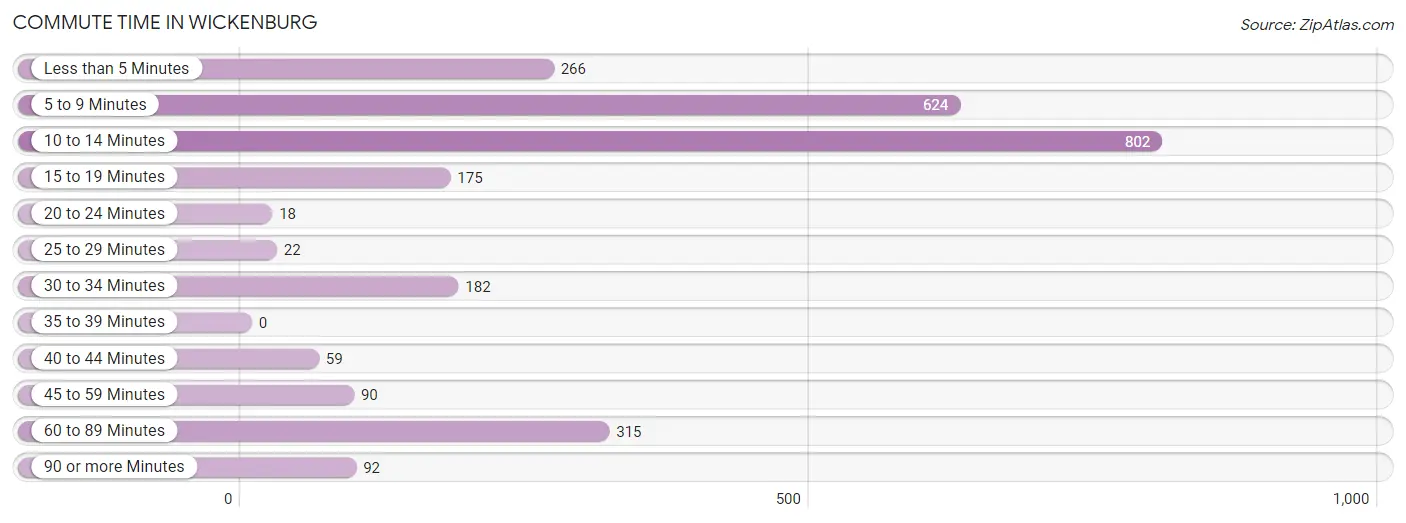
Commute Time in Wickenburg
The most frequently occuring commute durations in Wickenburg are 10 to 14 minutes (802 commuters, 30.3%), 5 to 9 minutes (624 commuters, 23.6%), and 60 to 89 minutes (315 commuters, 11.9%).
| Commute Time | # Commuters | % Commuters |
| Less than 5 Minutes | 266 | 10.1% |
| 5 to 9 Minutes | 624 | 23.6% |
| 10 to 14 Minutes | 802 | 30.3% |
| 15 to 19 Minutes | 175 | 6.6% |
| 20 to 24 Minutes | 18 | 0.7% |
| 25 to 29 Minutes | 22 | 0.8% |
| 30 to 34 Minutes | 182 | 6.9% |
| 35 to 39 Minutes | 0 | 0.0% |
| 40 to 44 Minutes | 59 | 2.2% |
| 45 to 59 Minutes | 90 | 3.4% |
| 60 to 89 Minutes | 315 | 11.9% |
| 90 or more Minutes | 92 | 3.5% |
Commute Time by Sex in Wickenburg
The most common commute times in Wickenburg are 10 to 14 minutes (400 commuters, 32.9%) for males and 10 to 14 minutes (402 commuters, 28.1%) for females.
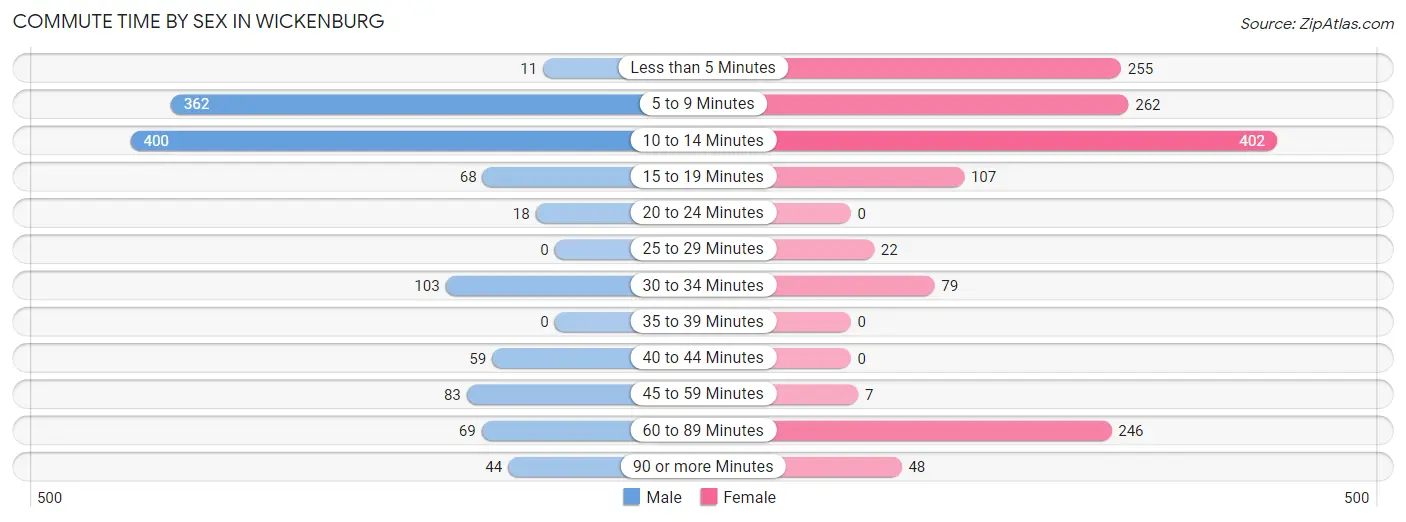
| Commute Time | Male | Female |
| Less than 5 Minutes | 11 (0.9%) | 255 (17.9%) |
| 5 to 9 Minutes | 362 (29.7%) | 262 (18.3%) |
| 10 to 14 Minutes | 400 (32.9%) | 402 (28.1%) |
| 15 to 19 Minutes | 68 (5.6%) | 107 (7.5%) |
| 20 to 24 Minutes | 18 (1.5%) | 0 (0.0%) |
| 25 to 29 Minutes | 0 (0.0%) | 22 (1.5%) |
| 30 to 34 Minutes | 103 (8.5%) | 79 (5.5%) |
| 35 to 39 Minutes | 0 (0.0%) | 0 (0.0%) |
| 40 to 44 Minutes | 59 (4.9%) | 0 (0.0%) |
| 45 to 59 Minutes | 83 (6.8%) | 7 (0.5%) |
| 60 to 89 Minutes | 69 (5.7%) | 246 (17.2%) |
| 90 or more Minutes | 44 (3.6%) | 48 (3.4%) |
Time of Departure to Work by Sex in Wickenburg
The most frequent times of departure to work in Wickenburg are 5:00 AM to 5:29 AM (185, 15.2%) for males and 6:30 AM to 6:59 AM (260, 18.2%) for females.
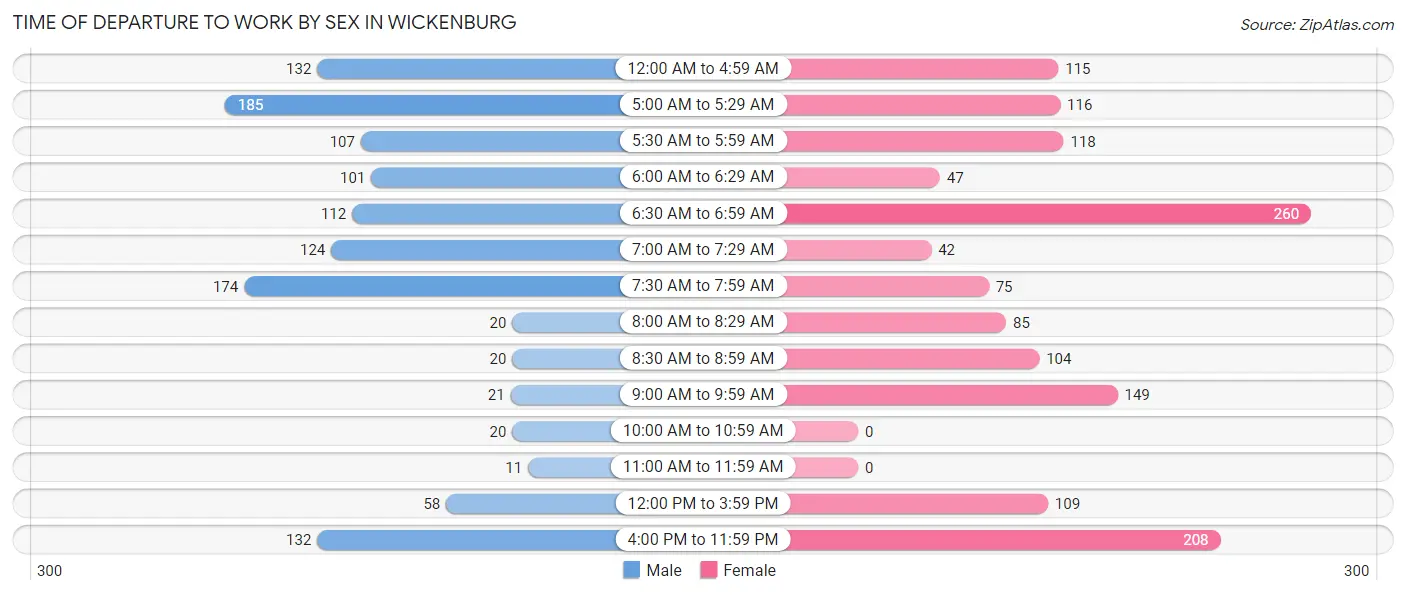
| Time of Departure | Male | Female |
| 12:00 AM to 4:59 AM | 132 (10.8%) | 115 (8.1%) |
| 5:00 AM to 5:29 AM | 185 (15.2%) | 116 (8.1%) |
| 5:30 AM to 5:59 AM | 107 (8.8%) | 118 (8.3%) |
| 6:00 AM to 6:29 AM | 101 (8.3%) | 47 (3.3%) |
| 6:30 AM to 6:59 AM | 112 (9.2%) | 260 (18.2%) |
| 7:00 AM to 7:29 AM | 124 (10.2%) | 42 (2.9%) |
| 7:30 AM to 7:59 AM | 174 (14.3%) | 75 (5.2%) |
| 8:00 AM to 8:29 AM | 20 (1.6%) | 85 (5.9%) |
| 8:30 AM to 8:59 AM | 20 (1.6%) | 104 (7.3%) |
| 9:00 AM to 9:59 AM | 21 (1.7%) | 149 (10.4%) |
| 10:00 AM to 10:59 AM | 20 (1.6%) | 0 (0.0%) |
| 11:00 AM to 11:59 AM | 11 (0.9%) | 0 (0.0%) |
| 12:00 PM to 3:59 PM | 58 (4.8%) | 109 (7.6%) |
| 4:00 PM to 11:59 PM | 132 (10.8%) | 208 (14.6%) |
| Total | 1,217 (100.0%) | 1,428 (100.0%) |
Housing Occupancy in Wickenburg
Occupancy by Ownership in Wickenburg
Of the total 3,825 dwellings in Wickenburg, owner-occupied units account for 3,034 (79.3%), while renter-occupied units make up 791 (20.7%).
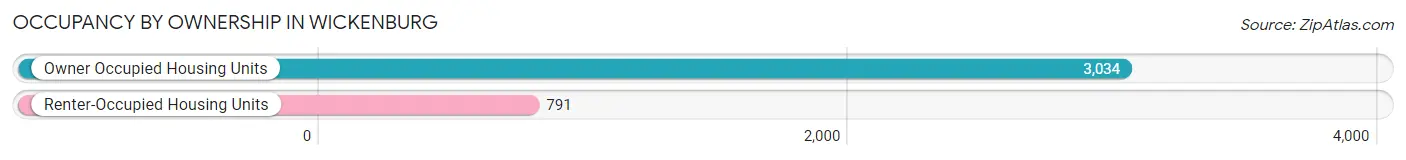
| Occupancy | # Housing Units | % Housing Units |
| Owner Occupied Housing Units | 3,034 | 79.3% |
| Renter-Occupied Housing Units | 791 | 20.7% |
| Total Occupied Housing Units | 3,825 | 100.0% |
Occupancy by Household Size in Wickenburg
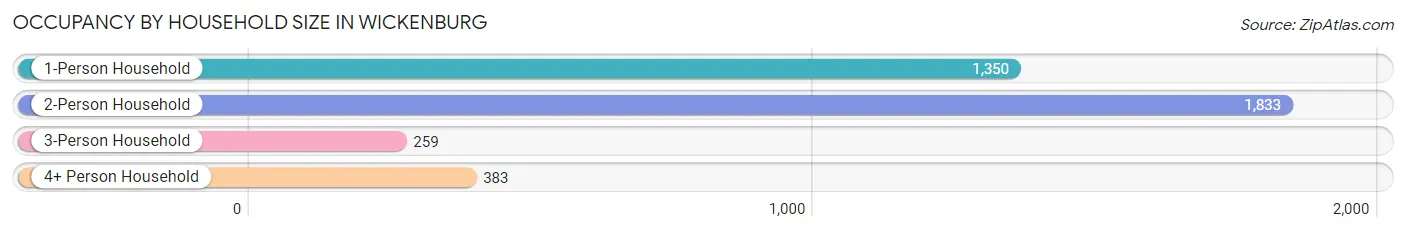
| Household Size | # Housing Units | % Housing Units |
| 1-Person Household | 1,350 | 35.3% |
| 2-Person Household | 1,833 | 47.9% |
| 3-Person Household | 259 | 6.8% |
| 4+ Person Household | 383 | 10.0% |
| Total Housing Units | 3,825 | 100.0% |
Occupancy by Ownership by Household Size in Wickenburg
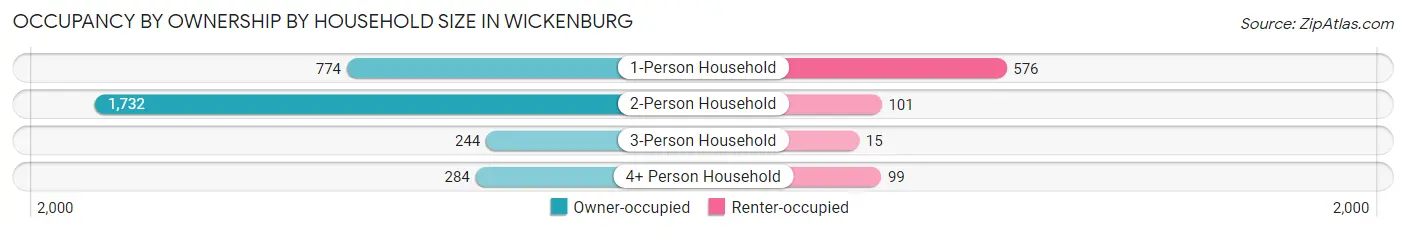
| Household Size | Owner-occupied | Renter-occupied |
| 1-Person Household | 774 (57.3%) | 576 (42.7%) |
| 2-Person Household | 1,732 (94.5%) | 101 (5.5%) |
| 3-Person Household | 244 (94.2%) | 15 (5.8%) |
| 4+ Person Household | 284 (74.2%) | 99 (25.9%) |
| Total Housing Units | 3,034 (79.3%) | 791 (20.7%) |
Occupancy by Educational Attainment in Wickenburg
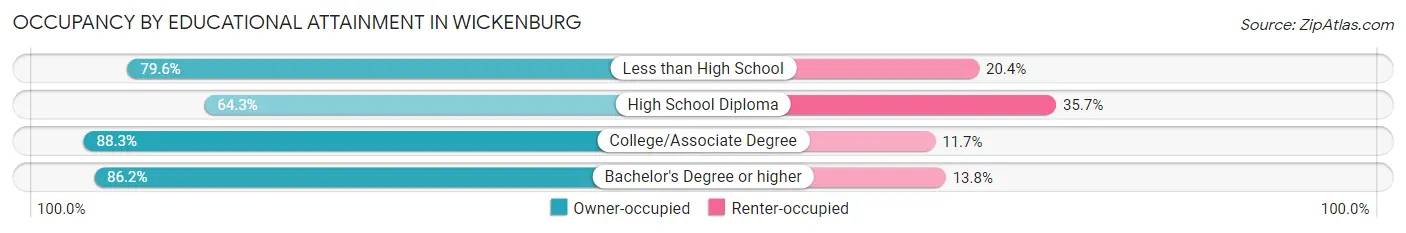
| Household Size | Owner-occupied | Renter-occupied |
| Less than High School | 121 (79.6%) | 31 (20.4%) |
| High School Diploma | 821 (64.3%) | 455 (35.7%) |
| College/Associate Degree | 1,092 (88.3%) | 145 (11.7%) |
| Bachelor's Degree or higher | 1,000 (86.2%) | 160 (13.8%) |
Occupancy by Age of Householder in Wickenburg
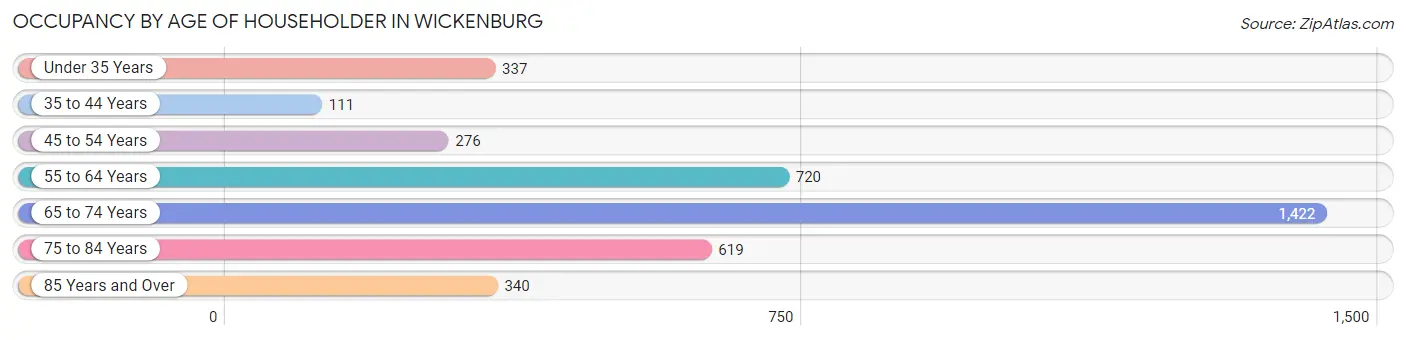
| Age Bracket | # Households | % Households |
| Under 35 Years | 337 | 8.8% |
| 35 to 44 Years | 111 | 2.9% |
| 45 to 54 Years | 276 | 7.2% |
| 55 to 64 Years | 720 | 18.8% |
| 65 to 74 Years | 1,422 | 37.2% |
| 75 to 84 Years | 619 | 16.2% |
| 85 Years and Over | 340 | 8.9% |
| Total | 3,825 | 100.0% |
Housing Finances in Wickenburg
Median Income by Occupancy in Wickenburg
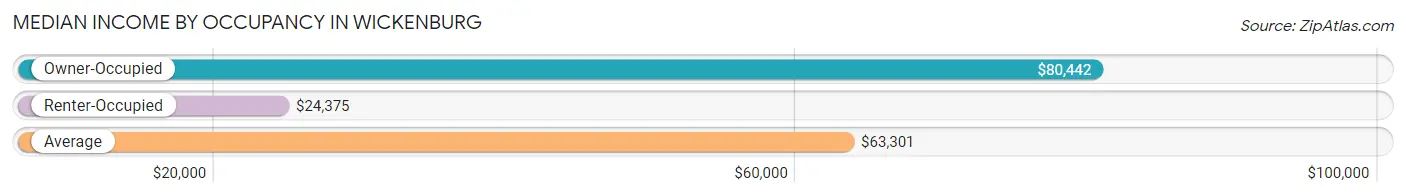
| Occupancy Type | # Households | Median Income |
| Owner-Occupied | 3,034 (79.3%) | $80,442 |
| Renter-Occupied | 791 (20.7%) | $24,375 |
| Average | 3,825 (100.0%) | $63,301 |
Occupancy by Householder Income Bracket in Wickenburg
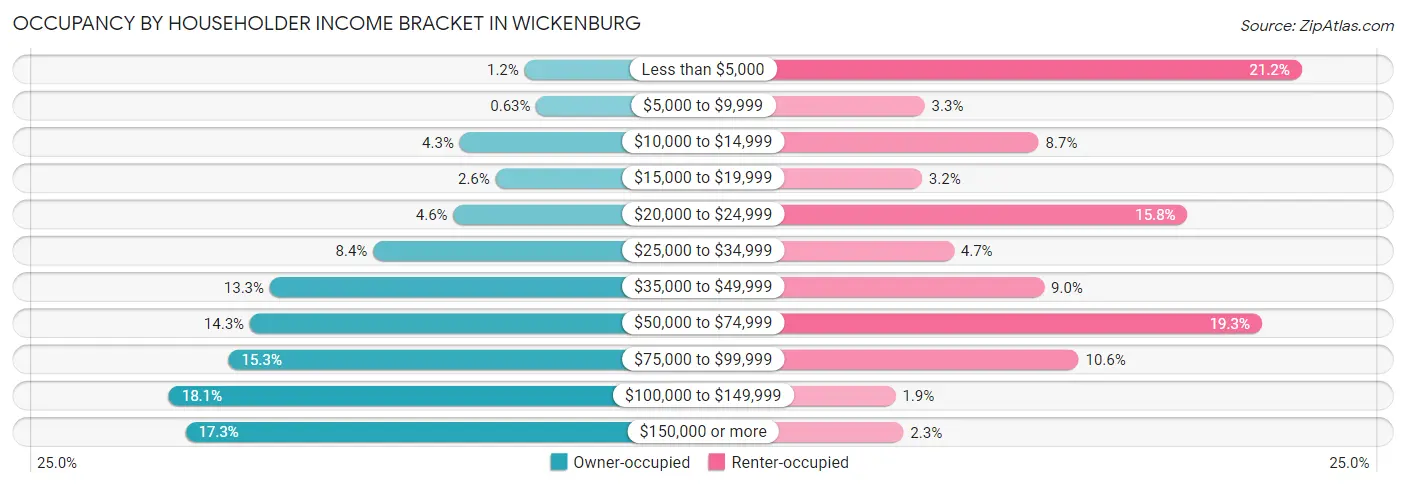
| Income Bracket | Owner-occupied | Renter-occupied |
| Less than $5,000 | 36 (1.2%) | 168 (21.2%) |
| $5,000 to $9,999 | 19 (0.6%) | 26 (3.3%) |
| $10,000 to $14,999 | 130 (4.3%) | 69 (8.7%) |
| $15,000 to $19,999 | 78 (2.6%) | 25 (3.2%) |
| $20,000 to $24,999 | 139 (4.6%) | 125 (15.8%) |
| $25,000 to $34,999 | 255 (8.4%) | 37 (4.7%) |
| $35,000 to $49,999 | 404 (13.3%) | 71 (9.0%) |
| $50,000 to $74,999 | 433 (14.3%) | 153 (19.3%) |
| $75,000 to $99,999 | 464 (15.3%) | 84 (10.6%) |
| $100,000 to $149,999 | 550 (18.1%) | 15 (1.9%) |
| $150,000 or more | 526 (17.3%) | 18 (2.3%) |
| Total | 3,034 (100.0%) | 791 (100.0%) |
Monthly Housing Cost Tiers in Wickenburg
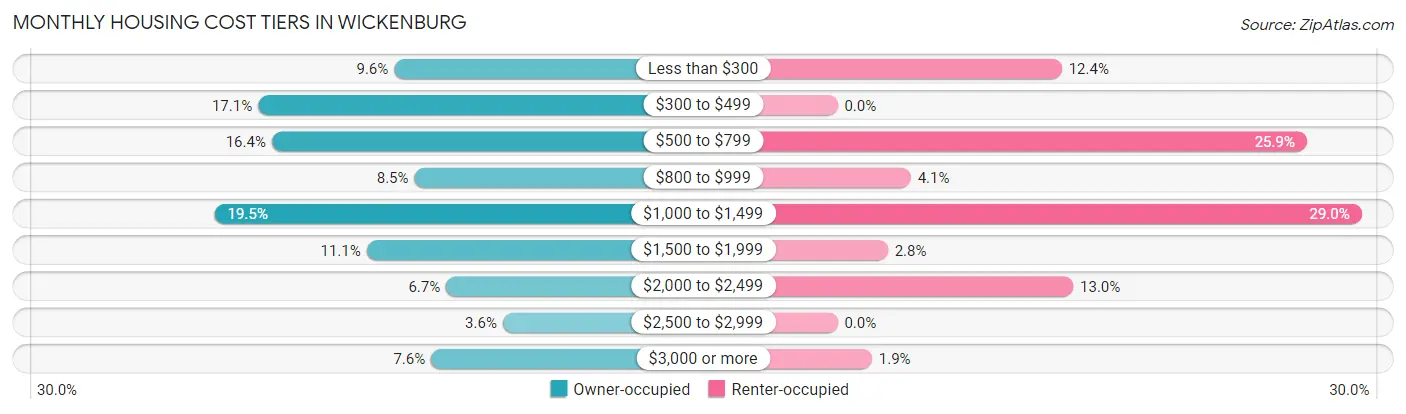
| Monthly Cost | Owner-occupied | Renter-occupied |
| Less than $300 | 291 (9.6%) | 98 (12.4%) |
| $300 to $499 | 519 (17.1%) | 0 (0.0%) |
| $500 to $799 | 496 (16.4%) | 205 (25.9%) |
| $800 to $999 | 257 (8.5%) | 32 (4.1%) |
| $1,000 to $1,499 | 592 (19.5%) | 229 (28.9%) |
| $1,500 to $1,999 | 337 (11.1%) | 22 (2.8%) |
| $2,000 to $2,499 | 204 (6.7%) | 103 (13.0%) |
| $2,500 to $2,999 | 109 (3.6%) | 0 (0.0%) |
| $3,000 or more | 229 (7.5%) | 15 (1.9%) |
| Total | 3,034 (100.0%) | 791 (100.0%) |
Physical Housing Characteristics in Wickenburg
Housing Structures in Wickenburg
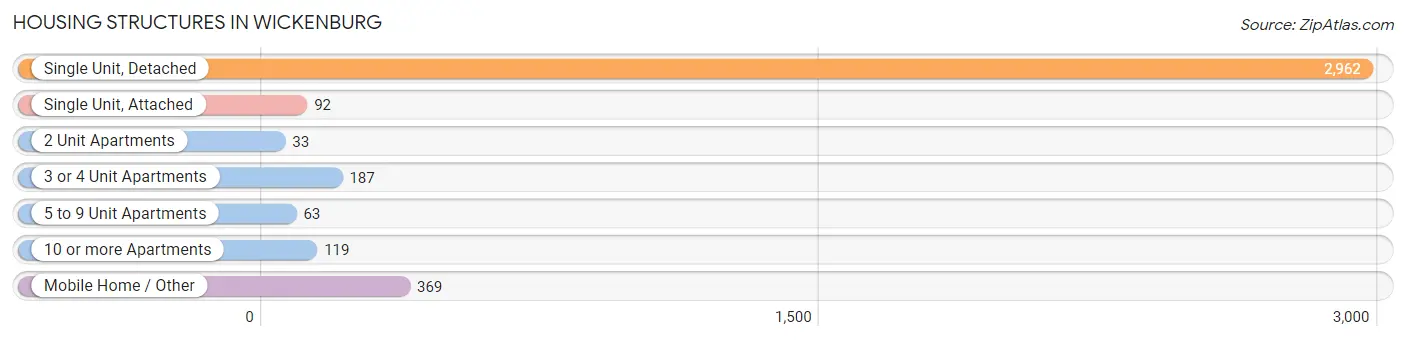
| Structure Type | # Housing Units | % Housing Units |
| Single Unit, Detached | 2,962 | 77.4% |
| Single Unit, Attached | 92 | 2.4% |
| 2 Unit Apartments | 33 | 0.9% |
| 3 or 4 Unit Apartments | 187 | 4.9% |
| 5 to 9 Unit Apartments | 63 | 1.7% |
| 10 or more Apartments | 119 | 3.1% |
| Mobile Home / Other | 369 | 9.7% |
| Total | 3,825 | 100.0% |
Housing Structures by Occupancy in Wickenburg
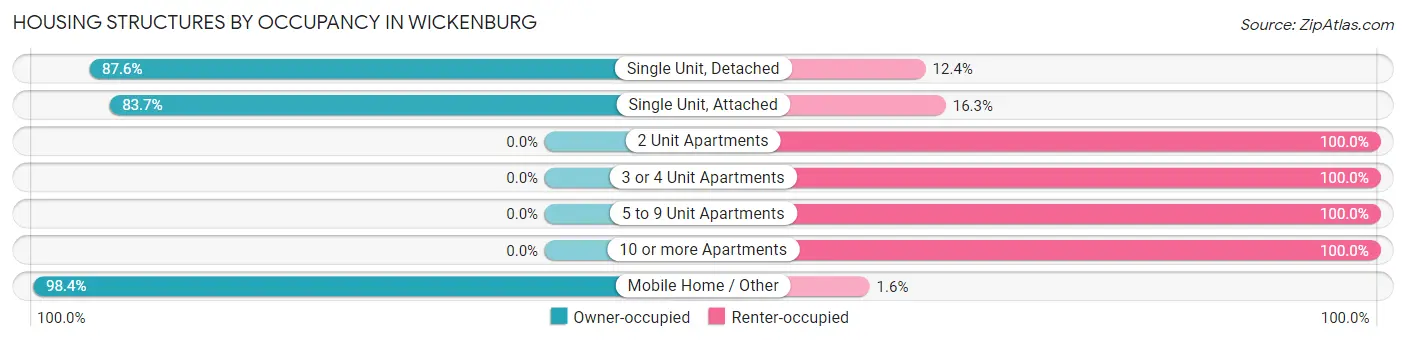
| Structure Type | Owner-occupied | Renter-occupied |
| Single Unit, Detached | 2,594 (87.6%) | 368 (12.4%) |
| Single Unit, Attached | 77 (83.7%) | 15 (16.3%) |
| 2 Unit Apartments | 0 (0.0%) | 33 (100.0%) |
| 3 or 4 Unit Apartments | 0 (0.0%) | 187 (100.0%) |
| 5 to 9 Unit Apartments | 0 (0.0%) | 63 (100.0%) |
| 10 or more Apartments | 0 (0.0%) | 119 (100.0%) |
| Mobile Home / Other | 363 (98.4%) | 6 (1.6%) |
| Total | 3,034 (79.3%) | 791 (20.7%) |
Housing Structures by Number of Rooms in Wickenburg
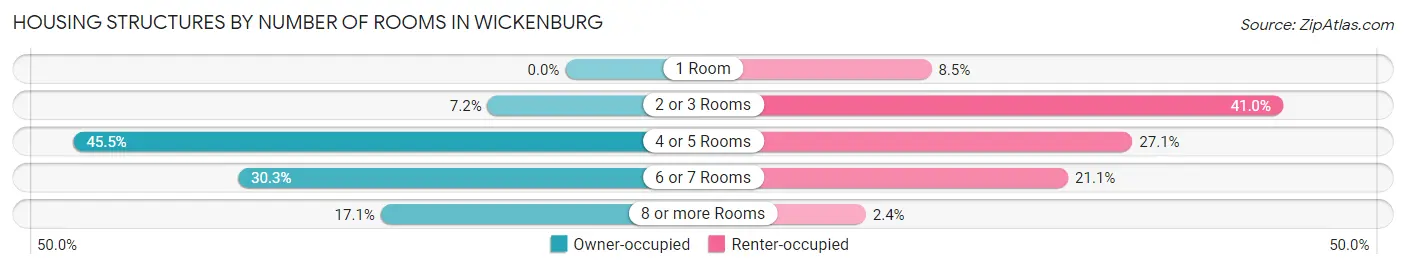
| Number of Rooms | Owner-occupied | Renter-occupied |
| 1 Room | 0 (0.0%) | 67 (8.5%) |
| 2 or 3 Rooms | 218 (7.2%) | 324 (41.0%) |
| 4 or 5 Rooms | 1,380 (45.5%) | 214 (27.1%) |
| 6 or 7 Rooms | 918 (30.3%) | 167 (21.1%) |
| 8 or more Rooms | 518 (17.1%) | 19 (2.4%) |
| Total | 3,034 (100.0%) | 791 (100.0%) |
Housing Structure by Heating Type in Wickenburg
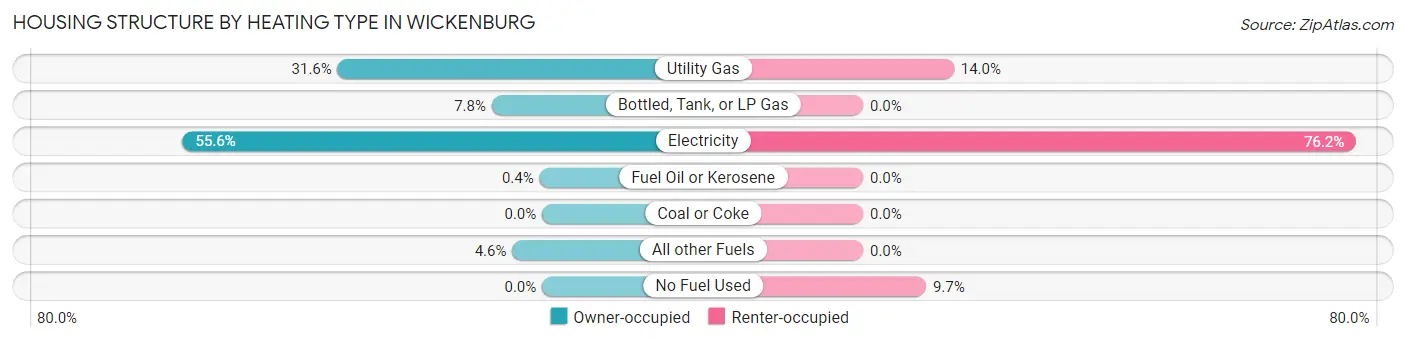
| Heating Type | Owner-occupied | Renter-occupied |
| Utility Gas | 959 (31.6%) | 111 (14.0%) |
| Bottled, Tank, or LP Gas | 236 (7.8%) | 0 (0.0%) |
| Electricity | 1,687 (55.6%) | 603 (76.2%) |
| Fuel Oil or Kerosene | 12 (0.4%) | 0 (0.0%) |
| Coal or Coke | 0 (0.0%) | 0 (0.0%) |
| All other Fuels | 140 (4.6%) | 0 (0.0%) |
| No Fuel Used | 0 (0.0%) | 77 (9.7%) |
| Total | 3,034 (100.0%) | 791 (100.0%) |
Household Vehicle Usage in Wickenburg
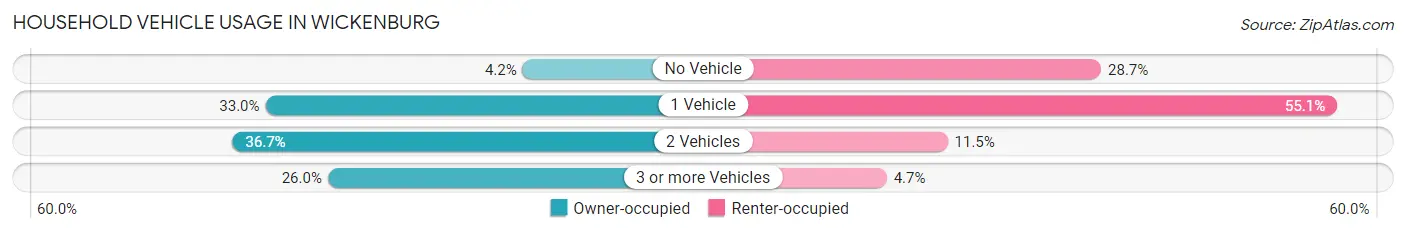
| Vehicles per Household | Owner-occupied | Renter-occupied |
| No Vehicle | 128 (4.2%) | 227 (28.7%) |
| 1 Vehicle | 1,002 (33.0%) | 436 (55.1%) |
| 2 Vehicles | 1,114 (36.7%) | 91 (11.5%) |
| 3 or more Vehicles | 790 (26.0%) | 37 (4.7%) |
| Total | 3,034 (100.0%) | 791 (100.0%) |
Real Estate & Mortgages in Wickenburg
Real Estate and Mortgage Overview in Wickenburg
| Characteristic | Without Mortgage | With Mortgage |
| Housing Units | 1,525 | 1,509 |
| Median Property Value | $332,900 | $438,900 |
| Median Household Income | $48,491 | $397 |
| Monthly Housing Costs | $480 | $229 |
| Real Estate Taxes | $1,563 | $0 |
Property Value by Mortgage Status in Wickenburg
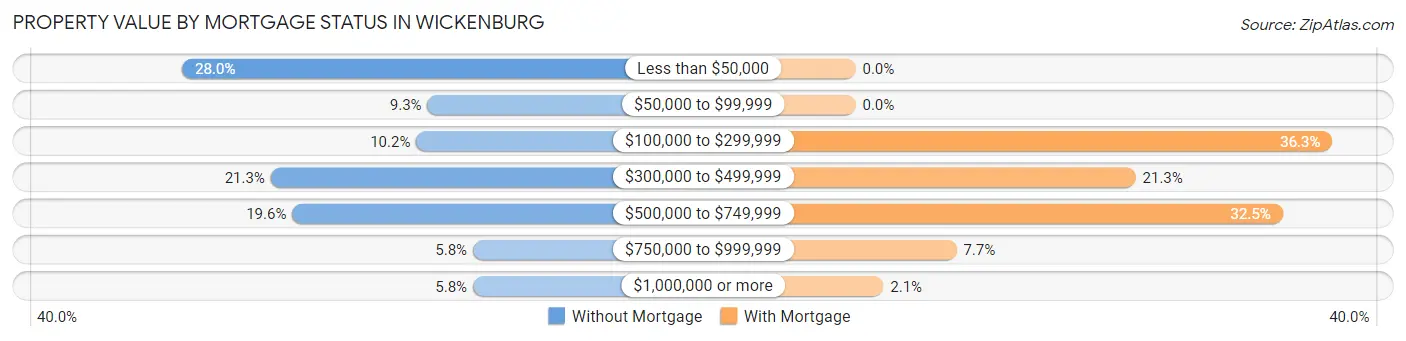
| Property Value | Without Mortgage | With Mortgage |
| Less than $50,000 | 427 (28.0%) | 0 (0.0%) |
| $50,000 to $99,999 | 142 (9.3%) | 0 (0.0%) |
| $100,000 to $299,999 | 155 (10.2%) | 548 (36.3%) |
| $300,000 to $499,999 | 324 (21.2%) | 322 (21.3%) |
| $500,000 to $749,999 | 299 (19.6%) | 491 (32.5%) |
| $750,000 to $999,999 | 89 (5.8%) | 116 (7.7%) |
| $1,000,000 or more | 89 (5.8%) | 32 (2.1%) |
| Total | 1,525 (100.0%) | 1,509 (100.0%) |
Household Income by Mortgage Status in Wickenburg
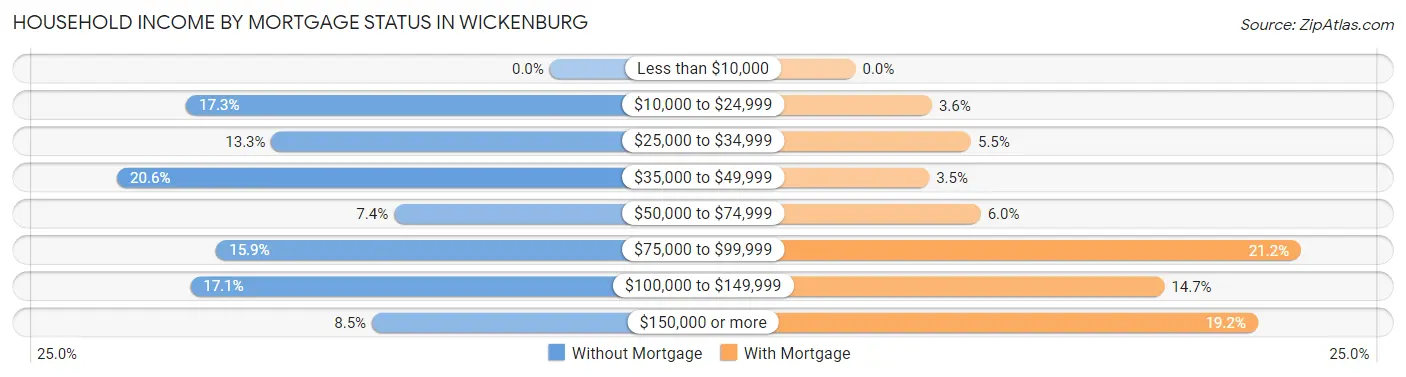
| Household Income | Without Mortgage | With Mortgage |
| Less than $10,000 | 0 (0.0%) | 0 (0.0%) |
| $10,000 to $24,999 | 264 (17.3%) | 55 (3.6%) |
| $25,000 to $34,999 | 202 (13.3%) | 83 (5.5%) |
| $35,000 to $49,999 | 314 (20.6%) | 53 (3.5%) |
| $50,000 to $74,999 | 113 (7.4%) | 90 (6.0%) |
| $75,000 to $99,999 | 242 (15.9%) | 320 (21.2%) |
| $100,000 to $149,999 | 261 (17.1%) | 222 (14.7%) |
| $150,000 or more | 129 (8.5%) | 289 (19.2%) |
| Total | 1,525 (100.0%) | 1,509 (100.0%) |
Property Value to Household Income Ratio in Wickenburg
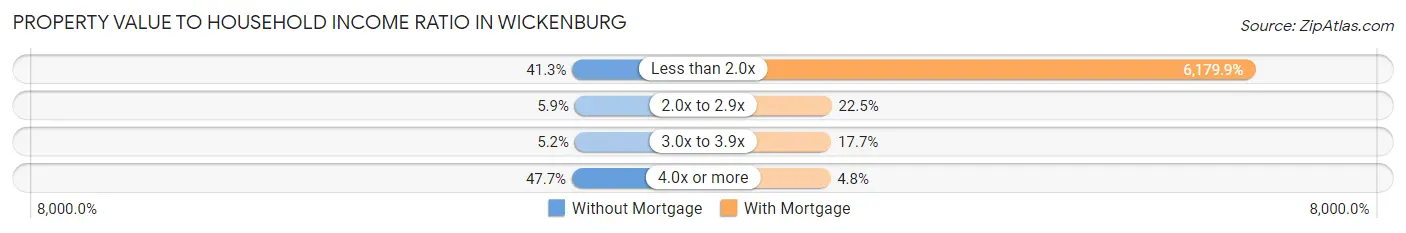
| Value-to-Income Ratio | Without Mortgage | With Mortgage |
| Less than 2.0x | 629 (41.2%) | 93,255 (6,179.9%) |
| 2.0x to 2.9x | 90 (5.9%) | 340 (22.5%) |
| 3.0x to 3.9x | 79 (5.2%) | 267 (17.7%) |
| 4.0x or more | 727 (47.7%) | 72 (4.8%) |
| Total | 1,525 (100.0%) | 1,509 (100.0%) |
Real Estate Taxes by Mortgage Status in Wickenburg
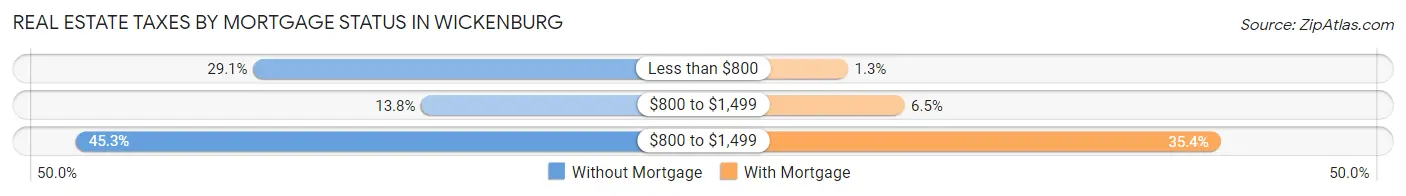
| Property Taxes | Without Mortgage | With Mortgage |
| Less than $800 | 444 (29.1%) | 20 (1.3%) |
| $800 to $1,499 | 210 (13.8%) | 98 (6.5%) |
| $800 to $1,499 | 691 (45.3%) | 534 (35.4%) |
| Total | 1,525 (100.0%) | 1,509 (100.0%) |
Health & Disability in Wickenburg
Health Insurance Coverage by Age in Wickenburg
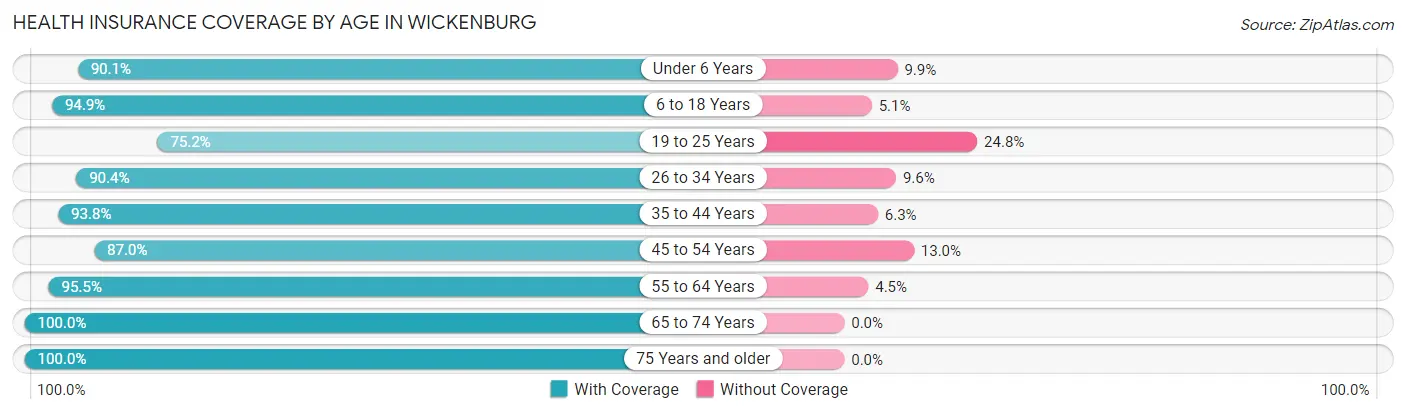
| Age Bracket | With Coverage | Without Coverage |
| Under 6 Years | 209 (90.1%) | 23 (9.9%) |
| 6 to 18 Years | 576 (94.9%) | 31 (5.1%) |
| 19 to 25 Years | 170 (75.2%) | 56 (24.8%) |
| 26 to 34 Years | 403 (90.4%) | 43 (9.6%) |
| 35 to 44 Years | 345 (93.8%) | 23 (6.2%) |
| 45 to 54 Years | 483 (87.0%) | 72 (13.0%) |
| 55 to 64 Years | 1,473 (95.5%) | 69 (4.5%) |
| 65 to 74 Years | 2,054 (100.0%) | 0 (0.0%) |
| 75 Years and older | 1,555 (100.0%) | 0 (0.0%) |
| Total | 7,268 (95.8%) | 317 (4.2%) |
Health Insurance Coverage by Citizenship Status in Wickenburg
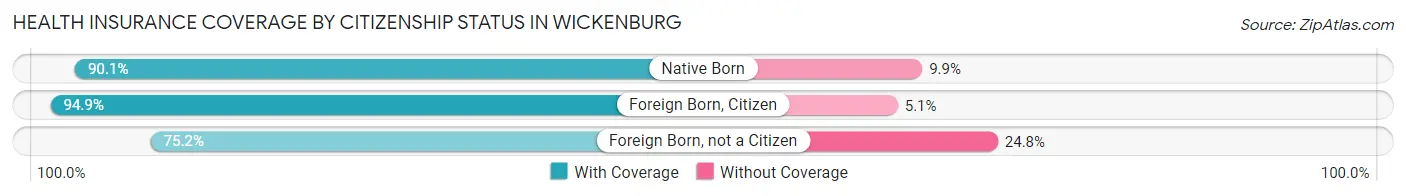
| Citizenship Status | With Coverage | Without Coverage |
| Native Born | 209 (90.1%) | 23 (9.9%) |
| Foreign Born, Citizen | 576 (94.9%) | 31 (5.1%) |
| Foreign Born, not a Citizen | 170 (75.2%) | 56 (24.8%) |
Health Insurance Coverage by Household Income in Wickenburg
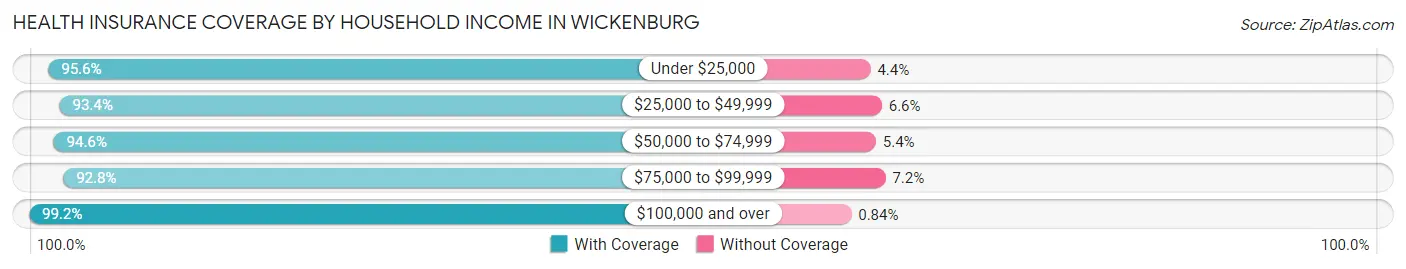
| Household Income | With Coverage | Without Coverage |
| Under $25,000 | 1,204 (95.6%) | 56 (4.4%) |
| $25,000 to $49,999 | 983 (93.4%) | 69 (6.6%) |
| $50,000 to $74,999 | 1,181 (94.6%) | 68 (5.4%) |
| $75,000 to $99,999 | 1,089 (92.8%) | 85 (7.2%) |
| $100,000 and over | 2,703 (99.2%) | 23 (0.8%) |
Public vs Private Health Insurance Coverage by Age in Wickenburg
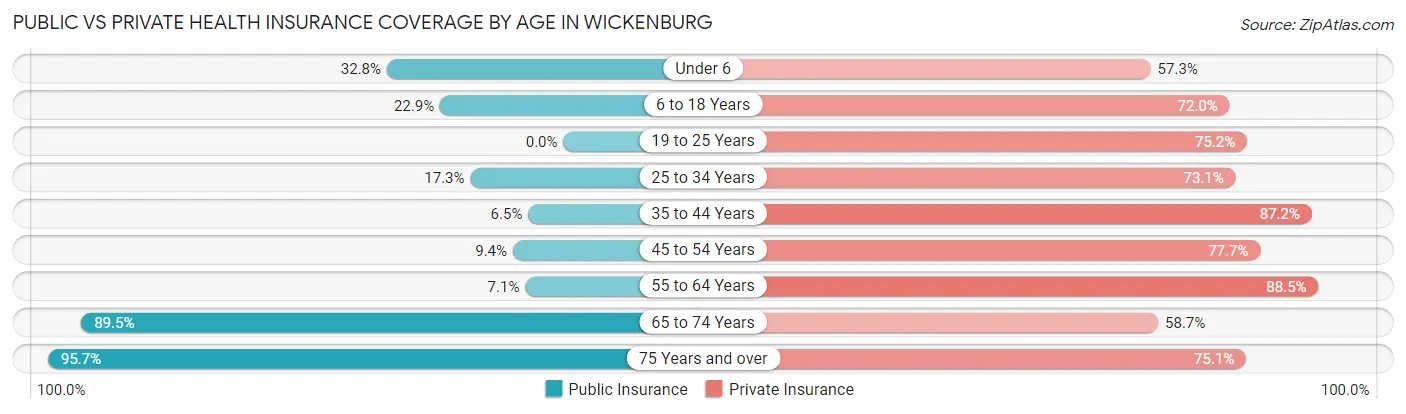
| Age Bracket | Public Insurance | Private Insurance |
| Under 6 | 76 (32.8%) | 133 (57.3%) |
| 6 to 18 Years | 139 (22.9%) | 437 (72.0%) |
| 19 to 25 Years | 0 (0.0%) | 170 (75.2%) |
| 25 to 34 Years | 77 (17.3%) | 326 (73.1%) |
| 35 to 44 Years | 24 (6.5%) | 321 (87.2%) |
| 45 to 54 Years | 52 (9.4%) | 431 (77.7%) |
| 55 to 64 Years | 109 (7.1%) | 1,364 (88.5%) |
| 65 to 74 Years | 1,838 (89.5%) | 1,206 (58.7%) |
| 75 Years and over | 1,488 (95.7%) | 1,167 (75.0%) |
| Total | 3,803 (50.1%) | 5,555 (73.2%) |
Disability Status by Sex by Age in Wickenburg
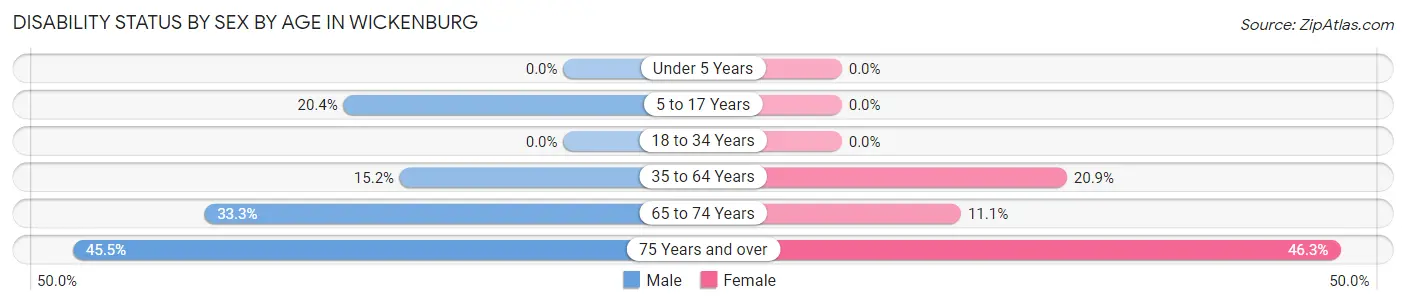
| Age Bracket | Male | Female |
| Under 5 Years | 0 (0.0%) | 0 (0.0%) |
| 5 to 17 Years | 71 (20.4%) | 0 (0.0%) |
| 18 to 34 Years | 0 (0.0%) | 0 (0.0%) |
| 35 to 64 Years | 183 (15.2%) | 263 (20.9%) |
| 65 to 74 Years | 335 (33.3%) | 116 (11.1%) |
| 75 Years and over | 325 (45.5%) | 389 (46.3%) |
Disability Class by Sex by Age in Wickenburg
Disability Class: Hearing Difficulty
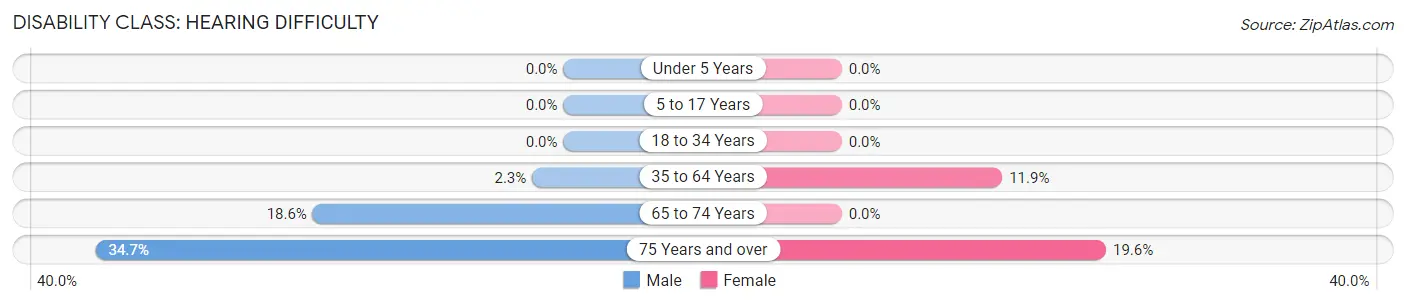
| Age Bracket | Male | Female |
| Under 5 Years | 0 (0.0%) | 0 (0.0%) |
| 5 to 17 Years | 0 (0.0%) | 0 (0.0%) |
| 18 to 34 Years | 0 (0.0%) | 0 (0.0%) |
| 35 to 64 Years | 28 (2.3%) | 150 (11.9%) |
| 65 to 74 Years | 187 (18.6%) | 0 (0.0%) |
| 75 Years and over | 248 (34.7%) | 165 (19.6%) |
Disability Class: Vision Difficulty
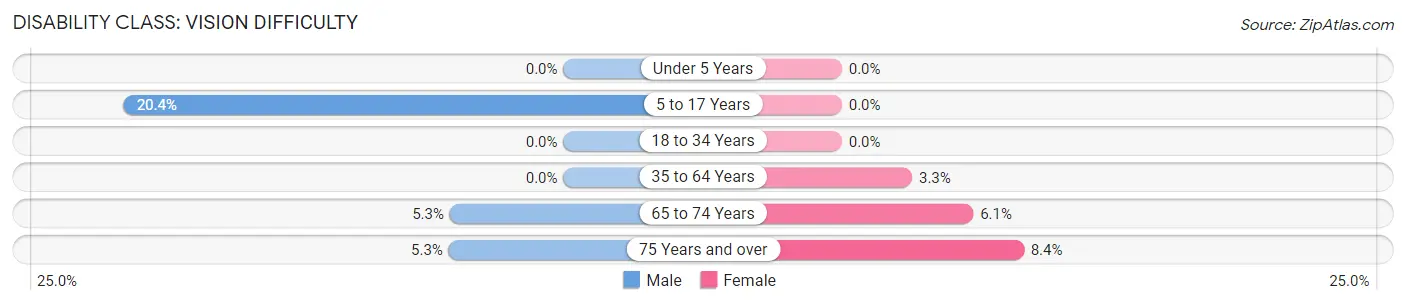
| Age Bracket | Male | Female |
| Under 5 Years | 0 (0.0%) | 0 (0.0%) |
| 5 to 17 Years | 71 (20.4%) | 0 (0.0%) |
| 18 to 34 Years | 0 (0.0%) | 0 (0.0%) |
| 35 to 64 Years | 0 (0.0%) | 41 (3.3%) |
| 65 to 74 Years | 53 (5.3%) | 64 (6.1%) |
| 75 Years and over | 38 (5.3%) | 71 (8.4%) |
Disability Class: Cognitive Difficulty
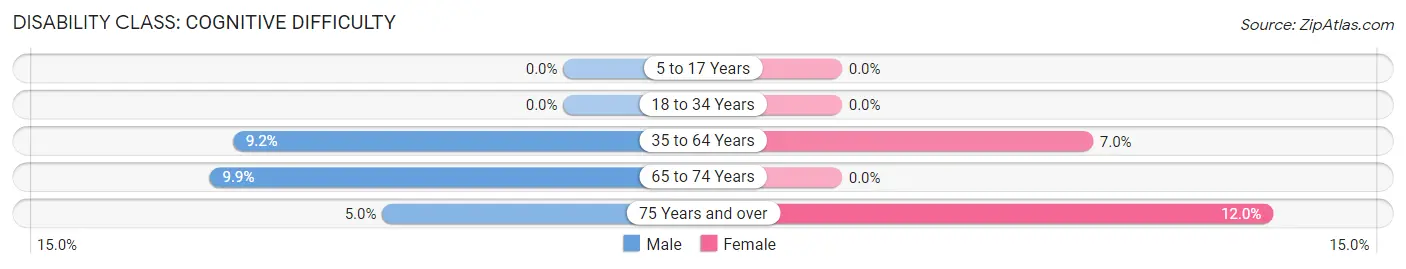
| Age Bracket | Male | Female |
| 5 to 17 Years | 0 (0.0%) | 0 (0.0%) |
| 18 to 34 Years | 0 (0.0%) | 0 (0.0%) |
| 35 to 64 Years | 111 (9.2%) | 88 (7.0%) |
| 65 to 74 Years | 99 (9.9%) | 0 (0.0%) |
| 75 Years and over | 36 (5.0%) | 101 (12.0%) |
Disability Class: Ambulatory Difficulty
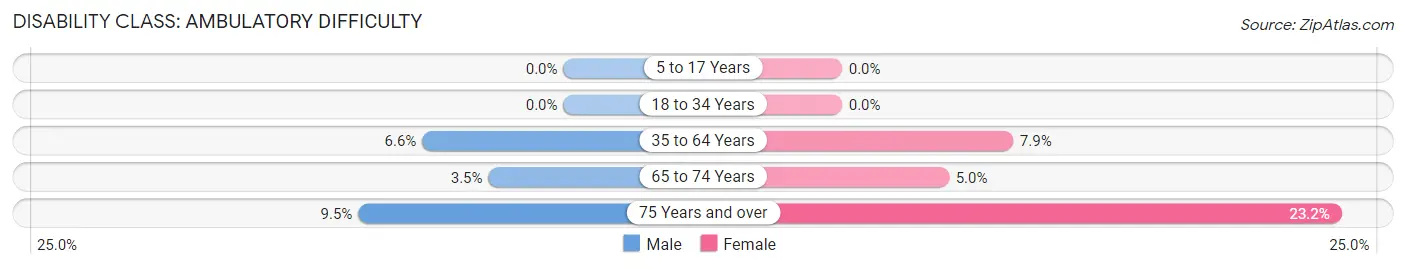
| Age Bracket | Male | Female |
| 5 to 17 Years | 0 (0.0%) | 0 (0.0%) |
| 18 to 34 Years | 0 (0.0%) | 0 (0.0%) |
| 35 to 64 Years | 79 (6.6%) | 100 (7.9%) |
| 65 to 74 Years | 35 (3.5%) | 52 (5.0%) |
| 75 Years and over | 68 (9.5%) | 195 (23.2%) |
Disability Class: Self-Care Difficulty
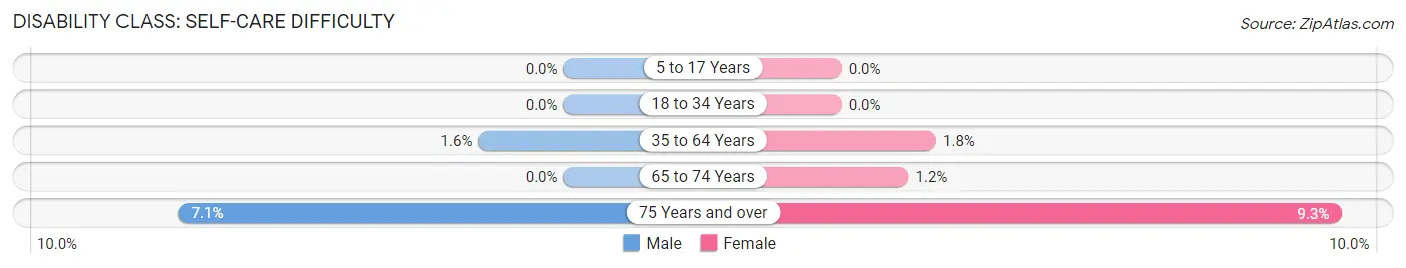
| Age Bracket | Male | Female |
| 5 to 17 Years | 0 (0.0%) | 0 (0.0%) |
| 18 to 34 Years | 0 (0.0%) | 0 (0.0%) |
| 35 to 64 Years | 19 (1.6%) | 22 (1.8%) |
| 65 to 74 Years | 0 (0.0%) | 13 (1.2%) |
| 75 Years and over | 51 (7.1%) | 78 (9.3%) |
Technology Access in Wickenburg
Computing Device Access in Wickenburg
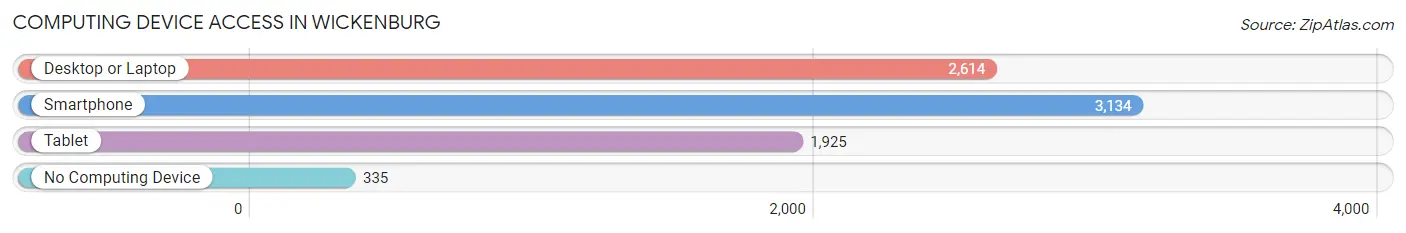
| Device Type | # Households | % Households |
| Desktop or Laptop | 2,614 | 68.3% |
| Smartphone | 3,134 | 81.9% |
| Tablet | 1,925 | 50.3% |
| No Computing Device | 335 | 8.8% |
| Total | 3,825 | 100.0% |
Internet Access in Wickenburg
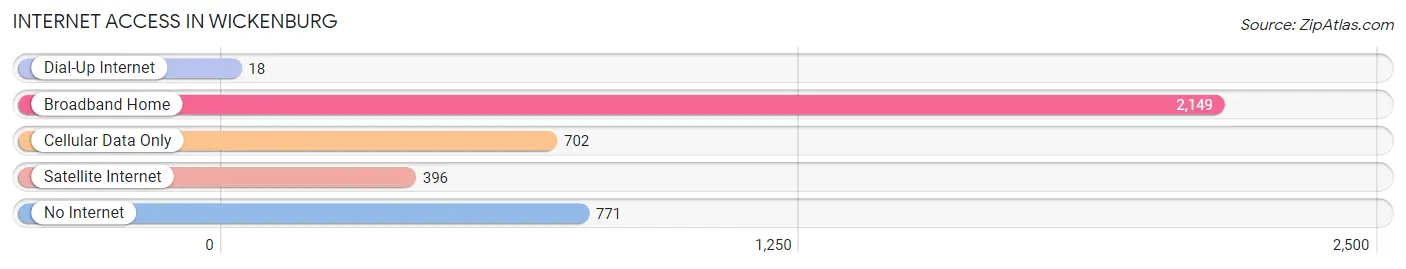
| Internet Type | # Households | % Households |
| Dial-Up Internet | 18 | 0.5% |
| Broadband Home | 2,149 | 56.2% |
| Cellular Data Only | 702 | 18.3% |
| Satellite Internet | 396 | 10.3% |
| No Internet | 771 | 20.2% |
| Total | 3,825 | 100.0% |
Wickenburg Summary
Wickenburg, Arizona is a small town located in Maricopa County, Arizona, about an hour northwest of Phoenix. It is situated in the Sonoran Desert, at an elevation of 2,000 feet. The town has a population of 6,363 as of the 2010 census, and is the county seat of Maricopa County.
History
The area around Wickenburg was first inhabited by the Hohokam people, who lived in the area from about 300 BC to 1450 AD. The area was later inhabited by the Yavapai and Apache tribes. The first Europeans to visit the area were Spanish explorers in the late 1700s.
In 1863, Henry Wickenburg, a German immigrant, discovered gold in the area and established the Vulture Mine. This discovery led to the founding of the town of Wickenburg in 1863. The town quickly grew as miners and prospectors flocked to the area in search of gold.
In 1867, the Arizona Territorial Legislature established Maricopa County, with Wickenburg as the county seat. The town continued to grow, and by the early 1900s, it had become a popular tourist destination, with many hotels, saloons, and other businesses catering to visitors.
Geography
Wickenburg is located in the Sonoran Desert, at an elevation of 2,000 feet. The town is situated on the Hassayampa River, which flows through the area. The town is surrounded by the Sonoran Desert, with the Bradshaw Mountains to the north and the White Tank Mountains to the south.
The climate in Wickenburg is hot and dry, with temperatures ranging from the mid-90s in the summer to the mid-50s in the winter. The area receives an average of 8.5 inches of rain per year.
Economy
The economy of Wickenburg is largely based on tourism and ranching. The town is home to several tourist attractions, including the Vulture Mine, the Desert Caballeros Western Museum, and the Wickenburg Ranch Golf and Social Club.
The town is also home to several ranches, including the Wickenburg Ranch, the Flying E Ranch, and the Circle Z Ranch. These ranches provide employment for many of the town's residents.
Demographics
As of the 2010 census, Wickenburg had a population of 6,363. The racial makeup of the town was 87.3% White, 0.7% African American, 0.9% Native American, 0.7% Asian, 0.1% Pacific Islander, 8.2% from other races, and 2.2% from two or more races. Hispanic or Latino of any race were 16.3% of the population.
The median income for a household in Wickenburg was $37,917, and the median income for a family was $45,938. The per capita income for the town was $20,945. About 11.2% of families and 14.3% of the population were below the poverty line, including 19.2% of those under age 18 and 8.2% of those age 65 or over.
Common Questions
What is Per Capita Income in Wickenburg?
Per Capita income in Wickenburg is $47,219.
What is the Median Family Income in Wickenburg?
Median Family Income in Wickenburg is $95,929.
What is the Median Household income in Wickenburg?
Median Household Income in Wickenburg is $63,301.
What is Income or Wage Gap in Wickenburg?
Income or Wage Gap in Wickenburg is 14.1%.
Women in Wickenburg earn 85.9 cents for every dollar earned by a man.
What is Inequality or Gini Index in Wickenburg?
Inequality or Gini Index in Wickenburg is 0.51.
What is the Total Population of Wickenburg?
Total Population of Wickenburg is 7,600.
What is the Total Male Population of Wickenburg?
Total Male Population of Wickenburg is 3,669.
What is the Total Female Population of Wickenburg?
Total Female Population of Wickenburg is 3,931.
What is the Ratio of Males per 100 Females in Wickenburg?
There are 93.34 Males per 100 Females in Wickenburg.
What is the Ratio of Females per 100 Males in Wickenburg?
There are 107.14 Females per 100 Males in Wickenburg.
What is the Median Population Age in Wickenburg?
Median Population Age in Wickenburg is 64.4 Years.
What is the Average Family Size in Wickenburg
Average Family Size in Wickenburg is 2.5 People.
What is the Average Household Size in Wickenburg
Average Household Size in Wickenburg is 1.9 People.
How Large is the Labor Force in Wickenburg?
There are 3,024 People in the Labor Forcein in Wickenburg.
What is the Percentage of People in the Labor Force in Wickenburg?
44.4% of People are in the Labor Force in Wickenburg.
What is the Unemployment Rate in Wickenburg?
Unemployment Rate in Wickenburg is 1.0%.