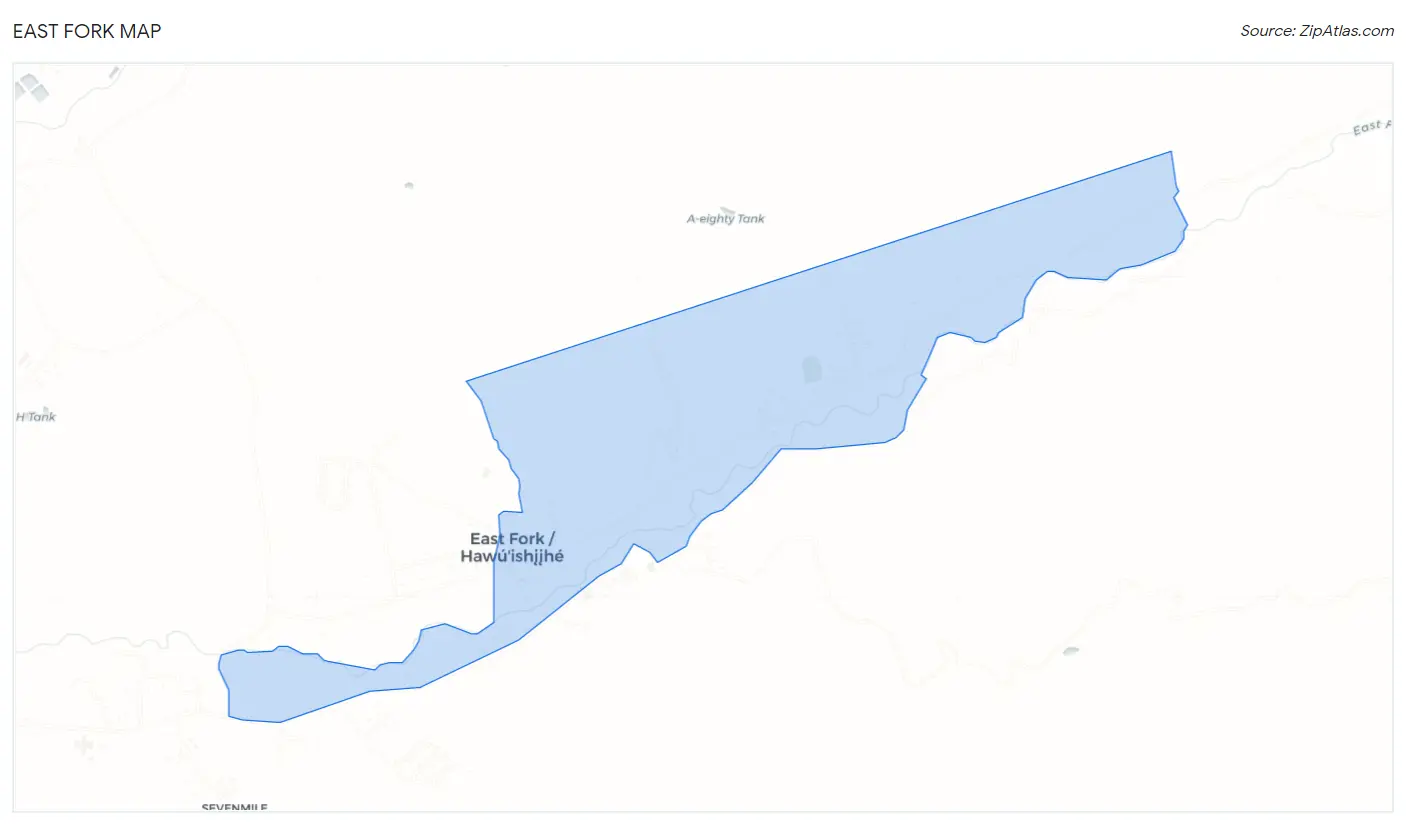
East Fork, AZ Map & Demographics
East Fork Map
East Fork Overview
$13,259
PER CAPITA INCOME
$40,083
AVG FAMILY INCOME
$42,500
AVG HOUSEHOLD INCOME
0.34
INEQUALITY / GINI INDEX
439
TOTAL POPULATION
168
MALE POPULATION
271
FEMALE POPULATION
61.99
MALES / 100 FEMALES
161.31
FEMALES / 100 MALES
20.2
MEDIAN AGE
3.9
AVG FAMILY SIZE
3.3
AVG HOUSEHOLD SIZE
182
LABOR FORCE [ PEOPLE ]
61.7%
PERCENT IN LABOR FORCE
8.2%
UNEMPLOYMENT RATE
Income in East Fork
Income Overview in East Fork
Per Capita Income in East Fork is $13,259, while median incomes of families and households are $40,083 and $42,500 respectively.
| Characteristic | Number | Measure |
| Per Capita Income | 439 | $13,259 |
| Median Family Income | 95 | $40,083 |
| Mean Family Income | 95 | $45,815 |
| Median Household Income | 132 | $42,500 |
| Mean Household Income | 132 | $44,745 |
| Income Deficit | 95 | $0 |
| Wage / Income Gap (%) | 439 | 0.00% |
| Wage / Income Gap ($) | 439 | 100.00¢ per $1 |
| Gini / Inequality Index | 439 | 0.34 |
Earnings by Sex in East Fork
| Sex | Number | Average Earnings |
| Male | 66 (36.3%) | $0 |
| Female | 116 (63.7%) | $0 |
| Total | 182 (100.0%) | $0 |
Earnings by Sex by Income Bracket in East Fork
The most common earnings brackets in East Fork are $35,000 to $39,999 for men (14 | 21.2%) and $10,000 to $12,499 for women (35 | 30.2%).
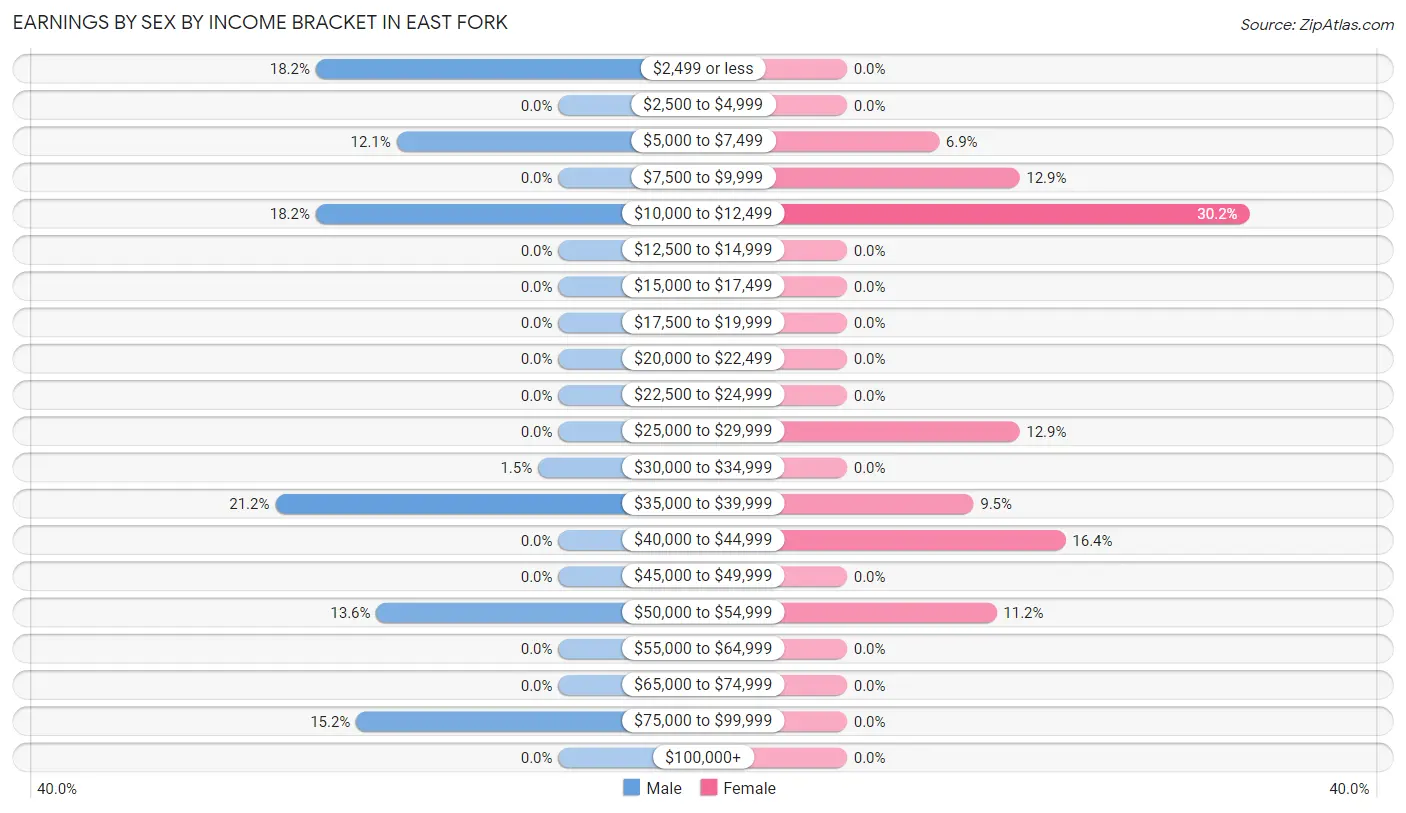
| Income | Male | Female |
| $2,499 or less | 12 (18.2%) | 0 (0.0%) |
| $2,500 to $4,999 | 0 (0.0%) | 0 (0.0%) |
| $5,000 to $7,499 | 8 (12.1%) | 8 (6.9%) |
| $7,500 to $9,999 | 0 (0.0%) | 15 (12.9%) |
| $10,000 to $12,499 | 12 (18.2%) | 35 (30.2%) |
| $12,500 to $14,999 | 0 (0.0%) | 0 (0.0%) |
| $15,000 to $17,499 | 0 (0.0%) | 0 (0.0%) |
| $17,500 to $19,999 | 0 (0.0%) | 0 (0.0%) |
| $20,000 to $22,499 | 0 (0.0%) | 0 (0.0%) |
| $22,500 to $24,999 | 0 (0.0%) | 0 (0.0%) |
| $25,000 to $29,999 | 0 (0.0%) | 15 (12.9%) |
| $30,000 to $34,999 | 1 (1.5%) | 0 (0.0%) |
| $35,000 to $39,999 | 14 (21.2%) | 11 (9.5%) |
| $40,000 to $44,999 | 0 (0.0%) | 19 (16.4%) |
| $45,000 to $49,999 | 0 (0.0%) | 0 (0.0%) |
| $50,000 to $54,999 | 9 (13.6%) | 13 (11.2%) |
| $55,000 to $64,999 | 0 (0.0%) | 0 (0.0%) |
| $65,000 to $74,999 | 0 (0.0%) | 0 (0.0%) |
| $75,000 to $99,999 | 10 (15.1%) | 0 (0.0%) |
| $100,000+ | 0 (0.0%) | 0 (0.0%) |
| Total | 66 (100.0%) | 116 (100.0%) |
Earnings by Sex by Educational Attainment in East Fork
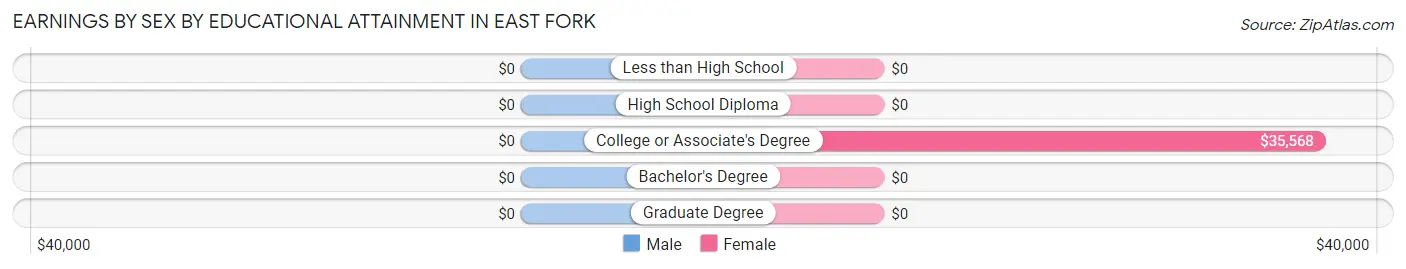
| Educational Attainment | Male Income | Female Income |
| Less than High School | - | - |
| High School Diploma | - | - |
| College or Associate's Degree | - | - |
| Bachelor's Degree | - | - |
| Graduate Degree | - | - |
| Total | $37,143 | $35,568 |
Family Income in East Fork
Family Income Brackets in East Fork
According to the East Fork family income data, there are 39 families falling into the $25,000 to $34,999 income range, which is the most common income bracket and makes up 41.0% of all families.
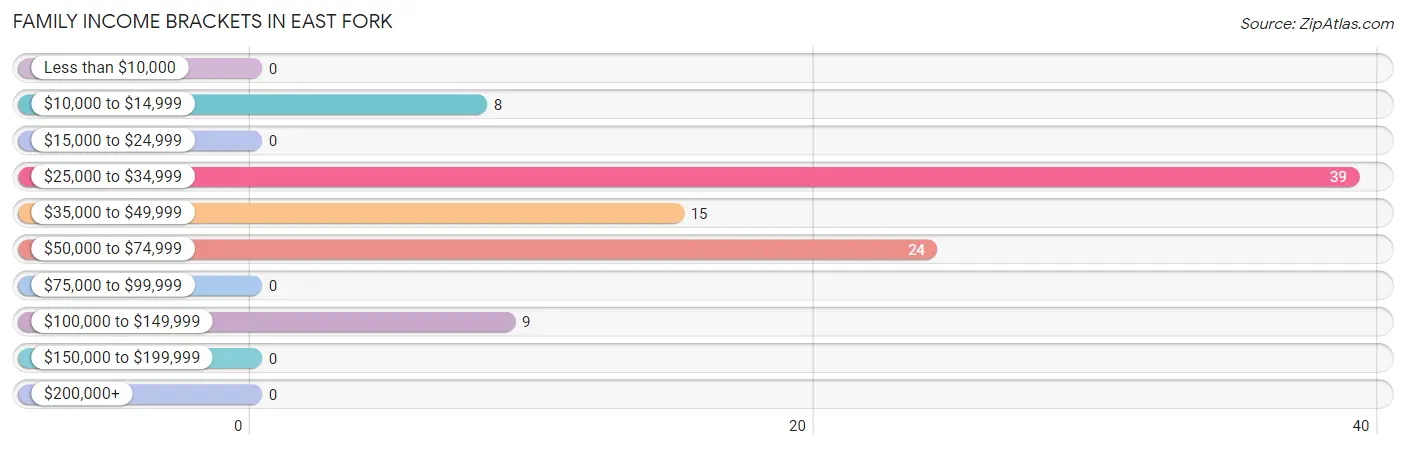
| Income Bracket | # Families | % Families |
| Less than $10,000 | 0 | 0.0% |
| $10,000 to $14,999 | 8 | 8.4% |
| $15,000 to $24,999 | 0 | 0.0% |
| $25,000 to $34,999 | 39 | 41.1% |
| $35,000 to $49,999 | 15 | 15.8% |
| $50,000 to $74,999 | 24 | 25.3% |
| $75,000 to $99,999 | 0 | 0.0% |
| $100,000 to $149,999 | 9 | 9.5% |
| $150,000 to $199,999 | 0 | 0.0% |
| $200,000+ | 0 | 0.0% |
Family Income by Famaliy Size in East Fork
3-person families (39 | 41.0%) account for the highest median family income in East Fork with $50,865 per family, while 3-person families (39 | 41.0%) have the highest median income of $16,955 per family member.
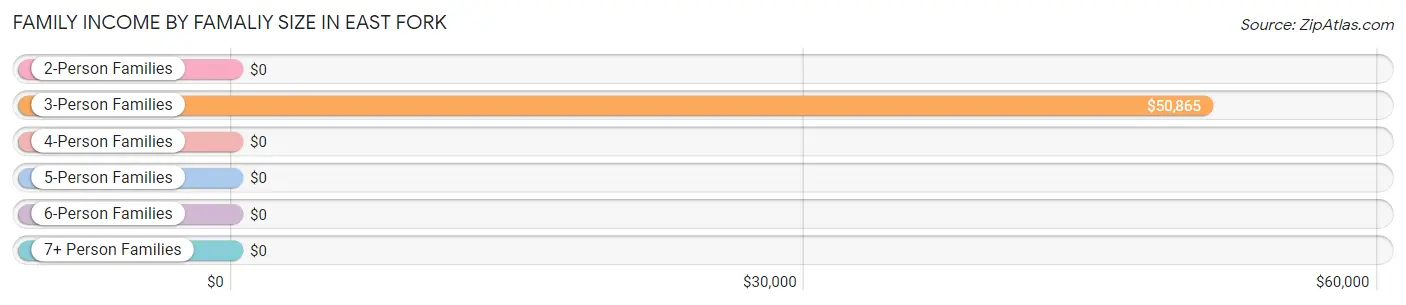
| Income Bracket | # Families | Median Income |
| 2-Person Families | 24 (25.3%) | $0 |
| 3-Person Families | 39 (41.0%) | $50,865 |
| 4-Person Families | 0 (0.0%) | $0 |
| 5-Person Families | 0 (0.0%) | $0 |
| 6-Person Families | 15 (15.8%) | $0 |
| 7+ Person Families | 17 (17.9%) | $0 |
| Total | 95 (100.0%) | $40,083 |
Family Income by Number of Earners in East Fork
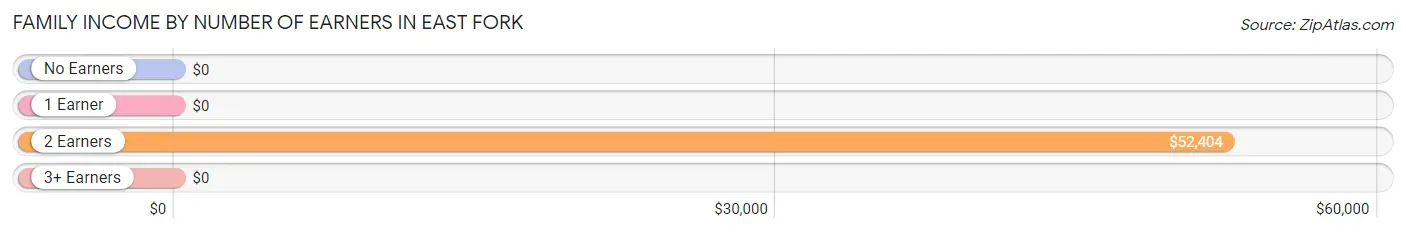
| Number of Earners | # Families | Median Income |
| No Earners | 9 (9.5%) | $0 |
| 1 Earner | 30 (31.6%) | $0 |
| 2 Earners | 41 (43.2%) | $52,404 |
| 3+ Earners | 15 (15.8%) | $0 |
| Total | 95 (100.0%) | $40,083 |
Household Income in East Fork
Household Income Brackets in East Fork
With 49 households falling in the category, the $50,000 to $74,999 income range is the most frequent in East Fork, accounting for 37.1% of all households.
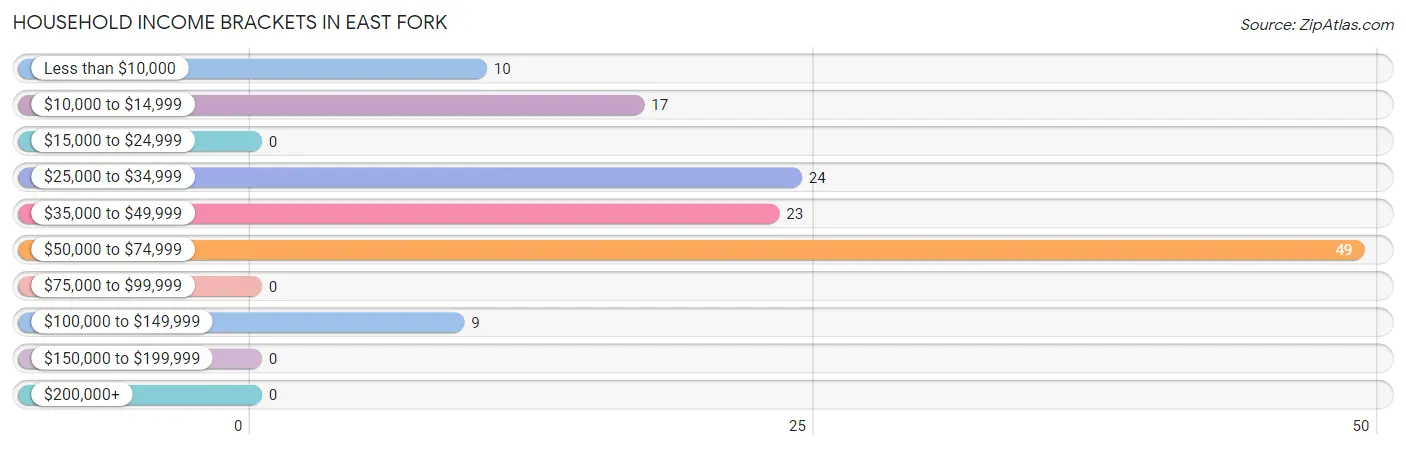
| Income Bracket | # Households | % Households |
| Less than $10,000 | 10 | 7.6% |
| $10,000 to $14,999 | 17 | 12.9% |
| $15,000 to $24,999 | 0 | 0.0% |
| $25,000 to $34,999 | 24 | 18.2% |
| $35,000 to $49,999 | 23 | 17.4% |
| $50,000 to $74,999 | 49 | 37.1% |
| $75,000 to $99,999 | 0 | 0.0% |
| $100,000 to $149,999 | 9 | 6.8% |
| $150,000 to $199,999 | 0 | 0.0% |
| $200,000+ | 0 | 0.0% |
Household Income by Householder Age in East Fork
The median household income in East Fork is $42,500, with the highest median household income of $60,227 found in the 45 to 64 years age bracket for the primary householder. A total of 38 households (28.8%) fall into this category.
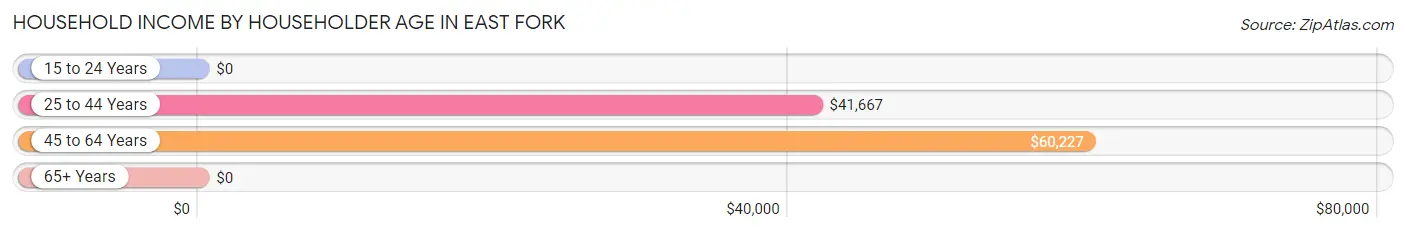
| Income Bracket | # Households | Median Income |
| 15 to 24 Years | 0 (0.0%) | $0 |
| 25 to 44 Years | 66 (50.0%) | $41,667 |
| 45 to 64 Years | 38 (28.8%) | $60,227 |
| 65+ Years | 28 (21.2%) | $0 |
| Total | 132 (100.0%) | $42,500 |
Poverty in East Fork
Income Below Poverty by Sex and Age in East Fork
With 56.6% poverty level for males and 59.4% for females among the residents of East Fork, 6 to 11 year old males and 12 to 14 year old females are the most vulnerable to poverty, with 11 males (100.0%) and 12 females (100.0%) in their respective age groups living below the poverty level.
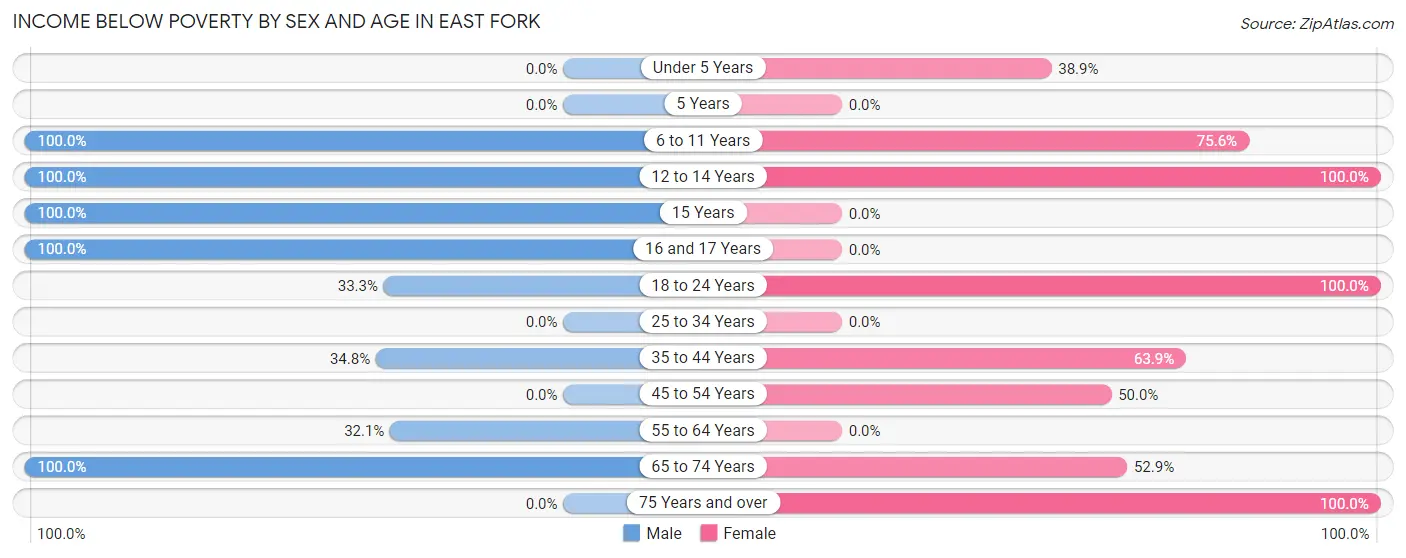
| Age Bracket | Male | Female |
| Under 5 Years | 0 (0.0%) | 7 (38.9%) |
| 5 Years | 0 (0.0%) | 0 (0.0%) |
| 6 to 11 Years | 11 (100.0%) | 34 (75.6%) |
| 12 to 14 Years | 19 (100.0%) | 12 (100.0%) |
| 15 Years | 17 (100.0%) | 0 (0.0%) |
| 16 and 17 Years | 10 (100.0%) | 0 (0.0%) |
| 18 to 24 Years | 12 (33.3%) | 55 (100.0%) |
| 25 to 34 Years | 0 (0.0%) | 0 (0.0%) |
| 35 to 44 Years | 8 (34.8%) | 23 (63.9%) |
| 45 to 54 Years | 0 (0.0%) | 11 (50.0%) |
| 55 to 64 Years | 9 (32.1%) | 0 (0.0%) |
| 65 to 74 Years | 9 (100.0%) | 9 (52.9%) |
| 75 Years and over | 0 (0.0%) | 10 (100.0%) |
| Total | 95 (56.6%) | 161 (59.4%) |
Income Above Poverty by Sex and Age in East Fork
According to the poverty statistics in East Fork, males aged 25 to 34 years and females aged 5 years are the age groups that are most secure financially, with 100.0% of males and 100.0% of females in these age groups living above the poverty line.
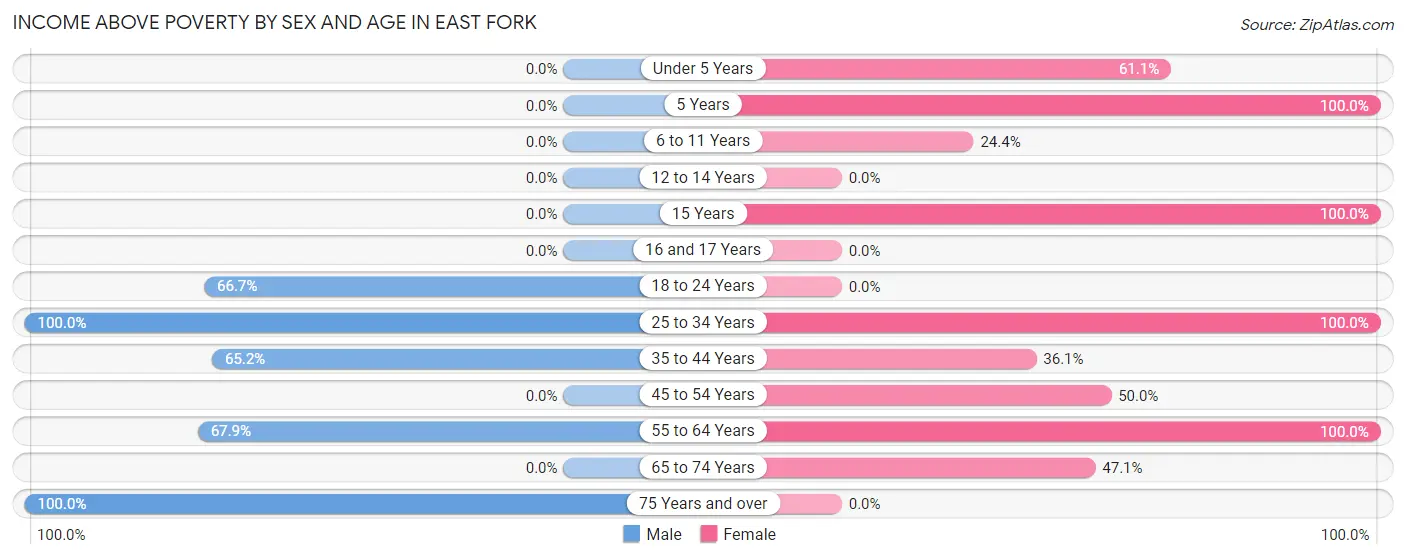
| Age Bracket | Male | Female |
| Under 5 Years | 0 (0.0%) | 11 (61.1%) |
| 5 Years | 0 (0.0%) | 11 (100.0%) |
| 6 to 11 Years | 0 (0.0%) | 11 (24.4%) |
| 12 to 14 Years | 0 (0.0%) | 0 (0.0%) |
| 15 Years | 0 (0.0%) | 11 (100.0%) |
| 16 and 17 Years | 0 (0.0%) | 0 (0.0%) |
| 18 to 24 Years | 24 (66.7%) | 0 (0.0%) |
| 25 to 34 Years | 14 (100.0%) | 25 (100.0%) |
| 35 to 44 Years | 15 (65.2%) | 13 (36.1%) |
| 45 to 54 Years | 0 (0.0%) | 11 (50.0%) |
| 55 to 64 Years | 19 (67.9%) | 9 (100.0%) |
| 65 to 74 Years | 0 (0.0%) | 8 (47.1%) |
| 75 Years and over | 1 (100.0%) | 0 (0.0%) |
| Total | 73 (43.4%) | 110 (40.6%) |
Income Below Poverty Among Married-Couple Families in East Fork
The poverty statistics for married-couple families in East Fork show that 25.0% or 8 of the total 32 families live below the poverty line. Families with 3 or 4 children have the highest poverty rate of 100.0%, comprising of 8 families. On the other hand, families with no children have the lowest poverty rate of 0.0%, which includes 0 families.
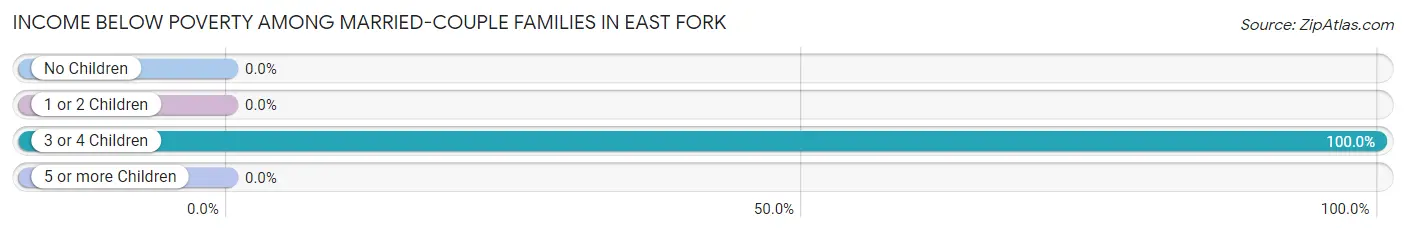
| Children | Above Poverty | Below Poverty |
| No Children | 24 (100.0%) | 0 (0.0%) |
| 1 or 2 Children | 0 (0.0%) | 0 (0.0%) |
| 3 or 4 Children | 0 (0.0%) | 8 (100.0%) |
| 5 or more Children | 0 (0.0%) | 0 (0.0%) |
| Total | 24 (75.0%) | 8 (25.0%) |
Income Below Poverty Among Single-Parent Households in East Fork
According to the poverty data in East Fork, 100.0% or 9 single-father households and 27.8% or 15 single-mother households are living below the poverty line. Among single-father households, those with 5 or more children have the highest poverty rate, with 9 households (100.0%) experiencing poverty. Likewise, among single-mother households, those with 3 or 4 children have the highest poverty rate, with 15 households (100.0%) falling below the poverty line.
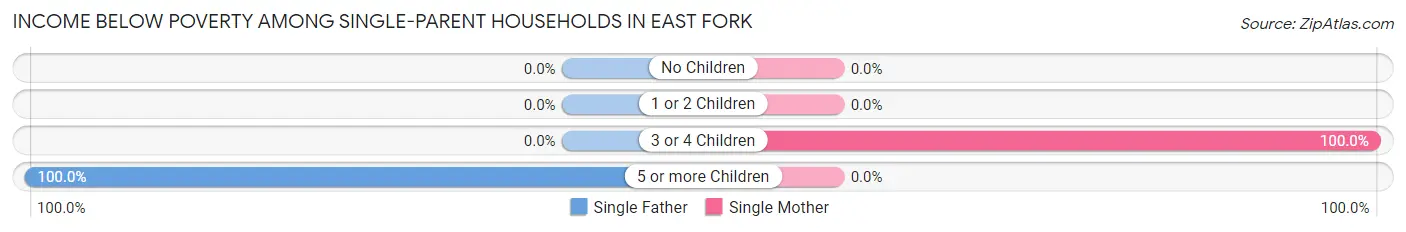
| Children | Single Father | Single Mother |
| No Children | 0 (0.0%) | 0 (0.0%) |
| 1 or 2 Children | 0 (0.0%) | 0 (0.0%) |
| 3 or 4 Children | 0 (0.0%) | 15 (100.0%) |
| 5 or more Children | 9 (100.0%) | 0 (0.0%) |
| Total | 9 (100.0%) | 15 (27.8%) |
Income Below Poverty Among Married-Couple vs Single-Parent Households in East Fork
The poverty data for East Fork shows that 8 of the married-couple family households (25.0%) and 24 of the single-parent households (38.1%) are living below the poverty level. Within the married-couple family households, those with 3 or 4 children have the highest poverty rate, with 8 households (100.0%) falling below the poverty line. Among the single-parent households, those with 3 or 4 children have the highest poverty rate, with 15 household (100.0%) living below poverty.
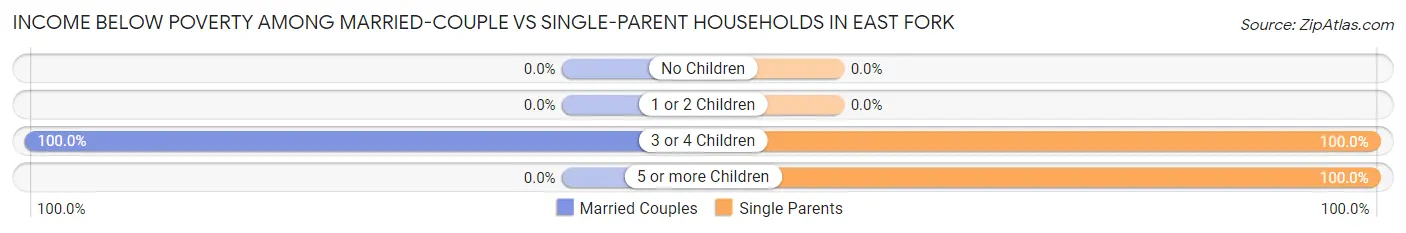
| Children | Married-Couple Families | Single-Parent Households |
| No Children | 0 (0.0%) | 0 (0.0%) |
| 1 or 2 Children | 0 (0.0%) | 0 (0.0%) |
| 3 or 4 Children | 8 (100.0%) | 15 (100.0%) |
| 5 or more Children | 0 (0.0%) | 9 (100.0%) |
| Total | 8 (25.0%) | 24 (38.1%) |
Race in East Fork
The most populous races in East Fork are Native / Alaskan (439 | 100.0%), and Hispanic or Latino (2 | 0.5%).
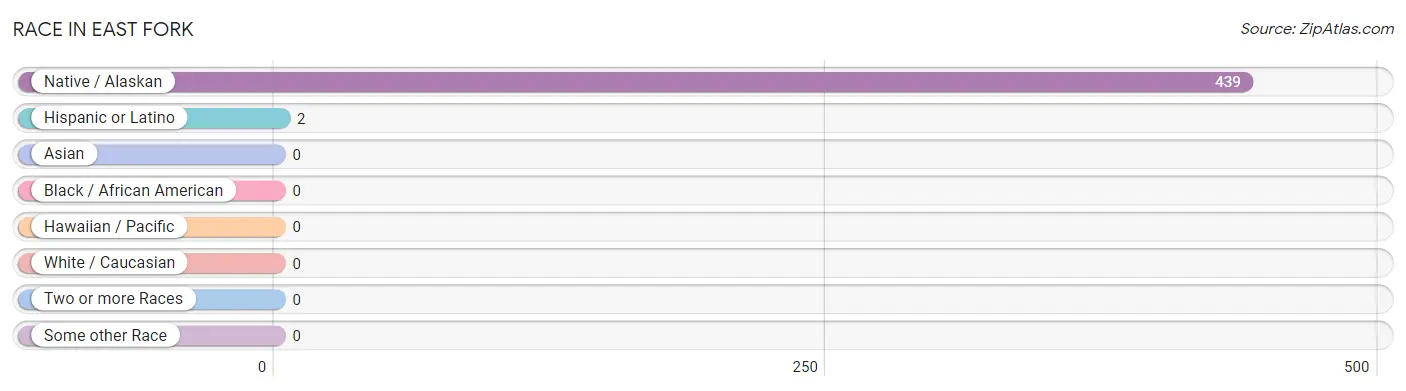
| Race | # Population | % Population |
| Asian | 0 | 0.0% |
| Black / African American | 0 | 0.0% |
| Hawaiian / Pacific | 0 | 0.0% |
| Hispanic or Latino | 2 | 0.5% |
| Native / Alaskan | 439 | 100.0% |
| White / Caucasian | 0 | 0.0% |
| Two or more Races | 0 | 0.0% |
| Some other Race | 0 | 0.0% |
| Total | 439 | 100.0% |
Ancestry in East Fork
The most populous ancestries reported in East Fork are Apache (437 | 99.5%), and Mexican (2 | 0.5%), together accounting for 100.0% of all East Fork residents.
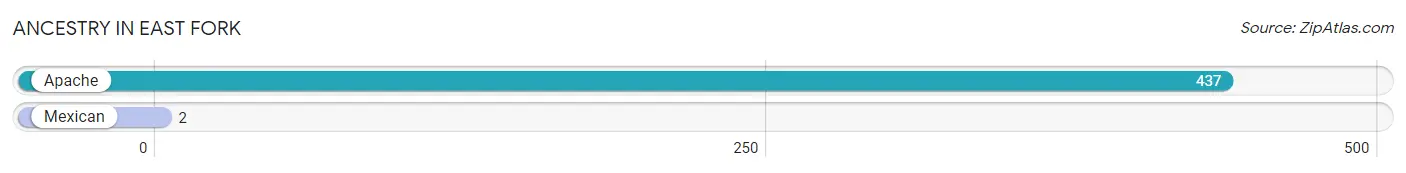
| Ancestry | # Population | % Population |
| Apache | 437 | 99.5% |
| Mexican | 2 | 0.5% | View All 2 Rows |
Immigrants in East Fork

| Immigration Origin | # Population | % Population | View All 0 Rows |
Sex and Age in East Fork
Sex and Age in East Fork
The most populous age groups in East Fork are 15 to 19 Years (51 | 30.4%) for men and 15 to 19 Years (50 | 18.4%) for women.
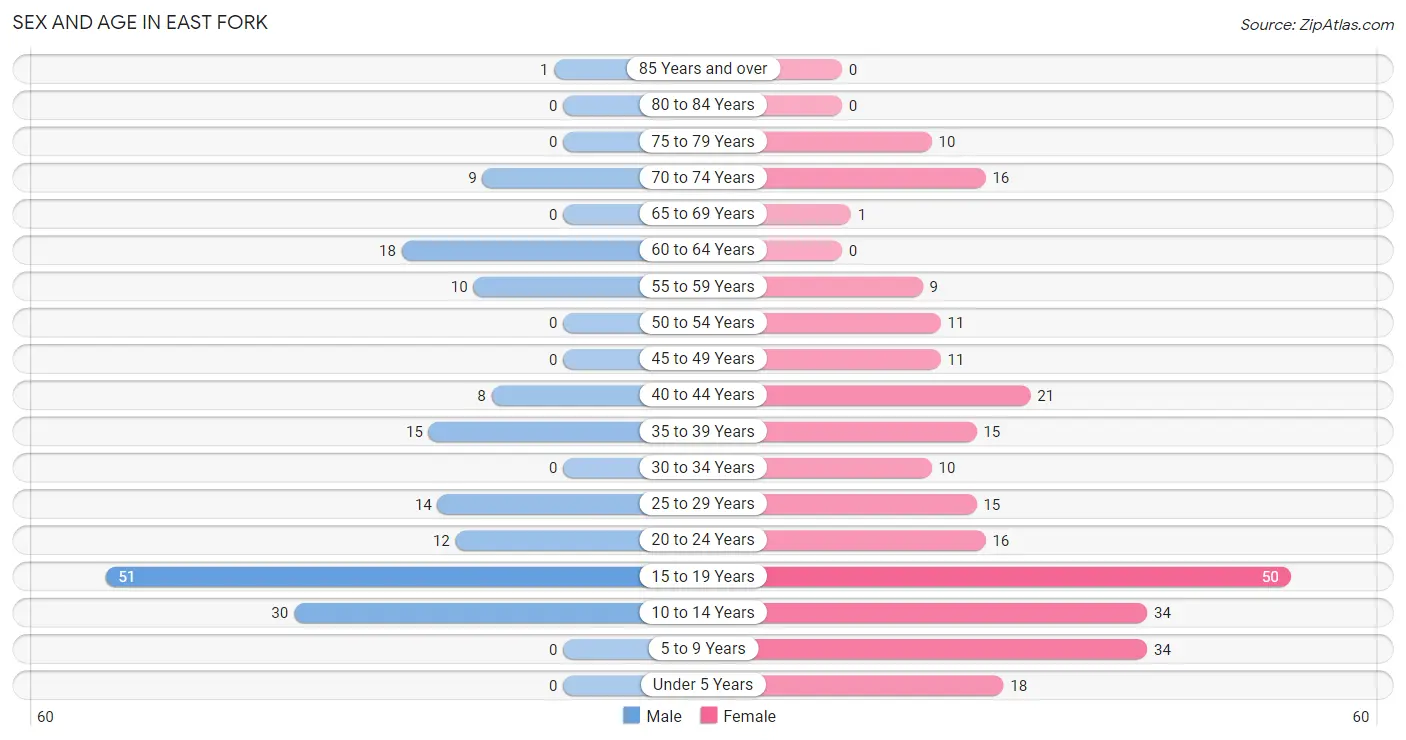
| Age Bracket | Male | Female |
| Under 5 Years | 0 (0.0%) | 18 (6.6%) |
| 5 to 9 Years | 0 (0.0%) | 34 (12.6%) |
| 10 to 14 Years | 30 (17.9%) | 34 (12.6%) |
| 15 to 19 Years | 51 (30.4%) | 50 (18.4%) |
| 20 to 24 Years | 12 (7.1%) | 16 (5.9%) |
| 25 to 29 Years | 14 (8.3%) | 15 (5.5%) |
| 30 to 34 Years | 0 (0.0%) | 10 (3.7%) |
| 35 to 39 Years | 15 (8.9%) | 15 (5.5%) |
| 40 to 44 Years | 8 (4.8%) | 21 (7.7%) |
| 45 to 49 Years | 0 (0.0%) | 11 (4.1%) |
| 50 to 54 Years | 0 (0.0%) | 11 (4.1%) |
| 55 to 59 Years | 10 (5.9%) | 9 (3.3%) |
| 60 to 64 Years | 18 (10.7%) | 0 (0.0%) |
| 65 to 69 Years | 0 (0.0%) | 1 (0.4%) |
| 70 to 74 Years | 9 (5.4%) | 16 (5.9%) |
| 75 to 79 Years | 0 (0.0%) | 10 (3.7%) |
| 80 to 84 Years | 0 (0.0%) | 0 (0.0%) |
| 85 Years and over | 1 (0.6%) | 0 (0.0%) |
| Total | 168 (100.0%) | 271 (100.0%) |
Families and Households in East Fork
Median Family Size in East Fork
The median family size in East Fork is 3.87 persons per family, with single male/father families (9 | 9.5%) accounting for the largest median family size of 8 persons per family. On the other hand, married-couple families (32 | 33.7%) represent the smallest median family size with 3.28 persons per family.
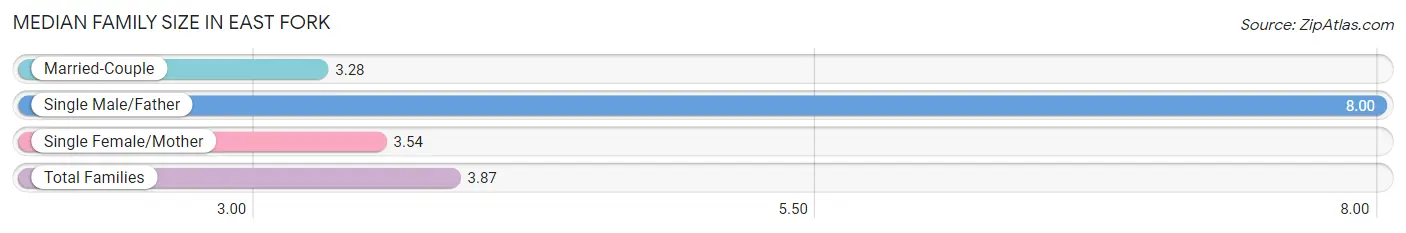
| Family Type | # Families | Family Size |
| Married-Couple | 32 (33.7%) | 3.28 |
| Single Male/Father | 9 (9.5%) | 8.00 |
| Single Female/Mother | 54 (56.8%) | 3.54 |
| Total Families | 95 (100.0%) | 3.87 |
Median Household Size in East Fork
The median household size in East Fork is 3.33 persons per household, with single male/father households (9 | 6.8%) accounting for the largest median household size of 9.22 persons per household. non-family households (37 | 28.0%) represent the smallest median household size with 1.24 persons per household.
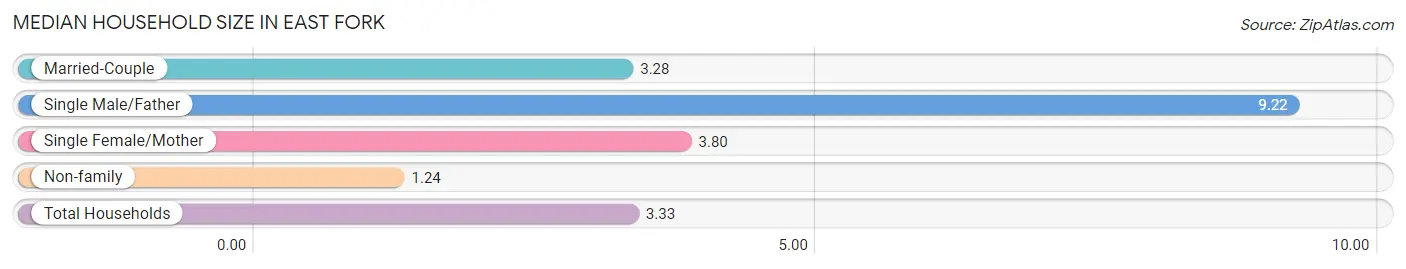
| Household Type | # Households | Household Size |
| Married-Couple | 32 (24.2%) | 3.28 |
| Single Male/Father | 9 (6.8%) | 9.22 |
| Single Female/Mother | 54 (40.9%) | 3.80 |
| Non-family | 37 (28.0%) | 1.24 |
| Total Households | 132 (100.0%) | 3.33 |
Household Size by Marriage Status in East Fork
Out of a total of 132 households in East Fork, 95 (72.0%) are family households, while 37 (28.0%) are nonfamily households. The most numerous type of family households are 2-person households, comprising 24, and the most common type of nonfamily households are 1-person households, comprising 26.
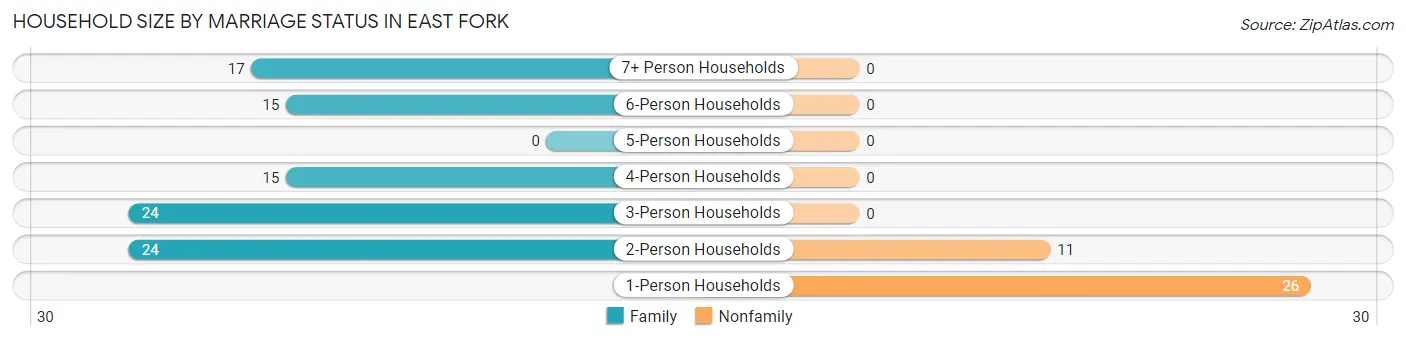
| Household Size | Family Households | Nonfamily Households |
| 1-Person Households | - | 26 (19.7%) |
| 2-Person Households | 24 (18.2%) | 11 (8.3%) |
| 3-Person Households | 24 (18.2%) | 0 (0.0%) |
| 4-Person Households | 15 (11.4%) | 0 (0.0%) |
| 5-Person Households | 0 (0.0%) | 0 (0.0%) |
| 6-Person Households | 15 (11.4%) | 0 (0.0%) |
| 7+ Person Households | 17 (12.9%) | 0 (0.0%) |
| Total | 95 (72.0%) | 37 (28.0%) |
Female Fertility in East Fork
Fertility by Age in East Fork
| Age Bracket | Women with Births | Births / 1,000 Women |
| 15 to 19 years | 0 (0.0%) | 0.0 |
| 20 to 34 years | 0 (0.0%) | 0.0 |
| 35 to 50 years | 0 (0.0%) | 0.0 |
| Total | 0 (0.0%) | 0.0 |
Fertility by Age by Marriage Status in East Fork
| Age Bracket | Married | Unmarried |
| 15 to 19 years | 0 (0.0%) | 0 (0.0%) |
| 20 to 34 years | 0 (0.0%) | 0 (0.0%) |
| 35 to 50 years | 0 (0.0%) | 0 (0.0%) |
| Total | 0 (0.0%) | 0 (0.0%) |
Fertility by Education in East Fork
| Educational Attainment | Women with Births | Births / 1,000 Women |
| Less than High School | 0 (0.0%) | 0.0 |
| High School Diploma | 0 (0.0%) | 0.0 |
| College or Associate's Degree | 0 (0.0%) | 0.0 |
| Bachelor's Degree | 0 (0.0%) | 0.0 |
| Graduate Degree | 0 (0.0%) | 0.0 |
| Total | 0 (0.0%) | 0.0 |
Fertility by Education by Marriage Status in East Fork
| Educational Attainment | Married | Unmarried |
| Less than High School | 0 (0.0%) | 0 (0.0%) |
| High School Diploma | 0 (0.0%) | 0 (0.0%) |
| College or Associate's Degree | 0 (0.0%) | 0 (0.0%) |
| Bachelor's Degree | 0 (0.0%) | 0 (0.0%) |
| Graduate Degree | 0 (0.0%) | 0 (0.0%) |
| Total | 0 (0.0%) | 0 (0.0%) |
Employment Characteristics in East Fork
Employment by Class of Employer in East Fork
Among the 167 employed individuals in East Fork, private company employees (59 | 35.3%), local government employees (58 | 34.7%), and not-for-profit organizations (34 | 20.4%) make up the most common classes of employment.
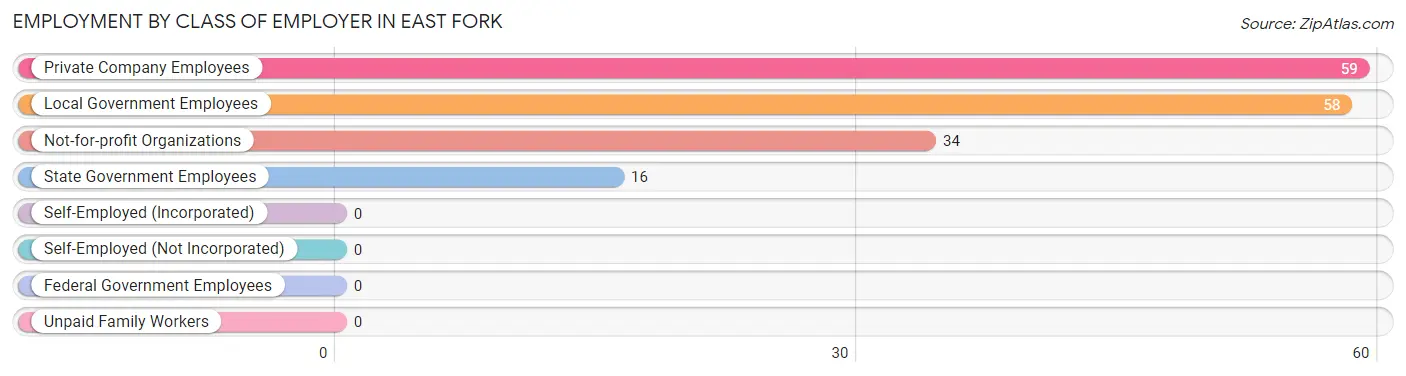
| Employer Class | # Employees | % Employees |
| Private Company Employees | 59 | 35.3% |
| Self-Employed (Incorporated) | 0 | 0.0% |
| Self-Employed (Not Incorporated) | 0 | 0.0% |
| Not-for-profit Organizations | 34 | 20.4% |
| Local Government Employees | 58 | 34.7% |
| State Government Employees | 16 | 9.6% |
| Federal Government Employees | 0 | 0.0% |
| Unpaid Family Workers | 0 | 0.0% |
| Total | 167 | 100.0% |
Employment Status by Age in East Fork
According to the labor force statistics for East Fork, out of the total population over 16 years of age (295), 61.7% or 182 individuals are in the labor force, with 8.2% or 15 of them unemployed. The age group with the highest labor force participation rate is 20 to 24 years, with 100.0% or 28 individuals in the labor force. Within the labor force, the 35 to 44 years age range has the highest percentage of unemployed individuals, with 34.1% or 15 of them being unemployed.
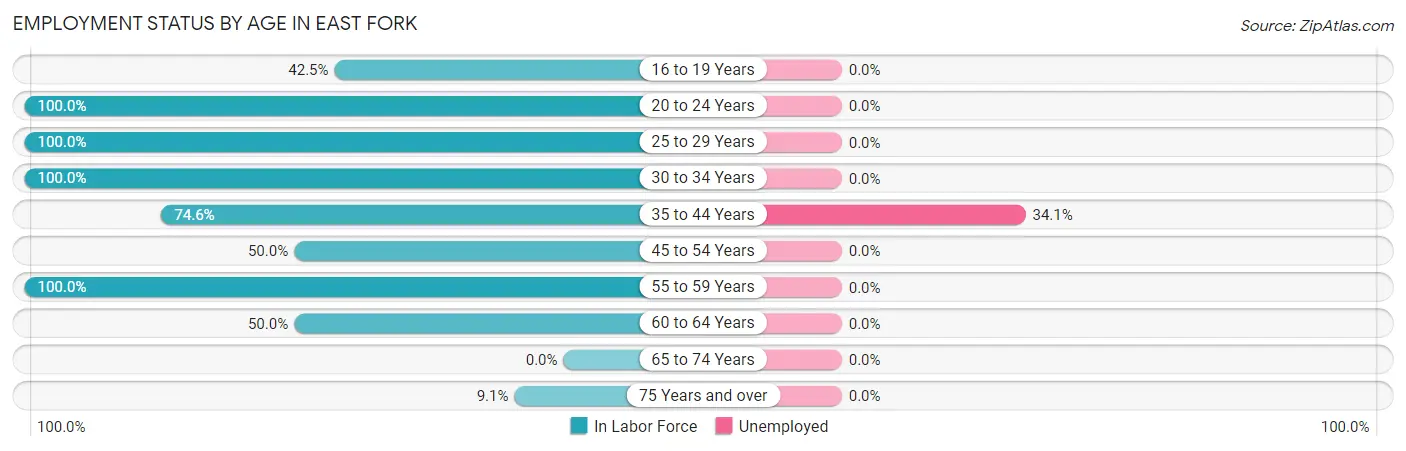
| Age Bracket | In Labor Force | Unemployed |
| 16 to 19 Years | 31 (42.5%) | 0 (0.0%) |
| 20 to 24 Years | 28 (100.0%) | 0 (0.0%) |
| 25 to 29 Years | 29 (100.0%) | 0 (0.0%) |
| 30 to 34 Years | 10 (100.0%) | 0 (0.0%) |
| 35 to 44 Years | 44 (74.6%) | 15 (34.1%) |
| 45 to 54 Years | 11 (50.0%) | 0 (0.0%) |
| 55 to 59 Years | 19 (100.0%) | 0 (0.0%) |
| 60 to 64 Years | 9 (50.0%) | 0 (0.0%) |
| 65 to 74 Years | 0 (0.0%) | 0 (0.0%) |
| 75 Years and over | 1 (9.1%) | 0 (0.0%) |
| Total | 182 (61.7%) | 15 (8.2%) |
Employment Status by Educational Attainment in East Fork
According to labor force statistics for East Fork, 77.7% of individuals (122) out of the total population between 25 and 64 years of age (157) are in the labor force, with 12.3% or 15 of them being unemployed. The group with the highest labor force participation rate are those with the educational attainment of college / associate degree, with 100.0% or 49 individuals in the labor force. Within the labor force, individuals with high school diploma education have the highest percentage of unemployment, with 34.9% or 15 of them being unemployed.
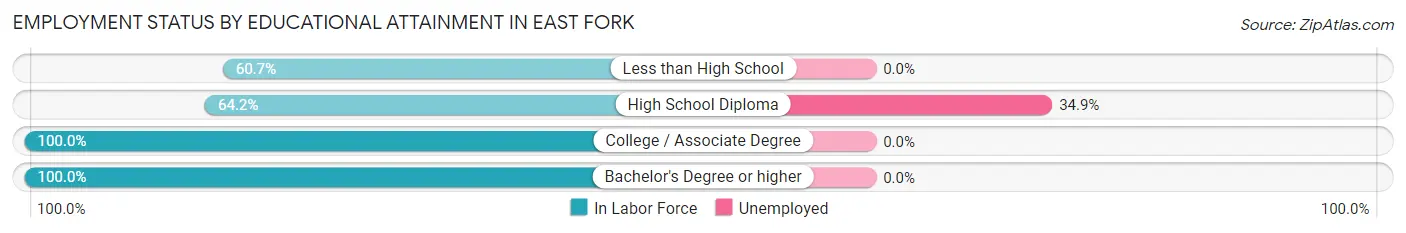
| Educational Attainment | In Labor Force | Unemployed |
| Less than High School | 17 (60.7%) | 0 (0.0%) |
| High School Diploma | 43 (64.2%) | 23 (34.9%) |
| College / Associate Degree | 49 (100.0%) | 0 (0.0%) |
| Bachelor's Degree or higher | 13 (100.0%) | 0 (0.0%) |
| Total | 122 (77.7%) | 19 (12.3%) |
Employment Occupations by Sex in East Fork
Management, Business, Science and Arts Occupations
The most common Management, Business, Science and Arts occupations in East Fork are Community & Social Service (15 | 9.0%), Education, Arts & Media (15 | 9.0%), Health Diagnosing & Treating (13 | 7.8%), Health Technologists (13 | 7.8%), and Management (1 | 0.6%).
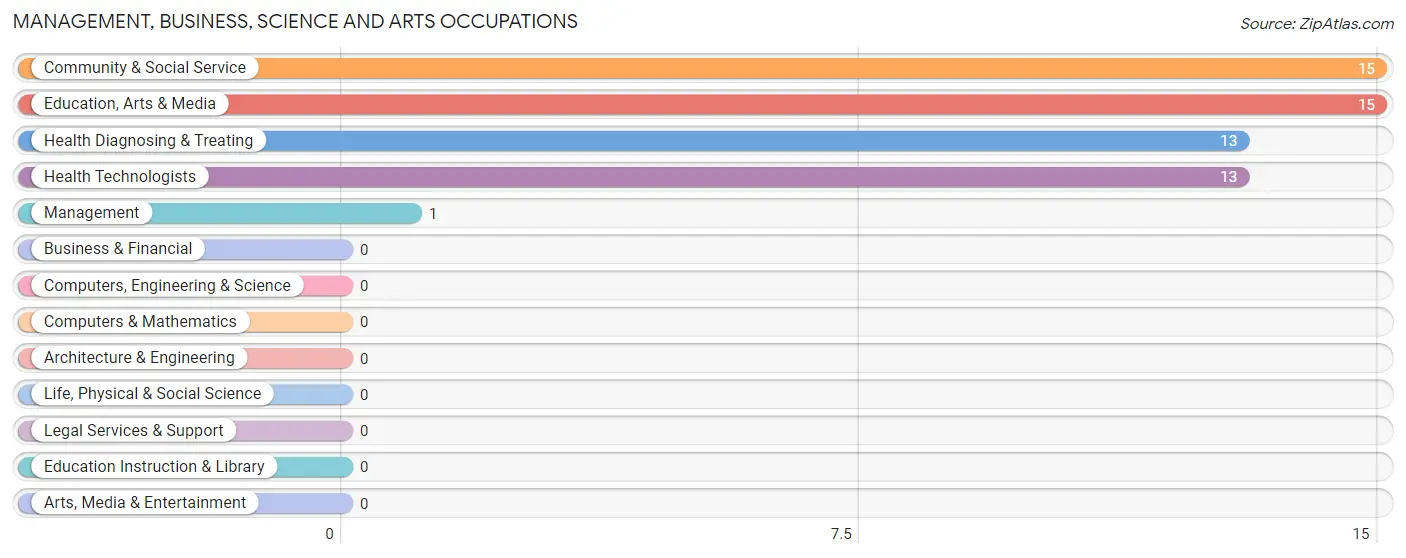
Management, Business, Science and Arts Occupations by Sex
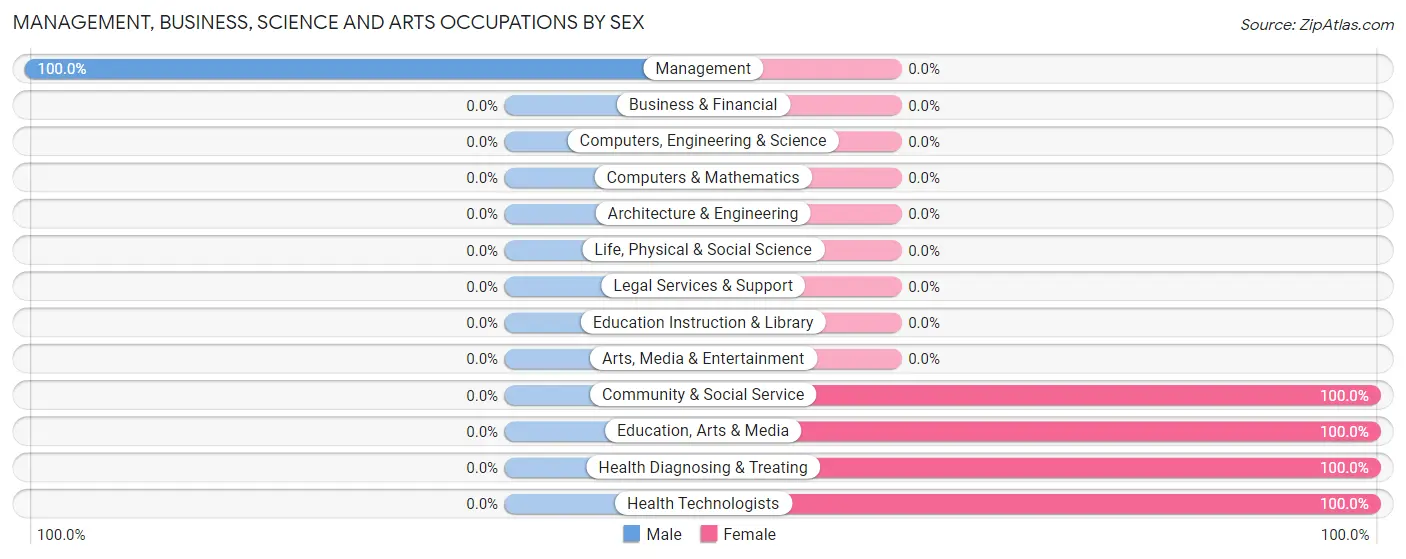
| Occupation | Male | Female |
| Management | 1 (100.0%) | 0 (0.0%) |
| Business & Financial | 0 (0.0%) | 0 (0.0%) |
| Computers, Engineering & Science | 0 (0.0%) | 0 (0.0%) |
| Computers & Mathematics | 0 (0.0%) | 0 (0.0%) |
| Architecture & Engineering | 0 (0.0%) | 0 (0.0%) |
| Life, Physical & Social Science | 0 (0.0%) | 0 (0.0%) |
| Community & Social Service | 0 (0.0%) | 15 (100.0%) |
| Education, Arts & Media | 0 (0.0%) | 15 (100.0%) |
| Legal Services & Support | 0 (0.0%) | 0 (0.0%) |
| Education Instruction & Library | 0 (0.0%) | 0 (0.0%) |
| Arts, Media & Entertainment | 0 (0.0%) | 0 (0.0%) |
| Health Diagnosing & Treating | 0 (0.0%) | 13 (100.0%) |
| Health Technologists | 0 (0.0%) | 13 (100.0%) |
| Total (Category) | 1 (3.5%) | 28 (96.6%) |
| Total (Overall) | 66 (39.5%) | 101 (60.5%) |
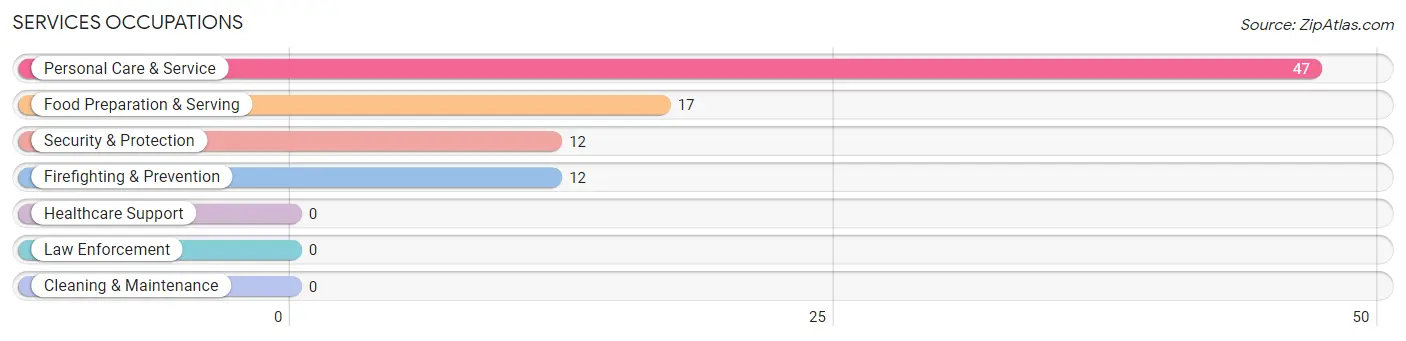
Services Occupations
The most common Services occupations in East Fork are Personal Care & Service (47 | 28.1%), Food Preparation & Serving (17 | 10.2%), Security & Protection (12 | 7.2%), and Firefighting & Prevention (12 | 7.2%).
Services Occupations by Sex
Within the Services occupations in East Fork, the most male-oriented occupations are Security & Protection (100.0%), Firefighting & Prevention (100.0%), and Food Preparation & Serving (52.9%), while the most female-oriented occupations are Personal Care & Service (74.5%), and Food Preparation & Serving (47.1%).
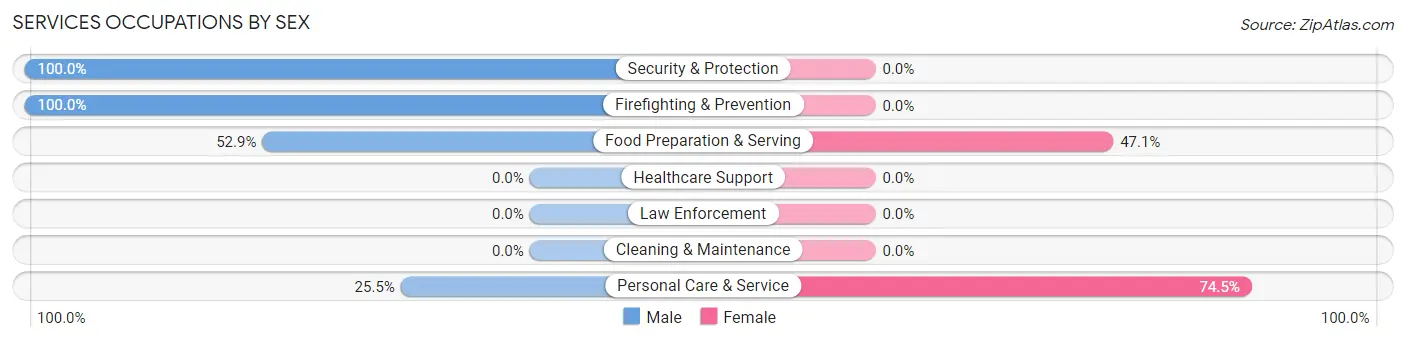
| Occupation | Male | Female |
| Healthcare Support | 0 (0.0%) | 0 (0.0%) |
| Security & Protection | 12 (100.0%) | 0 (0.0%) |
| Firefighting & Prevention | 12 (100.0%) | 0 (0.0%) |
| Law Enforcement | 0 (0.0%) | 0 (0.0%) |
| Food Preparation & Serving | 9 (52.9%) | 8 (47.1%) |
| Cleaning & Maintenance | 0 (0.0%) | 0 (0.0%) |
| Personal Care & Service | 12 (25.5%) | 35 (74.5%) |
| Total (Category) | 33 (43.4%) | 43 (56.6%) |
| Total (Overall) | 66 (39.5%) | 101 (60.5%) |
Sales and Office Occupations
The most common Sales and Office occupations in East Fork are , and Office & Administration (30 | 18.0%).
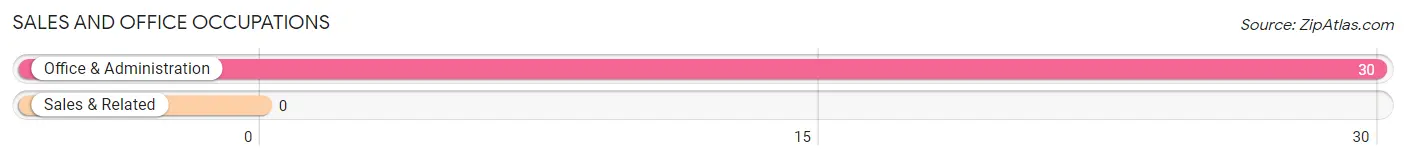
Sales and Office Occupations by Sex
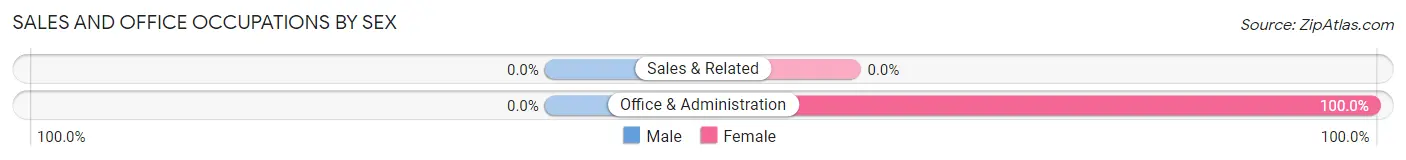
| Occupation | Male | Female |
| Sales & Related | 0 (0.0%) | 0 (0.0%) |
| Office & Administration | 0 (0.0%) | 30 (100.0%) |
| Total (Category) | 0 (0.0%) | 30 (100.0%) |
| Total (Overall) | 66 (39.5%) | 101 (60.5%) |
Natural Resources, Construction and Maintenance Occupations
The most common Natural Resources, Construction and Maintenance occupations in East Fork are , and Installation, Maintenance & Repair (10 | 6.0%).
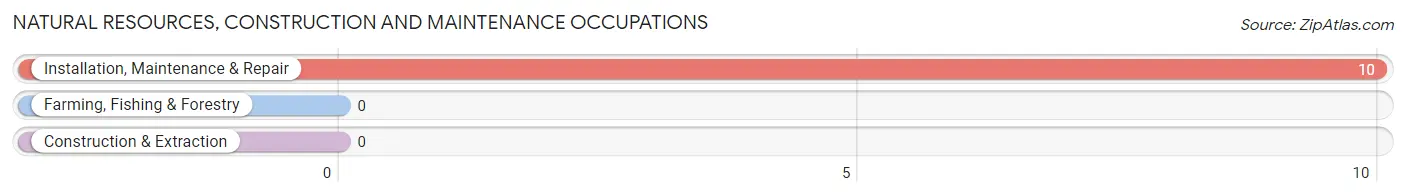
Natural Resources, Construction and Maintenance Occupations by Sex
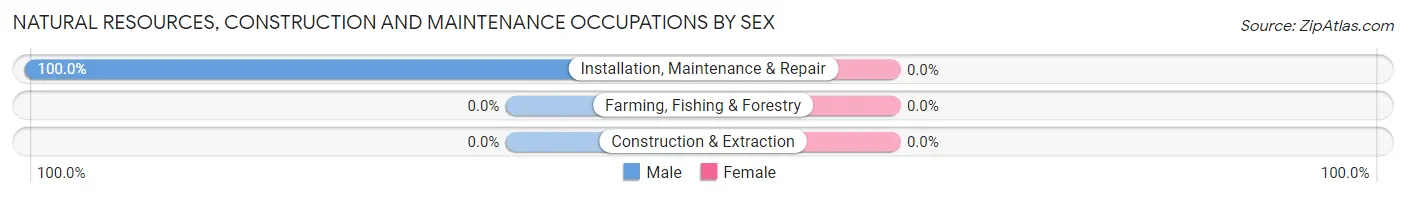
| Occupation | Male | Female |
| Farming, Fishing & Forestry | 0 (0.0%) | 0 (0.0%) |
| Construction & Extraction | 0 (0.0%) | 0 (0.0%) |
| Installation, Maintenance & Repair | 10 (100.0%) | 0 (0.0%) |
| Total (Category) | 10 (100.0%) | 0 (0.0%) |
| Total (Overall) | 66 (39.5%) | 101 (60.5%) |
Production, Transportation and Moving Occupations
The most common Production, Transportation and Moving occupations in East Fork are Production (14 | 8.4%), and Transportation (8 | 4.8%).
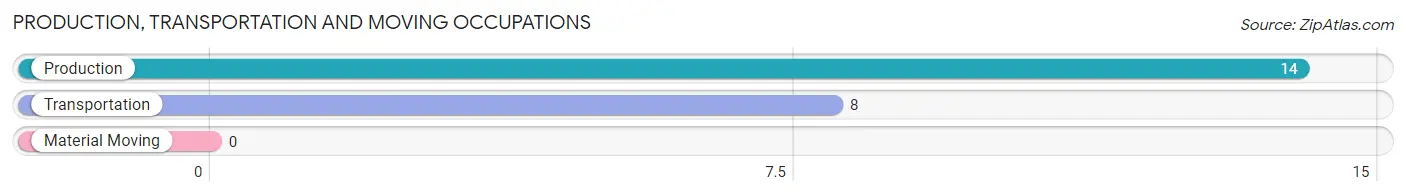
Production, Transportation and Moving Occupations by Sex
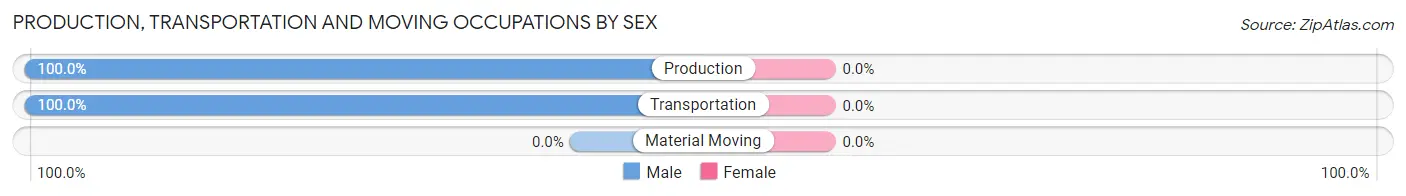
| Occupation | Male | Female |
| Production | 14 (100.0%) | 0 (0.0%) |
| Transportation | 8 (100.0%) | 0 (0.0%) |
| Material Moving | 0 (0.0%) | 0 (0.0%) |
| Total (Category) | 22 (100.0%) | 0 (0.0%) |
| Total (Overall) | 66 (39.5%) | 101 (60.5%) |
Employment Industries by Sex in East Fork
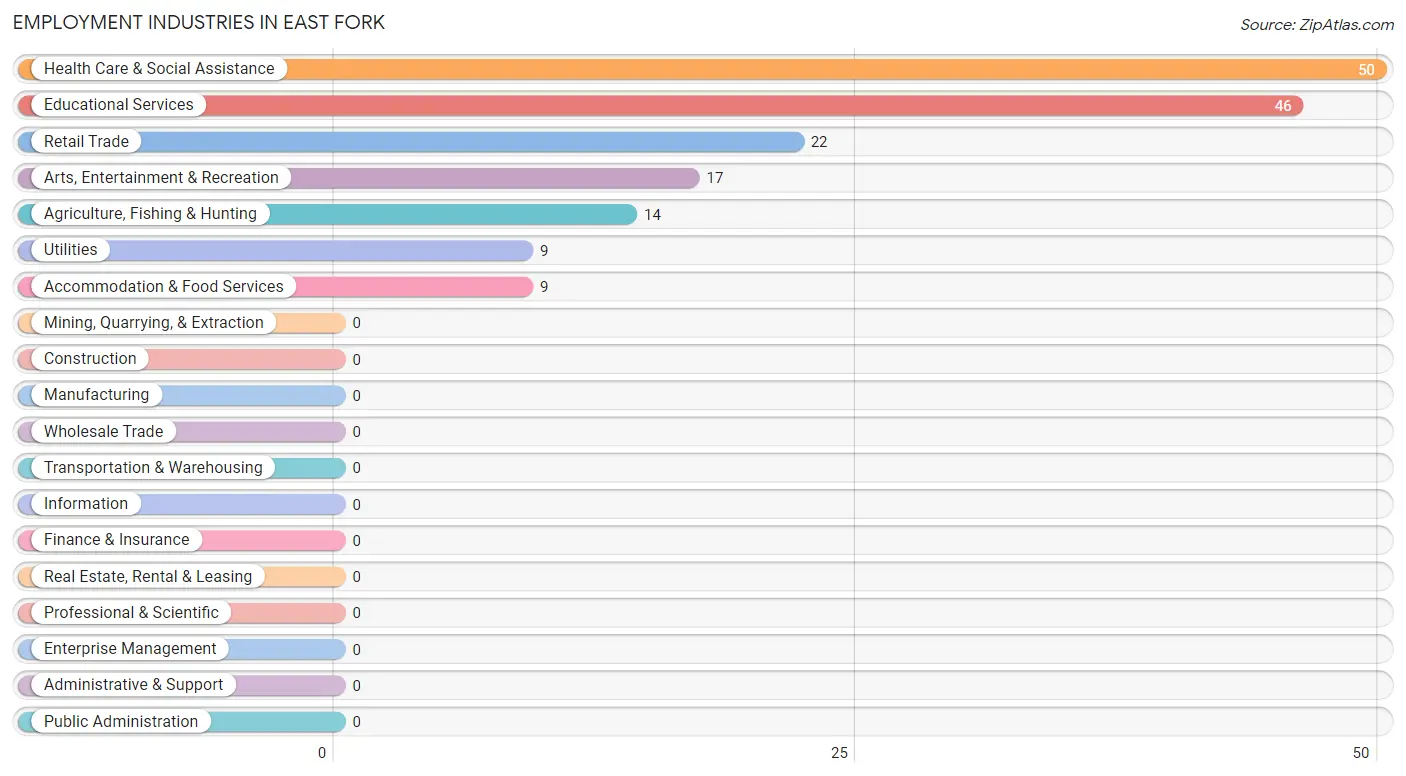
Employment Industries in East Fork
The major employment industries in East Fork include Health Care & Social Assistance (50 | 29.9%), Educational Services (46 | 27.5%), Retail Trade (22 | 13.2%), Arts, Entertainment & Recreation (17 | 10.2%), and Agriculture, Fishing & Hunting (14 | 8.4%).
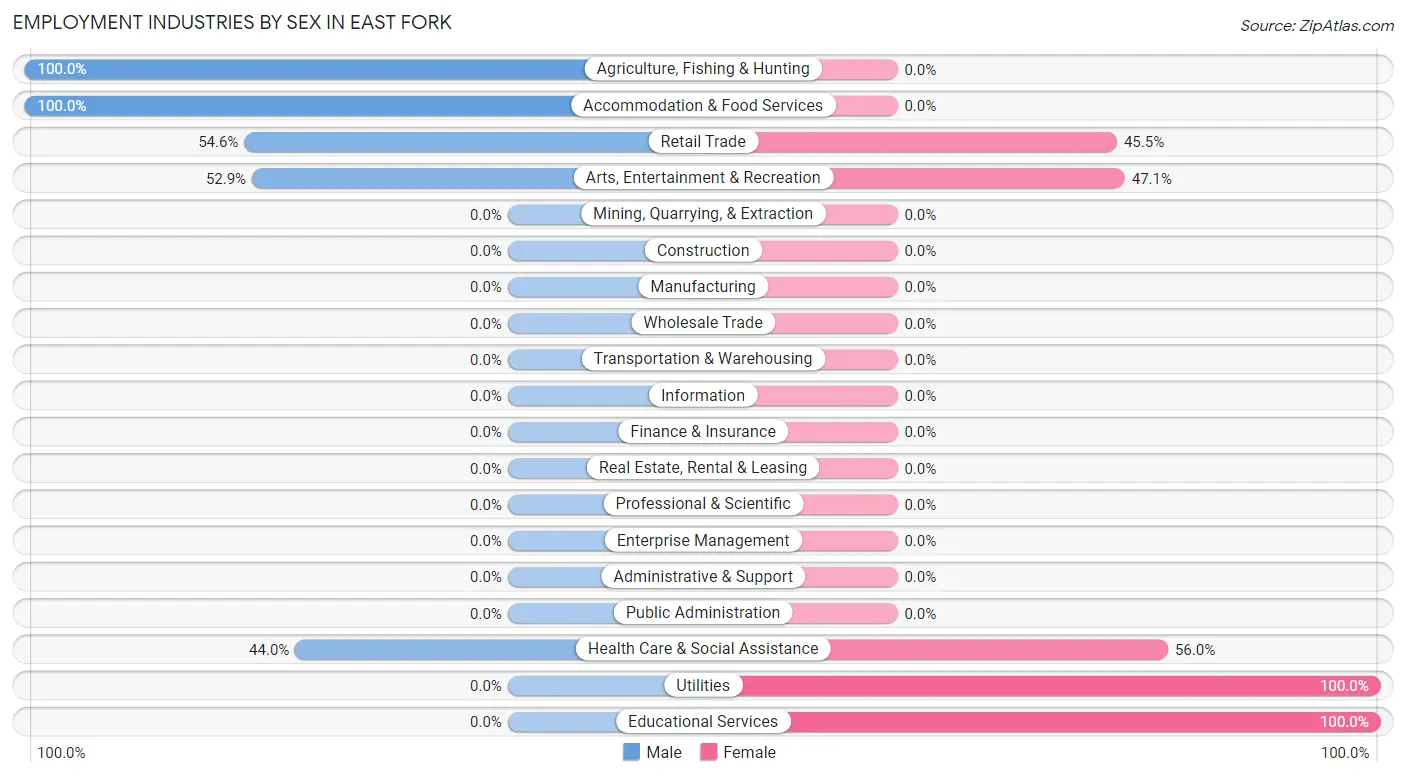
Employment Industries by Sex in East Fork
The East Fork industries that see more men than women are Agriculture, Fishing & Hunting (100.0%), Accommodation & Food Services (100.0%), and Retail Trade (54.5%), whereas the industries that tend to have a higher number of women are Utilities (100.0%), Educational Services (100.0%), and Health Care & Social Assistance (56.0%).
| Industry | Male | Female |
| Agriculture, Fishing & Hunting | 14 (100.0%) | 0 (0.0%) |
| Mining, Quarrying, & Extraction | 0 (0.0%) | 0 (0.0%) |
| Construction | 0 (0.0%) | 0 (0.0%) |
| Manufacturing | 0 (0.0%) | 0 (0.0%) |
| Wholesale Trade | 0 (0.0%) | 0 (0.0%) |
| Retail Trade | 12 (54.5%) | 10 (45.5%) |
| Transportation & Warehousing | 0 (0.0%) | 0 (0.0%) |
| Utilities | 0 (0.0%) | 9 (100.0%) |
| Information | 0 (0.0%) | 0 (0.0%) |
| Finance & Insurance | 0 (0.0%) | 0 (0.0%) |
| Real Estate, Rental & Leasing | 0 (0.0%) | 0 (0.0%) |
| Professional & Scientific | 0 (0.0%) | 0 (0.0%) |
| Enterprise Management | 0 (0.0%) | 0 (0.0%) |
| Administrative & Support | 0 (0.0%) | 0 (0.0%) |
| Educational Services | 0 (0.0%) | 46 (100.0%) |
| Health Care & Social Assistance | 22 (44.0%) | 28 (56.0%) |
| Arts, Entertainment & Recreation | 9 (52.9%) | 8 (47.1%) |
| Accommodation & Food Services | 9 (100.0%) | 0 (0.0%) |
| Public Administration | 0 (0.0%) | 0 (0.0%) |
| Total | 66 (39.5%) | 101 (60.5%) |
Education in East Fork
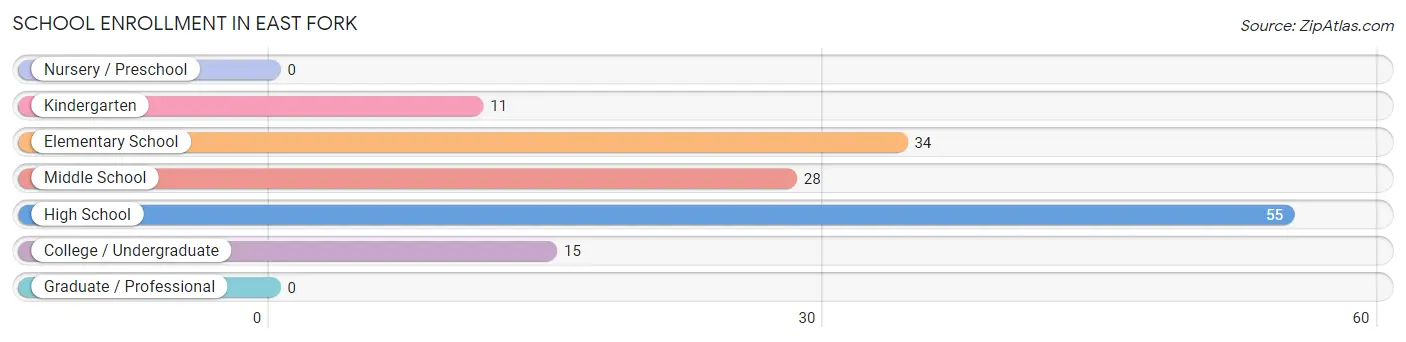
School Enrollment in East Fork
The most common levels of schooling among the 143 students in East Fork are high school (55 | 38.5%), elementary school (34 | 23.8%), and middle school (28 | 19.6%).
| School Level | # Students | % Students |
| Nursery / Preschool | 0 | 0.0% |
| Kindergarten | 11 | 7.7% |
| Elementary School | 34 | 23.8% |
| Middle School | 28 | 19.6% |
| High School | 55 | 38.5% |
| College / Undergraduate | 15 | 10.5% |
| Graduate / Professional | 0 | 0.0% |
| Total | 143 | 100.0% |
School Enrollment by Age by Funding Source in East Fork
Out of a total of 143 students who are enrolled in schools in East Fork, 1 (0.7%) attend a private institution, while the remaining 142 (99.3%) are enrolled in public schools. The age group of 35 years and over has the highest likelihood of being enrolled in private schools, with 1 (100.0% in the age bracket) enrolled. Conversely, the age group of 5 to 9 year old has the lowest likelihood of being enrolled in a private school, with 34 (100.0% in the age bracket) attending a public institution.
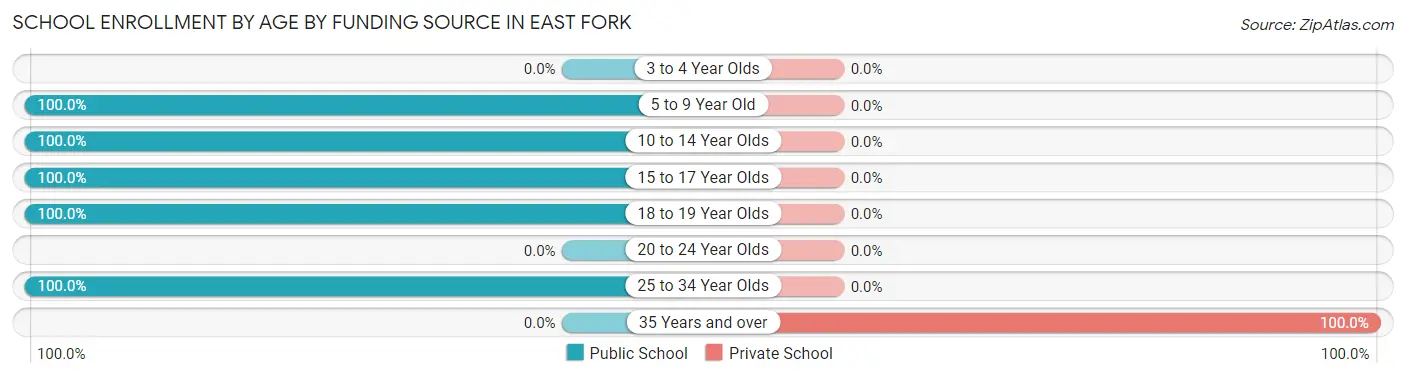
| Age Bracket | Public School | Private School |
| 3 to 4 Year Olds | 0 (0.0%) | 0 (0.0%) |
| 5 to 9 Year Old | 34 (100.0%) | 0 (0.0%) |
| 10 to 14 Year Olds | 44 (100.0%) | 0 (0.0%) |
| 15 to 17 Year Olds | 18 (100.0%) | 0 (0.0%) |
| 18 to 19 Year Olds | 31 (100.0%) | 0 (0.0%) |
| 20 to 24 Year Olds | 0 (0.0%) | 0 (0.0%) |
| 25 to 34 Year Olds | 15 (100.0%) | 0 (0.0%) |
| 35 Years and over | 0 (0.0%) | 1 (100.0%) |
| Total | 142 (99.3%) | 1 (0.7%) |
Educational Attainment by Field of Study in East Fork
, and science & technology (13 | 100.0%) are the most common fields of study among 13 individuals in East Fork who have obtained a bachelor's degree or higher.
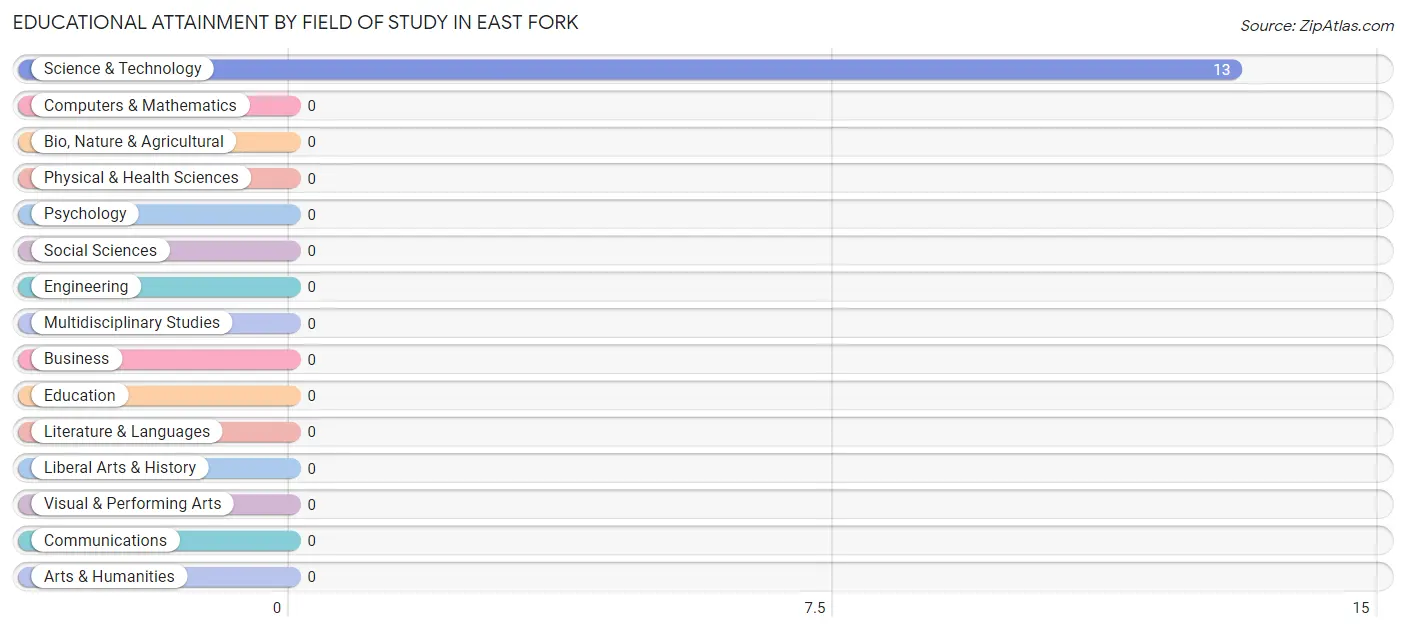
| Field of Study | # Graduates | % Graduates |
| Computers & Mathematics | 0 | 0.0% |
| Bio, Nature & Agricultural | 0 | 0.0% |
| Physical & Health Sciences | 0 | 0.0% |
| Psychology | 0 | 0.0% |
| Social Sciences | 0 | 0.0% |
| Engineering | 0 | 0.0% |
| Multidisciplinary Studies | 0 | 0.0% |
| Science & Technology | 13 | 100.0% |
| Business | 0 | 0.0% |
| Education | 0 | 0.0% |
| Literature & Languages | 0 | 0.0% |
| Liberal Arts & History | 0 | 0.0% |
| Visual & Performing Arts | 0 | 0.0% |
| Communications | 0 | 0.0% |
| Arts & Humanities | 0 | 0.0% |
| Total | 13 | 100.0% |
Transportation & Commute in East Fork
Vehicle Availability by Sex in East Fork
The most prevalent vehicle ownership categories in East Fork are males with 2 vehicles (37, accounting for 56.1%) and females with 2 vehicles (37, making up 36.6%).
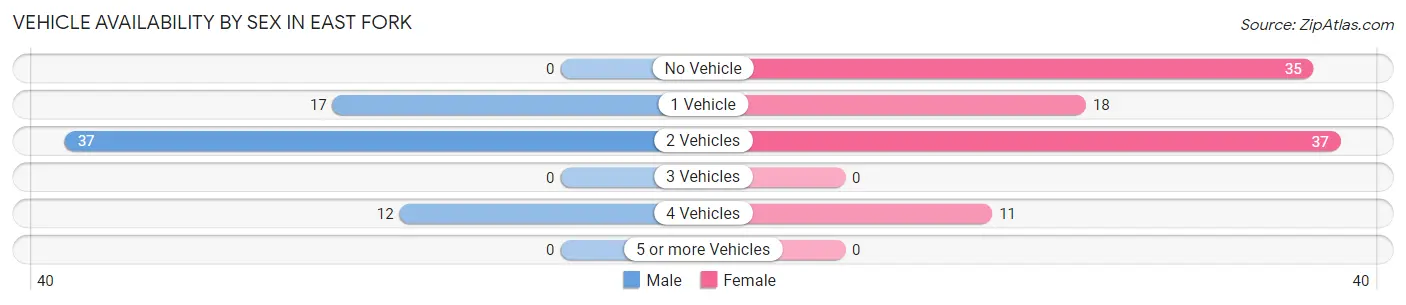
| Vehicles Available | Male | Female |
| No Vehicle | 0 (0.0%) | 35 (34.6%) |
| 1 Vehicle | 17 (25.8%) | 18 (17.8%) |
| 2 Vehicles | 37 (56.1%) | 37 (36.6%) |
| 3 Vehicles | 0 (0.0%) | 0 (0.0%) |
| 4 Vehicles | 12 (18.2%) | 11 (10.9%) |
| 5 or more Vehicles | 0 (0.0%) | 0 (0.0%) |
| Total | 66 (100.0%) | 101 (100.0%) |
Commute Time in East Fork
The most frequently occuring commute durations in East Fork are 10 to 14 minutes (61 commuters, 36.5%), 15 to 19 minutes (35 commuters, 21.0%), and 20 to 24 minutes (25 commuters, 15.0%).
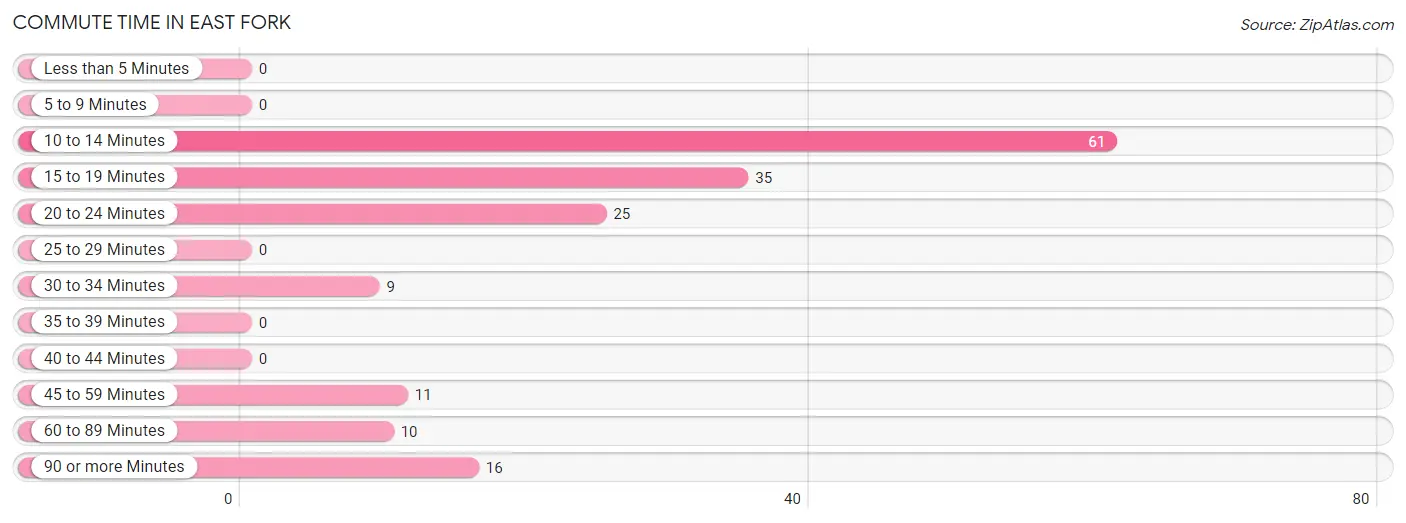
| Commute Time | # Commuters | % Commuters |
| Less than 5 Minutes | 0 | 0.0% |
| 5 to 9 Minutes | 0 | 0.0% |
| 10 to 14 Minutes | 61 | 36.5% |
| 15 to 19 Minutes | 35 | 21.0% |
| 20 to 24 Minutes | 25 | 15.0% |
| 25 to 29 Minutes | 0 | 0.0% |
| 30 to 34 Minutes | 9 | 5.4% |
| 35 to 39 Minutes | 0 | 0.0% |
| 40 to 44 Minutes | 0 | 0.0% |
| 45 to 59 Minutes | 11 | 6.6% |
| 60 to 89 Minutes | 10 | 6.0% |
| 90 or more Minutes | 16 | 9.6% |
Commute Time by Sex in East Fork
The most common commute times in East Fork are 10 to 14 minutes (37 commuters, 56.1%) for males and 15 to 19 minutes (35 commuters, 34.6%) for females.
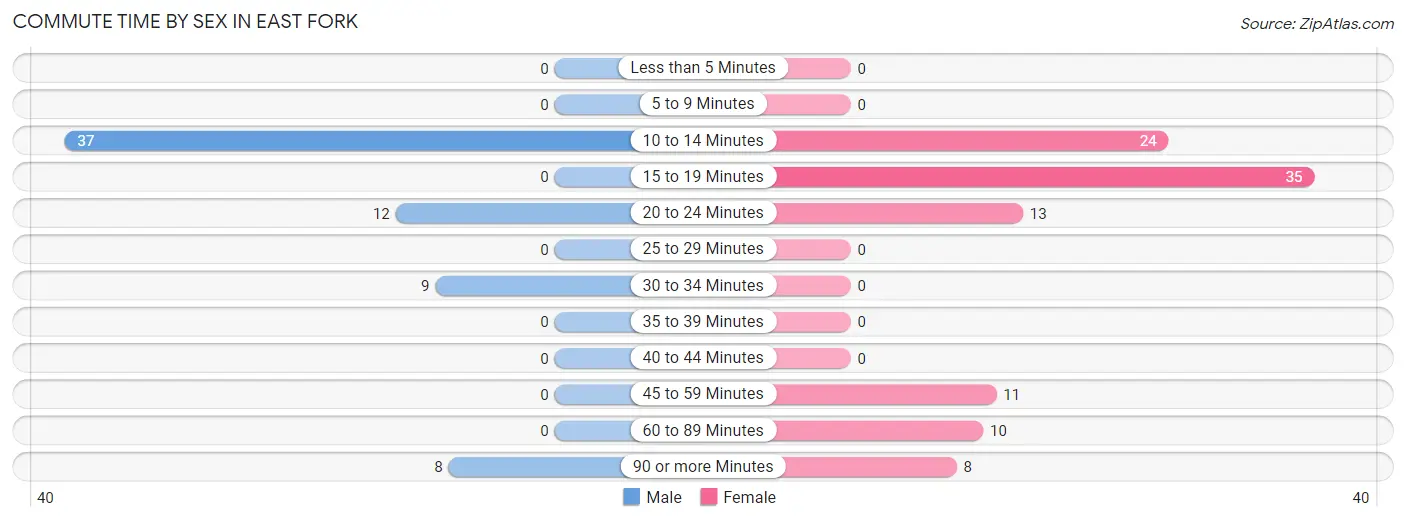
| Commute Time | Male | Female |
| Less than 5 Minutes | 0 (0.0%) | 0 (0.0%) |
| 5 to 9 Minutes | 0 (0.0%) | 0 (0.0%) |
| 10 to 14 Minutes | 37 (56.1%) | 24 (23.8%) |
| 15 to 19 Minutes | 0 (0.0%) | 35 (34.6%) |
| 20 to 24 Minutes | 12 (18.2%) | 13 (12.9%) |
| 25 to 29 Minutes | 0 (0.0%) | 0 (0.0%) |
| 30 to 34 Minutes | 9 (13.6%) | 0 (0.0%) |
| 35 to 39 Minutes | 0 (0.0%) | 0 (0.0%) |
| 40 to 44 Minutes | 0 (0.0%) | 0 (0.0%) |
| 45 to 59 Minutes | 0 (0.0%) | 11 (10.9%) |
| 60 to 89 Minutes | 0 (0.0%) | 10 (9.9%) |
| 90 or more Minutes | 8 (12.1%) | 8 (7.9%) |
Time of Departure to Work by Sex in East Fork
The most frequent times of departure to work in East Fork are 5:30 AM to 5:59 AM (36, 54.5%) for males and 6:30 AM to 6:59 AM (36, 35.6%) for females.
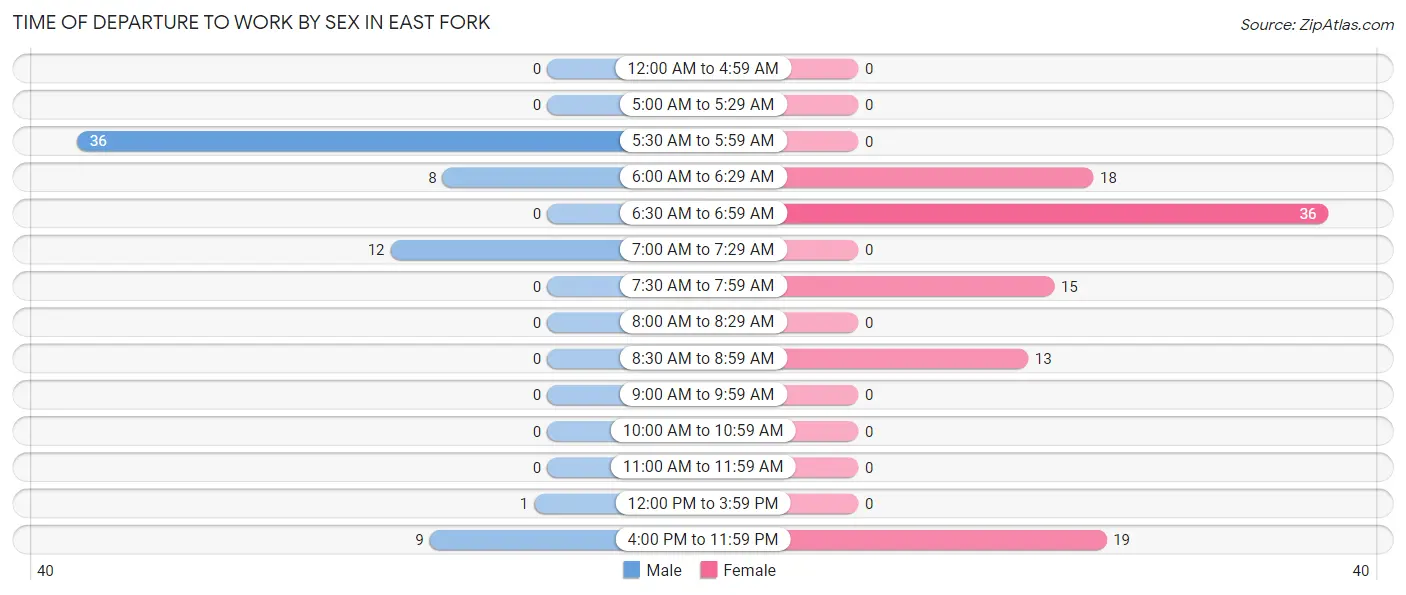
| Time of Departure | Male | Female |
| 12:00 AM to 4:59 AM | 0 (0.0%) | 0 (0.0%) |
| 5:00 AM to 5:29 AM | 0 (0.0%) | 0 (0.0%) |
| 5:30 AM to 5:59 AM | 36 (54.5%) | 0 (0.0%) |
| 6:00 AM to 6:29 AM | 8 (12.1%) | 18 (17.8%) |
| 6:30 AM to 6:59 AM | 0 (0.0%) | 36 (35.6%) |
| 7:00 AM to 7:29 AM | 12 (18.2%) | 0 (0.0%) |
| 7:30 AM to 7:59 AM | 0 (0.0%) | 15 (14.8%) |
| 8:00 AM to 8:29 AM | 0 (0.0%) | 0 (0.0%) |
| 8:30 AM to 8:59 AM | 0 (0.0%) | 13 (12.9%) |
| 9:00 AM to 9:59 AM | 0 (0.0%) | 0 (0.0%) |
| 10:00 AM to 10:59 AM | 0 (0.0%) | 0 (0.0%) |
| 11:00 AM to 11:59 AM | 0 (0.0%) | 0 (0.0%) |
| 12:00 PM to 3:59 PM | 1 (1.5%) | 0 (0.0%) |
| 4:00 PM to 11:59 PM | 9 (13.6%) | 19 (18.8%) |
| Total | 66 (100.0%) | 101 (100.0%) |
Housing Occupancy in East Fork
Occupancy by Ownership in East Fork
Of the total 132 dwellings in East Fork, owner-occupied units account for 74 (56.1%), while renter-occupied units make up 58 (43.9%).
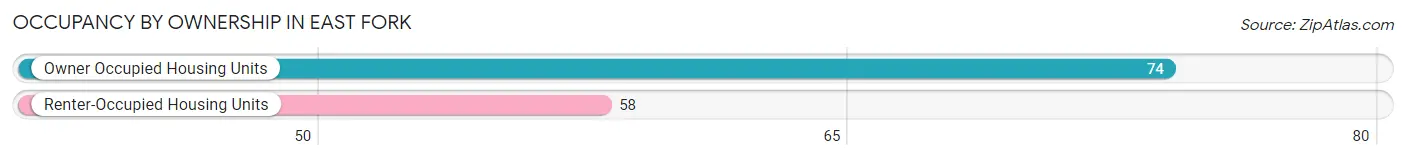
| Occupancy | # Housing Units | % Housing Units |
| Owner Occupied Housing Units | 74 | 56.1% |
| Renter-Occupied Housing Units | 58 | 43.9% |
| Total Occupied Housing Units | 132 | 100.0% |
Occupancy by Household Size in East Fork
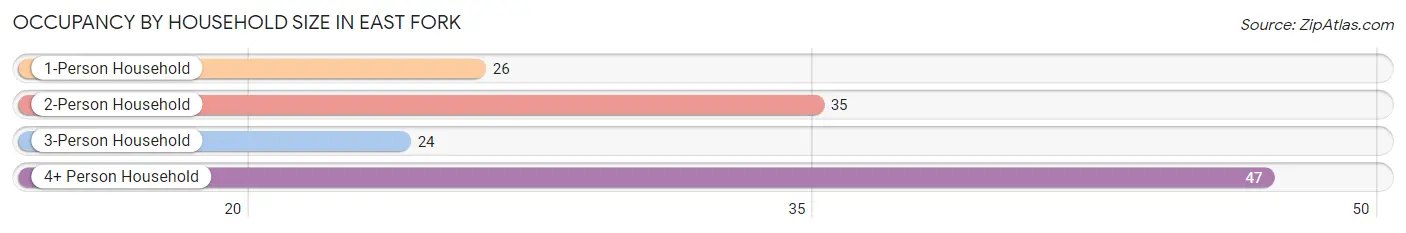
| Household Size | # Housing Units | % Housing Units |
| 1-Person Household | 26 | 19.7% |
| 2-Person Household | 35 | 26.5% |
| 3-Person Household | 24 | 18.2% |
| 4+ Person Household | 47 | 35.6% |
| Total Housing Units | 132 | 100.0% |
Occupancy by Ownership by Household Size in East Fork
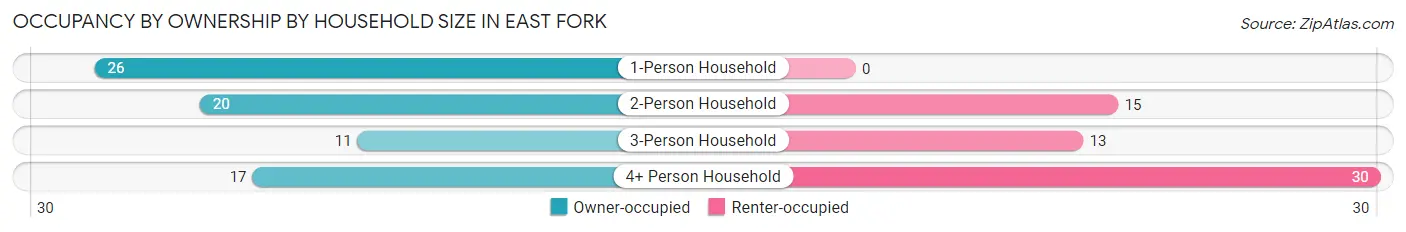
| Household Size | Owner-occupied | Renter-occupied |
| 1-Person Household | 26 (100.0%) | 0 (0.0%) |
| 2-Person Household | 20 (57.1%) | 15 (42.9%) |
| 3-Person Household | 11 (45.8%) | 13 (54.2%) |
| 4+ Person Household | 17 (36.2%) | 30 (63.8%) |
| Total Housing Units | 74 (56.1%) | 58 (43.9%) |
Occupancy by Educational Attainment in East Fork
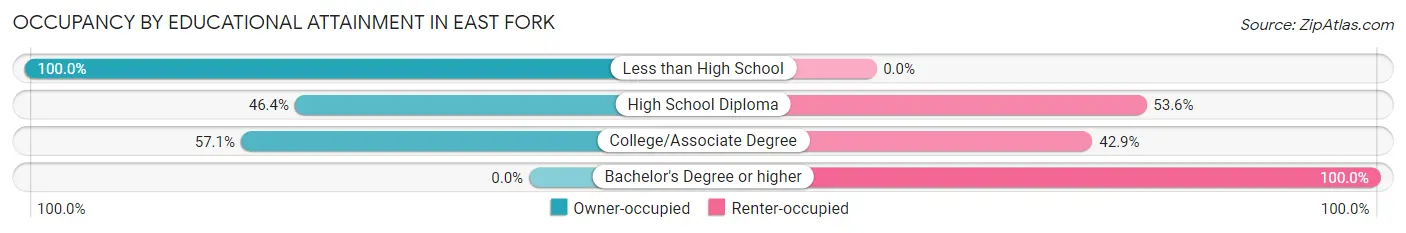
| Household Size | Owner-occupied | Renter-occupied |
| Less than High School | 28 (100.0%) | 0 (0.0%) |
| High School Diploma | 26 (46.4%) | 30 (53.6%) |
| College/Associate Degree | 20 (57.1%) | 15 (42.9%) |
| Bachelor's Degree or higher | 0 (0.0%) | 13 (100.0%) |
Occupancy by Age of Householder in East Fork
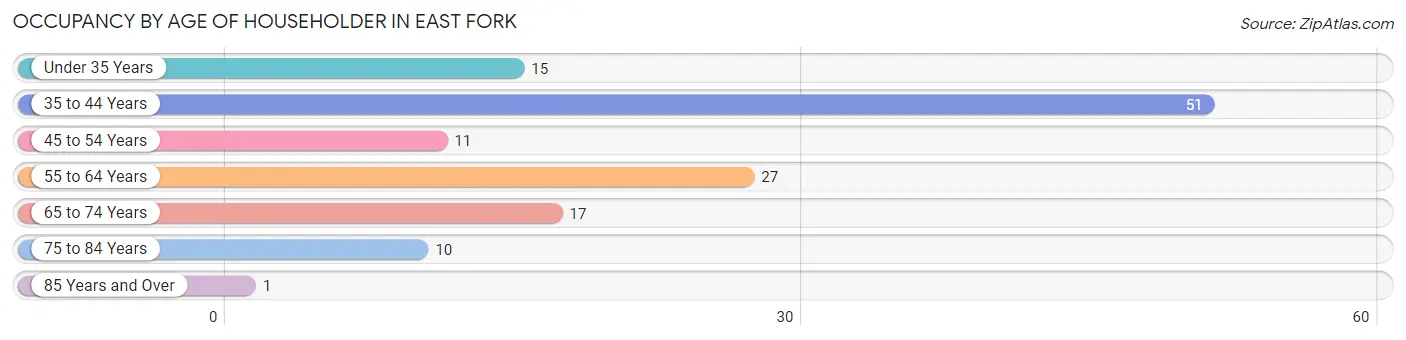
| Age Bracket | # Households | % Households |
| Under 35 Years | 15 | 11.4% |
| 35 to 44 Years | 51 | 38.6% |
| 45 to 54 Years | 11 | 8.3% |
| 55 to 64 Years | 27 | 20.4% |
| 65 to 74 Years | 17 | 12.9% |
| 75 to 84 Years | 10 | 7.6% |
| 85 Years and Over | 1 | 0.8% |
| Total | 132 | 100.0% |
Housing Finances in East Fork
Median Income by Occupancy in East Fork
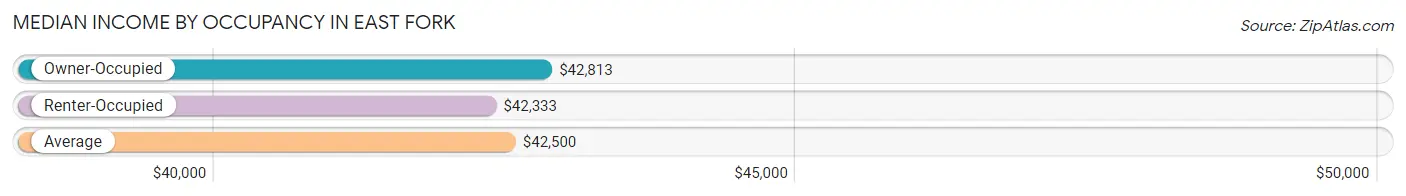
| Occupancy Type | # Households | Median Income |
| Owner-Occupied | 74 (56.1%) | $42,813 |
| Renter-Occupied | 58 (43.9%) | $42,333 |
| Average | 132 (100.0%) | $42,500 |
Occupancy by Householder Income Bracket in East Fork
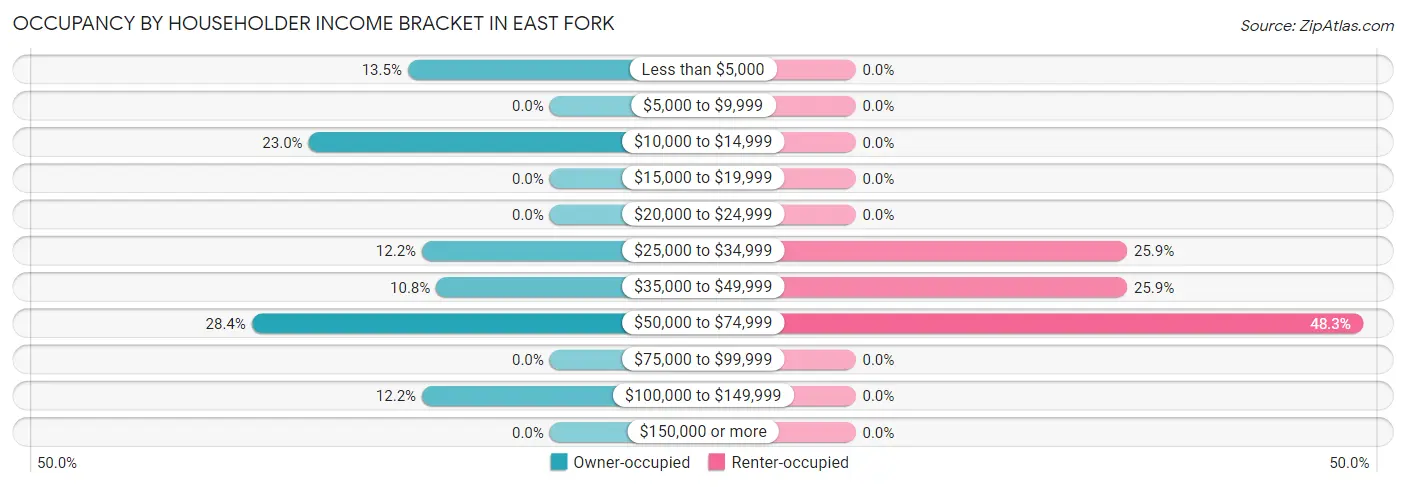
| Income Bracket | Owner-occupied | Renter-occupied |
| Less than $5,000 | 10 (13.5%) | 0 (0.0%) |
| $5,000 to $9,999 | 0 (0.0%) | 0 (0.0%) |
| $10,000 to $14,999 | 17 (23.0%) | 0 (0.0%) |
| $15,000 to $19,999 | 0 (0.0%) | 0 (0.0%) |
| $20,000 to $24,999 | 0 (0.0%) | 0 (0.0%) |
| $25,000 to $34,999 | 9 (12.2%) | 15 (25.9%) |
| $35,000 to $49,999 | 8 (10.8%) | 15 (25.9%) |
| $50,000 to $74,999 | 21 (28.4%) | 28 (48.3%) |
| $75,000 to $99,999 | 0 (0.0%) | 0 (0.0%) |
| $100,000 to $149,999 | 9 (12.2%) | 0 (0.0%) |
| $150,000 or more | 0 (0.0%) | 0 (0.0%) |
| Total | 74 (100.0%) | 58 (100.0%) |
Monthly Housing Cost Tiers in East Fork
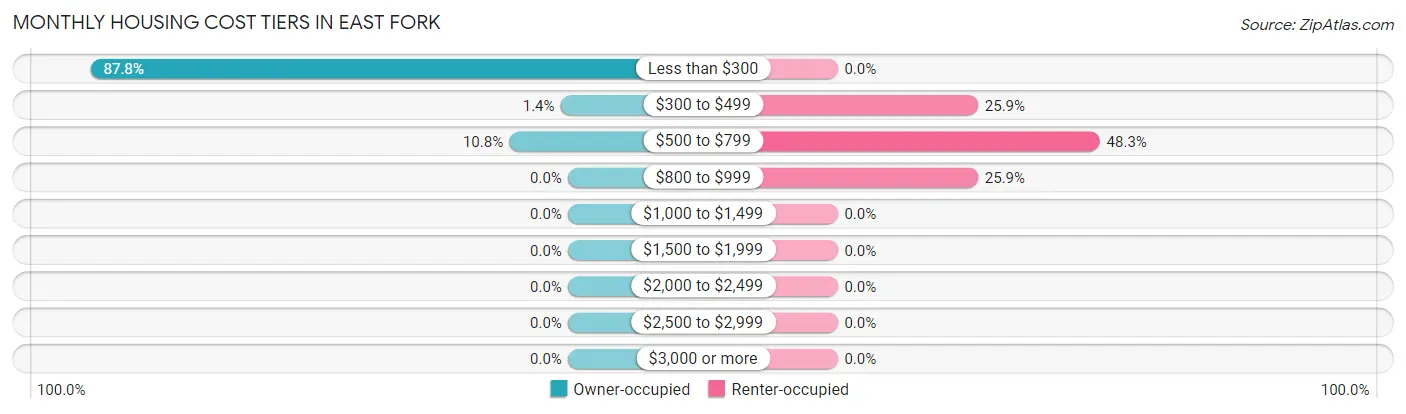
| Monthly Cost | Owner-occupied | Renter-occupied |
| Less than $300 | 65 (87.8%) | 0 (0.0%) |
| $300 to $499 | 1 (1.3%) | 15 (25.9%) |
| $500 to $799 | 8 (10.8%) | 28 (48.3%) |
| $800 to $999 | 0 (0.0%) | 15 (25.9%) |
| $1,000 to $1,499 | 0 (0.0%) | 0 (0.0%) |
| $1,500 to $1,999 | 0 (0.0%) | 0 (0.0%) |
| $2,000 to $2,499 | 0 (0.0%) | 0 (0.0%) |
| $2,500 to $2,999 | 0 (0.0%) | 0 (0.0%) |
| $3,000 or more | 0 (0.0%) | 0 (0.0%) |
| Total | 74 (100.0%) | 58 (100.0%) |
Physical Housing Characteristics in East Fork
Housing Structures in East Fork
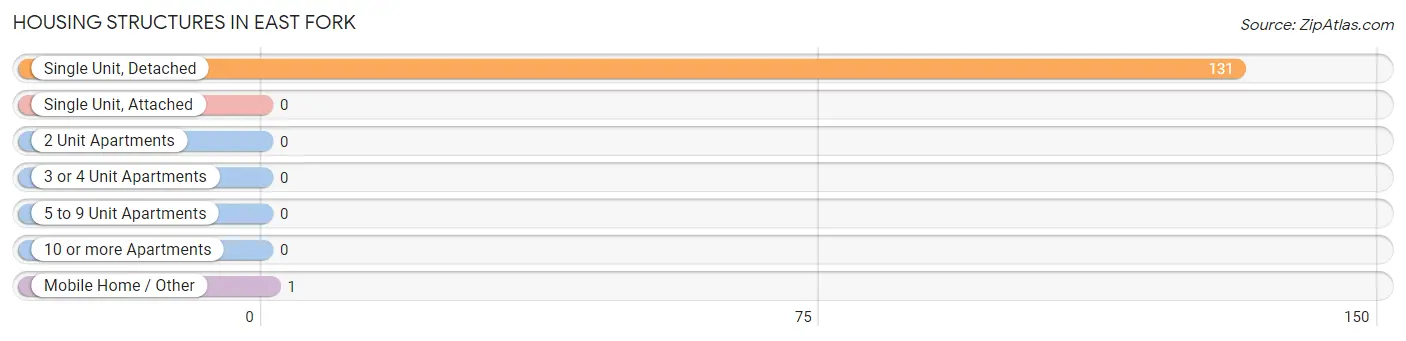
| Structure Type | # Housing Units | % Housing Units |
| Single Unit, Detached | 131 | 99.2% |
| Single Unit, Attached | 0 | 0.0% |
| 2 Unit Apartments | 0 | 0.0% |
| 3 or 4 Unit Apartments | 0 | 0.0% |
| 5 to 9 Unit Apartments | 0 | 0.0% |
| 10 or more Apartments | 0 | 0.0% |
| Mobile Home / Other | 1 | 0.8% |
| Total | 132 | 100.0% |
Housing Structures by Occupancy in East Fork
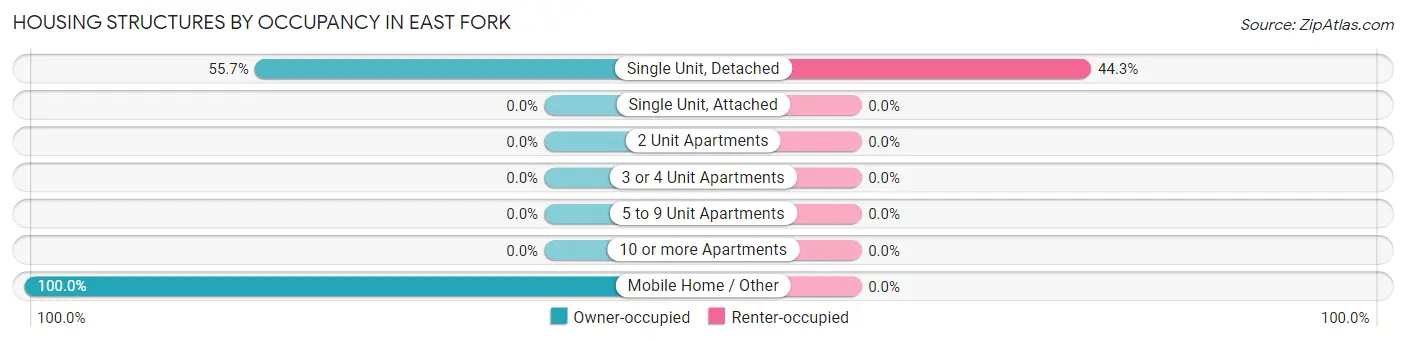
| Structure Type | Owner-occupied | Renter-occupied |
| Single Unit, Detached | 73 (55.7%) | 58 (44.3%) |
| Single Unit, Attached | 0 (0.0%) | 0 (0.0%) |
| 2 Unit Apartments | 0 (0.0%) | 0 (0.0%) |
| 3 or 4 Unit Apartments | 0 (0.0%) | 0 (0.0%) |
| 5 to 9 Unit Apartments | 0 (0.0%) | 0 (0.0%) |
| 10 or more Apartments | 0 (0.0%) | 0 (0.0%) |
| Mobile Home / Other | 1 (100.0%) | 0 (0.0%) |
| Total | 74 (56.1%) | 58 (43.9%) |
Housing Structures by Number of Rooms in East Fork
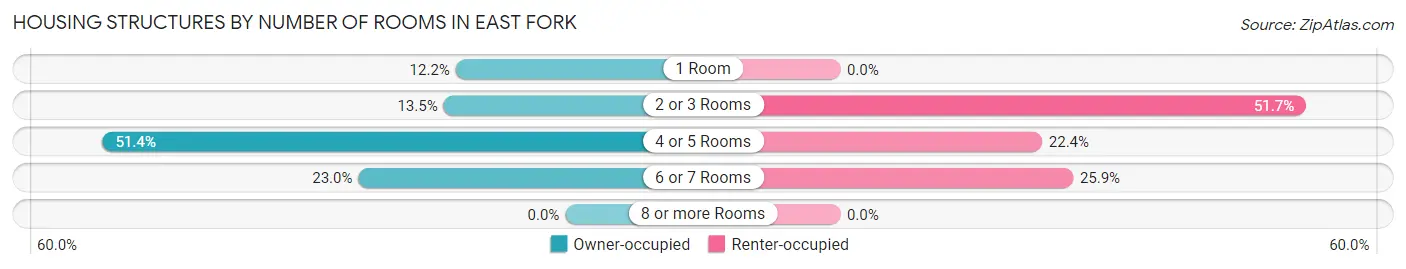
| Number of Rooms | Owner-occupied | Renter-occupied |
| 1 Room | 9 (12.2%) | 0 (0.0%) |
| 2 or 3 Rooms | 10 (13.5%) | 30 (51.7%) |
| 4 or 5 Rooms | 38 (51.3%) | 13 (22.4%) |
| 6 or 7 Rooms | 17 (23.0%) | 15 (25.9%) |
| 8 or more Rooms | 0 (0.0%) | 0 (0.0%) |
| Total | 74 (100.0%) | 58 (100.0%) |
Housing Structure by Heating Type in East Fork
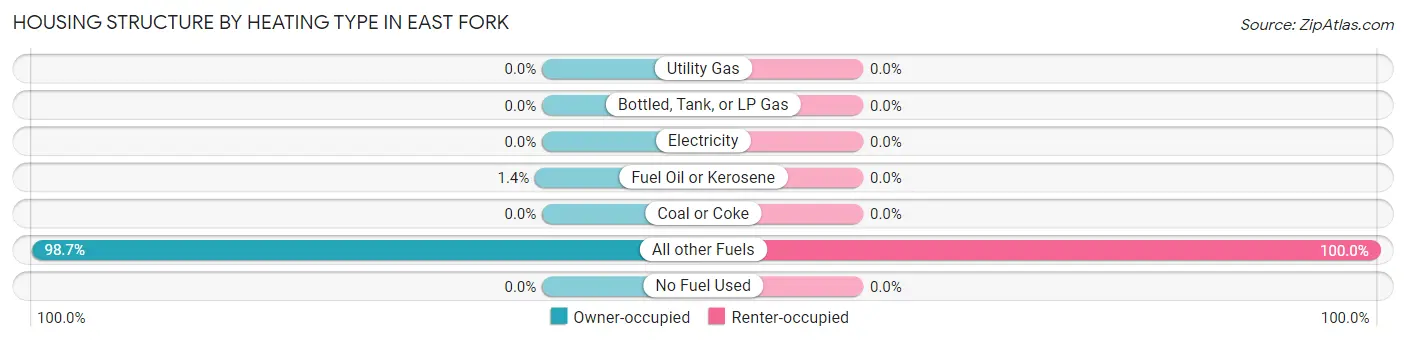
| Heating Type | Owner-occupied | Renter-occupied |
| Utility Gas | 0 (0.0%) | 0 (0.0%) |
| Bottled, Tank, or LP Gas | 0 (0.0%) | 0 (0.0%) |
| Electricity | 0 (0.0%) | 0 (0.0%) |
| Fuel Oil or Kerosene | 1 (1.3%) | 0 (0.0%) |
| Coal or Coke | 0 (0.0%) | 0 (0.0%) |
| All other Fuels | 73 (98.7%) | 58 (100.0%) |
| No Fuel Used | 0 (0.0%) | 0 (0.0%) |
| Total | 74 (100.0%) | 58 (100.0%) |
Household Vehicle Usage in East Fork
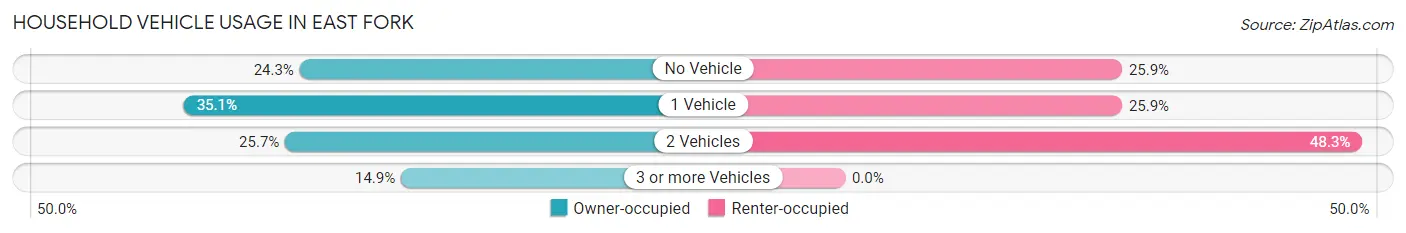
| Vehicles per Household | Owner-occupied | Renter-occupied |
| No Vehicle | 18 (24.3%) | 15 (25.9%) |
| 1 Vehicle | 26 (35.1%) | 15 (25.9%) |
| 2 Vehicles | 19 (25.7%) | 28 (48.3%) |
| 3 or more Vehicles | 11 (14.9%) | 0 (0.0%) |
| Total | 74 (100.0%) | 58 (100.0%) |
Real Estate & Mortgages in East Fork
Real Estate and Mortgage Overview in East Fork
| Characteristic | Without Mortgage | With Mortgage |
| Housing Units | 74 | 0 |
| Median Property Value | $151,400 | $0 |
| Median Household Income | $42,813 | $0 |
| Monthly Housing Costs | $207 | $0 |
| Real Estate Taxes | - | - |
Property Value by Mortgage Status in East Fork
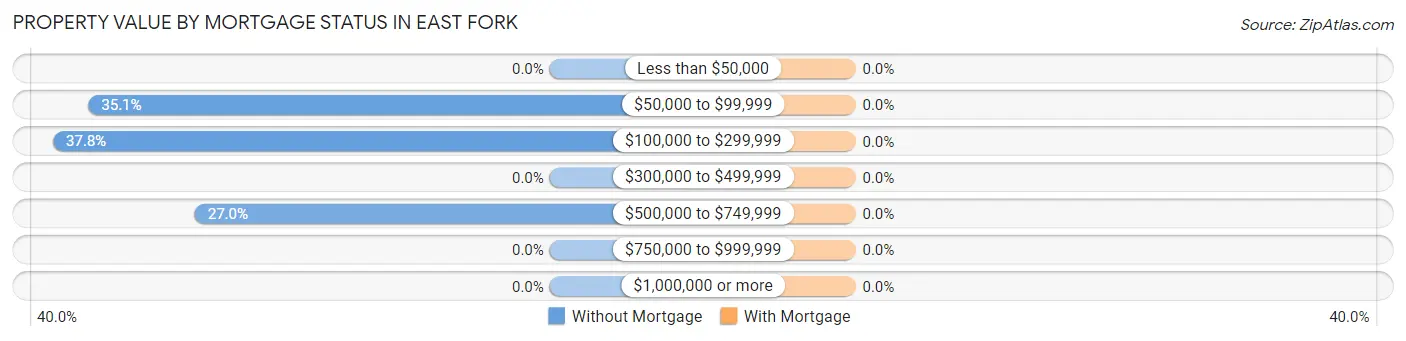
| Property Value | Without Mortgage | With Mortgage |
| Less than $50,000 | 0 (0.0%) | 0 (0.0%) |
| $50,000 to $99,999 | 26 (35.1%) | 0 (0.0%) |
| $100,000 to $299,999 | 28 (37.8%) | 0 (0.0%) |
| $300,000 to $499,999 | 0 (0.0%) | 0 (0.0%) |
| $500,000 to $749,999 | 20 (27.0%) | 0 (0.0%) |
| $750,000 to $999,999 | 0 (0.0%) | 0 (0.0%) |
| $1,000,000 or more | 0 (0.0%) | 0 (0.0%) |
| Total | 74 (100.0%) | 0 (0.0%) |
Household Income by Mortgage Status in East Fork
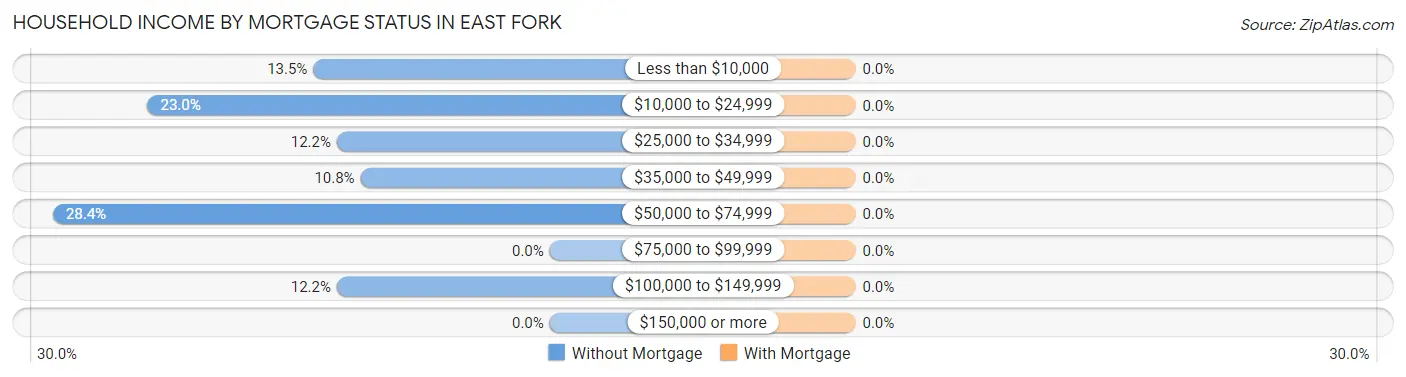
| Household Income | Without Mortgage | With Mortgage |
| Less than $10,000 | 10 (13.5%) | 0 (0.0%) |
| $10,000 to $24,999 | 17 (23.0%) | 0 (0.0%) |
| $25,000 to $34,999 | 9 (12.2%) | 0 (0.0%) |
| $35,000 to $49,999 | 8 (10.8%) | 0 (0.0%) |
| $50,000 to $74,999 | 21 (28.4%) | 0 (0.0%) |
| $75,000 to $99,999 | 0 (0.0%) | 0 (0.0%) |
| $100,000 to $149,999 | 9 (12.2%) | 0 (0.0%) |
| $150,000 or more | 0 (0.0%) | 0 (0.0%) |
| Total | 74 (100.0%) | 0 (0.0%) |
Property Value to Household Income Ratio in East Fork
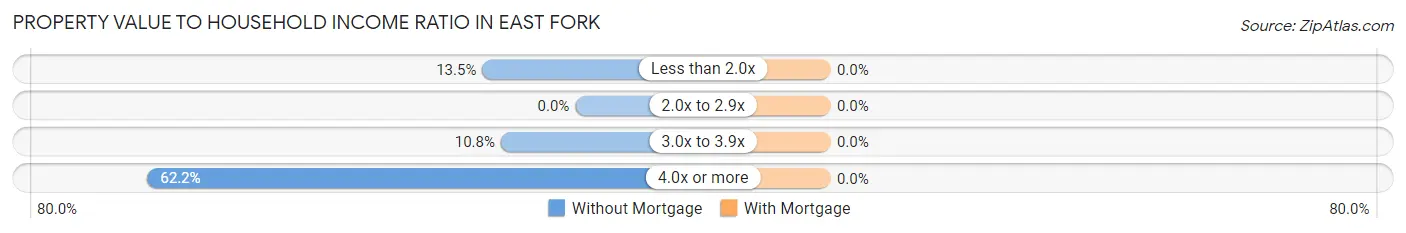
| Value-to-Income Ratio | Without Mortgage | With Mortgage |
| Less than 2.0x | 10 (13.5%) | 0 (0.0%) |
| 2.0x to 2.9x | 0 (0.0%) | 0 (0.0%) |
| 3.0x to 3.9x | 8 (10.8%) | 0 (0.0%) |
| 4.0x or more | 46 (62.2%) | 0 (0.0%) |
| Total | 74 (100.0%) | 0 (0.0%) |
Real Estate Taxes by Mortgage Status in East Fork
| Property Taxes | Without Mortgage | With Mortgage |
| Less than $800 | 0 (0.0%) | 0 (0.0%) |
| $800 to $1,499 | 0 (0.0%) | 0 (0.0%) |
| $800 to $1,499 | 0 (0.0%) | 0 (0.0%) |
| Total | 74 (100.0%) | 0 (0.0%) |
Health & Disability in East Fork
Health Insurance Coverage by Age in East Fork
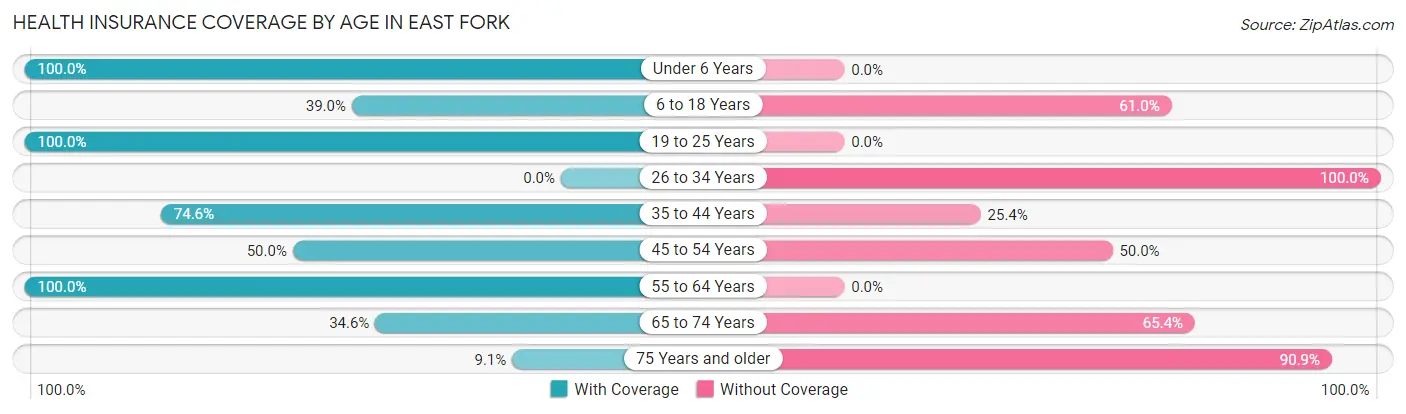
| Age Bracket | With Coverage | Without Coverage |
| Under 6 Years | 29 (100.0%) | 0 (0.0%) |
| 6 to 18 Years | 62 (39.0%) | 97 (61.0%) |
| 19 to 25 Years | 86 (100.0%) | 0 (0.0%) |
| 26 to 34 Years | 0 (0.0%) | 10 (100.0%) |
| 35 to 44 Years | 44 (74.6%) | 15 (25.4%) |
| 45 to 54 Years | 11 (50.0%) | 11 (50.0%) |
| 55 to 64 Years | 37 (100.0%) | 0 (0.0%) |
| 65 to 74 Years | 9 (34.6%) | 17 (65.4%) |
| 75 Years and older | 1 (9.1%) | 10 (90.9%) |
| Total | 279 (63.5%) | 160 (36.4%) |
Health Insurance Coverage by Citizenship Status in East Fork
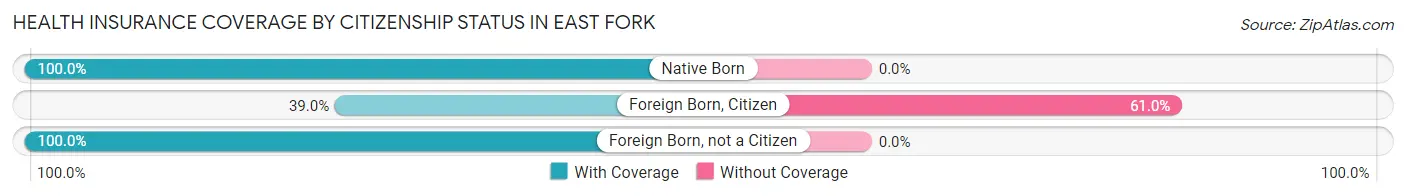
| Citizenship Status | With Coverage | Without Coverage |
| Native Born | 29 (100.0%) | 0 (0.0%) |
| Foreign Born, Citizen | 62 (39.0%) | 97 (61.0%) |
| Foreign Born, not a Citizen | 86 (100.0%) | 0 (0.0%) |
Health Insurance Coverage by Household Income in East Fork
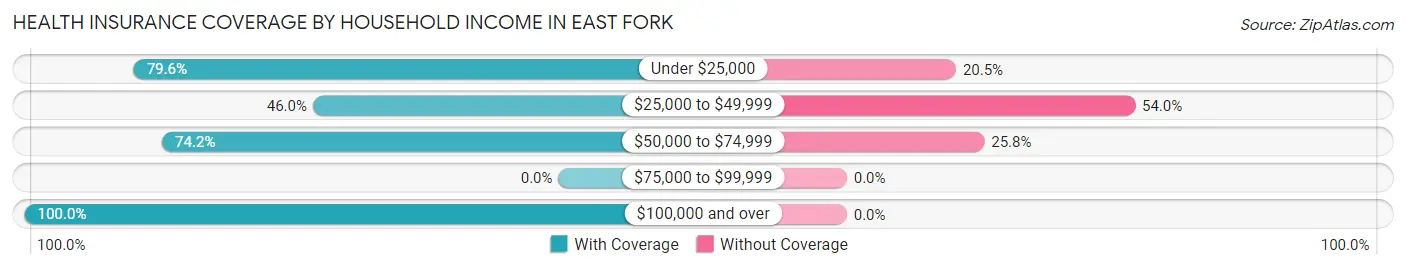
| Household Income | With Coverage | Without Coverage |
| Under $25,000 | 70 (79.5%) | 18 (20.4%) |
| $25,000 to $49,999 | 92 (46.0%) | 108 (54.0%) |
| $50,000 to $74,999 | 98 (74.2%) | 34 (25.8%) |
| $75,000 to $99,999 | 0 (0.0%) | 0 (0.0%) |
| $100,000 and over | 19 (100.0%) | 0 (0.0%) |
Public vs Private Health Insurance Coverage by Age in East Fork
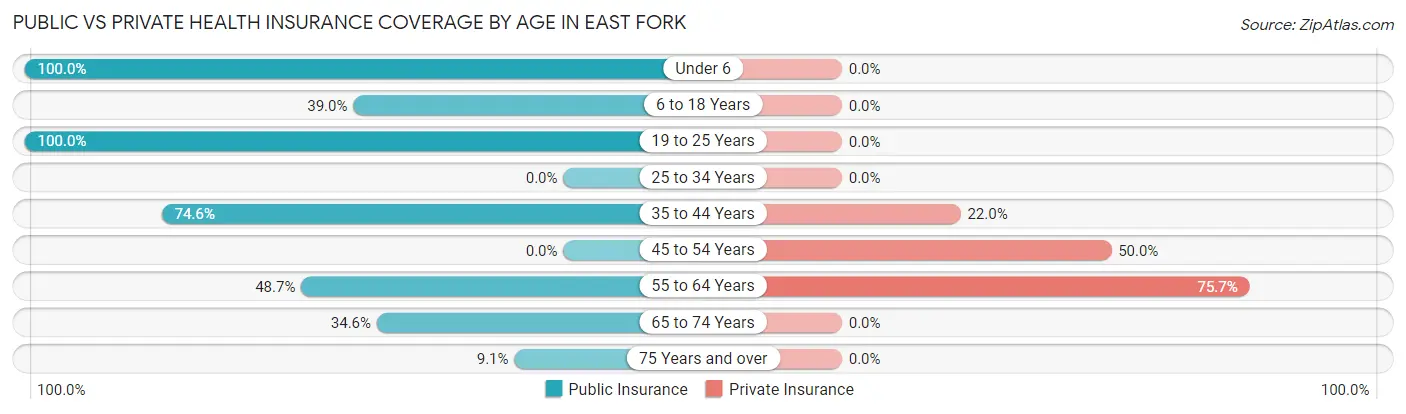
| Age Bracket | Public Insurance | Private Insurance |
| Under 6 | 29 (100.0%) | 0 (0.0%) |
| 6 to 18 Years | 62 (39.0%) | 0 (0.0%) |
| 19 to 25 Years | 86 (100.0%) | 0 (0.0%) |
| 25 to 34 Years | 0 (0.0%) | 0 (0.0%) |
| 35 to 44 Years | 44 (74.6%) | 13 (22.0%) |
| 45 to 54 Years | 0 (0.0%) | 11 (50.0%) |
| 55 to 64 Years | 18 (48.6%) | 28 (75.7%) |
| 65 to 74 Years | 9 (34.6%) | 0 (0.0%) |
| 75 Years and over | 1 (9.1%) | 0 (0.0%) |
| Total | 249 (56.7%) | 52 (11.8%) |
Disability Status by Sex by Age in East Fork
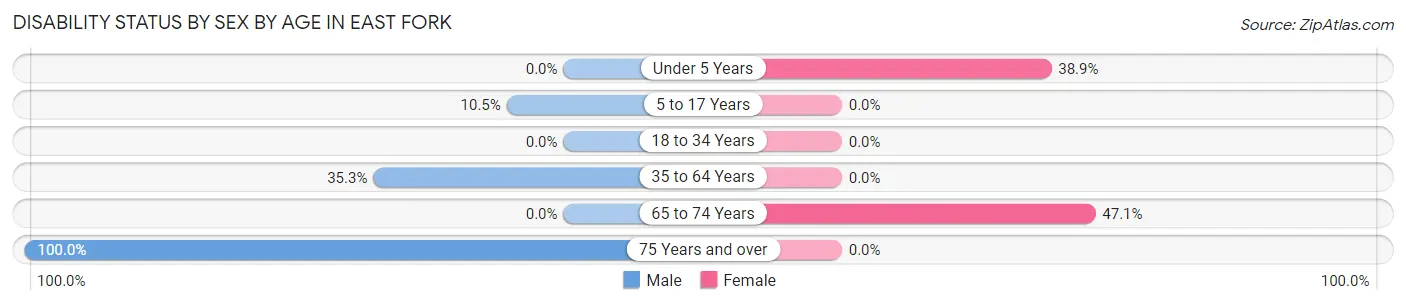
| Age Bracket | Male | Female |
| Under 5 Years | 0 (0.0%) | 7 (38.9%) |
| 5 to 17 Years | 6 (10.5%) | 0 (0.0%) |
| 18 to 34 Years | 0 (0.0%) | 0 (0.0%) |
| 35 to 64 Years | 18 (35.3%) | 0 (0.0%) |
| 65 to 74 Years | 0 (0.0%) | 8 (47.1%) |
| 75 Years and over | 1 (100.0%) | 0 (0.0%) |
Disability Class by Sex by Age in East Fork
Disability Class: Hearing Difficulty
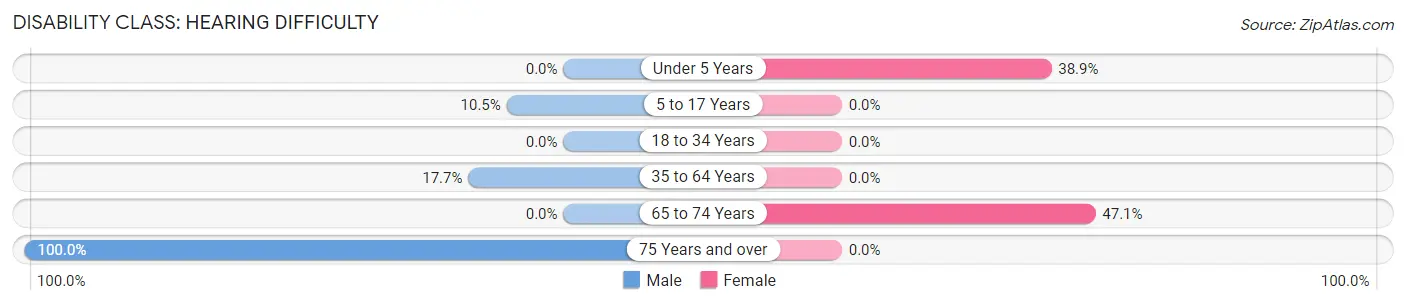
| Age Bracket | Male | Female |
| Under 5 Years | 0 (0.0%) | 7 (38.9%) |
| 5 to 17 Years | 6 (10.5%) | 0 (0.0%) |
| 18 to 34 Years | 0 (0.0%) | 0 (0.0%) |
| 35 to 64 Years | 9 (17.6%) | 0 (0.0%) |
| 65 to 74 Years | 0 (0.0%) | 8 (47.1%) |
| 75 Years and over | 1 (100.0%) | 0 (0.0%) |
Disability Class: Vision Difficulty
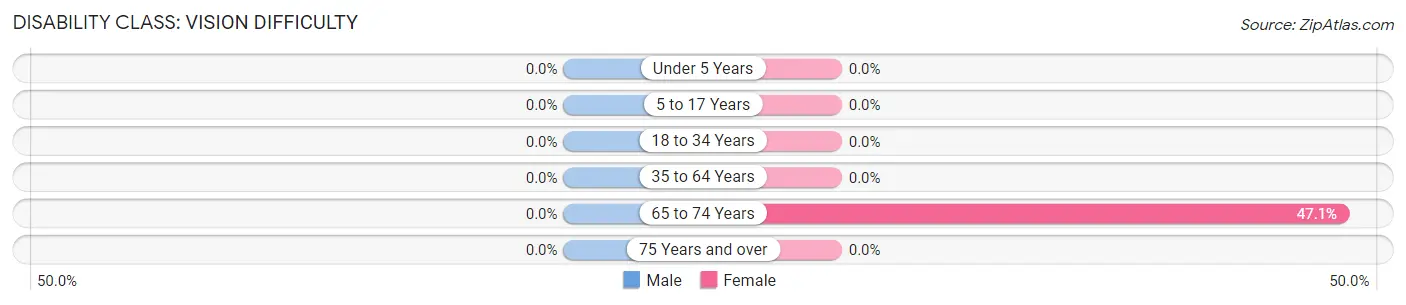
| Age Bracket | Male | Female |
| Under 5 Years | 0 (0.0%) | 0 (0.0%) |
| 5 to 17 Years | 0 (0.0%) | 0 (0.0%) |
| 18 to 34 Years | 0 (0.0%) | 0 (0.0%) |
| 35 to 64 Years | 0 (0.0%) | 0 (0.0%) |
| 65 to 74 Years | 0 (0.0%) | 8 (47.1%) |
| 75 Years and over | 0 (0.0%) | 0 (0.0%) |
Disability Class: Cognitive Difficulty

| Age Bracket | Male | Female |
| 5 to 17 Years | 0 (0.0%) | 0 (0.0%) |
| 18 to 34 Years | 0 (0.0%) | 0 (0.0%) |
| 35 to 64 Years | 9 (17.6%) | 0 (0.0%) |
| 65 to 74 Years | 0 (0.0%) | 8 (47.1%) |
| 75 Years and over | 1 (100.0%) | 0 (0.0%) |
Disability Class: Ambulatory Difficulty
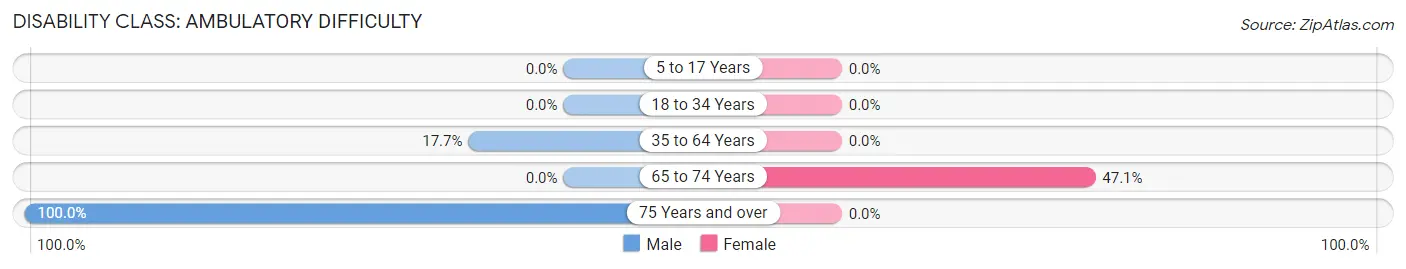
| Age Bracket | Male | Female |
| 5 to 17 Years | 0 (0.0%) | 0 (0.0%) |
| 18 to 34 Years | 0 (0.0%) | 0 (0.0%) |
| 35 to 64 Years | 9 (17.6%) | 0 (0.0%) |
| 65 to 74 Years | 0 (0.0%) | 8 (47.1%) |
| 75 Years and over | 1 (100.0%) | 0 (0.0%) |
Disability Class: Self-Care Difficulty
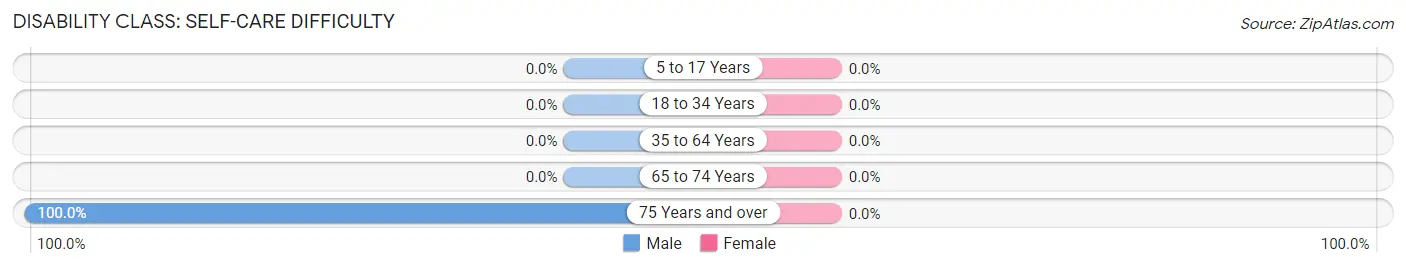
| Age Bracket | Male | Female |
| 5 to 17 Years | 0 (0.0%) | 0 (0.0%) |
| 18 to 34 Years | 0 (0.0%) | 0 (0.0%) |
| 35 to 64 Years | 0 (0.0%) | 0 (0.0%) |
| 65 to 74 Years | 0 (0.0%) | 0 (0.0%) |
| 75 Years and over | 1 (100.0%) | 0 (0.0%) |
Technology Access in East Fork
Computing Device Access in East Fork
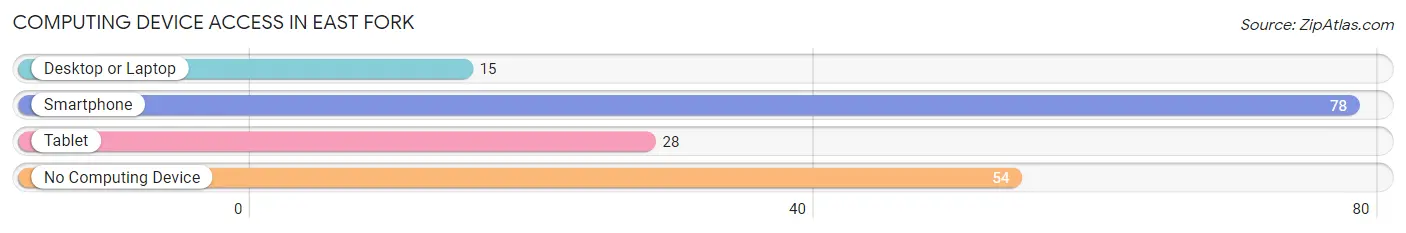
| Device Type | # Households | % Households |
| Desktop or Laptop | 15 | 11.4% |
| Smartphone | 78 | 59.1% |
| Tablet | 28 | 21.2% |
| No Computing Device | 54 | 40.9% |
| Total | 132 | 100.0% |
Internet Access in East Fork
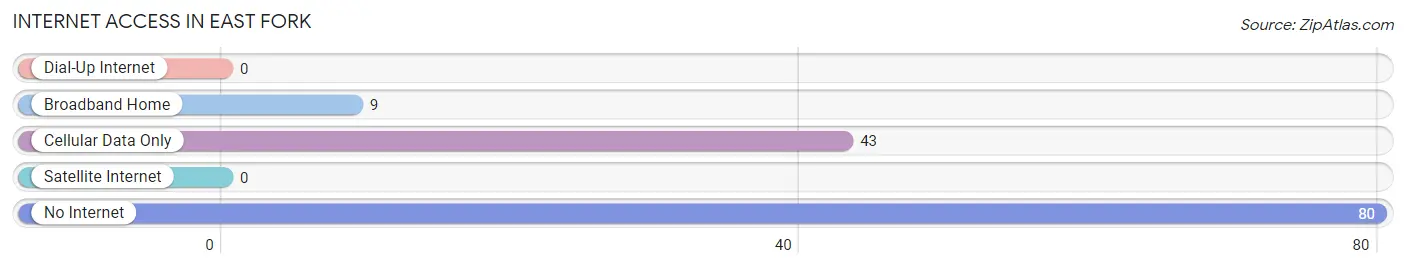
| Internet Type | # Households | % Households |
| Dial-Up Internet | 0 | 0.0% |
| Broadband Home | 9 | 6.8% |
| Cellular Data Only | 43 | 32.6% |
| Satellite Internet | 0 | 0.0% |
| No Internet | 80 | 60.6% |
| Total | 132 | 100.0% |
East Fork Summary
History
East Fork is a small unincorporated community located in the White Mountains of Arizona. It is situated in Navajo County, approximately 20 miles east of Show Low. The area was first settled in the late 1800s by Mormon pioneers who were looking for a place to homestead. The first settlers were the families of John and Mary Ann Smith, who arrived in 1881. They were followed by other families, including the families of William and Mary Ann Smith, John and Sarah Smith, and William and Mary Ann Smith.
The area was originally known as Smithville, but the name was changed to East Fork in 1891 when the post office was established. The name was chosen to reflect the fact that the community was located at the east fork of the Little Colorado River.
The area was primarily used for ranching and farming, and the Smiths were among the first to establish a ranch in the area. The Smiths also built a sawmill and a gristmill, which were used to process lumber and grain.
In the early 1900s, the area began to attract tourists who were drawn to the area’s natural beauty. The first hotel was built in 1910, and the area soon became a popular destination for fishing, hunting, and camping.
In the 1950s, the area began to experience a population boom as people moved to the area to take advantage of the area’s natural resources. The population of East Fork grew from just over 200 in 1950 to over 1,000 by the end of the decade.
Geography
East Fork is located in the White Mountains of Arizona, approximately 20 miles east of Show Low. The area is characterized by rolling hills, pine forests, and grassy meadows. The Little Colorado River runs through the area, and there are several small lakes and streams in the area.
The climate in East Fork is semi-arid, with hot summers and cold winters. The average annual temperature is around 50 degrees Fahrenheit, and the average annual precipitation is around 12 inches.
Economy
The economy of East Fork is largely based on tourism and ranching. The area is a popular destination for fishing, hunting, and camping, and there are several resorts and lodges in the area. The area is also home to several ranches, which raise cattle and horses.
The area is also home to several small businesses, including a grocery store, a hardware store, and a gas station.
Demographics
As of the 2010 census, the population of East Fork was 1,093. The racial makeup of the town was 95.3% White, 0.7% Native American, 0.3% Asian, 0.2% African American, and 3.5% from other races. The median household income was $37,500, and the median family income was $41,250.
Conclusion
East Fork is a small unincorporated community located in the White Mountains of Arizona. It is situated in Navajo County, approximately 20 miles east of Show Low. The area was first settled in the late 1800s by Mormon pioneers, and the economy is largely based on tourism and ranching. As of the 2010 census, the population of East Fork was 1,093. The area is characterized by rolling hills, pine forests, and grassy meadows, and the climate is semi-arid, with hot summers and cold winters.
Common Questions
What is Per Capita Income in East Fork?
Per Capita income in East Fork is $13,259.
What is the Median Family Income in East Fork?
Median Family Income in East Fork is $40,083.
What is the Median Household income in East Fork?
Median Household Income in East Fork is $42,500.
What is Inequality or Gini Index in East Fork?
Inequality or Gini Index in East Fork is 0.34.
What is the Total Population of East Fork?
Total Population of East Fork is 439.
What is the Total Male Population of East Fork?
Total Male Population of East Fork is 168.
What is the Total Female Population of East Fork?
Total Female Population of East Fork is 271.
What is the Ratio of Males per 100 Females in East Fork?
There are 61.99 Males per 100 Females in East Fork.
What is the Ratio of Females per 100 Males in East Fork?
There are 161.31 Females per 100 Males in East Fork.
What is the Median Population Age in East Fork?
Median Population Age in East Fork is 20.2 Years.
What is the Average Family Size in East Fork
Average Family Size in East Fork is 3.9 People.
What is the Average Household Size in East Fork
Average Household Size in East Fork is 3.3 People.
How Large is the Labor Force in East Fork?
There are 182 People in the Labor Forcein in East Fork.
What is the Percentage of People in the Labor Force in East Fork?
61.7% of People are in the Labor Force in East Fork.
What is the Unemployment Rate in East Fork?
Unemployment Rate in East Fork is 8.2%.