Tsaile, AZ Map & Demographics
Tsaile Map
Tsaile Overview
$11,445
PER CAPITA INCOME
$22,955
AVG FAMILY INCOME
$39,625
AVG HOUSEHOLD INCOME
55.9%
WAGE / INCOME GAP [ % ]
44.1¢/ $1
WAGE / INCOME GAP [ $ ]
$16,765
FAMILY INCOME DEFICIT
0.48
INEQUALITY / GINI INDEX
1,482
TOTAL POPULATION
678
MALE POPULATION
804
FEMALE POPULATION
84.33
MALES / 100 FEMALES
118.58
FEMALES / 100 MALES
20.9
MEDIAN AGE
5.1
AVG FAMILY SIZE
4.0
AVG HOUSEHOLD SIZE
526
LABOR FORCE [ PEOPLE ]
47.7%
PERCENT IN LABOR FORCE
4.8%
UNEMPLOYMENT RATE
Tsaile Zip Codes
Tsaile Area Codes
Income in Tsaile
Income Overview in Tsaile
Per Capita Income in Tsaile is $11,445, while median incomes of families and households are $22,955 and $39,625 respectively.
| Characteristic | Number | Measure |
| Per Capita Income | 1,482 | $11,445 |
| Median Family Income | 180 | $22,955 |
| Mean Family Income | 180 | $42,295 |
| Median Household Income | 259 | $39,625 |
| Mean Household Income | 259 | $48,778 |
| Income Deficit | 180 | $16,765 |
| Wage / Income Gap (%) | 1,482 | 55.93% |
| Wage / Income Gap ($) | 1,482 | 44.07¢ per $1 |
| Gini / Inequality Index | 1,482 | 0.48 |
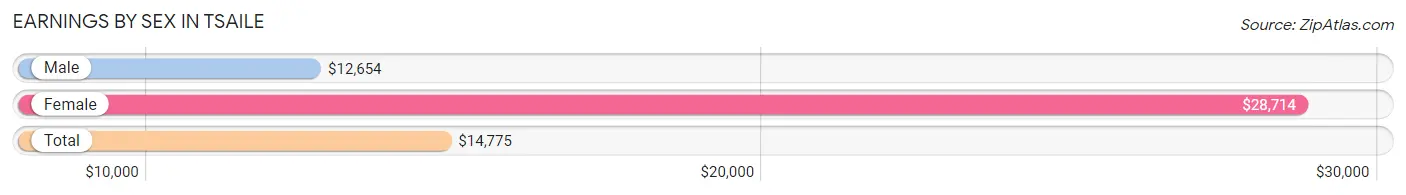
Earnings by Sex in Tsaile
Average Earnings in Tsaile are $14,775, $12,654 for men and $28,714 for women, a difference of 55.9%.
| Sex | Number | Average Earnings |
| Male | 335 (55.7%) | $12,654 |
| Female | 266 (44.3%) | $28,714 |
| Total | 601 (100.0%) | $14,775 |
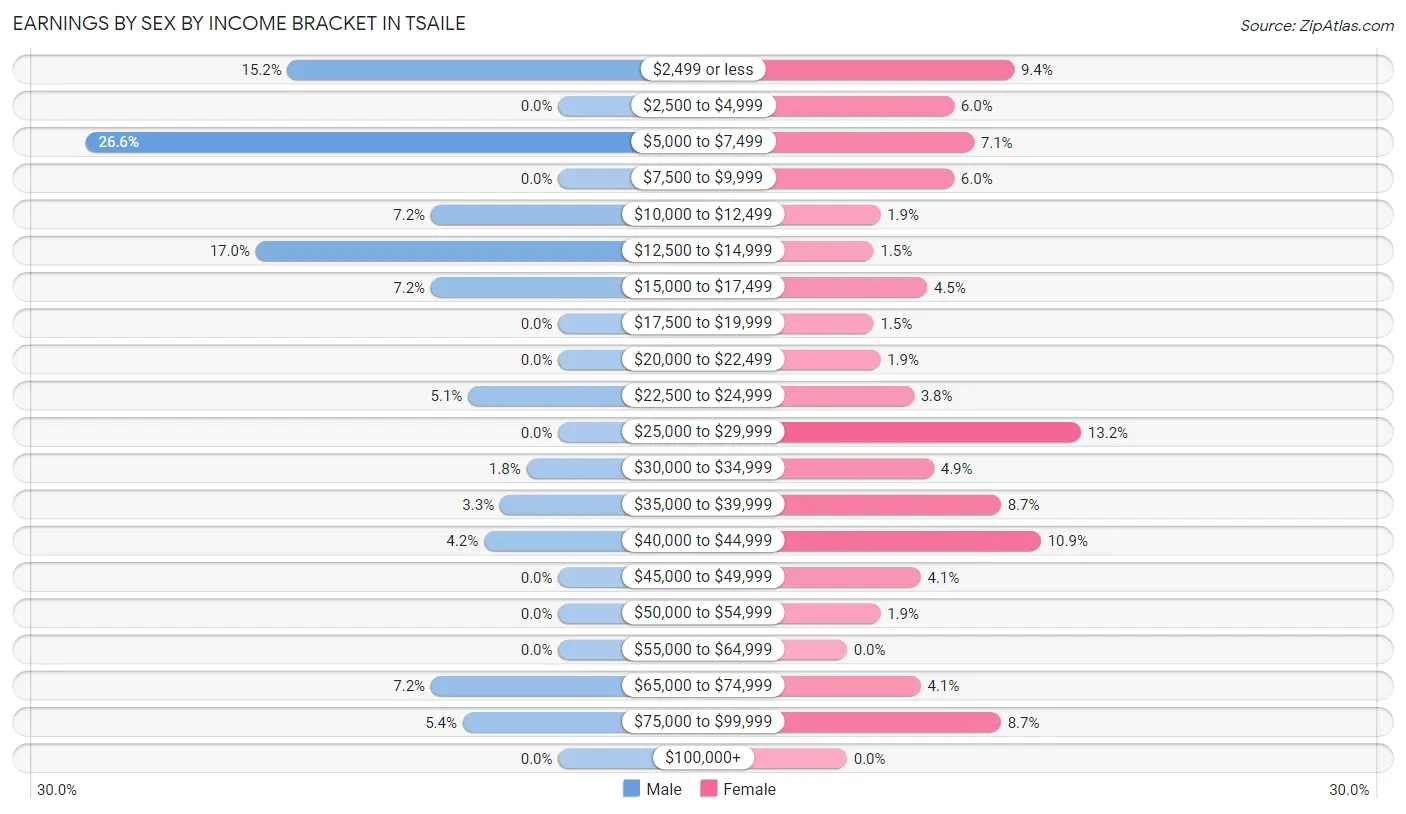
Earnings by Sex by Income Bracket in Tsaile
The most common earnings brackets in Tsaile are $5,000 to $7,499 for men (89 | 26.6%) and $25,000 to $29,999 for women (35 | 13.2%).
| Income | Male | Female |
| $2,499 or less | 51 (15.2%) | 25 (9.4%) |
| $2,500 to $4,999 | 0 (0.0%) | 16 (6.0%) |
| $5,000 to $7,499 | 89 (26.6%) | 19 (7.1%) |
| $7,500 to $9,999 | 0 (0.0%) | 16 (6.0%) |
| $10,000 to $12,499 | 24 (7.2%) | 5 (1.9%) |
| $12,500 to $14,999 | 57 (17.0%) | 4 (1.5%) |
| $15,000 to $17,499 | 24 (7.2%) | 12 (4.5%) |
| $17,500 to $19,999 | 0 (0.0%) | 4 (1.5%) |
| $20,000 to $22,499 | 0 (0.0%) | 5 (1.9%) |
| $22,500 to $24,999 | 17 (5.1%) | 10 (3.8%) |
| $25,000 to $29,999 | 0 (0.0%) | 35 (13.2%) |
| $30,000 to $34,999 | 6 (1.8%) | 13 (4.9%) |
| $35,000 to $39,999 | 11 (3.3%) | 23 (8.6%) |
| $40,000 to $44,999 | 14 (4.2%) | 29 (10.9%) |
| $45,000 to $49,999 | 0 (0.0%) | 11 (4.1%) |
| $50,000 to $54,999 | 0 (0.0%) | 5 (1.9%) |
| $55,000 to $64,999 | 0 (0.0%) | 0 (0.0%) |
| $65,000 to $74,999 | 24 (7.2%) | 11 (4.1%) |
| $75,000 to $99,999 | 18 (5.4%) | 23 (8.6%) |
| $100,000+ | 0 (0.0%) | 0 (0.0%) |
| Total | 335 (100.0%) | 266 (100.0%) |
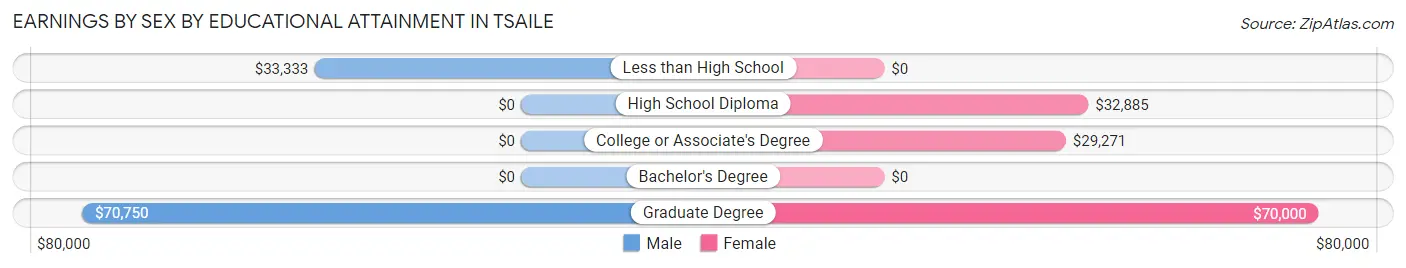
Earnings by Sex by Educational Attainment in Tsaile
| Educational Attainment | Male Income | Female Income |
| Less than High School | $33,333 | $0 |
| High School Diploma | - | - |
| College or Associate's Degree | - | - |
| Bachelor's Degree | - | - |
| Graduate Degree | $70,750 | $70,000 |
| Total | - | - |
Family Income in Tsaile
Family Income Brackets in Tsaile
According to the Tsaile family income data, there are 47 families falling into the less than $10,000 income range, which is the most common income bracket and makes up 26.1% of all families.
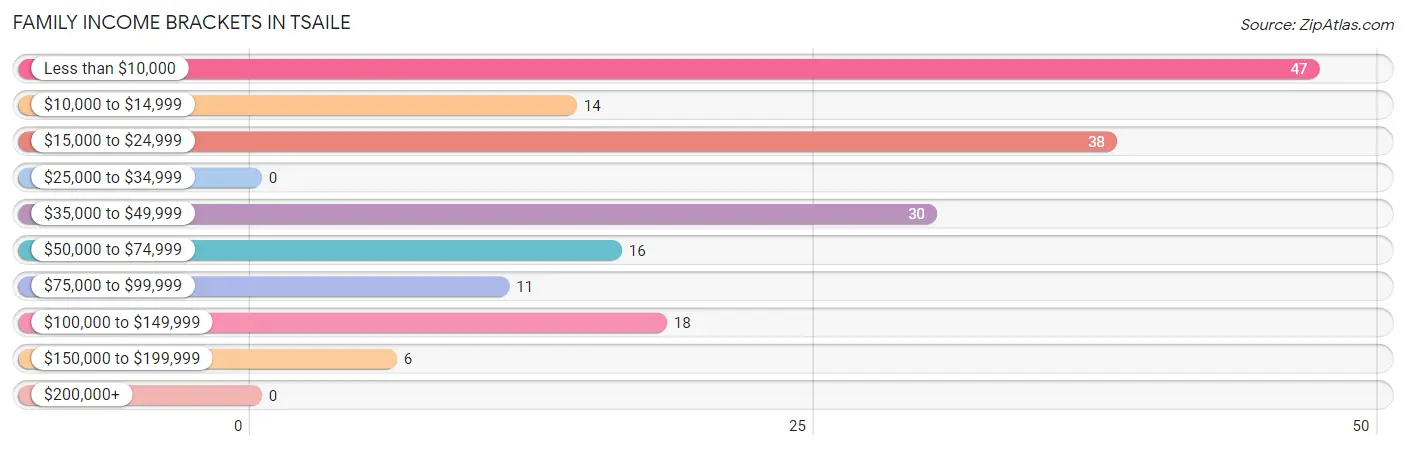
| Income Bracket | # Families | % Families |
| Less than $10,000 | 47 | 26.1% |
| $10,000 to $14,999 | 14 | 7.8% |
| $15,000 to $24,999 | 38 | 21.1% |
| $25,000 to $34,999 | 0 | 0.0% |
| $35,000 to $49,999 | 30 | 16.7% |
| $50,000 to $74,999 | 16 | 8.9% |
| $75,000 to $99,999 | 11 | 6.1% |
| $100,000 to $149,999 | 18 | 10.0% |
| $150,000 to $199,999 | 6 | 3.3% |
| $200,000+ | 0 | 0.0% |
Family Income by Famaliy Size in Tsaile
4-person families (30 | 16.7%) account for the highest median family income in Tsaile with $48,500 per family, while 4-person families (30 | 16.7%) have the highest median income of $12,125 per family member.
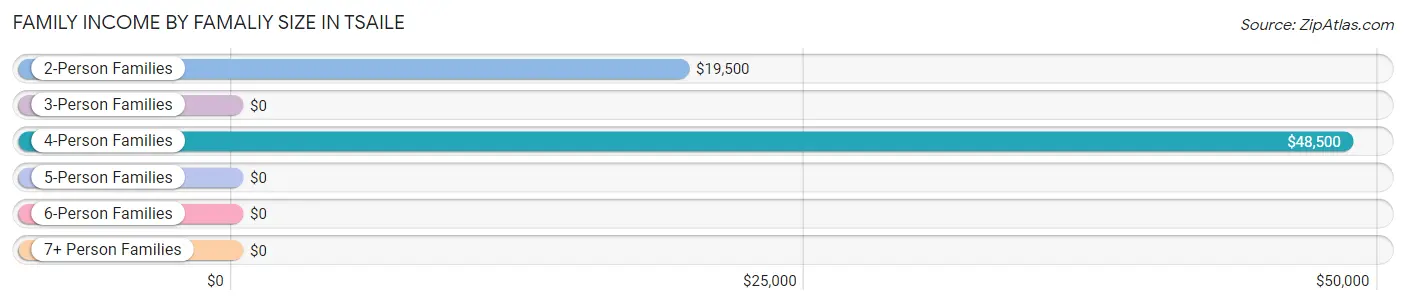
| Income Bracket | # Families | Median Income |
| 2-Person Families | 44 (24.4%) | $19,500 |
| 3-Person Families | 52 (28.9%) | $0 |
| 4-Person Families | 30 (16.7%) | $48,500 |
| 5-Person Families | 37 (20.6%) | $0 |
| 6-Person Families | 6 (3.3%) | $0 |
| 7+ Person Families | 11 (6.1%) | $0 |
| Total | 180 (100.0%) | $22,955 |
Family Income by Number of Earners in Tsaile
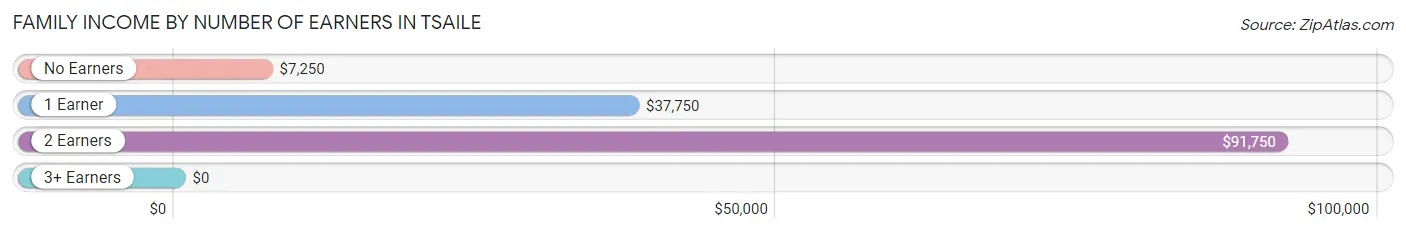
| Number of Earners | # Families | Median Income |
| No Earners | 64 (35.6%) | $7,250 |
| 1 Earner | 71 (39.4%) | $37,750 |
| 2 Earners | 39 (21.7%) | $91,750 |
| 3+ Earners | 6 (3.3%) | $0 |
| Total | 180 (100.0%) | $22,955 |
Household Income in Tsaile
Household Income Brackets in Tsaile
With 47 households falling in the category, the less than $10,000 income range is the most frequent in Tsaile, accounting for 18.1% of all households.
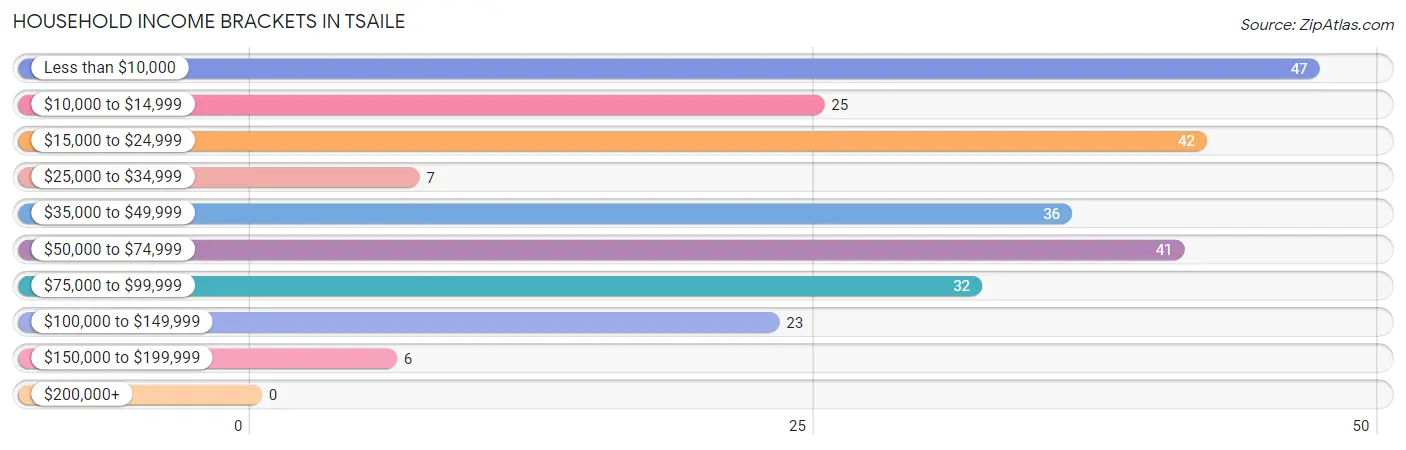
| Income Bracket | # Households | % Households |
| Less than $10,000 | 47 | 18.1% |
| $10,000 to $14,999 | 25 | 9.7% |
| $15,000 to $24,999 | 42 | 16.2% |
| $25,000 to $34,999 | 7 | 2.7% |
| $35,000 to $49,999 | 36 | 13.9% |
| $50,000 to $74,999 | 41 | 15.8% |
| $75,000 to $99,999 | 32 | 12.4% |
| $100,000 to $149,999 | 23 | 8.9% |
| $150,000 to $199,999 | 6 | 2.3% |
| $200,000+ | 0 | 0.0% |
Household Income by Householder Age in Tsaile
The median household income in Tsaile is $39,625, with the highest median household income of $67,750 found in the 45 to 64 years age bracket for the primary householder. A total of 86 households (33.2%) fall into this category. Meanwhile, the 15 to 24 years age bracket for the primary householder has the lowest median household income of $0, with 11 households (4.3%) in this group.
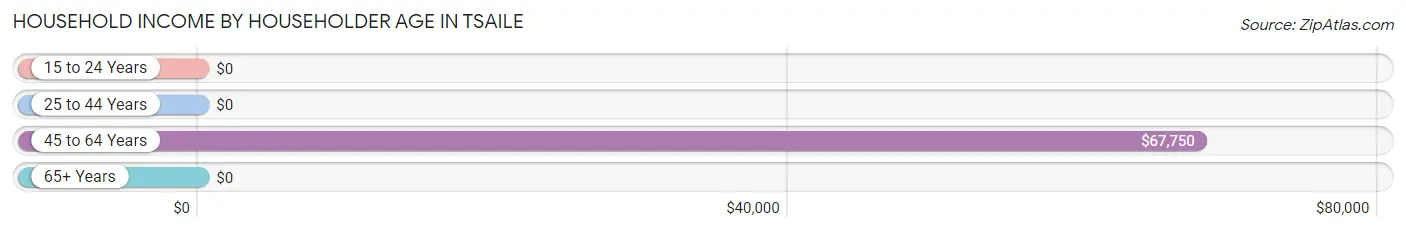
| Income Bracket | # Households | Median Income |
| 15 to 24 Years | 11 (4.3%) | $0 |
| 25 to 44 Years | 100 (38.6%) | $0 |
| 45 to 64 Years | 86 (33.2%) | $67,750 |
| 65+ Years | 62 (23.9%) | $0 |
| Total | 259 (100.0%) | $39,625 |
Poverty in Tsaile
Income Below Poverty by Sex and Age in Tsaile
With 47.5% poverty level for males and 34.6% for females among the residents of Tsaile, 5 year old males and 6 to 11 year old females are the most vulnerable to poverty, with 4 males (100.0%) and 77 females (68.8%) in their respective age groups living below the poverty level.
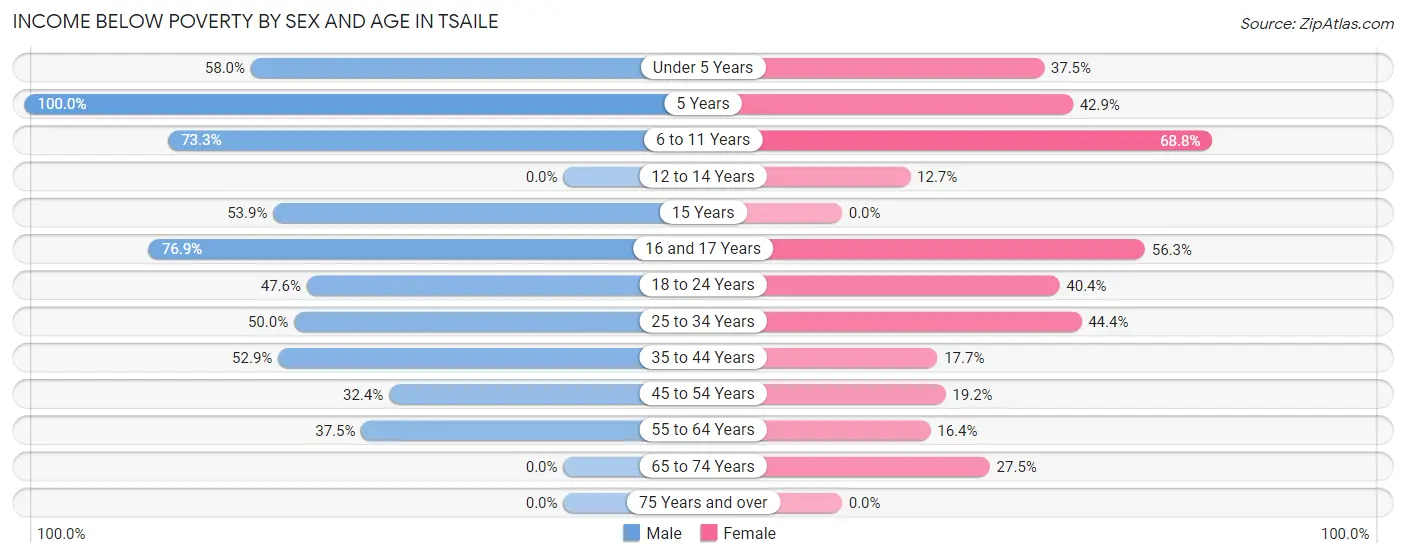
| Age Bracket | Male | Female |
| Under 5 Years | 29 (58.0%) | 12 (37.5%) |
| 5 Years | 4 (100.0%) | 6 (42.9%) |
| 6 to 11 Years | 44 (73.3%) | 77 (68.8%) |
| 12 to 14 Years | 0 (0.0%) | 9 (12.7%) |
| 15 Years | 7 (53.8%) | 0 (0.0%) |
| 16 and 17 Years | 20 (76.9%) | 9 (56.2%) |
| 18 to 24 Years | 20 (47.6%) | 42 (40.4%) |
| 25 to 34 Years | 22 (50.0%) | 24 (44.4%) |
| 35 to 44 Years | 18 (52.9%) | 14 (17.7%) |
| 45 to 54 Years | 11 (32.4%) | 5 (19.2%) |
| 55 to 64 Years | 6 (37.5%) | 11 (16.4%) |
| 65 to 74 Years | 0 (0.0%) | 14 (27.5%) |
| 75 Years and over | 0 (0.0%) | 0 (0.0%) |
| Total | 181 (47.5%) | 223 (34.6%) |
Income Above Poverty by Sex and Age in Tsaile
According to the poverty statistics in Tsaile, males aged 12 to 14 years and females aged 75 years and over are the age groups that are most secure financially, with 100.0% of males and 100.0% of females in these age groups living above the poverty line.
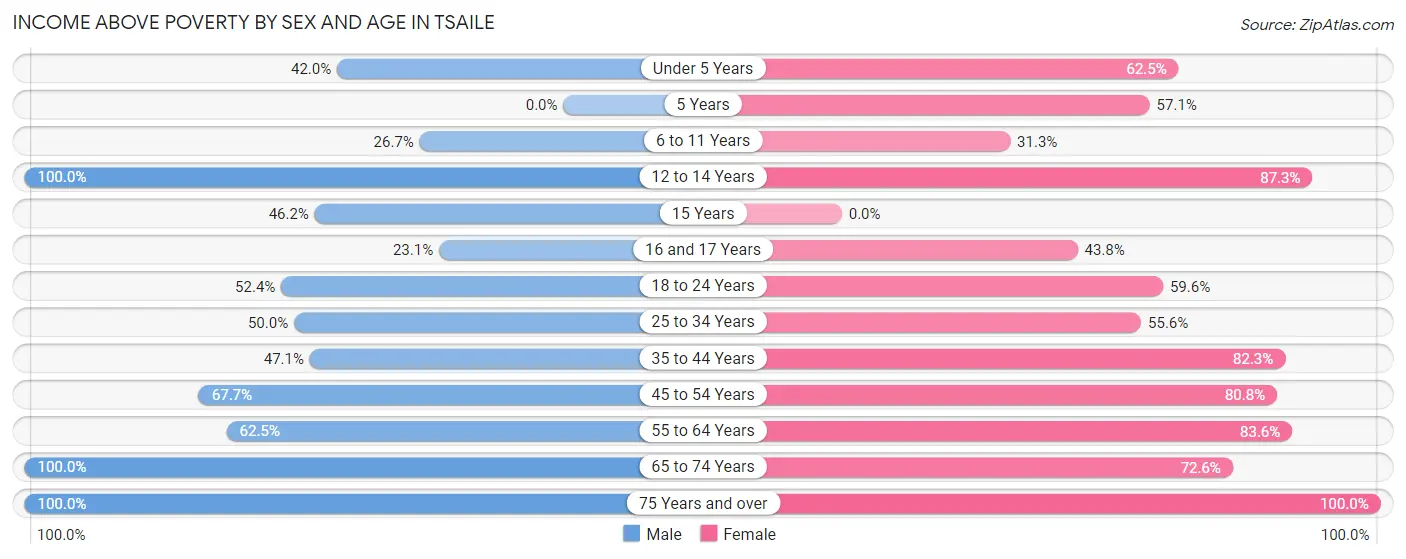
| Age Bracket | Male | Female |
| Under 5 Years | 21 (42.0%) | 20 (62.5%) |
| 5 Years | 0 (0.0%) | 8 (57.1%) |
| 6 to 11 Years | 16 (26.7%) | 35 (31.2%) |
| 12 to 14 Years | 24 (100.0%) | 62 (87.3%) |
| 15 Years | 6 (46.2%) | 0 (0.0%) |
| 16 and 17 Years | 6 (23.1%) | 7 (43.8%) |
| 18 to 24 Years | 22 (52.4%) | 62 (59.6%) |
| 25 to 34 Years | 22 (50.0%) | 30 (55.6%) |
| 35 to 44 Years | 16 (47.1%) | 65 (82.3%) |
| 45 to 54 Years | 23 (67.6%) | 21 (80.8%) |
| 55 to 64 Years | 10 (62.5%) | 56 (83.6%) |
| 65 to 74 Years | 30 (100.0%) | 37 (72.6%) |
| 75 Years and over | 4 (100.0%) | 18 (100.0%) |
| Total | 200 (52.5%) | 421 (65.4%) |
Income Below Poverty Among Married-Couple Families in Tsaile
The poverty statistics for married-couple families in Tsaile show that 25.0% or 18 of the total 72 families live below the poverty line. Families with 1 or 2 children have the highest poverty rate of 50.0%, comprising of 11 families. On the other hand, families with no children have the lowest poverty rate of 0.0%, which includes 0 families.
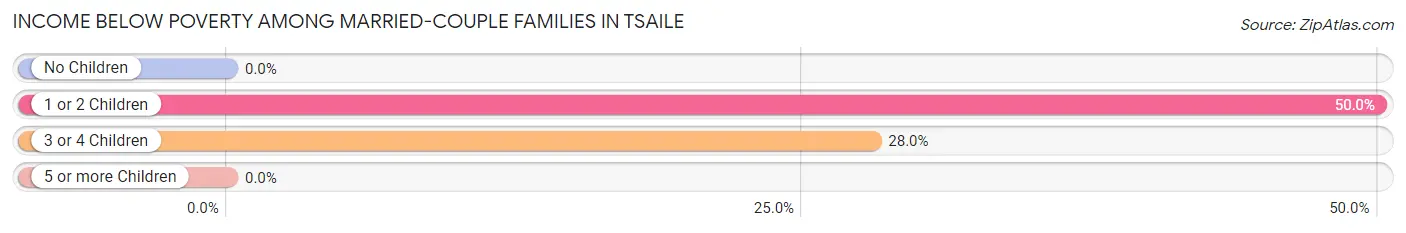
| Children | Above Poverty | Below Poverty |
| No Children | 25 (100.0%) | 0 (0.0%) |
| 1 or 2 Children | 11 (50.0%) | 11 (50.0%) |
| 3 or 4 Children | 18 (72.0%) | 7 (28.0%) |
| 5 or more Children | 0 (0.0%) | 0 (0.0%) |
| Total | 54 (75.0%) | 18 (25.0%) |
Income Below Poverty Among Single-Parent Households in Tsaile
According to the poverty data in Tsaile, 100.0% or 15 single-father households and 49.5% or 46 single-mother households are living below the poverty line. Among single-father households, those with no children have the highest poverty rate, with 6 households (100.0%) experiencing poverty. Likewise, among single-mother households, those with 1 or 2 children have the highest poverty rate, with 34 households (56.7%) falling below the poverty line.
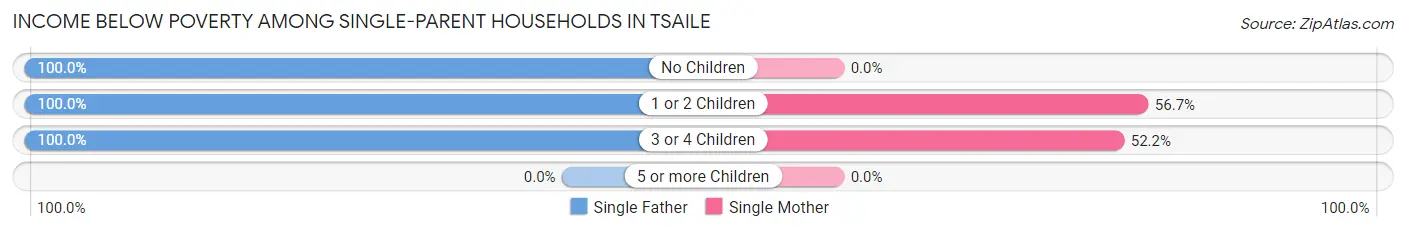
| Children | Single Father | Single Mother |
| No Children | 6 (100.0%) | 0 (0.0%) |
| 1 or 2 Children | 5 (100.0%) | 34 (56.7%) |
| 3 or 4 Children | 4 (100.0%) | 12 (52.2%) |
| 5 or more Children | 0 (0.0%) | 0 (0.0%) |
| Total | 15 (100.0%) | 46 (49.5%) |
Income Below Poverty Among Married-Couple vs Single-Parent Households in Tsaile
The poverty data for Tsaile shows that 18 of the married-couple family households (25.0%) and 61 of the single-parent households (56.5%) are living below the poverty level. Within the married-couple family households, those with 1 or 2 children have the highest poverty rate, with 11 households (50.0%) falling below the poverty line. Among the single-parent households, those with 1 or 2 children have the highest poverty rate, with 39 household (60.0%) living below poverty.
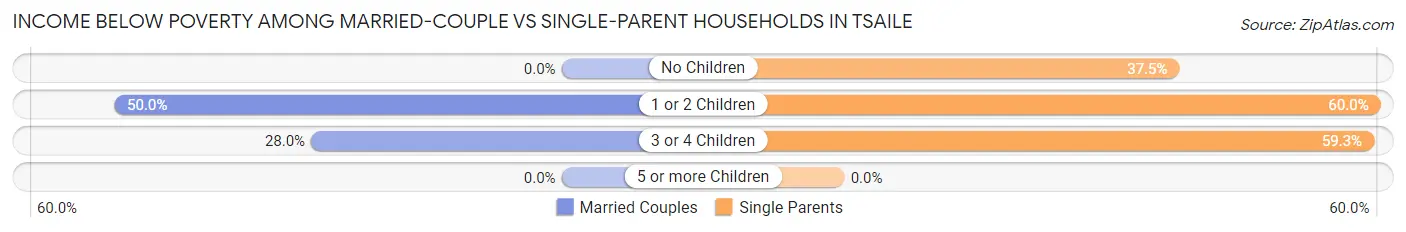
| Children | Married-Couple Families | Single-Parent Households |
| No Children | 0 (0.0%) | 6 (37.5%) |
| 1 or 2 Children | 11 (50.0%) | 39 (60.0%) |
| 3 or 4 Children | 7 (28.0%) | 16 (59.3%) |
| 5 or more Children | 0 (0.0%) | 0 (0.0%) |
| Total | 18 (25.0%) | 61 (56.5%) |
Race in Tsaile
The most populous races in Tsaile are Native / Alaskan (1,085 | 73.2%), White / Caucasian (215 | 14.5%), and Black / African American (109 | 7.3%).
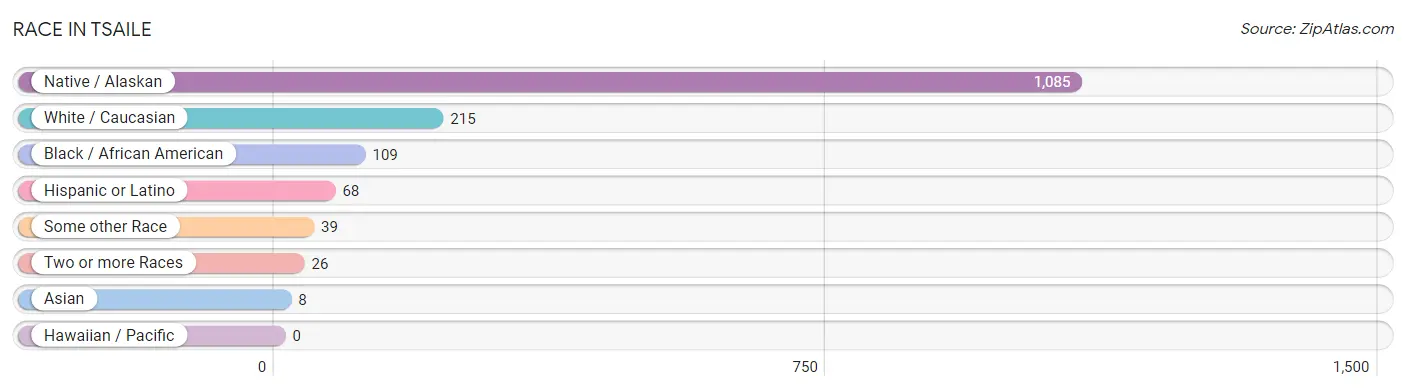
| Race | # Population | % Population |
| Asian | 8 | 0.5% |
| Black / African American | 109 | 7.3% |
| Hawaiian / Pacific | 0 | 0.0% |
| Hispanic or Latino | 68 | 4.6% |
| Native / Alaskan | 1,085 | 73.2% |
| White / Caucasian | 215 | 14.5% |
| Two or more Races | 26 | 1.8% |
| Some other Race | 39 | 2.6% |
| Total | 1,482 | 100.0% |
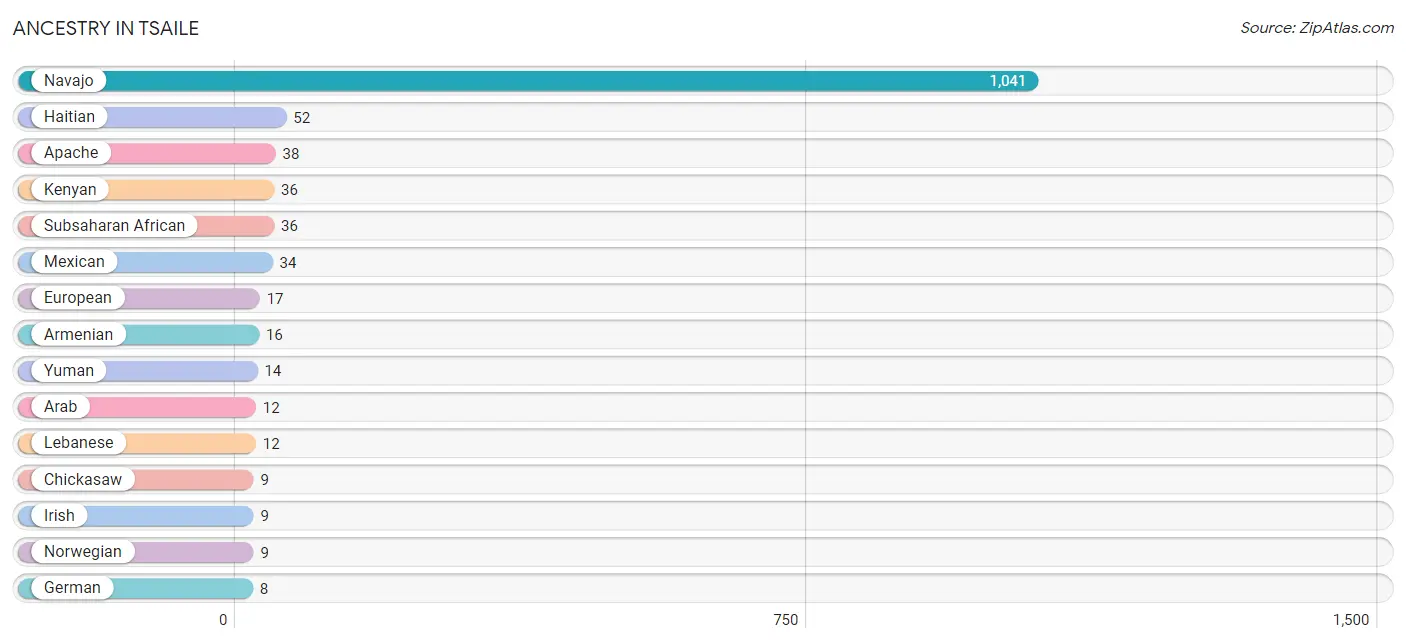
Ancestry in Tsaile
The most populous ancestries reported in Tsaile are Navajo (1,041 | 70.2%), Haitian (52 | 3.5%), Apache (38 | 2.6%), Kenyan (36 | 2.4%), and Subsaharan African (36 | 2.4%), together accounting for 81.2% of all Tsaile residents.
| Ancestry | # Population | % Population |
| American | 6 | 0.4% |
| Apache | 38 | 2.6% |
| Arab | 12 | 0.8% |
| Armenian | 16 | 1.1% |
| British | 4 | 0.3% |
| Chickasaw | 9 | 0.6% |
| Cuban | 2 | 0.1% |
| European | 17 | 1.1% |
| French Canadian | 2 | 0.1% |
| German | 8 | 0.5% |
| Haitian | 52 | 3.5% |
| Iranian | 3 | 0.2% |
| Irish | 9 | 0.6% |
| Italian | 7 | 0.5% |
| Kenyan | 36 | 2.4% |
| Korean | 4 | 0.3% |
| Lebanese | 12 | 0.8% |
| Mexican | 34 | 2.3% |
| Mexican American Indian | 6 | 0.4% |
| Navajo | 1,041 | 70.2% |
| Norwegian | 9 | 0.6% |
| Polish | 4 | 0.3% |
| Russian | 1 | 0.1% |
| Spanish | 3 | 0.2% |
| Subsaharan African | 36 | 2.4% |
| Swedish | 3 | 0.2% |
| Thai | 7 | 0.5% |
| Yuman | 14 | 0.9% | View All 28 Rows |
Immigrants in Tsaile
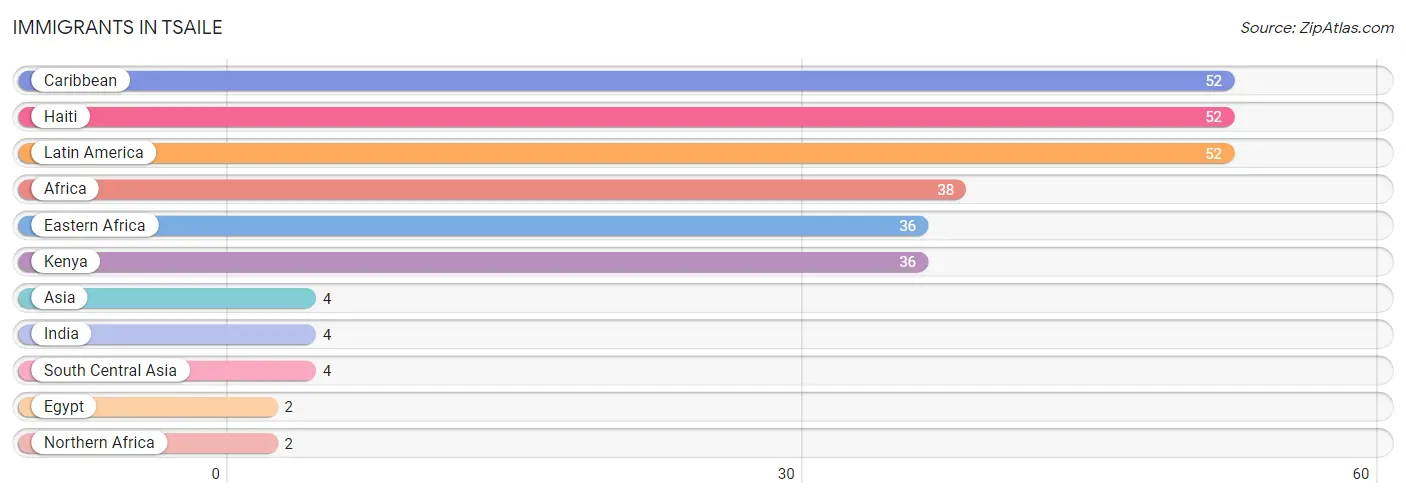
The most numerous immigrant groups reported in Tsaile came from Caribbean (52 | 3.5%), Haiti (52 | 3.5%), Latin America (52 | 3.5%), Africa (38 | 2.6%), and Eastern Africa (36 | 2.4%), together accounting for 15.5% of all Tsaile residents.
| Immigration Origin | # Population | % Population |
| Africa | 38 | 2.6% |
| Asia | 4 | 0.3% |
| Caribbean | 52 | 3.5% |
| Eastern Africa | 36 | 2.4% |
| Egypt | 2 | 0.1% |
| Haiti | 52 | 3.5% |
| India | 4 | 0.3% |
| Kenya | 36 | 2.4% |
| Latin America | 52 | 3.5% |
| Northern Africa | 2 | 0.1% |
| South Central Asia | 4 | 0.3% | View All 11 Rows |
Sex and Age in Tsaile
Sex and Age in Tsaile
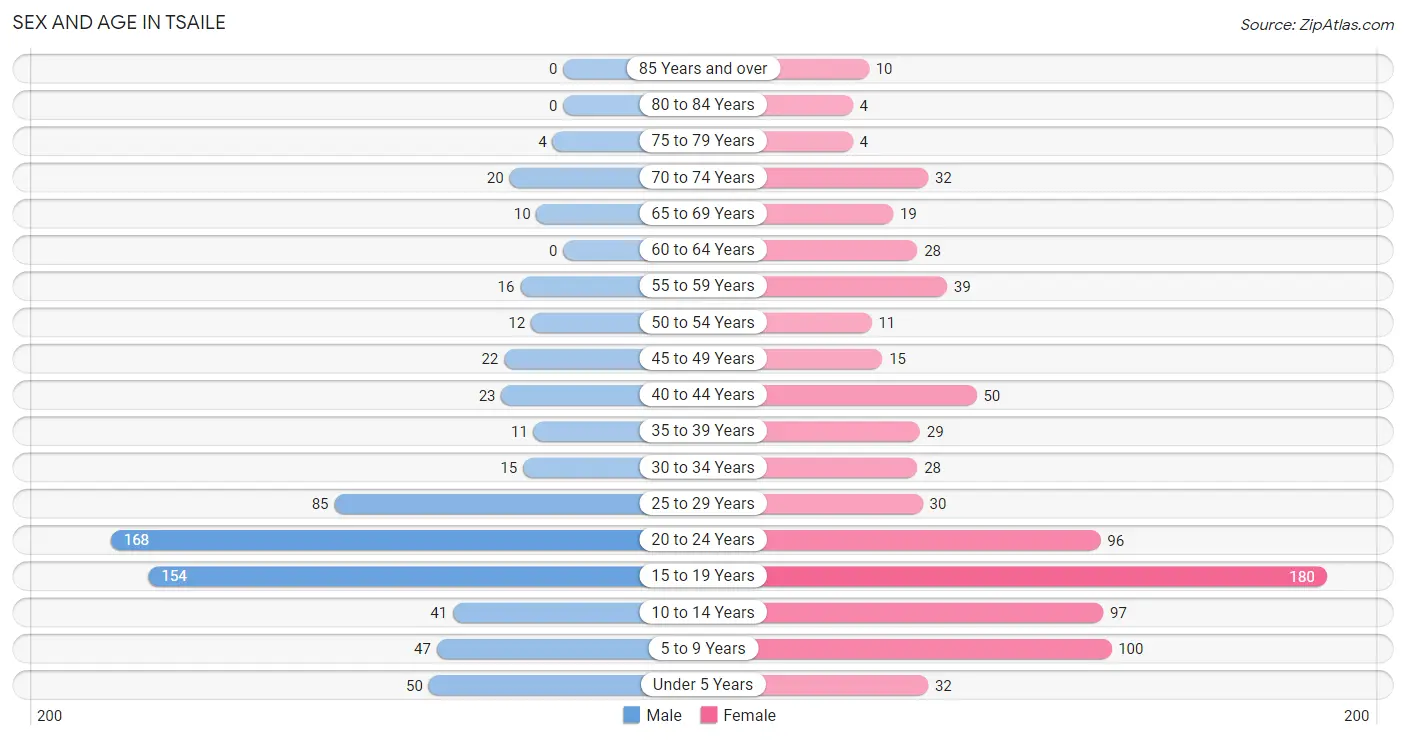
The most populous age groups in Tsaile are 20 to 24 Years (168 | 24.8%) for men and 15 to 19 Years (180 | 22.4%) for women.
| Age Bracket | Male | Female |
| Under 5 Years | 50 (7.4%) | 32 (4.0%) |
| 5 to 9 Years | 47 (6.9%) | 100 (12.4%) |
| 10 to 14 Years | 41 (6.0%) | 97 (12.1%) |
| 15 to 19 Years | 154 (22.7%) | 180 (22.4%) |
| 20 to 24 Years | 168 (24.8%) | 96 (11.9%) |
| 25 to 29 Years | 85 (12.5%) | 30 (3.7%) |
| 30 to 34 Years | 15 (2.2%) | 28 (3.5%) |
| 35 to 39 Years | 11 (1.6%) | 29 (3.6%) |
| 40 to 44 Years | 23 (3.4%) | 50 (6.2%) |
| 45 to 49 Years | 22 (3.2%) | 15 (1.9%) |
| 50 to 54 Years | 12 (1.8%) | 11 (1.4%) |
| 55 to 59 Years | 16 (2.4%) | 39 (4.9%) |
| 60 to 64 Years | 0 (0.0%) | 28 (3.5%) |
| 65 to 69 Years | 10 (1.5%) | 19 (2.4%) |
| 70 to 74 Years | 20 (2.9%) | 32 (4.0%) |
| 75 to 79 Years | 4 (0.6%) | 4 (0.5%) |
| 80 to 84 Years | 0 (0.0%) | 4 (0.5%) |
| 85 Years and over | 0 (0.0%) | 10 (1.2%) |
| Total | 678 (100.0%) | 804 (100.0%) |
Families and Households in Tsaile
Median Family Size in Tsaile
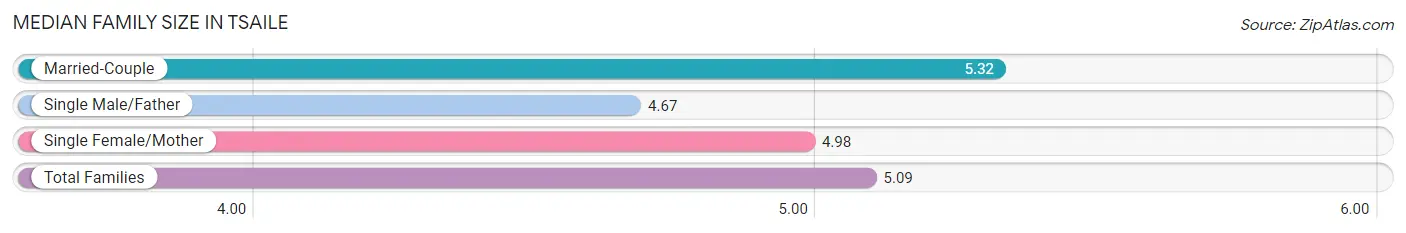
The median family size in Tsaile is 5.09 persons per family, with married-couple families (72 | 40.0%) accounting for the largest median family size of 5.32 persons per family. On the other hand, single male/father families (15 | 8.3%) represent the smallest median family size with 4.67 persons per family.
| Family Type | # Families | Family Size |
| Married-Couple | 72 (40.0%) | 5.32 |
| Single Male/Father | 15 (8.3%) | 4.67 |
| Single Female/Mother | 93 (51.7%) | 4.98 |
| Total Families | 180 (100.0%) | 5.09 |
Median Household Size in Tsaile
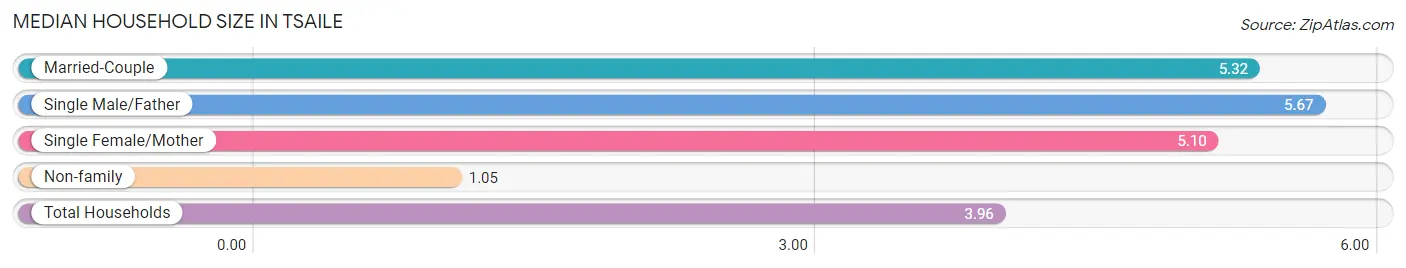
The median household size in Tsaile is 3.96 persons per household, with single male/father households (15 | 5.8%) accounting for the largest median household size of 5.67 persons per household. non-family households (79 | 30.5%) represent the smallest median household size with 1.05 persons per household.
| Household Type | # Households | Household Size |
| Married-Couple | 72 (27.8%) | 5.32 |
| Single Male/Father | 15 (5.8%) | 5.67 |
| Single Female/Mother | 93 (35.9%) | 5.10 |
| Non-family | 79 (30.5%) | 1.05 |
| Total Households | 259 (100.0%) | 3.96 |
Household Size by Marriage Status in Tsaile
Out of a total of 259 households in Tsaile, 180 (69.5%) are family households, while 79 (30.5%) are nonfamily households. The most numerous type of family households are 3-person households, comprising 46, and the most common type of nonfamily households are 1-person households, comprising 74.
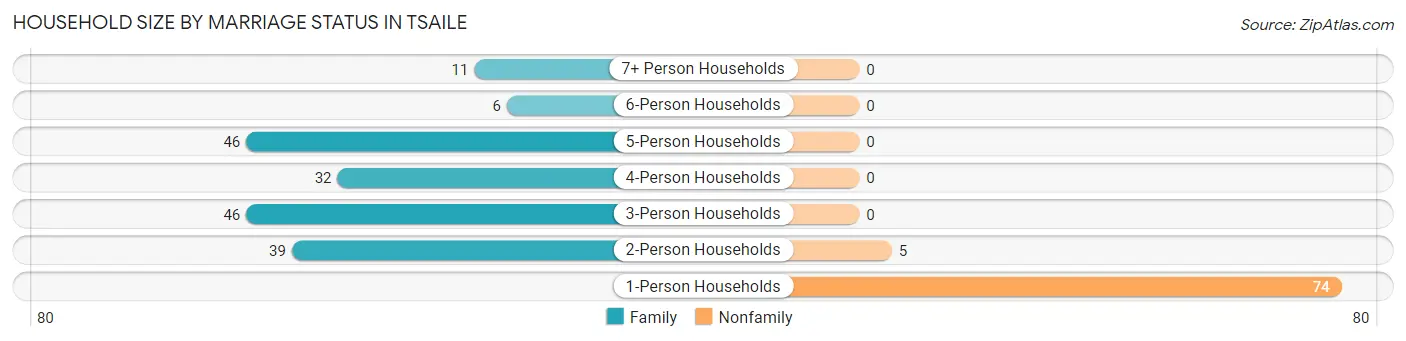
| Household Size | Family Households | Nonfamily Households |
| 1-Person Households | - | 74 (28.6%) |
| 2-Person Households | 39 (15.1%) | 5 (1.9%) |
| 3-Person Households | 46 (17.8%) | 0 (0.0%) |
| 4-Person Households | 32 (12.4%) | 0 (0.0%) |
| 5-Person Households | 46 (17.8%) | 0 (0.0%) |
| 6-Person Households | 6 (2.3%) | 0 (0.0%) |
| 7+ Person Households | 11 (4.3%) | 0 (0.0%) |
| Total | 180 (69.5%) | 79 (30.5%) |
Female Fertility in Tsaile
Fertility by Age in Tsaile
Average fertility rate in Tsaile is 21.0 births per 1,000 women. Women in the age bracket of 35 to 50 years have the highest fertility rate with 43.0 births per 1,000 women. Women in the age bracket of 20 to 34 years acount for 55.6% of all women with births.
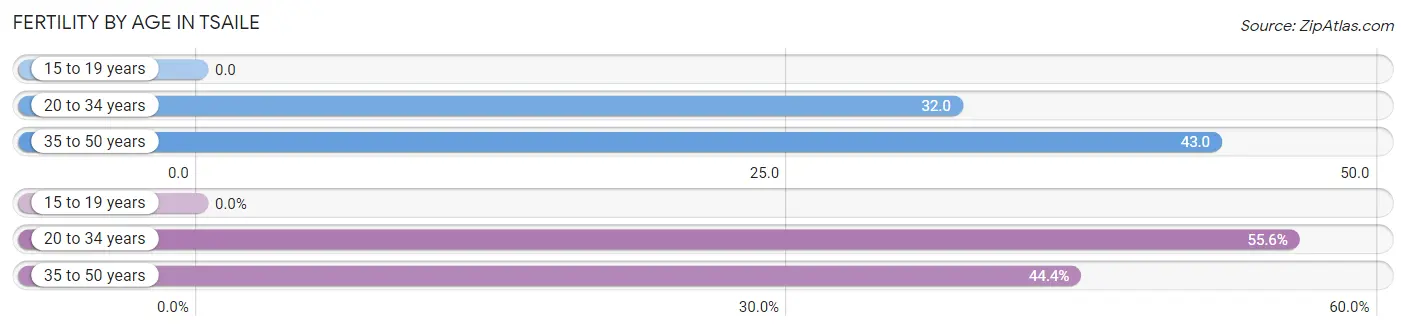
| Age Bracket | Women with Births | Births / 1,000 Women |
| 15 to 19 years | 0 (0.0%) | 0.0 |
| 20 to 34 years | 5 (55.6%) | 32.0 |
| 35 to 50 years | 4 (44.4%) | 43.0 |
| Total | 9 (100.0%) | 21.0 |
Fertility by Age by Marriage Status in Tsaile
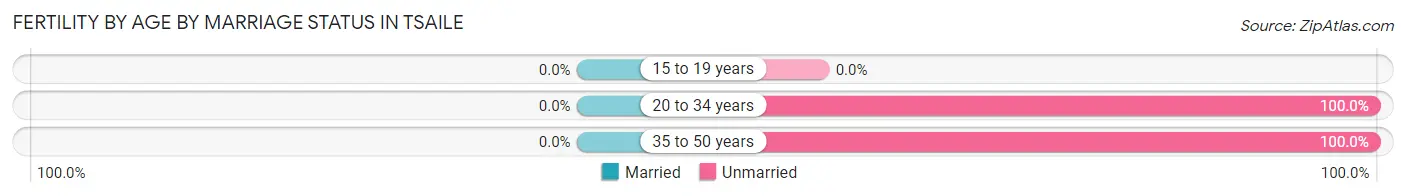
| Age Bracket | Married | Unmarried |
| 15 to 19 years | 0 (0.0%) | 0 (0.0%) |
| 20 to 34 years | 0 (0.0%) | 5 (100.0%) |
| 35 to 50 years | 0 (0.0%) | 4 (100.0%) |
| Total | 0 (0.0%) | 9 (100.0%) |
Fertility by Education in Tsaile
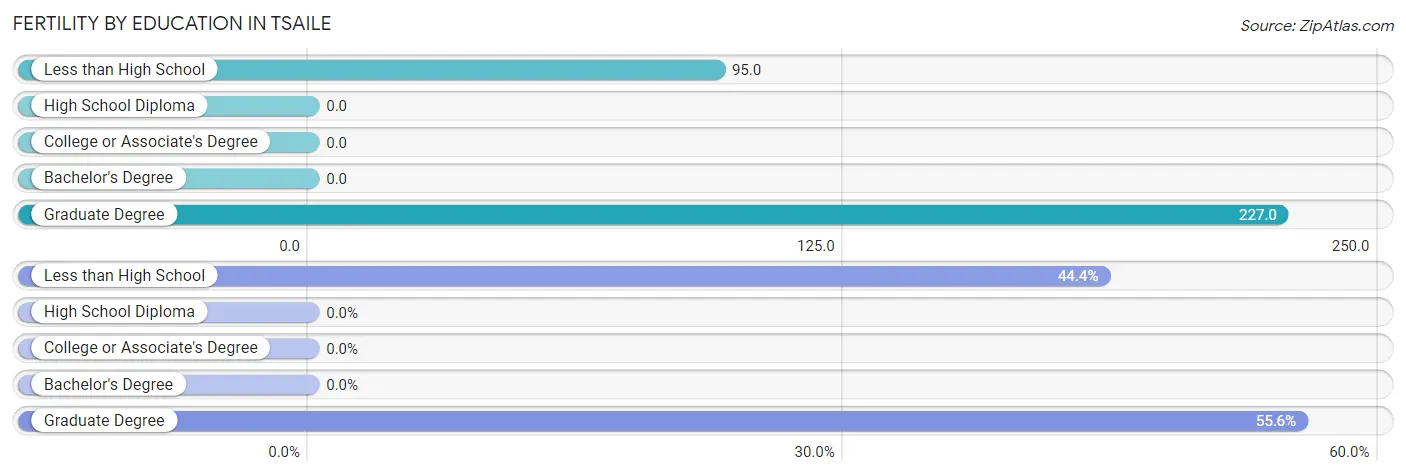
| Educational Attainment | Women with Births | Births / 1,000 Women |
| Less than High School | 4 (44.4%) | 95.0 |
| High School Diploma | 0 (0.0%) | 0.0 |
| College or Associate's Degree | 0 (0.0%) | 0.0 |
| Bachelor's Degree | 0 (0.0%) | 0.0 |
| Graduate Degree | 5 (55.6%) | 227.0 |
| Total | 9 (100.0%) | 21.0 |
Fertility by Education by Marriage Status in Tsaile
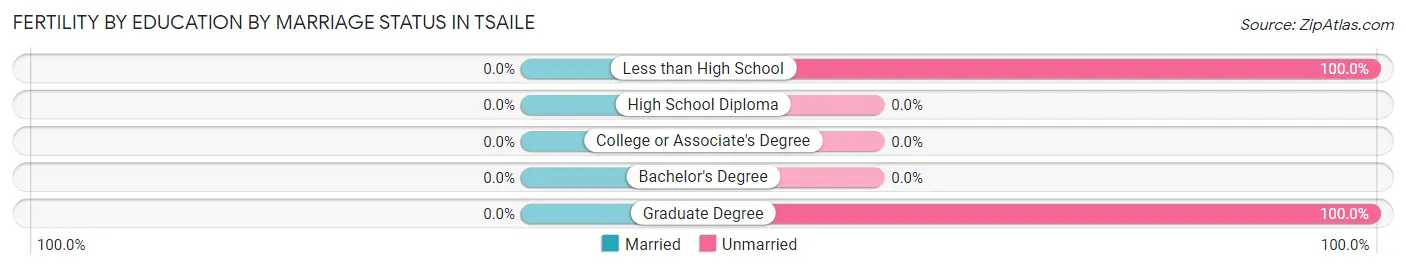
| Educational Attainment | Married | Unmarried |
| Less than High School | 0 (0.0%) | 4 (100.0%) |
| High School Diploma | 0 (0.0%) | 0 (0.0%) |
| College or Associate's Degree | 0 (0.0%) | 0 (0.0%) |
| Bachelor's Degree | 0 (0.0%) | 0 (0.0%) |
| Graduate Degree | 0 (0.0%) | 5 (100.0%) |
| Total | 0 (0.0%) | 9 (100.0%) |
Employment Characteristics in Tsaile
Employment by Class of Employer in Tsaile
Among the 451 employed individuals in Tsaile, state government employees (126 | 27.9%), local government employees (110 | 24.4%), and private company employees (95 | 21.1%) make up the most common classes of employment.
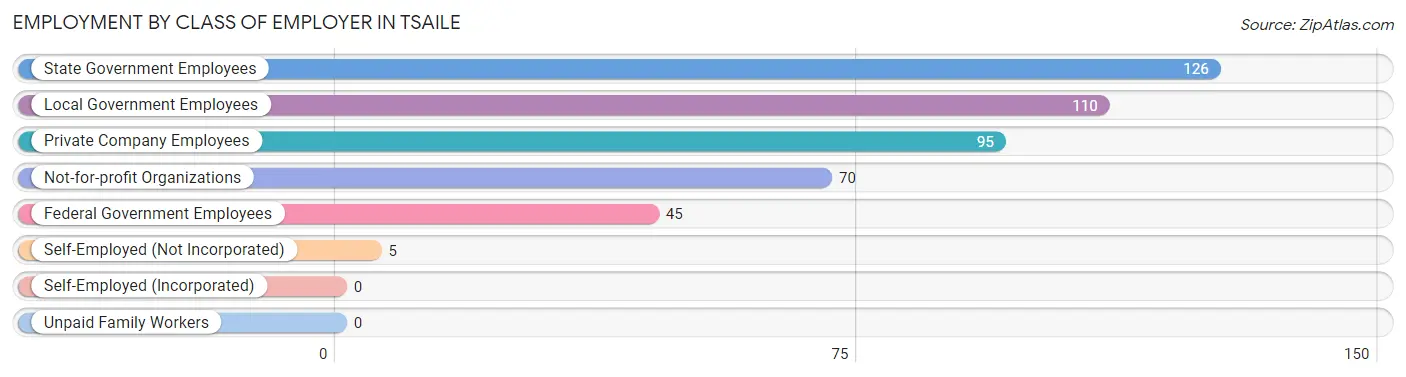
| Employer Class | # Employees | % Employees |
| Private Company Employees | 95 | 21.1% |
| Self-Employed (Incorporated) | 0 | 0.0% |
| Self-Employed (Not Incorporated) | 5 | 1.1% |
| Not-for-profit Organizations | 70 | 15.5% |
| Local Government Employees | 110 | 24.4% |
| State Government Employees | 126 | 27.9% |
| Federal Government Employees | 45 | 10.0% |
| Unpaid Family Workers | 0 | 0.0% |
| Total | 451 | 100.0% |
Employment Status by Age in Tsaile
According to the labor force statistics for Tsaile, out of the total population over 16 years of age (1,102), 47.7% or 526 individuals are in the labor force, with 4.8% or 25 of them unemployed. The age group with the highest labor force participation rate is 25 to 29 years, with 84.3% or 97 individuals in the labor force. Within the labor force, the 30 to 34 years age range has the highest percentage of unemployed individuals, with 35.3% or 12 of them being unemployed.
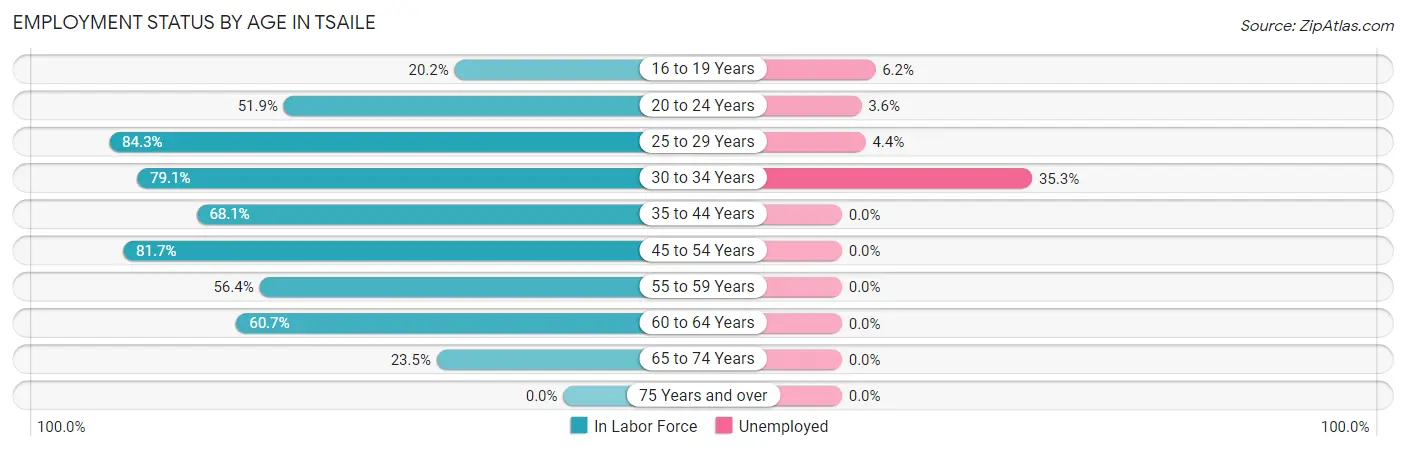
| Age Bracket | In Labor Force | Unemployed |
| 16 to 19 Years | 65 (20.2%) | 4 (6.2%) |
| 20 to 24 Years | 137 (51.9%) | 5 (3.6%) |
| 25 to 29 Years | 97 (84.3%) | 4 (4.4%) |
| 30 to 34 Years | 34 (79.1%) | 12 (35.3%) |
| 35 to 44 Years | 77 (68.1%) | 0 (0.0%) |
| 45 to 54 Years | 49 (81.7%) | 0 (0.0%) |
| 55 to 59 Years | 31 (56.4%) | 0 (0.0%) |
| 60 to 64 Years | 17 (60.7%) | 0 (0.0%) |
| 65 to 74 Years | 19 (23.5%) | 0 (0.0%) |
| 75 Years and over | 0 (0.0%) | 0 (0.0%) |
| Total | 526 (47.7%) | 25 (4.8%) |
Employment Status by Educational Attainment in Tsaile
According to labor force statistics for Tsaile, 73.7% of individuals (305) out of the total population between 25 and 64 years of age (414) are in the labor force, with 5.4% or 16 of them being unemployed. The group with the highest labor force participation rate are those with the educational attainment of bachelor's degree or higher, with 91.7% or 66 individuals in the labor force. Within the labor force, individuals with college / associate degree education have the highest percentage of unemployment, with 7.8% or 12 of them being unemployed.
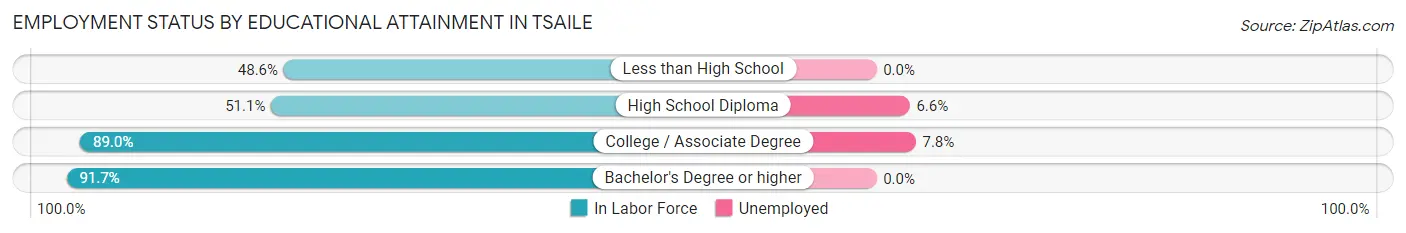
| Educational Attainment | In Labor Force | Unemployed |
| Less than High School | 18 (48.6%) | 0 (0.0%) |
| High School Diploma | 68 (51.1%) | 9 (6.6%) |
| College / Associate Degree | 153 (89.0%) | 13 (7.8%) |
| Bachelor's Degree or higher | 66 (91.7%) | 0 (0.0%) |
| Total | 305 (73.7%) | 22 (5.4%) |
Employment Occupations by Sex in Tsaile
Management, Business, Science and Arts Occupations
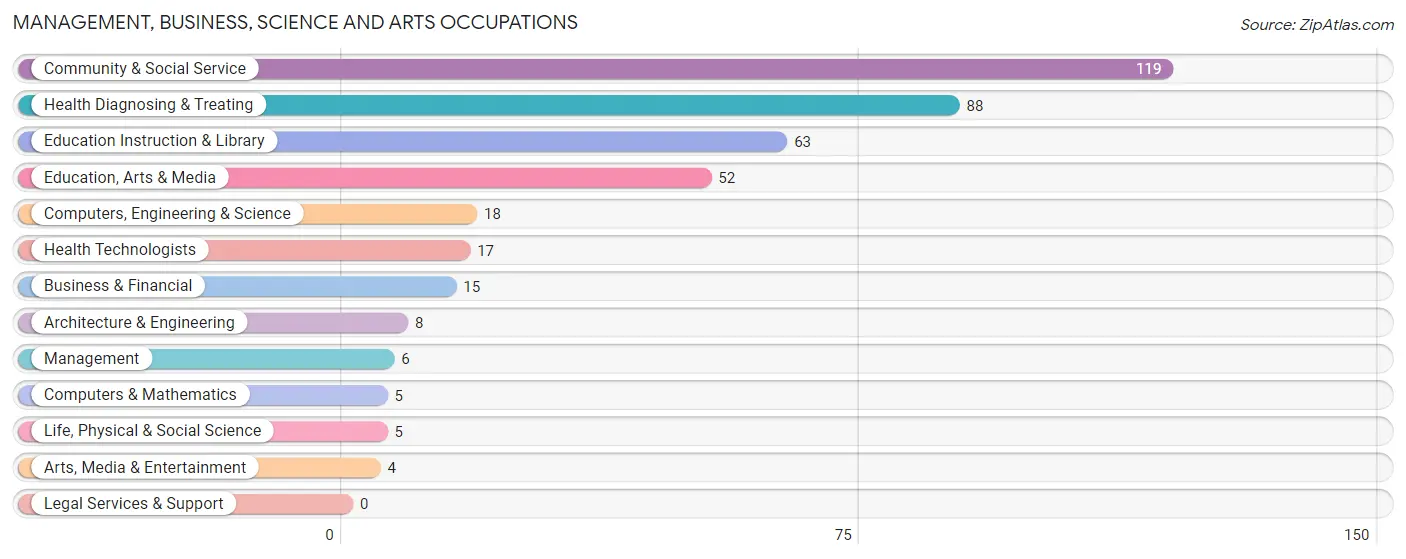
The most common Management, Business, Science and Arts occupations in Tsaile are Community & Social Service (119 | 24.1%), Health Diagnosing & Treating (88 | 17.8%), Education Instruction & Library (63 | 12.8%), Education, Arts & Media (52 | 10.5%), and Computers, Engineering & Science (18 | 3.6%).
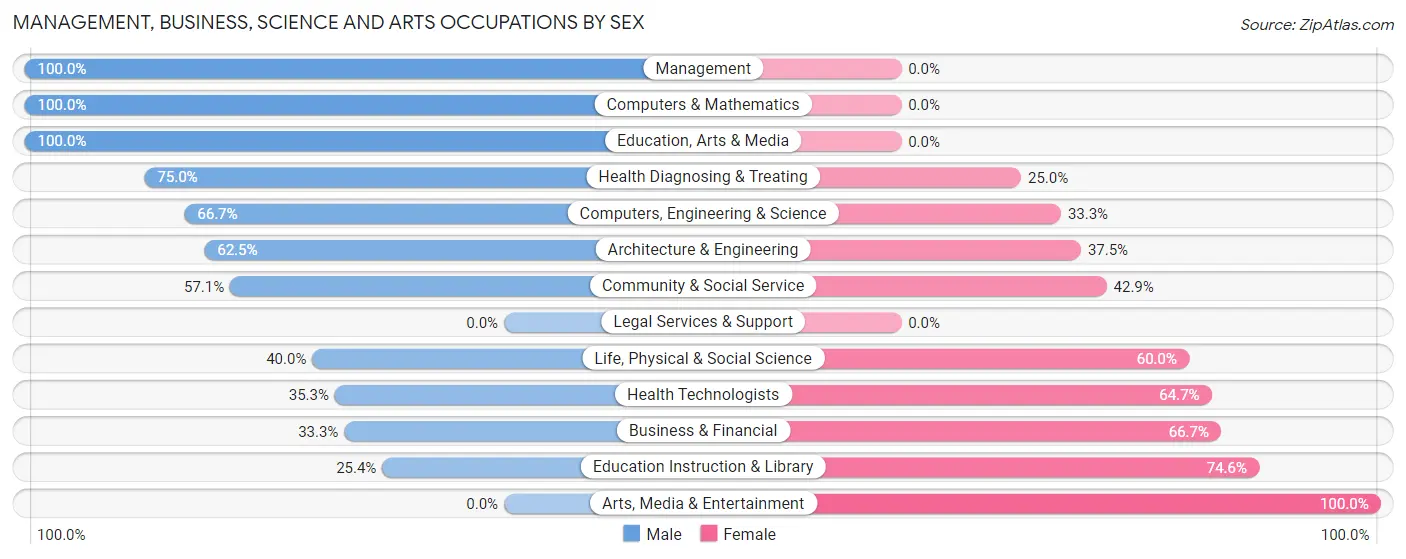
Management, Business, Science and Arts Occupations by Sex
Within the Management, Business, Science and Arts occupations in Tsaile, the most male-oriented occupations are Management (100.0%), Computers & Mathematics (100.0%), and Education, Arts & Media (100.0%), while the most female-oriented occupations are Arts, Media & Entertainment (100.0%), Education Instruction & Library (74.6%), and Business & Financial (66.7%).
| Occupation | Male | Female |
| Management | 6 (100.0%) | 0 (0.0%) |
| Business & Financial | 5 (33.3%) | 10 (66.7%) |
| Computers, Engineering & Science | 12 (66.7%) | 6 (33.3%) |
| Computers & Mathematics | 5 (100.0%) | 0 (0.0%) |
| Architecture & Engineering | 5 (62.5%) | 3 (37.5%) |
| Life, Physical & Social Science | 2 (40.0%) | 3 (60.0%) |
| Community & Social Service | 68 (57.1%) | 51 (42.9%) |
| Education, Arts & Media | 52 (100.0%) | 0 (0.0%) |
| Legal Services & Support | 0 (0.0%) | 0 (0.0%) |
| Education Instruction & Library | 16 (25.4%) | 47 (74.6%) |
| Arts, Media & Entertainment | 0 (0.0%) | 4 (100.0%) |
| Health Diagnosing & Treating | 66 (75.0%) | 22 (25.0%) |
| Health Technologists | 6 (35.3%) | 11 (64.7%) |
| Total (Category) | 157 (63.8%) | 89 (36.2%) |
| Total (Overall) | 286 (57.9%) | 208 (42.1%) |
Services Occupations
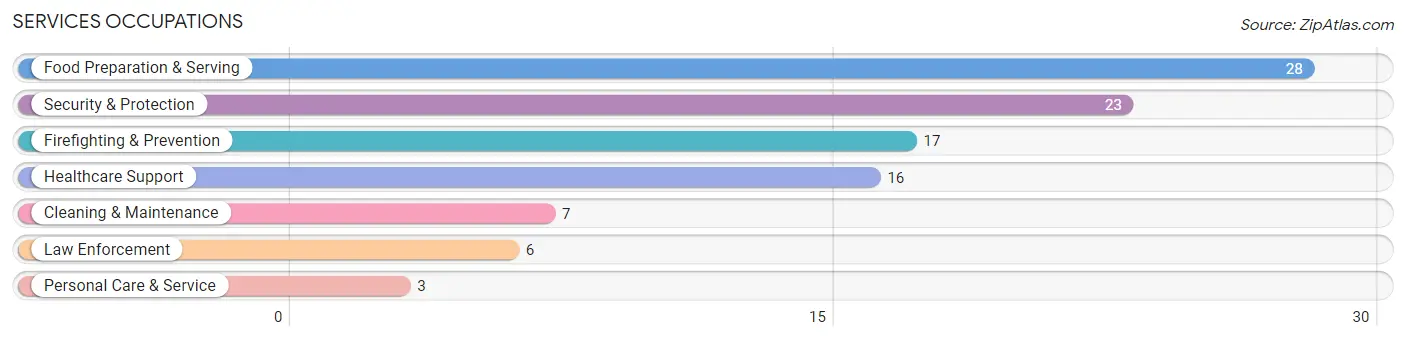
The most common Services occupations in Tsaile are Food Preparation & Serving (28 | 5.7%), Security & Protection (23 | 4.7%), Firefighting & Prevention (17 | 3.4%), Healthcare Support (16 | 3.2%), and Cleaning & Maintenance (7 | 1.4%).
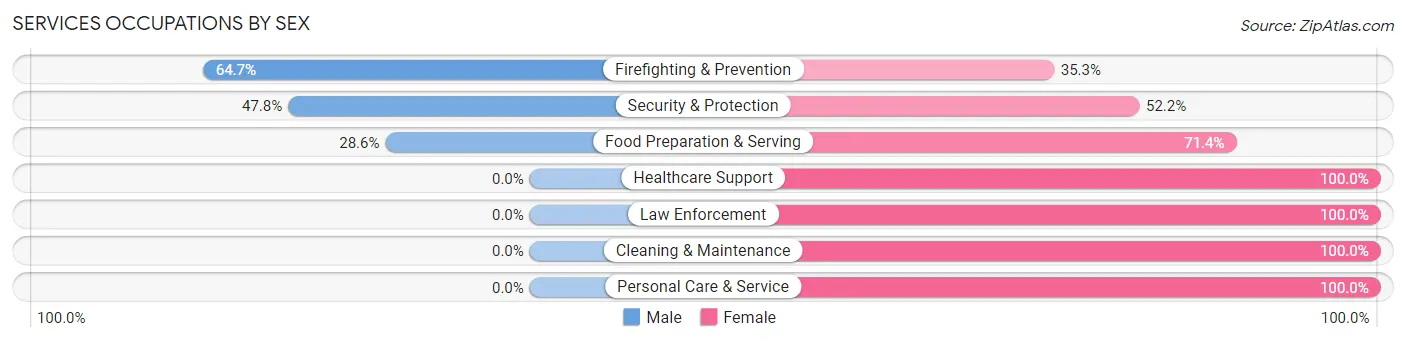
Services Occupations by Sex
Within the Services occupations in Tsaile, the most male-oriented occupations are Firefighting & Prevention (64.7%), Security & Protection (47.8%), and Food Preparation & Serving (28.6%), while the most female-oriented occupations are Healthcare Support (100.0%), Law Enforcement (100.0%), and Cleaning & Maintenance (100.0%).
| Occupation | Male | Female |
| Healthcare Support | 0 (0.0%) | 16 (100.0%) |
| Security & Protection | 11 (47.8%) | 12 (52.2%) |
| Firefighting & Prevention | 11 (64.7%) | 6 (35.3%) |
| Law Enforcement | 0 (0.0%) | 6 (100.0%) |
| Food Preparation & Serving | 8 (28.6%) | 20 (71.4%) |
| Cleaning & Maintenance | 0 (0.0%) | 7 (100.0%) |
| Personal Care & Service | 0 (0.0%) | 3 (100.0%) |
| Total (Category) | 19 (24.7%) | 58 (75.3%) |
| Total (Overall) | 286 (57.9%) | 208 (42.1%) |
Sales and Office Occupations
The most common Sales and Office occupations in Tsaile are Office & Administration (61 | 12.3%), and Sales & Related (59 | 11.9%).

Sales and Office Occupations by Sex

| Occupation | Male | Female |
| Sales & Related | 59 (100.0%) | 0 (0.0%) |
| Office & Administration | 5 (8.2%) | 56 (91.8%) |
| Total (Category) | 64 (53.3%) | 56 (46.7%) |
| Total (Overall) | 286 (57.9%) | 208 (42.1%) |
Natural Resources, Construction and Maintenance Occupations
The most common Natural Resources, Construction and Maintenance occupations in Tsaile are , and Construction & Extraction (29 | 5.9%).
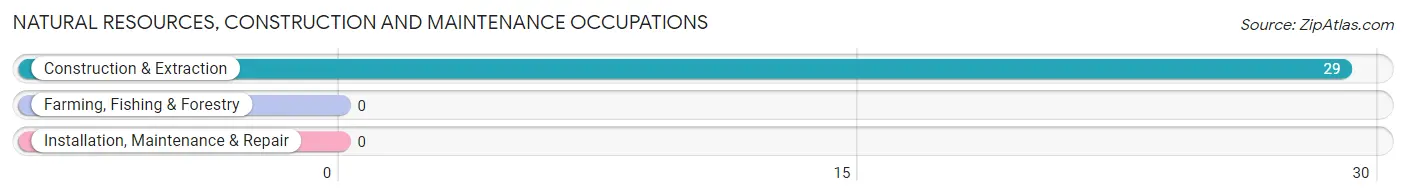
Natural Resources, Construction and Maintenance Occupations by Sex
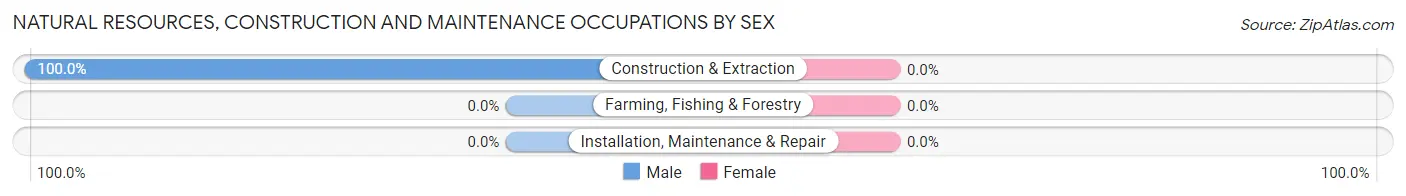
| Occupation | Male | Female |
| Farming, Fishing & Forestry | 0 (0.0%) | 0 (0.0%) |
| Construction & Extraction | 29 (100.0%) | 0 (0.0%) |
| Installation, Maintenance & Repair | 0 (0.0%) | 0 (0.0%) |
| Total (Category) | 29 (100.0%) | 0 (0.0%) |
| Total (Overall) | 286 (57.9%) | 208 (42.1%) |
Production, Transportation and Moving Occupations
The most common Production, Transportation and Moving occupations in Tsaile are Material Moving (17 | 3.4%), and Transportation (5 | 1.0%).
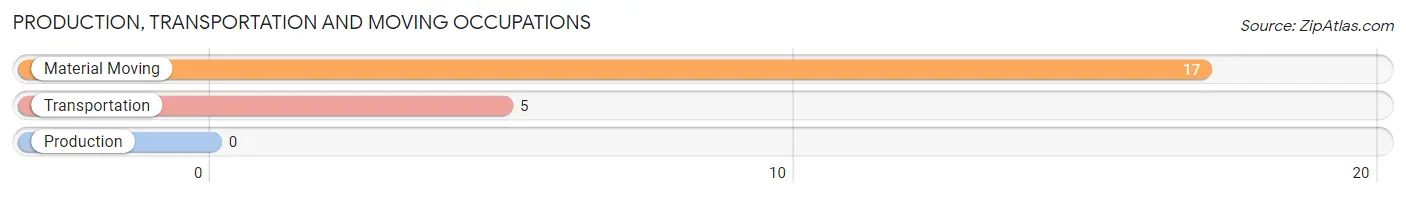
Production, Transportation and Moving Occupations by Sex
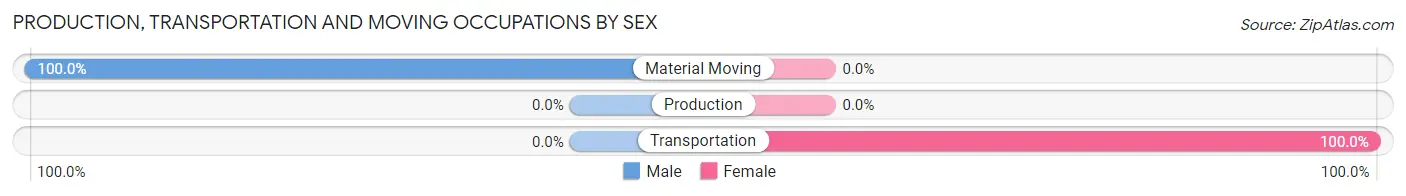
| Occupation | Male | Female |
| Production | 0 (0.0%) | 0 (0.0%) |
| Transportation | 0 (0.0%) | 5 (100.0%) |
| Material Moving | 17 (100.0%) | 0 (0.0%) |
| Total (Category) | 17 (77.3%) | 5 (22.7%) |
| Total (Overall) | 286 (57.9%) | 208 (42.1%) |
Employment Industries by Sex in Tsaile
Employment Industries in Tsaile
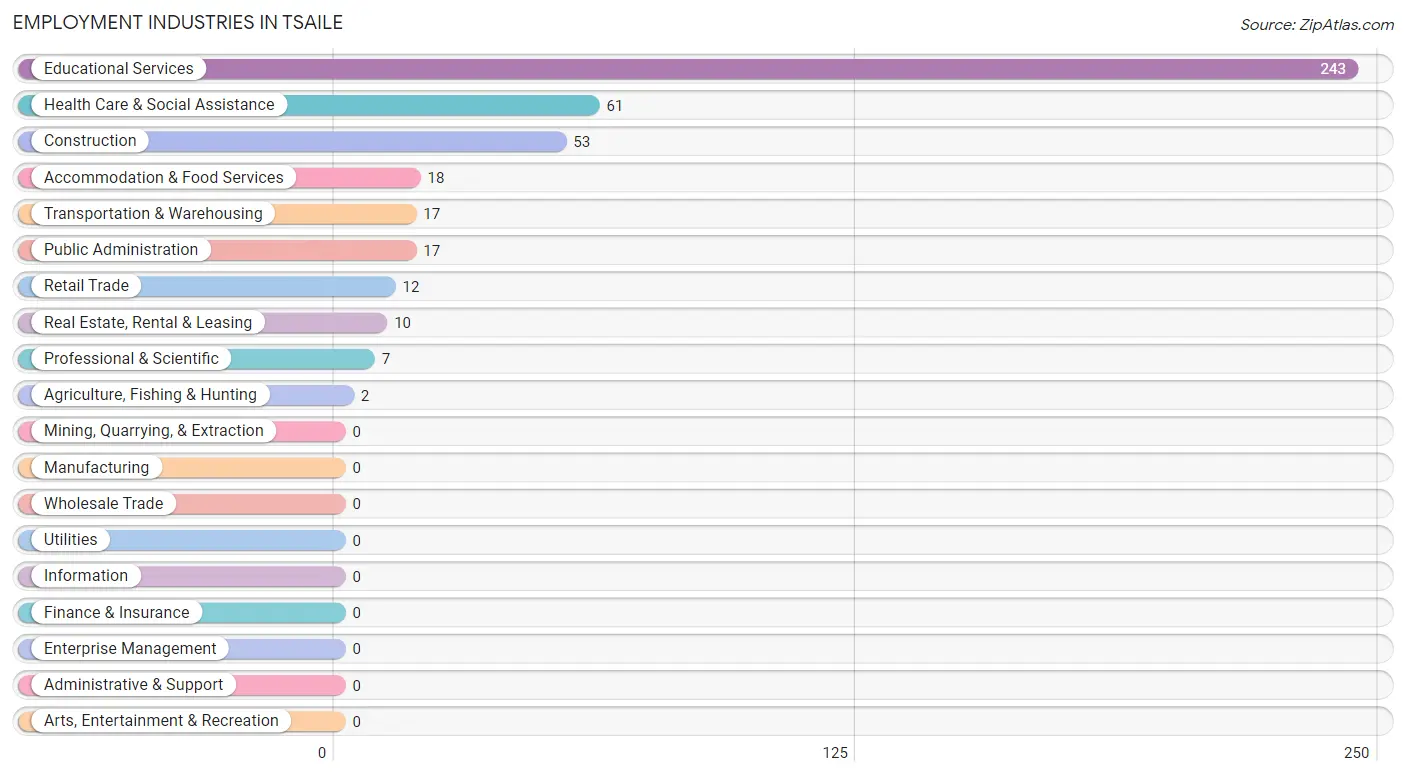
The major employment industries in Tsaile include Educational Services (243 | 49.2%), Health Care & Social Assistance (61 | 12.3%), Construction (53 | 10.7%), Accommodation & Food Services (18 | 3.6%), and Transportation & Warehousing (17 | 3.4%).
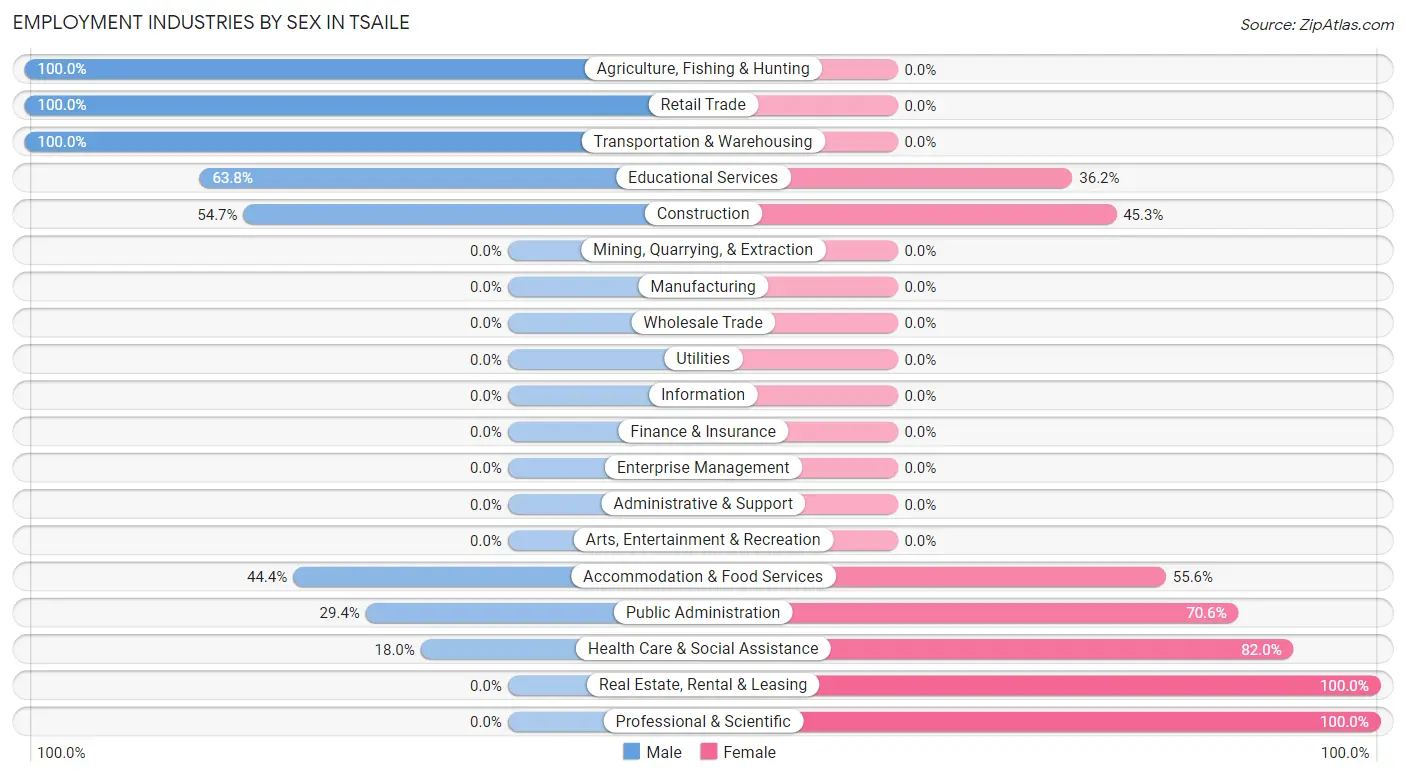
Employment Industries by Sex in Tsaile
The Tsaile industries that see more men than women are Agriculture, Fishing & Hunting (100.0%), Retail Trade (100.0%), and Transportation & Warehousing (100.0%), whereas the industries that tend to have a higher number of women are Real Estate, Rental & Leasing (100.0%), Professional & Scientific (100.0%), and Health Care & Social Assistance (82.0%).
| Industry | Male | Female |
| Agriculture, Fishing & Hunting | 2 (100.0%) | 0 (0.0%) |
| Mining, Quarrying, & Extraction | 0 (0.0%) | 0 (0.0%) |
| Construction | 29 (54.7%) | 24 (45.3%) |
| Manufacturing | 0 (0.0%) | 0 (0.0%) |
| Wholesale Trade | 0 (0.0%) | 0 (0.0%) |
| Retail Trade | 12 (100.0%) | 0 (0.0%) |
| Transportation & Warehousing | 17 (100.0%) | 0 (0.0%) |
| Utilities | 0 (0.0%) | 0 (0.0%) |
| Information | 0 (0.0%) | 0 (0.0%) |
| Finance & Insurance | 0 (0.0%) | 0 (0.0%) |
| Real Estate, Rental & Leasing | 0 (0.0%) | 10 (100.0%) |
| Professional & Scientific | 0 (0.0%) | 7 (100.0%) |
| Enterprise Management | 0 (0.0%) | 0 (0.0%) |
| Administrative & Support | 0 (0.0%) | 0 (0.0%) |
| Educational Services | 155 (63.8%) | 88 (36.2%) |
| Health Care & Social Assistance | 11 (18.0%) | 50 (82.0%) |
| Arts, Entertainment & Recreation | 0 (0.0%) | 0 (0.0%) |
| Accommodation & Food Services | 8 (44.4%) | 10 (55.6%) |
| Public Administration | 5 (29.4%) | 12 (70.6%) |
| Total | 286 (57.9%) | 208 (42.1%) |
Education in Tsaile
School Enrollment in Tsaile
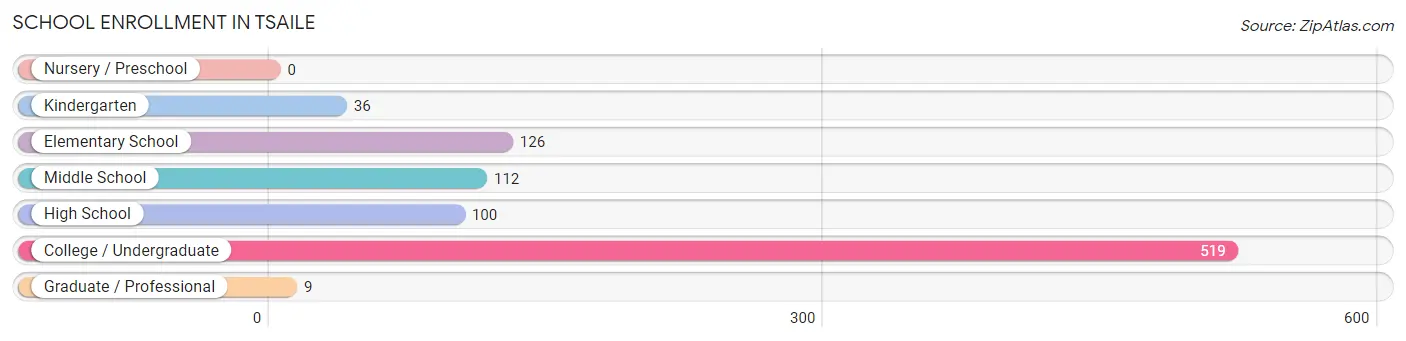
The most common levels of schooling among the 902 students in Tsaile are college / undergraduate (519 | 57.5%), elementary school (126 | 14.0%), and middle school (112 | 12.4%).
| School Level | # Students | % Students |
| Nursery / Preschool | 0 | 0.0% |
| Kindergarten | 36 | 4.0% |
| Elementary School | 126 | 14.0% |
| Middle School | 112 | 12.4% |
| High School | 100 | 11.1% |
| College / Undergraduate | 519 | 57.5% |
| Graduate / Professional | 9 | 1.0% |
| Total | 902 | 100.0% |
School Enrollment by Age by Funding Source in Tsaile
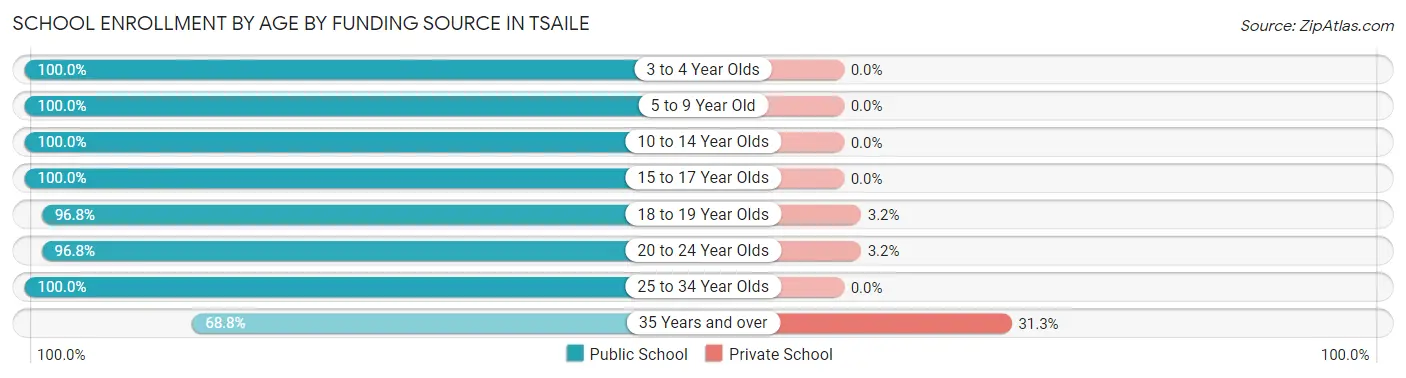
Out of a total of 902 students who are enrolled in schools in Tsaile, 20 (2.2%) attend a private institution, while the remaining 882 (97.8%) are enrolled in public schools. The age group of 35 years and over has the highest likelihood of being enrolled in private schools, with 5 (31.2% in the age bracket) enrolled. Conversely, the age group of 3 to 4 year olds has the lowest likelihood of being enrolled in a private school, with 6 (100.0% in the age bracket) attending a public institution.
| Age Bracket | Public School | Private School |
| 3 to 4 Year Olds | 6 (100.0%) | 0 (0.0%) |
| 5 to 9 Year Old | 147 (100.0%) | 0 (0.0%) |
| 10 to 14 Year Olds | 129 (100.0%) | 0 (0.0%) |
| 15 to 17 Year Olds | 72 (100.0%) | 0 (0.0%) |
| 18 to 19 Year Olds | 243 (96.8%) | 8 (3.2%) |
| 20 to 24 Year Olds | 213 (96.8%) | 7 (3.2%) |
| 25 to 34 Year Olds | 61 (100.0%) | 0 (0.0%) |
| 35 Years and over | 11 (68.8%) | 5 (31.2%) |
| Total | 882 (97.8%) | 20 (2.2%) |
Educational Attainment by Field of Study in Tsaile
Education (34 | 34.3%), science & technology (21 | 21.2%), business (9 | 9.1%), physical & health sciences (6 | 6.1%), and social sciences (6 | 6.1%) are the most common fields of study among 99 individuals in Tsaile who have obtained a bachelor's degree or higher.
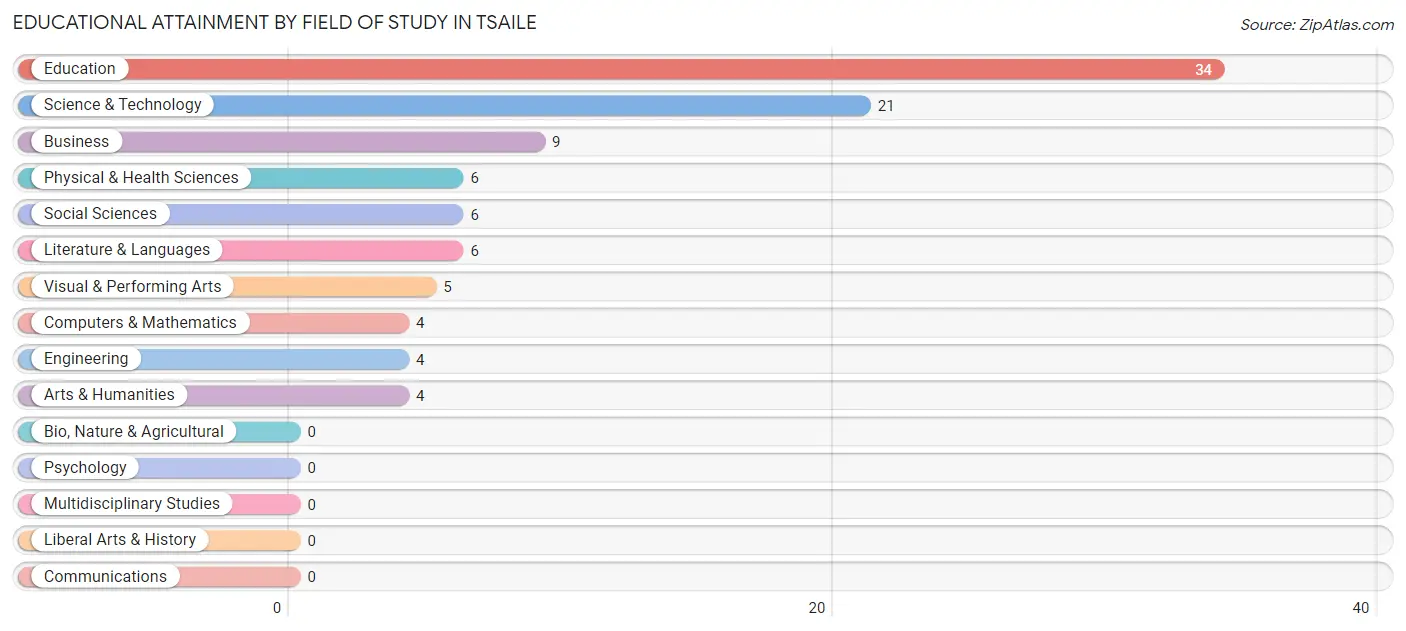
| Field of Study | # Graduates | % Graduates |
| Computers & Mathematics | 4 | 4.0% |
| Bio, Nature & Agricultural | 0 | 0.0% |
| Physical & Health Sciences | 6 | 6.1% |
| Psychology | 0 | 0.0% |
| Social Sciences | 6 | 6.1% |
| Engineering | 4 | 4.0% |
| Multidisciplinary Studies | 0 | 0.0% |
| Science & Technology | 21 | 21.2% |
| Business | 9 | 9.1% |
| Education | 34 | 34.3% |
| Literature & Languages | 6 | 6.1% |
| Liberal Arts & History | 0 | 0.0% |
| Visual & Performing Arts | 5 | 5.1% |
| Communications | 0 | 0.0% |
| Arts & Humanities | 4 | 4.0% |
| Total | 99 | 100.0% |
Transportation & Commute in Tsaile
Vehicle Availability by Sex in Tsaile
The most prevalent vehicle ownership categories in Tsaile are males with 3 vehicles (34, accounting for 34.7%) and females with 3 vehicles (23, making up 21.4%).
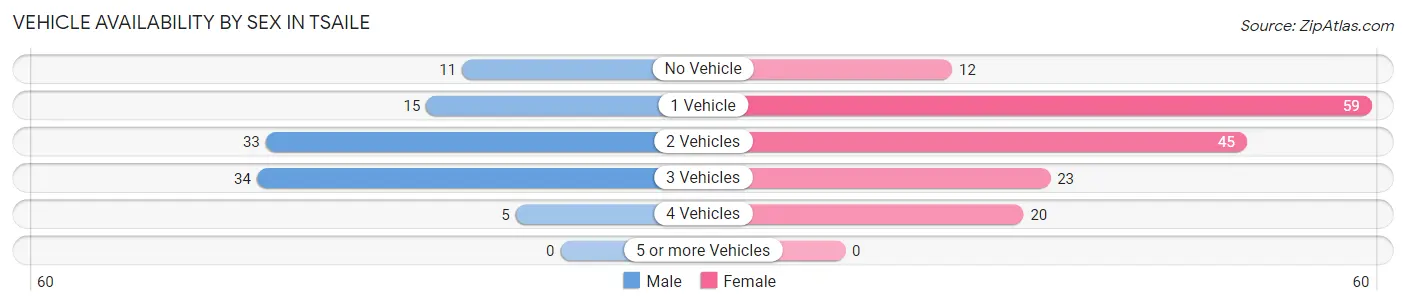
| Vehicles Available | Male | Female |
| No Vehicle | 11 (11.2%) | 12 (7.5%) |
| 1 Vehicle | 15 (15.3%) | 59 (37.1%) |
| 2 Vehicles | 33 (33.7%) | 45 (28.3%) |
| 3 Vehicles | 34 (34.7%) | 23 (14.5%) |
| 4 Vehicles | 5 (5.1%) | 20 (12.6%) |
| 5 or more Vehicles | 0 (0.0%) | 0 (0.0%) |
| Total | 98 (100.0%) | 159 (100.0%) |
Commute Time in Tsaile
The most frequently occuring commute durations in Tsaile are 5 to 9 minutes (169 commuters, 41.1%), 15 to 19 minutes (60 commuters, 14.6%), and 90 or more minutes (36 commuters, 8.8%).
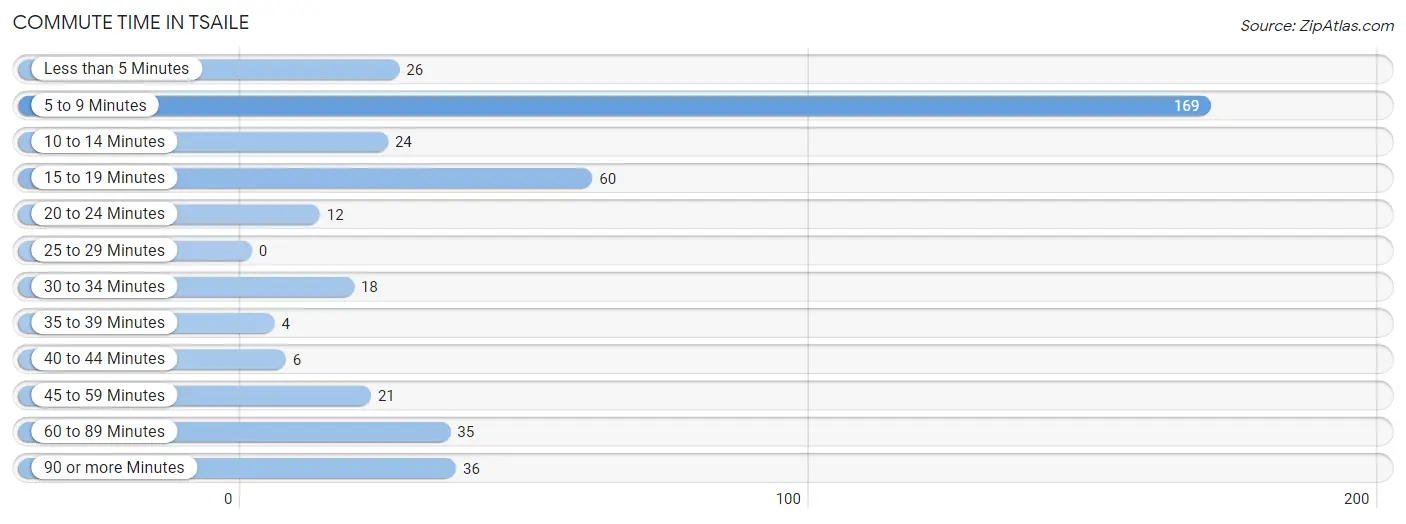
| Commute Time | # Commuters | % Commuters |
| Less than 5 Minutes | 26 | 6.3% |
| 5 to 9 Minutes | 169 | 41.1% |
| 10 to 14 Minutes | 24 | 5.8% |
| 15 to 19 Minutes | 60 | 14.6% |
| 20 to 24 Minutes | 12 | 2.9% |
| 25 to 29 Minutes | 0 | 0.0% |
| 30 to 34 Minutes | 18 | 4.4% |
| 35 to 39 Minutes | 4 | 1.0% |
| 40 to 44 Minutes | 6 | 1.5% |
| 45 to 59 Minutes | 21 | 5.1% |
| 60 to 89 Minutes | 35 | 8.5% |
| 90 or more Minutes | 36 | 8.8% |
Commute Time by Sex in Tsaile
The most common commute times in Tsaile are 5 to 9 minutes (125 commuters, 57.9%) for males and 5 to 9 minutes (44 commuters, 22.6%) for females.
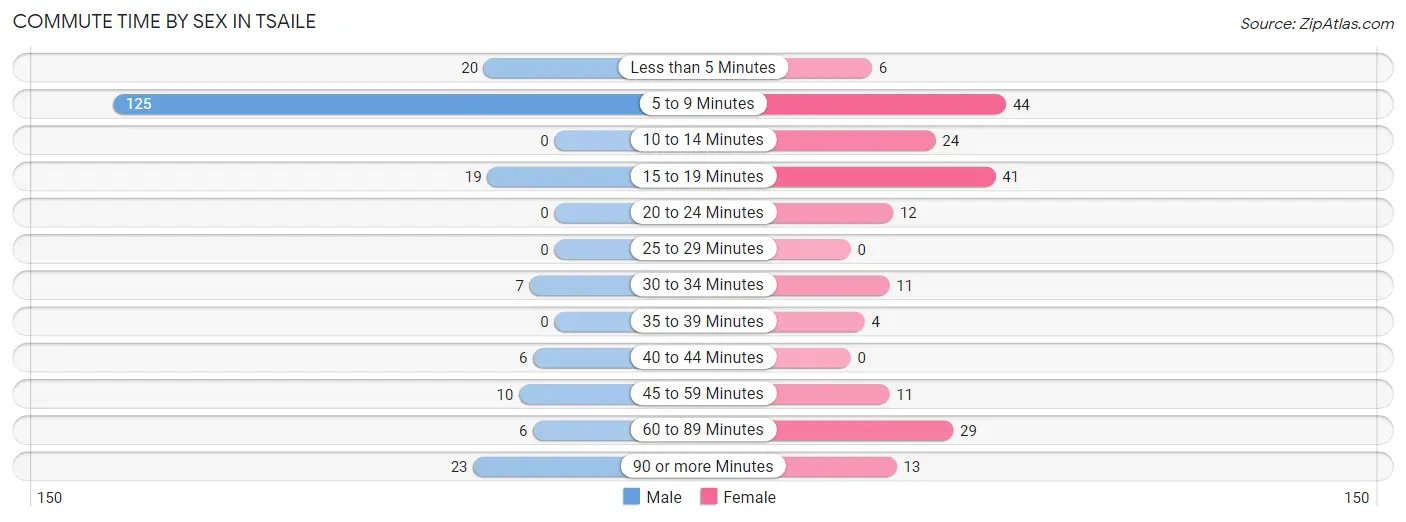
| Commute Time | Male | Female |
| Less than 5 Minutes | 20 (9.3%) | 6 (3.1%) |
| 5 to 9 Minutes | 125 (57.9%) | 44 (22.6%) |
| 10 to 14 Minutes | 0 (0.0%) | 24 (12.3%) |
| 15 to 19 Minutes | 19 (8.8%) | 41 (21.0%) |
| 20 to 24 Minutes | 0 (0.0%) | 12 (6.1%) |
| 25 to 29 Minutes | 0 (0.0%) | 0 (0.0%) |
| 30 to 34 Minutes | 7 (3.2%) | 11 (5.6%) |
| 35 to 39 Minutes | 0 (0.0%) | 4 (2.1%) |
| 40 to 44 Minutes | 6 (2.8%) | 0 (0.0%) |
| 45 to 59 Minutes | 10 (4.6%) | 11 (5.6%) |
| 60 to 89 Minutes | 6 (2.8%) | 29 (14.9%) |
| 90 or more Minutes | 23 (10.6%) | 13 (6.7%) |
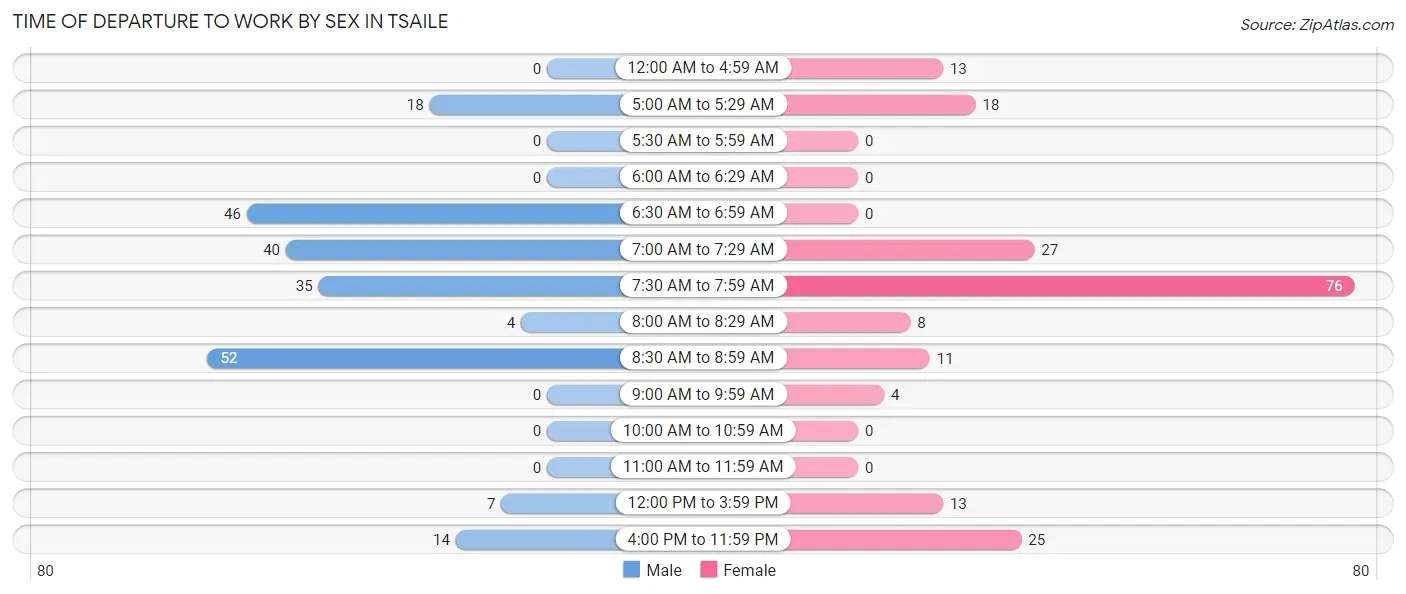
Time of Departure to Work by Sex in Tsaile
The most frequent times of departure to work in Tsaile are 8:30 AM to 8:59 AM (52, 24.1%) for males and 7:30 AM to 7:59 AM (76, 39.0%) for females.
| Time of Departure | Male | Female |
| 12:00 AM to 4:59 AM | 0 (0.0%) | 13 (6.7%) |
| 5:00 AM to 5:29 AM | 18 (8.3%) | 18 (9.2%) |
| 5:30 AM to 5:59 AM | 0 (0.0%) | 0 (0.0%) |
| 6:00 AM to 6:29 AM | 0 (0.0%) | 0 (0.0%) |
| 6:30 AM to 6:59 AM | 46 (21.3%) | 0 (0.0%) |
| 7:00 AM to 7:29 AM | 40 (18.5%) | 27 (13.9%) |
| 7:30 AM to 7:59 AM | 35 (16.2%) | 76 (39.0%) |
| 8:00 AM to 8:29 AM | 4 (1.8%) | 8 (4.1%) |
| 8:30 AM to 8:59 AM | 52 (24.1%) | 11 (5.6%) |
| 9:00 AM to 9:59 AM | 0 (0.0%) | 4 (2.1%) |
| 10:00 AM to 10:59 AM | 0 (0.0%) | 0 (0.0%) |
| 11:00 AM to 11:59 AM | 0 (0.0%) | 0 (0.0%) |
| 12:00 PM to 3:59 PM | 7 (3.2%) | 13 (6.7%) |
| 4:00 PM to 11:59 PM | 14 (6.5%) | 25 (12.8%) |
| Total | 216 (100.0%) | 195 (100.0%) |
Housing Occupancy in Tsaile
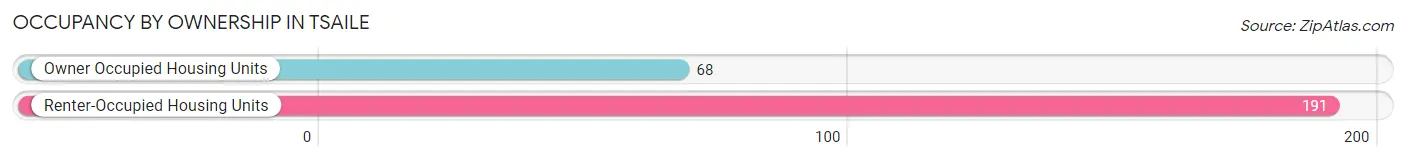
Occupancy by Ownership in Tsaile
Of the total 259 dwellings in Tsaile, owner-occupied units account for 68 (26.3%), while renter-occupied units make up 191 (73.8%).
| Occupancy | # Housing Units | % Housing Units |
| Owner Occupied Housing Units | 68 | 26.3% |
| Renter-Occupied Housing Units | 191 | 73.8% |
| Total Occupied Housing Units | 259 | 100.0% |
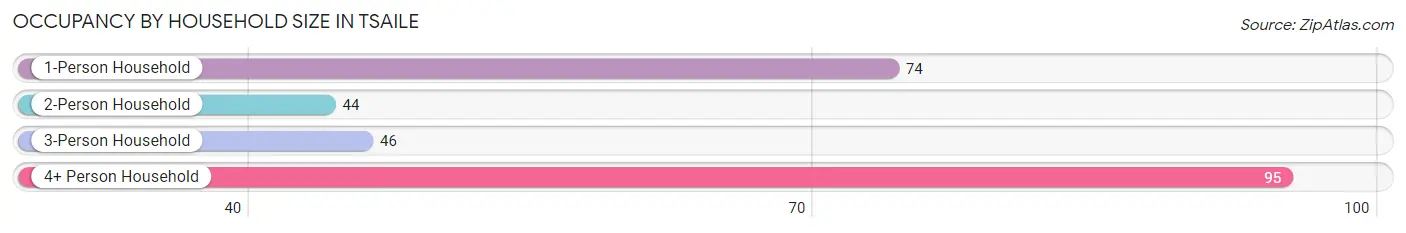
Occupancy by Household Size in Tsaile
| Household Size | # Housing Units | % Housing Units |
| 1-Person Household | 74 | 28.6% |
| 2-Person Household | 44 | 17.0% |
| 3-Person Household | 46 | 17.8% |
| 4+ Person Household | 95 | 36.7% |
| Total Housing Units | 259 | 100.0% |
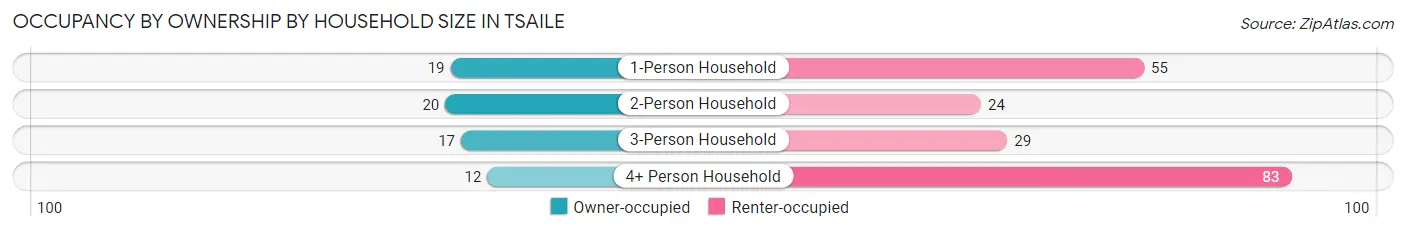
Occupancy by Ownership by Household Size in Tsaile
| Household Size | Owner-occupied | Renter-occupied |
| 1-Person Household | 19 (25.7%) | 55 (74.3%) |
| 2-Person Household | 20 (45.5%) | 24 (54.5%) |
| 3-Person Household | 17 (37.0%) | 29 (63.0%) |
| 4+ Person Household | 12 (12.6%) | 83 (87.4%) |
| Total Housing Units | 68 (26.3%) | 191 (73.8%) |
Occupancy by Educational Attainment in Tsaile
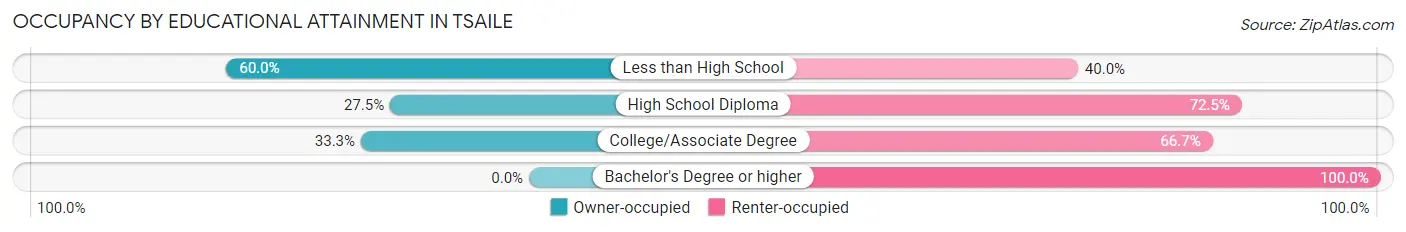
| Household Size | Owner-occupied | Renter-occupied |
| Less than High School | 21 (60.0%) | 14 (40.0%) |
| High School Diploma | 19 (27.5%) | 50 (72.5%) |
| College/Associate Degree | 28 (33.3%) | 56 (66.7%) |
| Bachelor's Degree or higher | 0 (0.0%) | 71 (100.0%) |
Occupancy by Age of Householder in Tsaile
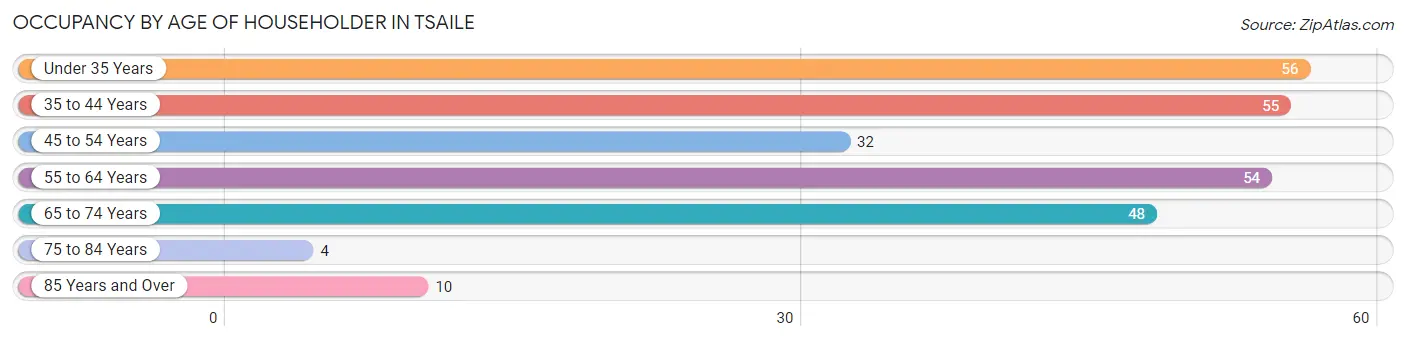
| Age Bracket | # Households | % Households |
| Under 35 Years | 56 | 21.6% |
| 35 to 44 Years | 55 | 21.2% |
| 45 to 54 Years | 32 | 12.4% |
| 55 to 64 Years | 54 | 20.8% |
| 65 to 74 Years | 48 | 18.5% |
| 75 to 84 Years | 4 | 1.5% |
| 85 Years and Over | 10 | 3.9% |
| Total | 259 | 100.0% |
Housing Finances in Tsaile
Median Income by Occupancy in Tsaile
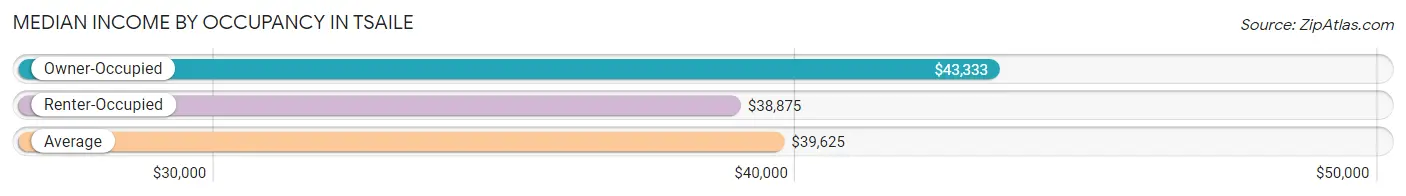
| Occupancy Type | # Households | Median Income |
| Owner-Occupied | 68 (26.3%) | $43,333 |
| Renter-Occupied | 191 (73.8%) | $38,875 |
| Average | 259 (100.0%) | $39,625 |
Occupancy by Householder Income Bracket in Tsaile
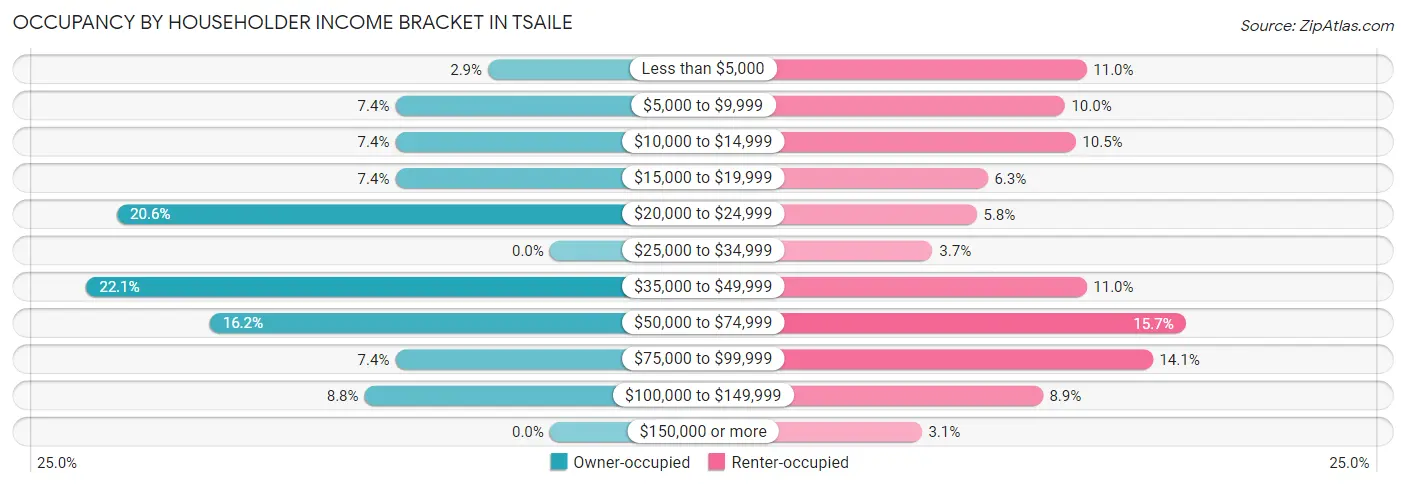
| Income Bracket | Owner-occupied | Renter-occupied |
| Less than $5,000 | 2 (2.9%) | 21 (11.0%) |
| $5,000 to $9,999 | 5 (7.3%) | 19 (10.0%) |
| $10,000 to $14,999 | 5 (7.3%) | 20 (10.5%) |
| $15,000 to $19,999 | 5 (7.3%) | 12 (6.3%) |
| $20,000 to $24,999 | 14 (20.6%) | 11 (5.8%) |
| $25,000 to $34,999 | 0 (0.0%) | 7 (3.7%) |
| $35,000 to $49,999 | 15 (22.1%) | 21 (11.0%) |
| $50,000 to $74,999 | 11 (16.2%) | 30 (15.7%) |
| $75,000 to $99,999 | 5 (7.3%) | 27 (14.1%) |
| $100,000 to $149,999 | 6 (8.8%) | 17 (8.9%) |
| $150,000 or more | 0 (0.0%) | 6 (3.1%) |
| Total | 68 (100.0%) | 191 (100.0%) |
Monthly Housing Cost Tiers in Tsaile
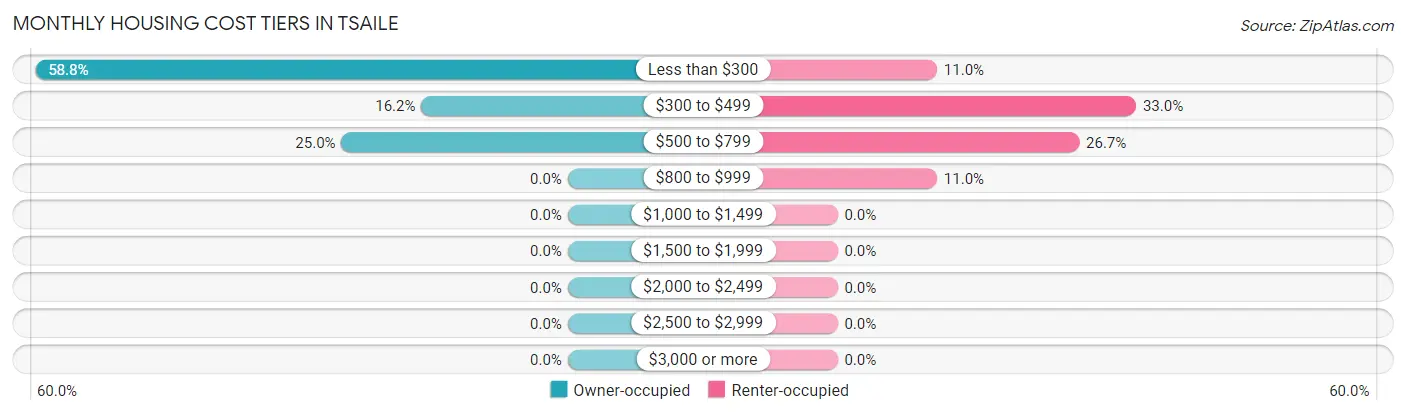
| Monthly Cost | Owner-occupied | Renter-occupied |
| Less than $300 | 40 (58.8%) | 21 (11.0%) |
| $300 to $499 | 11 (16.2%) | 63 (33.0%) |
| $500 to $799 | 17 (25.0%) | 51 (26.7%) |
| $800 to $999 | 0 (0.0%) | 21 (11.0%) |
| $1,000 to $1,499 | 0 (0.0%) | 0 (0.0%) |
| $1,500 to $1,999 | 0 (0.0%) | 0 (0.0%) |
| $2,000 to $2,499 | 0 (0.0%) | 0 (0.0%) |
| $2,500 to $2,999 | 0 (0.0%) | 0 (0.0%) |
| $3,000 or more | 0 (0.0%) | 0 (0.0%) |
| Total | 68 (100.0%) | 191 (100.0%) |
Physical Housing Characteristics in Tsaile
Housing Structures in Tsaile
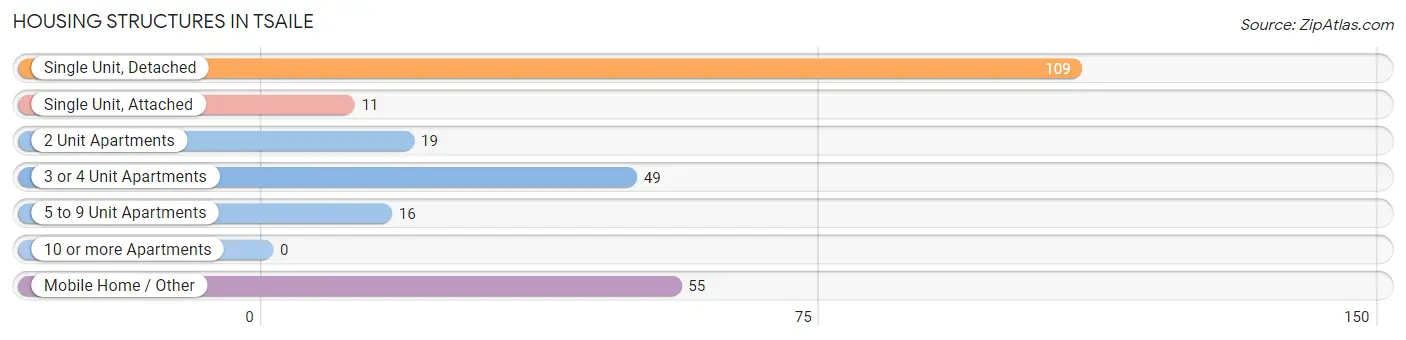
| Structure Type | # Housing Units | % Housing Units |
| Single Unit, Detached | 109 | 42.1% |
| Single Unit, Attached | 11 | 4.3% |
| 2 Unit Apartments | 19 | 7.3% |
| 3 or 4 Unit Apartments | 49 | 18.9% |
| 5 to 9 Unit Apartments | 16 | 6.2% |
| 10 or more Apartments | 0 | 0.0% |
| Mobile Home / Other | 55 | 21.2% |
| Total | 259 | 100.0% |
Housing Structures by Occupancy in Tsaile
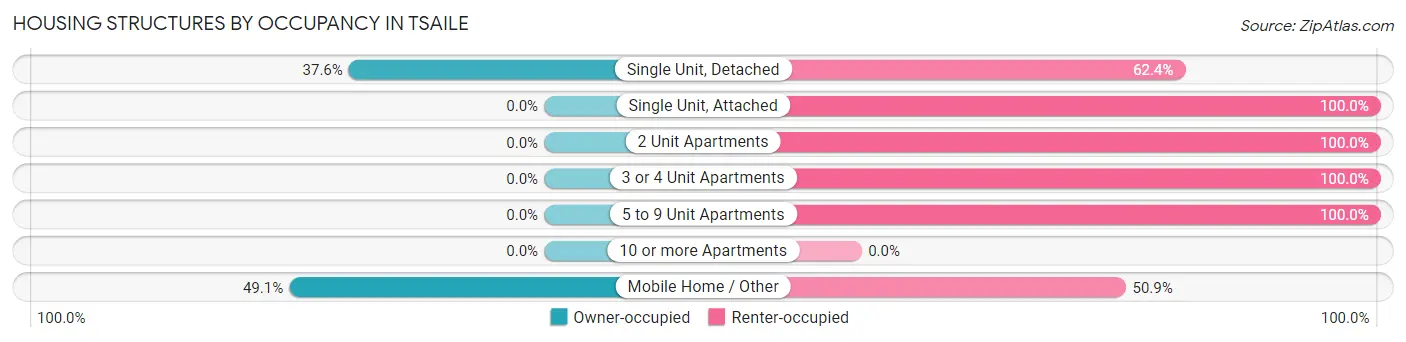
| Structure Type | Owner-occupied | Renter-occupied |
| Single Unit, Detached | 41 (37.6%) | 68 (62.4%) |
| Single Unit, Attached | 0 (0.0%) | 11 (100.0%) |
| 2 Unit Apartments | 0 (0.0%) | 19 (100.0%) |
| 3 or 4 Unit Apartments | 0 (0.0%) | 49 (100.0%) |
| 5 to 9 Unit Apartments | 0 (0.0%) | 16 (100.0%) |
| 10 or more Apartments | 0 (0.0%) | 0 (0.0%) |
| Mobile Home / Other | 27 (49.1%) | 28 (50.9%) |
| Total | 68 (26.3%) | 191 (73.8%) |
Housing Structures by Number of Rooms in Tsaile
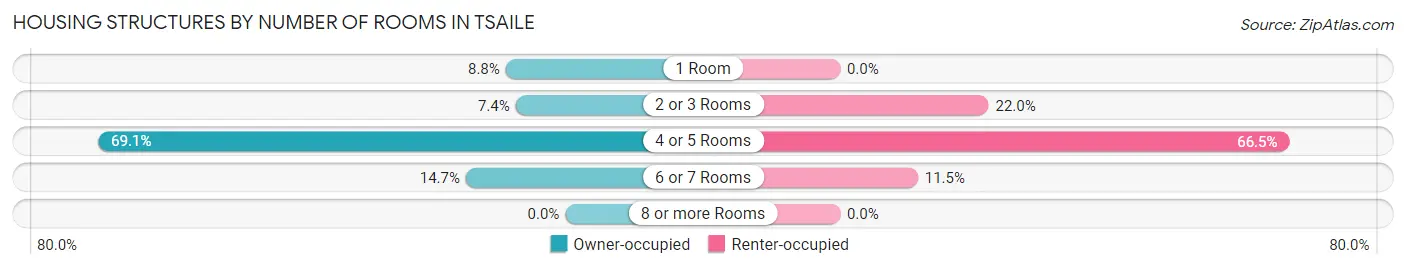
| Number of Rooms | Owner-occupied | Renter-occupied |
| 1 Room | 6 (8.8%) | 0 (0.0%) |
| 2 or 3 Rooms | 5 (7.3%) | 42 (22.0%) |
| 4 or 5 Rooms | 47 (69.1%) | 127 (66.5%) |
| 6 or 7 Rooms | 10 (14.7%) | 22 (11.5%) |
| 8 or more Rooms | 0 (0.0%) | 0 (0.0%) |
| Total | 68 (100.0%) | 191 (100.0%) |
Housing Structure by Heating Type in Tsaile
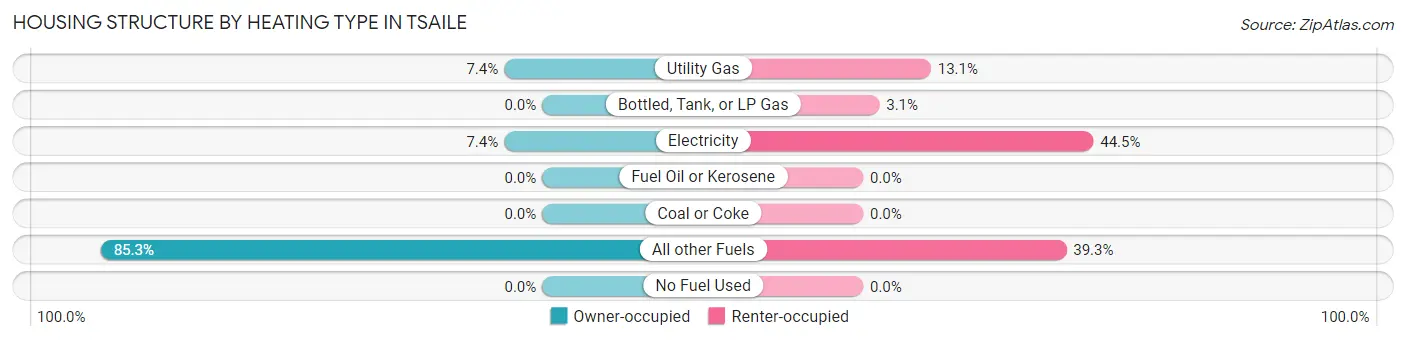
| Heating Type | Owner-occupied | Renter-occupied |
| Utility Gas | 5 (7.3%) | 25 (13.1%) |
| Bottled, Tank, or LP Gas | 0 (0.0%) | 6 (3.1%) |
| Electricity | 5 (7.3%) | 85 (44.5%) |
| Fuel Oil or Kerosene | 0 (0.0%) | 0 (0.0%) |
| Coal or Coke | 0 (0.0%) | 0 (0.0%) |
| All other Fuels | 58 (85.3%) | 75 (39.3%) |
| No Fuel Used | 0 (0.0%) | 0 (0.0%) |
| Total | 68 (100.0%) | 191 (100.0%) |
Household Vehicle Usage in Tsaile
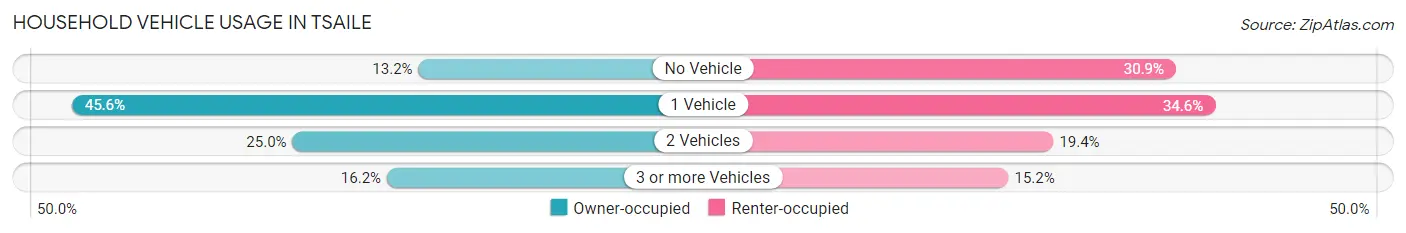
| Vehicles per Household | Owner-occupied | Renter-occupied |
| No Vehicle | 9 (13.2%) | 59 (30.9%) |
| 1 Vehicle | 31 (45.6%) | 66 (34.5%) |
| 2 Vehicles | 17 (25.0%) | 37 (19.4%) |
| 3 or more Vehicles | 11 (16.2%) | 29 (15.2%) |
| Total | 68 (100.0%) | 191 (100.0%) |
Real Estate & Mortgages in Tsaile
Real Estate and Mortgage Overview in Tsaile
| Characteristic | Without Mortgage | With Mortgage |
| Housing Units | 58 | 10 |
| Median Property Value | $46,400 | $0 |
| Median Household Income | $44,722 | $0 |
| Monthly Housing Costs | $197 | $0 |
| Real Estate Taxes | - | - |
Property Value by Mortgage Status in Tsaile
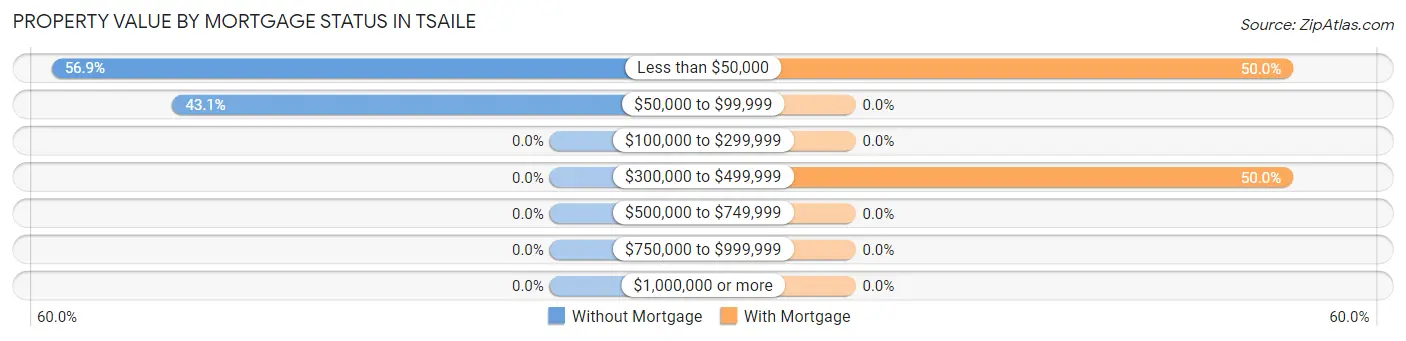
| Property Value | Without Mortgage | With Mortgage |
| Less than $50,000 | 33 (56.9%) | 5 (50.0%) |
| $50,000 to $99,999 | 25 (43.1%) | 0 (0.0%) |
| $100,000 to $299,999 | 0 (0.0%) | 0 (0.0%) |
| $300,000 to $499,999 | 0 (0.0%) | 5 (50.0%) |
| $500,000 to $749,999 | 0 (0.0%) | 0 (0.0%) |
| $750,000 to $999,999 | 0 (0.0%) | 0 (0.0%) |
| $1,000,000 or more | 0 (0.0%) | 0 (0.0%) |
| Total | 58 (100.0%) | 10 (100.0%) |
Household Income by Mortgage Status in Tsaile
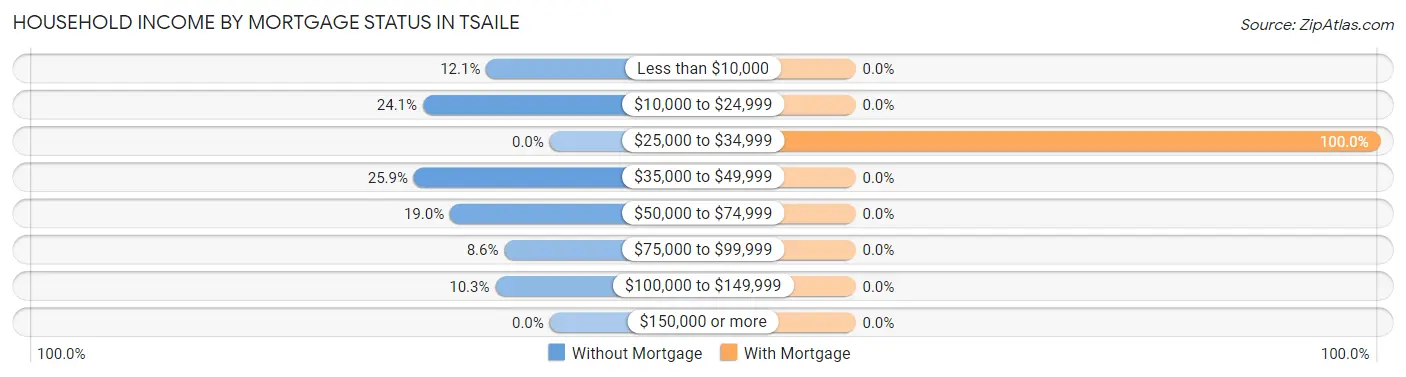
| Household Income | Without Mortgage | With Mortgage |
| Less than $10,000 | 7 (12.1%) | 0 (0.0%) |
| $10,000 to $24,999 | 14 (24.1%) | 0 (0.0%) |
| $25,000 to $34,999 | 0 (0.0%) | 10 (100.0%) |
| $35,000 to $49,999 | 15 (25.9%) | 0 (0.0%) |
| $50,000 to $74,999 | 11 (19.0%) | 0 (0.0%) |
| $75,000 to $99,999 | 5 (8.6%) | 0 (0.0%) |
| $100,000 to $149,999 | 6 (10.3%) | 0 (0.0%) |
| $150,000 or more | 0 (0.0%) | 0 (0.0%) |
| Total | 58 (100.0%) | 10 (100.0%) |
Property Value to Household Income Ratio in Tsaile
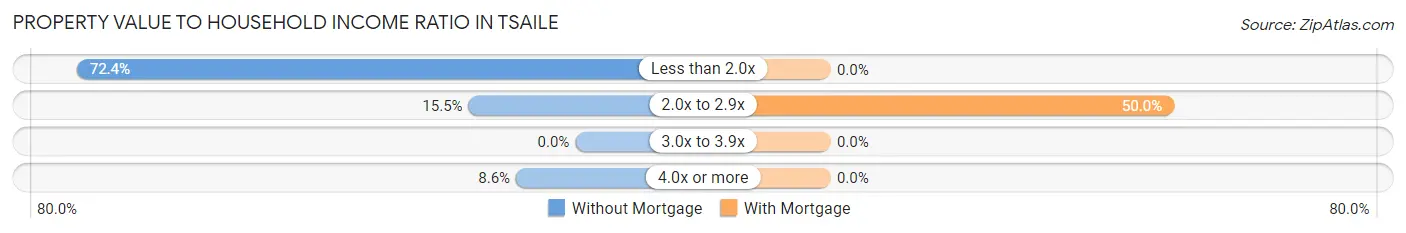
| Value-to-Income Ratio | Without Mortgage | With Mortgage |
| Less than 2.0x | 42 (72.4%) | 0 (0.0%) |
| 2.0x to 2.9x | 9 (15.5%) | 5 (50.0%) |
| 3.0x to 3.9x | 0 (0.0%) | 0 (0.0%) |
| 4.0x or more | 5 (8.6%) | 0 (0.0%) |
| Total | 58 (100.0%) | 10 (100.0%) |
Real Estate Taxes by Mortgage Status in Tsaile
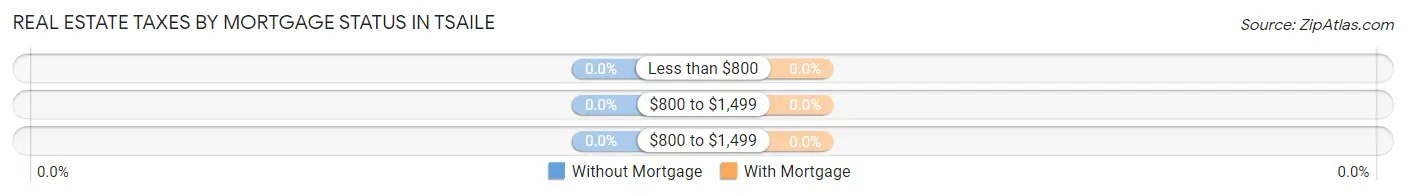
| Property Taxes | Without Mortgage | With Mortgage |
| Less than $800 | 0 (0.0%) | 0 (0.0%) |
| $800 to $1,499 | 0 (0.0%) | 0 (0.0%) |
| $800 to $1,499 | 0 (0.0%) | 0 (0.0%) |
| Total | 58 (100.0%) | 10 (100.0%) |
Health & Disability in Tsaile
Health Insurance Coverage by Age in Tsaile
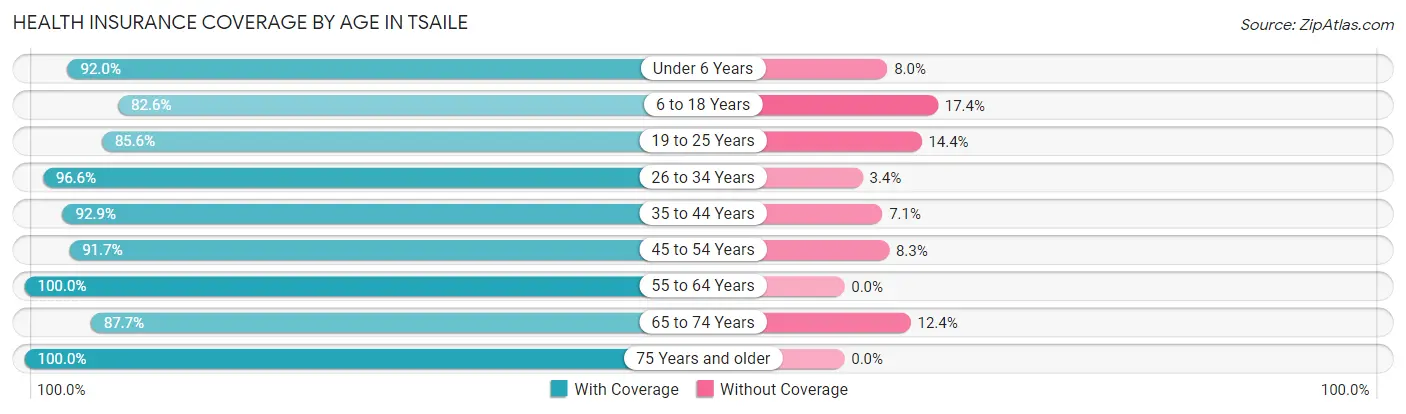
| Age Bracket | With Coverage | Without Coverage |
| Under 6 Years | 92 (92.0%) | 8 (8.0%) |
| 6 to 18 Years | 379 (82.6%) | 80 (17.4%) |
| 19 to 25 Years | 351 (85.6%) | 59 (14.4%) |
| 26 to 34 Years | 142 (96.6%) | 5 (3.4%) |
| 35 to 44 Years | 105 (92.9%) | 8 (7.1%) |
| 45 to 54 Years | 55 (91.7%) | 5 (8.3%) |
| 55 to 64 Years | 83 (100.0%) | 0 (0.0%) |
| 65 to 74 Years | 71 (87.6%) | 10 (12.3%) |
| 75 Years and older | 22 (100.0%) | 0 (0.0%) |
| Total | 1,300 (88.1%) | 175 (11.9%) |
Health Insurance Coverage by Citizenship Status in Tsaile

| Citizenship Status | With Coverage | Without Coverage |
| Native Born | 92 (92.0%) | 8 (8.0%) |
| Foreign Born, Citizen | 379 (82.6%) | 80 (17.4%) |
| Foreign Born, not a Citizen | 351 (85.6%) | 59 (14.4%) |
Health Insurance Coverage by Household Income in Tsaile
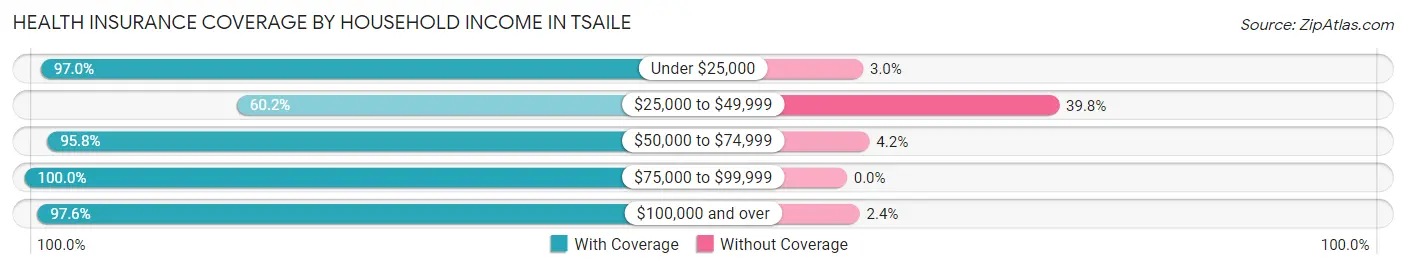
| Household Income | With Coverage | Without Coverage |
| Under $25,000 | 415 (97.0%) | 13 (3.0%) |
| $25,000 to $49,999 | 109 (60.2%) | 72 (39.8%) |
| $50,000 to $74,999 | 113 (95.8%) | 5 (4.2%) |
| $75,000 to $99,999 | 83 (100.0%) | 0 (0.0%) |
| $100,000 and over | 203 (97.6%) | 5 (2.4%) |
Public vs Private Health Insurance Coverage by Age in Tsaile
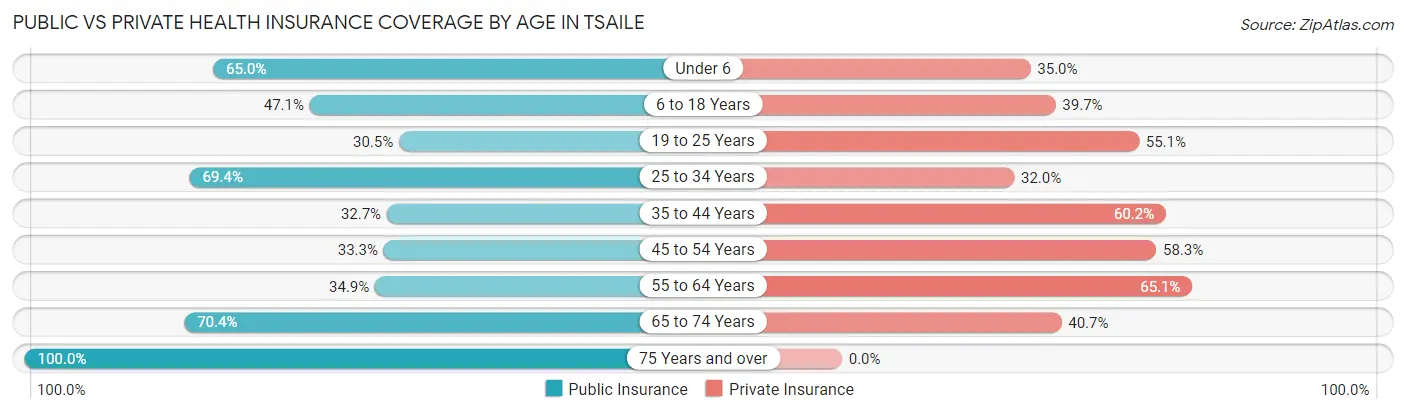
| Age Bracket | Public Insurance | Private Insurance |
| Under 6 | 65 (65.0%) | 35 (35.0%) |
| 6 to 18 Years | 216 (47.1%) | 182 (39.7%) |
| 19 to 25 Years | 125 (30.5%) | 226 (55.1%) |
| 25 to 34 Years | 102 (69.4%) | 47 (32.0%) |
| 35 to 44 Years | 37 (32.7%) | 68 (60.2%) |
| 45 to 54 Years | 20 (33.3%) | 35 (58.3%) |
| 55 to 64 Years | 29 (34.9%) | 54 (65.1%) |
| 65 to 74 Years | 57 (70.4%) | 33 (40.7%) |
| 75 Years and over | 22 (100.0%) | 0 (0.0%) |
| Total | 673 (45.6%) | 680 (46.1%) |
Disability Status by Sex by Age in Tsaile

| Age Bracket | Male | Female |
| Under 5 Years | 0 (0.0%) | 0 (0.0%) |
| 5 to 17 Years | 4 (3.2%) | 0 (0.0%) |
| 18 to 34 Years | 0 (0.0%) | 7 (2.3%) |
| 35 to 64 Years | 0 (0.0%) | 2 (1.2%) |
| 65 to 74 Years | 0 (0.0%) | 18 (35.3%) |
| 75 Years and over | 0 (0.0%) | 5 (27.8%) |
Disability Class by Sex by Age in Tsaile
Disability Class: Hearing Difficulty
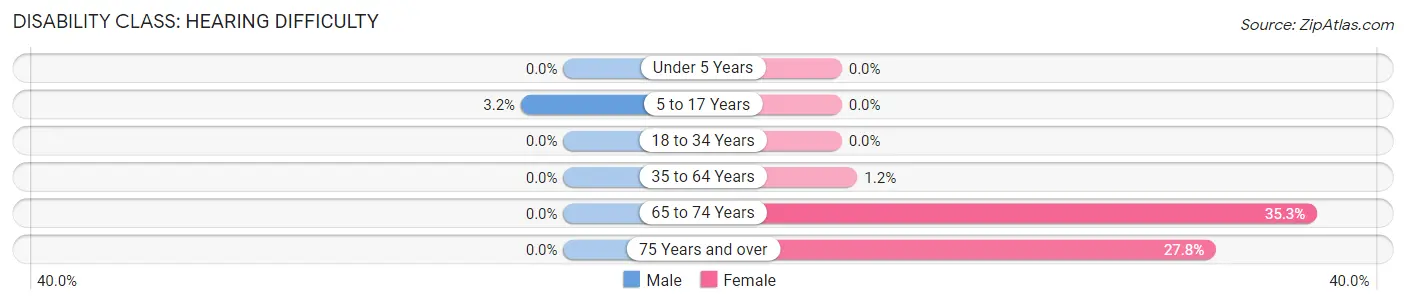
| Age Bracket | Male | Female |
| Under 5 Years | 0 (0.0%) | 0 (0.0%) |
| 5 to 17 Years | 4 (3.2%) | 0 (0.0%) |
| 18 to 34 Years | 0 (0.0%) | 0 (0.0%) |
| 35 to 64 Years | 0 (0.0%) | 2 (1.2%) |
| 65 to 74 Years | 0 (0.0%) | 18 (35.3%) |
| 75 Years and over | 0 (0.0%) | 5 (27.8%) |
Disability Class: Vision Difficulty
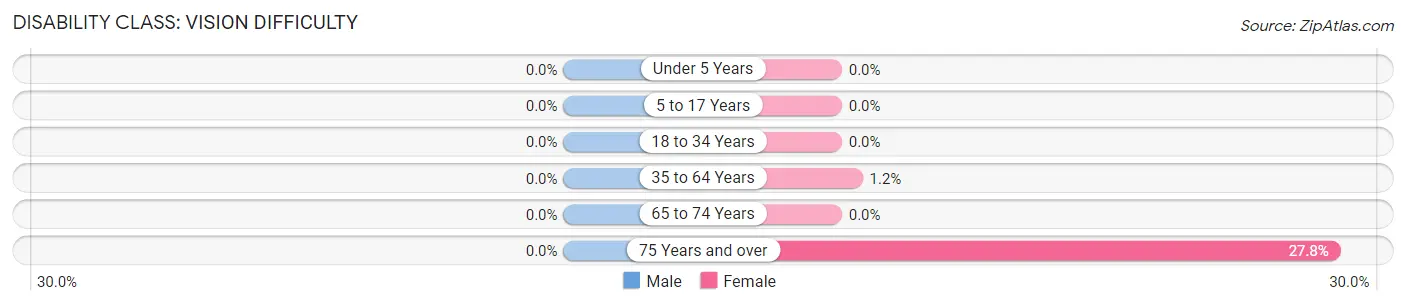
| Age Bracket | Male | Female |
| Under 5 Years | 0 (0.0%) | 0 (0.0%) |
| 5 to 17 Years | 0 (0.0%) | 0 (0.0%) |
| 18 to 34 Years | 0 (0.0%) | 0 (0.0%) |
| 35 to 64 Years | 0 (0.0%) | 2 (1.2%) |
| 65 to 74 Years | 0 (0.0%) | 0 (0.0%) |
| 75 Years and over | 0 (0.0%) | 5 (27.8%) |
Disability Class: Cognitive Difficulty
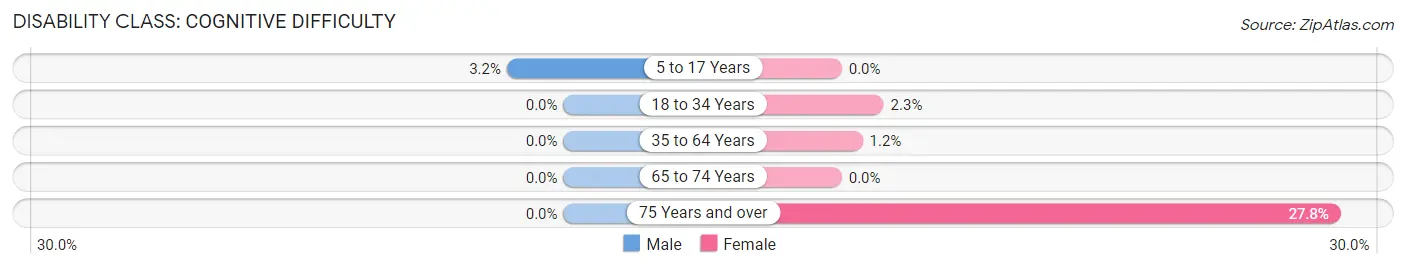
| Age Bracket | Male | Female |
| 5 to 17 Years | 4 (3.2%) | 0 (0.0%) |
| 18 to 34 Years | 0 (0.0%) | 7 (2.3%) |
| 35 to 64 Years | 0 (0.0%) | 2 (1.2%) |
| 65 to 74 Years | 0 (0.0%) | 0 (0.0%) |
| 75 Years and over | 0 (0.0%) | 5 (27.8%) |
Disability Class: Ambulatory Difficulty
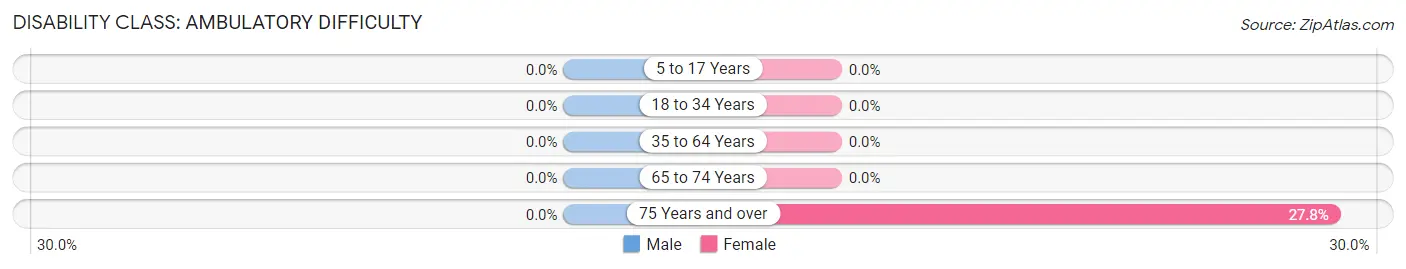
| Age Bracket | Male | Female |
| 5 to 17 Years | 0 (0.0%) | 0 (0.0%) |
| 18 to 34 Years | 0 (0.0%) | 0 (0.0%) |
| 35 to 64 Years | 0 (0.0%) | 0 (0.0%) |
| 65 to 74 Years | 0 (0.0%) | 0 (0.0%) |
| 75 Years and over | 0 (0.0%) | 5 (27.8%) |
Disability Class: Self-Care Difficulty
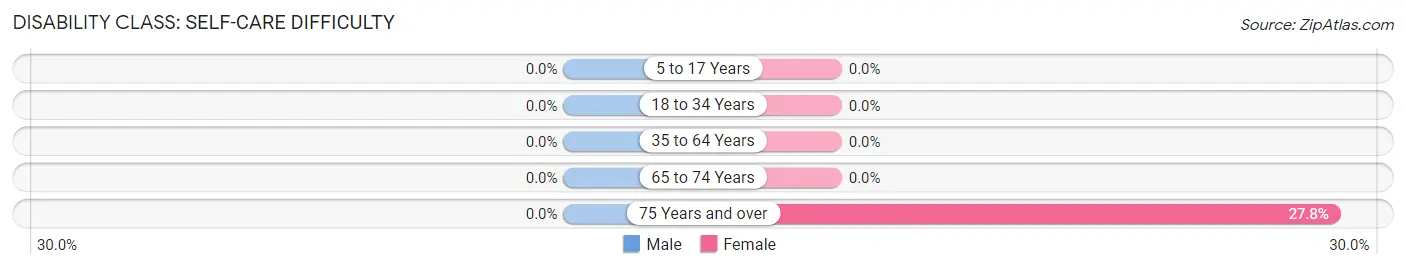
| Age Bracket | Male | Female |
| 5 to 17 Years | 0 (0.0%) | 0 (0.0%) |
| 18 to 34 Years | 0 (0.0%) | 0 (0.0%) |
| 35 to 64 Years | 0 (0.0%) | 0 (0.0%) |
| 65 to 74 Years | 0 (0.0%) | 0 (0.0%) |
| 75 Years and over | 0 (0.0%) | 5 (27.8%) |
Technology Access in Tsaile
Computing Device Access in Tsaile
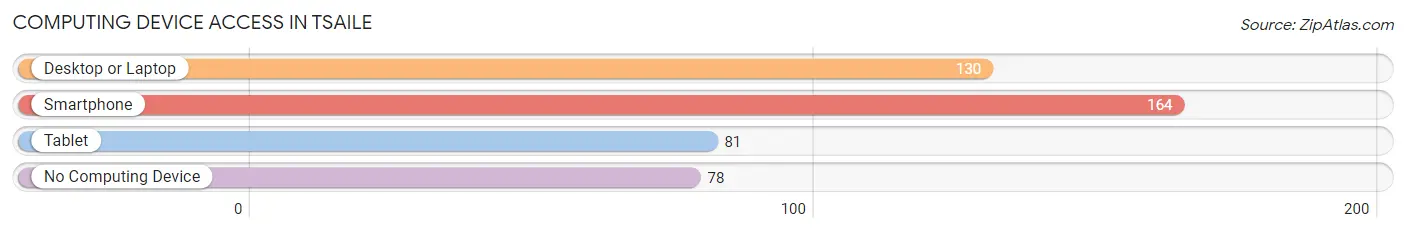
| Device Type | # Households | % Households |
| Desktop or Laptop | 130 | 50.2% |
| Smartphone | 164 | 63.3% |
| Tablet | 81 | 31.3% |
| No Computing Device | 78 | 30.1% |
| Total | 259 | 100.0% |
Internet Access in Tsaile
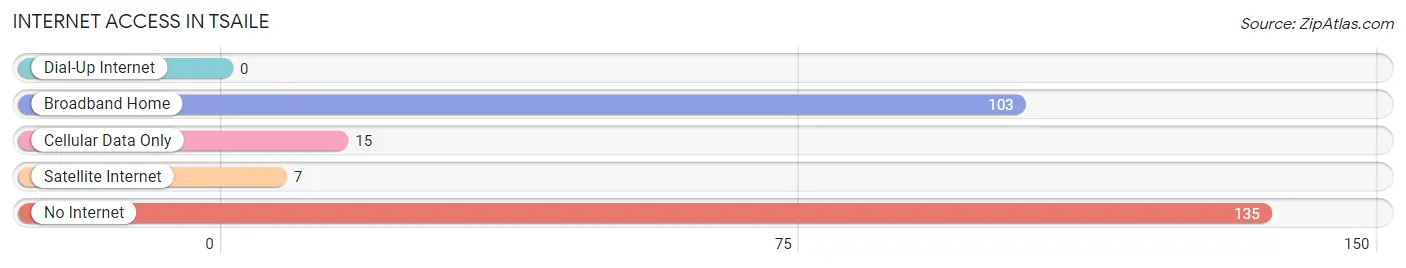
| Internet Type | # Households | % Households |
| Dial-Up Internet | 0 | 0.0% |
| Broadband Home | 103 | 39.8% |
| Cellular Data Only | 15 | 5.8% |
| Satellite Internet | 7 | 2.7% |
| No Internet | 135 | 52.1% |
| Total | 259 | 100.0% |
Tsaile Summary
Tsaile is a small town located in the Navajo Nation in the northeastern corner of Arizona. It is situated in the Chuska Mountains, approximately 30 miles south of the Four Corners Monument. The town is home to the Diné College, the first tribally-controlled college in the United States.
Geography
Tsaile is located in the Chuska Mountains, a range of mountains that stretch from Arizona into New Mexico. The town is situated at an elevation of 6,000 feet and is surrounded by rolling hills and mesas. The area is known for its spectacular views of the surrounding landscape, including the Chuska Mountains, the San Juan River Valley, and the Navajo Nation.
The climate in Tsaile is semi-arid, with hot summers and cold winters. The average annual temperature is around 50 degrees Fahrenheit, with temperatures ranging from the low 30s in the winter to the high 90s in the summer. The area receives an average of 12 inches of precipitation per year, mostly in the form of snow.
Economy
Tsaile’s economy is largely based on agriculture and tourism. The town is home to several farms and ranches, which produce a variety of crops, including corn, wheat, and hay. The area is also known for its Navajo-style jewelry and crafts, which are sold in local stores and at the nearby Navajo Nation Fair.
Tourism is an important part of the local economy, with visitors coming to the area to explore the nearby Chuska Mountains and the Navajo Nation. The town is also home to the Diné College, which attracts students from all over the world.
Demographics
As of the 2010 census, Tsaile had a population of 1,072. The town is predominantly Native American, with the majority of the population being Navajo. The median age of the population is 25.7 years, and the median household income is $25,000.
Education
Tsaile is home to the Diné College, the first tribally-controlled college in the United States. The college offers a variety of degree programs, including business, education, and health sciences. The college also offers a variety of cultural and recreational activities, including a museum, a library, and a theater.
Conclusion
Tsaile is a small town located in the Navajo Nation in the northeastern corner of Arizona. It is situated in the Chuska Mountains and is home to the Diné College, the first tribally-controlled college in the United States. The town’s economy is largely based on agriculture and tourism, and the population is predominantly Native American. The town is also home to the Diné College, which offers a variety of degree programs and cultural and recreational activities.
Common Questions
What is Per Capita Income in Tsaile?
Per Capita income in Tsaile is $11,445.
What is the Median Family Income in Tsaile?
Median Family Income in Tsaile is $22,955.
What is the Median Household income in Tsaile?
Median Household Income in Tsaile is $39,625.
What is Income or Wage Gap in Tsaile?
Income or Wage Gap in Tsaile is 55.9%.
Women in Tsaile earn 44.1 cents for every dollar earned by a man.
What is Family Income Deficit in Tsaile?
Family Income Deficit in Tsaile is $16,765.
Families that are below poverty line in Tsaile earn $16,765 less on average than the poverty threshold level.
What is Inequality or Gini Index in Tsaile?
Inequality or Gini Index in Tsaile is 0.48.
What is the Total Population of Tsaile?
Total Population of Tsaile is 1,482.
What is the Total Male Population of Tsaile?
Total Male Population of Tsaile is 678.
What is the Total Female Population of Tsaile?
Total Female Population of Tsaile is 804.
What is the Ratio of Males per 100 Females in Tsaile?
There are 84.33 Males per 100 Females in Tsaile.
What is the Ratio of Females per 100 Males in Tsaile?
There are 118.58 Females per 100 Males in Tsaile.
What is the Median Population Age in Tsaile?
Median Population Age in Tsaile is 20.9 Years.
What is the Average Family Size in Tsaile
Average Family Size in Tsaile is 5.1 People.
What is the Average Household Size in Tsaile
Average Household Size in Tsaile is 4.0 People.
How Large is the Labor Force in Tsaile?
There are 526 People in the Labor Forcein in Tsaile.
What is the Percentage of People in the Labor Force in Tsaile?
47.7% of People are in the Labor Force in Tsaile.
What is the Unemployment Rate in Tsaile?
Unemployment Rate in Tsaile is 4.8%.