Dudleyville, AZ Map & Demographics
Dudleyville Map
Dudleyville Overview
$21,567
PER CAPITA INCOME
$85,208
AVG FAMILY INCOME
$63,663
AVG HOUSEHOLD INCOME
0.26
INEQUALITY / GINI INDEX
478
TOTAL POPULATION
267
MALE POPULATION
211
FEMALE POPULATION
126.54
MALES / 100 FEMALES
79.03
FEMALES / 100 MALES
45.3
MEDIAN AGE
3.0
AVG FAMILY SIZE
2.6
AVG HOUSEHOLD SIZE
163
LABOR FORCE [ PEOPLE ]
42.8%
PERCENT IN LABOR FORCE
Dudleyville Area Codes
Income in Dudleyville
Income Overview in Dudleyville
Per Capita Income in Dudleyville is $21,567, while median incomes of families and households are $85,208 and $63,663 respectively.
| Characteristic | Number | Measure |
| Per Capita Income | 478 | $21,567 |
| Median Family Income | 137 | $85,208 |
| Mean Family Income | 137 | $73,222 |
| Median Household Income | 186 | $63,663 |
| Mean Household Income | 186 | $58,996 |
| Income Deficit | 137 | $0 |
| Wage / Income Gap (%) | 478 | 0.00% |
| Wage / Income Gap ($) | 478 | 100.00¢ per $1 |
| Gini / Inequality Index | 478 | 0.26 |
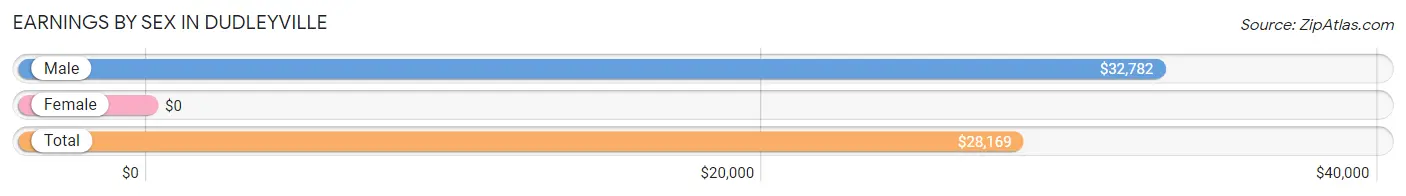
Earnings by Sex in Dudleyville
| Sex | Number | Average Earnings |
| Male | 93 (57.1%) | $32,782 |
| Female | 70 (42.9%) | $0 |
| Total | 163 (100.0%) | $28,169 |
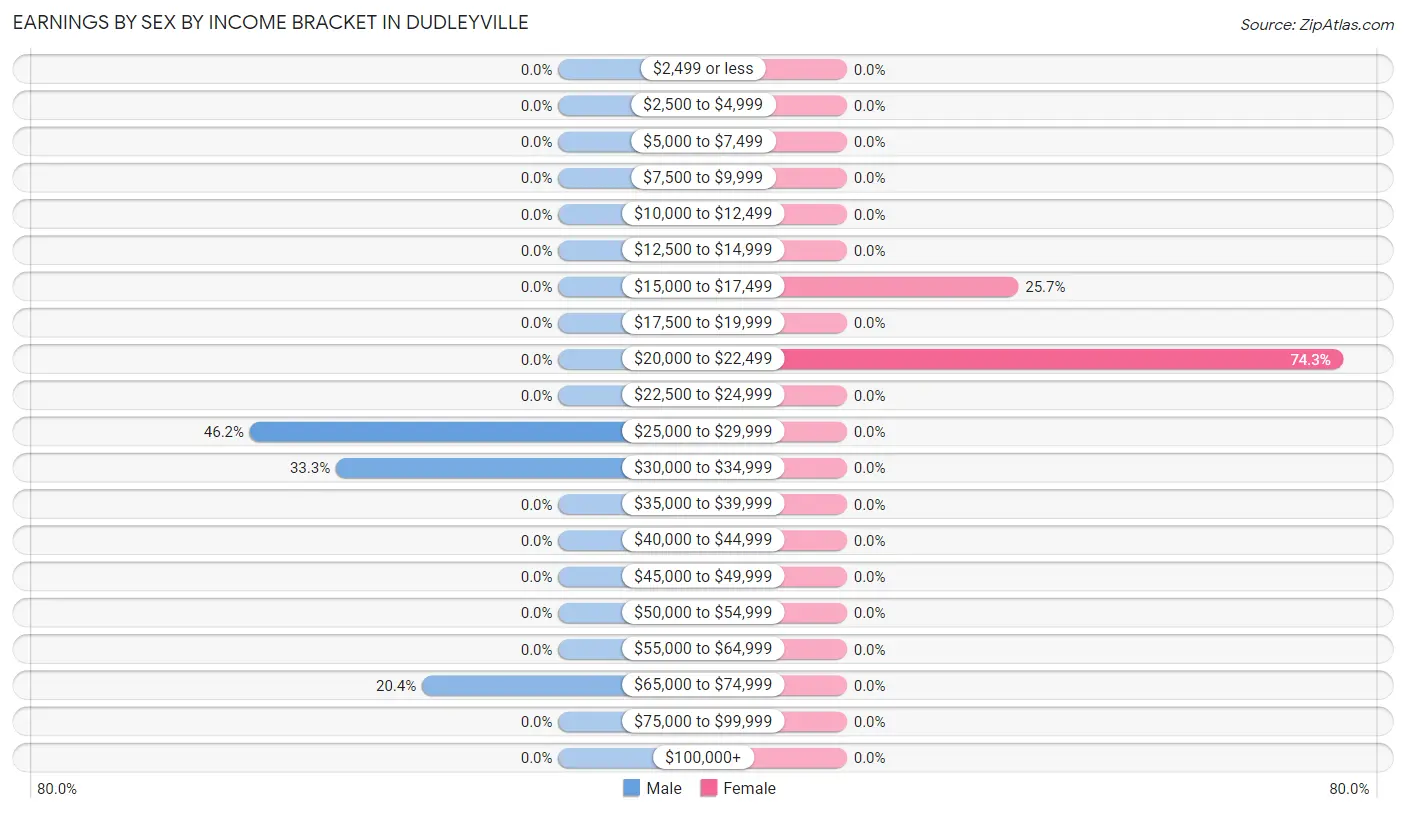
Earnings by Sex by Income Bracket in Dudleyville
The most common earnings brackets in Dudleyville are $25,000 to $29,999 for men (43 | 46.2%) and $20,000 to $22,499 for women (52 | 74.3%).
| Income | Male | Female |
| $2,499 or less | 0 (0.0%) | 0 (0.0%) |
| $2,500 to $4,999 | 0 (0.0%) | 0 (0.0%) |
| $5,000 to $7,499 | 0 (0.0%) | 0 (0.0%) |
| $7,500 to $9,999 | 0 (0.0%) | 0 (0.0%) |
| $10,000 to $12,499 | 0 (0.0%) | 0 (0.0%) |
| $12,500 to $14,999 | 0 (0.0%) | 0 (0.0%) |
| $15,000 to $17,499 | 0 (0.0%) | 18 (25.7%) |
| $17,500 to $19,999 | 0 (0.0%) | 0 (0.0%) |
| $20,000 to $22,499 | 0 (0.0%) | 52 (74.3%) |
| $22,500 to $24,999 | 0 (0.0%) | 0 (0.0%) |
| $25,000 to $29,999 | 43 (46.2%) | 0 (0.0%) |
| $30,000 to $34,999 | 31 (33.3%) | 0 (0.0%) |
| $35,000 to $39,999 | 0 (0.0%) | 0 (0.0%) |
| $40,000 to $44,999 | 0 (0.0%) | 0 (0.0%) |
| $45,000 to $49,999 | 0 (0.0%) | 0 (0.0%) |
| $50,000 to $54,999 | 0 (0.0%) | 0 (0.0%) |
| $55,000 to $64,999 | 0 (0.0%) | 0 (0.0%) |
| $65,000 to $74,999 | 19 (20.4%) | 0 (0.0%) |
| $75,000 to $99,999 | 0 (0.0%) | 0 (0.0%) |
| $100,000+ | 0 (0.0%) | 0 (0.0%) |
| Total | 93 (100.0%) | 70 (100.0%) |
Earnings by Sex by Educational Attainment in Dudleyville
| Educational Attainment | Male Income | Female Income |
| Less than High School | - | - |
| High School Diploma | - | - |
| College or Associate's Degree | - | - |
| Bachelor's Degree | - | - |
| Graduate Degree | - | - |
| Total | - | - |
Family Income in Dudleyville
Family Income Brackets in Dudleyville
According to the Dudleyville family income data, there are 70 families falling into the $75,000 to $99,999 income range, which is the most common income bracket and makes up 51.1% of all families.
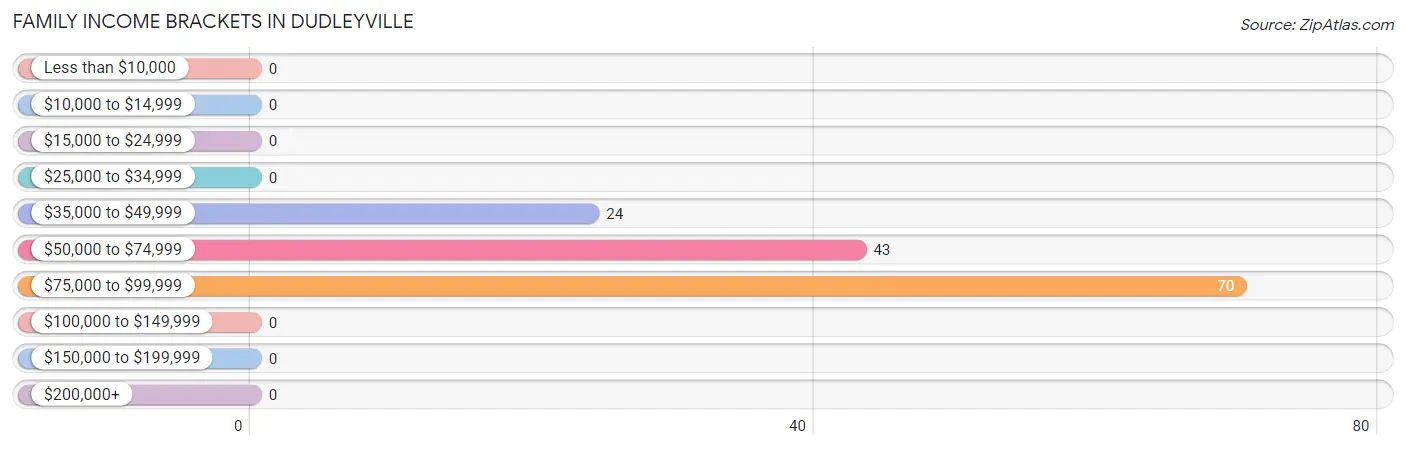
| Income Bracket | # Families | % Families |
| Less than $10,000 | 0 | 0.0% |
| $10,000 to $14,999 | 0 | 0.0% |
| $15,000 to $24,999 | 0 | 0.0% |
| $25,000 to $34,999 | 0 | 0.0% |
| $35,000 to $49,999 | 24 | 17.5% |
| $50,000 to $74,999 | 43 | 31.4% |
| $75,000 to $99,999 | 70 | 51.1% |
| $100,000 to $149,999 | 0 | 0.0% |
| $150,000 to $199,999 | 0 | 0.0% |
| $200,000+ | 0 | 0.0% |
Family Income by Famaliy Size in Dudleyville
| Income Bracket | # Families | Median Income |
| 2-Person Families | 76 (55.5%) | $0 |
| 3-Person Families | 0 (0.0%) | $0 |
| 4-Person Families | 0 (0.0%) | $0 |
| 5-Person Families | 43 (31.4%) | $0 |
| 6-Person Families | 0 (0.0%) | $0 |
| 7+ Person Families | 18 (13.1%) | $0 |
| Total | 137 (100.0%) | $85,208 |
Family Income by Number of Earners in Dudleyville
| Number of Earners | # Families | Median Income |
| No Earners | 24 (17.5%) | $0 |
| 1 Earner | 52 (38.0%) | $0 |
| 2 Earners | 61 (44.5%) | $0 |
| 3+ Earners | 0 (0.0%) | $0 |
| Total | 137 (100.0%) | $85,208 |
Household Income in Dudleyville
Household Income Brackets in Dudleyville
With 70 households falling in the category, the $75,000 to $99,999 income range is the most frequent in Dudleyville, accounting for 37.6% of all households.
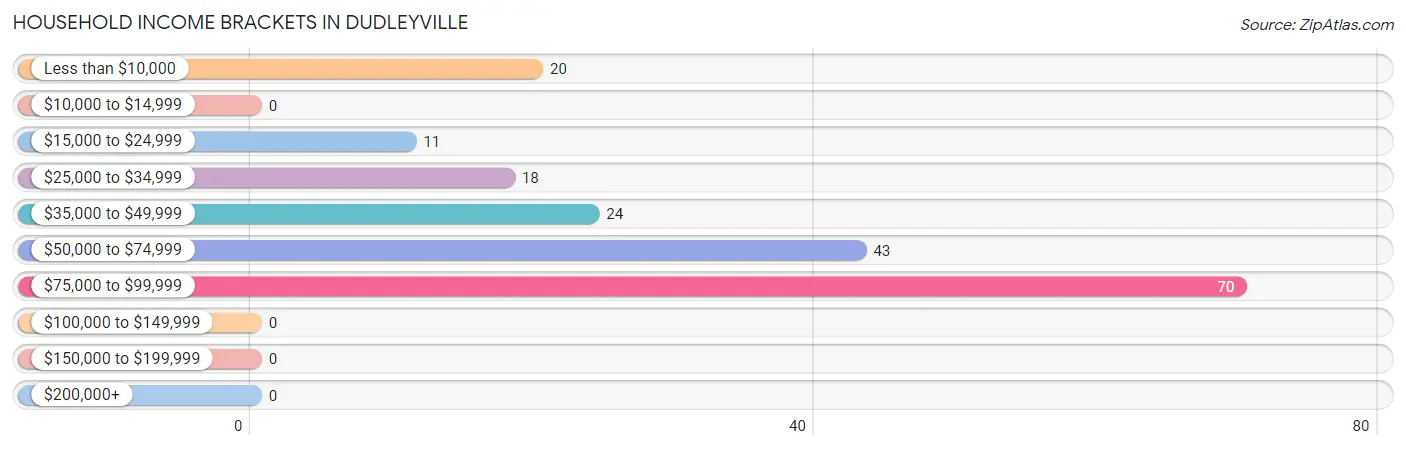
| Income Bracket | # Households | % Households |
| Less than $10,000 | 20 | 10.8% |
| $10,000 to $14,999 | 0 | 0.0% |
| $15,000 to $24,999 | 11 | 5.9% |
| $25,000 to $34,999 | 18 | 9.7% |
| $35,000 to $49,999 | 24 | 12.9% |
| $50,000 to $74,999 | 43 | 23.1% |
| $75,000 to $99,999 | 70 | 37.6% |
| $100,000 to $149,999 | 0 | 0.0% |
| $150,000 to $199,999 | 0 | 0.0% |
| $200,000+ | 0 | 0.0% |
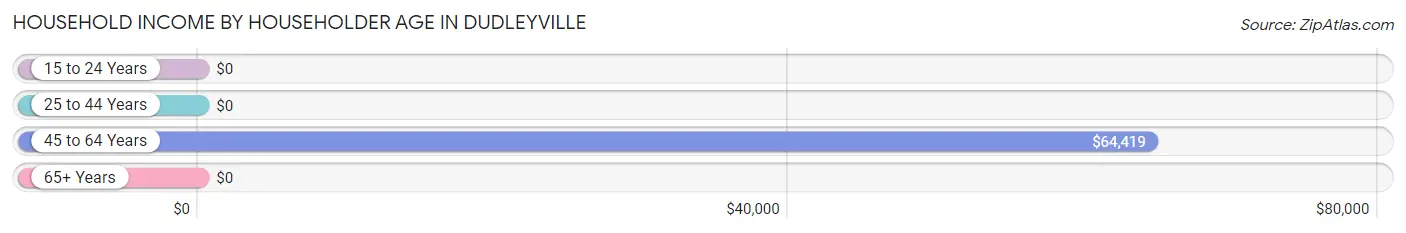
Household Income by Householder Age in Dudleyville
The median household income in Dudleyville is $63,663, with the highest median household income of $64,419 found in the 45 to 64 years age bracket for the primary householder. A total of 124 households (66.7%) fall into this category.
| Income Bracket | # Households | Median Income |
| 15 to 24 Years | 0 (0.0%) | $0 |
| 25 to 44 Years | 18 (9.7%) | $0 |
| 45 to 64 Years | 124 (66.7%) | $64,419 |
| 65+ Years | 44 (23.7%) | $0 |
| Total | 186 (100.0%) | $63,663 |
Poverty in Dudleyville
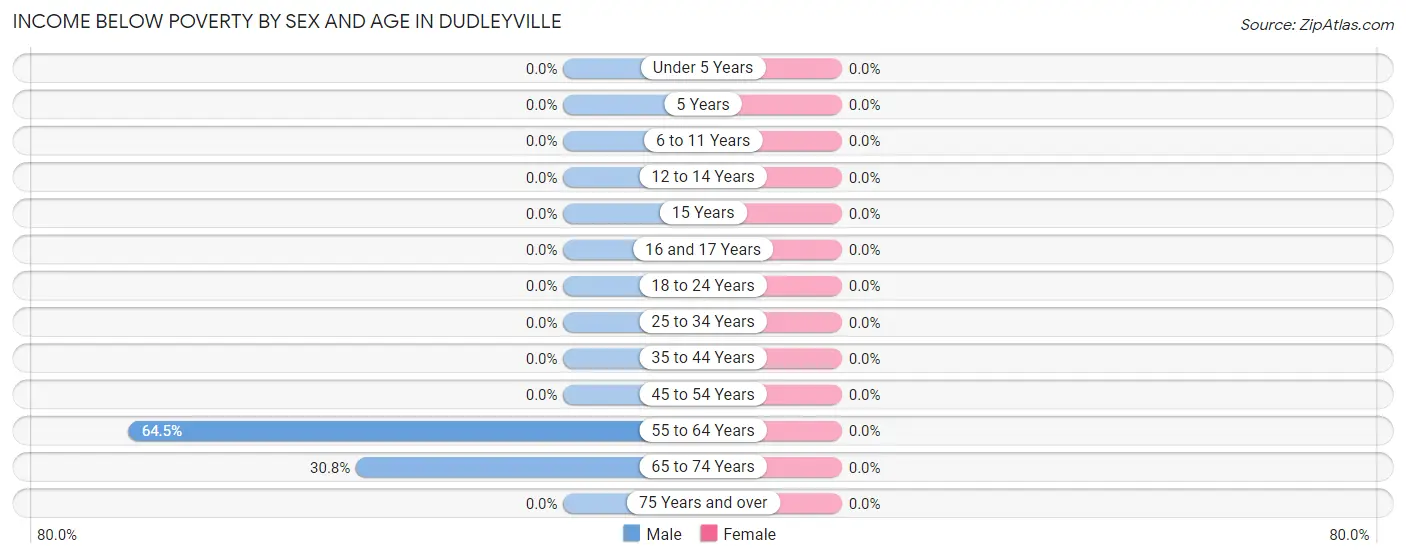
Income Below Poverty by Sex and Age in Dudleyville
| Age Bracket | Male | Female |
| Under 5 Years | 0 (0.0%) | 0 (0.0%) |
| 5 Years | 0 (0.0%) | 0 (0.0%) |
| 6 to 11 Years | 0 (0.0%) | 0 (0.0%) |
| 12 to 14 Years | 0 (0.0%) | 0 (0.0%) |
| 15 Years | 0 (0.0%) | 0 (0.0%) |
| 16 and 17 Years | 0 (0.0%) | 0 (0.0%) |
| 18 to 24 Years | 0 (0.0%) | 0 (0.0%) |
| 25 to 34 Years | 0 (0.0%) | 0 (0.0%) |
| 35 to 44 Years | 0 (0.0%) | 0 (0.0%) |
| 45 to 54 Years | 0 (0.0%) | 0 (0.0%) |
| 55 to 64 Years | 20 (64.5%) | 0 (0.0%) |
| 65 to 74 Years | 20 (30.8%) | 0 (0.0%) |
| 75 Years and over | 0 (0.0%) | 0 (0.0%) |
| Total | 40 (15.0%) | 0 (0.0%) |
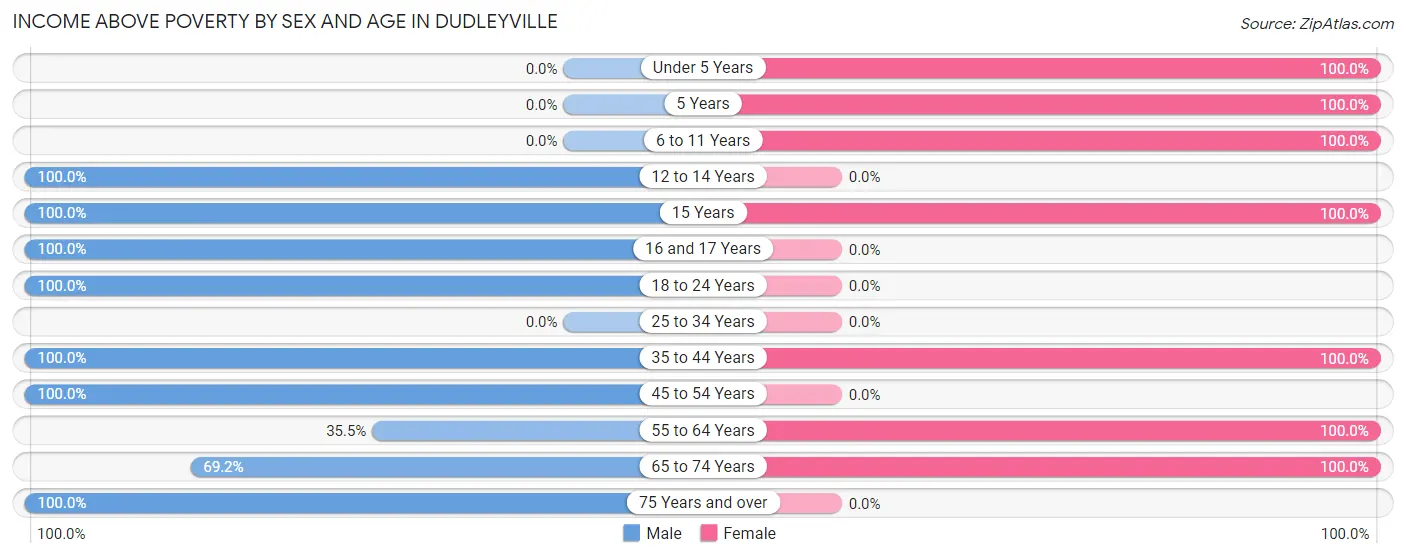
Income Above Poverty by Sex and Age in Dudleyville
According to the poverty statistics in Dudleyville, males aged 12 to 14 years and females aged under 5 years are the age groups that are most secure financially, with 100.0% of males and 100.0% of females in these age groups living above the poverty line.
| Age Bracket | Male | Female |
| Under 5 Years | 0 (0.0%) | 15 (100.0%) |
| 5 Years | 0 (0.0%) | 15 (100.0%) |
| 6 to 11 Years | 0 (0.0%) | 16 (100.0%) |
| 12 to 14 Years | 16 (100.0%) | 0 (0.0%) |
| 15 Years | 21 (100.0%) | 14 (100.0%) |
| 16 and 17 Years | 17 (100.0%) | 0 (0.0%) |
| 18 to 24 Years | 31 (100.0%) | 0 (0.0%) |
| 25 to 34 Years | 0 (0.0%) | 0 (0.0%) |
| 35 to 44 Years | 19 (100.0%) | 61 (100.0%) |
| 45 to 54 Years | 43 (100.0%) | 0 (0.0%) |
| 55 to 64 Years | 11 (35.5%) | 70 (100.0%) |
| 65 to 74 Years | 45 (69.2%) | 20 (100.0%) |
| 75 Years and over | 24 (100.0%) | 0 (0.0%) |
| Total | 227 (85.0%) | 211 (100.0%) |
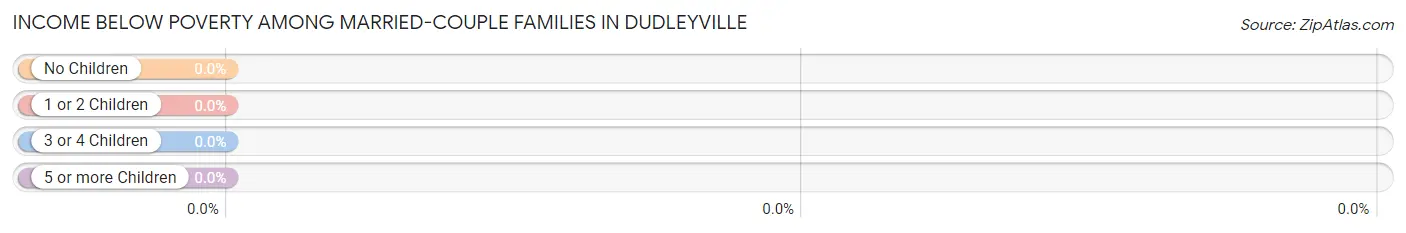
Income Below Poverty Among Married-Couple Families in Dudleyville
| Children | Above Poverty | Below Poverty |
| No Children | 76 (100.0%) | 0 (0.0%) |
| 1 or 2 Children | 43 (100.0%) | 0 (0.0%) |
| 3 or 4 Children | 0 (0.0%) | 0 (0.0%) |
| 5 or more Children | 18 (100.0%) | 0 (0.0%) |
| Total | 137 (100.0%) | 0 (0.0%) |
Income Below Poverty Among Single-Parent Households in Dudleyville
| Children | Single Father | Single Mother |
| No Children | 0 (0.0%) | 0 (0.0%) |
| 1 or 2 Children | 0 (0.0%) | 0 (0.0%) |
| 3 or 4 Children | 0 (0.0%) | 0 (0.0%) |
| 5 or more Children | 0 (0.0%) | 0 (0.0%) |
| Total | 0 (0.0%) | 0 (0.0%) |
Income Below Poverty Among Married-Couple vs Single-Parent Households in Dudleyville
| Children | Married-Couple Families | Single-Parent Households |
| No Children | 0 (0.0%) | 0 (0.0%) |
| 1 or 2 Children | 0 (0.0%) | 0 (0.0%) |
| 3 or 4 Children | 0 (0.0%) | 0 (0.0%) |
| 5 or more Children | 0 (0.0%) | 0 (0.0%) |
| Total | 0 (0.0%) | 0 (0.0%) |
Race in Dudleyville
The most populous races in Dudleyville are Hispanic or Latino (376 | 78.7%), White / Caucasian (312 | 65.3%), and Some other Race (166 | 34.7%).
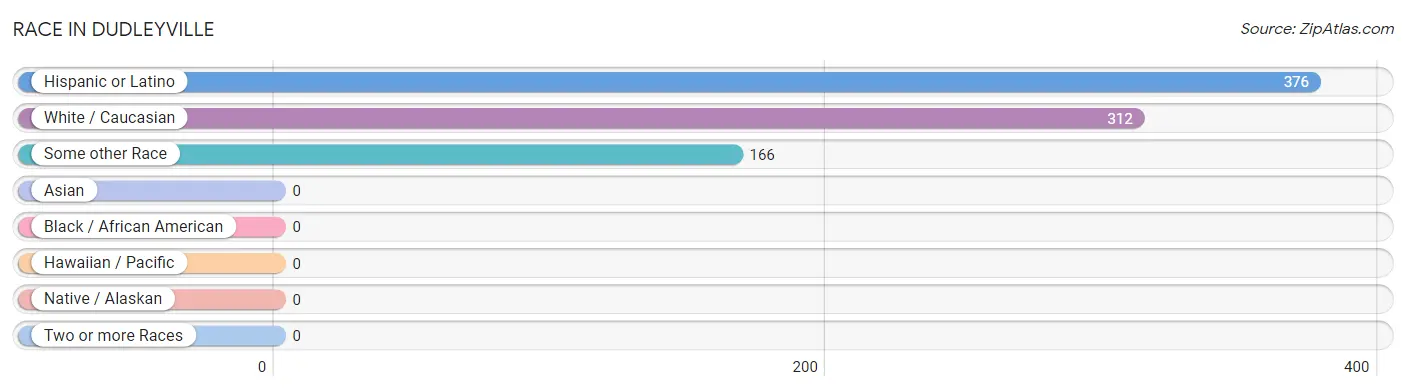
| Race | # Population | % Population |
| Asian | 0 | 0.0% |
| Black / African American | 0 | 0.0% |
| Hawaiian / Pacific | 0 | 0.0% |
| Hispanic or Latino | 376 | 78.7% |
| Native / Alaskan | 0 | 0.0% |
| White / Caucasian | 312 | 65.3% |
| Two or more Races | 0 | 0.0% |
| Some other Race | 166 | 34.7% |
| Total | 478 | 100.0% |
Ancestry in Dudleyville
The most populous ancestries reported in Dudleyville are Mexican (376 | 78.7%), German (24 | 5.0%), Danish (20 | 4.2%), English (20 | 4.2%), and Polish (20 | 4.2%), together accounting for 96.2% of all Dudleyville residents.
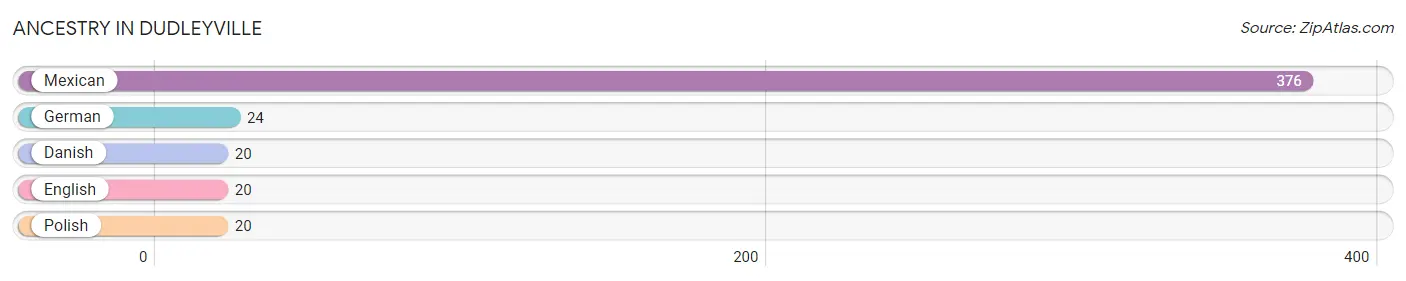
| Ancestry | # Population | % Population |
| Danish | 20 | 4.2% |
| English | 20 | 4.2% |
| German | 24 | 5.0% |
| Mexican | 376 | 78.7% |
| Polish | 20 | 4.2% | View All 5 Rows |
Immigrants in Dudleyville
The most numerous immigrant groups reported in Dudleyville came from Central America (18 | 3.8%), Latin America (18 | 3.8%), and Mexico (18 | 3.8%), together accounting for 11.3% of all Dudleyville residents.
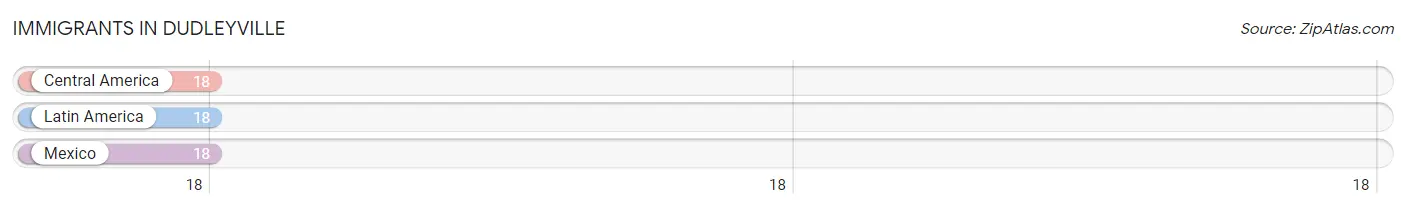
| Immigration Origin | # Population | % Population |
| Central America | 18 | 3.8% |
| Latin America | 18 | 3.8% |
| Mexico | 18 | 3.8% | View All 3 Rows |
Sex and Age in Dudleyville
Sex and Age in Dudleyville
The most populous age groups in Dudleyville are 65 to 69 Years (65 | 24.3%) for men and 60 to 64 Years (52 | 24.6%) for women.
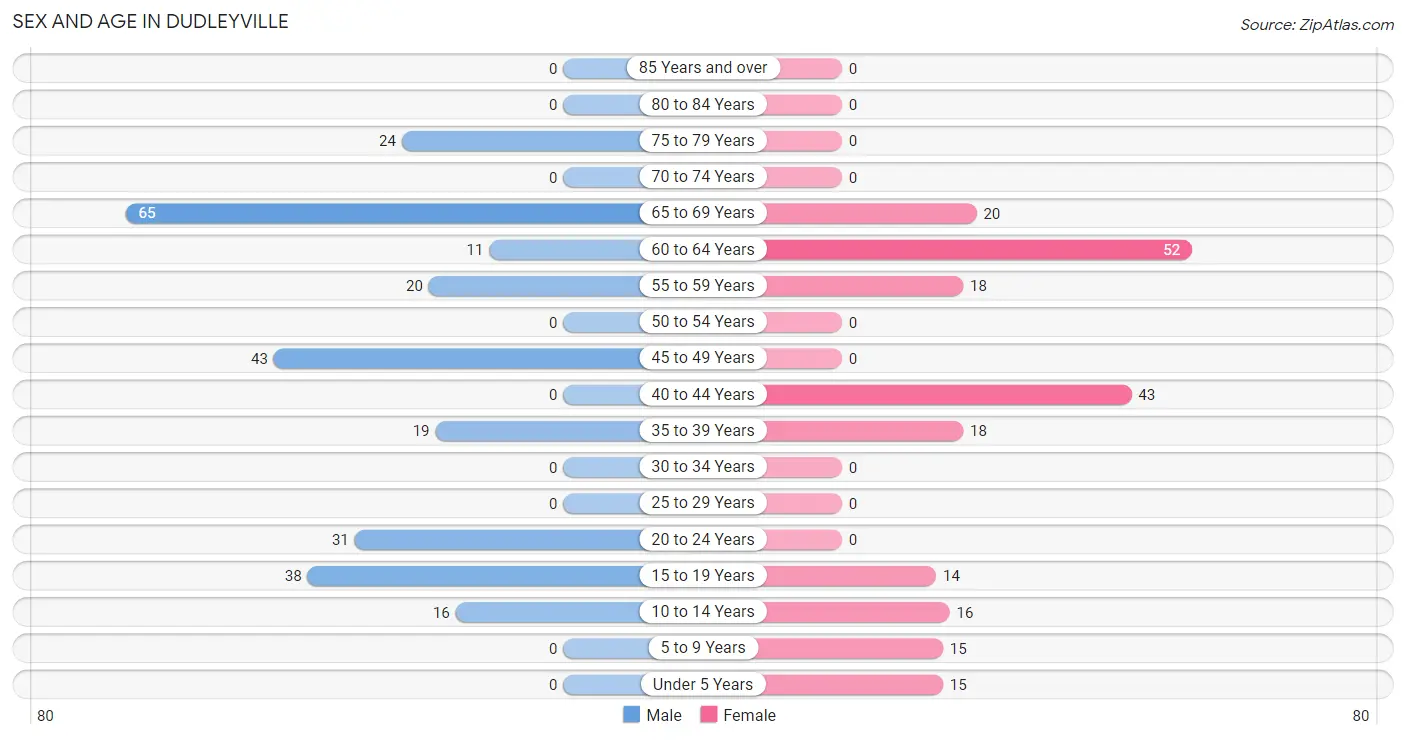
| Age Bracket | Male | Female |
| Under 5 Years | 0 (0.0%) | 15 (7.1%) |
| 5 to 9 Years | 0 (0.0%) | 15 (7.1%) |
| 10 to 14 Years | 16 (6.0%) | 16 (7.6%) |
| 15 to 19 Years | 38 (14.2%) | 14 (6.6%) |
| 20 to 24 Years | 31 (11.6%) | 0 (0.0%) |
| 25 to 29 Years | 0 (0.0%) | 0 (0.0%) |
| 30 to 34 Years | 0 (0.0%) | 0 (0.0%) |
| 35 to 39 Years | 19 (7.1%) | 18 (8.5%) |
| 40 to 44 Years | 0 (0.0%) | 43 (20.4%) |
| 45 to 49 Years | 43 (16.1%) | 0 (0.0%) |
| 50 to 54 Years | 0 (0.0%) | 0 (0.0%) |
| 55 to 59 Years | 20 (7.5%) | 18 (8.5%) |
| 60 to 64 Years | 11 (4.1%) | 52 (24.6%) |
| 65 to 69 Years | 65 (24.3%) | 20 (9.5%) |
| 70 to 74 Years | 0 (0.0%) | 0 (0.0%) |
| 75 to 79 Years | 24 (9.0%) | 0 (0.0%) |
| 80 to 84 Years | 0 (0.0%) | 0 (0.0%) |
| 85 Years and over | 0 (0.0%) | 0 (0.0%) |
| Total | 267 (100.0%) | 211 (100.0%) |
Families and Households in Dudleyville
Median Family Size in Dudleyville
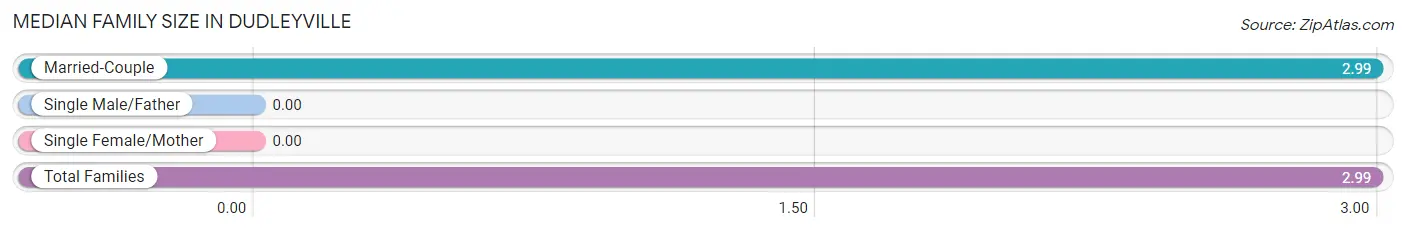
| Family Type | # Families | Family Size |
| Married-Couple | 137 (100.0%) | 2.99 |
| Single Male/Father | 0 (0.0%) | - |
| Single Female/Mother | 0 (0.0%) | - |
| Total Families | 137 (100.0%) | 2.99 |
Median Household Size in Dudleyville
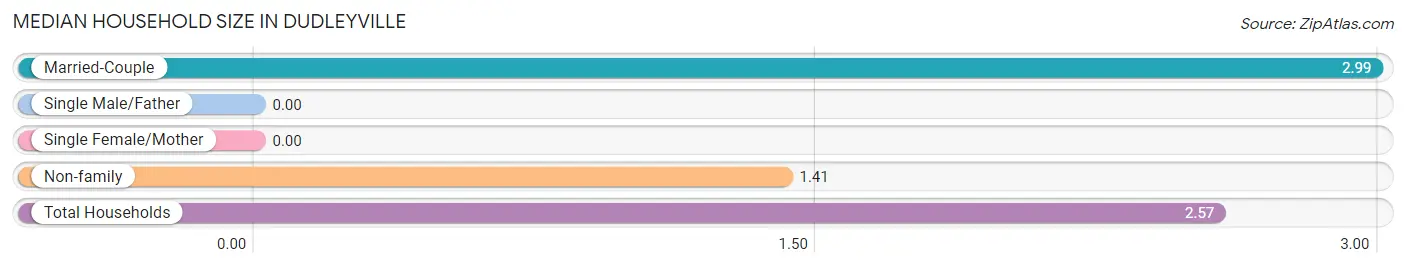
| Household Type | # Households | Household Size |
| Married-Couple | 137 (73.7%) | 2.99 |
| Single Male/Father | 0 (0.0%) | - |
| Single Female/Mother | 0 (0.0%) | - |
| Non-family | 49 (26.3%) | 1.41 |
| Total Households | 186 (100.0%) | 2.57 |
Household Size by Marriage Status in Dudleyville
Out of a total of 186 households in Dudleyville, 137 (73.7%) are family households, while 49 (26.3%) are nonfamily households. The most numerous type of family households are 2-person households, comprising 76, and the most common type of nonfamily households are 1-person households, comprising 31.
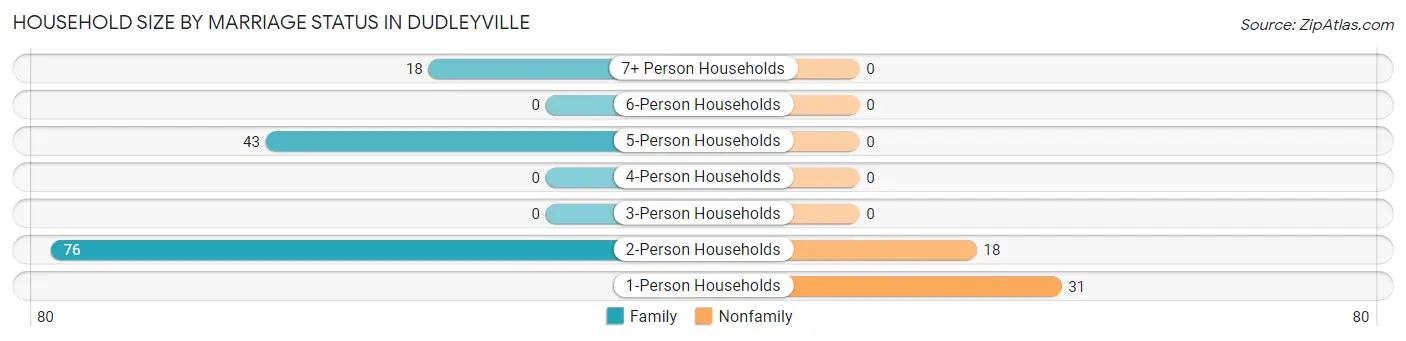
| Household Size | Family Households | Nonfamily Households |
| 1-Person Households | - | 31 (16.7%) |
| 2-Person Households | 76 (40.9%) | 18 (9.7%) |
| 3-Person Households | 0 (0.0%) | 0 (0.0%) |
| 4-Person Households | 0 (0.0%) | 0 (0.0%) |
| 5-Person Households | 43 (23.1%) | 0 (0.0%) |
| 6-Person Households | 0 (0.0%) | 0 (0.0%) |
| 7+ Person Households | 18 (9.7%) | 0 (0.0%) |
| Total | 137 (73.7%) | 49 (26.3%) |
Female Fertility in Dudleyville
Fertility by Age in Dudleyville
| Age Bracket | Women with Births | Births / 1,000 Women |
| 15 to 19 years | 0 (0.0%) | 0.0 |
| 20 to 34 years | 0 (0.0%) | 0.0 |
| 35 to 50 years | 0 (0.0%) | 0.0 |
| Total | 0 (0.0%) | 0.0 |
Fertility by Age by Marriage Status in Dudleyville
| Age Bracket | Married | Unmarried |
| 15 to 19 years | 0 (0.0%) | 0 (0.0%) |
| 20 to 34 years | 0 (0.0%) | 0 (0.0%) |
| 35 to 50 years | 0 (0.0%) | 0 (0.0%) |
| Total | 0 (0.0%) | 0 (0.0%) |
Fertility by Education in Dudleyville
| Educational Attainment | Women with Births | Births / 1,000 Women |
| Less than High School | 0 (0.0%) | 0.0 |
| High School Diploma | 0 (0.0%) | 0.0 |
| College or Associate's Degree | 0 (0.0%) | 0.0 |
| Bachelor's Degree | 0 (0.0%) | 0.0 |
| Graduate Degree | 0 (0.0%) | 0.0 |
| Total | 0 (0.0%) | 0.0 |
Fertility by Education by Marriage Status in Dudleyville
| Educational Attainment | Married | Unmarried |
| Less than High School | 0 (0.0%) | 0 (0.0%) |
| High School Diploma | 0 (0.0%) | 0 (0.0%) |
| College or Associate's Degree | 0 (0.0%) | 0 (0.0%) |
| Bachelor's Degree | 0 (0.0%) | 0 (0.0%) |
| Graduate Degree | 0 (0.0%) | 0 (0.0%) |
| Total | 0 (0.0%) | 0 (0.0%) |
Employment Characteristics in Dudleyville
Employment by Class of Employer in Dudleyville
Among the 163 employed individuals in Dudleyville, private company employees (126 | 77.3%), state government employees (19 | 11.7%), and local government employees (18 | 11.0%) make up the most common classes of employment.
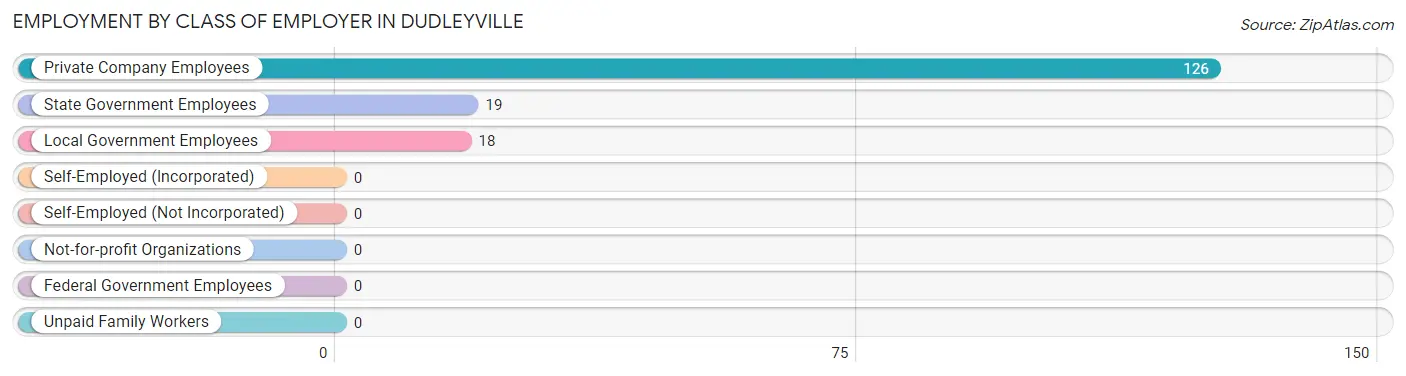
| Employer Class | # Employees | % Employees |
| Private Company Employees | 126 | 77.3% |
| Self-Employed (Incorporated) | 0 | 0.0% |
| Self-Employed (Not Incorporated) | 0 | 0.0% |
| Not-for-profit Organizations | 0 | 0.0% |
| Local Government Employees | 18 | 11.0% |
| State Government Employees | 19 | 11.7% |
| Federal Government Employees | 0 | 0.0% |
| Unpaid Family Workers | 0 | 0.0% |
| Total | 163 | 100.0% |
Employment Status by Age in Dudleyville
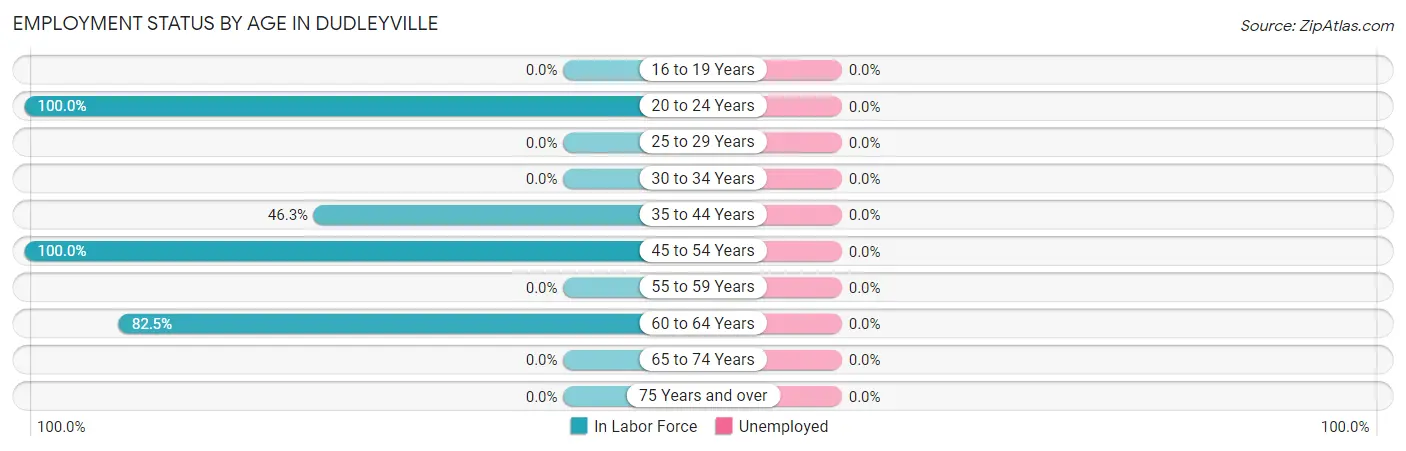
| Age Bracket | In Labor Force | Unemployed |
| 16 to 19 Years | 0 (0.0%) | 0 (0.0%) |
| 20 to 24 Years | 31 (100.0%) | 0 (0.0%) |
| 25 to 29 Years | 0 (0.0%) | 0 (0.0%) |
| 30 to 34 Years | 0 (0.0%) | 0 (0.0%) |
| 35 to 44 Years | 37 (46.3%) | 0 (0.0%) |
| 45 to 54 Years | 43 (100.0%) | 0 (0.0%) |
| 55 to 59 Years | 0 (0.0%) | 0 (0.0%) |
| 60 to 64 Years | 52 (82.5%) | 0 (0.0%) |
| 65 to 74 Years | 0 (0.0%) | 0 (0.0%) |
| 75 Years and over | 0 (0.0%) | 0 (0.0%) |
| Total | 163 (42.8%) | 0 (0.0%) |
Employment Status by Educational Attainment in Dudleyville
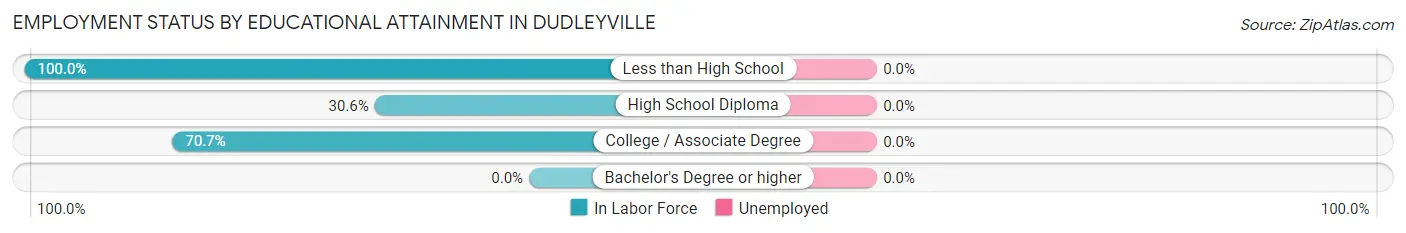
| Educational Attainment | In Labor Force | Unemployed |
| Less than High School | 43 (100.0%) | 0 (0.0%) |
| High School Diploma | 19 (30.6%) | 0 (0.0%) |
| College / Associate Degree | 70 (70.7%) | 0 (0.0%) |
| Bachelor's Degree or higher | 0 (0.0%) | 0 (0.0%) |
| Total | 132 (58.9%) | 0 (0.0%) |
Employment Occupations by Sex in Dudleyville
Management, Business, Science and Arts Occupations
The most common Management, Business, Science and Arts occupations in Dudleyville are Health Diagnosing & Treating (52 | 31.9%), and Health Technologists (52 | 31.9%).
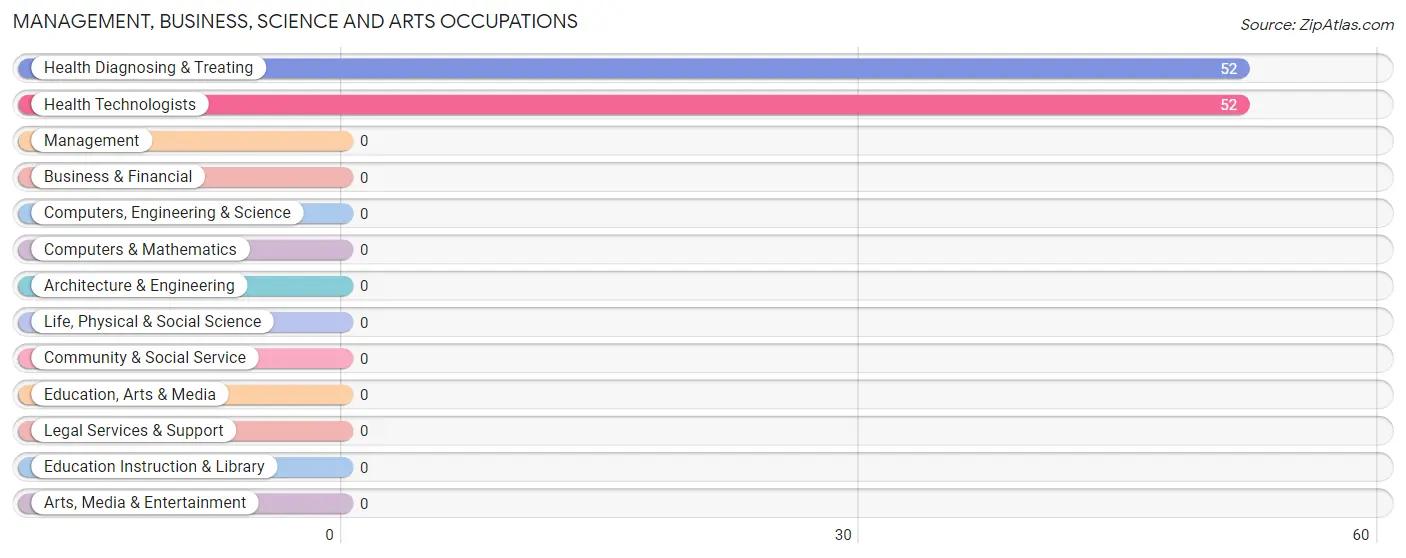
Management, Business, Science and Arts Occupations by Sex
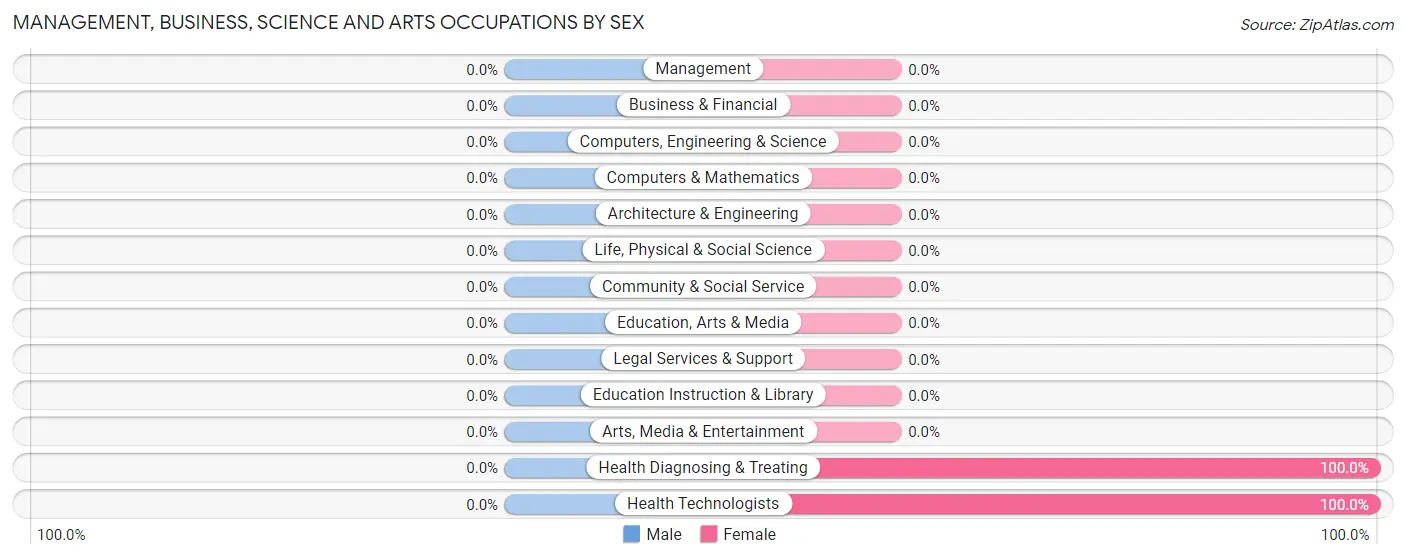
| Occupation | Male | Female |
| Management | 0 (0.0%) | 0 (0.0%) |
| Business & Financial | 0 (0.0%) | 0 (0.0%) |
| Computers, Engineering & Science | 0 (0.0%) | 0 (0.0%) |
| Computers & Mathematics | 0 (0.0%) | 0 (0.0%) |
| Architecture & Engineering | 0 (0.0%) | 0 (0.0%) |
| Life, Physical & Social Science | 0 (0.0%) | 0 (0.0%) |
| Community & Social Service | 0 (0.0%) | 0 (0.0%) |
| Education, Arts & Media | 0 (0.0%) | 0 (0.0%) |
| Legal Services & Support | 0 (0.0%) | 0 (0.0%) |
| Education Instruction & Library | 0 (0.0%) | 0 (0.0%) |
| Arts, Media & Entertainment | 0 (0.0%) | 0 (0.0%) |
| Health Diagnosing & Treating | 0 (0.0%) | 52 (100.0%) |
| Health Technologists | 0 (0.0%) | 52 (100.0%) |
| Total (Category) | 0 (0.0%) | 52 (100.0%) |
| Total (Overall) | 93 (57.1%) | 70 (42.9%) |
Services Occupations
The most common Services occupations in Dudleyville are Cleaning & Maintenance (43 | 26.4%), Security & Protection (19 | 11.7%), and Law Enforcement (19 | 11.7%).
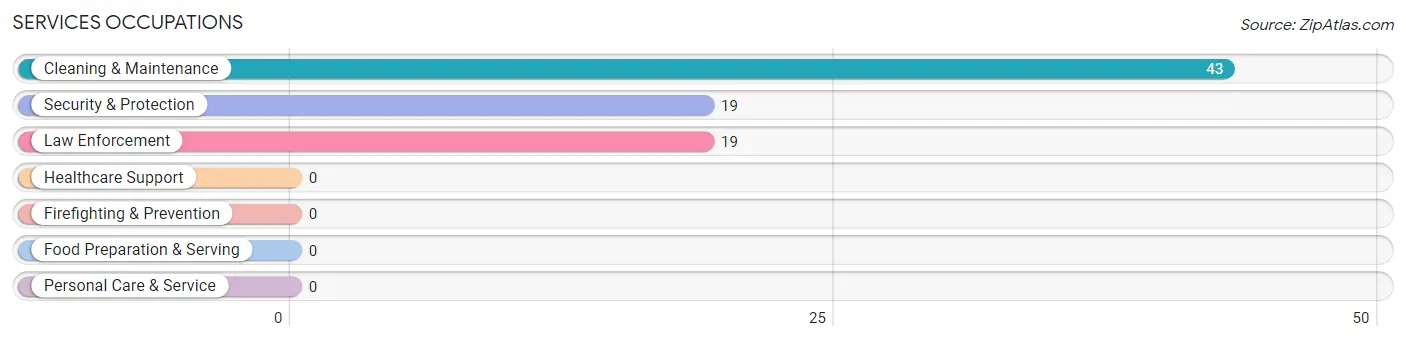
Services Occupations by Sex
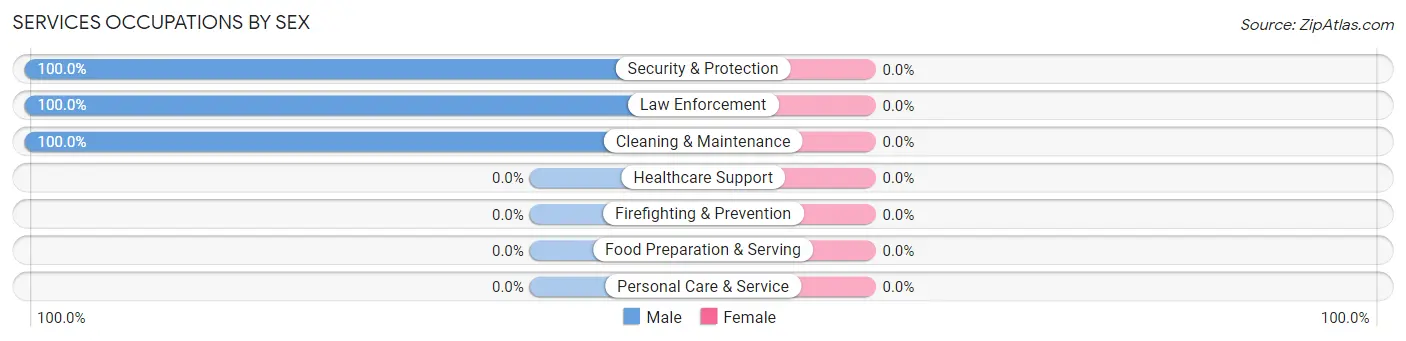
| Occupation | Male | Female |
| Healthcare Support | 0 (0.0%) | 0 (0.0%) |
| Security & Protection | 19 (100.0%) | 0 (0.0%) |
| Firefighting & Prevention | 0 (0.0%) | 0 (0.0%) |
| Law Enforcement | 19 (100.0%) | 0 (0.0%) |
| Food Preparation & Serving | 0 (0.0%) | 0 (0.0%) |
| Cleaning & Maintenance | 43 (100.0%) | 0 (0.0%) |
| Personal Care & Service | 0 (0.0%) | 0 (0.0%) |
| Total (Category) | 62 (100.0%) | 0 (0.0%) |
| Total (Overall) | 93 (57.1%) | 70 (42.9%) |
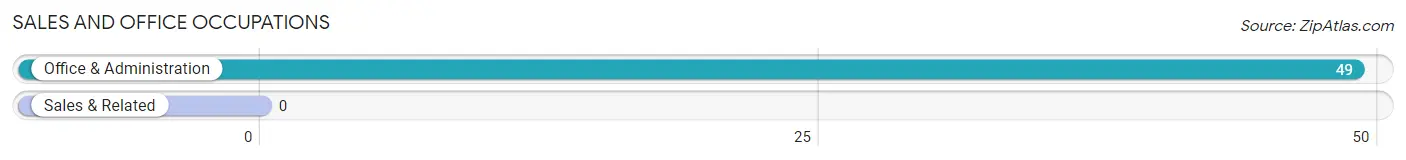
Sales and Office Occupations
The most common Sales and Office occupations in Dudleyville are , and Office & Administration (49 | 30.1%).
Sales and Office Occupations by Sex
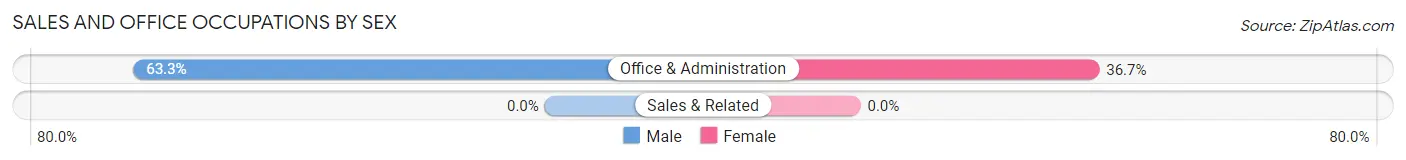
| Occupation | Male | Female |
| Sales & Related | 0 (0.0%) | 0 (0.0%) |
| Office & Administration | 31 (63.3%) | 18 (36.7%) |
| Total (Category) | 31 (63.3%) | 18 (36.7%) |
| Total (Overall) | 93 (57.1%) | 70 (42.9%) |
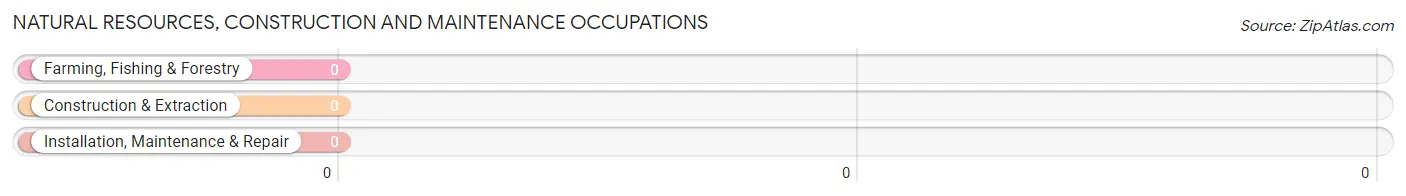
Natural Resources, Construction and Maintenance Occupations
Natural Resources, Construction and Maintenance Occupations by Sex
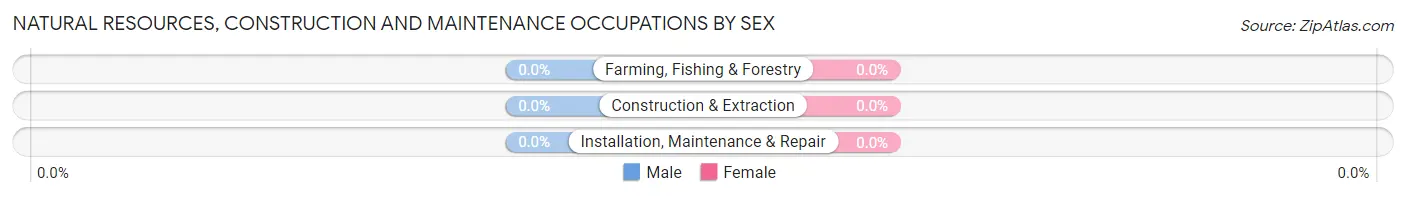
| Occupation | Male | Female |
| Farming, Fishing & Forestry | 0 (0.0%) | 0 (0.0%) |
| Construction & Extraction | 0 (0.0%) | 0 (0.0%) |
| Installation, Maintenance & Repair | 0 (0.0%) | 0 (0.0%) |
| Total (Category) | 0 (0.0%) | 0 (0.0%) |
| Total (Overall) | 93 (57.1%) | 70 (42.9%) |
Production, Transportation and Moving Occupations
Production, Transportation and Moving Occupations by Sex
| Occupation | Male | Female |
| Production | 0 (0.0%) | 0 (0.0%) |
| Transportation | 0 (0.0%) | 0 (0.0%) |
| Material Moving | 0 (0.0%) | 0 (0.0%) |
| Total (Category) | 0 (0.0%) | 0 (0.0%) |
| Total (Overall) | 93 (57.1%) | 70 (42.9%) |
Employment Industries by Sex in Dudleyville
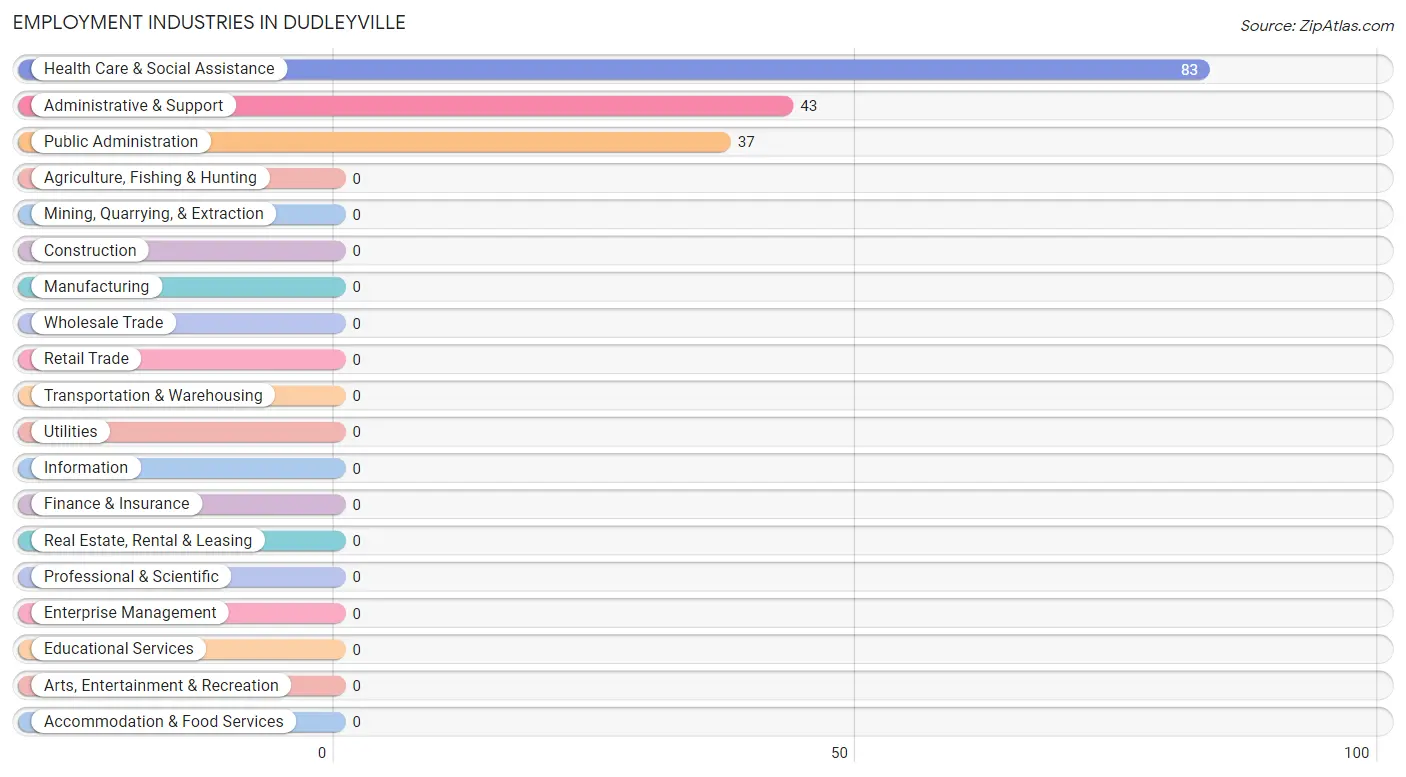
Employment Industries in Dudleyville
The major employment industries in Dudleyville include Health Care & Social Assistance (83 | 50.9%), Administrative & Support (43 | 26.4%), and Public Administration (37 | 22.7%).
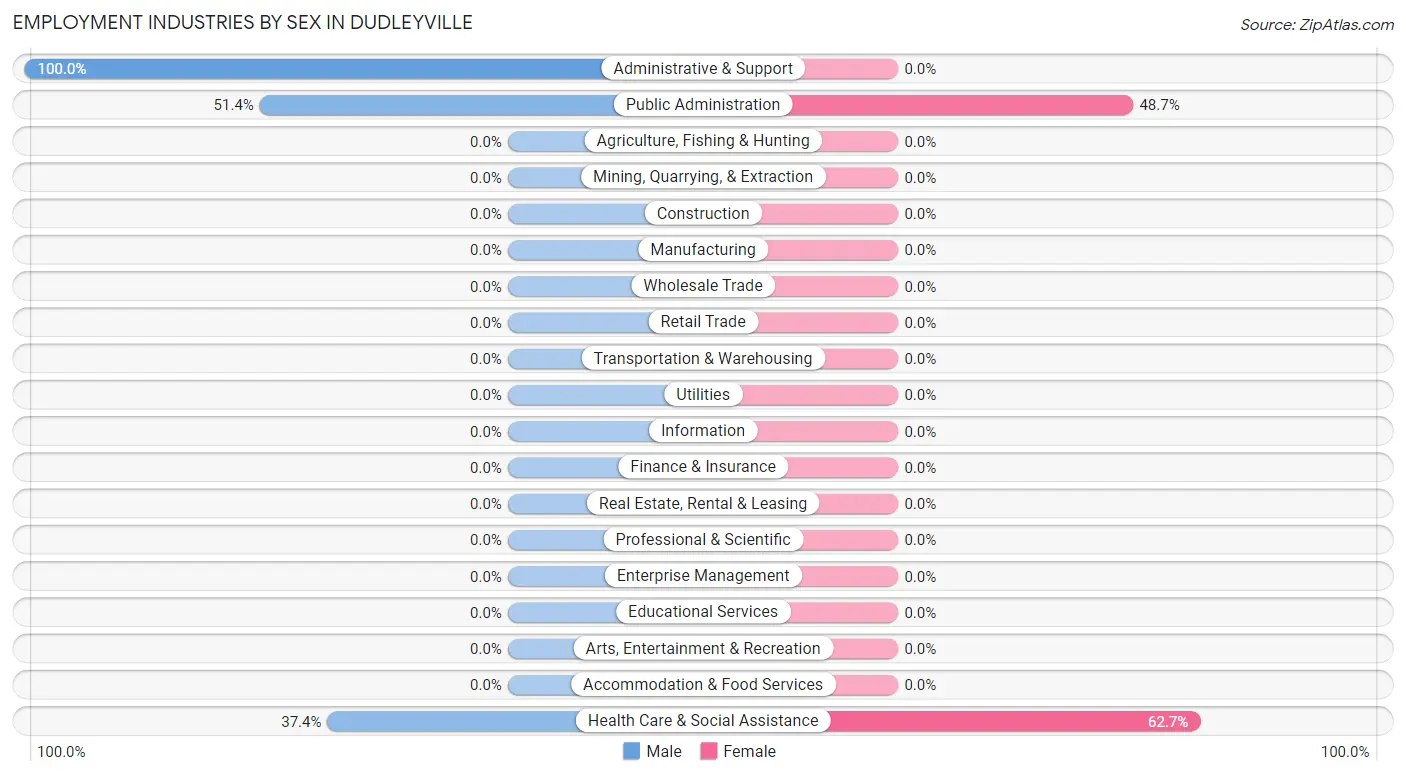
Employment Industries by Sex in Dudleyville
The Dudleyville industries that see more men than women are Administrative & Support (100.0%), Public Administration (51.3%), and Health Care & Social Assistance (37.3%), whereas the industries that tend to have a higher number of women are Health Care & Social Assistance (62.6%), and Public Administration (48.6%).
| Industry | Male | Female |
| Agriculture, Fishing & Hunting | 0 (0.0%) | 0 (0.0%) |
| Mining, Quarrying, & Extraction | 0 (0.0%) | 0 (0.0%) |
| Construction | 0 (0.0%) | 0 (0.0%) |
| Manufacturing | 0 (0.0%) | 0 (0.0%) |
| Wholesale Trade | 0 (0.0%) | 0 (0.0%) |
| Retail Trade | 0 (0.0%) | 0 (0.0%) |
| Transportation & Warehousing | 0 (0.0%) | 0 (0.0%) |
| Utilities | 0 (0.0%) | 0 (0.0%) |
| Information | 0 (0.0%) | 0 (0.0%) |
| Finance & Insurance | 0 (0.0%) | 0 (0.0%) |
| Real Estate, Rental & Leasing | 0 (0.0%) | 0 (0.0%) |
| Professional & Scientific | 0 (0.0%) | 0 (0.0%) |
| Enterprise Management | 0 (0.0%) | 0 (0.0%) |
| Administrative & Support | 43 (100.0%) | 0 (0.0%) |
| Educational Services | 0 (0.0%) | 0 (0.0%) |
| Health Care & Social Assistance | 31 (37.3%) | 52 (62.6%) |
| Arts, Entertainment & Recreation | 0 (0.0%) | 0 (0.0%) |
| Accommodation & Food Services | 0 (0.0%) | 0 (0.0%) |
| Public Administration | 19 (51.3%) | 18 (48.6%) |
| Total | 93 (57.1%) | 70 (42.9%) |
Education in Dudleyville
School Enrollment in Dudleyville
The most common levels of schooling among the 114 students in Dudleyville are high school (52 | 45.6%), middle school (32 | 28.1%), and nursery / preschool (15 | 13.2%).
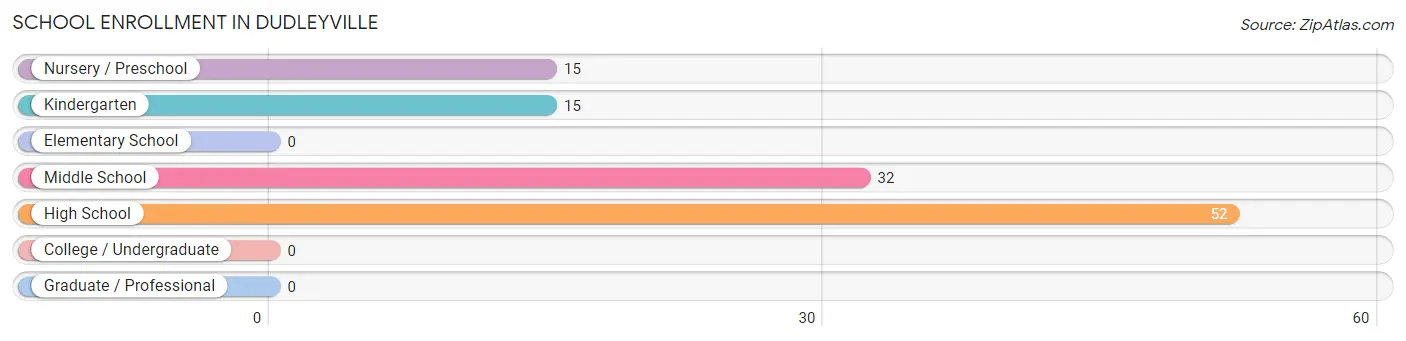
| School Level | # Students | % Students |
| Nursery / Preschool | 15 | 13.2% |
| Kindergarten | 15 | 13.2% |
| Elementary School | 0 | 0.0% |
| Middle School | 32 | 28.1% |
| High School | 52 | 45.6% |
| College / Undergraduate | 0 | 0.0% |
| Graduate / Professional | 0 | 0.0% |
| Total | 114 | 100.0% |
School Enrollment by Age by Funding Source in Dudleyville
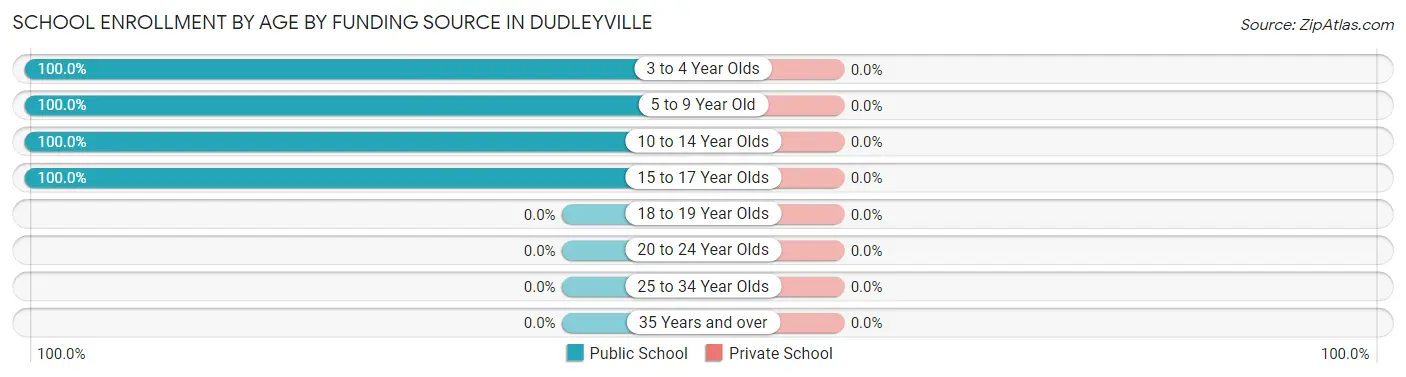
| Age Bracket | Public School | Private School |
| 3 to 4 Year Olds | 15 (100.0%) | 0 (0.0%) |
| 5 to 9 Year Old | 15 (100.0%) | 0 (0.0%) |
| 10 to 14 Year Olds | 32 (100.0%) | 0 (0.0%) |
| 15 to 17 Year Olds | 52 (100.0%) | 0 (0.0%) |
| 18 to 19 Year Olds | 0 (0.0%) | 0 (0.0%) |
| 20 to 24 Year Olds | 0 (0.0%) | 0 (0.0%) |
| 25 to 34 Year Olds | 0 (0.0%) | 0 (0.0%) |
| 35 Years and over | 0 (0.0%) | 0 (0.0%) |
| Total | 114 (100.0%) | 0 (0.0%) |
Educational Attainment by Field of Study in Dudleyville
, and arts & humanities (20 | 100.0%) are the most common fields of study among 20 individuals in Dudleyville who have obtained a bachelor's degree or higher.
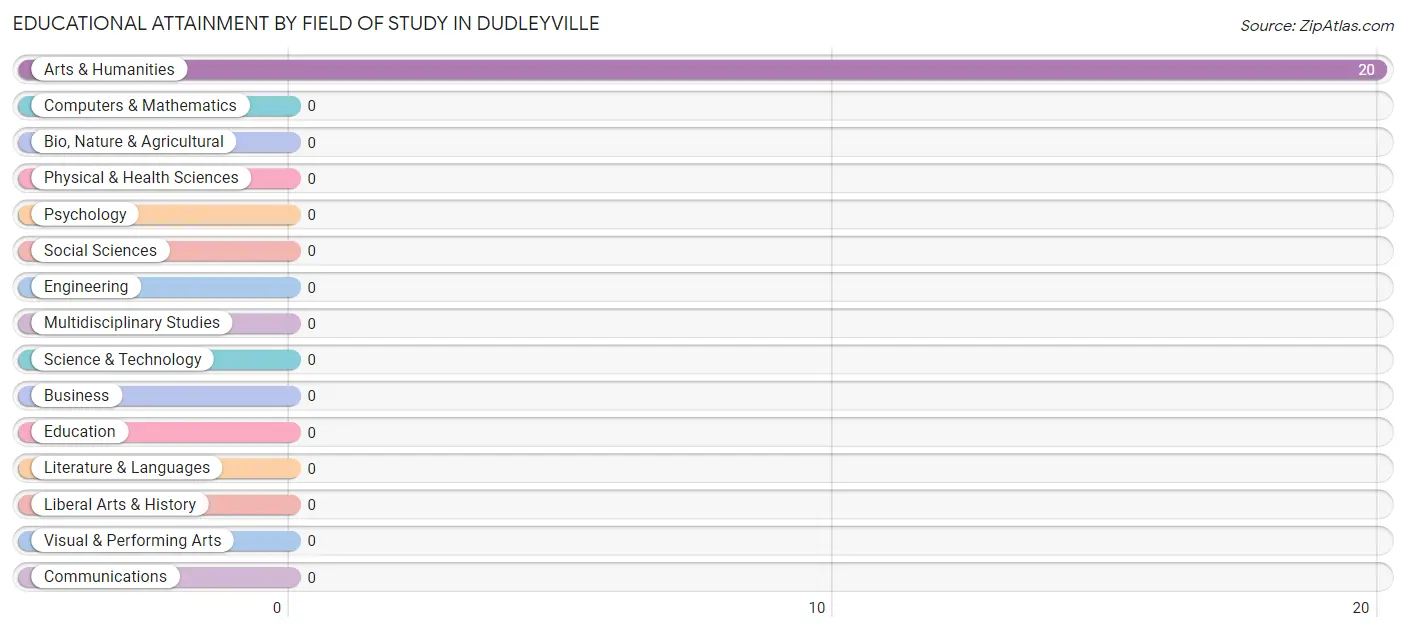
| Field of Study | # Graduates | % Graduates |
| Computers & Mathematics | 0 | 0.0% |
| Bio, Nature & Agricultural | 0 | 0.0% |
| Physical & Health Sciences | 0 | 0.0% |
| Psychology | 0 | 0.0% |
| Social Sciences | 0 | 0.0% |
| Engineering | 0 | 0.0% |
| Multidisciplinary Studies | 0 | 0.0% |
| Science & Technology | 0 | 0.0% |
| Business | 0 | 0.0% |
| Education | 0 | 0.0% |
| Literature & Languages | 0 | 0.0% |
| Liberal Arts & History | 0 | 0.0% |
| Visual & Performing Arts | 0 | 0.0% |
| Communications | 0 | 0.0% |
| Arts & Humanities | 20 | 100.0% |
| Total | 20 | 100.0% |
Transportation & Commute in Dudleyville
Vehicle Availability by Sex in Dudleyville
The most prevalent vehicle ownership categories in Dudleyville are males with 2 vehicles (74, accounting for 79.6%) and females with 2 vehicles (0, making up 105.7%).
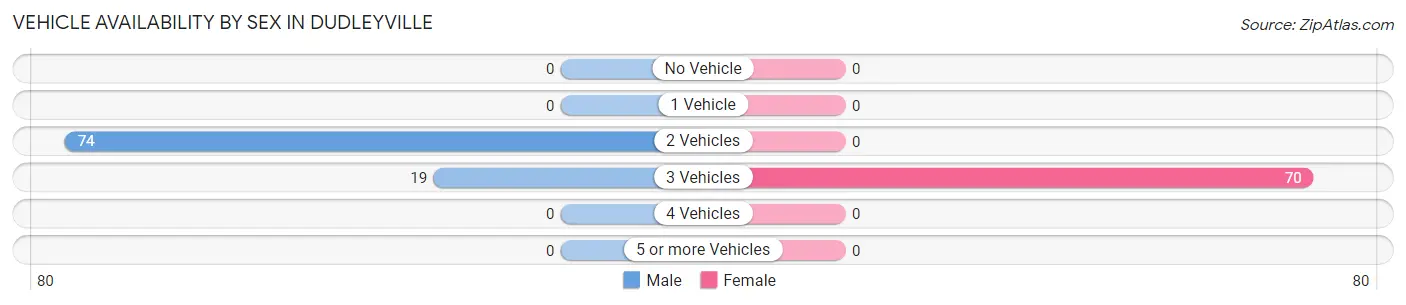
| Vehicles Available | Male | Female |
| No Vehicle | 0 (0.0%) | 0 (0.0%) |
| 1 Vehicle | 0 (0.0%) | 0 (0.0%) |
| 2 Vehicles | 74 (79.6%) | 0 (0.0%) |
| 3 Vehicles | 19 (20.4%) | 70 (100.0%) |
| 4 Vehicles | 0 (0.0%) | 0 (0.0%) |
| 5 or more Vehicles | 0 (0.0%) | 0 (0.0%) |
| Total | 93 (100.0%) | 70 (100.0%) |
Commute Time in Dudleyville
The most frequently occuring commute durations in Dudleyville are 15 to 19 minutes (70 commuters, 42.9%), 60 to 89 minutes (62 commuters, 38.0%), and 40 to 44 minutes (31 commuters, 19.0%).
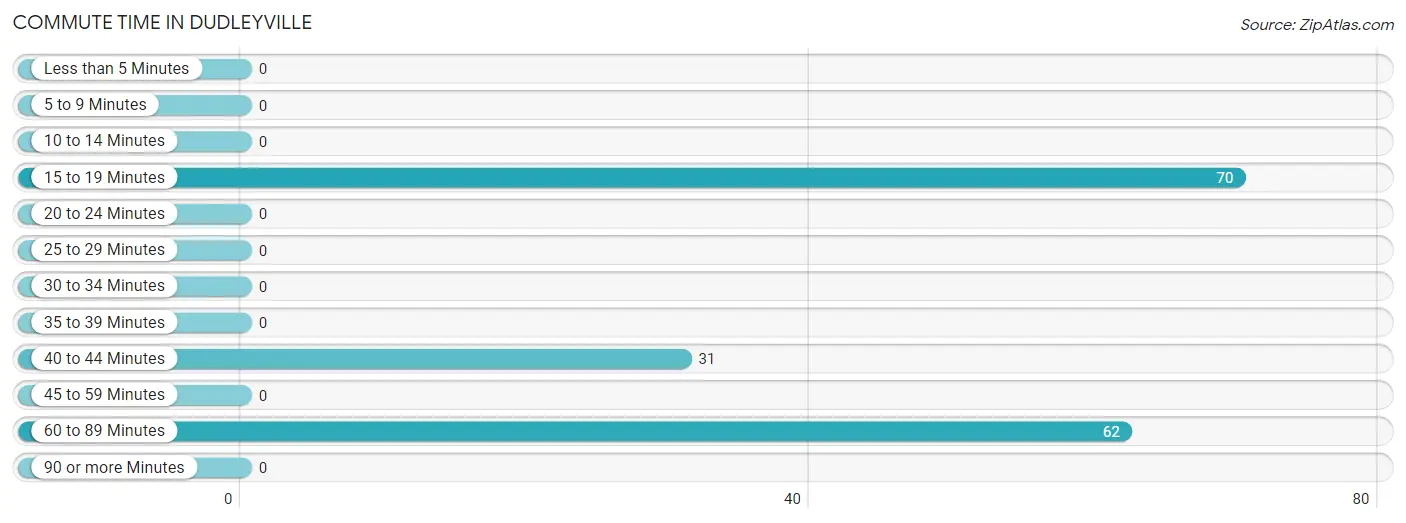
| Commute Time | # Commuters | % Commuters |
| Less than 5 Minutes | 0 | 0.0% |
| 5 to 9 Minutes | 0 | 0.0% |
| 10 to 14 Minutes | 0 | 0.0% |
| 15 to 19 Minutes | 70 | 42.9% |
| 20 to 24 Minutes | 0 | 0.0% |
| 25 to 29 Minutes | 0 | 0.0% |
| 30 to 34 Minutes | 0 | 0.0% |
| 35 to 39 Minutes | 0 | 0.0% |
| 40 to 44 Minutes | 31 | 19.0% |
| 45 to 59 Minutes | 0 | 0.0% |
| 60 to 89 Minutes | 62 | 38.0% |
| 90 or more Minutes | 0 | 0.0% |
Commute Time by Sex in Dudleyville
The most common commute times in Dudleyville are 60 to 89 minutes (62 commuters, 66.7%) for males and 15 to 19 minutes (70 commuters, 100.0%) for females.
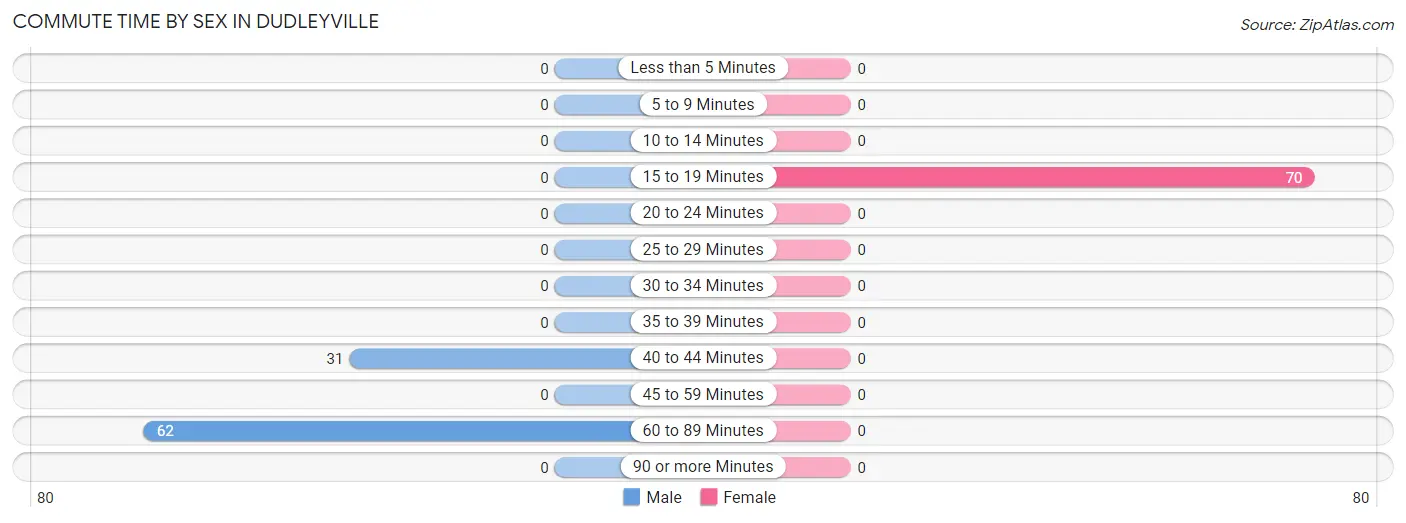
| Commute Time | Male | Female |
| Less than 5 Minutes | 0 (0.0%) | 0 (0.0%) |
| 5 to 9 Minutes | 0 (0.0%) | 0 (0.0%) |
| 10 to 14 Minutes | 0 (0.0%) | 0 (0.0%) |
| 15 to 19 Minutes | 0 (0.0%) | 70 (100.0%) |
| 20 to 24 Minutes | 0 (0.0%) | 0 (0.0%) |
| 25 to 29 Minutes | 0 (0.0%) | 0 (0.0%) |
| 30 to 34 Minutes | 0 (0.0%) | 0 (0.0%) |
| 35 to 39 Minutes | 0 (0.0%) | 0 (0.0%) |
| 40 to 44 Minutes | 31 (33.3%) | 0 (0.0%) |
| 45 to 59 Minutes | 0 (0.0%) | 0 (0.0%) |
| 60 to 89 Minutes | 62 (66.7%) | 0 (0.0%) |
| 90 or more Minutes | 0 (0.0%) | 0 (0.0%) |
Time of Departure to Work by Sex in Dudleyville
The most frequent times of departure to work in Dudleyville are 12:00 AM to 4:59 AM (50, 53.8%) for males and 9:00 AM to 9:59 AM (52, 74.3%) for females.
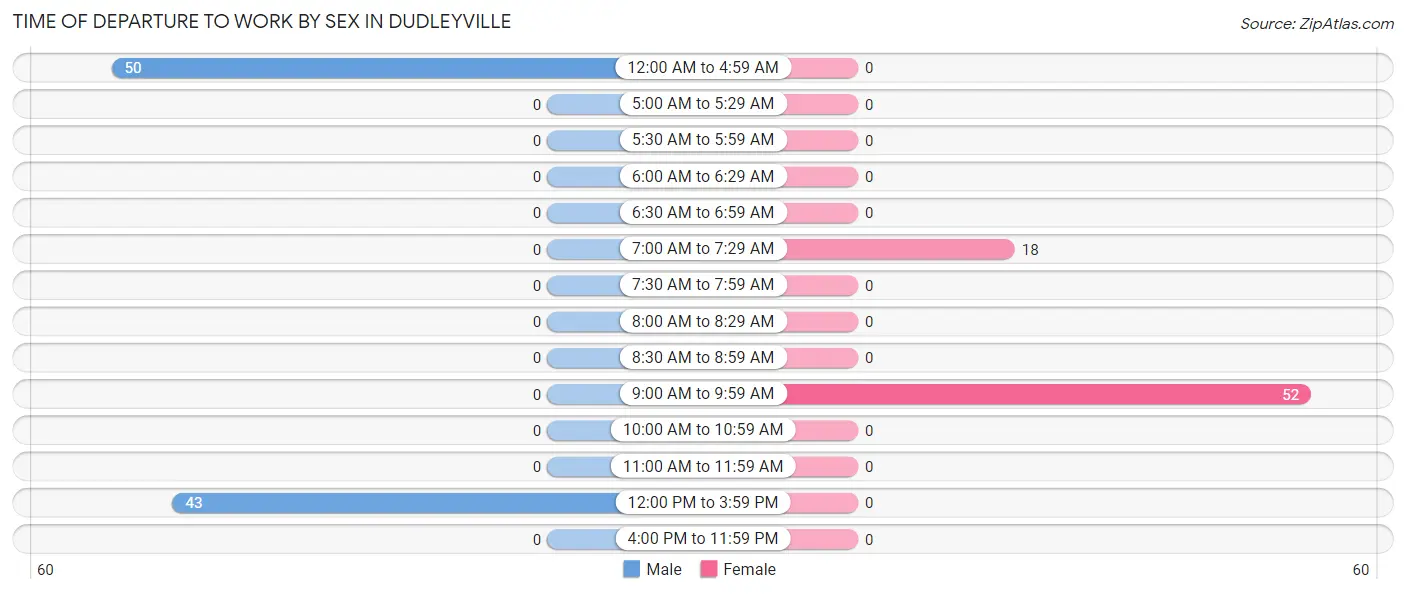
| Time of Departure | Male | Female |
| 12:00 AM to 4:59 AM | 50 (53.8%) | 0 (0.0%) |
| 5:00 AM to 5:29 AM | 0 (0.0%) | 0 (0.0%) |
| 5:30 AM to 5:59 AM | 0 (0.0%) | 0 (0.0%) |
| 6:00 AM to 6:29 AM | 0 (0.0%) | 0 (0.0%) |
| 6:30 AM to 6:59 AM | 0 (0.0%) | 0 (0.0%) |
| 7:00 AM to 7:29 AM | 0 (0.0%) | 18 (25.7%) |
| 7:30 AM to 7:59 AM | 0 (0.0%) | 0 (0.0%) |
| 8:00 AM to 8:29 AM | 0 (0.0%) | 0 (0.0%) |
| 8:30 AM to 8:59 AM | 0 (0.0%) | 0 (0.0%) |
| 9:00 AM to 9:59 AM | 0 (0.0%) | 52 (74.3%) |
| 10:00 AM to 10:59 AM | 0 (0.0%) | 0 (0.0%) |
| 11:00 AM to 11:59 AM | 0 (0.0%) | 0 (0.0%) |
| 12:00 PM to 3:59 PM | 43 (46.2%) | 0 (0.0%) |
| 4:00 PM to 11:59 PM | 0 (0.0%) | 0 (0.0%) |
| Total | 93 (100.0%) | 70 (100.0%) |
Housing Occupancy in Dudleyville
Occupancy by Ownership in Dudleyville
Of the total 186 dwellings in Dudleyville, owner-occupied units account for 175 (94.1%), while renter-occupied units make up 11 (5.9%).
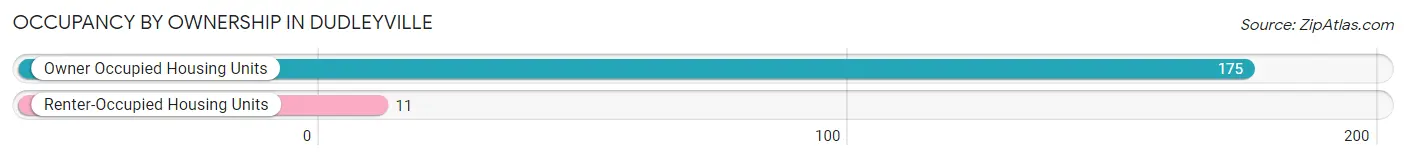
| Occupancy | # Housing Units | % Housing Units |
| Owner Occupied Housing Units | 175 | 94.1% |
| Renter-Occupied Housing Units | 11 | 5.9% |
| Total Occupied Housing Units | 186 | 100.0% |
Occupancy by Household Size in Dudleyville
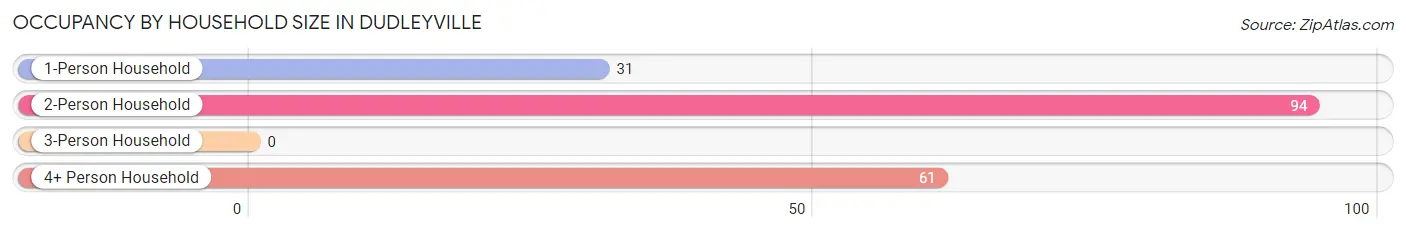
| Household Size | # Housing Units | % Housing Units |
| 1-Person Household | 31 | 16.7% |
| 2-Person Household | 94 | 50.5% |
| 3-Person Household | 0 | 0.0% |
| 4+ Person Household | 61 | 32.8% |
| Total Housing Units | 186 | 100.0% |
Occupancy by Ownership by Household Size in Dudleyville
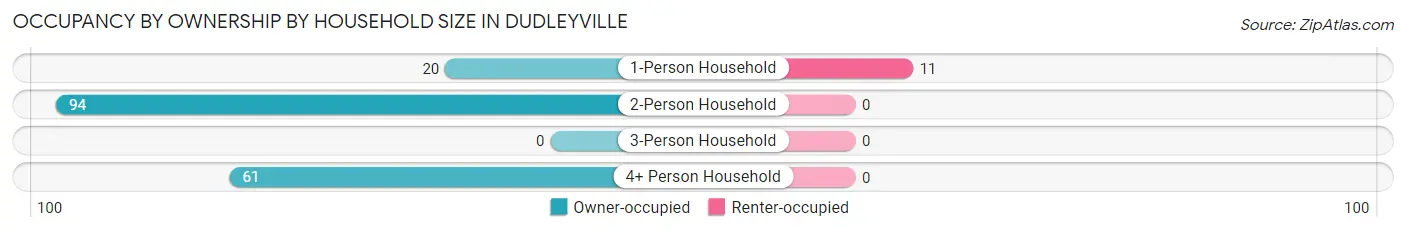
| Household Size | Owner-occupied | Renter-occupied |
| 1-Person Household | 20 (64.5%) | 11 (35.5%) |
| 2-Person Household | 94 (100.0%) | 0 (0.0%) |
| 3-Person Household | 0 (0.0%) | 0 (0.0%) |
| 4+ Person Household | 61 (100.0%) | 0 (0.0%) |
| Total Housing Units | 175 (94.1%) | 11 (5.9%) |
Occupancy by Educational Attainment in Dudleyville
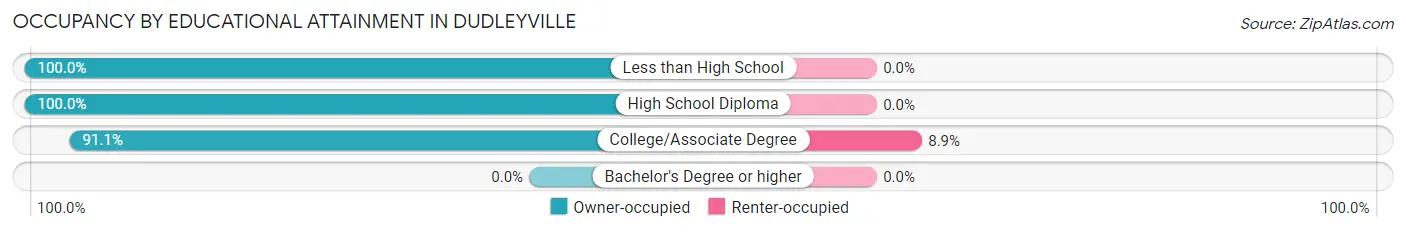
| Household Size | Owner-occupied | Renter-occupied |
| Less than High School | 43 (100.0%) | 0 (0.0%) |
| High School Diploma | 20 (100.0%) | 0 (0.0%) |
| College/Associate Degree | 112 (91.1%) | 11 (8.9%) |
| Bachelor's Degree or higher | 0 (0.0%) | 0 (0.0%) |
Occupancy by Age of Householder in Dudleyville
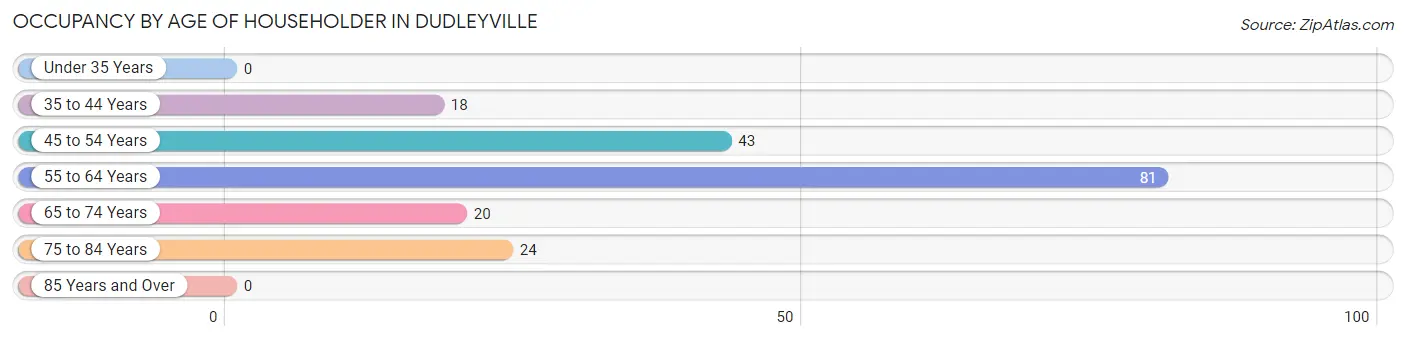
| Age Bracket | # Households | % Households |
| Under 35 Years | 0 | 0.0% |
| 35 to 44 Years | 18 | 9.7% |
| 45 to 54 Years | 43 | 23.1% |
| 55 to 64 Years | 81 | 43.5% |
| 65 to 74 Years | 20 | 10.7% |
| 75 to 84 Years | 24 | 12.9% |
| 85 Years and Over | 0 | 0.0% |
| Total | 186 | 100.0% |
Housing Finances in Dudleyville
Median Income by Occupancy in Dudleyville
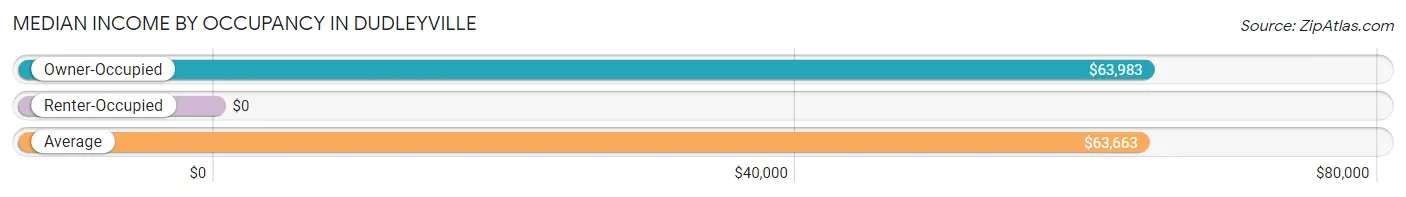
| Occupancy Type | # Households | Median Income |
| Owner-Occupied | 175 (94.1%) | $63,983 |
| Renter-Occupied | 11 (5.9%) | $0 |
| Average | 186 (100.0%) | $63,663 |
Occupancy by Householder Income Bracket in Dudleyville
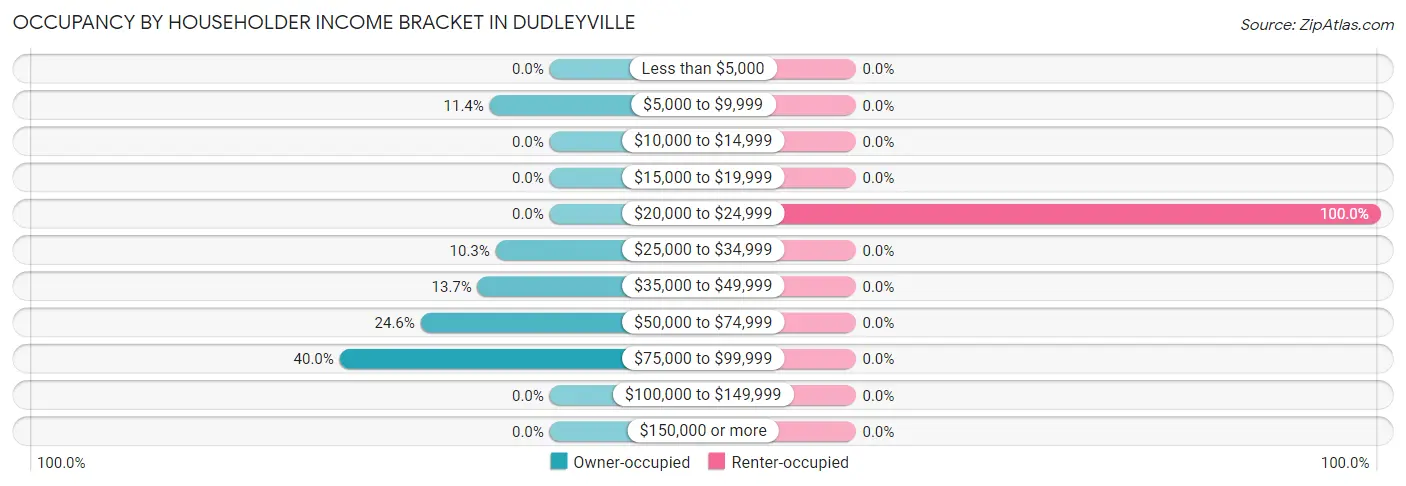
| Income Bracket | Owner-occupied | Renter-occupied |
| Less than $5,000 | 0 (0.0%) | 0 (0.0%) |
| $5,000 to $9,999 | 20 (11.4%) | 0 (0.0%) |
| $10,000 to $14,999 | 0 (0.0%) | 0 (0.0%) |
| $15,000 to $19,999 | 0 (0.0%) | 0 (0.0%) |
| $20,000 to $24,999 | 0 (0.0%) | 11 (100.0%) |
| $25,000 to $34,999 | 18 (10.3%) | 0 (0.0%) |
| $35,000 to $49,999 | 24 (13.7%) | 0 (0.0%) |
| $50,000 to $74,999 | 43 (24.6%) | 0 (0.0%) |
| $75,000 to $99,999 | 70 (40.0%) | 0 (0.0%) |
| $100,000 to $149,999 | 0 (0.0%) | 0 (0.0%) |
| $150,000 or more | 0 (0.0%) | 0 (0.0%) |
| Total | 175 (100.0%) | 11 (100.0%) |
Monthly Housing Cost Tiers in Dudleyville
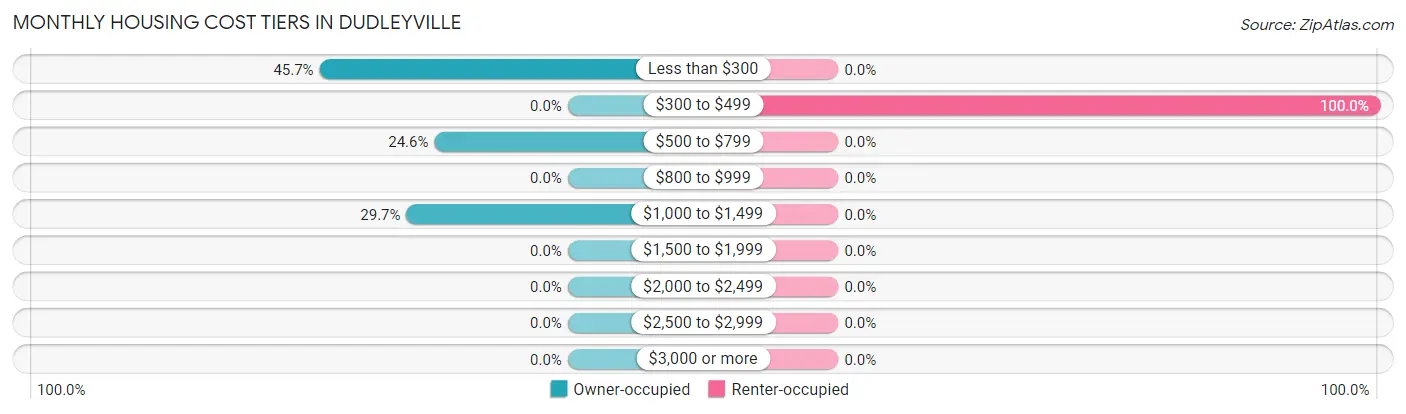
| Monthly Cost | Owner-occupied | Renter-occupied |
| Less than $300 | 80 (45.7%) | 0 (0.0%) |
| $300 to $499 | 0 (0.0%) | 11 (100.0%) |
| $500 to $799 | 43 (24.6%) | 0 (0.0%) |
| $800 to $999 | 0 (0.0%) | 0 (0.0%) |
| $1,000 to $1,499 | 52 (29.7%) | 0 (0.0%) |
| $1,500 to $1,999 | 0 (0.0%) | 0 (0.0%) |
| $2,000 to $2,499 | 0 (0.0%) | 0 (0.0%) |
| $2,500 to $2,999 | 0 (0.0%) | 0 (0.0%) |
| $3,000 or more | 0 (0.0%) | 0 (0.0%) |
| Total | 175 (100.0%) | 11 (100.0%) |
Physical Housing Characteristics in Dudleyville
Housing Structures in Dudleyville
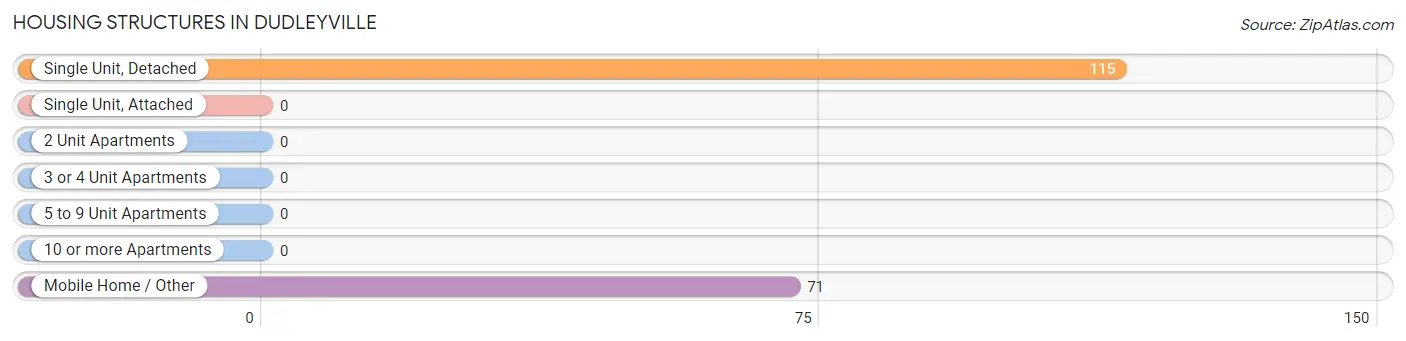
| Structure Type | # Housing Units | % Housing Units |
| Single Unit, Detached | 115 | 61.8% |
| Single Unit, Attached | 0 | 0.0% |
| 2 Unit Apartments | 0 | 0.0% |
| 3 or 4 Unit Apartments | 0 | 0.0% |
| 5 to 9 Unit Apartments | 0 | 0.0% |
| 10 or more Apartments | 0 | 0.0% |
| Mobile Home / Other | 71 | 38.2% |
| Total | 186 | 100.0% |
Housing Structures by Occupancy in Dudleyville
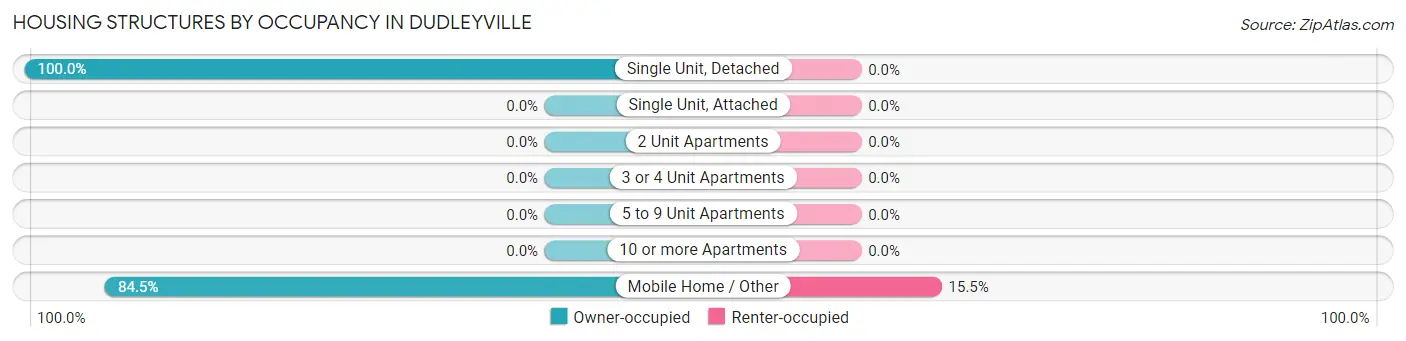
| Structure Type | Owner-occupied | Renter-occupied |
| Single Unit, Detached | 115 (100.0%) | 0 (0.0%) |
| Single Unit, Attached | 0 (0.0%) | 0 (0.0%) |
| 2 Unit Apartments | 0 (0.0%) | 0 (0.0%) |
| 3 or 4 Unit Apartments | 0 (0.0%) | 0 (0.0%) |
| 5 to 9 Unit Apartments | 0 (0.0%) | 0 (0.0%) |
| 10 or more Apartments | 0 (0.0%) | 0 (0.0%) |
| Mobile Home / Other | 60 (84.5%) | 11 (15.5%) |
| Total | 175 (94.1%) | 11 (5.9%) |
Housing Structures by Number of Rooms in Dudleyville
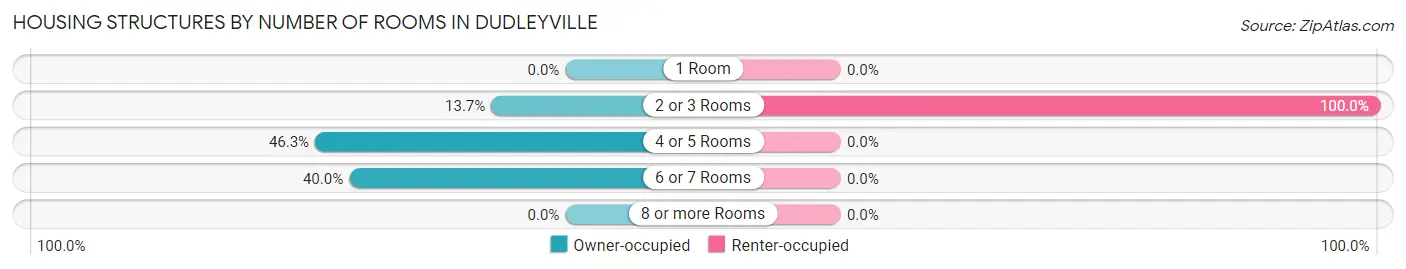
| Number of Rooms | Owner-occupied | Renter-occupied |
| 1 Room | 0 (0.0%) | 0 (0.0%) |
| 2 or 3 Rooms | 24 (13.7%) | 11 (100.0%) |
| 4 or 5 Rooms | 81 (46.3%) | 0 (0.0%) |
| 6 or 7 Rooms | 70 (40.0%) | 0 (0.0%) |
| 8 or more Rooms | 0 (0.0%) | 0 (0.0%) |
| Total | 175 (100.0%) | 11 (100.0%) |
Housing Structure by Heating Type in Dudleyville
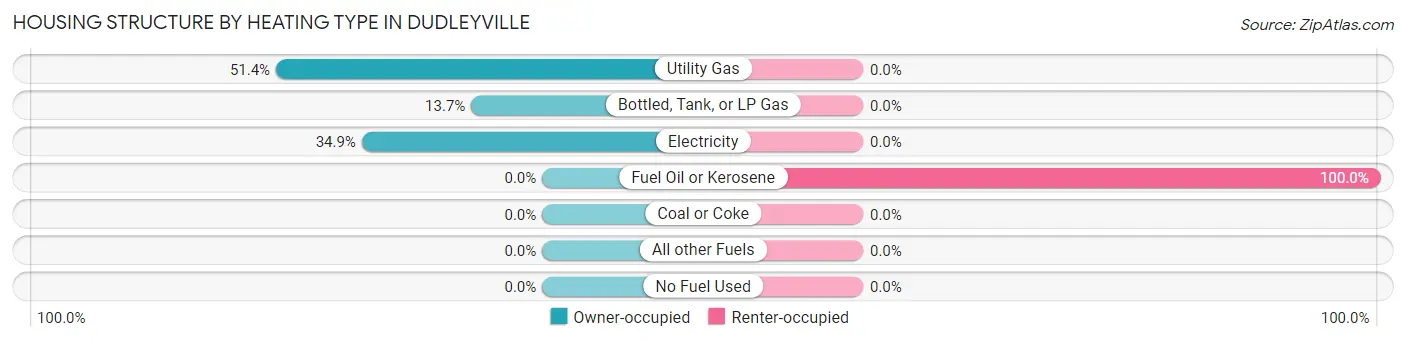
| Heating Type | Owner-occupied | Renter-occupied |
| Utility Gas | 90 (51.4%) | 0 (0.0%) |
| Bottled, Tank, or LP Gas | 24 (13.7%) | 0 (0.0%) |
| Electricity | 61 (34.9%) | 0 (0.0%) |
| Fuel Oil or Kerosene | 0 (0.0%) | 11 (100.0%) |
| Coal or Coke | 0 (0.0%) | 0 (0.0%) |
| All other Fuels | 0 (0.0%) | 0 (0.0%) |
| No Fuel Used | 0 (0.0%) | 0 (0.0%) |
| Total | 175 (100.0%) | 11 (100.0%) |
Household Vehicle Usage in Dudleyville
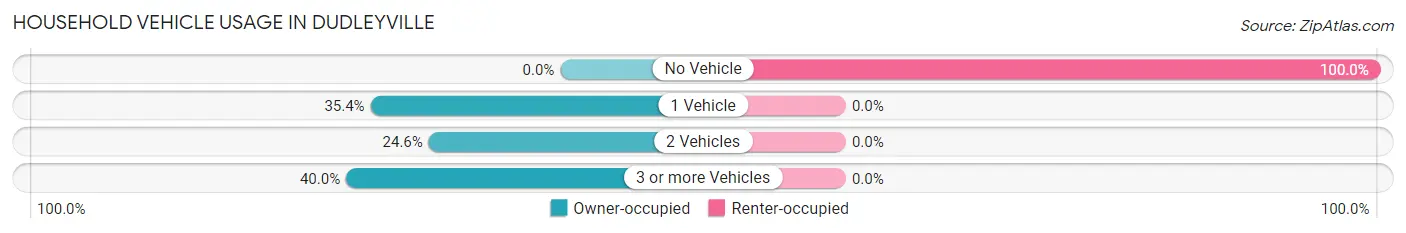
| Vehicles per Household | Owner-occupied | Renter-occupied |
| No Vehicle | 0 (0.0%) | 11 (100.0%) |
| 1 Vehicle | 62 (35.4%) | 0 (0.0%) |
| 2 Vehicles | 43 (24.6%) | 0 (0.0%) |
| 3 or more Vehicles | 70 (40.0%) | 0 (0.0%) |
| Total | 175 (100.0%) | 11 (100.0%) |
Real Estate & Mortgages in Dudleyville
Real Estate and Mortgage Overview in Dudleyville
| Characteristic | Without Mortgage | With Mortgage |
| Housing Units | 123 | 52 |
| Median Property Value | - | - |
| Median Household Income | $49,948 | $0 |
| Monthly Housing Costs | - | - |
| Real Estate Taxes | $794 | $0 |
Property Value by Mortgage Status in Dudleyville
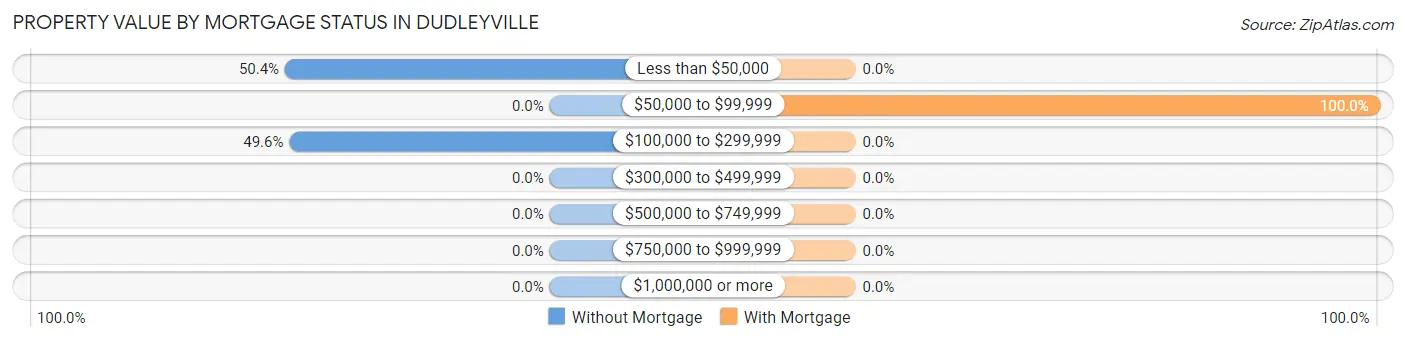
| Property Value | Without Mortgage | With Mortgage |
| Less than $50,000 | 62 (50.4%) | 0 (0.0%) |
| $50,000 to $99,999 | 0 (0.0%) | 52 (100.0%) |
| $100,000 to $299,999 | 61 (49.6%) | 0 (0.0%) |
| $300,000 to $499,999 | 0 (0.0%) | 0 (0.0%) |
| $500,000 to $749,999 | 0 (0.0%) | 0 (0.0%) |
| $750,000 to $999,999 | 0 (0.0%) | 0 (0.0%) |
| $1,000,000 or more | 0 (0.0%) | 0 (0.0%) |
| Total | 123 (100.0%) | 52 (100.0%) |
Household Income by Mortgage Status in Dudleyville
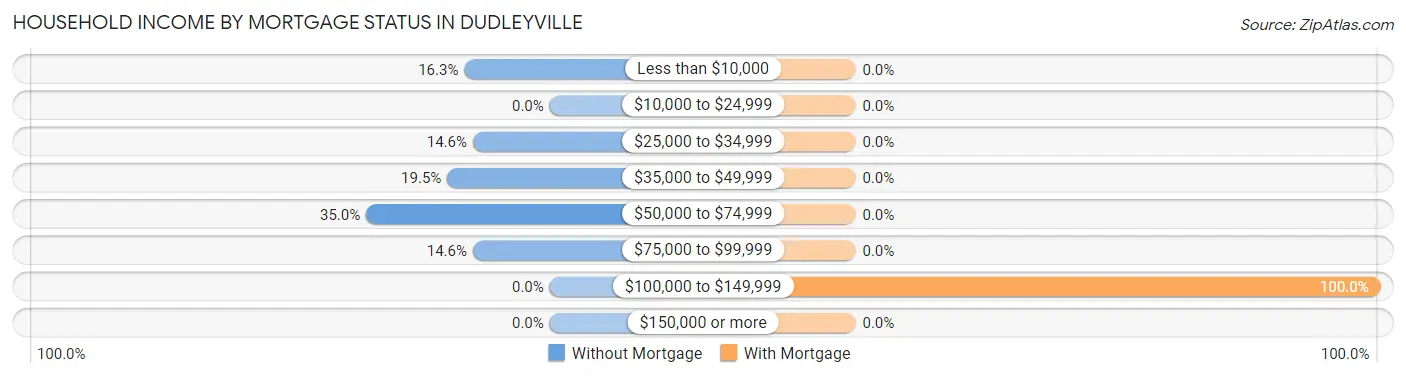
| Household Income | Without Mortgage | With Mortgage |
| Less than $10,000 | 20 (16.3%) | 0 (0.0%) |
| $10,000 to $24,999 | 0 (0.0%) | 0 (0.0%) |
| $25,000 to $34,999 | 18 (14.6%) | 0 (0.0%) |
| $35,000 to $49,999 | 24 (19.5%) | 0 (0.0%) |
| $50,000 to $74,999 | 43 (35.0%) | 0 (0.0%) |
| $75,000 to $99,999 | 18 (14.6%) | 0 (0.0%) |
| $100,000 to $149,999 | 0 (0.0%) | 52 (100.0%) |
| $150,000 or more | 0 (0.0%) | 0 (0.0%) |
| Total | 123 (100.0%) | 52 (100.0%) |
Property Value to Household Income Ratio in Dudleyville
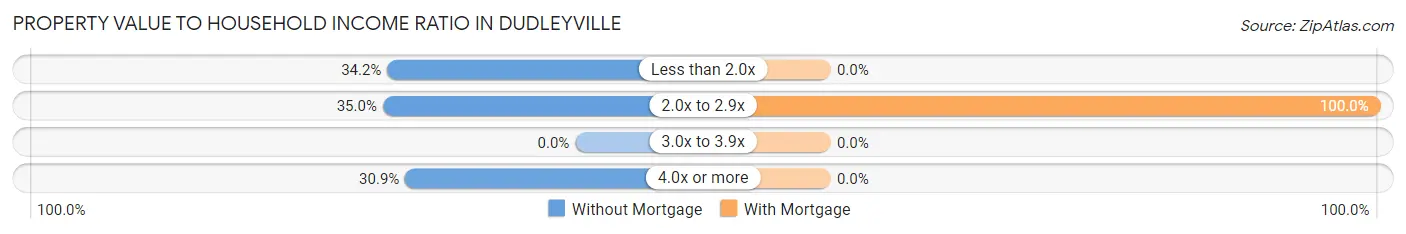
| Value-to-Income Ratio | Without Mortgage | With Mortgage |
| Less than 2.0x | 42 (34.2%) | 0 (0.0%) |
| 2.0x to 2.9x | 43 (35.0%) | 52 (100.0%) |
| 3.0x to 3.9x | 0 (0.0%) | 0 (0.0%) |
| 4.0x or more | 38 (30.9%) | 0 (0.0%) |
| Total | 123 (100.0%) | 52 (100.0%) |
Real Estate Taxes by Mortgage Status in Dudleyville
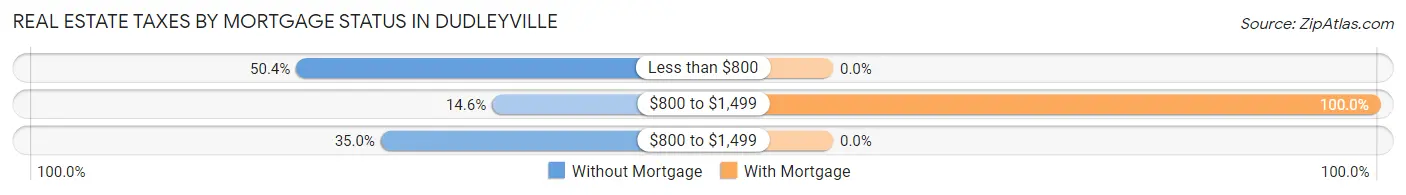
| Property Taxes | Without Mortgage | With Mortgage |
| Less than $800 | 62 (50.4%) | 0 (0.0%) |
| $800 to $1,499 | 18 (14.6%) | 52 (100.0%) |
| $800 to $1,499 | 43 (35.0%) | 0 (0.0%) |
| Total | 123 (100.0%) | 52 (100.0%) |
Health & Disability in Dudleyville
Health Insurance Coverage by Age in Dudleyville
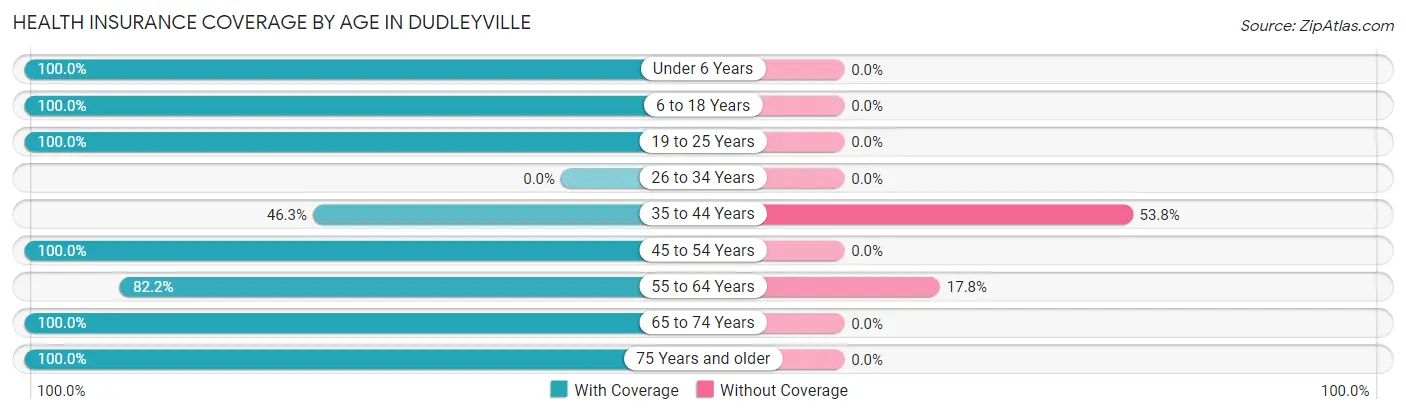
| Age Bracket | With Coverage | Without Coverage |
| Under 6 Years | 30 (100.0%) | 0 (0.0%) |
| 6 to 18 Years | 84 (100.0%) | 0 (0.0%) |
| 19 to 25 Years | 31 (100.0%) | 0 (0.0%) |
| 26 to 34 Years | 0 (0.0%) | 0 (0.0%) |
| 35 to 44 Years | 37 (46.3%) | 43 (53.7%) |
| 45 to 54 Years | 43 (100.0%) | 0 (0.0%) |
| 55 to 64 Years | 83 (82.2%) | 18 (17.8%) |
| 65 to 74 Years | 85 (100.0%) | 0 (0.0%) |
| 75 Years and older | 24 (100.0%) | 0 (0.0%) |
| Total | 417 (87.2%) | 61 (12.8%) |
Health Insurance Coverage by Citizenship Status in Dudleyville
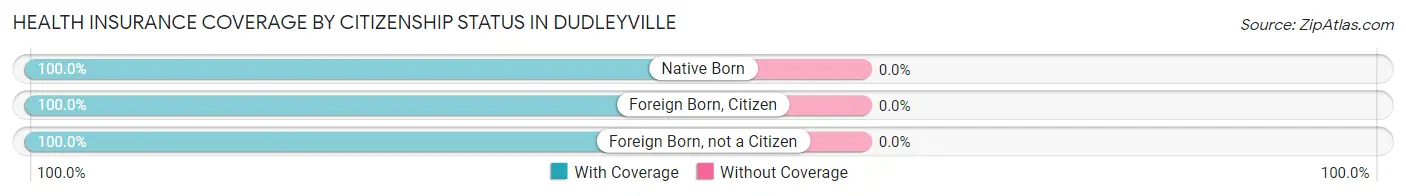
| Citizenship Status | With Coverage | Without Coverage |
| Native Born | 30 (100.0%) | 0 (0.0%) |
| Foreign Born, Citizen | 84 (100.0%) | 0 (0.0%) |
| Foreign Born, not a Citizen | 31 (100.0%) | 0 (0.0%) |
Health Insurance Coverage by Household Income in Dudleyville
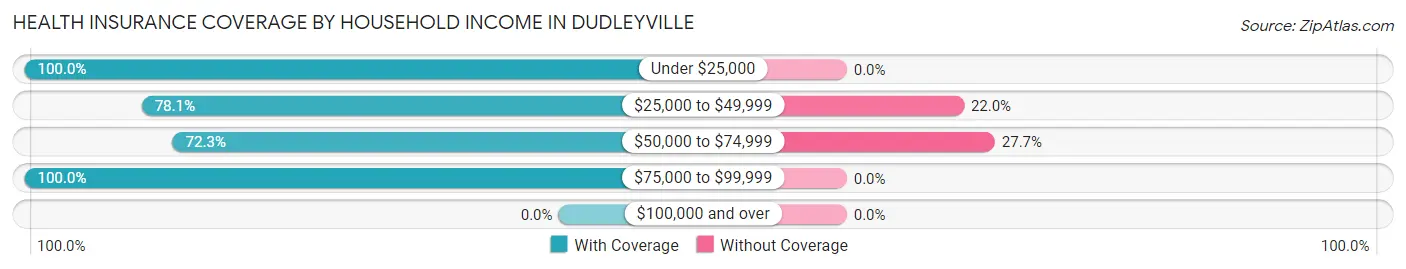
| Household Income | With Coverage | Without Coverage |
| Under $25,000 | 31 (100.0%) | 0 (0.0%) |
| $25,000 to $49,999 | 64 (78.0%) | 18 (22.0%) |
| $50,000 to $74,999 | 112 (72.3%) | 43 (27.7%) |
| $75,000 to $99,999 | 210 (100.0%) | 0 (0.0%) |
| $100,000 and over | 0 (0.0%) | 0 (0.0%) |
Public vs Private Health Insurance Coverage by Age in Dudleyville
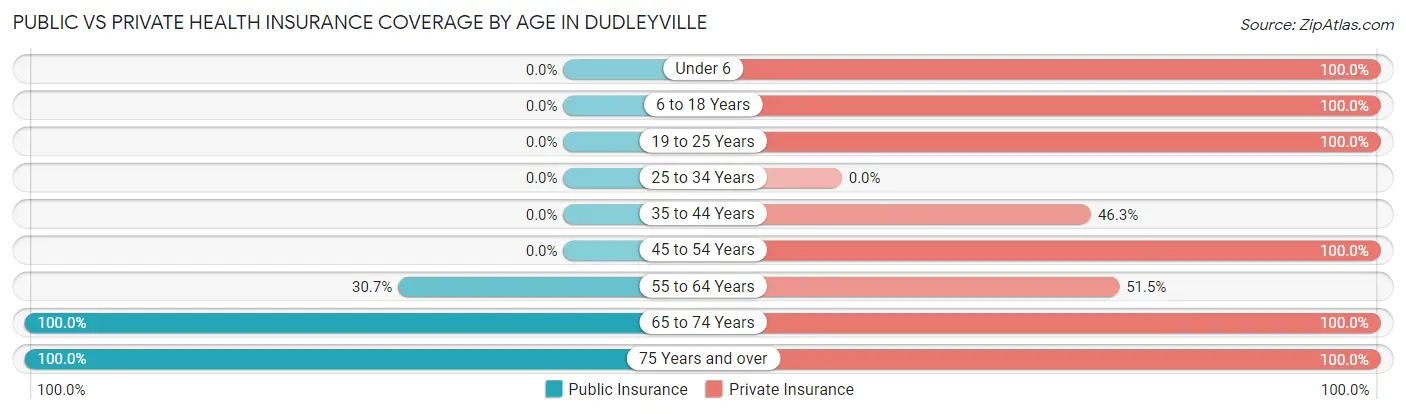
| Age Bracket | Public Insurance | Private Insurance |
| Under 6 | 0 (0.0%) | 30 (100.0%) |
| 6 to 18 Years | 0 (0.0%) | 84 (100.0%) |
| 19 to 25 Years | 0 (0.0%) | 31 (100.0%) |
| 25 to 34 Years | 0 (0.0%) | 0 (0.0%) |
| 35 to 44 Years | 0 (0.0%) | 37 (46.3%) |
| 45 to 54 Years | 0 (0.0%) | 43 (100.0%) |
| 55 to 64 Years | 31 (30.7%) | 52 (51.5%) |
| 65 to 74 Years | 85 (100.0%) | 85 (100.0%) |
| 75 Years and over | 24 (100.0%) | 24 (100.0%) |
| Total | 140 (29.3%) | 386 (80.7%) |
Disability Status by Sex by Age in Dudleyville
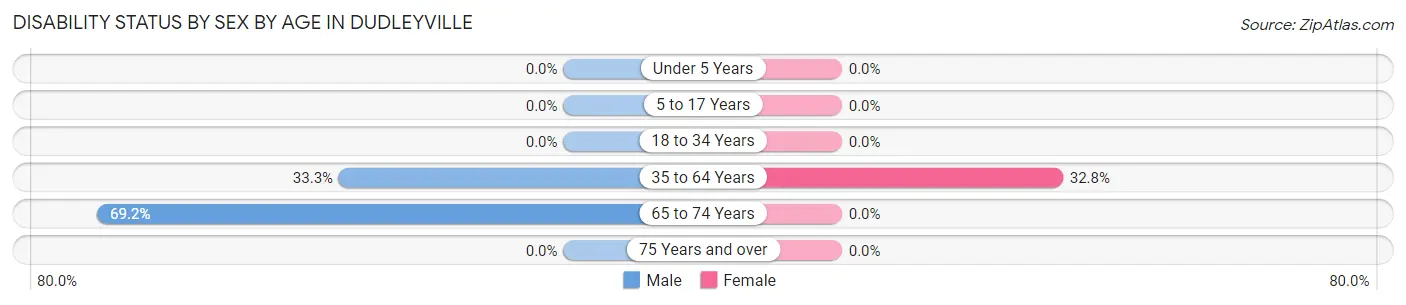
| Age Bracket | Male | Female |
| Under 5 Years | 0 (0.0%) | 0 (0.0%) |
| 5 to 17 Years | 0 (0.0%) | 0 (0.0%) |
| 18 to 34 Years | 0 (0.0%) | 0 (0.0%) |
| 35 to 64 Years | 31 (33.3%) | 43 (32.8%) |
| 65 to 74 Years | 45 (69.2%) | 0 (0.0%) |
| 75 Years and over | 0 (0.0%) | 0 (0.0%) |
Disability Class by Sex by Age in Dudleyville
Disability Class: Hearing Difficulty
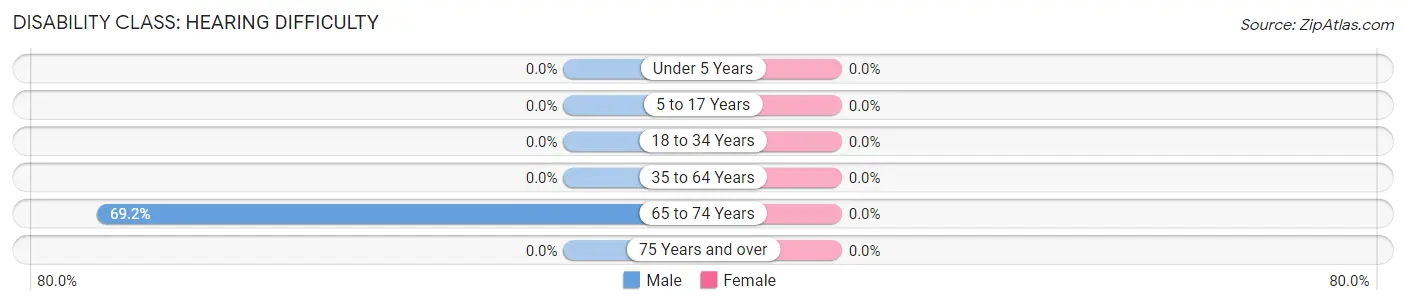
| Age Bracket | Male | Female |
| Under 5 Years | 0 (0.0%) | 0 (0.0%) |
| 5 to 17 Years | 0 (0.0%) | 0 (0.0%) |
| 18 to 34 Years | 0 (0.0%) | 0 (0.0%) |
| 35 to 64 Years | 0 (0.0%) | 0 (0.0%) |
| 65 to 74 Years | 45 (69.2%) | 0 (0.0%) |
| 75 Years and over | 0 (0.0%) | 0 (0.0%) |
Disability Class: Vision Difficulty
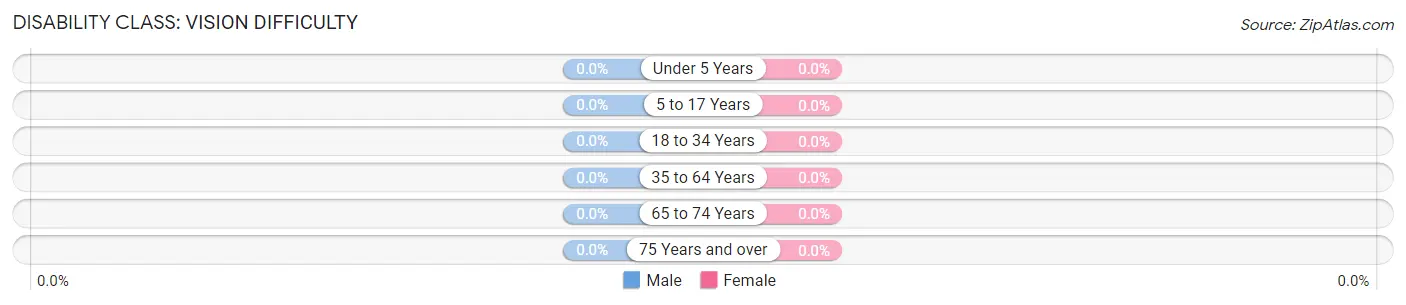
| Age Bracket | Male | Female |
| Under 5 Years | 0 (0.0%) | 0 (0.0%) |
| 5 to 17 Years | 0 (0.0%) | 0 (0.0%) |
| 18 to 34 Years | 0 (0.0%) | 0 (0.0%) |
| 35 to 64 Years | 0 (0.0%) | 0 (0.0%) |
| 65 to 74 Years | 0 (0.0%) | 0 (0.0%) |
| 75 Years and over | 0 (0.0%) | 0 (0.0%) |
Disability Class: Cognitive Difficulty
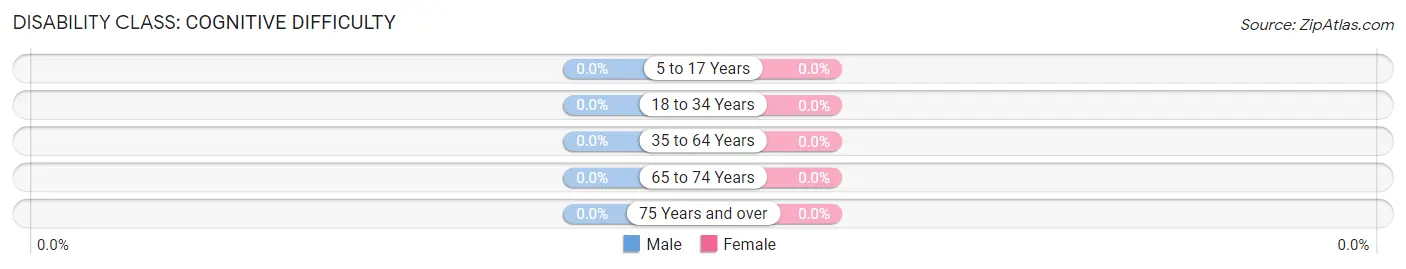
| Age Bracket | Male | Female |
| 5 to 17 Years | 0 (0.0%) | 0 (0.0%) |
| 18 to 34 Years | 0 (0.0%) | 0 (0.0%) |
| 35 to 64 Years | 0 (0.0%) | 0 (0.0%) |
| 65 to 74 Years | 0 (0.0%) | 0 (0.0%) |
| 75 Years and over | 0 (0.0%) | 0 (0.0%) |
Disability Class: Ambulatory Difficulty
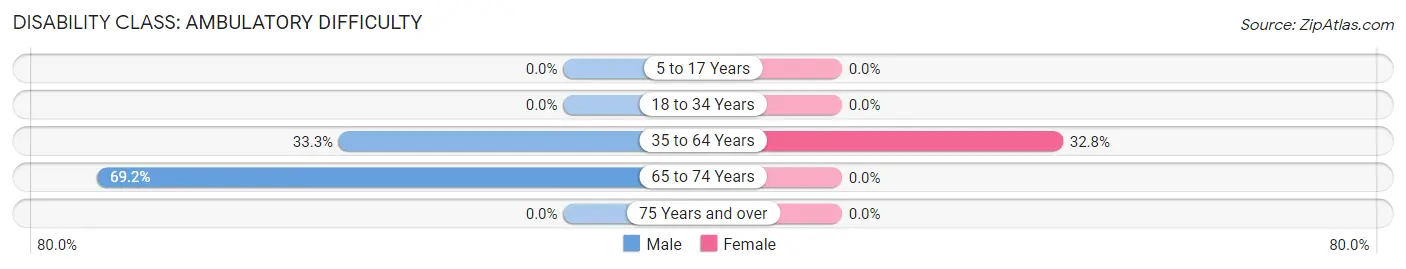
| Age Bracket | Male | Female |
| 5 to 17 Years | 0 (0.0%) | 0 (0.0%) |
| 18 to 34 Years | 0 (0.0%) | 0 (0.0%) |
| 35 to 64 Years | 31 (33.3%) | 43 (32.8%) |
| 65 to 74 Years | 45 (69.2%) | 0 (0.0%) |
| 75 Years and over | 0 (0.0%) | 0 (0.0%) |
Disability Class: Self-Care Difficulty
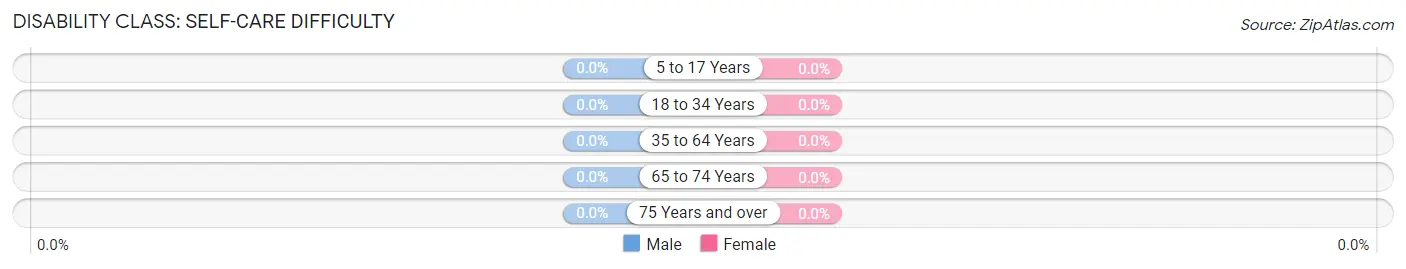
| Age Bracket | Male | Female |
| 5 to 17 Years | 0 (0.0%) | 0 (0.0%) |
| 18 to 34 Years | 0 (0.0%) | 0 (0.0%) |
| 35 to 64 Years | 0 (0.0%) | 0 (0.0%) |
| 65 to 74 Years | 0 (0.0%) | 0 (0.0%) |
| 75 Years and over | 0 (0.0%) | 0 (0.0%) |
Technology Access in Dudleyville
Computing Device Access in Dudleyville
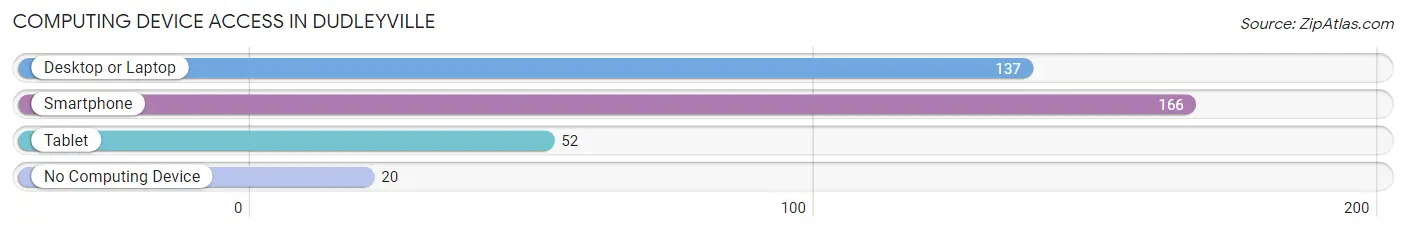
| Device Type | # Households | % Households |
| Desktop or Laptop | 137 | 73.7% |
| Smartphone | 166 | 89.2% |
| Tablet | 52 | 28.0% |
| No Computing Device | 20 | 10.7% |
| Total | 186 | 100.0% |
Internet Access in Dudleyville
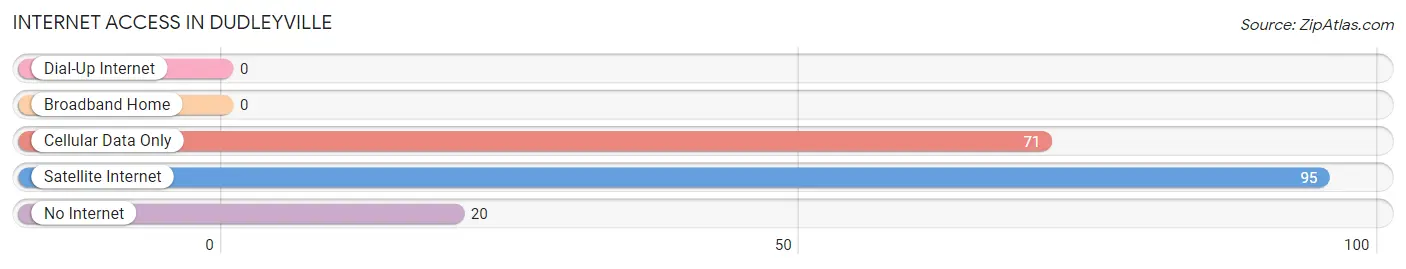
| Internet Type | # Households | % Households |
| Dial-Up Internet | 0 | 0.0% |
| Broadband Home | 0 | 0.0% |
| Cellular Data Only | 71 | 38.2% |
| Satellite Internet | 95 | 51.1% |
| No Internet | 20 | 10.7% |
| Total | 186 | 100.0% |
Dudleyville Summary
Dudleyville is a small unincorporated community located in Pinal County, Arizona. It is situated in the San Pedro Valley, approximately 40 miles southeast of Phoenix. The town was founded in the late 1800s by William Dudley, a rancher and miner who settled in the area. The town was named after him.
History
The area around Dudleyville was first inhabited by the Hohokam people, who lived in the area from around 300 BC to 1450 AD. The Hohokam were a pre-Columbian culture that lived in the Sonoran Desert. They were known for their irrigation systems and their pottery.
In the late 1800s, William Dudley moved to the area and established a ranch and a mine. He named the town after himself. The town grew slowly, and by the early 1900s, it had a post office, a school, a general store, and a few other businesses.
In the 1920s, the town began to decline as the mining industry in the area declined. The post office closed in the 1930s, and the school closed in the 1940s. By the 1950s, the town had become a ghost town.
In the 1970s, the town was revived when a group of investors purchased the land and began to develop it. They built a golf course, a hotel, and a restaurant. The town also became a popular destination for tourists.
Geography
Dudleyville is located in the San Pedro Valley, which is part of the Sonoran Desert. The town is situated at an elevation of 2,400 feet. The area is characterized by rolling hills and dry, desert vegetation.
The climate in Dudleyville is hot and dry, with temperatures ranging from the mid-90s in the summer to the mid-50s in the winter. The area receives very little rainfall, with an average of only 8 inches per year.
Economy
The economy of Dudleyville is largely based on tourism. The town is a popular destination for golfers, as it is home to a golf course. The town also has a hotel and a restaurant.
In addition to tourism, the town is also home to a few small businesses, including a gas station, a convenience store, and a few other shops.
Demographics
As of the 2010 census, the population of Dudleyville was 1,072. The racial makeup of the town was 94.3% White, 0.7% Native American, 0.3% Asian, 0.2% African American, and 4.5% from other races.
The median household income in Dudleyville was $37,500, and the median family income was $41,250. The per capita income was $17,500.
Conclusion
Dudleyville is a small unincorporated community located in Pinal County, Arizona. It was founded in the late 1800s by William Dudley, a rancher and miner who settled in the area. The town has a long history, and it has seen its share of ups and downs. Today, the town is a popular destination for tourists, and its economy is largely based on tourism. The population of Dudleyville is 1,072, and the median household income is $37,500.
Common Questions
What is Per Capita Income in Dudleyville?
Per Capita income in Dudleyville is $21,567.
What is the Median Family Income in Dudleyville?
Median Family Income in Dudleyville is $85,208.
What is the Median Household income in Dudleyville?
Median Household Income in Dudleyville is $63,663.
What is Inequality or Gini Index in Dudleyville?
Inequality or Gini Index in Dudleyville is 0.26.
What is the Total Population of Dudleyville?
Total Population of Dudleyville is 478.
What is the Total Male Population of Dudleyville?
Total Male Population of Dudleyville is 267.
What is the Total Female Population of Dudleyville?
Total Female Population of Dudleyville is 211.
What is the Ratio of Males per 100 Females in Dudleyville?
There are 126.54 Males per 100 Females in Dudleyville.
What is the Ratio of Females per 100 Males in Dudleyville?
There are 79.03 Females per 100 Males in Dudleyville.
What is the Median Population Age in Dudleyville?
Median Population Age in Dudleyville is 45.3 Years.
What is the Average Family Size in Dudleyville
Average Family Size in Dudleyville is 3.0 People.
What is the Average Household Size in Dudleyville
Average Household Size in Dudleyville is 2.6 People.
How Large is the Labor Force in Dudleyville?
There are 163 People in the Labor Forcein in Dudleyville.
What is the Percentage of People in the Labor Force in Dudleyville?
42.8% of People are in the Labor Force in Dudleyville.