Tubac, AZ Map & Demographics
Tubac Map
Tubac Overview
$57,357
PER CAPITA INCOME
$110,744
AVG FAMILY INCOME
$85,893
AVG HOUSEHOLD INCOME
0.44
INEQUALITY / GINI INDEX
1,375
TOTAL POPULATION
639
MALE POPULATION
736
FEMALE POPULATION
86.82
MALES / 100 FEMALES
115.18
FEMALES / 100 MALES
69.4
MEDIAN AGE
2.3
AVG FAMILY SIZE
1.8
AVG HOUSEHOLD SIZE
412
LABOR FORCE [ PEOPLE ]
32.0%
PERCENT IN LABOR FORCE
3.9%
UNEMPLOYMENT RATE
Tubac Zip Codes
Tubac Area Codes
Income in Tubac
Income Overview in Tubac
Per Capita Income in Tubac is $57,357, while median incomes of families and households are $110,744 and $85,893 respectively.
| Characteristic | Number | Measure |
| Per Capita Income | 1,375 | $57,357 |
| Median Family Income | 415 | $110,744 |
| Mean Family Income | 415 | $140,509 |
| Median Household Income | 767 | $85,893 |
| Mean Household Income | 767 | $107,197 |
| Income Deficit | 415 | $0 |
| Wage / Income Gap (%) | 1,375 | 0.00% |
| Wage / Income Gap ($) | 1,375 | 100.00¢ per $1 |
| Gini / Inequality Index | 1,375 | 0.44 |
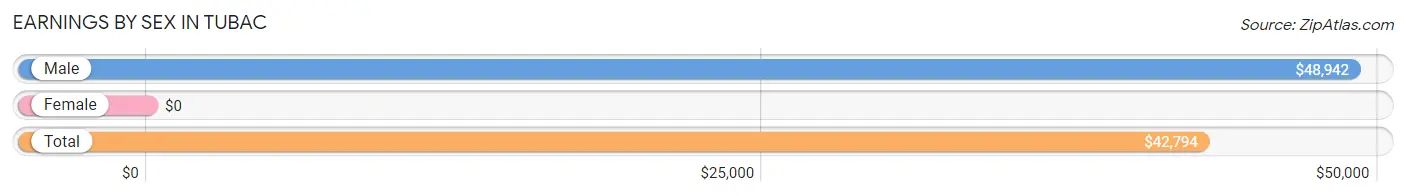
Earnings by Sex in Tubac
| Sex | Number | Average Earnings |
| Male | 272 (65.4%) | $48,942 |
| Female | 144 (34.6%) | $0 |
| Total | 416 (100.0%) | $42,794 |
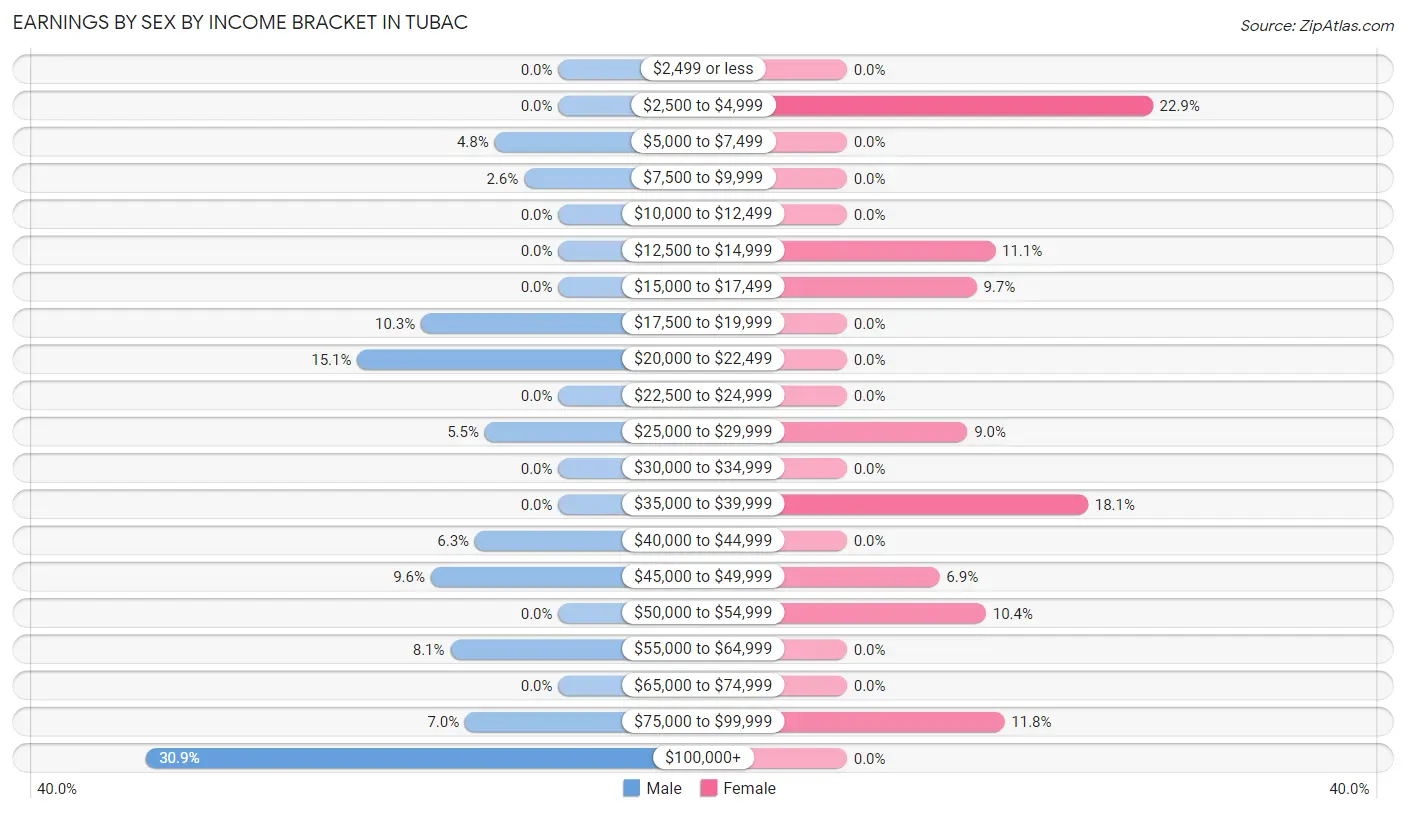
Earnings by Sex by Income Bracket in Tubac
The most common earnings brackets in Tubac are $100,000+ for men (84 | 30.9%) and $2,500 to $4,999 for women (33 | 22.9%).
| Income | Male | Female |
| $2,499 or less | 0 (0.0%) | 0 (0.0%) |
| $2,500 to $4,999 | 0 (0.0%) | 33 (22.9%) |
| $5,000 to $7,499 | 13 (4.8%) | 0 (0.0%) |
| $7,500 to $9,999 | 7 (2.6%) | 0 (0.0%) |
| $10,000 to $12,499 | 0 (0.0%) | 0 (0.0%) |
| $12,500 to $14,999 | 0 (0.0%) | 16 (11.1%) |
| $15,000 to $17,499 | 0 (0.0%) | 14 (9.7%) |
| $17,500 to $19,999 | 28 (10.3%) | 0 (0.0%) |
| $20,000 to $22,499 | 41 (15.1%) | 0 (0.0%) |
| $22,500 to $24,999 | 0 (0.0%) | 0 (0.0%) |
| $25,000 to $29,999 | 15 (5.5%) | 13 (9.0%) |
| $30,000 to $34,999 | 0 (0.0%) | 0 (0.0%) |
| $35,000 to $39,999 | 0 (0.0%) | 26 (18.1%) |
| $40,000 to $44,999 | 17 (6.2%) | 0 (0.0%) |
| $45,000 to $49,999 | 26 (9.6%) | 10 (6.9%) |
| $50,000 to $54,999 | 0 (0.0%) | 15 (10.4%) |
| $55,000 to $64,999 | 22 (8.1%) | 0 (0.0%) |
| $65,000 to $74,999 | 0 (0.0%) | 0 (0.0%) |
| $75,000 to $99,999 | 19 (7.0%) | 17 (11.8%) |
| $100,000+ | 84 (30.9%) | 0 (0.0%) |
| Total | 272 (100.0%) | 144 (100.0%) |
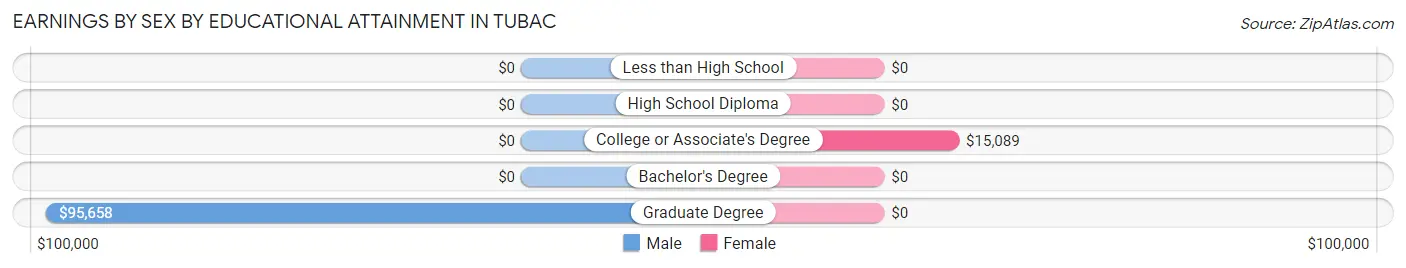
Earnings by Sex by Educational Attainment in Tubac
| Educational Attainment | Male Income | Female Income |
| Less than High School | - | - |
| High School Diploma | - | - |
| College or Associate's Degree | - | - |
| Bachelor's Degree | - | - |
| Graduate Degree | $95,658 | $0 |
| Total | $48,942 | $0 |
Family Income in Tubac
Family Income Brackets in Tubac
According to the Tubac family income data, there are 134 families falling into the $100,000 to $149,999 income range, which is the most common income bracket and makes up 32.3% of all families.
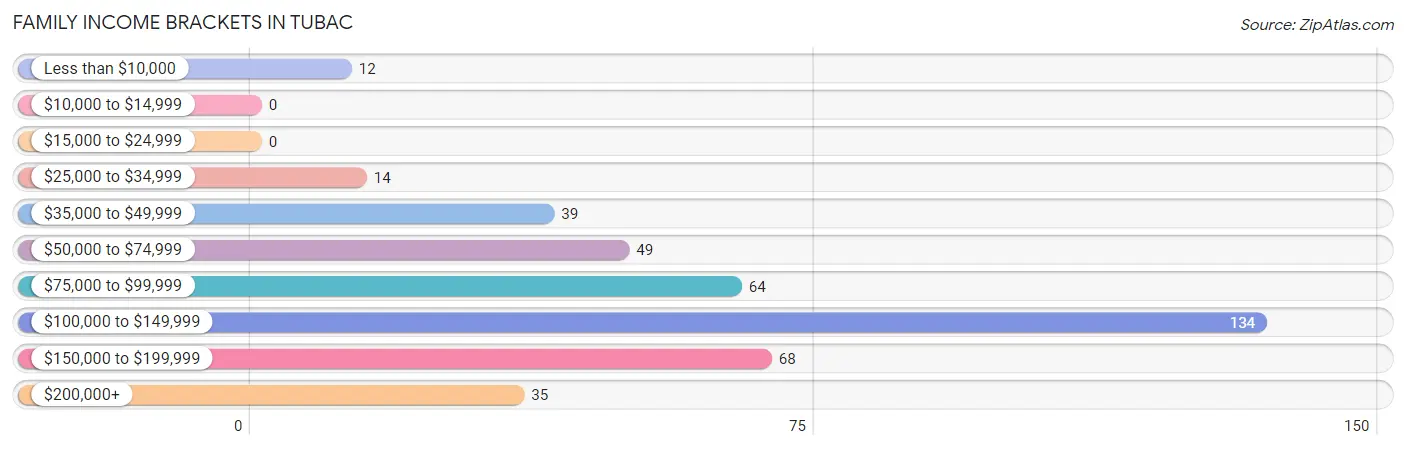
| Income Bracket | # Families | % Families |
| Less than $10,000 | 12 | 2.9% |
| $10,000 to $14,999 | 0 | 0.0% |
| $15,000 to $24,999 | 0 | 0.0% |
| $25,000 to $34,999 | 14 | 3.4% |
| $35,000 to $49,999 | 39 | 9.4% |
| $50,000 to $74,999 | 49 | 11.8% |
| $75,000 to $99,999 | 64 | 15.4% |
| $100,000 to $149,999 | 134 | 32.3% |
| $150,000 to $199,999 | 68 | 16.4% |
| $200,000+ | 35 | 8.4% |
Family Income by Famaliy Size in Tubac
2-person families (327 | 78.8%) account for the highest median family income in Tubac with $110,387 per family, while 2-person families (327 | 78.8%) have the highest median income of $55,194 per family member.
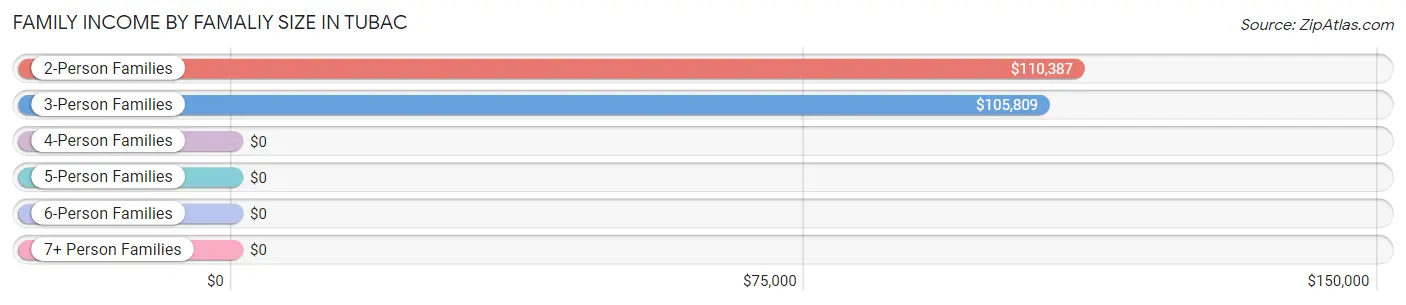
| Income Bracket | # Families | Median Income |
| 2-Person Families | 327 (78.8%) | $110,387 |
| 3-Person Families | 53 (12.8%) | $105,809 |
| 4-Person Families | 35 (8.4%) | $0 |
| 5-Person Families | 0 (0.0%) | $0 |
| 6-Person Families | 0 (0.0%) | $0 |
| 7+ Person Families | 0 (0.0%) | $0 |
| Total | 415 (100.0%) | $110,744 |
Family Income by Number of Earners in Tubac
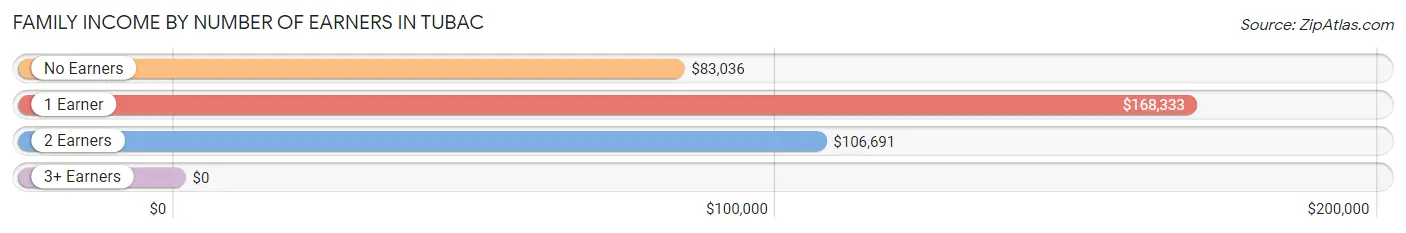
| Number of Earners | # Families | Median Income |
| No Earners | 190 (45.8%) | $83,036 |
| 1 Earner | 174 (41.9%) | $168,333 |
| 2 Earners | 51 (12.3%) | $106,691 |
| 3+ Earners | 0 (0.0%) | $0 |
| Total | 415 (100.0%) | $110,744 |
Household Income in Tubac
Household Income Brackets in Tubac
With 220 households falling in the category, the $100,000 to $149,999 income range is the most frequent in Tubac, accounting for 28.7% of all households. In contrast, only 13 households (1.7%) fall into the $15,000 to $24,999 income bracket, making it the least populous group.
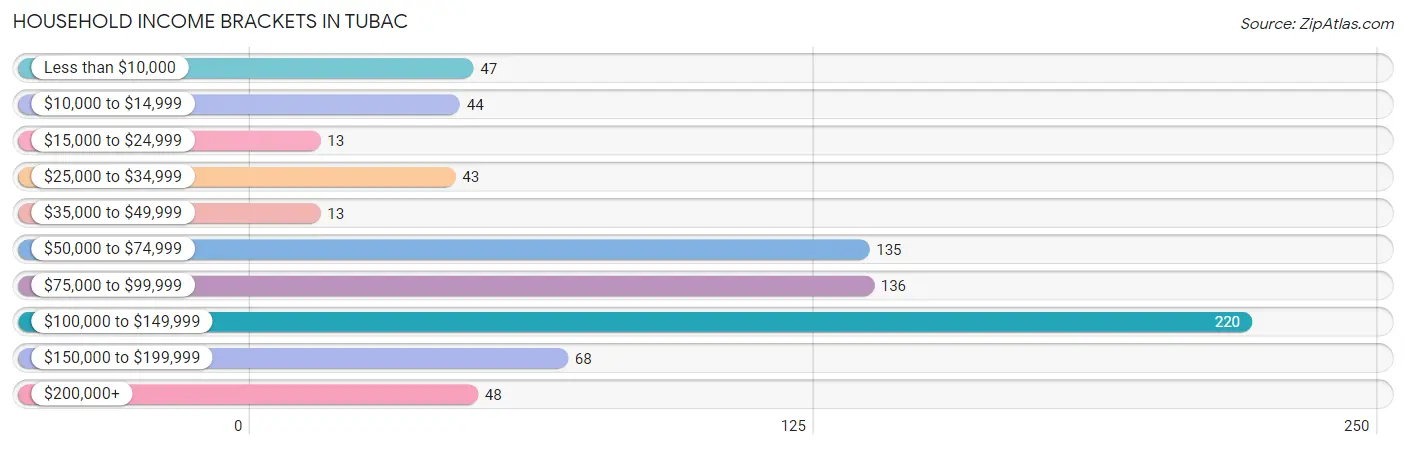
| Income Bracket | # Households | % Households |
| Less than $10,000 | 47 | 6.1% |
| $10,000 to $14,999 | 44 | 5.7% |
| $15,000 to $24,999 | 13 | 1.7% |
| $25,000 to $34,999 | 43 | 5.6% |
| $35,000 to $49,999 | 13 | 1.7% |
| $50,000 to $74,999 | 135 | 17.6% |
| $75,000 to $99,999 | 136 | 17.7% |
| $100,000 to $149,999 | 220 | 28.7% |
| $150,000 to $199,999 | 68 | 8.9% |
| $200,000+ | 48 | 6.3% |
Household Income by Householder Age in Tubac
The median household income in Tubac is $85,893, with the highest median household income of $89,167 found in the 65+ years age bracket for the primary householder. A total of 524 households (68.3%) fall into this category.
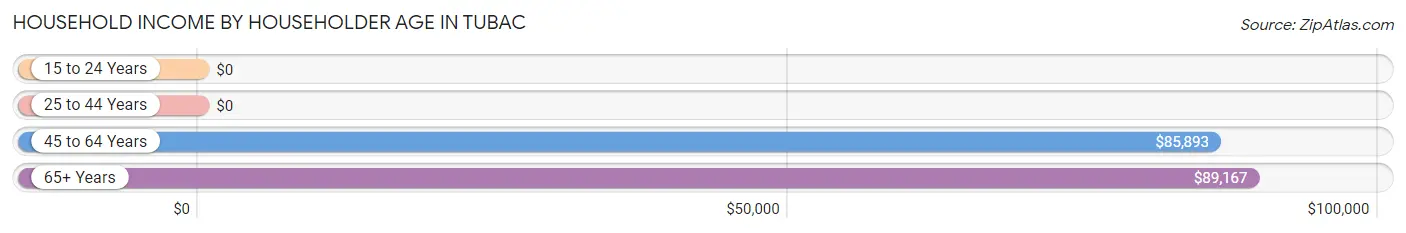
| Income Bracket | # Households | Median Income |
| 15 to 24 Years | 0 (0.0%) | $0 |
| 25 to 44 Years | 90 (11.7%) | $0 |
| 45 to 64 Years | 153 (20.0%) | $85,893 |
| 65+ Years | 524 (68.3%) | $89,167 |
| Total | 767 (100.0%) | $85,893 |
Poverty in Tubac
Income Below Poverty by Sex and Age in Tubac
With 1.9% poverty level for males and 10.9% for females among the residents of Tubac, 75 year old and over males and 45 to 54 year old females are the most vulnerable to poverty, with 12 males (5.1%) and 16 females (100.0%) in their respective age groups living below the poverty level.
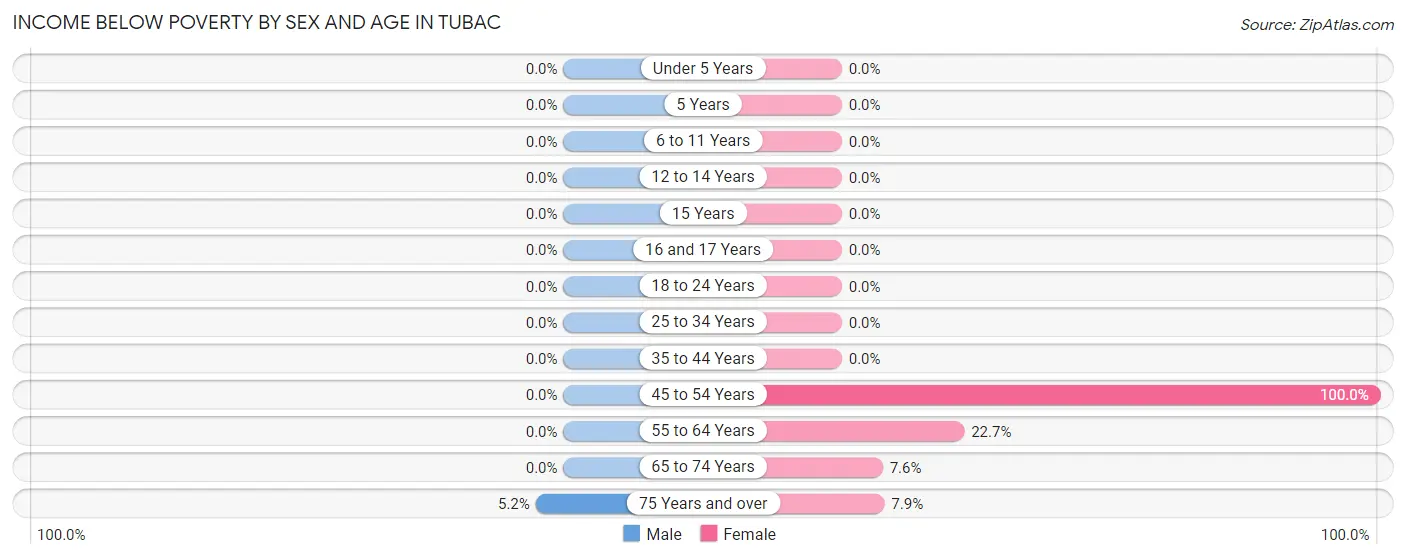
| Age Bracket | Male | Female |
| Under 5 Years | 0 (0.0%) | 0 (0.0%) |
| 5 Years | 0 (0.0%) | 0 (0.0%) |
| 6 to 11 Years | 0 (0.0%) | 0 (0.0%) |
| 12 to 14 Years | 0 (0.0%) | 0 (0.0%) |
| 15 Years | 0 (0.0%) | 0 (0.0%) |
| 16 and 17 Years | 0 (0.0%) | 0 (0.0%) |
| 18 to 24 Years | 0 (0.0%) | 0 (0.0%) |
| 25 to 34 Years | 0 (0.0%) | 0 (0.0%) |
| 35 to 44 Years | 0 (0.0%) | 0 (0.0%) |
| 45 to 54 Years | 0 (0.0%) | 16 (100.0%) |
| 55 to 64 Years | 0 (0.0%) | 30 (22.7%) |
| 65 to 74 Years | 0 (0.0%) | 20 (7.6%) |
| 75 Years and over | 12 (5.1%) | 14 (7.9%) |
| Total | 12 (1.9%) | 80 (10.9%) |
Income Above Poverty by Sex and Age in Tubac
According to the poverty statistics in Tubac, males aged 16 and 17 years and females aged under 5 years are the age groups that are most secure financially, with 100.0% of males and 100.0% of females in these age groups living above the poverty line.
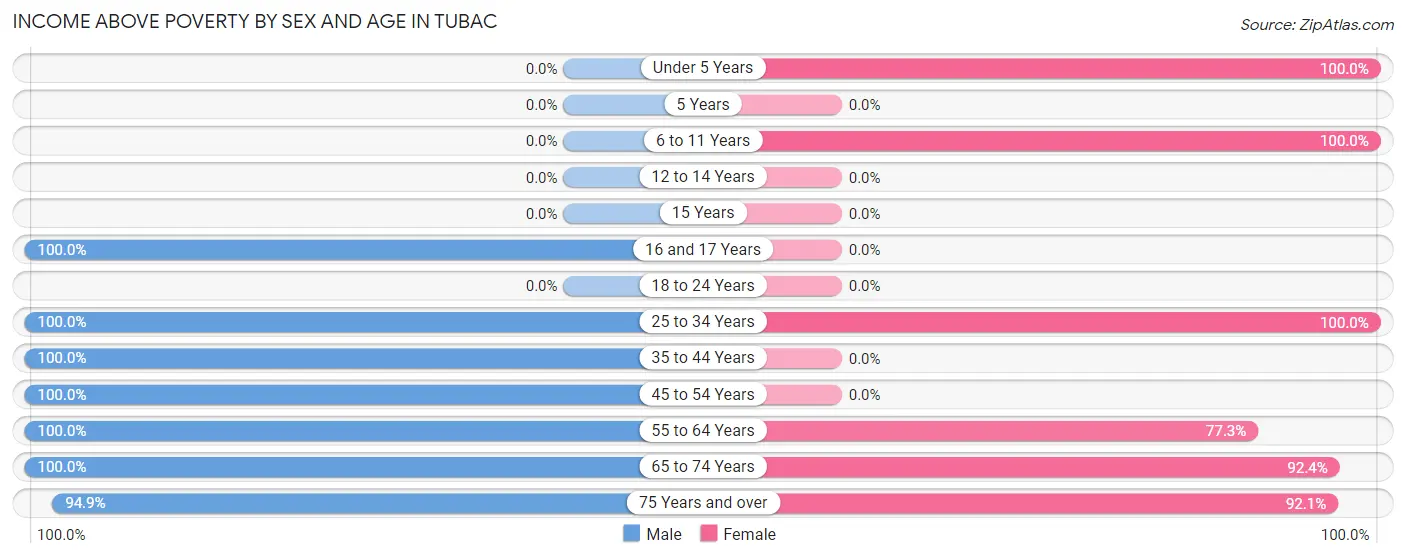
| Age Bracket | Male | Female |
| Under 5 Years | 0 (0.0%) | 54 (100.0%) |
| 5 Years | 0 (0.0%) | 0 (0.0%) |
| 6 to 11 Years | 0 (0.0%) | 32 (100.0%) |
| 12 to 14 Years | 0 (0.0%) | 0 (0.0%) |
| 15 Years | 0 (0.0%) | 0 (0.0%) |
| 16 and 17 Years | 16 (100.0%) | 0 (0.0%) |
| 18 to 24 Years | 0 (0.0%) | 0 (0.0%) |
| 25 to 34 Years | 58 (100.0%) | 62 (100.0%) |
| 35 to 44 Years | 40 (100.0%) | 0 (0.0%) |
| 45 to 54 Years | 52 (100.0%) | 0 (0.0%) |
| 55 to 64 Years | 71 (100.0%) | 102 (77.3%) |
| 65 to 74 Years | 169 (100.0%) | 243 (92.4%) |
| 75 Years and over | 221 (94.9%) | 163 (92.1%) |
| Total | 627 (98.1%) | 656 (89.1%) |
Income Below Poverty Among Married-Couple Families in Tubac
The poverty statistics for married-couple families in Tubac show that 3.1% or 12 of the total 389 families live below the poverty line. Families with no children have the highest poverty rate of 3.5%, comprising of 12 families. On the other hand, families with 1 or 2 children have the lowest poverty rate of 0.0%, which includes 0 families.
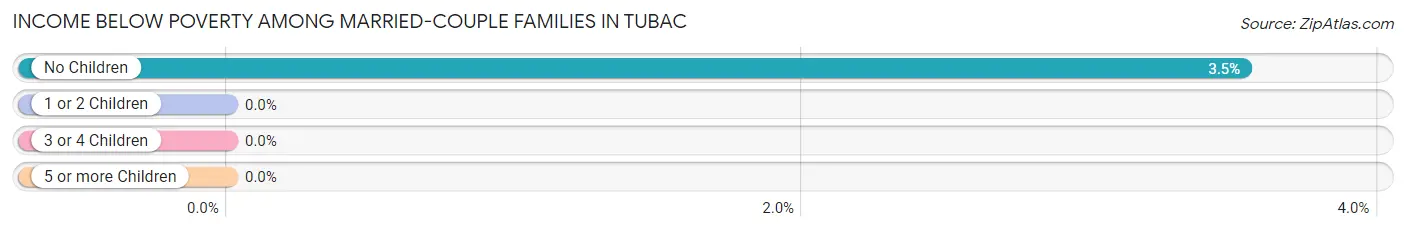
| Children | Above Poverty | Below Poverty |
| No Children | 328 (96.5%) | 12 (3.5%) |
| 1 or 2 Children | 49 (100.0%) | 0 (0.0%) |
| 3 or 4 Children | 0 (0.0%) | 0 (0.0%) |
| 5 or more Children | 0 (0.0%) | 0 (0.0%) |
| Total | 377 (96.9%) | 12 (3.1%) |
Income Below Poverty Among Single-Parent Households in Tubac
| Children | Single Father | Single Mother |
| No Children | 0 (0.0%) | 0 (0.0%) |
| 1 or 2 Children | 0 (0.0%) | 0 (0.0%) |
| 3 or 4 Children | 0 (0.0%) | 0 (0.0%) |
| 5 or more Children | 0 (0.0%) | 0 (0.0%) |
| Total | 0 (0.0%) | 0 (0.0%) |
Income Below Poverty Among Married-Couple vs Single-Parent Households in Tubac
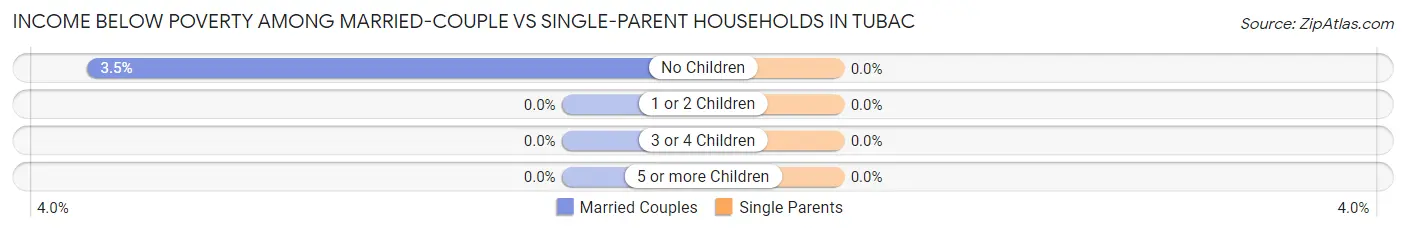
| Children | Married-Couple Families | Single-Parent Households |
| No Children | 12 (3.5%) | 0 (0.0%) |
| 1 or 2 Children | 0 (0.0%) | 0 (0.0%) |
| 3 or 4 Children | 0 (0.0%) | 0 (0.0%) |
| 5 or more Children | 0 (0.0%) | 0 (0.0%) |
| Total | 12 (3.1%) | 0 (0.0%) |
Race in Tubac
The most populous races in Tubac are White / Caucasian (1,208 | 87.8%), Hispanic or Latino (253 | 18.4%), and Two or more Races (138 | 10.0%).
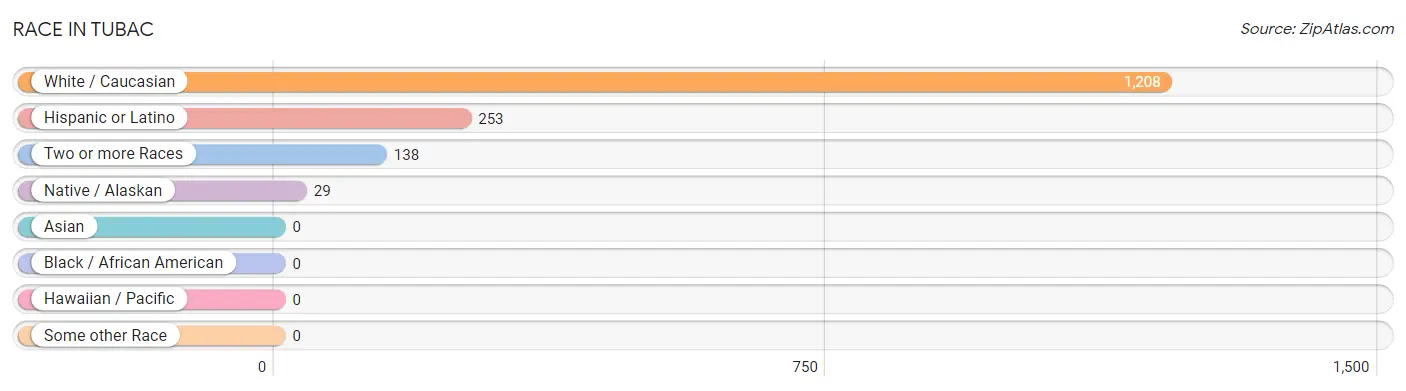
| Race | # Population | % Population |
| Asian | 0 | 0.0% |
| Black / African American | 0 | 0.0% |
| Hawaiian / Pacific | 0 | 0.0% |
| Hispanic or Latino | 253 | 18.4% |
| Native / Alaskan | 29 | 2.1% |
| White / Caucasian | 1,208 | 87.8% |
| Two or more Races | 138 | 10.0% |
| Some other Race | 0 | 0.0% |
| Total | 1,375 | 100.0% |
Ancestry in Tubac
The most populous ancestries reported in Tubac are Mexican (253 | 18.4%), English (249 | 18.1%), German (240 | 17.4%), Irish (139 | 10.1%), and American (81 | 5.9%), together accounting for 70.0% of all Tubac residents.
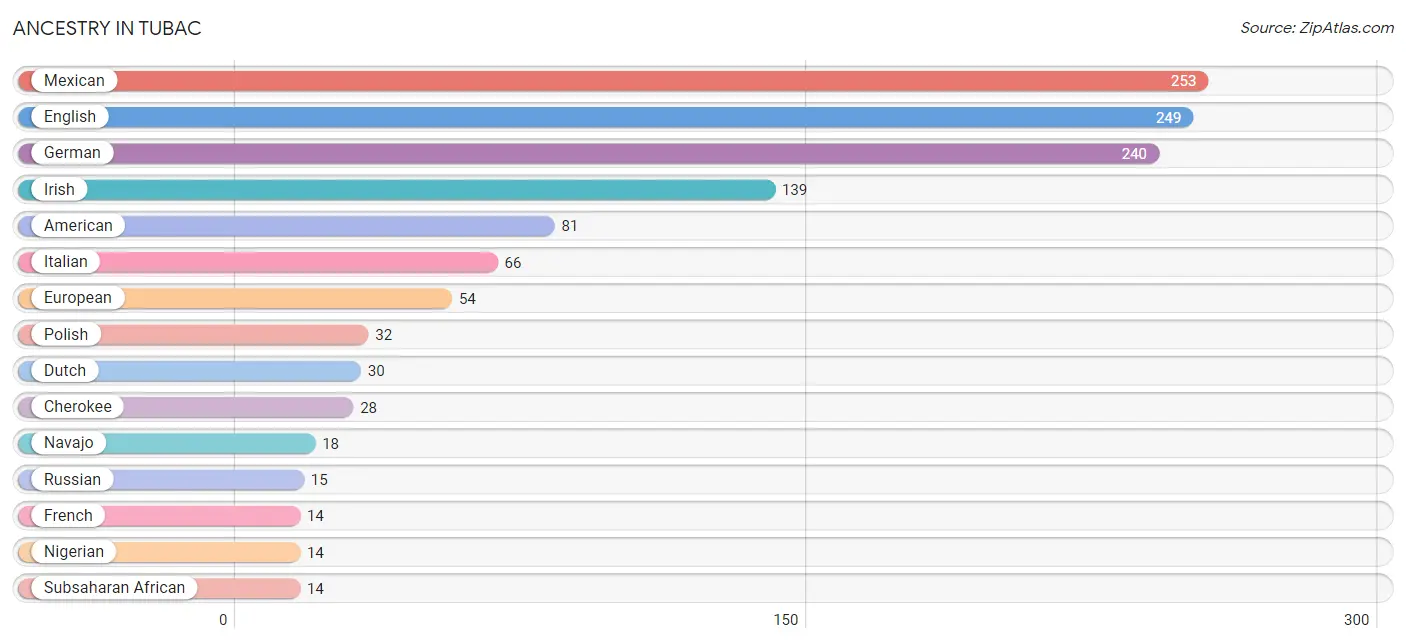
| Ancestry | # Population | % Population |
| American | 81 | 5.9% |
| Cherokee | 28 | 2.0% |
| Danish | 9 | 0.6% |
| Dutch | 30 | 2.2% |
| English | 249 | 18.1% |
| European | 54 | 3.9% |
| French | 14 | 1.0% |
| German | 240 | 17.4% |
| Irish | 139 | 10.1% |
| Italian | 66 | 4.8% |
| Mexican | 253 | 18.4% |
| Navajo | 18 | 1.3% |
| Nigerian | 14 | 1.0% |
| Norwegian | 10 | 0.7% |
| Polish | 32 | 2.3% |
| Russian | 15 | 1.1% |
| Scotch-Irish | 13 | 0.9% |
| Scottish | 13 | 0.9% |
| Subsaharan African | 14 | 1.0% |
| Ukrainian | 14 | 1.0% |
| Yaqui | 11 | 0.8% | View All 21 Rows |
Immigrants in Tubac
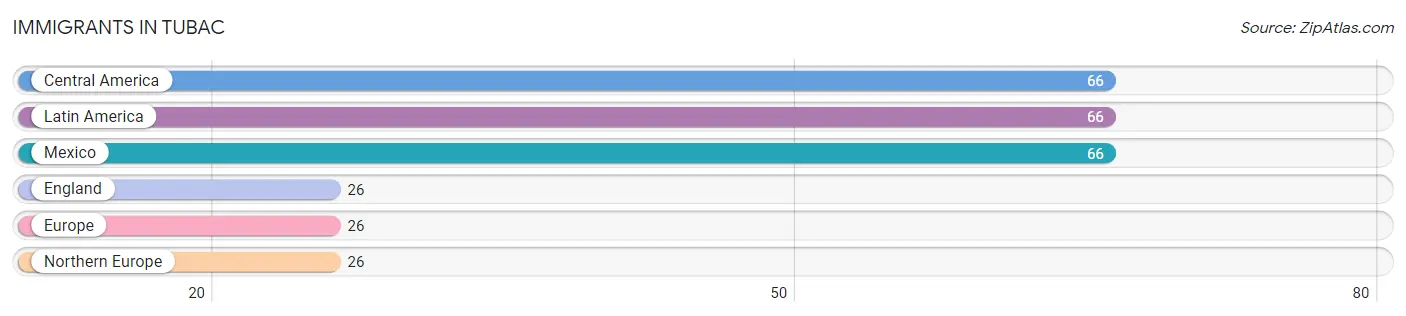
The most numerous immigrant groups reported in Tubac came from Central America (66 | 4.8%), Latin America (66 | 4.8%), Mexico (66 | 4.8%), England (26 | 1.9%), and Europe (26 | 1.9%), together accounting for 18.2% of all Tubac residents.
| Immigration Origin | # Population | % Population |
| Central America | 66 | 4.8% |
| England | 26 | 1.9% |
| Europe | 26 | 1.9% |
| Latin America | 66 | 4.8% |
| Mexico | 66 | 4.8% |
| Northern Europe | 26 | 1.9% | View All 6 Rows |
Sex and Age in Tubac
Sex and Age in Tubac
The most populous age groups in Tubac are 70 to 74 Years (118 | 18.5%) for men and 65 to 69 Years (147 | 20.0%) for women.
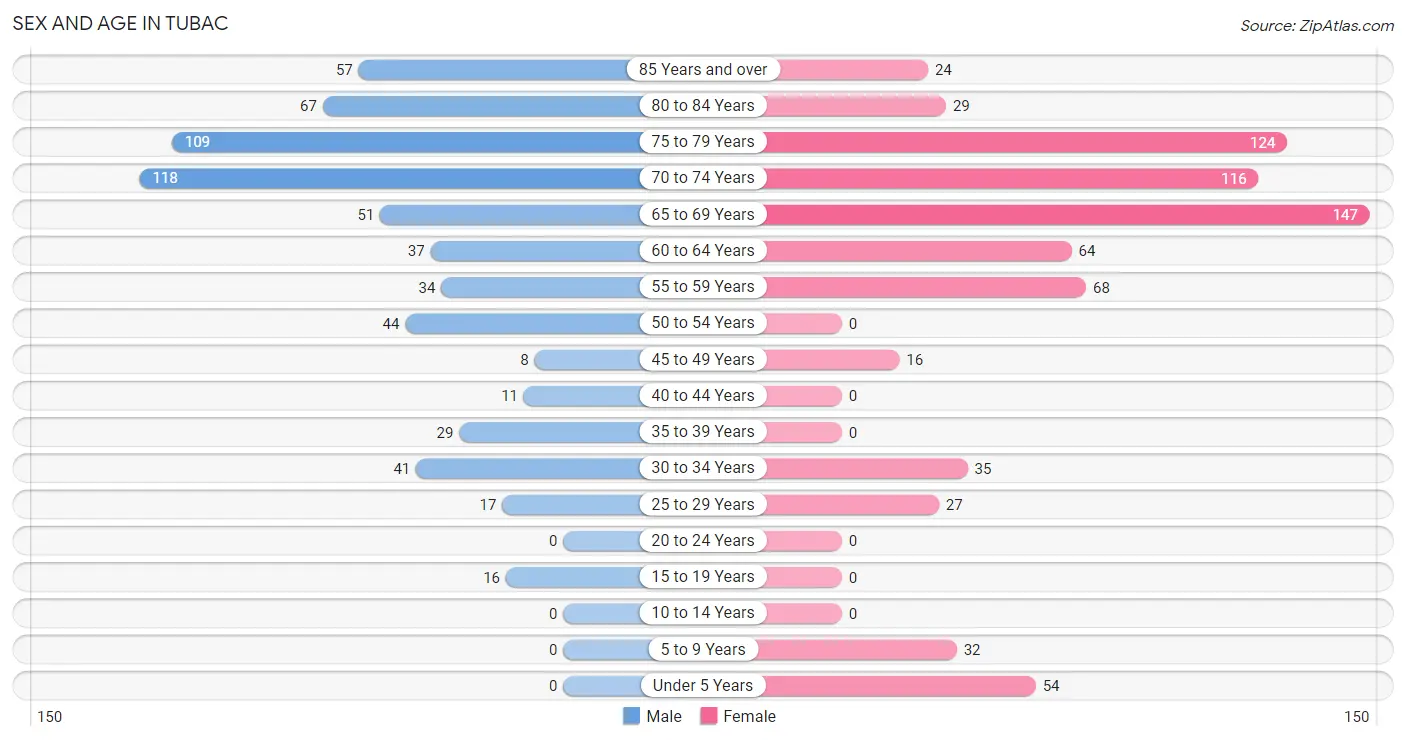
| Age Bracket | Male | Female |
| Under 5 Years | 0 (0.0%) | 54 (7.3%) |
| 5 to 9 Years | 0 (0.0%) | 32 (4.3%) |
| 10 to 14 Years | 0 (0.0%) | 0 (0.0%) |
| 15 to 19 Years | 16 (2.5%) | 0 (0.0%) |
| 20 to 24 Years | 0 (0.0%) | 0 (0.0%) |
| 25 to 29 Years | 17 (2.7%) | 27 (3.7%) |
| 30 to 34 Years | 41 (6.4%) | 35 (4.8%) |
| 35 to 39 Years | 29 (4.5%) | 0 (0.0%) |
| 40 to 44 Years | 11 (1.7%) | 0 (0.0%) |
| 45 to 49 Years | 8 (1.3%) | 16 (2.2%) |
| 50 to 54 Years | 44 (6.9%) | 0 (0.0%) |
| 55 to 59 Years | 34 (5.3%) | 68 (9.2%) |
| 60 to 64 Years | 37 (5.8%) | 64 (8.7%) |
| 65 to 69 Years | 51 (8.0%) | 147 (20.0%) |
| 70 to 74 Years | 118 (18.5%) | 116 (15.8%) |
| 75 to 79 Years | 109 (17.1%) | 124 (16.9%) |
| 80 to 84 Years | 67 (10.5%) | 29 (3.9%) |
| 85 Years and over | 57 (8.9%) | 24 (3.3%) |
| Total | 639 (100.0%) | 736 (100.0%) |
Families and Households in Tubac
Median Family Size in Tubac
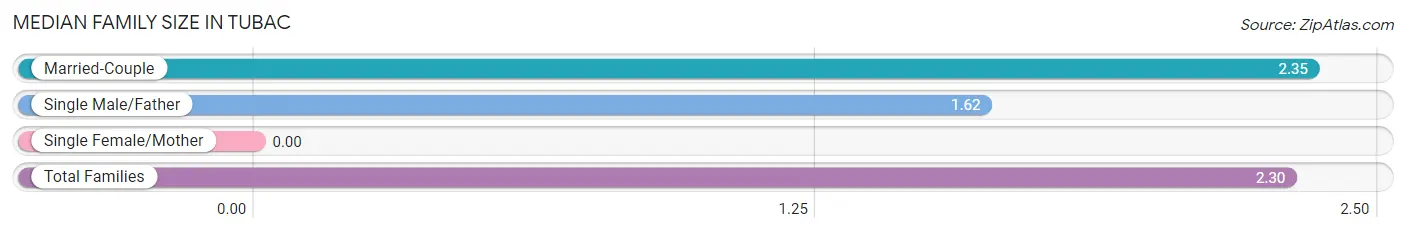
| Family Type | # Families | Family Size |
| Married-Couple | 389 (93.7%) | 2.35 |
| Single Male/Father | 26 (6.3%) | 1.62 |
| Single Female/Mother | 0 (0.0%) | - |
| Total Families | 415 (100.0%) | 2.30 |
Median Household Size in Tubac
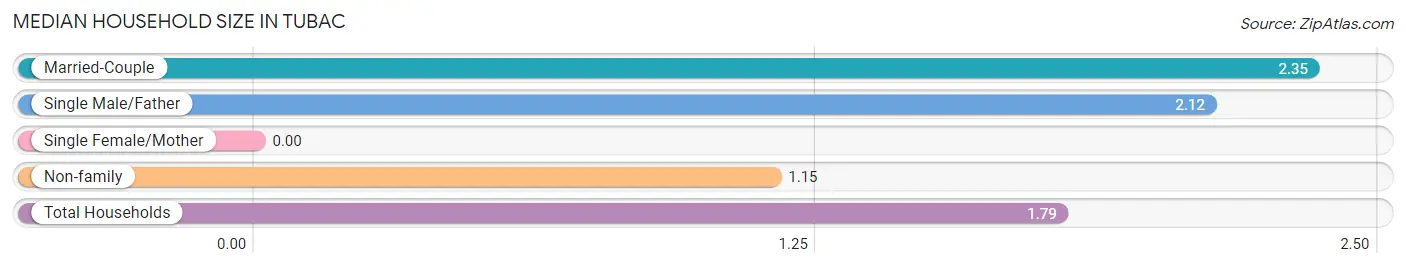
| Household Type | # Households | Household Size |
| Married-Couple | 389 (50.7%) | 2.35 |
| Single Male/Father | 26 (3.4%) | 2.12 |
| Single Female/Mother | 0 (0.0%) | - |
| Non-family | 352 (45.9%) | 1.15 |
| Total Households | 767 (100.0%) | 1.79 |
Household Size by Marriage Status in Tubac
Out of a total of 767 households in Tubac, 415 (54.1%) are family households, while 352 (45.9%) are nonfamily households. The most numerous type of family households are 2-person households, comprising 301, and the most common type of nonfamily households are 1-person households, comprising 295.
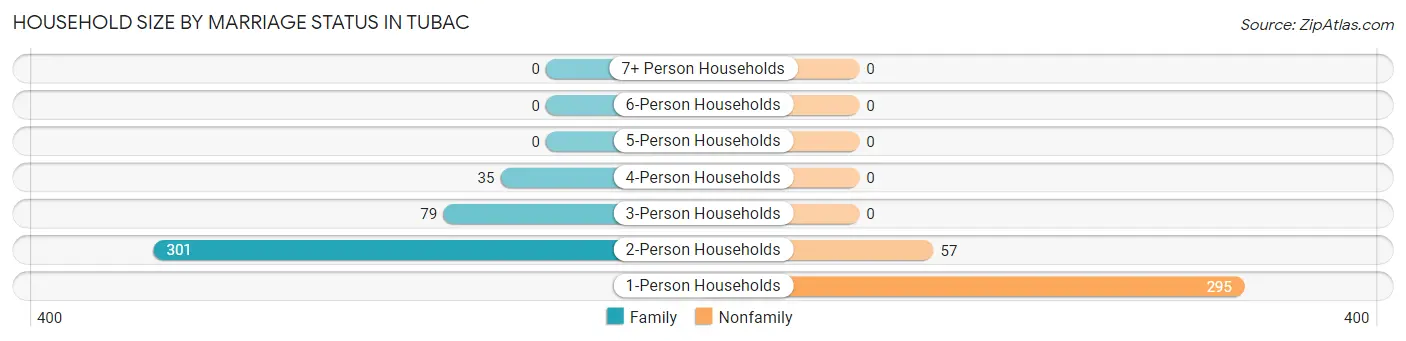
| Household Size | Family Households | Nonfamily Households |
| 1-Person Households | - | 295 (38.5%) |
| 2-Person Households | 301 (39.2%) | 57 (7.4%) |
| 3-Person Households | 79 (10.3%) | 0 (0.0%) |
| 4-Person Households | 35 (4.6%) | 0 (0.0%) |
| 5-Person Households | 0 (0.0%) | 0 (0.0%) |
| 6-Person Households | 0 (0.0%) | 0 (0.0%) |
| 7+ Person Households | 0 (0.0%) | 0 (0.0%) |
| Total | 415 (54.1%) | 352 (45.9%) |
Female Fertility in Tubac
Fertility by Age in Tubac
Average fertility rate in Tubac is 192.0 births per 1,000 women. Women in the age bracket of 20 to 34 years have the highest fertility rate with 242.0 births per 1,000 women. Women in the age bracket of 20 to 34 years acount for 100.0% of all women with births.
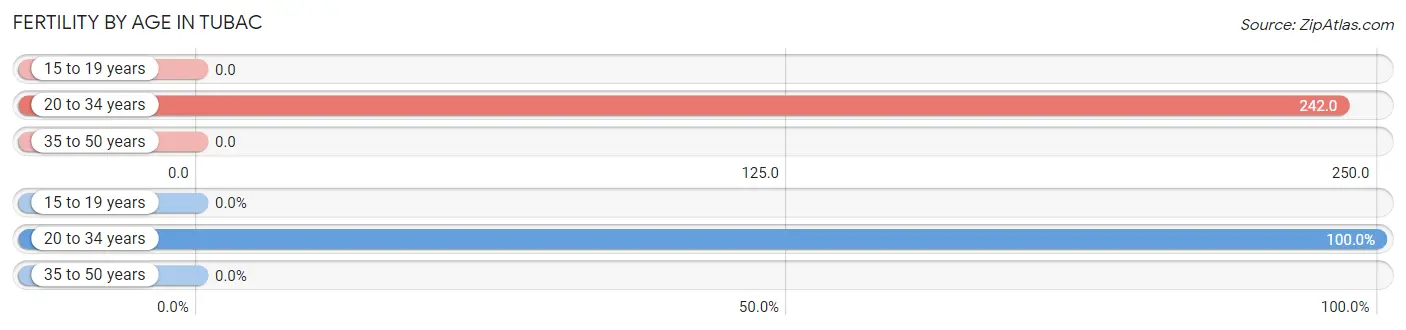
| Age Bracket | Women with Births | Births / 1,000 Women |
| 15 to 19 years | 0 (0.0%) | 0.0 |
| 20 to 34 years | 15 (100.0%) | 242.0 |
| 35 to 50 years | 0 (0.0%) | 0.0 |
| Total | 15 (100.0%) | 192.0 |
Fertility by Age by Marriage Status in Tubac
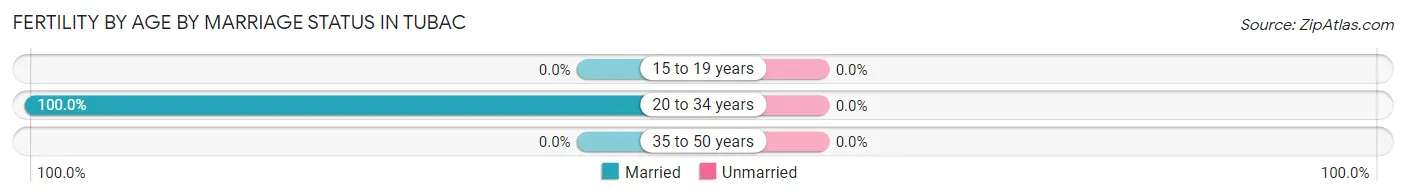
| Age Bracket | Married | Unmarried |
| 15 to 19 years | 0 (0.0%) | 0 (0.0%) |
| 20 to 34 years | 15 (100.0%) | 0 (0.0%) |
| 35 to 50 years | 0 (0.0%) | 0 (0.0%) |
| Total | 15 (100.0%) | 0 (0.0%) |
Fertility by Education in Tubac
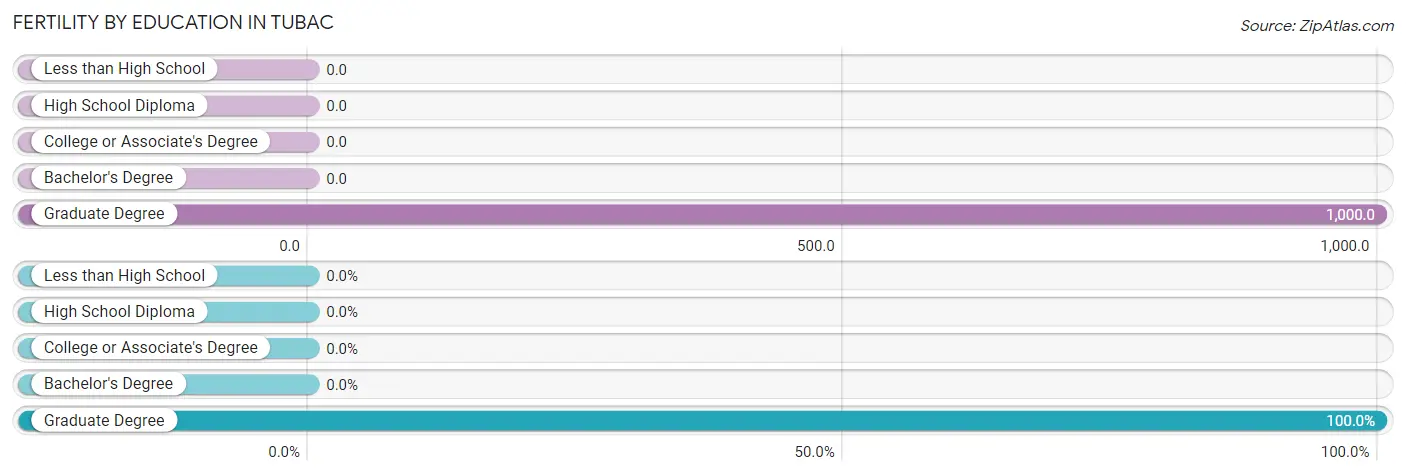
| Educational Attainment | Women with Births | Births / 1,000 Women |
| Less than High School | 0 (0.0%) | 0.0 |
| High School Diploma | 0 (0.0%) | 0.0 |
| College or Associate's Degree | 0 (0.0%) | 0.0 |
| Bachelor's Degree | 0 (0.0%) | 0.0 |
| Graduate Degree | 15 (100.0%) | 1,000.0 |
| Total | 15 (100.0%) | 192.0 |
Fertility by Education by Marriage Status in Tubac
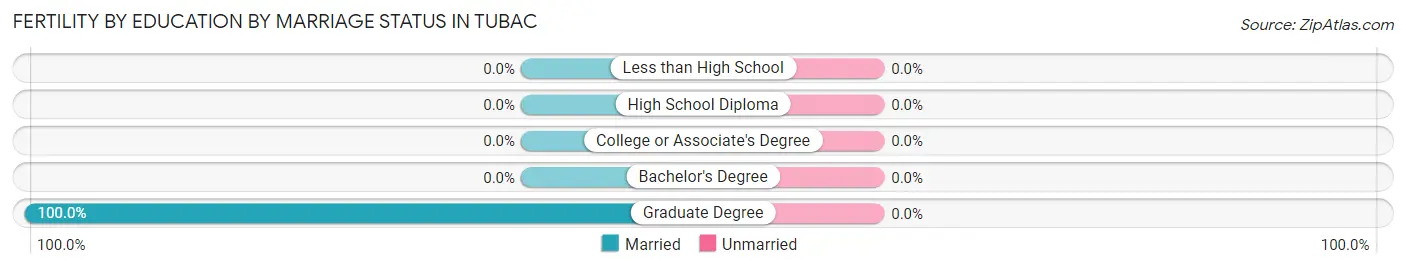
| Educational Attainment | Married | Unmarried |
| Less than High School | 0 (0.0%) | 0 (0.0%) |
| High School Diploma | 0 (0.0%) | 0 (0.0%) |
| College or Associate's Degree | 0 (0.0%) | 0 (0.0%) |
| Bachelor's Degree | 0 (0.0%) | 0 (0.0%) |
| Graduate Degree | 15 (100.0%) | 0 (0.0%) |
| Total | 15 (100.0%) | 0 (0.0%) |
Employment Characteristics in Tubac
Employment by Class of Employer in Tubac
Among the 388 employed individuals in Tubac, private company employees (176 | 45.4%), self-employed (incorporated) (79 | 20.4%), and self-employed (not incorporated) (78 | 20.1%) make up the most common classes of employment.
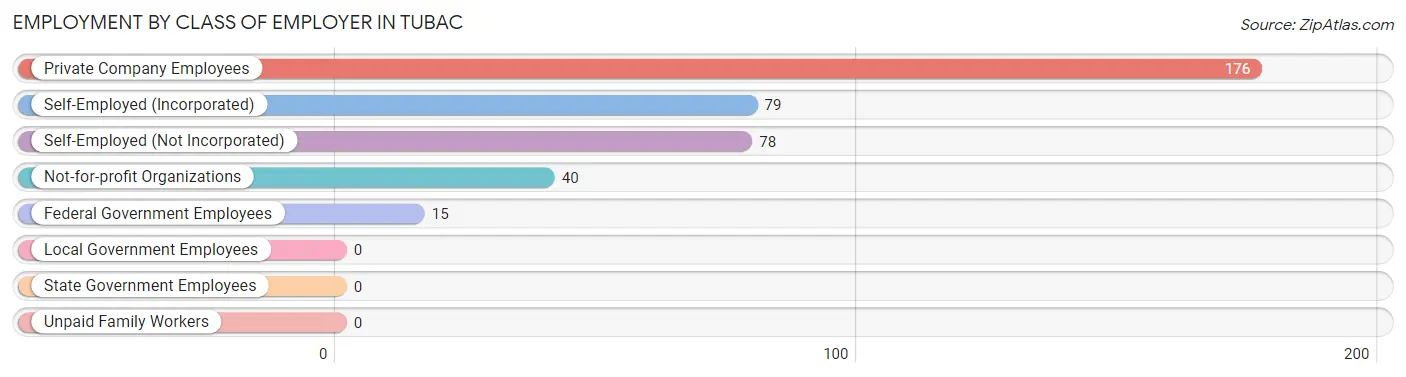
| Employer Class | # Employees | % Employees |
| Private Company Employees | 176 | 45.4% |
| Self-Employed (Incorporated) | 79 | 20.4% |
| Self-Employed (Not Incorporated) | 78 | 20.1% |
| Not-for-profit Organizations | 40 | 10.3% |
| Local Government Employees | 0 | 0.0% |
| State Government Employees | 0 | 0.0% |
| Federal Government Employees | 15 | 3.9% |
| Unpaid Family Workers | 0 | 0.0% |
| Total | 388 | 100.0% |
Employment Status by Age in Tubac
According to the labor force statistics for Tubac, out of the total population over 16 years of age (1,289), 32.0% or 412 individuals are in the labor force, with 3.9% or 16 of them unemployed. The age group with the highest labor force participation rate is 35 to 44 years, with 100.0% or 40 individuals in the labor force. Within the labor force, the 60 to 64 years age range has the highest percentage of unemployed individuals, with 51.6% or 16 of them being unemployed.
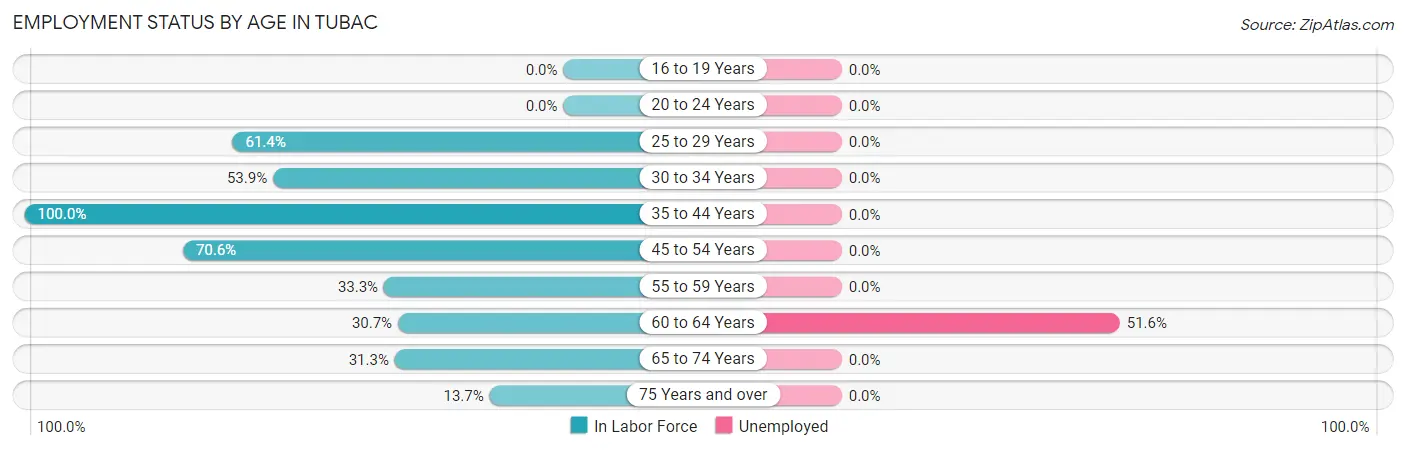
| Age Bracket | In Labor Force | Unemployed |
| 16 to 19 Years | 0 (0.0%) | 0 (0.0%) |
| 20 to 24 Years | 0 (0.0%) | 0 (0.0%) |
| 25 to 29 Years | 27 (61.4%) | 0 (0.0%) |
| 30 to 34 Years | 41 (53.9%) | 0 (0.0%) |
| 35 to 44 Years | 40 (100.0%) | 0 (0.0%) |
| 45 to 54 Years | 48 (70.6%) | 0 (0.0%) |
| 55 to 59 Years | 34 (33.3%) | 0 (0.0%) |
| 60 to 64 Years | 31 (30.7%) | 16 (51.6%) |
| 65 to 74 Years | 135 (31.3%) | 0 (0.0%) |
| 75 Years and over | 56 (13.7%) | 0 (0.0%) |
| Total | 412 (32.0%) | 16 (3.9%) |
Employment Status by Educational Attainment in Tubac
According to labor force statistics for Tubac, 51.3% of individuals (221) out of the total population between 25 and 64 years of age (431) are in the labor force, with 7.2% or 16 of them being unemployed. The group with the highest labor force participation rate are those with the educational attainment of less than high school, with 100.0% or 26 individuals in the labor force. Within the labor force, individuals with bachelor's degree or higher education have the highest percentage of unemployment, with 13.8% or 16 of them being unemployed.
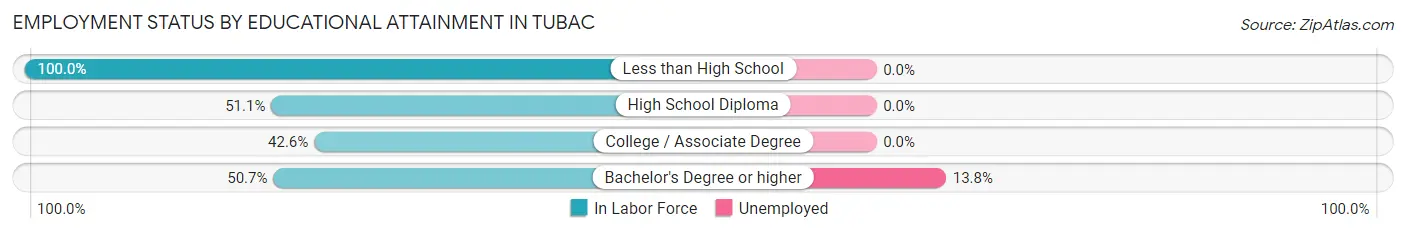
| Educational Attainment | In Labor Force | Unemployed |
| Less than High School | 26 (100.0%) | 0 (0.0%) |
| High School Diploma | 24 (51.1%) | 0 (0.0%) |
| College / Associate Degree | 55 (42.6%) | 0 (0.0%) |
| Bachelor's Degree or higher | 116 (50.7%) | 32 (13.8%) |
| Total | 221 (51.3%) | 31 (7.2%) |
Employment Occupations by Sex in Tubac
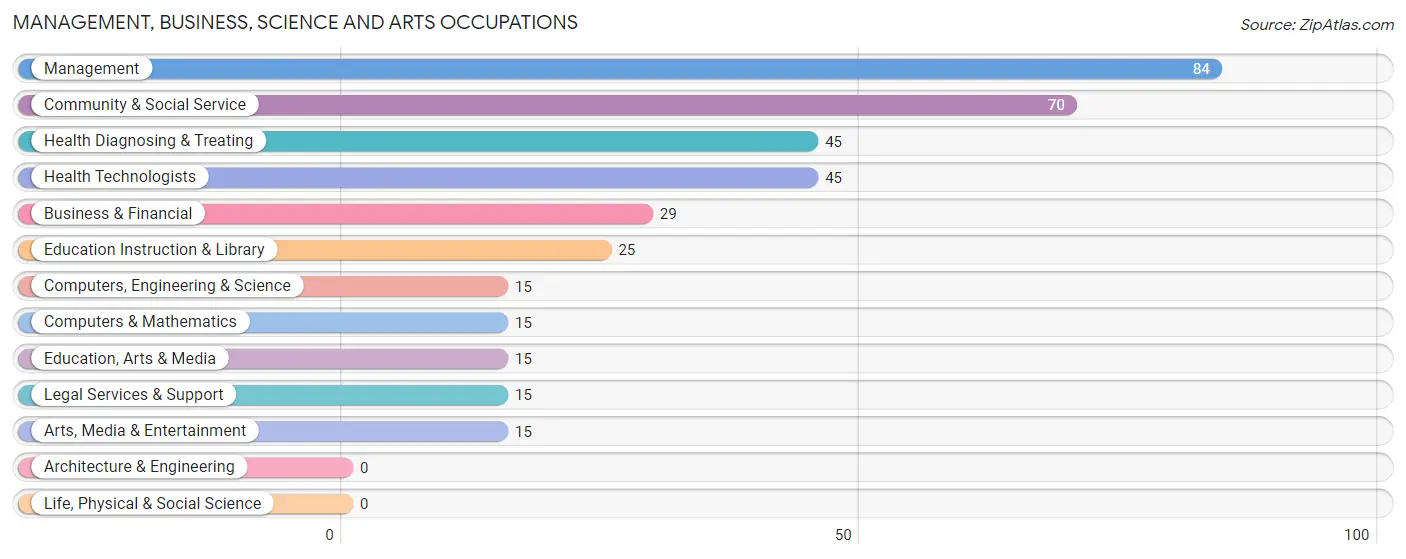
Management, Business, Science and Arts Occupations
The most common Management, Business, Science and Arts occupations in Tubac are Management (84 | 21.2%), Community & Social Service (70 | 17.7%), Health Diagnosing & Treating (45 | 11.4%), Health Technologists (45 | 11.4%), and Business & Financial (29 | 7.3%).
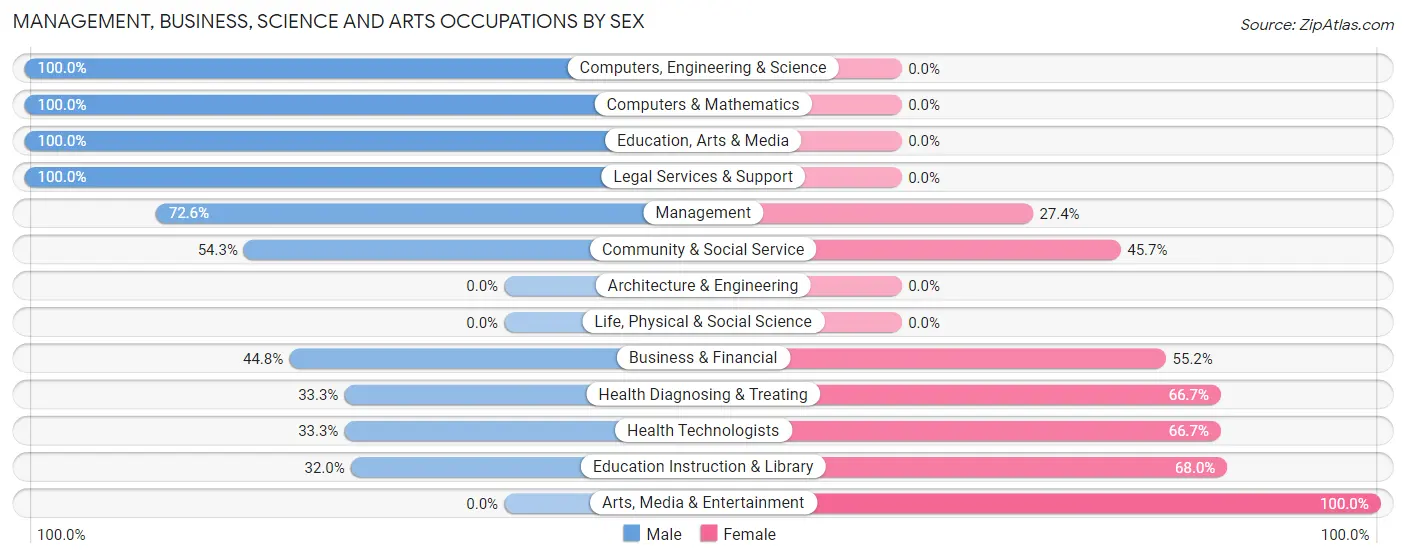
Management, Business, Science and Arts Occupations by Sex
Within the Management, Business, Science and Arts occupations in Tubac, the most male-oriented occupations are Computers, Engineering & Science (100.0%), Computers & Mathematics (100.0%), and Education, Arts & Media (100.0%), while the most female-oriented occupations are Arts, Media & Entertainment (100.0%), Education Instruction & Library (68.0%), and Health Diagnosing & Treating (66.7%).
| Occupation | Male | Female |
| Management | 61 (72.6%) | 23 (27.4%) |
| Business & Financial | 13 (44.8%) | 16 (55.2%) |
| Computers, Engineering & Science | 15 (100.0%) | 0 (0.0%) |
| Computers & Mathematics | 15 (100.0%) | 0 (0.0%) |
| Architecture & Engineering | 0 (0.0%) | 0 (0.0%) |
| Life, Physical & Social Science | 0 (0.0%) | 0 (0.0%) |
| Community & Social Service | 38 (54.3%) | 32 (45.7%) |
| Education, Arts & Media | 15 (100.0%) | 0 (0.0%) |
| Legal Services & Support | 15 (100.0%) | 0 (0.0%) |
| Education Instruction & Library | 8 (32.0%) | 17 (68.0%) |
| Arts, Media & Entertainment | 0 (0.0%) | 15 (100.0%) |
| Health Diagnosing & Treating | 15 (33.3%) | 30 (66.7%) |
| Health Technologists | 15 (33.3%) | 30 (66.7%) |
| Total (Category) | 142 (58.4%) | 101 (41.6%) |
| Total (Overall) | 252 (63.6%) | 144 (36.4%) |
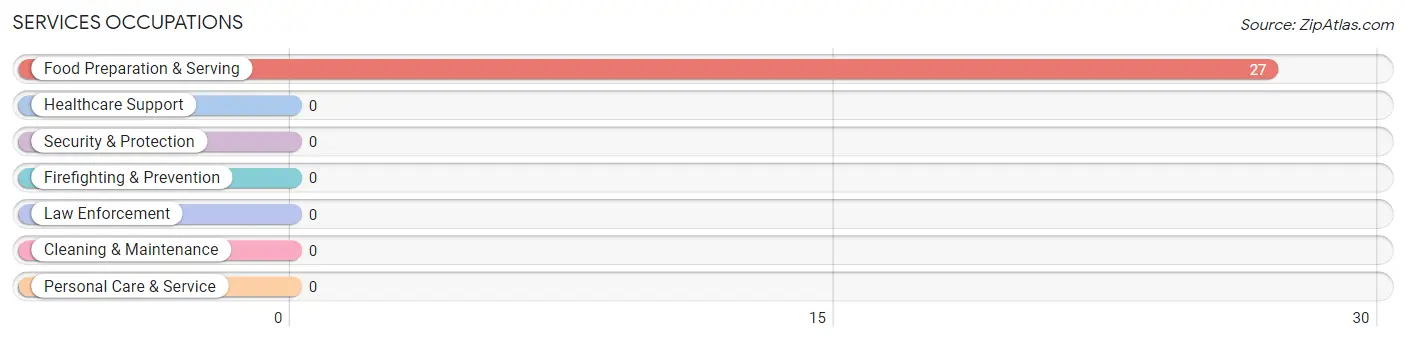
Services Occupations
The most common Services occupations in Tubac are , and Food Preparation & Serving (27 | 6.8%).
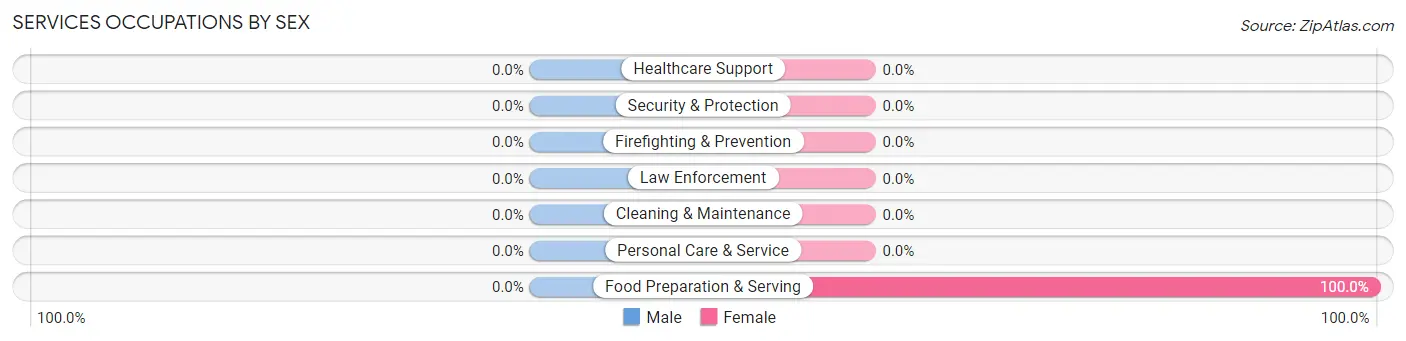
Services Occupations by Sex
| Occupation | Male | Female |
| Healthcare Support | 0 (0.0%) | 0 (0.0%) |
| Security & Protection | 0 (0.0%) | 0 (0.0%) |
| Firefighting & Prevention | 0 (0.0%) | 0 (0.0%) |
| Law Enforcement | 0 (0.0%) | 0 (0.0%) |
| Food Preparation & Serving | 0 (0.0%) | 27 (100.0%) |
| Cleaning & Maintenance | 0 (0.0%) | 0 (0.0%) |
| Personal Care & Service | 0 (0.0%) | 0 (0.0%) |
| Total (Category) | 0 (0.0%) | 27 (100.0%) |
| Total (Overall) | 252 (63.6%) | 144 (36.4%) |
Sales and Office Occupations
The most common Sales and Office occupations in Tubac are Sales & Related (74 | 18.7%), and Office & Administration (15 | 3.8%).
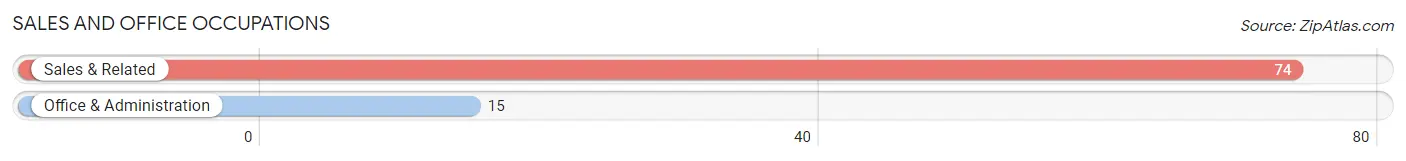
Sales and Office Occupations by Sex

| Occupation | Male | Female |
| Sales & Related | 58 (78.4%) | 16 (21.6%) |
| Office & Administration | 15 (100.0%) | 0 (0.0%) |
| Total (Category) | 73 (82.0%) | 16 (18.0%) |
| Total (Overall) | 252 (63.6%) | 144 (36.4%) |
Natural Resources, Construction and Maintenance Occupations
The most common Natural Resources, Construction and Maintenance occupations in Tubac are , and Construction & Extraction (37 | 9.3%).
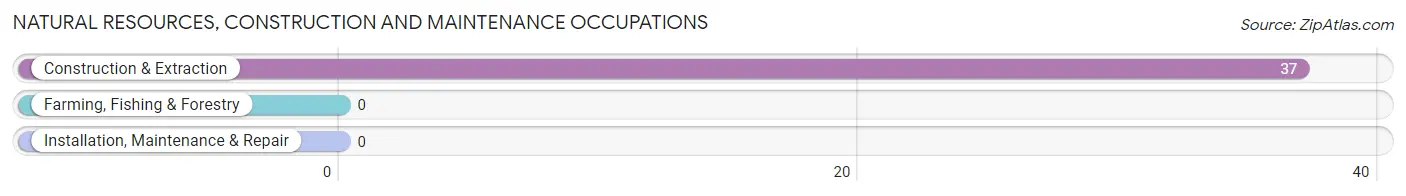
Natural Resources, Construction and Maintenance Occupations by Sex
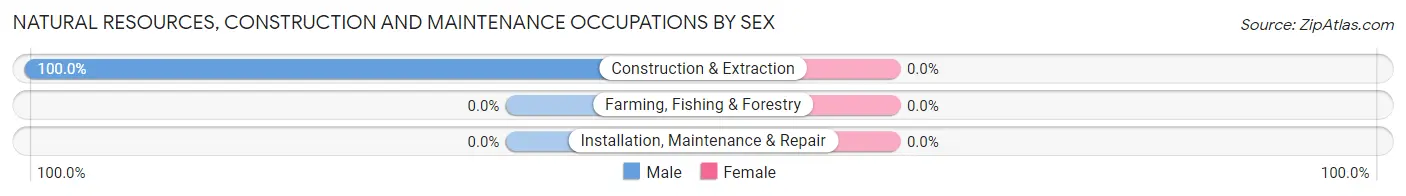
| Occupation | Male | Female |
| Farming, Fishing & Forestry | 0 (0.0%) | 0 (0.0%) |
| Construction & Extraction | 37 (100.0%) | 0 (0.0%) |
| Installation, Maintenance & Repair | 0 (0.0%) | 0 (0.0%) |
| Total (Category) | 37 (100.0%) | 0 (0.0%) |
| Total (Overall) | 252 (63.6%) | 144 (36.4%) |
Production, Transportation and Moving Occupations
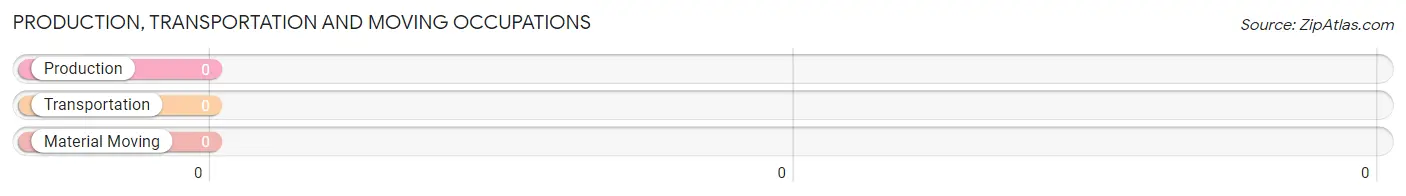
Production, Transportation and Moving Occupations by Sex
| Occupation | Male | Female |
| Production | 0 (0.0%) | 0 (0.0%) |
| Transportation | 0 (0.0%) | 0 (0.0%) |
| Material Moving | 0 (0.0%) | 0 (0.0%) |
| Total (Category) | 0 (0.0%) | 0 (0.0%) |
| Total (Overall) | 252 (63.6%) | 144 (36.4%) |
Employment Industries by Sex in Tubac
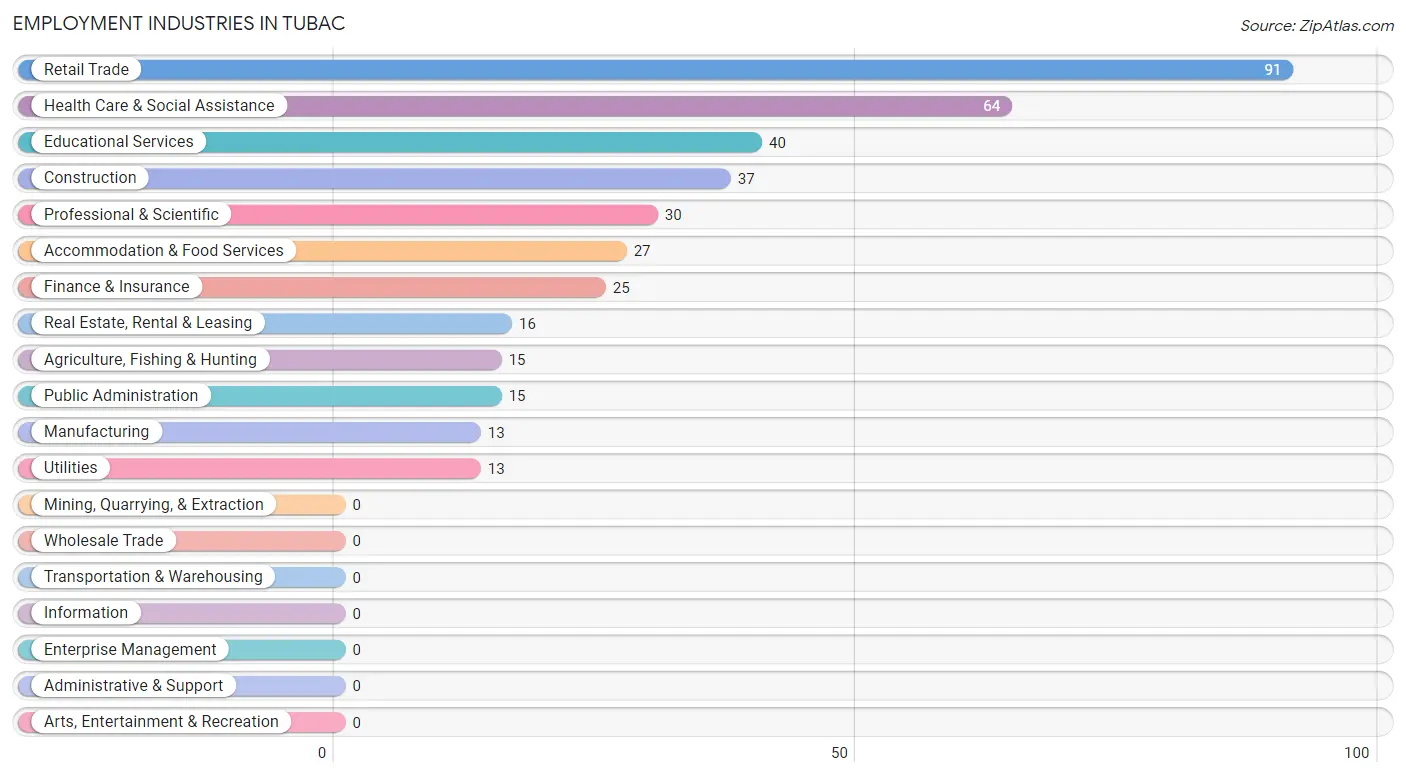
Employment Industries in Tubac
The major employment industries in Tubac include Retail Trade (91 | 23.0%), Health Care & Social Assistance (64 | 16.2%), Educational Services (40 | 10.1%), Construction (37 | 9.3%), and Professional & Scientific (30 | 7.6%).
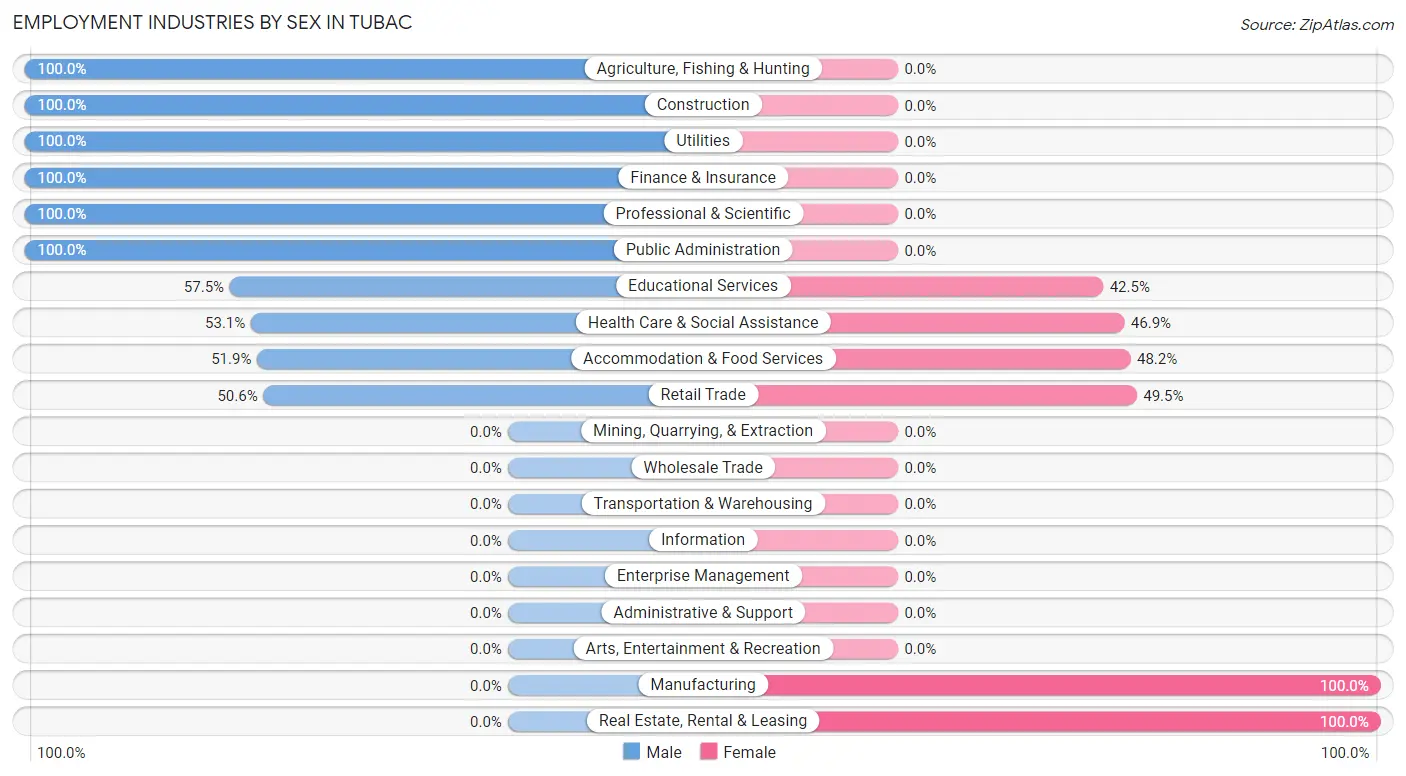
Employment Industries by Sex in Tubac
The Tubac industries that see more men than women are Agriculture, Fishing & Hunting (100.0%), Construction (100.0%), and Utilities (100.0%), whereas the industries that tend to have a higher number of women are Manufacturing (100.0%), Real Estate, Rental & Leasing (100.0%), and Retail Trade (49.4%).
| Industry | Male | Female |
| Agriculture, Fishing & Hunting | 15 (100.0%) | 0 (0.0%) |
| Mining, Quarrying, & Extraction | 0 (0.0%) | 0 (0.0%) |
| Construction | 37 (100.0%) | 0 (0.0%) |
| Manufacturing | 0 (0.0%) | 13 (100.0%) |
| Wholesale Trade | 0 (0.0%) | 0 (0.0%) |
| Retail Trade | 46 (50.5%) | 45 (49.4%) |
| Transportation & Warehousing | 0 (0.0%) | 0 (0.0%) |
| Utilities | 13 (100.0%) | 0 (0.0%) |
| Information | 0 (0.0%) | 0 (0.0%) |
| Finance & Insurance | 25 (100.0%) | 0 (0.0%) |
| Real Estate, Rental & Leasing | 0 (0.0%) | 16 (100.0%) |
| Professional & Scientific | 30 (100.0%) | 0 (0.0%) |
| Enterprise Management | 0 (0.0%) | 0 (0.0%) |
| Administrative & Support | 0 (0.0%) | 0 (0.0%) |
| Educational Services | 23 (57.5%) | 17 (42.5%) |
| Health Care & Social Assistance | 34 (53.1%) | 30 (46.9%) |
| Arts, Entertainment & Recreation | 0 (0.0%) | 0 (0.0%) |
| Accommodation & Food Services | 14 (51.8%) | 13 (48.1%) |
| Public Administration | 15 (100.0%) | 0 (0.0%) |
| Total | 252 (63.6%) | 144 (36.4%) |
Education in Tubac
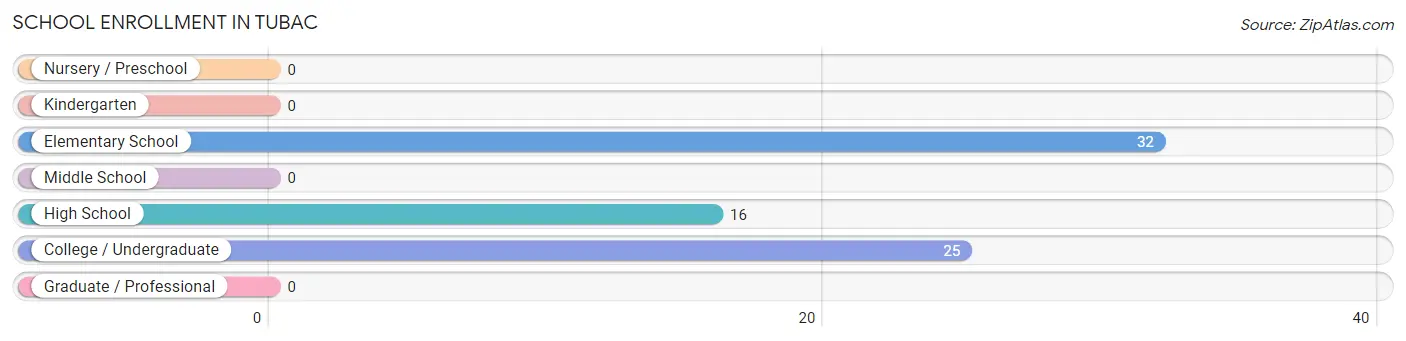
School Enrollment in Tubac
The most common levels of schooling among the 73 students in Tubac are elementary school (32 | 43.8%), college / undergraduate (25 | 34.3%), and high school (16 | 21.9%).
| School Level | # Students | % Students |
| Nursery / Preschool | 0 | 0.0% |
| Kindergarten | 0 | 0.0% |
| Elementary School | 32 | 43.8% |
| Middle School | 0 | 0.0% |
| High School | 16 | 21.9% |
| College / Undergraduate | 25 | 34.3% |
| Graduate / Professional | 0 | 0.0% |
| Total | 73 | 100.0% |
School Enrollment by Age by Funding Source in Tubac
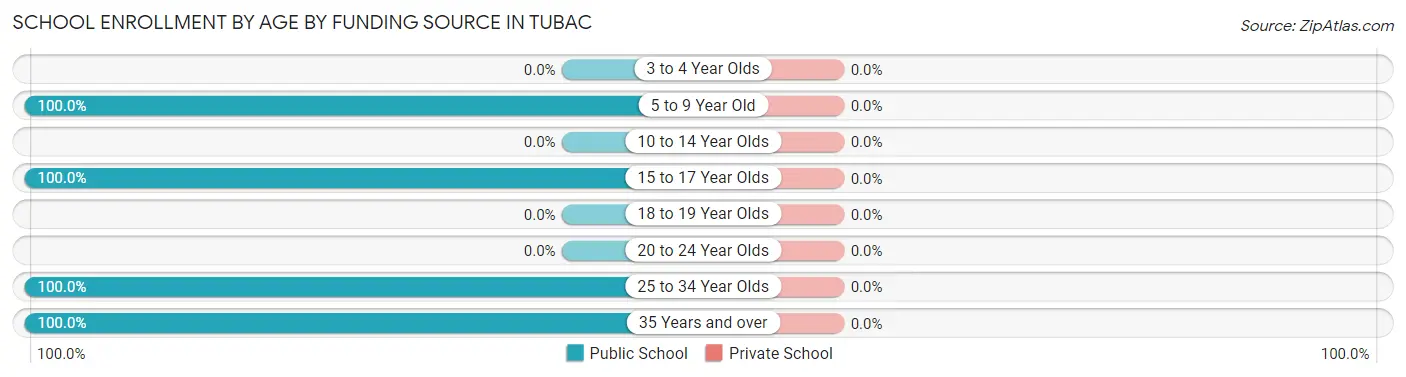
| Age Bracket | Public School | Private School |
| 3 to 4 Year Olds | 0 (0.0%) | 0 (0.0%) |
| 5 to 9 Year Old | 32 (100.0%) | 0 (0.0%) |
| 10 to 14 Year Olds | 0 (0.0%) | 0 (0.0%) |
| 15 to 17 Year Olds | 16 (100.0%) | 0 (0.0%) |
| 18 to 19 Year Olds | 0 (0.0%) | 0 (0.0%) |
| 20 to 24 Year Olds | 0 (0.0%) | 0 (0.0%) |
| 25 to 34 Year Olds | 17 (100.0%) | 0 (0.0%) |
| 35 Years and over | 8 (100.0%) | 0 (0.0%) |
| Total | 73 (100.0%) | 0 (0.0%) |
Educational Attainment by Field of Study in Tubac
Business (146 | 19.7%), bio, nature & agricultural (106 | 14.3%), psychology (98 | 13.2%), education (93 | 12.5%), and social sciences (45 | 6.1%) are the most common fields of study among 742 individuals in Tubac who have obtained a bachelor's degree or higher.
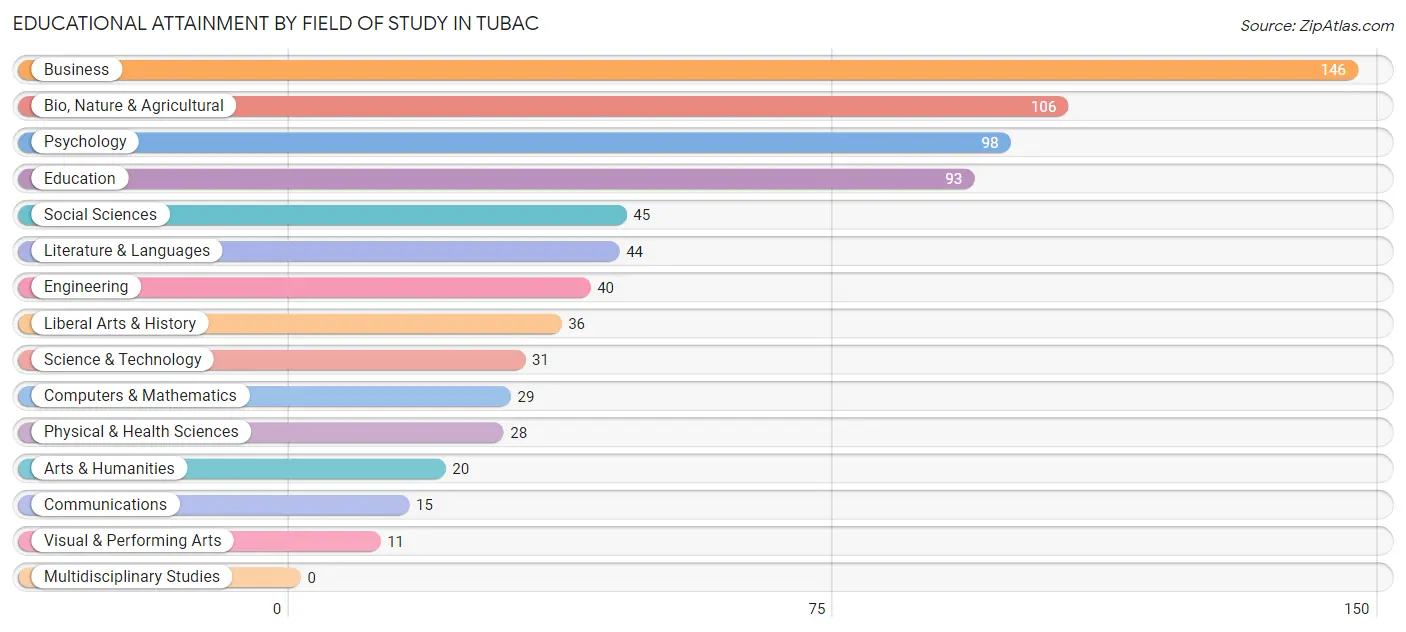
| Field of Study | # Graduates | % Graduates |
| Computers & Mathematics | 29 | 3.9% |
| Bio, Nature & Agricultural | 106 | 14.3% |
| Physical & Health Sciences | 28 | 3.8% |
| Psychology | 98 | 13.2% |
| Social Sciences | 45 | 6.1% |
| Engineering | 40 | 5.4% |
| Multidisciplinary Studies | 0 | 0.0% |
| Science & Technology | 31 | 4.2% |
| Business | 146 | 19.7% |
| Education | 93 | 12.5% |
| Literature & Languages | 44 | 5.9% |
| Liberal Arts & History | 36 | 4.9% |
| Visual & Performing Arts | 11 | 1.5% |
| Communications | 15 | 2.0% |
| Arts & Humanities | 20 | 2.7% |
| Total | 742 | 100.0% |
Transportation & Commute in Tubac
Vehicle Availability by Sex in Tubac
The most prevalent vehicle ownership categories in Tubac are males with 2 vehicles (103, accounting for 42.2%) and females with 2 vehicles (76, making up 71.5%).
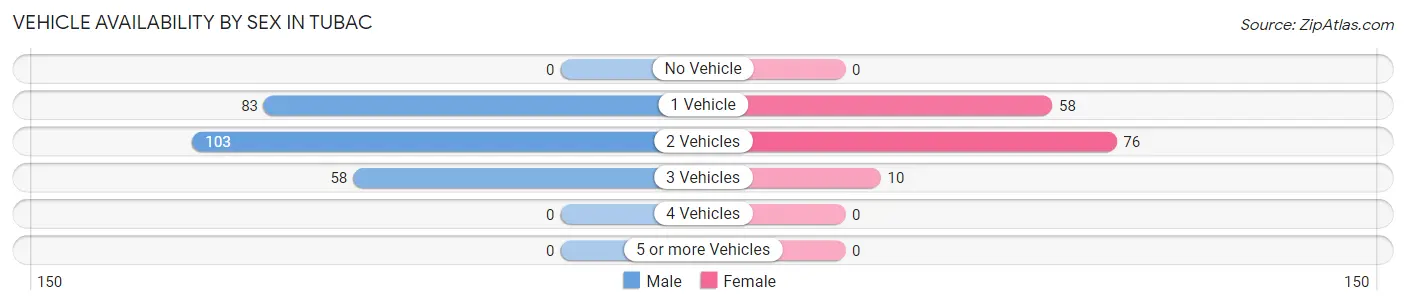
| Vehicles Available | Male | Female |
| No Vehicle | 0 (0.0%) | 0 (0.0%) |
| 1 Vehicle | 83 (34.0%) | 58 (40.3%) |
| 2 Vehicles | 103 (42.2%) | 76 (52.8%) |
| 3 Vehicles | 58 (23.8%) | 10 (6.9%) |
| 4 Vehicles | 0 (0.0%) | 0 (0.0%) |
| 5 or more Vehicles | 0 (0.0%) | 0 (0.0%) |
| Total | 244 (100.0%) | 144 (100.0%) |
Commute Time in Tubac
The most frequently occuring commute durations in Tubac are 20 to 24 minutes (105 commuters, 31.5%), 25 to 29 minutes (72 commuters, 21.6%), and 45 to 59 minutes (60 commuters, 18.0%).
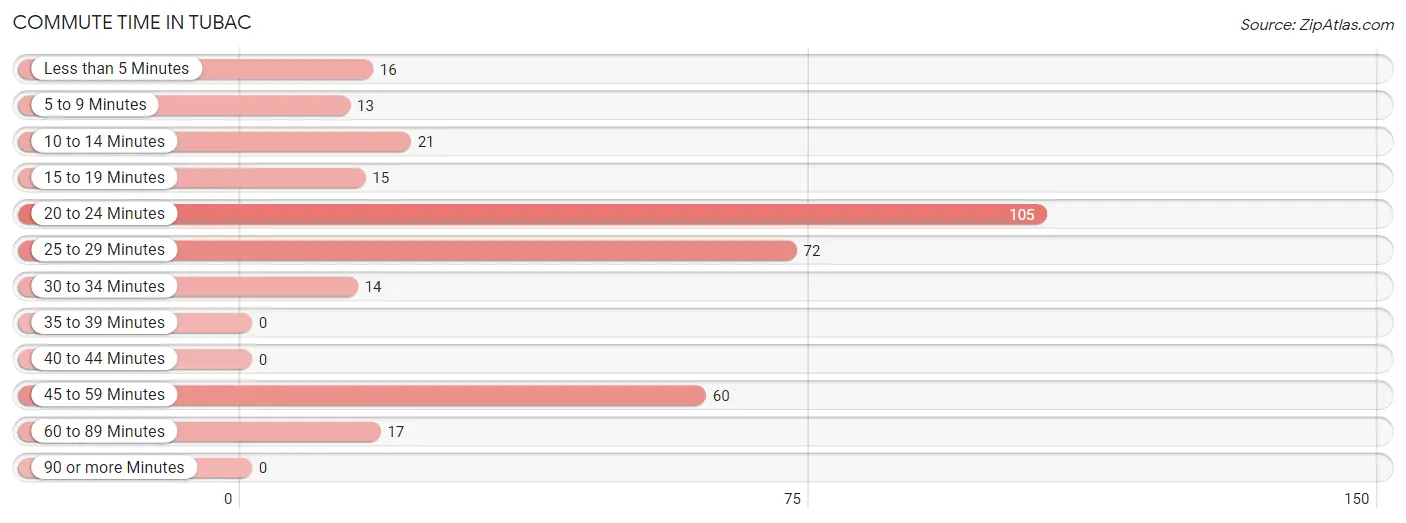
| Commute Time | # Commuters | % Commuters |
| Less than 5 Minutes | 16 | 4.8% |
| 5 to 9 Minutes | 13 | 3.9% |
| 10 to 14 Minutes | 21 | 6.3% |
| 15 to 19 Minutes | 15 | 4.5% |
| 20 to 24 Minutes | 105 | 31.5% |
| 25 to 29 Minutes | 72 | 21.6% |
| 30 to 34 Minutes | 14 | 4.2% |
| 35 to 39 Minutes | 0 | 0.0% |
| 40 to 44 Minutes | 0 | 0.0% |
| 45 to 59 Minutes | 60 | 18.0% |
| 60 to 89 Minutes | 17 | 5.1% |
| 90 or more Minutes | 0 | 0.0% |
Commute Time by Sex in Tubac
The most common commute times in Tubac are 25 to 29 minutes (58 commuters, 30.7%) for males and 20 to 24 minutes (61 commuters, 42.4%) for females.
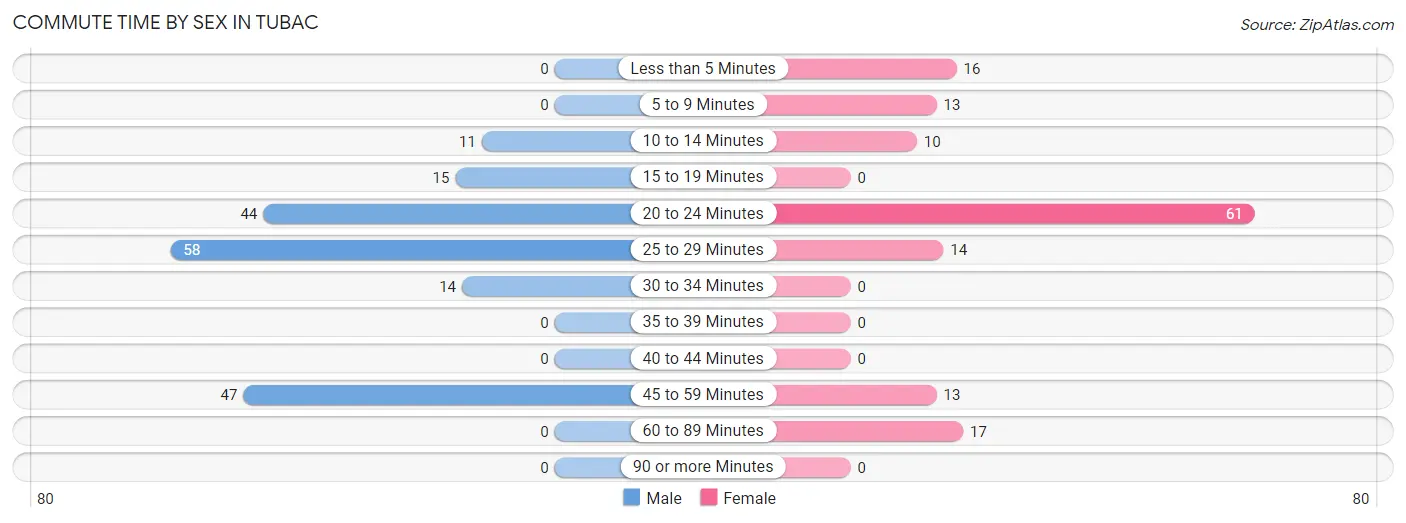
| Commute Time | Male | Female |
| Less than 5 Minutes | 0 (0.0%) | 16 (11.1%) |
| 5 to 9 Minutes | 0 (0.0%) | 13 (9.0%) |
| 10 to 14 Minutes | 11 (5.8%) | 10 (6.9%) |
| 15 to 19 Minutes | 15 (7.9%) | 0 (0.0%) |
| 20 to 24 Minutes | 44 (23.3%) | 61 (42.4%) |
| 25 to 29 Minutes | 58 (30.7%) | 14 (9.7%) |
| 30 to 34 Minutes | 14 (7.4%) | 0 (0.0%) |
| 35 to 39 Minutes | 0 (0.0%) | 0 (0.0%) |
| 40 to 44 Minutes | 0 (0.0%) | 0 (0.0%) |
| 45 to 59 Minutes | 47 (24.9%) | 13 (9.0%) |
| 60 to 89 Minutes | 0 (0.0%) | 17 (11.8%) |
| 90 or more Minutes | 0 (0.0%) | 0 (0.0%) |
Time of Departure to Work by Sex in Tubac
The most frequent times of departure to work in Tubac are 7:30 AM to 7:59 AM (50, 26.5%) for males and 7:30 AM to 7:59 AM (31, 21.5%) for females.
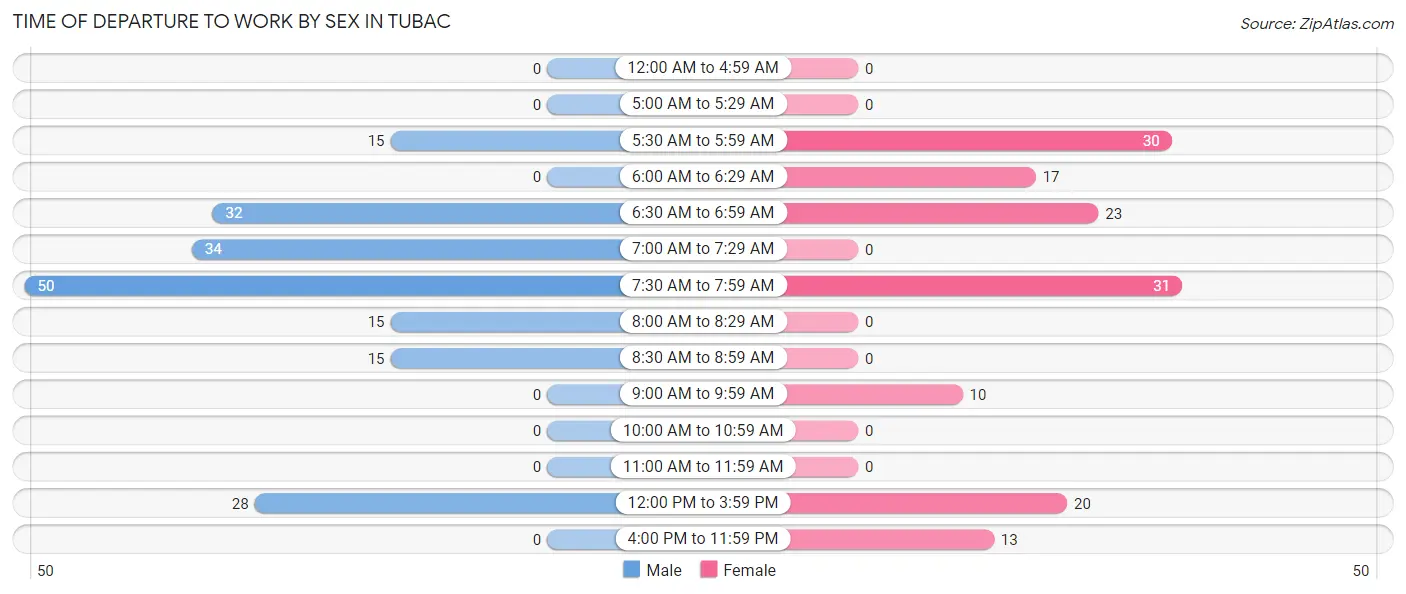
| Time of Departure | Male | Female |
| 12:00 AM to 4:59 AM | 0 (0.0%) | 0 (0.0%) |
| 5:00 AM to 5:29 AM | 0 (0.0%) | 0 (0.0%) |
| 5:30 AM to 5:59 AM | 15 (7.9%) | 30 (20.8%) |
| 6:00 AM to 6:29 AM | 0 (0.0%) | 17 (11.8%) |
| 6:30 AM to 6:59 AM | 32 (16.9%) | 23 (16.0%) |
| 7:00 AM to 7:29 AM | 34 (18.0%) | 0 (0.0%) |
| 7:30 AM to 7:59 AM | 50 (26.5%) | 31 (21.5%) |
| 8:00 AM to 8:29 AM | 15 (7.9%) | 0 (0.0%) |
| 8:30 AM to 8:59 AM | 15 (7.9%) | 0 (0.0%) |
| 9:00 AM to 9:59 AM | 0 (0.0%) | 10 (6.9%) |
| 10:00 AM to 10:59 AM | 0 (0.0%) | 0 (0.0%) |
| 11:00 AM to 11:59 AM | 0 (0.0%) | 0 (0.0%) |
| 12:00 PM to 3:59 PM | 28 (14.8%) | 20 (13.9%) |
| 4:00 PM to 11:59 PM | 0 (0.0%) | 13 (9.0%) |
| Total | 189 (100.0%) | 144 (100.0%) |
Housing Occupancy in Tubac
Occupancy by Ownership in Tubac
Of the total 767 dwellings in Tubac, owner-occupied units account for 654 (85.3%), while renter-occupied units make up 113 (14.7%).
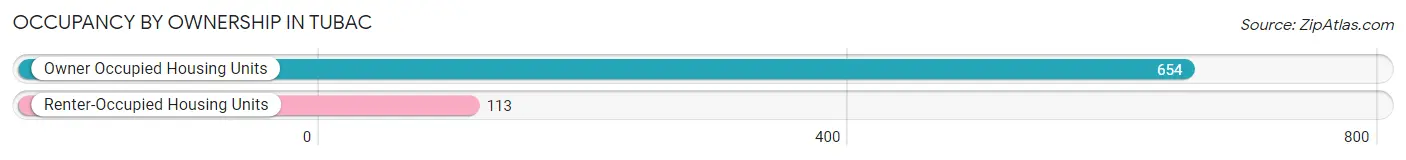
| Occupancy | # Housing Units | % Housing Units |
| Owner Occupied Housing Units | 654 | 85.3% |
| Renter-Occupied Housing Units | 113 | 14.7% |
| Total Occupied Housing Units | 767 | 100.0% |
Occupancy by Household Size in Tubac
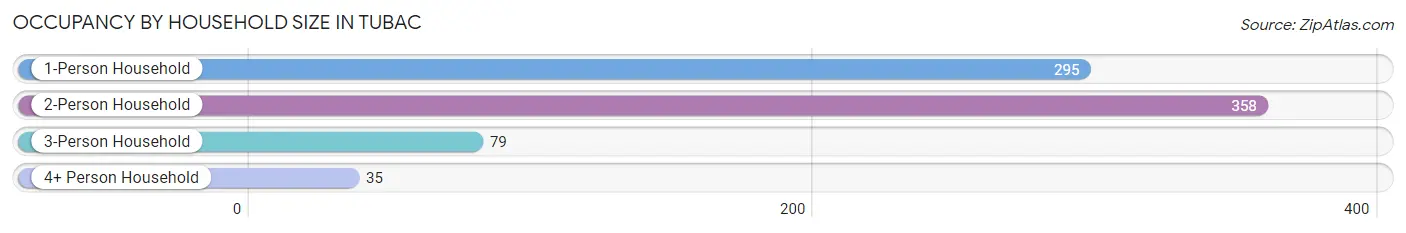
| Household Size | # Housing Units | % Housing Units |
| 1-Person Household | 295 | 38.5% |
| 2-Person Household | 358 | 46.7% |
| 3-Person Household | 79 | 10.3% |
| 4+ Person Household | 35 | 4.6% |
| Total Housing Units | 767 | 100.0% |
Occupancy by Ownership by Household Size in Tubac
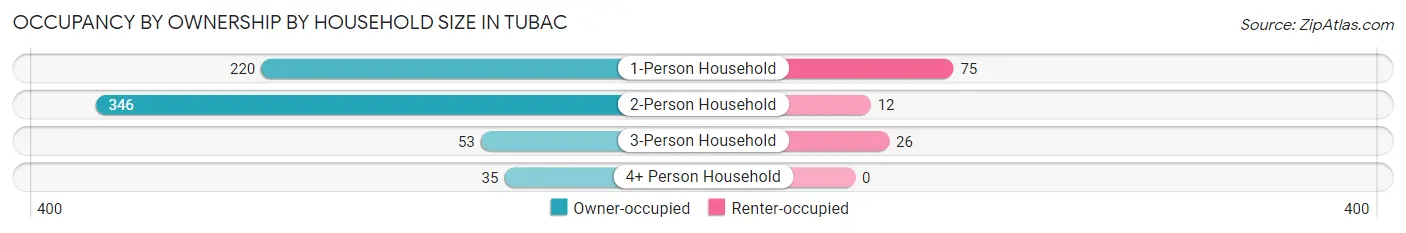
| Household Size | Owner-occupied | Renter-occupied |
| 1-Person Household | 220 (74.6%) | 75 (25.4%) |
| 2-Person Household | 346 (96.7%) | 12 (3.4%) |
| 3-Person Household | 53 (67.1%) | 26 (32.9%) |
| 4+ Person Household | 35 (100.0%) | 0 (0.0%) |
| Total Housing Units | 654 (85.3%) | 113 (14.7%) |
Occupancy by Educational Attainment in Tubac
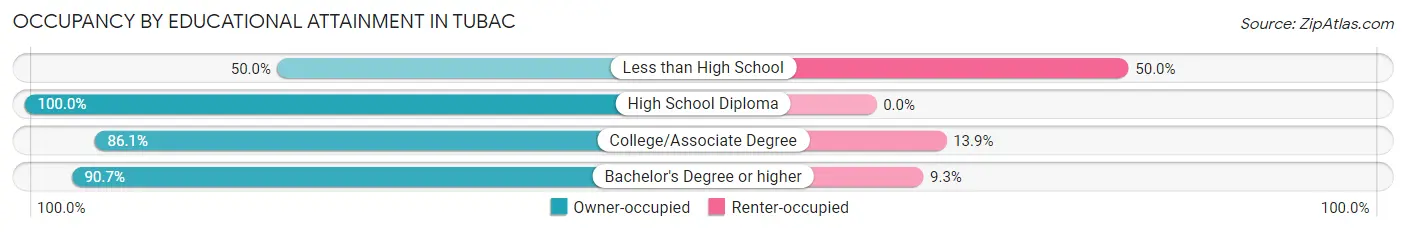
| Household Size | Owner-occupied | Renter-occupied |
| Less than High School | 43 (50.0%) | 43 (50.0%) |
| High School Diploma | 17 (100.0%) | 0 (0.0%) |
| College/Associate Degree | 155 (86.1%) | 25 (13.9%) |
| Bachelor's Degree or higher | 439 (90.7%) | 45 (9.3%) |
Occupancy by Age of Householder in Tubac
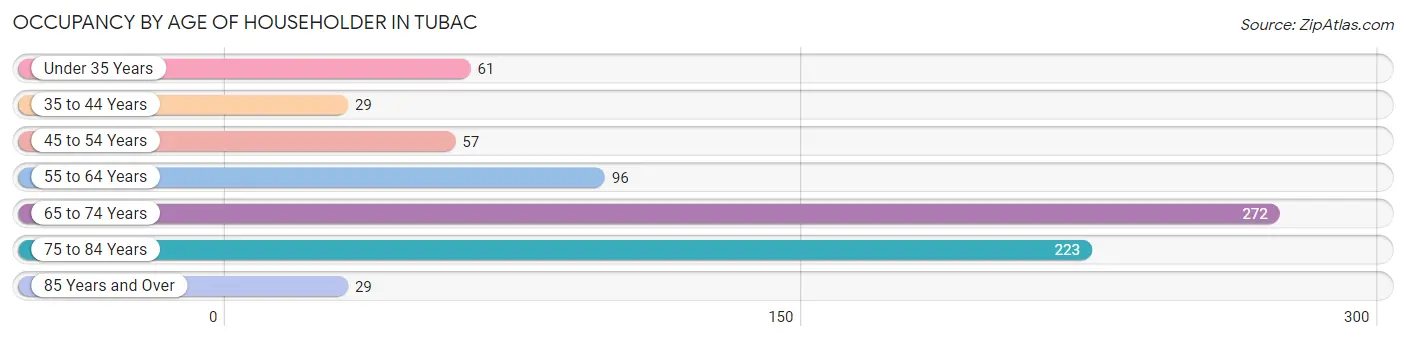
| Age Bracket | # Households | % Households |
| Under 35 Years | 61 | 8.0% |
| 35 to 44 Years | 29 | 3.8% |
| 45 to 54 Years | 57 | 7.4% |
| 55 to 64 Years | 96 | 12.5% |
| 65 to 74 Years | 272 | 35.5% |
| 75 to 84 Years | 223 | 29.1% |
| 85 Years and Over | 29 | 3.8% |
| Total | 767 | 100.0% |
Housing Finances in Tubac
Median Income by Occupancy in Tubac
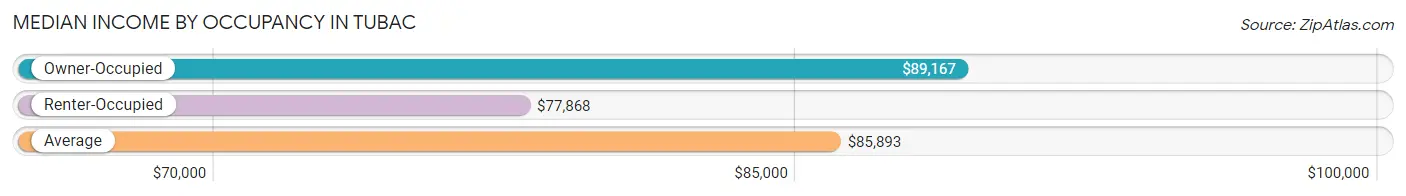
| Occupancy Type | # Households | Median Income |
| Owner-Occupied | 654 (85.3%) | $89,167 |
| Renter-Occupied | 113 (14.7%) | $77,868 |
| Average | 767 (100.0%) | $85,893 |
Occupancy by Householder Income Bracket in Tubac
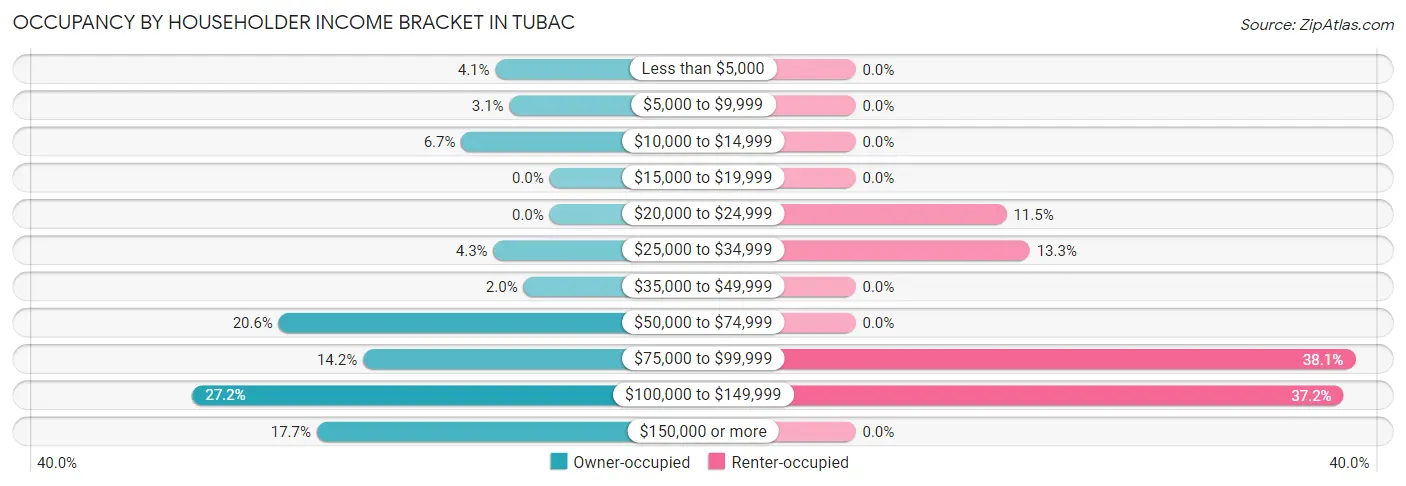
| Income Bracket | Owner-occupied | Renter-occupied |
| Less than $5,000 | 27 (4.1%) | 0 (0.0%) |
| $5,000 to $9,999 | 20 (3.1%) | 0 (0.0%) |
| $10,000 to $14,999 | 44 (6.7%) | 0 (0.0%) |
| $15,000 to $19,999 | 0 (0.0%) | 0 (0.0%) |
| $20,000 to $24,999 | 0 (0.0%) | 13 (11.5%) |
| $25,000 to $34,999 | 28 (4.3%) | 15 (13.3%) |
| $35,000 to $49,999 | 13 (2.0%) | 0 (0.0%) |
| $50,000 to $74,999 | 135 (20.6%) | 0 (0.0%) |
| $75,000 to $99,999 | 93 (14.2%) | 43 (38.1%) |
| $100,000 to $149,999 | 178 (27.2%) | 42 (37.2%) |
| $150,000 or more | 116 (17.7%) | 0 (0.0%) |
| Total | 654 (100.0%) | 113 (100.0%) |
Monthly Housing Cost Tiers in Tubac
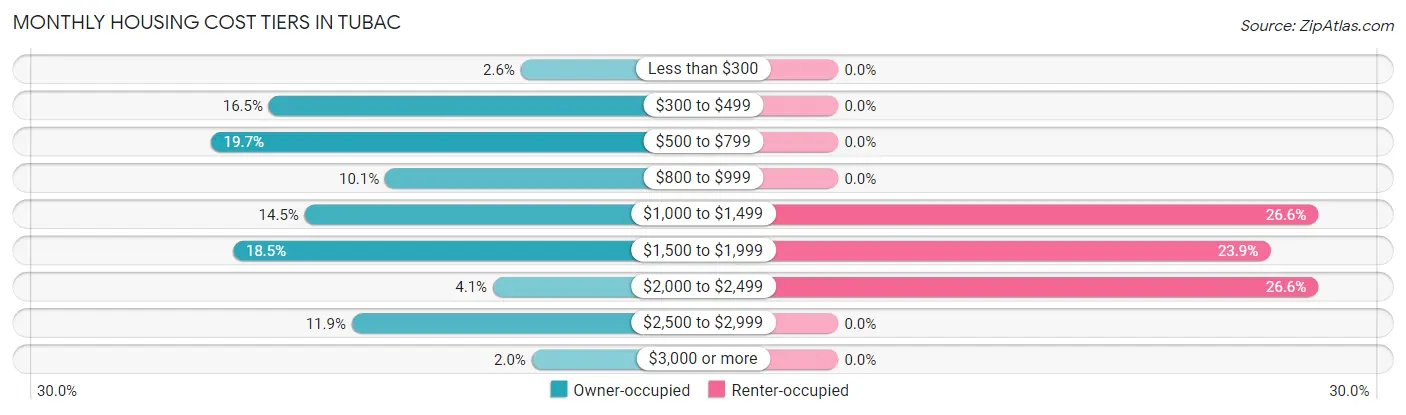
| Monthly Cost | Owner-occupied | Renter-occupied |
| Less than $300 | 17 (2.6%) | 0 (0.0%) |
| $300 to $499 | 108 (16.5%) | 0 (0.0%) |
| $500 to $799 | 129 (19.7%) | 0 (0.0%) |
| $800 to $999 | 66 (10.1%) | 0 (0.0%) |
| $1,000 to $1,499 | 95 (14.5%) | 30 (26.6%) |
| $1,500 to $1,999 | 121 (18.5%) | 27 (23.9%) |
| $2,000 to $2,499 | 27 (4.1%) | 30 (26.6%) |
| $2,500 to $2,999 | 78 (11.9%) | 0 (0.0%) |
| $3,000 or more | 13 (2.0%) | 0 (0.0%) |
| Total | 654 (100.0%) | 113 (100.0%) |
Physical Housing Characteristics in Tubac
Housing Structures in Tubac
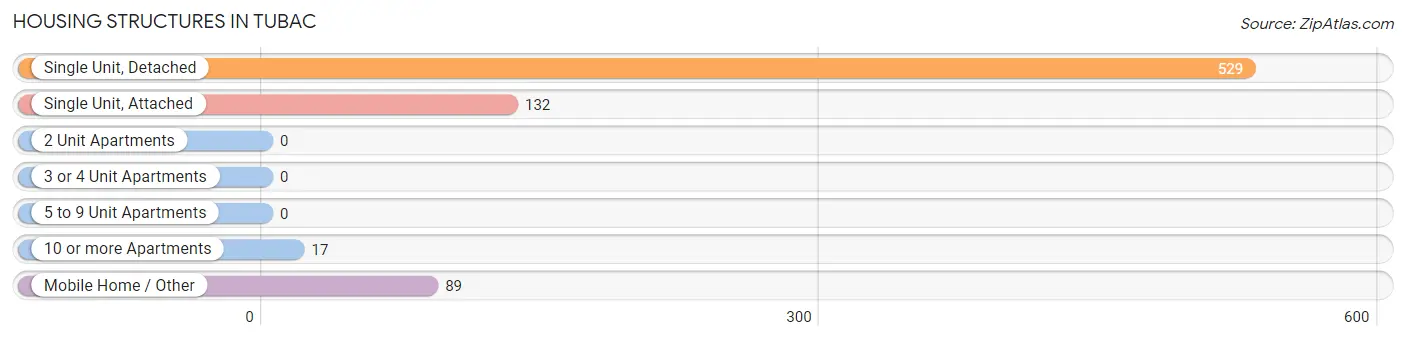
| Structure Type | # Housing Units | % Housing Units |
| Single Unit, Detached | 529 | 69.0% |
| Single Unit, Attached | 132 | 17.2% |
| 2 Unit Apartments | 0 | 0.0% |
| 3 or 4 Unit Apartments | 0 | 0.0% |
| 5 to 9 Unit Apartments | 0 | 0.0% |
| 10 or more Apartments | 17 | 2.2% |
| Mobile Home / Other | 89 | 11.6% |
| Total | 767 | 100.0% |
Housing Structures by Occupancy in Tubac
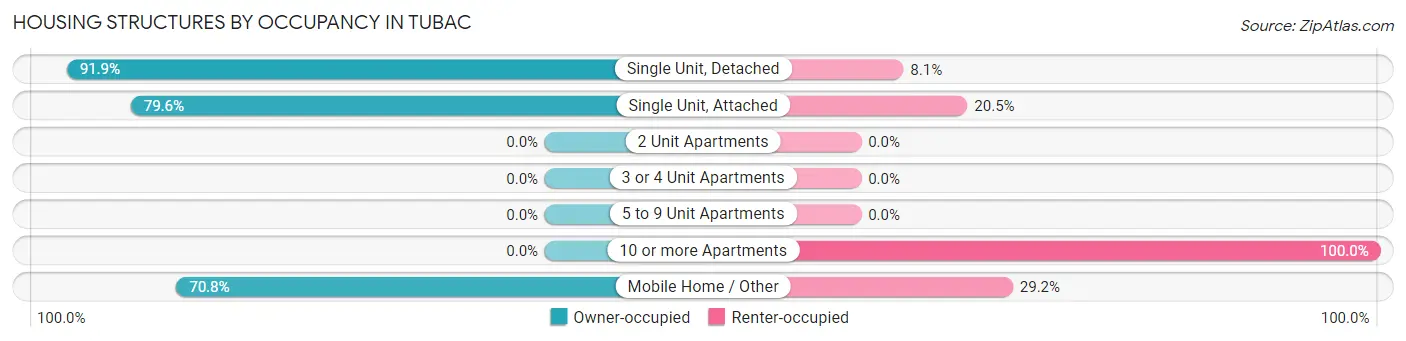
| Structure Type | Owner-occupied | Renter-occupied |
| Single Unit, Detached | 486 (91.9%) | 43 (8.1%) |
| Single Unit, Attached | 105 (79.5%) | 27 (20.4%) |
| 2 Unit Apartments | 0 (0.0%) | 0 (0.0%) |
| 3 or 4 Unit Apartments | 0 (0.0%) | 0 (0.0%) |
| 5 to 9 Unit Apartments | 0 (0.0%) | 0 (0.0%) |
| 10 or more Apartments | 0 (0.0%) | 17 (100.0%) |
| Mobile Home / Other | 63 (70.8%) | 26 (29.2%) |
| Total | 654 (85.3%) | 113 (14.7%) |
Housing Structures by Number of Rooms in Tubac
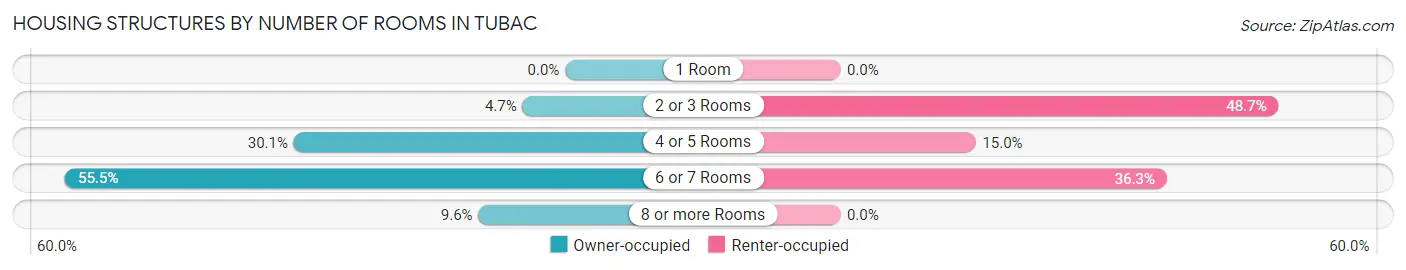
| Number of Rooms | Owner-occupied | Renter-occupied |
| 1 Room | 0 (0.0%) | 0 (0.0%) |
| 2 or 3 Rooms | 31 (4.7%) | 55 (48.7%) |
| 4 or 5 Rooms | 197 (30.1%) | 17 (15.0%) |
| 6 or 7 Rooms | 363 (55.5%) | 41 (36.3%) |
| 8 or more Rooms | 63 (9.6%) | 0 (0.0%) |
| Total | 654 (100.0%) | 113 (100.0%) |
Housing Structure by Heating Type in Tubac
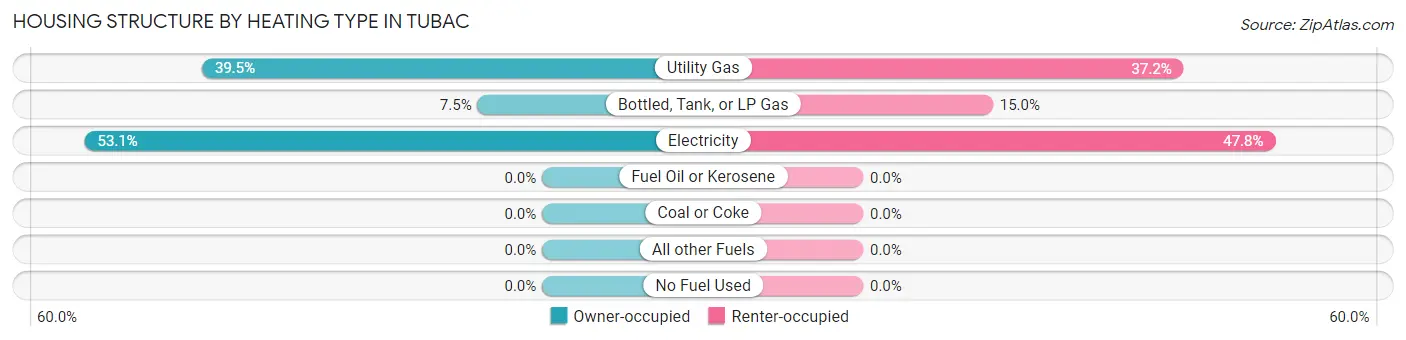
| Heating Type | Owner-occupied | Renter-occupied |
| Utility Gas | 258 (39.5%) | 42 (37.2%) |
| Bottled, Tank, or LP Gas | 49 (7.5%) | 17 (15.0%) |
| Electricity | 347 (53.1%) | 54 (47.8%) |
| Fuel Oil or Kerosene | 0 (0.0%) | 0 (0.0%) |
| Coal or Coke | 0 (0.0%) | 0 (0.0%) |
| All other Fuels | 0 (0.0%) | 0 (0.0%) |
| No Fuel Used | 0 (0.0%) | 0 (0.0%) |
| Total | 654 (100.0%) | 113 (100.0%) |
Household Vehicle Usage in Tubac
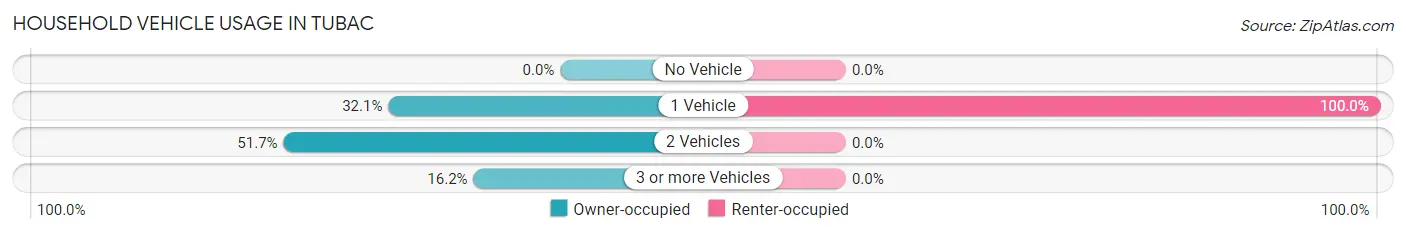
| Vehicles per Household | Owner-occupied | Renter-occupied |
| No Vehicle | 0 (0.0%) | 0 (0.0%) |
| 1 Vehicle | 210 (32.1%) | 113 (100.0%) |
| 2 Vehicles | 338 (51.7%) | 0 (0.0%) |
| 3 or more Vehicles | 106 (16.2%) | 0 (0.0%) |
| Total | 654 (100.0%) | 113 (100.0%) |
Real Estate & Mortgages in Tubac
Real Estate and Mortgage Overview in Tubac
| Characteristic | Without Mortgage | With Mortgage |
| Housing Units | 324 | 330 |
| Median Property Value | $380,800 | $621,000 |
| Median Household Income | $60,833 | $61 |
| Monthly Housing Costs | $611 | $13 |
| Real Estate Taxes | $2,615 | $0 |
Property Value by Mortgage Status in Tubac
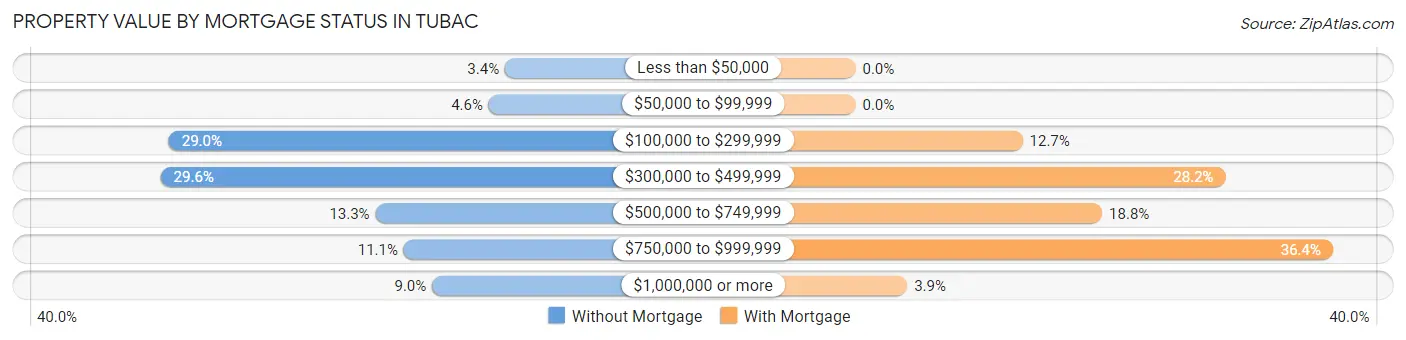
| Property Value | Without Mortgage | With Mortgage |
| Less than $50,000 | 11 (3.4%) | 0 (0.0%) |
| $50,000 to $99,999 | 15 (4.6%) | 0 (0.0%) |
| $100,000 to $299,999 | 94 (29.0%) | 42 (12.7%) |
| $300,000 to $499,999 | 96 (29.6%) | 93 (28.2%) |
| $500,000 to $749,999 | 43 (13.3%) | 62 (18.8%) |
| $750,000 to $999,999 | 36 (11.1%) | 120 (36.4%) |
| $1,000,000 or more | 29 (8.9%) | 13 (3.9%) |
| Total | 324 (100.0%) | 330 (100.0%) |
Household Income by Mortgage Status in Tubac
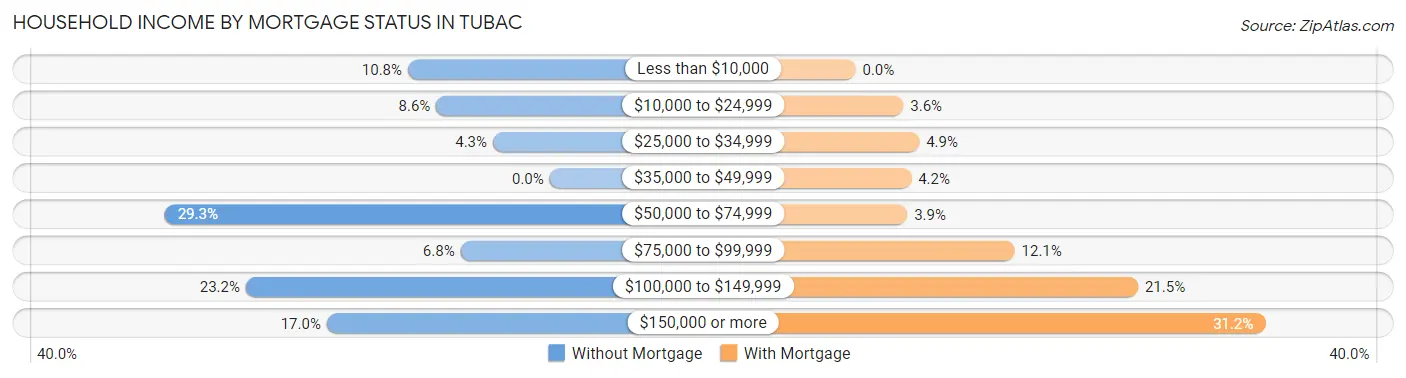
| Household Income | Without Mortgage | With Mortgage |
| Less than $10,000 | 35 (10.8%) | 0 (0.0%) |
| $10,000 to $24,999 | 28 (8.6%) | 12 (3.6%) |
| $25,000 to $34,999 | 14 (4.3%) | 16 (4.9%) |
| $35,000 to $49,999 | 0 (0.0%) | 14 (4.2%) |
| $50,000 to $74,999 | 95 (29.3%) | 13 (3.9%) |
| $75,000 to $99,999 | 22 (6.8%) | 40 (12.1%) |
| $100,000 to $149,999 | 75 (23.2%) | 71 (21.5%) |
| $150,000 or more | 55 (17.0%) | 103 (31.2%) |
| Total | 324 (100.0%) | 330 (100.0%) |
Property Value to Household Income Ratio in Tubac
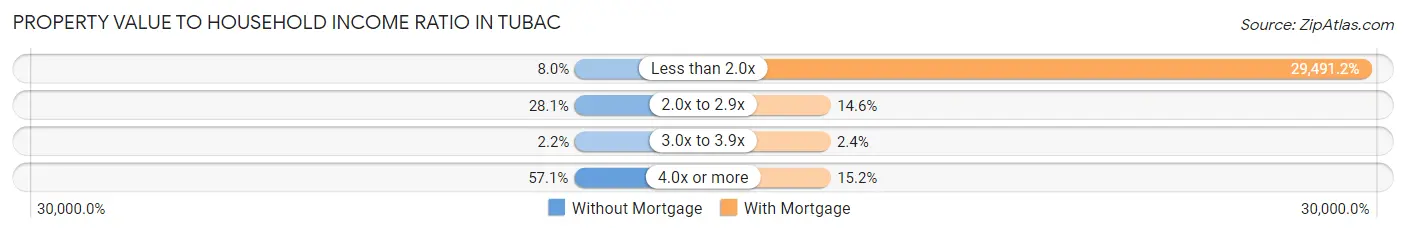
| Value-to-Income Ratio | Without Mortgage | With Mortgage |
| Less than 2.0x | 26 (8.0%) | 97,321 (29,491.2%) |
| 2.0x to 2.9x | 91 (28.1%) | 48 (14.5%) |
| 3.0x to 3.9x | 7 (2.2%) | 8 (2.4%) |
| 4.0x or more | 185 (57.1%) | 50 (15.1%) |
| Total | 324 (100.0%) | 330 (100.0%) |
Real Estate Taxes by Mortgage Status in Tubac
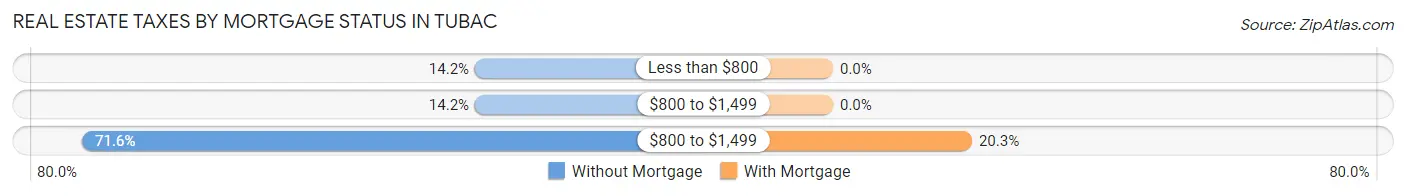
| Property Taxes | Without Mortgage | With Mortgage |
| Less than $800 | 46 (14.2%) | 0 (0.0%) |
| $800 to $1,499 | 46 (14.2%) | 0 (0.0%) |
| $800 to $1,499 | 232 (71.6%) | 67 (20.3%) |
| Total | 324 (100.0%) | 330 (100.0%) |
Health & Disability in Tubac
Health Insurance Coverage by Age in Tubac
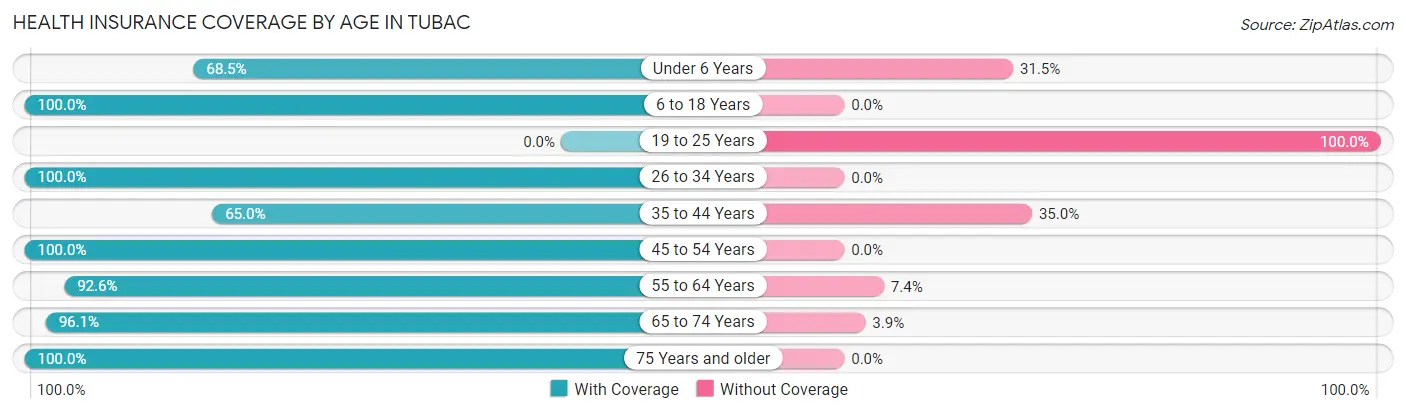
| Age Bracket | With Coverage | Without Coverage |
| Under 6 Years | 37 (68.5%) | 17 (31.5%) |
| 6 to 18 Years | 48 (100.0%) | 0 (0.0%) |
| 19 to 25 Years | 0 (0.0%) | 13 (100.0%) |
| 26 to 34 Years | 107 (100.0%) | 0 (0.0%) |
| 35 to 44 Years | 26 (65.0%) | 14 (35.0%) |
| 45 to 54 Years | 68 (100.0%) | 0 (0.0%) |
| 55 to 64 Years | 188 (92.6%) | 15 (7.4%) |
| 65 to 74 Years | 415 (96.1%) | 17 (3.9%) |
| 75 Years and older | 410 (100.0%) | 0 (0.0%) |
| Total | 1,299 (94.5%) | 76 (5.5%) |
Health Insurance Coverage by Citizenship Status in Tubac
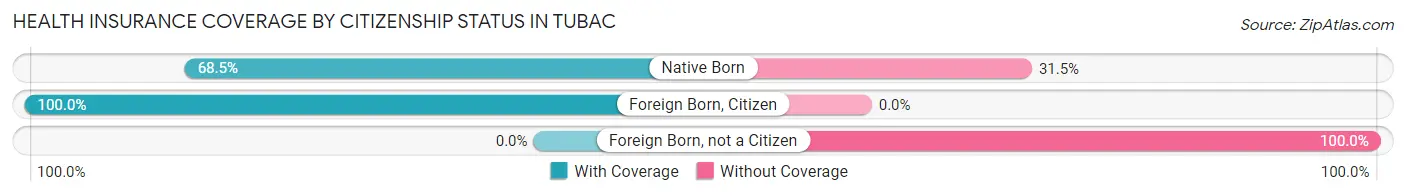
| Citizenship Status | With Coverage | Without Coverage |
| Native Born | 37 (68.5%) | 17 (31.5%) |
| Foreign Born, Citizen | 48 (100.0%) | 0 (0.0%) |
| Foreign Born, not a Citizen | 0 (0.0%) | 13 (100.0%) |
Health Insurance Coverage by Household Income in Tubac
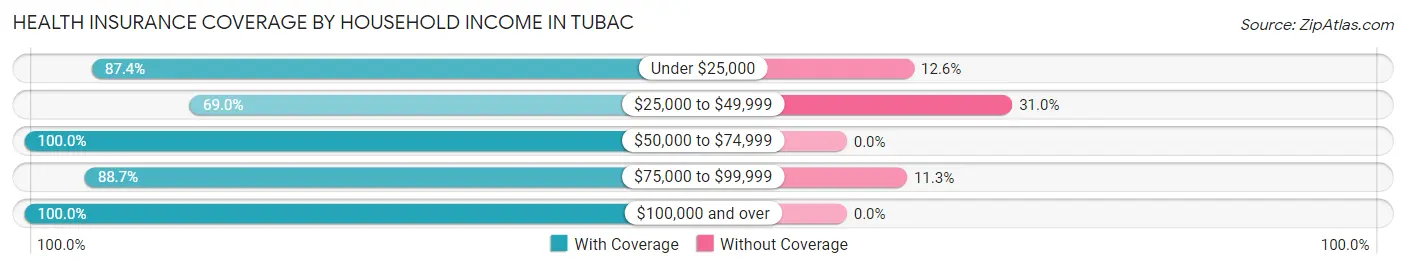
| Household Income | With Coverage | Without Coverage |
| Under $25,000 | 104 (87.4%) | 15 (12.6%) |
| $25,000 to $49,999 | 69 (69.0%) | 31 (31.0%) |
| $50,000 to $74,999 | 187 (100.0%) | 0 (0.0%) |
| $75,000 to $99,999 | 236 (88.7%) | 30 (11.3%) |
| $100,000 and over | 703 (100.0%) | 0 (0.0%) |
Public vs Private Health Insurance Coverage by Age in Tubac
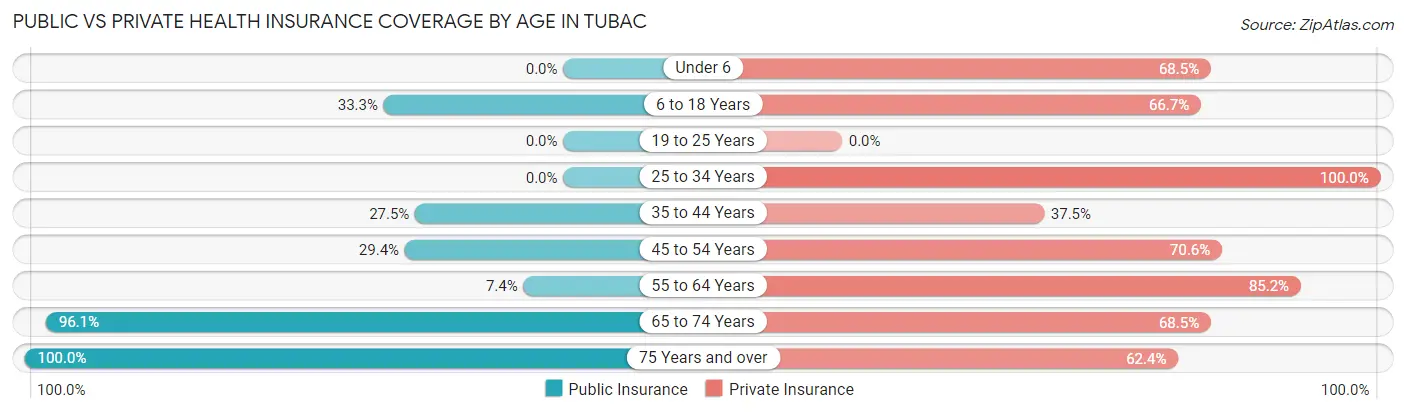
| Age Bracket | Public Insurance | Private Insurance |
| Under 6 | 0 (0.0%) | 37 (68.5%) |
| 6 to 18 Years | 16 (33.3%) | 32 (66.7%) |
| 19 to 25 Years | 0 (0.0%) | 0 (0.0%) |
| 25 to 34 Years | 0 (0.0%) | 107 (100.0%) |
| 35 to 44 Years | 11 (27.5%) | 15 (37.5%) |
| 45 to 54 Years | 20 (29.4%) | 48 (70.6%) |
| 55 to 64 Years | 15 (7.4%) | 173 (85.2%) |
| 65 to 74 Years | 415 (96.1%) | 296 (68.5%) |
| 75 Years and over | 410 (100.0%) | 256 (62.4%) |
| Total | 887 (64.5%) | 964 (70.1%) |
Disability Status by Sex by Age in Tubac
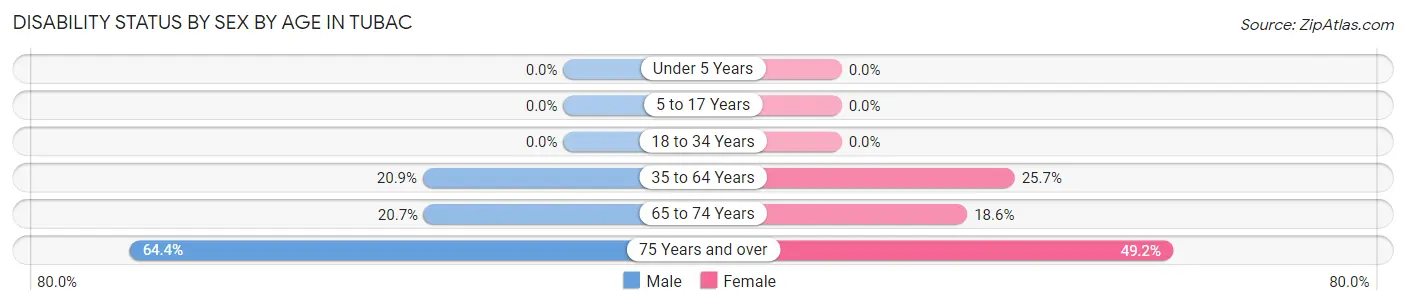
| Age Bracket | Male | Female |
| Under 5 Years | 0 (0.0%) | 0 (0.0%) |
| 5 to 17 Years | 0 (0.0%) | 0 (0.0%) |
| 18 to 34 Years | 0 (0.0%) | 0 (0.0%) |
| 35 to 64 Years | 34 (20.9%) | 38 (25.7%) |
| 65 to 74 Years | 35 (20.7%) | 49 (18.6%) |
| 75 Years and over | 150 (64.4%) | 87 (49.1%) |
Disability Class by Sex by Age in Tubac
Disability Class: Hearing Difficulty
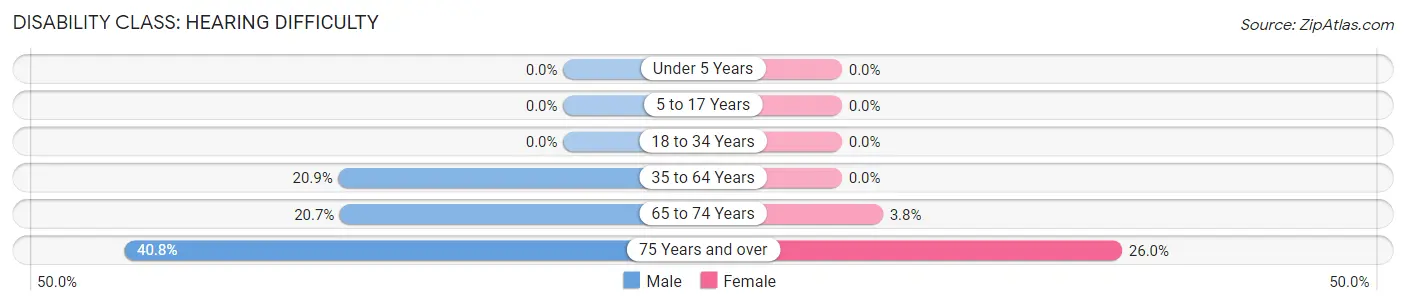
| Age Bracket | Male | Female |
| Under 5 Years | 0 (0.0%) | 0 (0.0%) |
| 5 to 17 Years | 0 (0.0%) | 0 (0.0%) |
| 18 to 34 Years | 0 (0.0%) | 0 (0.0%) |
| 35 to 64 Years | 34 (20.9%) | 0 (0.0%) |
| 65 to 74 Years | 35 (20.7%) | 10 (3.8%) |
| 75 Years and over | 95 (40.8%) | 46 (26.0%) |
Disability Class: Vision Difficulty
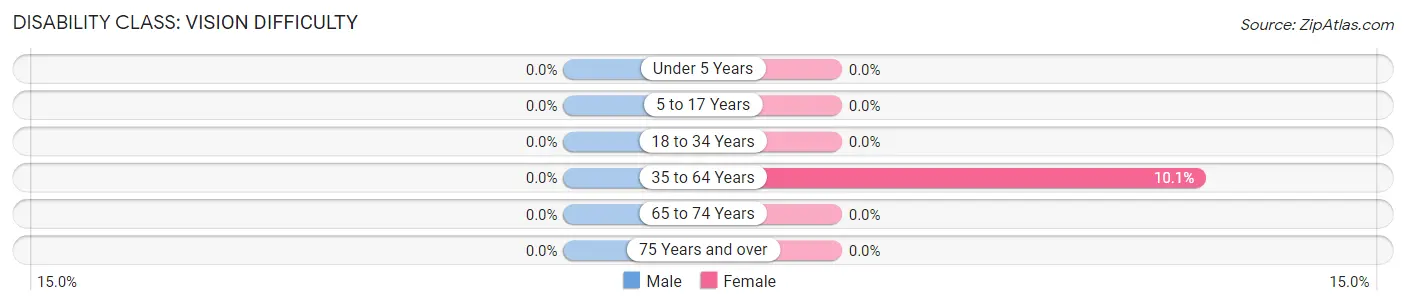
| Age Bracket | Male | Female |
| Under 5 Years | 0 (0.0%) | 0 (0.0%) |
| 5 to 17 Years | 0 (0.0%) | 0 (0.0%) |
| 18 to 34 Years | 0 (0.0%) | 0 (0.0%) |
| 35 to 64 Years | 0 (0.0%) | 15 (10.1%) |
| 65 to 74 Years | 0 (0.0%) | 0 (0.0%) |
| 75 Years and over | 0 (0.0%) | 0 (0.0%) |
Disability Class: Cognitive Difficulty
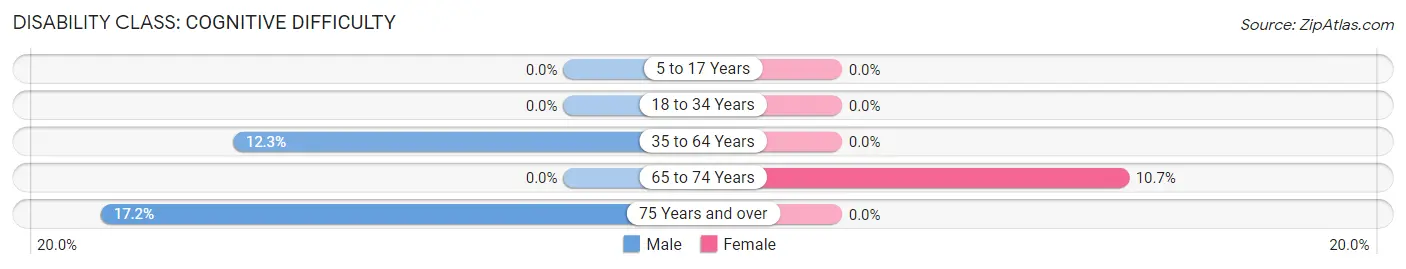
| Age Bracket | Male | Female |
| 5 to 17 Years | 0 (0.0%) | 0 (0.0%) |
| 18 to 34 Years | 0 (0.0%) | 0 (0.0%) |
| 35 to 64 Years | 20 (12.3%) | 0 (0.0%) |
| 65 to 74 Years | 0 (0.0%) | 28 (10.6%) |
| 75 Years and over | 40 (17.2%) | 0 (0.0%) |
Disability Class: Ambulatory Difficulty
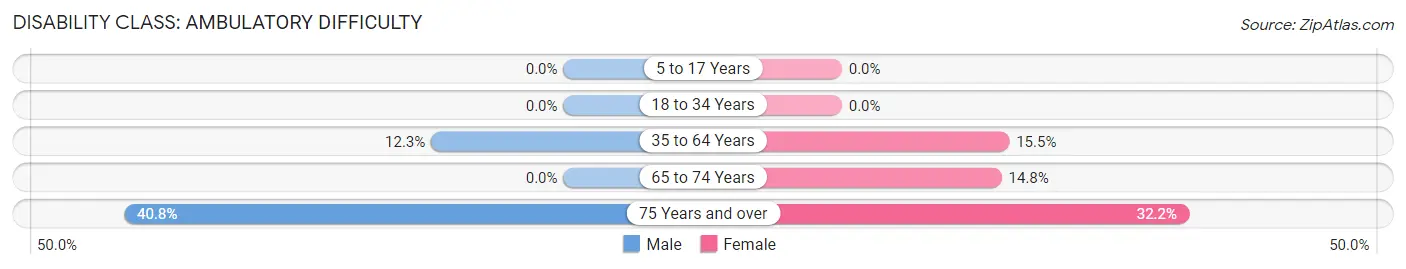
| Age Bracket | Male | Female |
| 5 to 17 Years | 0 (0.0%) | 0 (0.0%) |
| 18 to 34 Years | 0 (0.0%) | 0 (0.0%) |
| 35 to 64 Years | 20 (12.3%) | 23 (15.5%) |
| 65 to 74 Years | 0 (0.0%) | 39 (14.8%) |
| 75 Years and over | 95 (40.8%) | 57 (32.2%) |
Disability Class: Self-Care Difficulty
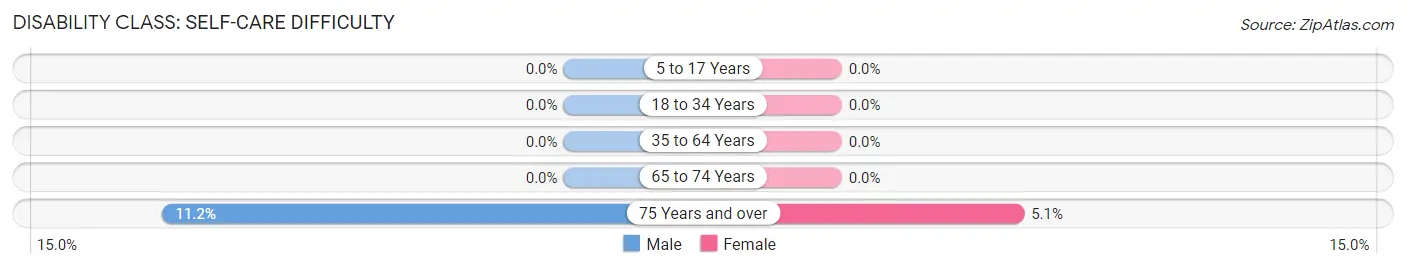
| Age Bracket | Male | Female |
| 5 to 17 Years | 0 (0.0%) | 0 (0.0%) |
| 18 to 34 Years | 0 (0.0%) | 0 (0.0%) |
| 35 to 64 Years | 0 (0.0%) | 0 (0.0%) |
| 65 to 74 Years | 0 (0.0%) | 0 (0.0%) |
| 75 Years and over | 26 (11.2%) | 9 (5.1%) |
Technology Access in Tubac
Computing Device Access in Tubac
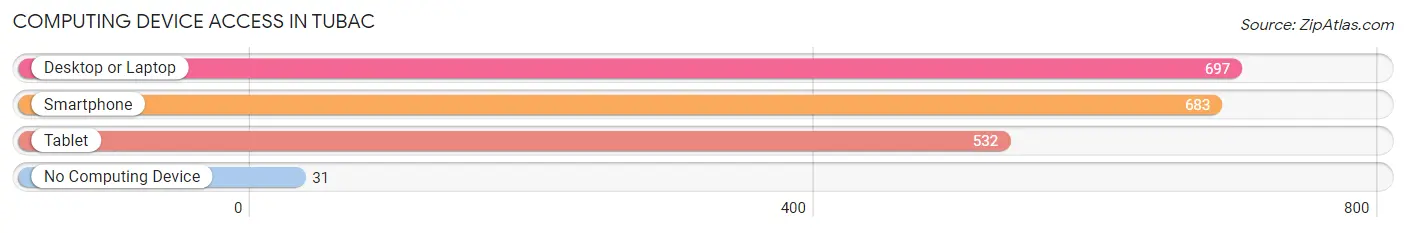
| Device Type | # Households | % Households |
| Desktop or Laptop | 697 | 90.9% |
| Smartphone | 683 | 89.0% |
| Tablet | 532 | 69.4% |
| No Computing Device | 31 | 4.0% |
| Total | 767 | 100.0% |
Internet Access in Tubac
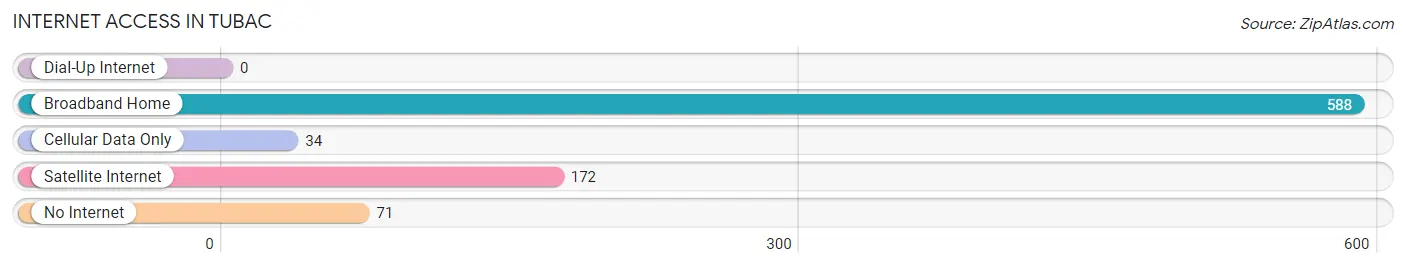
| Internet Type | # Households | % Households |
| Dial-Up Internet | 0 | 0.0% |
| Broadband Home | 588 | 76.7% |
| Cellular Data Only | 34 | 4.4% |
| Satellite Internet | 172 | 22.4% |
| No Internet | 71 | 9.3% |
| Total | 767 | 100.0% |
Tubac Summary
Tubac, Arizona is a small town located in Santa Cruz County, Arizona, United States. It is situated about 60 miles south of Tucson and is part of the Tucson Metropolitan Statistical Area. The town is known for its rich history, diverse geography, vibrant economy, and unique demographics.
History
Tubac was first settled by the O’odham people, who lived in the area for centuries before the arrival of Europeans. The first Europeans to settle in the area were Spanish missionaries and soldiers, who established a mission in Tubac in 1752. The mission was abandoned in 1776, but the town of Tubac was re-established in 1787. The town was a major trading center for the region, and it became a major stop on the Camino Real, a trade route between Mexico and California.
In 1821, Tubac became part of Mexico, and it remained so until 1854, when it was annexed by the United States. During this time, Tubac was a major stop on the Butterfield Overland Mail route, which connected St. Louis, Missouri to San Francisco, California. In 1861, Tubac was the site of the Battle of Picacho Pass, the only battle of the Civil War to take place in Arizona.
In the late 19th century, Tubac became a popular tourist destination, and it remains so today. The town is home to several historic sites, including the Tubac Presidio State Historic Park, which was established in 1959.
Geography
Tubac is located in the Santa Cruz Valley, which is part of the Sonoran Desert. The town is situated at an elevation of 2,800 feet, and it is surrounded by mountains and hills. The Santa Cruz River runs through the town, and it is a major source of water for the area.
The climate in Tubac is hot and dry, with temperatures ranging from the mid-90s in the summer to the mid-50s in the winter. The area receives an average of 12 inches of rain per year, and it is prone to occasional flash floods.
Economy
Tubac’s economy is largely based on tourism, and the town is home to several art galleries, shops, and restaurants. The town is also home to several wineries, and it is a popular destination for wine tasting.
The town is also home to several manufacturing companies, including a copper smelter and a paper mill. The town is also home to several agricultural operations, including cattle ranches and farms.
Demographics
As of the 2010 census, Tubac had a population of 1,191. The town is predominantly white, with about 75% of the population identifying as such. The town is also home to a large Hispanic population, with about 20% of the population identifying as Hispanic or Latino.
The median household income in Tubac is $45,000, and the median home value is $200,000. The town has a low unemployment rate, and the poverty rate is below the national average.
Tubac is a small town with a rich history, diverse geography, vibrant economy, and unique demographics. The town is a popular tourist destination, and it is home to several art galleries, shops, and restaurants. The town is also home to several manufacturing companies and agricultural operations, and it has a low unemployment rate and a median household income of $45,000.
Common Questions
What is Per Capita Income in Tubac?
Per Capita income in Tubac is $57,357.
What is the Median Family Income in Tubac?
Median Family Income in Tubac is $110,744.
What is the Median Household income in Tubac?
Median Household Income in Tubac is $85,893.
What is Inequality or Gini Index in Tubac?
Inequality or Gini Index in Tubac is 0.44.
What is the Total Population of Tubac?
Total Population of Tubac is 1,375.
What is the Total Male Population of Tubac?
Total Male Population of Tubac is 639.
What is the Total Female Population of Tubac?
Total Female Population of Tubac is 736.
What is the Ratio of Males per 100 Females in Tubac?
There are 86.82 Males per 100 Females in Tubac.
What is the Ratio of Females per 100 Males in Tubac?
There are 115.18 Females per 100 Males in Tubac.
What is the Median Population Age in Tubac?
Median Population Age in Tubac is 69.4 Years.
What is the Average Family Size in Tubac
Average Family Size in Tubac is 2.3 People.
What is the Average Household Size in Tubac
Average Household Size in Tubac is 1.8 People.
How Large is the Labor Force in Tubac?
There are 412 People in the Labor Forcein in Tubac.
What is the Percentage of People in the Labor Force in Tubac?
32.0% of People are in the Labor Force in Tubac.
What is the Unemployment Rate in Tubac?
Unemployment Rate in Tubac is 3.9%.