Vernon, AZ Map & Demographics
Vernon Map
Vernon Overview
$14,180
PER CAPITA INCOME
$48,203
AVG FAMILY INCOME
$48,203
AVG HOUSEHOLD INCOME
0.29
INEQUALITY / GINI INDEX
331
TOTAL POPULATION
151
MALE POPULATION
180
FEMALE POPULATION
83.89
MALES / 100 FEMALES
119.21
FEMALES / 100 MALES
22.7
MEDIAN AGE
6.8
AVG FAMILY SIZE
6.8
AVG HOUSEHOLD SIZE
71
LABOR FORCE [ PEOPLE ]
32.9%
PERCENT IN LABOR FORCE
Vernon Zip Codes
Vernon Area Codes
Income in Vernon
Income Overview in Vernon
Per Capita Income in Vernon is $14,180, while median incomes of families and households are $48,203 and $48,203 respectively.
| Characteristic | Number | Measure |
| Per Capita Income | 331 | $14,180 |
| Median Family Income | 49 | $48,203 |
| Mean Family Income | 49 | $76,604 |
| Median Household Income | 49 | $48,203 |
| Mean Household Income | 49 | $76,604 |
| Income Deficit | 49 | $0 |
| Wage / Income Gap (%) | 331 | 0.00% |
| Wage / Income Gap ($) | 331 | 100.00¢ per $1 |
| Gini / Inequality Index | 331 | 0.29 |
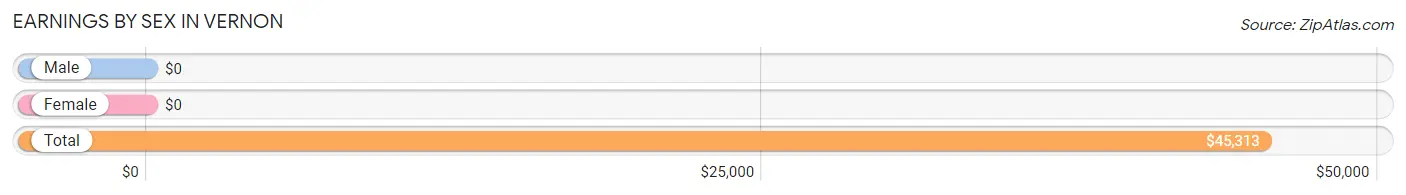
Earnings by Sex in Vernon
| Sex | Number | Average Earnings |
| Male | 42 (59.2%) | $0 |
| Female | 29 (40.8%) | $0 |
| Total | 71 (100.0%) | $45,313 |
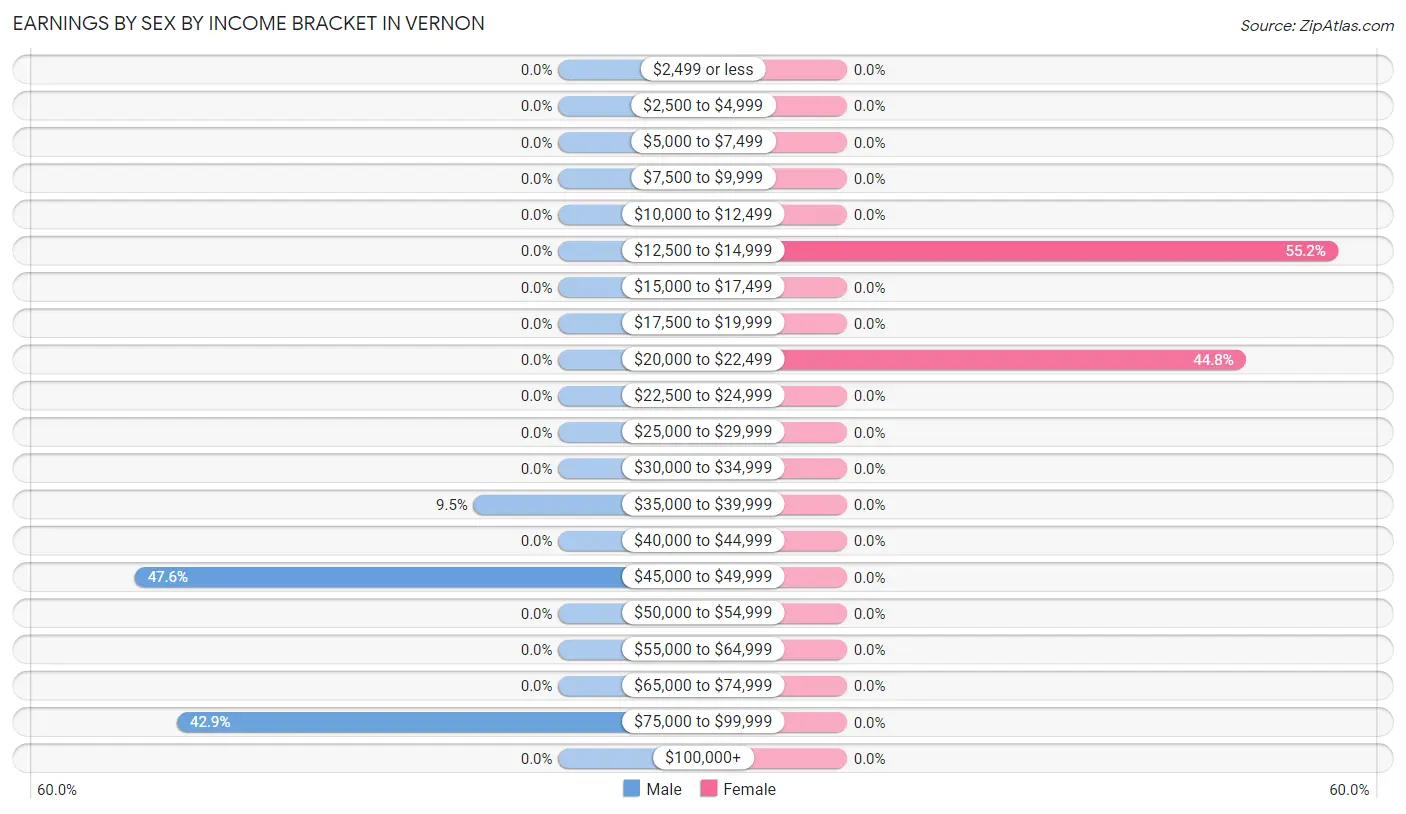
Earnings by Sex by Income Bracket in Vernon
The most common earnings brackets in Vernon are $45,000 to $49,999 for men (20 | 47.6%) and $12,500 to $14,999 for women (16 | 55.2%).
| Income | Male | Female |
| $2,499 or less | 0 (0.0%) | 0 (0.0%) |
| $2,500 to $4,999 | 0 (0.0%) | 0 (0.0%) |
| $5,000 to $7,499 | 0 (0.0%) | 0 (0.0%) |
| $7,500 to $9,999 | 0 (0.0%) | 0 (0.0%) |
| $10,000 to $12,499 | 0 (0.0%) | 0 (0.0%) |
| $12,500 to $14,999 | 0 (0.0%) | 16 (55.2%) |
| $15,000 to $17,499 | 0 (0.0%) | 0 (0.0%) |
| $17,500 to $19,999 | 0 (0.0%) | 0 (0.0%) |
| $20,000 to $22,499 | 0 (0.0%) | 13 (44.8%) |
| $22,500 to $24,999 | 0 (0.0%) | 0 (0.0%) |
| $25,000 to $29,999 | 0 (0.0%) | 0 (0.0%) |
| $30,000 to $34,999 | 0 (0.0%) | 0 (0.0%) |
| $35,000 to $39,999 | 4 (9.5%) | 0 (0.0%) |
| $40,000 to $44,999 | 0 (0.0%) | 0 (0.0%) |
| $45,000 to $49,999 | 20 (47.6%) | 0 (0.0%) |
| $50,000 to $54,999 | 0 (0.0%) | 0 (0.0%) |
| $55,000 to $64,999 | 0 (0.0%) | 0 (0.0%) |
| $65,000 to $74,999 | 0 (0.0%) | 0 (0.0%) |
| $75,000 to $99,999 | 18 (42.9%) | 0 (0.0%) |
| $100,000+ | 0 (0.0%) | 0 (0.0%) |
| Total | 42 (100.0%) | 29 (100.0%) |
Earnings by Sex by Educational Attainment in Vernon
| Educational Attainment | Male Income | Female Income |
| Less than High School | - | - |
| High School Diploma | - | - |
| College or Associate's Degree | - | - |
| Bachelor's Degree | - | - |
| Graduate Degree | - | - |
| Total | - | - |
Family Income in Vernon
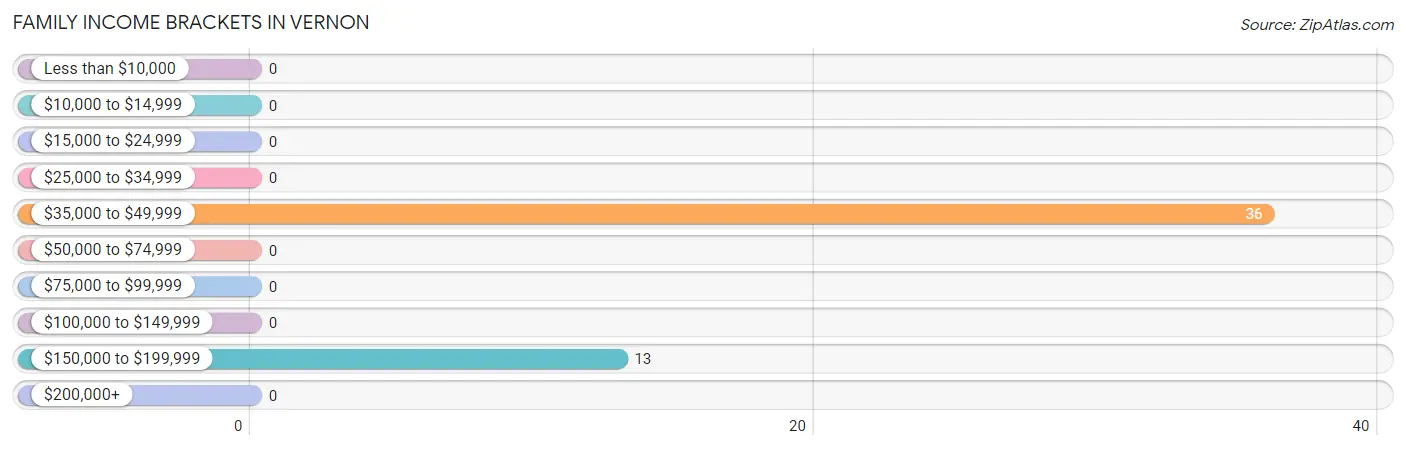
Family Income Brackets in Vernon
According to the Vernon family income data, there are 36 families falling into the $35,000 to $49,999 income range, which is the most common income bracket and makes up 73.5% of all families.
| Income Bracket | # Families | % Families |
| Less than $10,000 | 0 | 0.0% |
| $10,000 to $14,999 | 0 | 0.0% |
| $15,000 to $24,999 | 0 | 0.0% |
| $25,000 to $34,999 | 0 | 0.0% |
| $35,000 to $49,999 | 36 | 73.5% |
| $50,000 to $74,999 | 0 | 0.0% |
| $75,000 to $99,999 | 0 | 0.0% |
| $100,000 to $149,999 | 0 | 0.0% |
| $150,000 to $199,999 | 13 | 26.5% |
| $200,000+ | 0 | 0.0% |
Family Income by Famaliy Size in Vernon
| Income Bracket | # Families | Median Income |
| 2-Person Families | 0 (0.0%) | $0 |
| 3-Person Families | 0 (0.0%) | $0 |
| 4-Person Families | 0 (0.0%) | $0 |
| 5-Person Families | 0 (0.0%) | $0 |
| 6-Person Families | 36 (73.5%) | $0 |
| 7+ Person Families | 13 (26.5%) | $0 |
| Total | 49 (100.0%) | $48,203 |
Family Income by Number of Earners in Vernon
| Number of Earners | # Families | Median Income |
| No Earners | 0 (0.0%) | $0 |
| 1 Earner | 20 (40.8%) | $0 |
| 2 Earners | 29 (59.2%) | $0 |
| 3+ Earners | 0 (0.0%) | $0 |
| Total | 49 (100.0%) | $48,203 |
Household Income in Vernon
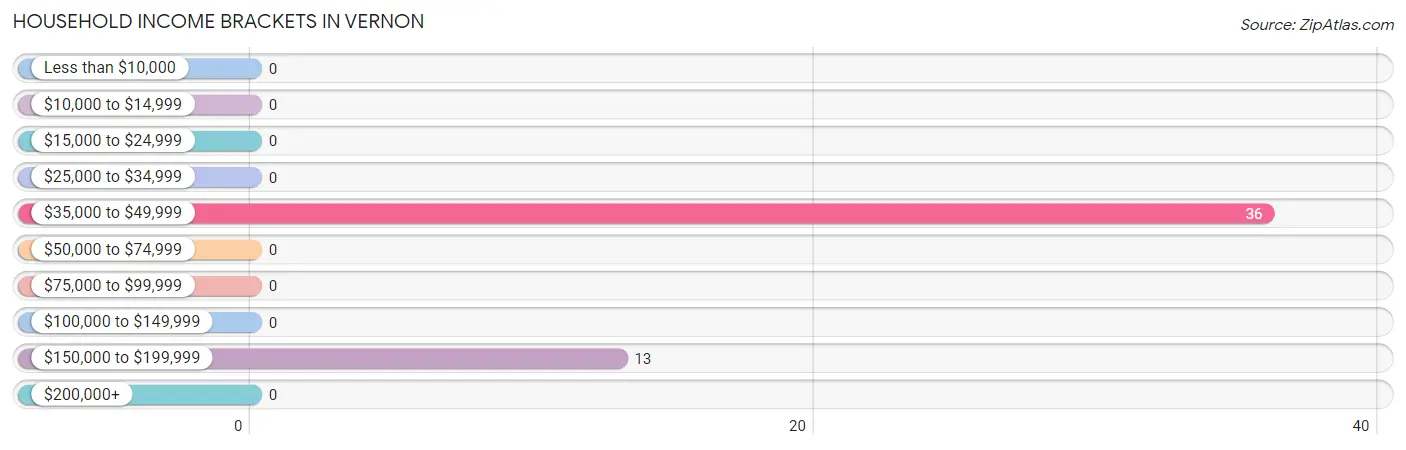
Household Income Brackets in Vernon
With 36 households falling in the category, the $35,000 to $49,999 income range is the most frequent in Vernon, accounting for 73.5% of all households.
| Income Bracket | # Households | % Households |
| Less than $10,000 | 0 | 0.0% |
| $10,000 to $14,999 | 0 | 0.0% |
| $15,000 to $24,999 | 0 | 0.0% |
| $25,000 to $34,999 | 0 | 0.0% |
| $35,000 to $49,999 | 36 | 73.5% |
| $50,000 to $74,999 | 0 | 0.0% |
| $75,000 to $99,999 | 0 | 0.0% |
| $100,000 to $149,999 | 0 | 0.0% |
| $150,000 to $199,999 | 13 | 26.5% |
| $200,000+ | 0 | 0.0% |
Household Income by Householder Age in Vernon
| Income Bracket | # Households | Median Income |
| 15 to 24 Years | 0 (0.0%) | $0 |
| 25 to 44 Years | 33 (67.3%) | $0 |
| 45 to 64 Years | 16 (32.7%) | $0 |
| 65+ Years | 0 (0.0%) | $0 |
| Total | 49 (100.0%) | $48,203 |
Poverty in Vernon
Income Below Poverty by Sex and Age in Vernon
| Age Bracket | Male | Female |
| Under 5 Years | 0 (0.0%) | 0 (0.0%) |
| 5 Years | 0 (0.0%) | 0 (0.0%) |
| 6 to 11 Years | 0 (0.0%) | 0 (0.0%) |
| 12 to 14 Years | 0 (0.0%) | 0 (0.0%) |
| 15 Years | 0 (0.0%) | 0 (0.0%) |
| 16 and 17 Years | 0 (0.0%) | 0 (0.0%) |
| 18 to 24 Years | 0 (0.0%) | 0 (0.0%) |
| 25 to 34 Years | 0 (0.0%) | 0 (0.0%) |
| 35 to 44 Years | 0 (0.0%) | 0 (0.0%) |
| 45 to 54 Years | 0 (0.0%) | 0 (0.0%) |
| 55 to 64 Years | 0 (0.0%) | 0 (0.0%) |
| 65 to 74 Years | 0 (0.0%) | 0 (0.0%) |
| 75 Years and over | 0 (0.0%) | 0 (0.0%) |
| Total | 0 (0.0%) | 0 (0.0%) |
Income Above Poverty by Sex and Age in Vernon
According to the poverty statistics in Vernon, males aged under 5 years and females aged under 5 years are the age groups that are most secure financially, with 100.0% of males and 100.0% of females in these age groups living above the poverty line.
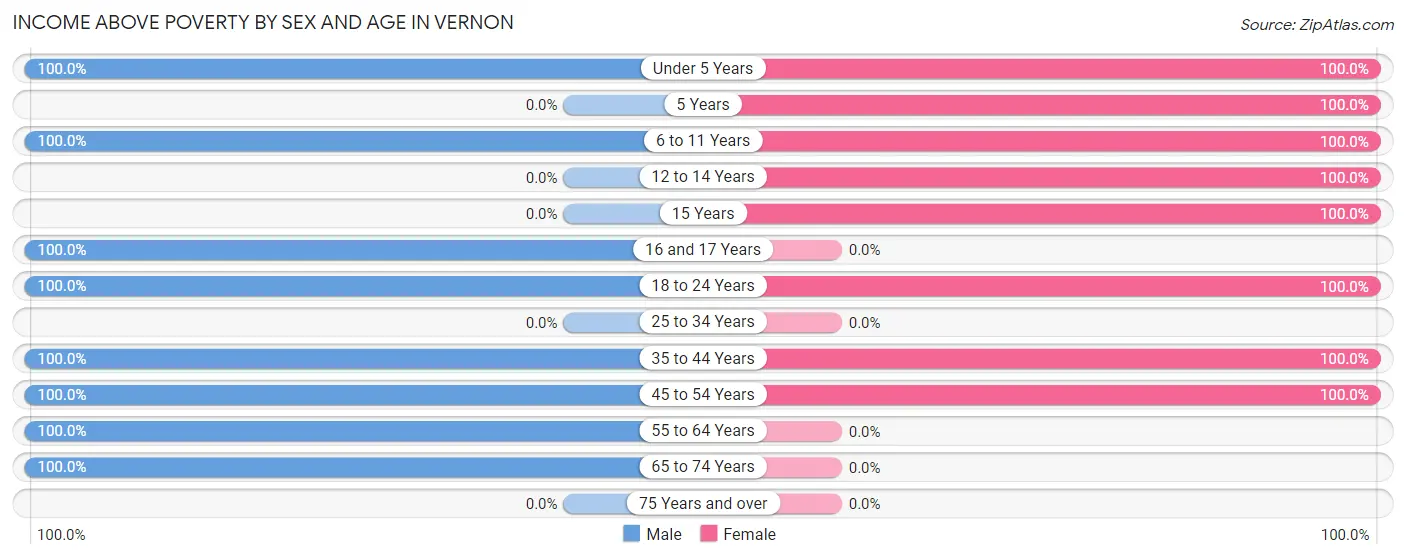
| Age Bracket | Male | Female |
| Under 5 Years | 14 (100.0%) | 30 (100.0%) |
| 5 Years | 0 (0.0%) | 14 (100.0%) |
| 6 to 11 Years | 13 (100.0%) | 12 (100.0%) |
| 12 to 14 Years | 0 (0.0%) | 20 (100.0%) |
| 15 Years | 0 (0.0%) | 12 (100.0%) |
| 16 and 17 Years | 11 (100.0%) | 0 (0.0%) |
| 18 to 24 Years | 7 (100.0%) | 47 (100.0%) |
| 25 to 34 Years | 0 (0.0%) | 0 (0.0%) |
| 35 to 44 Years | 38 (100.0%) | 29 (100.0%) |
| 45 to 54 Years | 4 (100.0%) | 16 (100.0%) |
| 55 to 64 Years | 29 (100.0%) | 0 (0.0%) |
| 65 to 74 Years | 35 (100.0%) | 0 (0.0%) |
| 75 Years and over | 0 (0.0%) | 0 (0.0%) |
| Total | 151 (100.0%) | 180 (100.0%) |
Income Below Poverty Among Married-Couple Families in Vernon
| Children | Above Poverty | Below Poverty |
| No Children | 0 (0.0%) | 0 (0.0%) |
| 1 or 2 Children | 0 (0.0%) | 0 (0.0%) |
| 3 or 4 Children | 49 (100.0%) | 0 (0.0%) |
| 5 or more Children | 0 (0.0%) | 0 (0.0%) |
| Total | 49 (100.0%) | 0 (0.0%) |
Income Below Poverty Among Single-Parent Households in Vernon
| Children | Single Father | Single Mother |
| No Children | 0 (0.0%) | 0 (0.0%) |
| 1 or 2 Children | 0 (0.0%) | 0 (0.0%) |
| 3 or 4 Children | 0 (0.0%) | 0 (0.0%) |
| 5 or more Children | 0 (0.0%) | 0 (0.0%) |
| Total | 0 (0.0%) | 0 (0.0%) |
Income Below Poverty Among Married-Couple vs Single-Parent Households in Vernon
| Children | Married-Couple Families | Single-Parent Households |
| No Children | 0 (0.0%) | 0 (0.0%) |
| 1 or 2 Children | 0 (0.0%) | 0 (0.0%) |
| 3 or 4 Children | 0 (0.0%) | 0 (0.0%) |
| 5 or more Children | 0 (0.0%) | 0 (0.0%) |
| Total | 0 (0.0%) | 0 (0.0%) |
Race in Vernon
The most populous races in Vernon are White / Caucasian (331 | 100.0%), and Hispanic or Latino (4 | 1.2%).
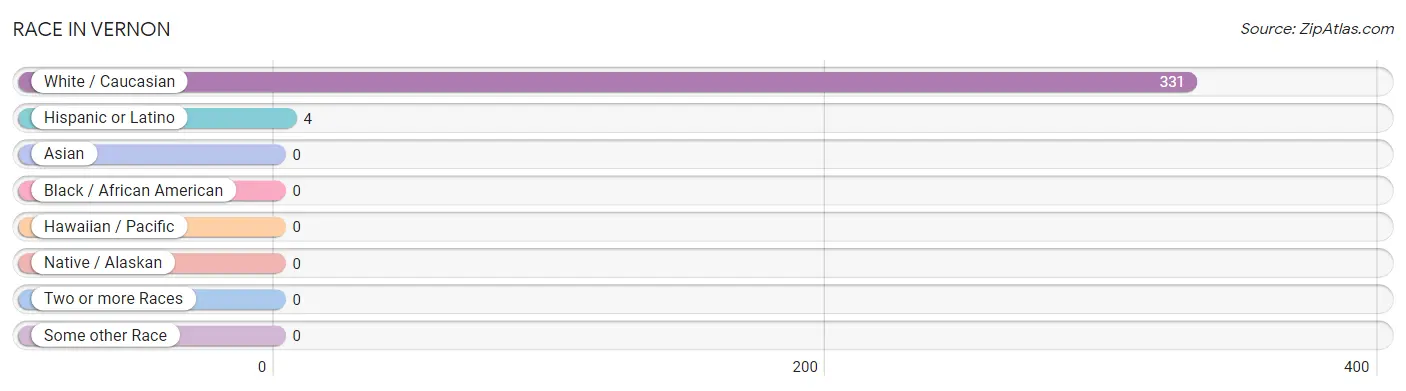
| Race | # Population | % Population |
| Asian | 0 | 0.0% |
| Black / African American | 0 | 0.0% |
| Hawaiian / Pacific | 0 | 0.0% |
| Hispanic or Latino | 4 | 1.2% |
| Native / Alaskan | 0 | 0.0% |
| White / Caucasian | 331 | 100.0% |
| Two or more Races | 0 | 0.0% |
| Some other Race | 0 | 0.0% |
| Total | 331 | 100.0% |
Ancestry in Vernon
The most populous ancestries reported in Vernon are American (100 | 30.2%), German (63 | 19.0%), English (52 | 15.7%), Irish (51 | 15.4%), and Scotch-Irish (50 | 15.1%), together accounting for 95.5% of all Vernon residents.
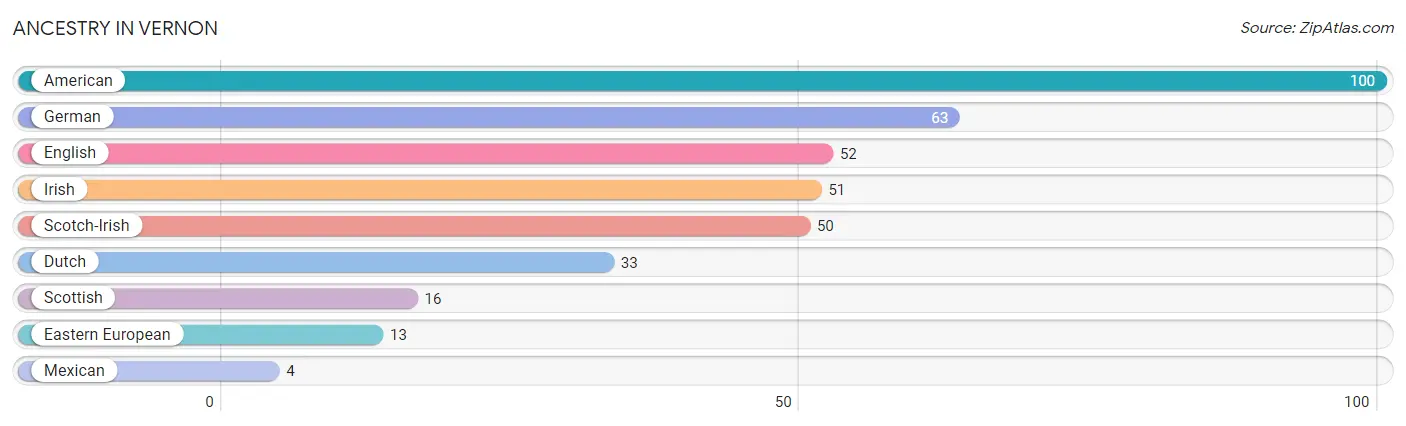
| Ancestry | # Population | % Population |
| American | 100 | 30.2% |
| Dutch | 33 | 10.0% |
| Eastern European | 13 | 3.9% |
| English | 52 | 15.7% |
| German | 63 | 19.0% |
| Irish | 51 | 15.4% |
| Mexican | 4 | 1.2% |
| Scotch-Irish | 50 | 15.1% |
| Scottish | 16 | 4.8% | View All 9 Rows |
Immigrants in Vernon

| Immigration Origin | # Population | % Population | View All 0 Rows |
Sex and Age in Vernon
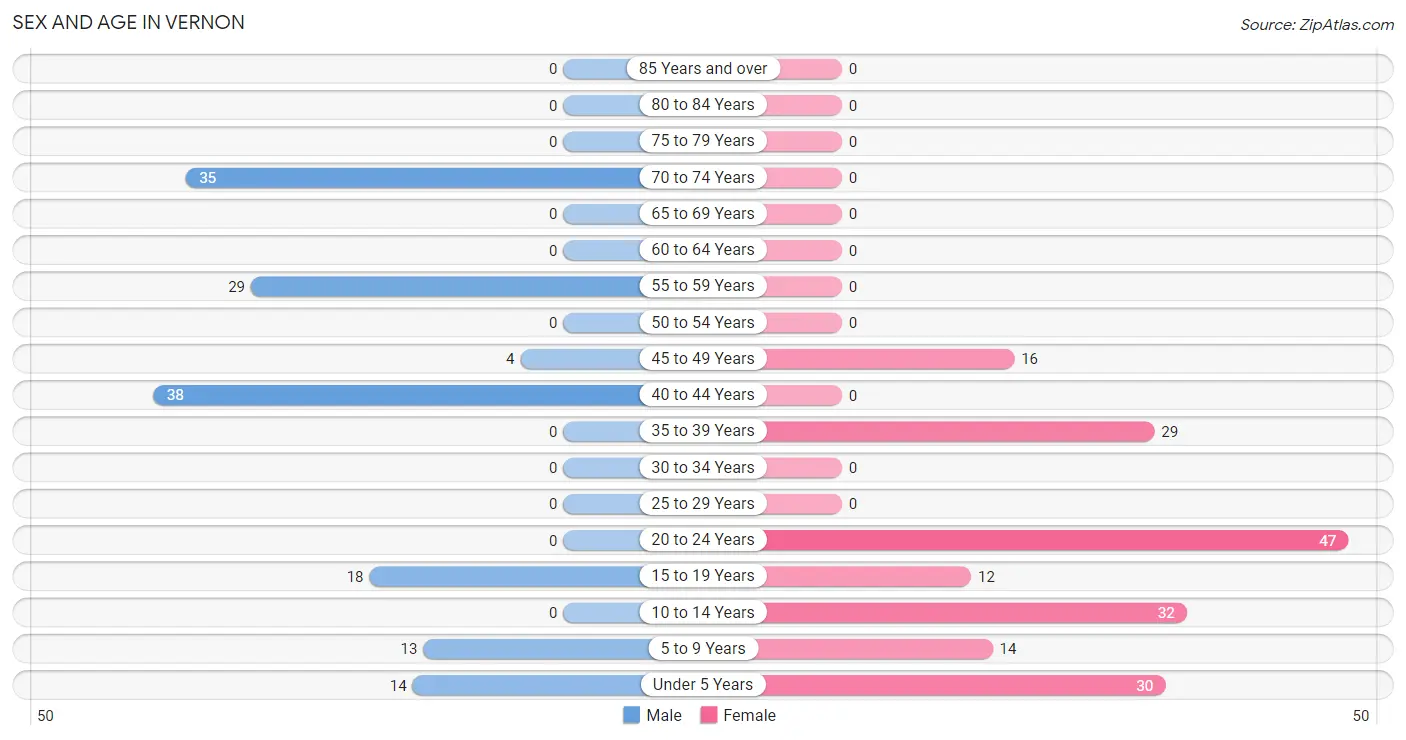
Sex and Age in Vernon
The most populous age groups in Vernon are 40 to 44 Years (38 | 25.2%) for men and 20 to 24 Years (47 | 26.1%) for women.
| Age Bracket | Male | Female |
| Under 5 Years | 14 (9.3%) | 30 (16.7%) |
| 5 to 9 Years | 13 (8.6%) | 14 (7.8%) |
| 10 to 14 Years | 0 (0.0%) | 32 (17.8%) |
| 15 to 19 Years | 18 (11.9%) | 12 (6.7%) |
| 20 to 24 Years | 0 (0.0%) | 47 (26.1%) |
| 25 to 29 Years | 0 (0.0%) | 0 (0.0%) |
| 30 to 34 Years | 0 (0.0%) | 0 (0.0%) |
| 35 to 39 Years | 0 (0.0%) | 29 (16.1%) |
| 40 to 44 Years | 38 (25.2%) | 0 (0.0%) |
| 45 to 49 Years | 4 (2.6%) | 16 (8.9%) |
| 50 to 54 Years | 0 (0.0%) | 0 (0.0%) |
| 55 to 59 Years | 29 (19.2%) | 0 (0.0%) |
| 60 to 64 Years | 0 (0.0%) | 0 (0.0%) |
| 65 to 69 Years | 0 (0.0%) | 0 (0.0%) |
| 70 to 74 Years | 35 (23.2%) | 0 (0.0%) |
| 75 to 79 Years | 0 (0.0%) | 0 (0.0%) |
| 80 to 84 Years | 0 (0.0%) | 0 (0.0%) |
| 85 Years and over | 0 (0.0%) | 0 (0.0%) |
| Total | 151 (100.0%) | 180 (100.0%) |
Families and Households in Vernon
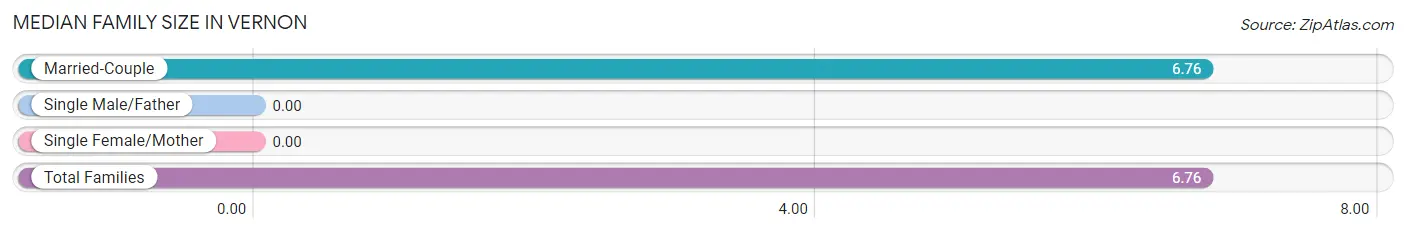
Median Family Size in Vernon
| Family Type | # Families | Family Size |
| Married-Couple | 49 (100.0%) | 6.76 |
| Single Male/Father | 0 (0.0%) | - |
| Single Female/Mother | 0 (0.0%) | - |
| Total Families | 49 (100.0%) | 6.76 |
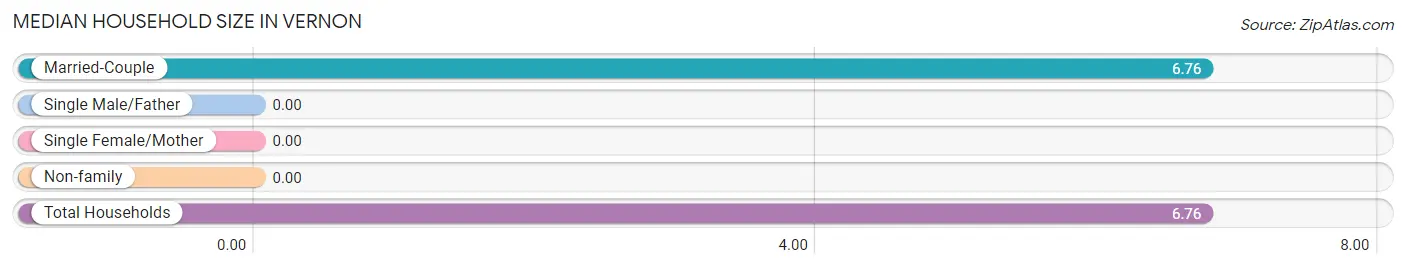
Median Household Size in Vernon
| Household Type | # Households | Household Size |
| Married-Couple | 49 (100.0%) | 6.76 |
| Single Male/Father | 0 (0.0%) | - |
| Single Female/Mother | 0 (0.0%) | - |
| Non-family | 0 (0.0%) | - |
| Total Households | 49 (100.0%) | 6.76 |
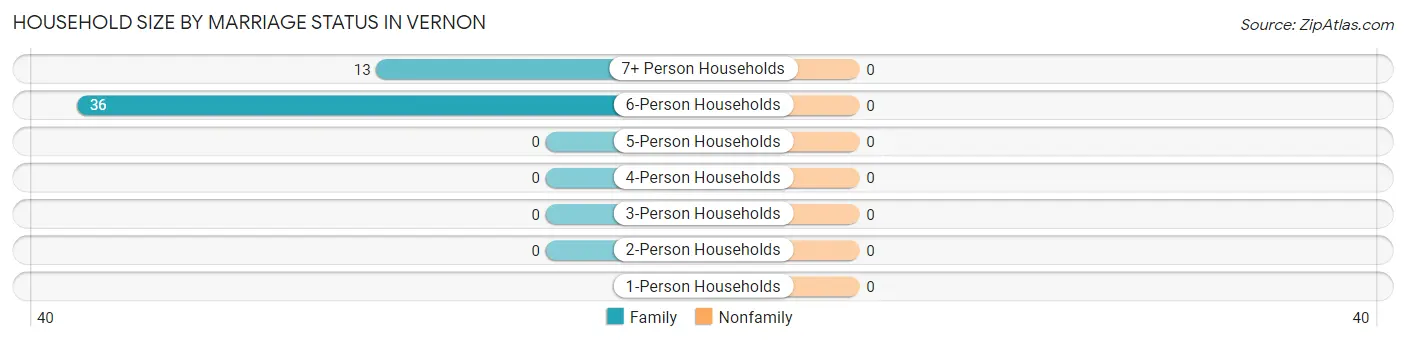
Household Size by Marriage Status in Vernon
| Household Size | Family Households | Nonfamily Households |
| 1-Person Households | - | 0 (0.0%) |
| 2-Person Households | 0 (0.0%) | 0 (0.0%) |
| 3-Person Households | 0 (0.0%) | 0 (0.0%) |
| 4-Person Households | 0 (0.0%) | 0 (0.0%) |
| 5-Person Households | 0 (0.0%) | 0 (0.0%) |
| 6-Person Households | 36 (73.5%) | 0 (0.0%) |
| 7+ Person Households | 13 (26.5%) | 0 (0.0%) |
| Total | 49 (100.0%) | 0 (0.0%) |
Female Fertility in Vernon
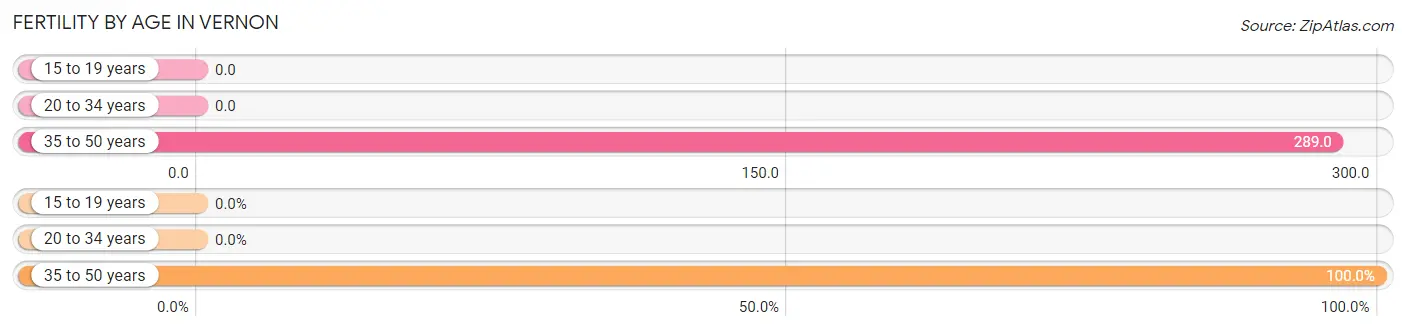
Fertility by Age in Vernon
Average fertility rate in Vernon is 125.0 births per 1,000 women. Women in the age bracket of 35 to 50 years have the highest fertility rate with 289.0 births per 1,000 women. Women in the age bracket of 35 to 50 years acount for 100.0% of all women with births.
| Age Bracket | Women with Births | Births / 1,000 Women |
| 15 to 19 years | 0 (0.0%) | 0.0 |
| 20 to 34 years | 0 (0.0%) | 0.0 |
| 35 to 50 years | 13 (100.0%) | 289.0 |
| Total | 13 (100.0%) | 125.0 |
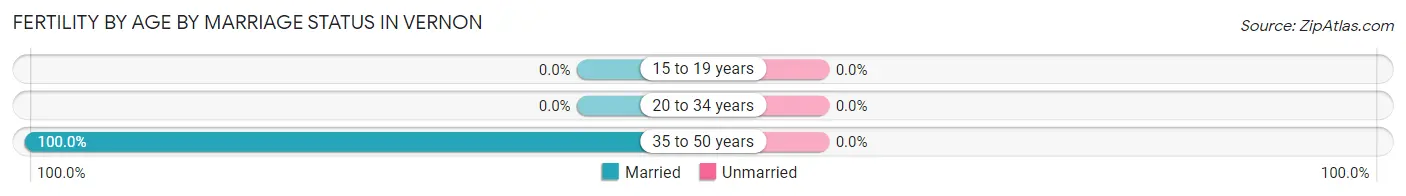
Fertility by Age by Marriage Status in Vernon
| Age Bracket | Married | Unmarried |
| 15 to 19 years | 0 (0.0%) | 0 (0.0%) |
| 20 to 34 years | 0 (0.0%) | 0 (0.0%) |
| 35 to 50 years | 13 (100.0%) | 0 (0.0%) |
| Total | 13 (100.0%) | 0 (0.0%) |
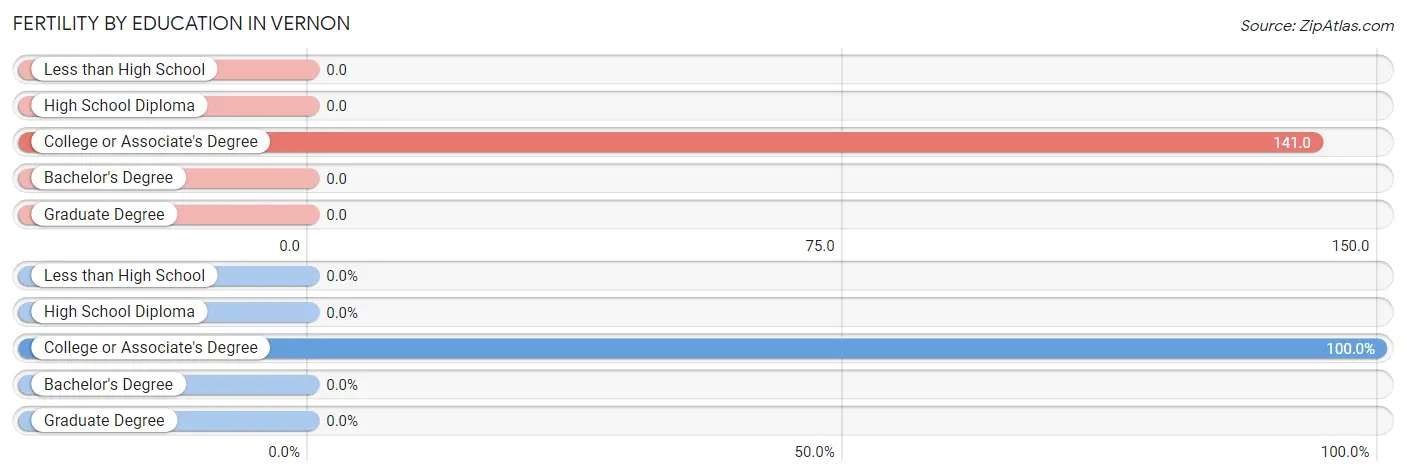
Fertility by Education in Vernon
| Educational Attainment | Women with Births | Births / 1,000 Women |
| Less than High School | 0 (0.0%) | 0.0 |
| High School Diploma | 0 (0.0%) | 0.0 |
| College or Associate's Degree | 13 (100.0%) | 141.0 |
| Bachelor's Degree | 0 (0.0%) | 0.0 |
| Graduate Degree | 0 (0.0%) | 0.0 |
| Total | 13 (100.0%) | 125.0 |
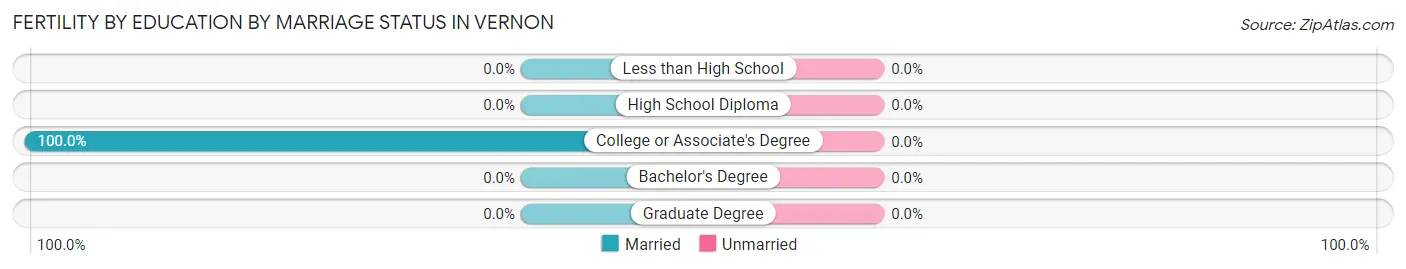
Fertility by Education by Marriage Status in Vernon
| Educational Attainment | Married | Unmarried |
| Less than High School | 0 (0.0%) | 0 (0.0%) |
| High School Diploma | 0 (0.0%) | 0 (0.0%) |
| College or Associate's Degree | 13 (100.0%) | 0 (0.0%) |
| Bachelor's Degree | 0 (0.0%) | 0 (0.0%) |
| Graduate Degree | 0 (0.0%) | 0 (0.0%) |
| Total | 13 (100.0%) | 0 (0.0%) |
Employment Characteristics in Vernon
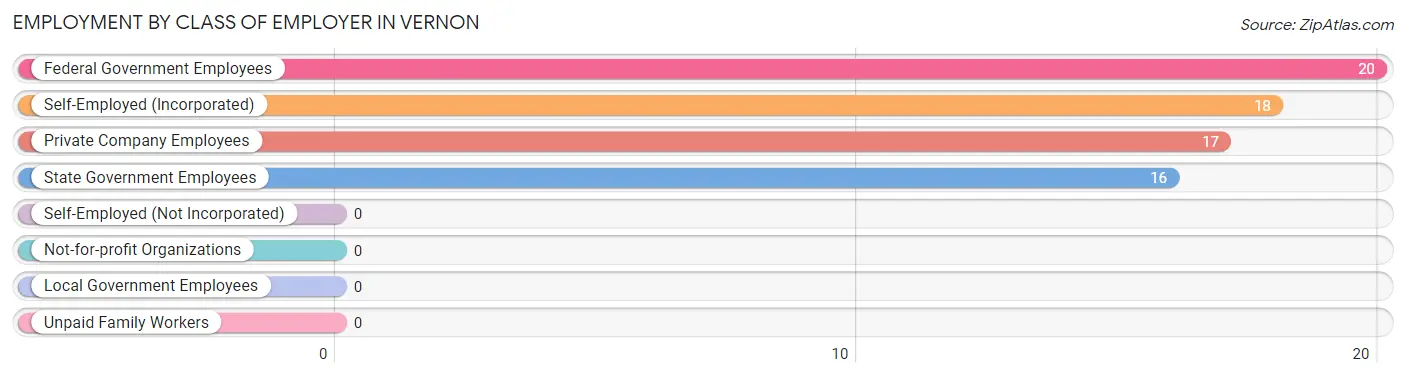
Employment by Class of Employer in Vernon
Among the 71 employed individuals in Vernon, federal government employees (20 | 28.2%), self-employed (incorporated) (18 | 25.4%), and private company employees (17 | 23.9%) make up the most common classes of employment.
| Employer Class | # Employees | % Employees |
| Private Company Employees | 17 | 23.9% |
| Self-Employed (Incorporated) | 18 | 25.4% |
| Self-Employed (Not Incorporated) | 0 | 0.0% |
| Not-for-profit Organizations | 0 | 0.0% |
| Local Government Employees | 0 | 0.0% |
| State Government Employees | 16 | 22.5% |
| Federal Government Employees | 20 | 28.2% |
| Unpaid Family Workers | 0 | 0.0% |
| Total | 71 | 100.0% |
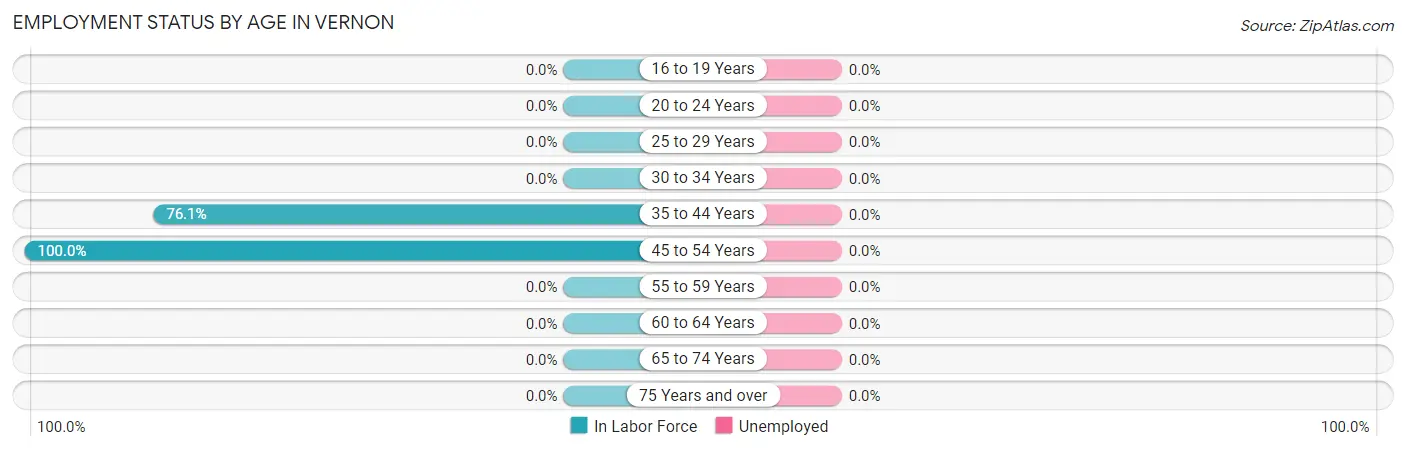
Employment Status by Age in Vernon
| Age Bracket | In Labor Force | Unemployed |
| 16 to 19 Years | 0 (0.0%) | 0 (0.0%) |
| 20 to 24 Years | 0 (0.0%) | 0 (0.0%) |
| 25 to 29 Years | 0 (0.0%) | 0 (0.0%) |
| 30 to 34 Years | 0 (0.0%) | 0 (0.0%) |
| 35 to 44 Years | 51 (76.1%) | 0 (0.0%) |
| 45 to 54 Years | 20 (100.0%) | 0 (0.0%) |
| 55 to 59 Years | 0 (0.0%) | 0 (0.0%) |
| 60 to 64 Years | 0 (0.0%) | 0 (0.0%) |
| 65 to 74 Years | 0 (0.0%) | 0 (0.0%) |
| 75 Years and over | 0 (0.0%) | 0 (0.0%) |
| Total | 71 (32.9%) | 0 (0.0%) |
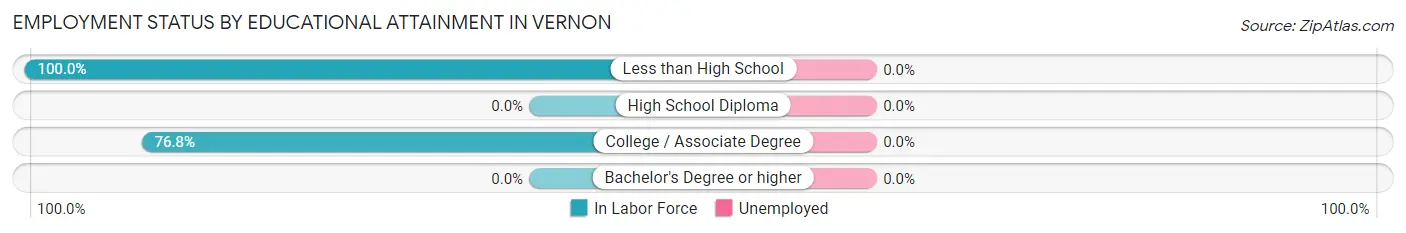
Employment Status by Educational Attainment in Vernon
| Educational Attainment | In Labor Force | Unemployed |
| Less than High School | 18 (100.0%) | 0 (0.0%) |
| High School Diploma | 0 (0.0%) | 0 (0.0%) |
| College / Associate Degree | 53 (76.8%) | 0 (0.0%) |
| Bachelor's Degree or higher | 0 (0.0%) | 0 (0.0%) |
| Total | 71 (61.2%) | 0 (0.0%) |
Employment Occupations by Sex in Vernon
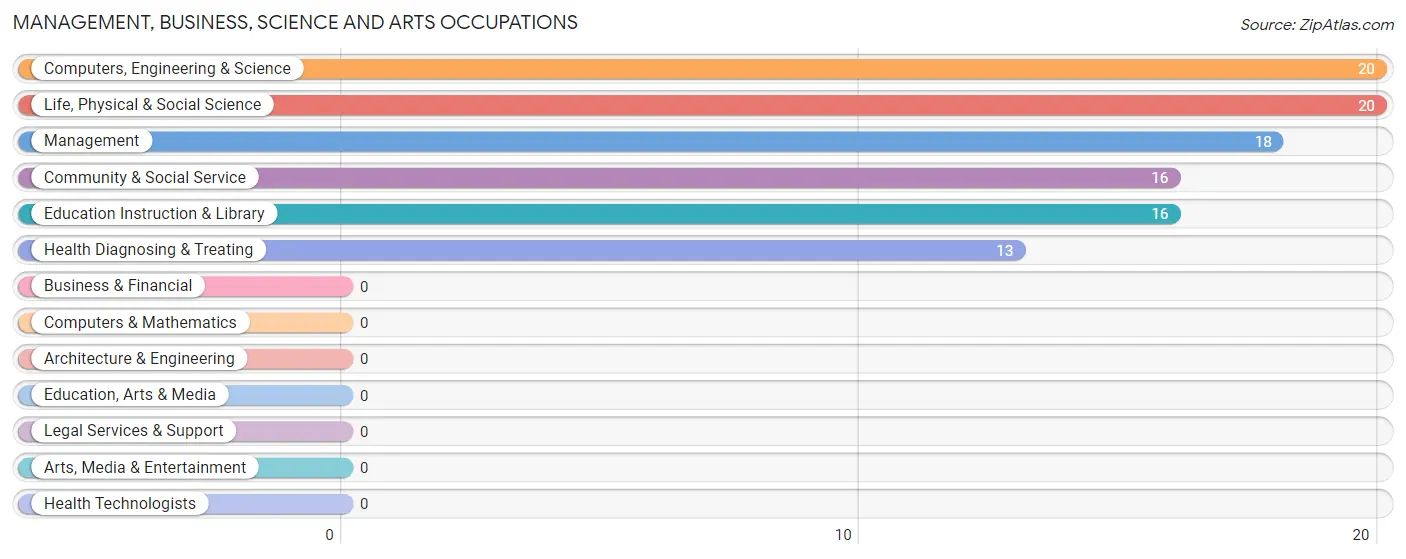
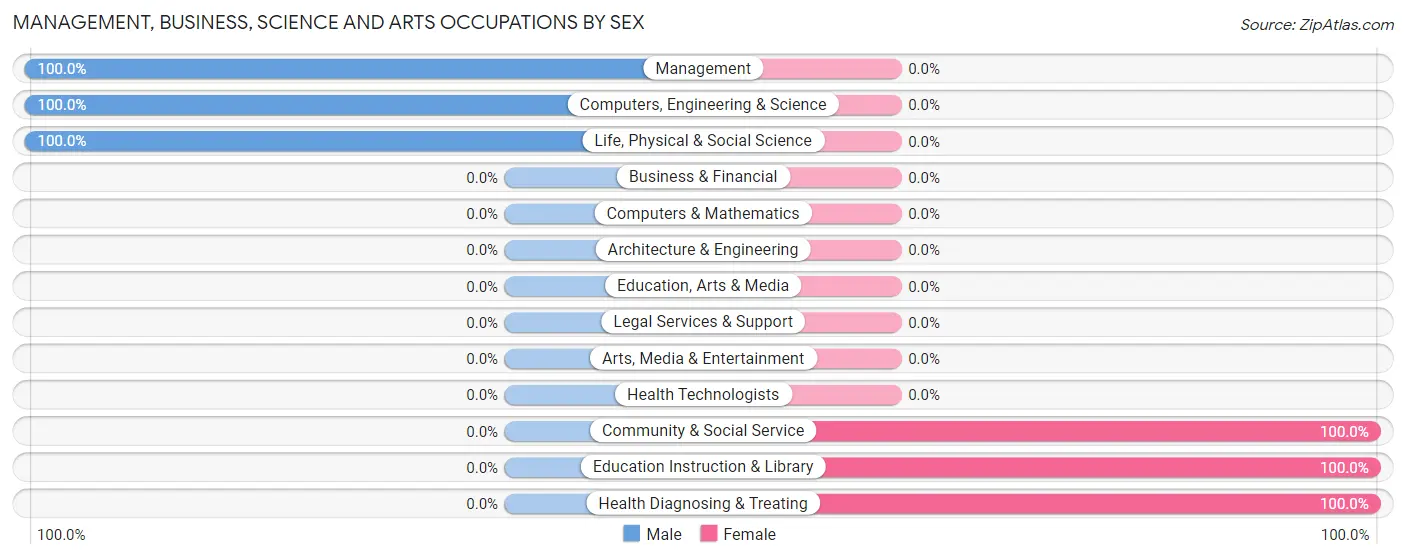
Management, Business, Science and Arts Occupations
The most common Management, Business, Science and Arts occupations in Vernon are Computers, Engineering & Science (20 | 28.2%), Life, Physical & Social Science (20 | 28.2%), Management (18 | 25.4%), Community & Social Service (16 | 22.5%), and Education Instruction & Library (16 | 22.5%).
Management, Business, Science and Arts Occupations by Sex
Within the Management, Business, Science and Arts occupations in Vernon, the most male-oriented occupations are Management (100.0%), Computers, Engineering & Science (100.0%), and Life, Physical & Social Science (100.0%), while the most female-oriented occupations are Community & Social Service (100.0%), Education Instruction & Library (100.0%), and Health Diagnosing & Treating (100.0%).
| Occupation | Male | Female |
| Management | 18 (100.0%) | 0 (0.0%) |
| Business & Financial | 0 (0.0%) | 0 (0.0%) |
| Computers, Engineering & Science | 20 (100.0%) | 0 (0.0%) |
| Computers & Mathematics | 0 (0.0%) | 0 (0.0%) |
| Architecture & Engineering | 0 (0.0%) | 0 (0.0%) |
| Life, Physical & Social Science | 20 (100.0%) | 0 (0.0%) |
| Community & Social Service | 0 (0.0%) | 16 (100.0%) |
| Education, Arts & Media | 0 (0.0%) | 0 (0.0%) |
| Legal Services & Support | 0 (0.0%) | 0 (0.0%) |
| Education Instruction & Library | 0 (0.0%) | 16 (100.0%) |
| Arts, Media & Entertainment | 0 (0.0%) | 0 (0.0%) |
| Health Diagnosing & Treating | 0 (0.0%) | 13 (100.0%) |
| Health Technologists | 0 (0.0%) | 0 (0.0%) |
| Total (Category) | 38 (56.7%) | 29 (43.3%) |
| Total (Overall) | 42 (59.2%) | 29 (40.8%) |
Services Occupations
Services Occupations by Sex
| Occupation | Male | Female |
| Healthcare Support | 0 (0.0%) | 0 (0.0%) |
| Security & Protection | 0 (0.0%) | 0 (0.0%) |
| Firefighting & Prevention | 0 (0.0%) | 0 (0.0%) |
| Law Enforcement | 0 (0.0%) | 0 (0.0%) |
| Food Preparation & Serving | 0 (0.0%) | 0 (0.0%) |
| Cleaning & Maintenance | 0 (0.0%) | 0 (0.0%) |
| Personal Care & Service | 0 (0.0%) | 0 (0.0%) |
| Total (Category) | 0 (0.0%) | 0 (0.0%) |
| Total (Overall) | 42 (59.2%) | 29 (40.8%) |
Sales and Office Occupations
Sales and Office Occupations by Sex
| Occupation | Male | Female |
| Sales & Related | 0 (0.0%) | 0 (0.0%) |
| Office & Administration | 0 (0.0%) | 0 (0.0%) |
| Total (Category) | 0 (0.0%) | 0 (0.0%) |
| Total (Overall) | 42 (59.2%) | 29 (40.8%) |
Natural Resources, Construction and Maintenance Occupations
The most common Natural Resources, Construction and Maintenance occupations in Vernon are , and Farming, Fishing & Forestry (4 | 5.6%).
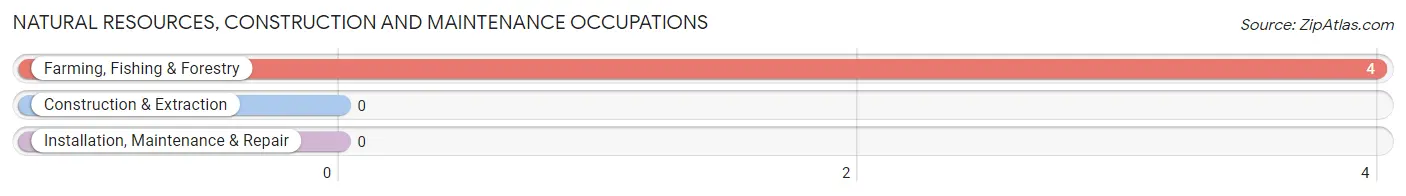
Natural Resources, Construction and Maintenance Occupations by Sex
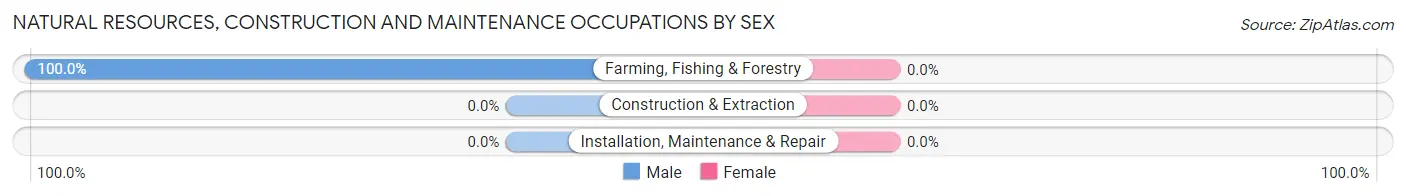
| Occupation | Male | Female |
| Farming, Fishing & Forestry | 4 (100.0%) | 0 (0.0%) |
| Construction & Extraction | 0 (0.0%) | 0 (0.0%) |
| Installation, Maintenance & Repair | 0 (0.0%) | 0 (0.0%) |
| Total (Category) | 4 (100.0%) | 0 (0.0%) |
| Total (Overall) | 42 (59.2%) | 29 (40.8%) |
Production, Transportation and Moving Occupations
Production, Transportation and Moving Occupations by Sex
| Occupation | Male | Female |
| Production | 0 (0.0%) | 0 (0.0%) |
| Transportation | 0 (0.0%) | 0 (0.0%) |
| Material Moving | 0 (0.0%) | 0 (0.0%) |
| Total (Category) | 0 (0.0%) | 0 (0.0%) |
| Total (Overall) | 42 (59.2%) | 29 (40.8%) |
Employment Industries by Sex in Vernon
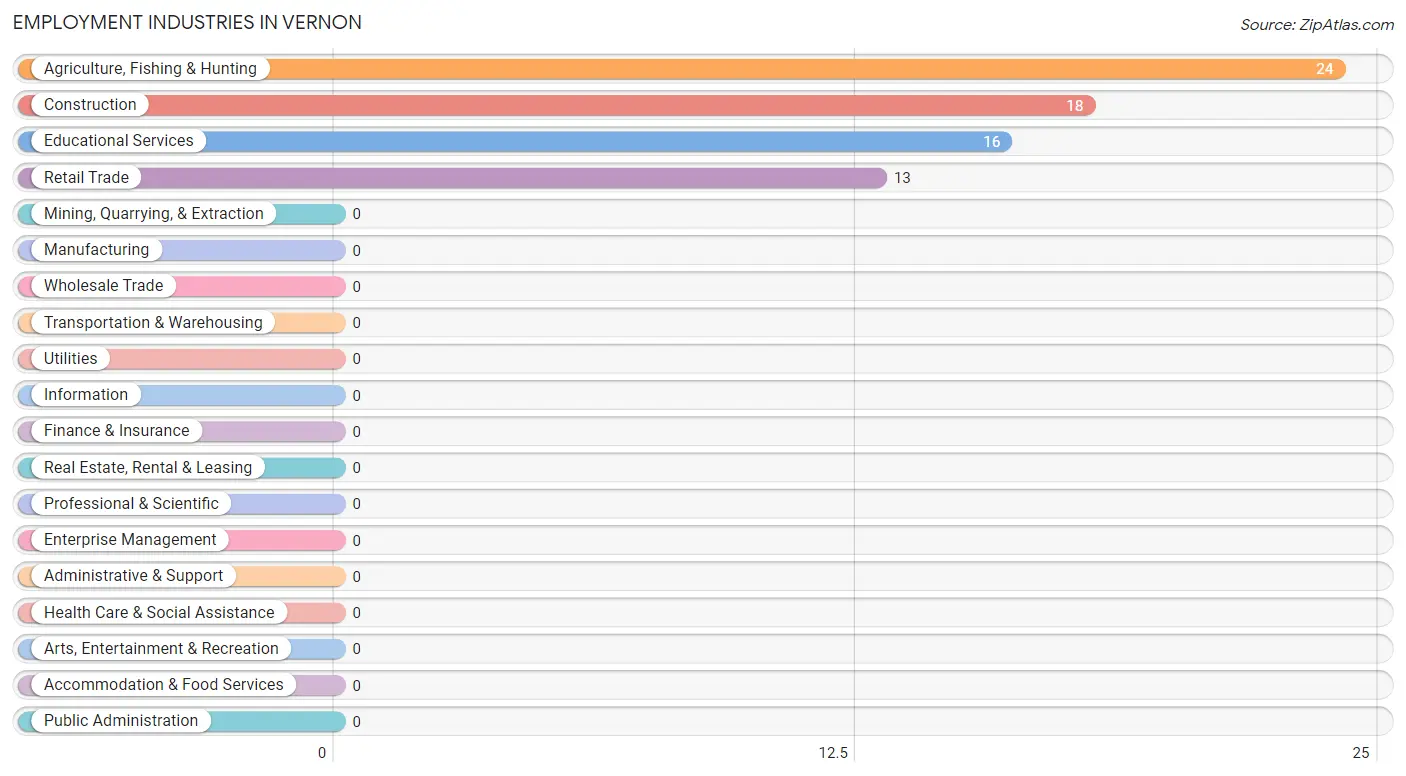
Employment Industries in Vernon
The major employment industries in Vernon include Agriculture, Fishing & Hunting (24 | 33.8%), Construction (18 | 25.4%), Educational Services (16 | 22.5%), and Retail Trade (13 | 18.3%).
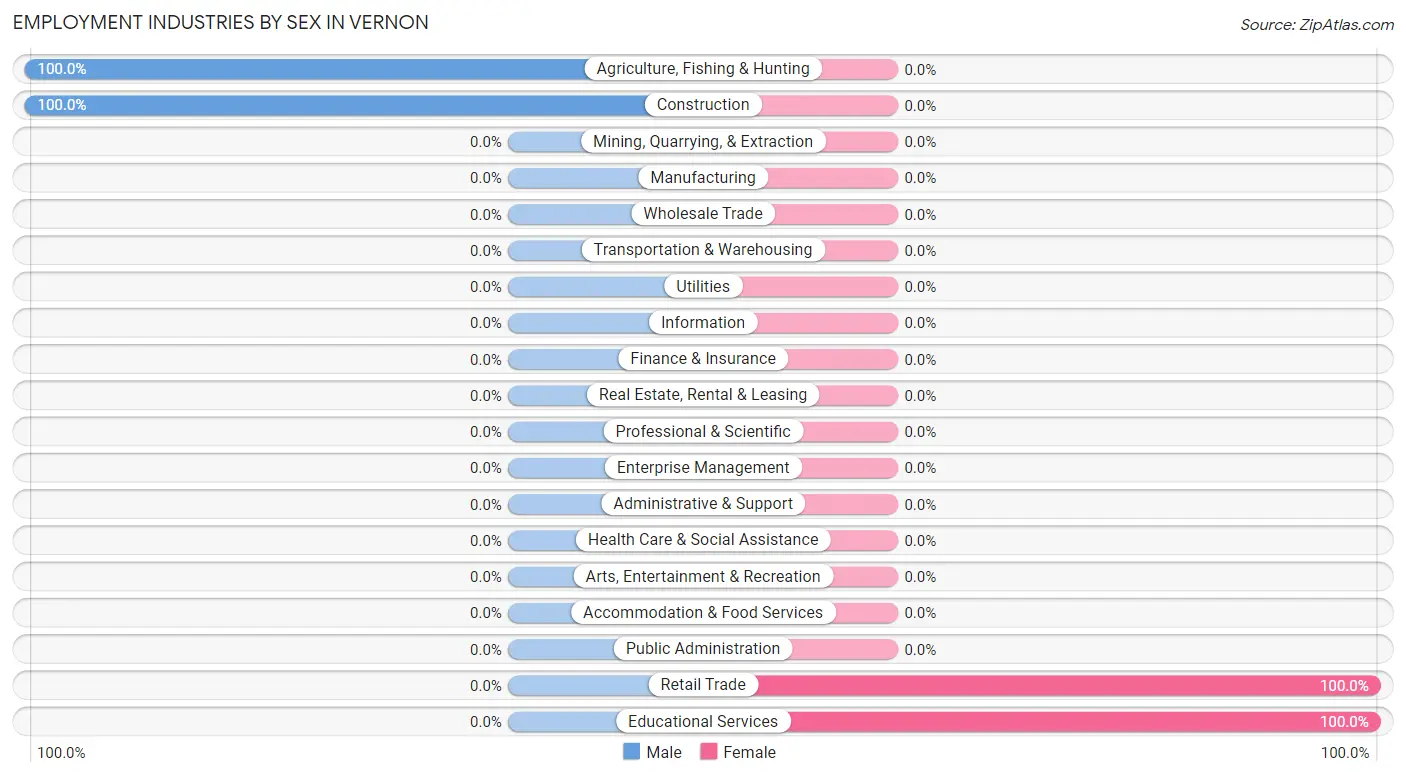
Employment Industries by Sex in Vernon
The Vernon industries that see more men than women are Agriculture, Fishing & Hunting (100.0%), and Construction (100.0%), whereas the industries that tend to have a higher number of women are Retail Trade (100.0%), and Educational Services (100.0%).
| Industry | Male | Female |
| Agriculture, Fishing & Hunting | 24 (100.0%) | 0 (0.0%) |
| Mining, Quarrying, & Extraction | 0 (0.0%) | 0 (0.0%) |
| Construction | 18 (100.0%) | 0 (0.0%) |
| Manufacturing | 0 (0.0%) | 0 (0.0%) |
| Wholesale Trade | 0 (0.0%) | 0 (0.0%) |
| Retail Trade | 0 (0.0%) | 13 (100.0%) |
| Transportation & Warehousing | 0 (0.0%) | 0 (0.0%) |
| Utilities | 0 (0.0%) | 0 (0.0%) |
| Information | 0 (0.0%) | 0 (0.0%) |
| Finance & Insurance | 0 (0.0%) | 0 (0.0%) |
| Real Estate, Rental & Leasing | 0 (0.0%) | 0 (0.0%) |
| Professional & Scientific | 0 (0.0%) | 0 (0.0%) |
| Enterprise Management | 0 (0.0%) | 0 (0.0%) |
| Administrative & Support | 0 (0.0%) | 0 (0.0%) |
| Educational Services | 0 (0.0%) | 16 (100.0%) |
| Health Care & Social Assistance | 0 (0.0%) | 0 (0.0%) |
| Arts, Entertainment & Recreation | 0 (0.0%) | 0 (0.0%) |
| Accommodation & Food Services | 0 (0.0%) | 0 (0.0%) |
| Public Administration | 0 (0.0%) | 0 (0.0%) |
| Total | 42 (59.2%) | 29 (40.8%) |
Education in Vernon
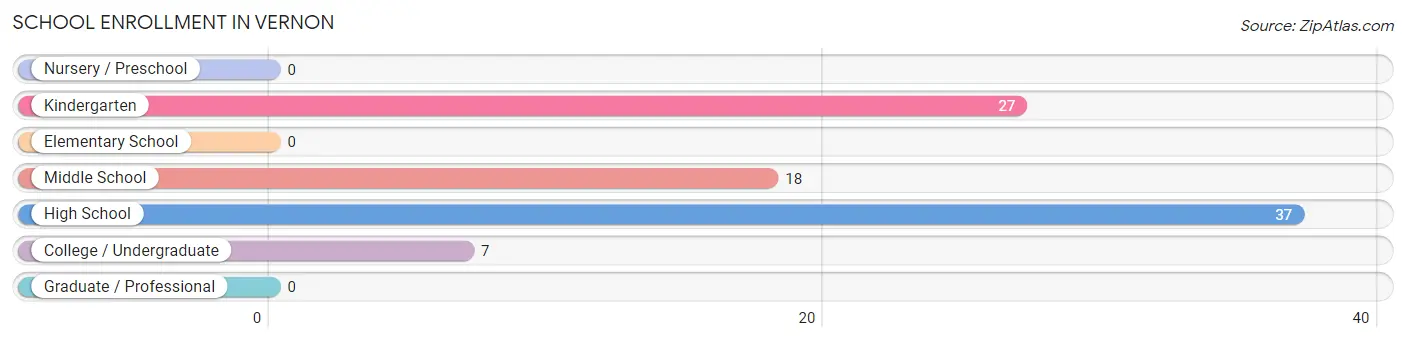
School Enrollment in Vernon
The most common levels of schooling among the 89 students in Vernon are high school (37 | 41.6%), kindergarten (27 | 30.3%), and middle school (18 | 20.2%).
| School Level | # Students | % Students |
| Nursery / Preschool | 0 | 0.0% |
| Kindergarten | 27 | 30.3% |
| Elementary School | 0 | 0.0% |
| Middle School | 18 | 20.2% |
| High School | 37 | 41.6% |
| College / Undergraduate | 7 | 7.9% |
| Graduate / Professional | 0 | 0.0% |
| Total | 89 | 100.0% |
School Enrollment by Age by Funding Source in Vernon
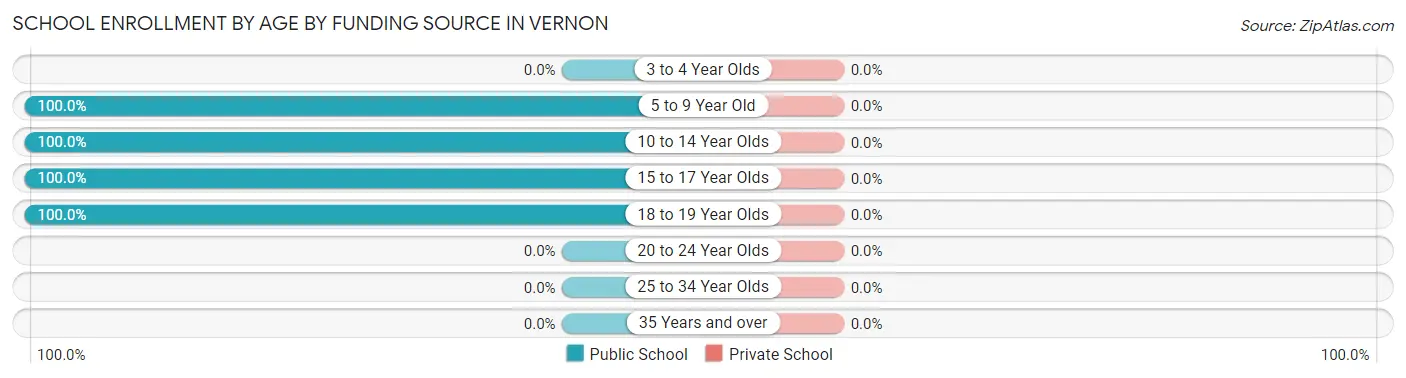
| Age Bracket | Public School | Private School |
| 3 to 4 Year Olds | 0 (0.0%) | 0 (0.0%) |
| 5 to 9 Year Old | 27 (100.0%) | 0 (0.0%) |
| 10 to 14 Year Olds | 32 (100.0%) | 0 (0.0%) |
| 15 to 17 Year Olds | 23 (100.0%) | 0 (0.0%) |
| 18 to 19 Year Olds | 7 (100.0%) | 0 (0.0%) |
| 20 to 24 Year Olds | 0 (0.0%) | 0 (0.0%) |
| 25 to 34 Year Olds | 0 (0.0%) | 0 (0.0%) |
| 35 Years and over | 0 (0.0%) | 0 (0.0%) |
| Total | 89 (100.0%) | 0 (0.0%) |
Educational Attainment by Field of Study in Vernon
, and education (35 | 100.0%) are the most common fields of study among 35 individuals in Vernon who have obtained a bachelor's degree or higher.
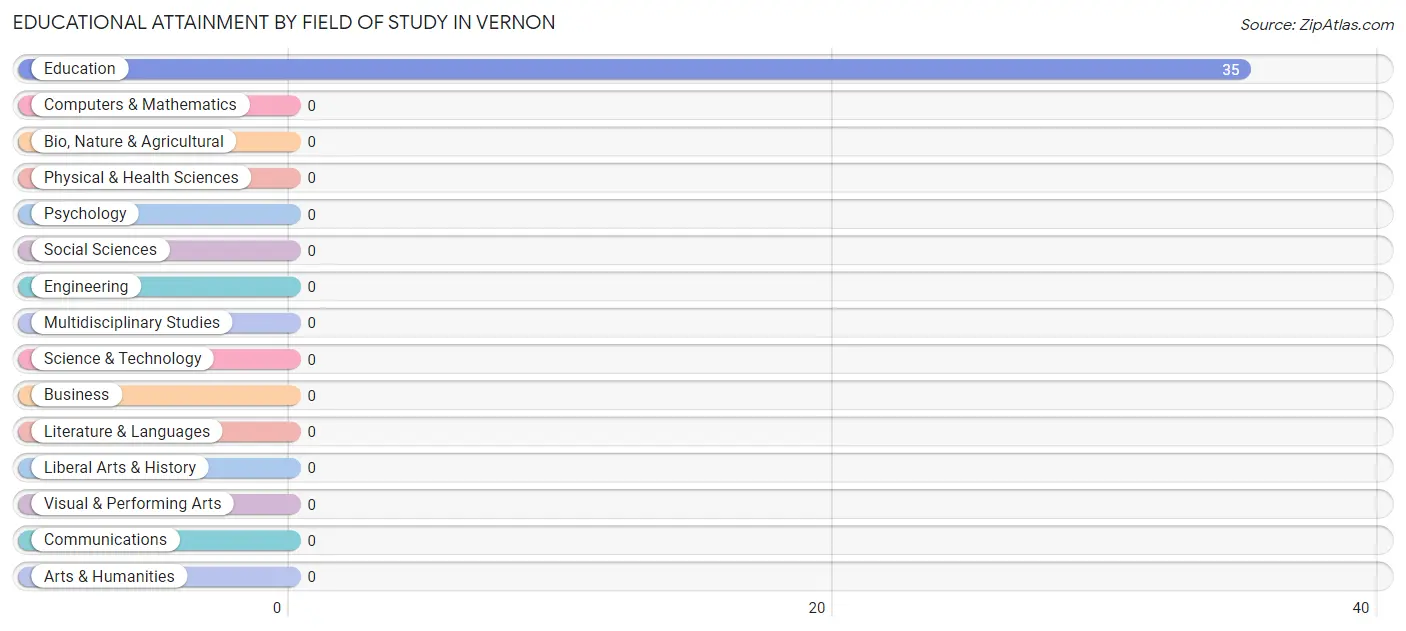
| Field of Study | # Graduates | % Graduates |
| Computers & Mathematics | 0 | 0.0% |
| Bio, Nature & Agricultural | 0 | 0.0% |
| Physical & Health Sciences | 0 | 0.0% |
| Psychology | 0 | 0.0% |
| Social Sciences | 0 | 0.0% |
| Engineering | 0 | 0.0% |
| Multidisciplinary Studies | 0 | 0.0% |
| Science & Technology | 0 | 0.0% |
| Business | 0 | 0.0% |
| Education | 35 | 100.0% |
| Literature & Languages | 0 | 0.0% |
| Liberal Arts & History | 0 | 0.0% |
| Visual & Performing Arts | 0 | 0.0% |
| Communications | 0 | 0.0% |
| Arts & Humanities | 0 | 0.0% |
| Total | 35 | 100.0% |
Transportation & Commute in Vernon
Vehicle Availability by Sex in Vernon
The most prevalent vehicle ownership categories in Vernon are males with 2 vehicles (20, accounting for 47.6%) and females with 2 vehicles (0, making up 69.0%).
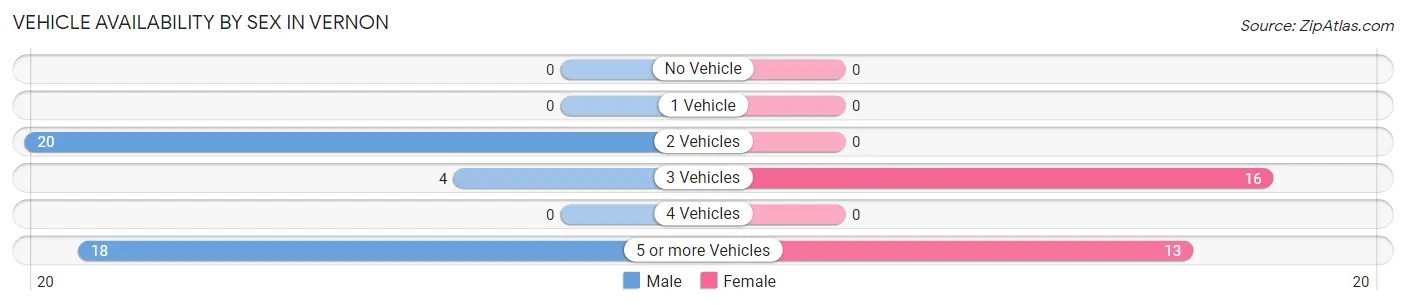
| Vehicles Available | Male | Female |
| No Vehicle | 0 (0.0%) | 0 (0.0%) |
| 1 Vehicle | 0 (0.0%) | 0 (0.0%) |
| 2 Vehicles | 20 (47.6%) | 0 (0.0%) |
| 3 Vehicles | 4 (9.5%) | 16 (55.2%) |
| 4 Vehicles | 0 (0.0%) | 0 (0.0%) |
| 5 or more Vehicles | 18 (42.9%) | 13 (44.8%) |
| Total | 42 (100.0%) | 29 (100.0%) |
Commute Time in Vernon
The most frequently occuring commute durations in Vernon are 40 to 44 minutes (20 commuters, 28.2%), 15 to 19 minutes (18 commuters, 25.4%), and 20 to 24 minutes (17 commuters, 23.9%).
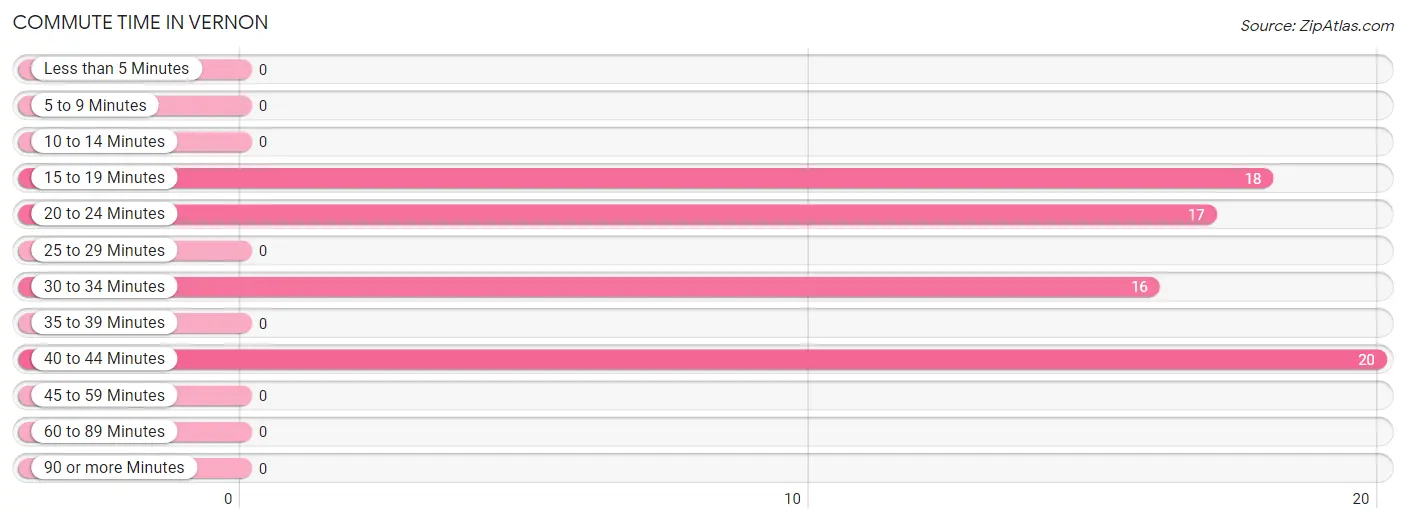
| Commute Time | # Commuters | % Commuters |
| Less than 5 Minutes | 0 | 0.0% |
| 5 to 9 Minutes | 0 | 0.0% |
| 10 to 14 Minutes | 0 | 0.0% |
| 15 to 19 Minutes | 18 | 25.4% |
| 20 to 24 Minutes | 17 | 23.9% |
| 25 to 29 Minutes | 0 | 0.0% |
| 30 to 34 Minutes | 16 | 22.5% |
| 35 to 39 Minutes | 0 | 0.0% |
| 40 to 44 Minutes | 20 | 28.2% |
| 45 to 59 Minutes | 0 | 0.0% |
| 60 to 89 Minutes | 0 | 0.0% |
| 90 or more Minutes | 0 | 0.0% |
Commute Time by Sex in Vernon
The most common commute times in Vernon are 40 to 44 minutes (20 commuters, 47.6%) for males and 30 to 34 minutes (16 commuters, 55.2%) for females.
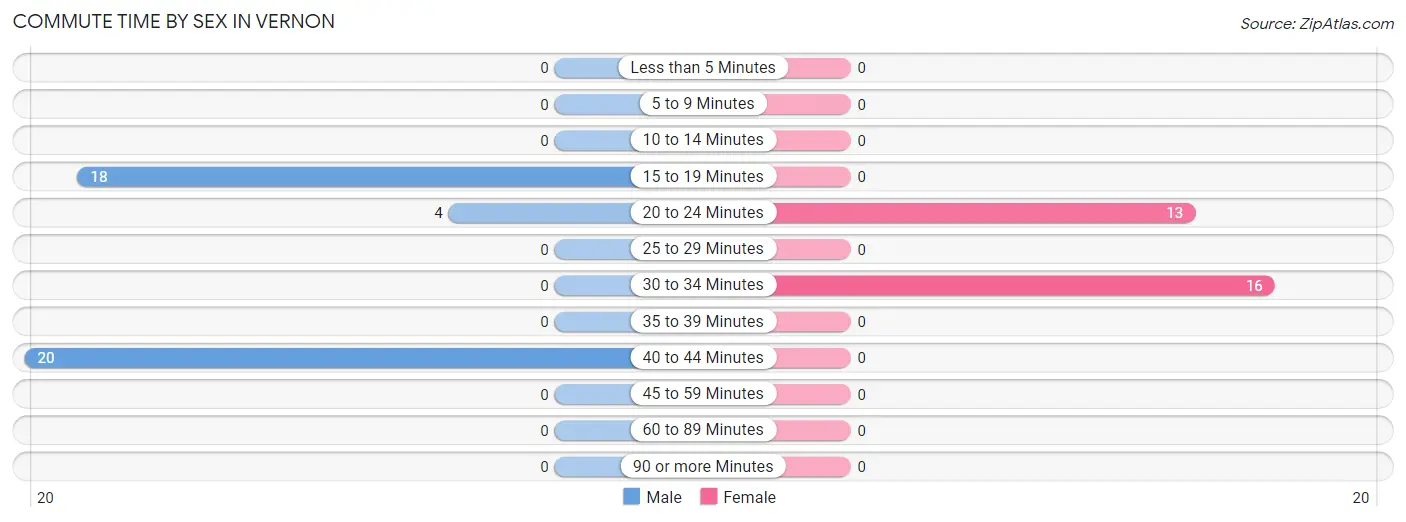
| Commute Time | Male | Female |
| Less than 5 Minutes | 0 (0.0%) | 0 (0.0%) |
| 5 to 9 Minutes | 0 (0.0%) | 0 (0.0%) |
| 10 to 14 Minutes | 0 (0.0%) | 0 (0.0%) |
| 15 to 19 Minutes | 18 (42.9%) | 0 (0.0%) |
| 20 to 24 Minutes | 4 (9.5%) | 13 (44.8%) |
| 25 to 29 Minutes | 0 (0.0%) | 0 (0.0%) |
| 30 to 34 Minutes | 0 (0.0%) | 16 (55.2%) |
| 35 to 39 Minutes | 0 (0.0%) | 0 (0.0%) |
| 40 to 44 Minutes | 20 (47.6%) | 0 (0.0%) |
| 45 to 59 Minutes | 0 (0.0%) | 0 (0.0%) |
| 60 to 89 Minutes | 0 (0.0%) | 0 (0.0%) |
| 90 or more Minutes | 0 (0.0%) | 0 (0.0%) |
Time of Departure to Work by Sex in Vernon
The most frequent times of departure to work in Vernon are 7:00 AM to 7:29 AM (38, 90.5%) for males and 6:30 AM to 6:59 AM (16, 55.2%) for females.
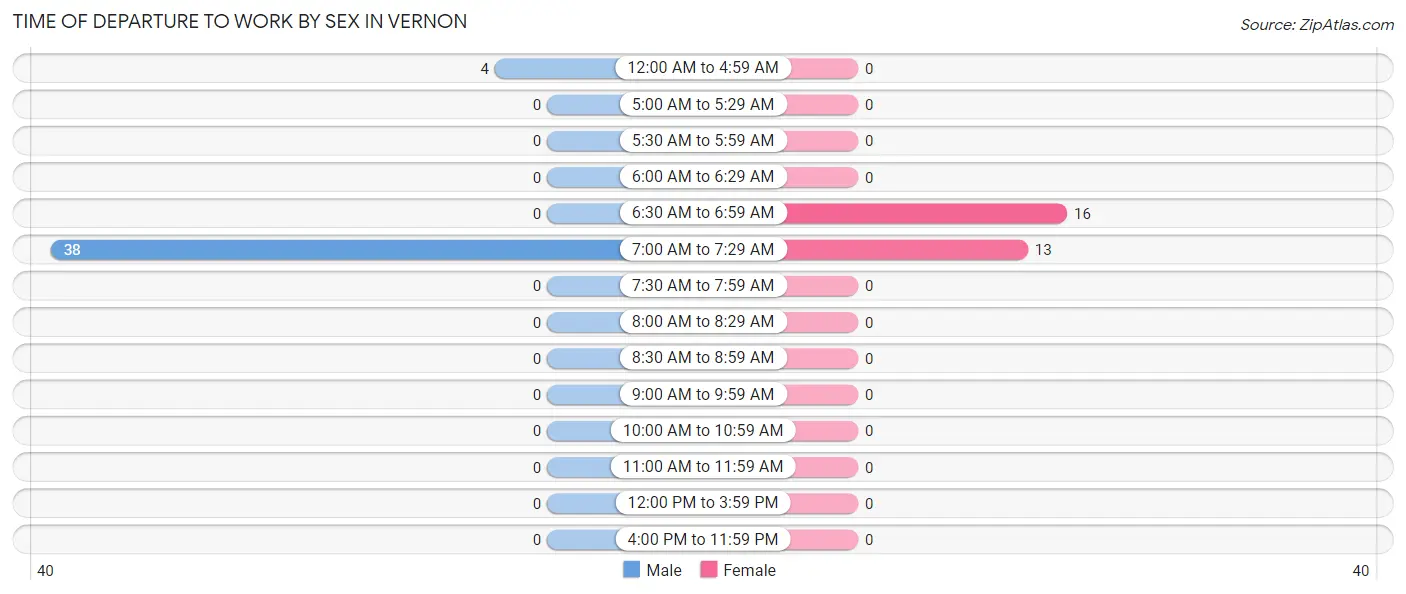
| Time of Departure | Male | Female |
| 12:00 AM to 4:59 AM | 4 (9.5%) | 0 (0.0%) |
| 5:00 AM to 5:29 AM | 0 (0.0%) | 0 (0.0%) |
| 5:30 AM to 5:59 AM | 0 (0.0%) | 0 (0.0%) |
| 6:00 AM to 6:29 AM | 0 (0.0%) | 0 (0.0%) |
| 6:30 AM to 6:59 AM | 0 (0.0%) | 16 (55.2%) |
| 7:00 AM to 7:29 AM | 38 (90.5%) | 13 (44.8%) |
| 7:30 AM to 7:59 AM | 0 (0.0%) | 0 (0.0%) |
| 8:00 AM to 8:29 AM | 0 (0.0%) | 0 (0.0%) |
| 8:30 AM to 8:59 AM | 0 (0.0%) | 0 (0.0%) |
| 9:00 AM to 9:59 AM | 0 (0.0%) | 0 (0.0%) |
| 10:00 AM to 10:59 AM | 0 (0.0%) | 0 (0.0%) |
| 11:00 AM to 11:59 AM | 0 (0.0%) | 0 (0.0%) |
| 12:00 PM to 3:59 PM | 0 (0.0%) | 0 (0.0%) |
| 4:00 PM to 11:59 PM | 0 (0.0%) | 0 (0.0%) |
| Total | 42 (100.0%) | 29 (100.0%) |
Housing Occupancy in Vernon
Occupancy by Ownership in Vernon
Of the total 49 dwellings in Vernon, owner-occupied units account for 29 (59.2%), while renter-occupied units make up 20 (40.8%).
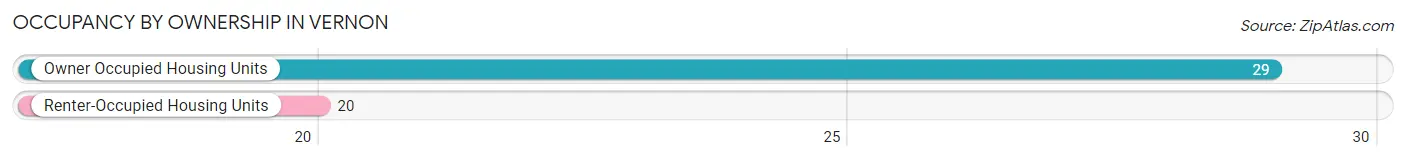
| Occupancy | # Housing Units | % Housing Units |
| Owner Occupied Housing Units | 29 | 59.2% |
| Renter-Occupied Housing Units | 20 | 40.8% |
| Total Occupied Housing Units | 49 | 100.0% |
Occupancy by Household Size in Vernon
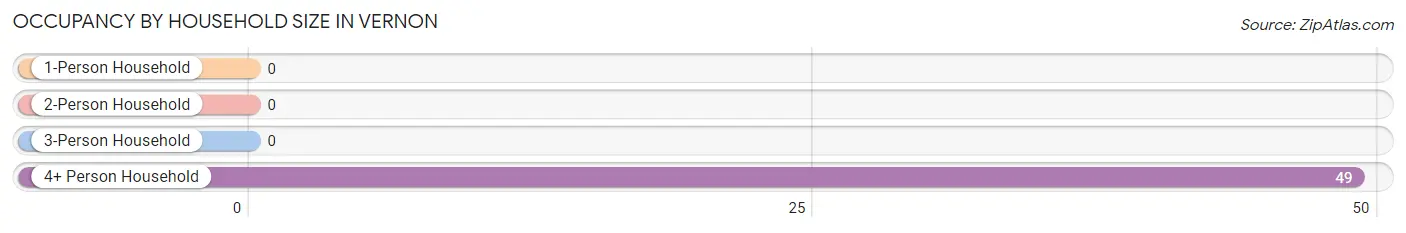
| Household Size | # Housing Units | % Housing Units |
| 1-Person Household | 0 | 0.0% |
| 2-Person Household | 0 | 0.0% |
| 3-Person Household | 0 | 0.0% |
| 4+ Person Household | 49 | 100.0% |
| Total Housing Units | 49 | 100.0% |
Occupancy by Ownership by Household Size in Vernon
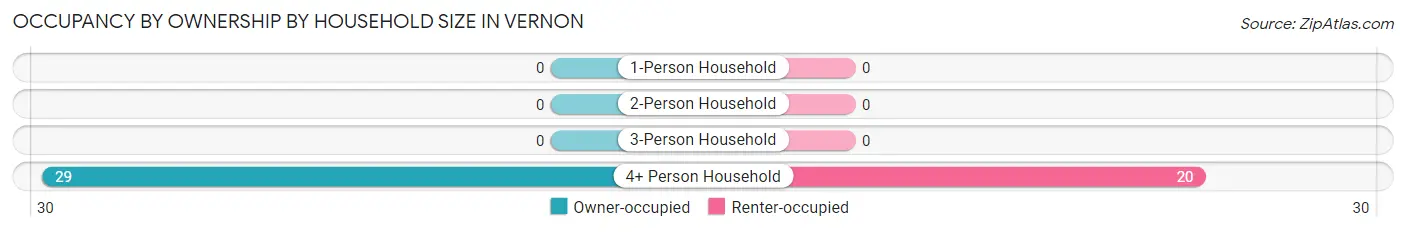
| Household Size | Owner-occupied | Renter-occupied |
| 1-Person Household | 0 (0.0%) | 0 (0.0%) |
| 2-Person Household | 0 (0.0%) | 0 (0.0%) |
| 3-Person Household | 0 (0.0%) | 0 (0.0%) |
| 4+ Person Household | 29 (59.2%) | 20 (40.8%) |
| Total Housing Units | 29 (59.2%) | 20 (40.8%) |
Occupancy by Educational Attainment in Vernon
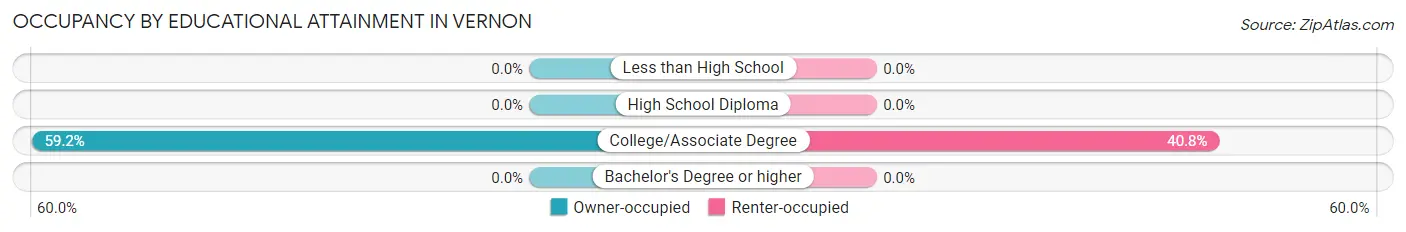
| Household Size | Owner-occupied | Renter-occupied |
| Less than High School | 0 (0.0%) | 0 (0.0%) |
| High School Diploma | 0 (0.0%) | 0 (0.0%) |
| College/Associate Degree | 29 (59.2%) | 20 (40.8%) |
| Bachelor's Degree or higher | 0 (0.0%) | 0 (0.0%) |
Occupancy by Age of Householder in Vernon

| Age Bracket | # Households | % Households |
| Under 35 Years | 0 | 0.0% |
| 35 to 44 Years | 33 | 67.3% |
| 45 to 54 Years | 16 | 32.7% |
| 55 to 64 Years | 0 | 0.0% |
| 65 to 74 Years | 0 | 0.0% |
| 75 to 84 Years | 0 | 0.0% |
| 85 Years and Over | 0 | 0.0% |
| Total | 49 | 100.0% |
Housing Finances in Vernon
Median Income by Occupancy in Vernon
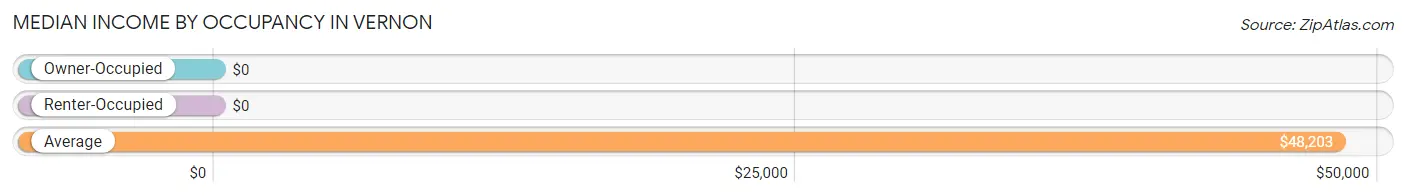
| Occupancy Type | # Households | Median Income |
| Owner-Occupied | 29 (59.2%) | $0 |
| Renter-Occupied | 20 (40.8%) | $0 |
| Average | 49 (100.0%) | $48,203 |
Occupancy by Householder Income Bracket in Vernon
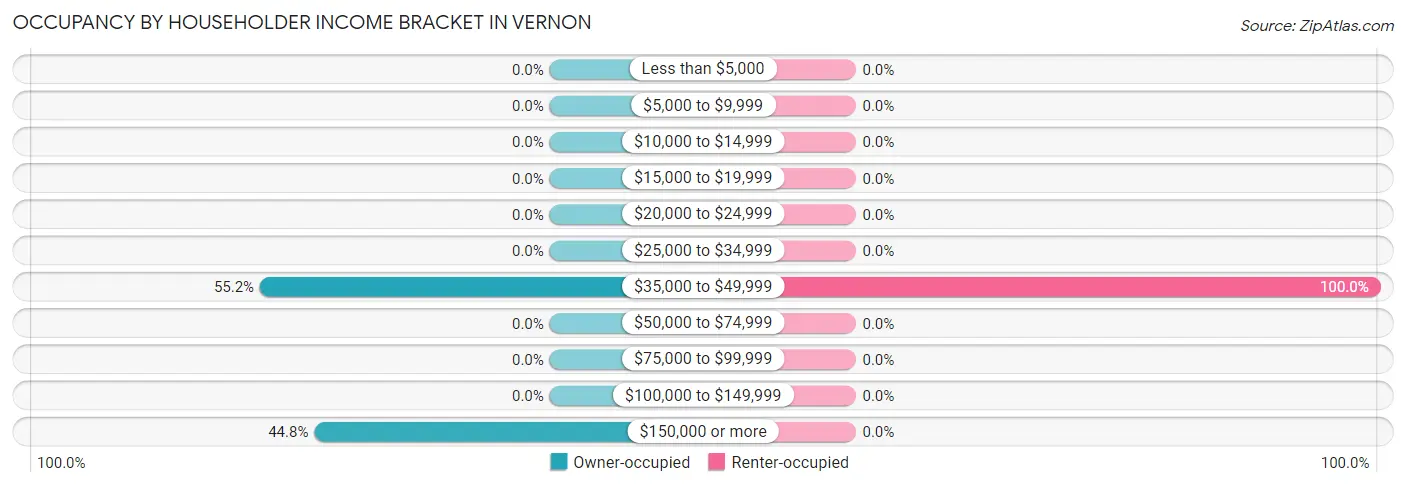
| Income Bracket | Owner-occupied | Renter-occupied |
| Less than $5,000 | 0 (0.0%) | 0 (0.0%) |
| $5,000 to $9,999 | 0 (0.0%) | 0 (0.0%) |
| $10,000 to $14,999 | 0 (0.0%) | 0 (0.0%) |
| $15,000 to $19,999 | 0 (0.0%) | 0 (0.0%) |
| $20,000 to $24,999 | 0 (0.0%) | 0 (0.0%) |
| $25,000 to $34,999 | 0 (0.0%) | 0 (0.0%) |
| $35,000 to $49,999 | 16 (55.2%) | 20 (100.0%) |
| $50,000 to $74,999 | 0 (0.0%) | 0 (0.0%) |
| $75,000 to $99,999 | 0 (0.0%) | 0 (0.0%) |
| $100,000 to $149,999 | 0 (0.0%) | 0 (0.0%) |
| $150,000 or more | 13 (44.8%) | 0 (0.0%) |
| Total | 29 (100.0%) | 20 (100.0%) |
Monthly Housing Cost Tiers in Vernon
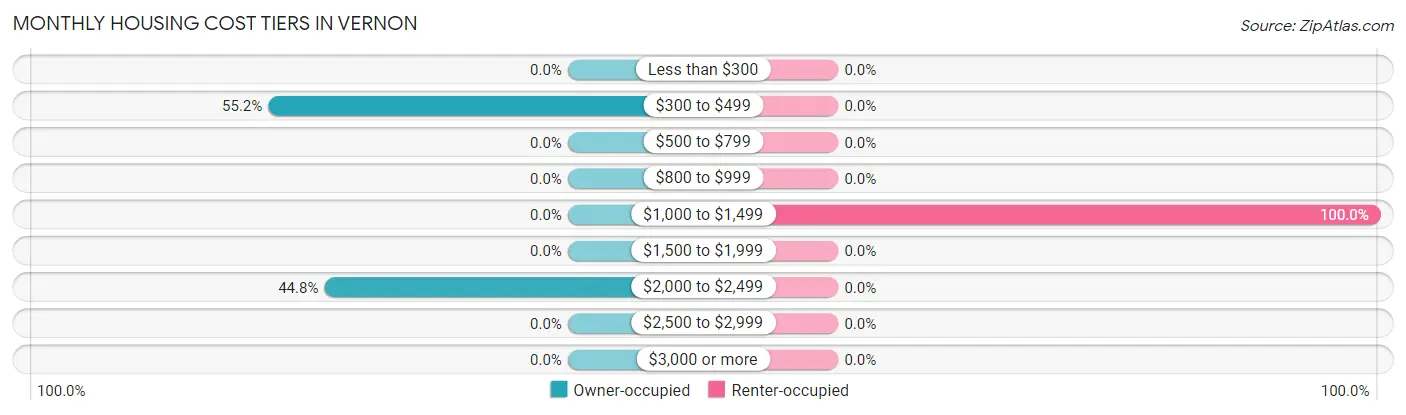
| Monthly Cost | Owner-occupied | Renter-occupied |
| Less than $300 | 0 (0.0%) | 0 (0.0%) |
| $300 to $499 | 16 (55.2%) | 0 (0.0%) |
| $500 to $799 | 0 (0.0%) | 0 (0.0%) |
| $800 to $999 | 0 (0.0%) | 0 (0.0%) |
| $1,000 to $1,499 | 0 (0.0%) | 20 (100.0%) |
| $1,500 to $1,999 | 0 (0.0%) | 0 (0.0%) |
| $2,000 to $2,499 | 13 (44.8%) | 0 (0.0%) |
| $2,500 to $2,999 | 0 (0.0%) | 0 (0.0%) |
| $3,000 or more | 0 (0.0%) | 0 (0.0%) |
| Total | 29 (100.0%) | 20 (100.0%) |
Physical Housing Characteristics in Vernon
Housing Structures in Vernon
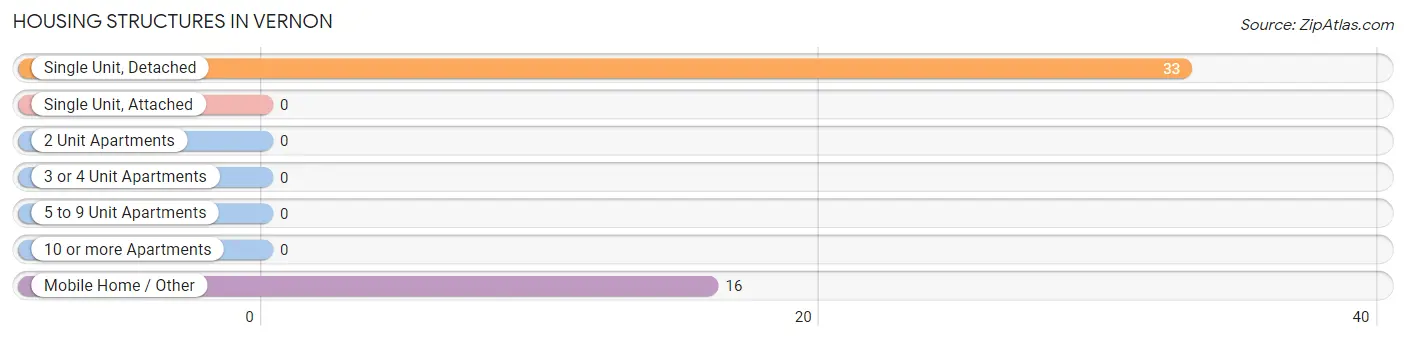
| Structure Type | # Housing Units | % Housing Units |
| Single Unit, Detached | 33 | 67.3% |
| Single Unit, Attached | 0 | 0.0% |
| 2 Unit Apartments | 0 | 0.0% |
| 3 or 4 Unit Apartments | 0 | 0.0% |
| 5 to 9 Unit Apartments | 0 | 0.0% |
| 10 or more Apartments | 0 | 0.0% |
| Mobile Home / Other | 16 | 32.7% |
| Total | 49 | 100.0% |
Housing Structures by Occupancy in Vernon
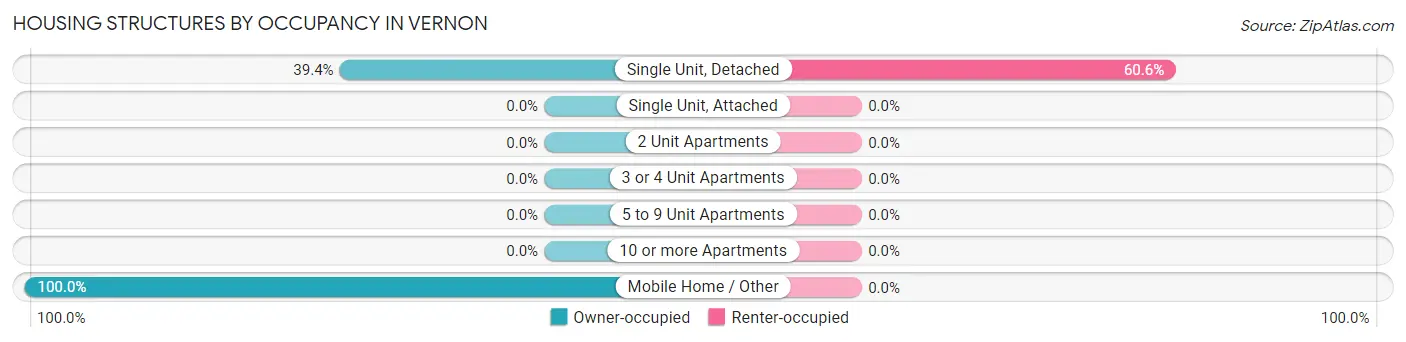
| Structure Type | Owner-occupied | Renter-occupied |
| Single Unit, Detached | 13 (39.4%) | 20 (60.6%) |
| Single Unit, Attached | 0 (0.0%) | 0 (0.0%) |
| 2 Unit Apartments | 0 (0.0%) | 0 (0.0%) |
| 3 or 4 Unit Apartments | 0 (0.0%) | 0 (0.0%) |
| 5 to 9 Unit Apartments | 0 (0.0%) | 0 (0.0%) |
| 10 or more Apartments | 0 (0.0%) | 0 (0.0%) |
| Mobile Home / Other | 16 (100.0%) | 0 (0.0%) |
| Total | 29 (59.2%) | 20 (40.8%) |
Housing Structures by Number of Rooms in Vernon
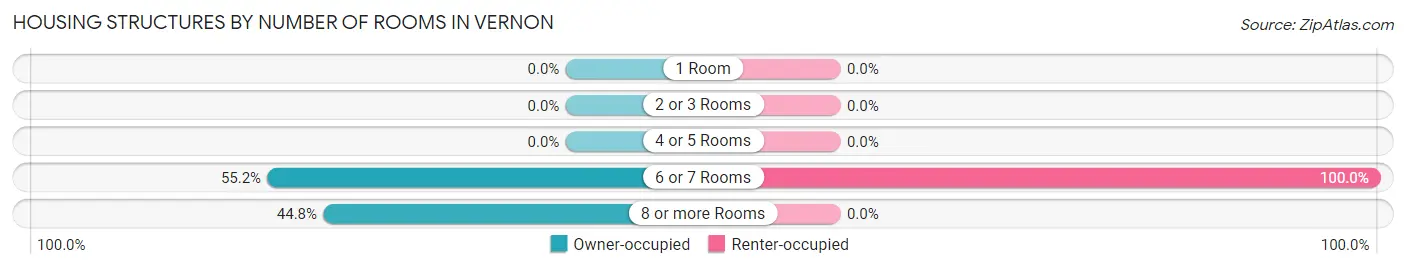
| Number of Rooms | Owner-occupied | Renter-occupied |
| 1 Room | 0 (0.0%) | 0 (0.0%) |
| 2 or 3 Rooms | 0 (0.0%) | 0 (0.0%) |
| 4 or 5 Rooms | 0 (0.0%) | 0 (0.0%) |
| 6 or 7 Rooms | 16 (55.2%) | 20 (100.0%) |
| 8 or more Rooms | 13 (44.8%) | 0 (0.0%) |
| Total | 29 (100.0%) | 20 (100.0%) |
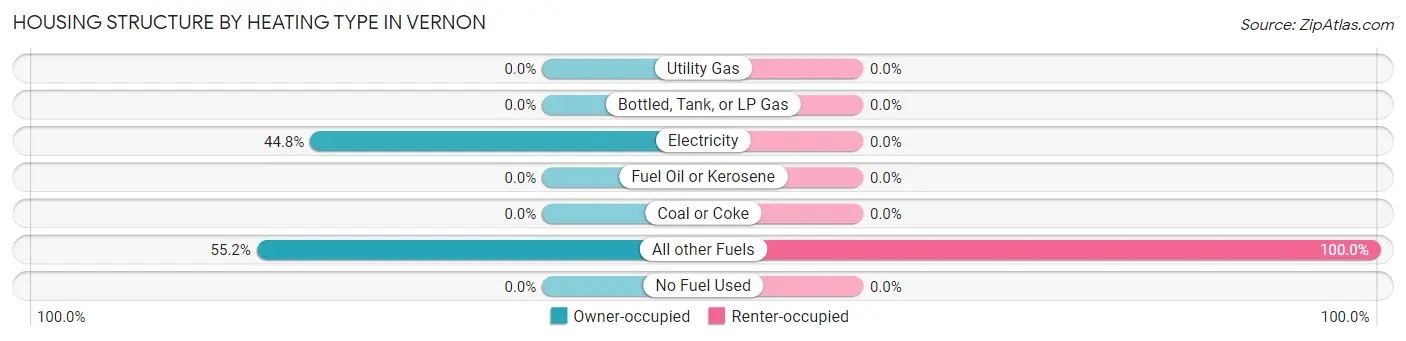
Housing Structure by Heating Type in Vernon
| Heating Type | Owner-occupied | Renter-occupied |
| Utility Gas | 0 (0.0%) | 0 (0.0%) |
| Bottled, Tank, or LP Gas | 0 (0.0%) | 0 (0.0%) |
| Electricity | 13 (44.8%) | 0 (0.0%) |
| Fuel Oil or Kerosene | 0 (0.0%) | 0 (0.0%) |
| Coal or Coke | 0 (0.0%) | 0 (0.0%) |
| All other Fuels | 16 (55.2%) | 20 (100.0%) |
| No Fuel Used | 0 (0.0%) | 0 (0.0%) |
| Total | 29 (100.0%) | 20 (100.0%) |
Household Vehicle Usage in Vernon
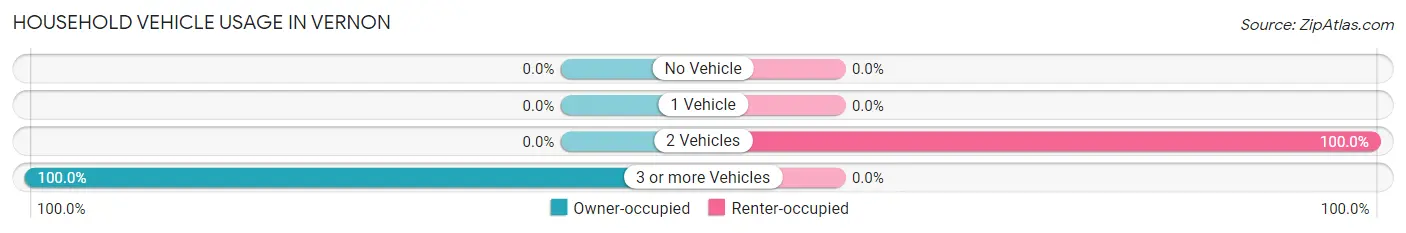
| Vehicles per Household | Owner-occupied | Renter-occupied |
| No Vehicle | 0 (0.0%) | 0 (0.0%) |
| 1 Vehicle | 0 (0.0%) | 0 (0.0%) |
| 2 Vehicles | 0 (0.0%) | 20 (100.0%) |
| 3 or more Vehicles | 29 (100.0%) | 0 (0.0%) |
| Total | 29 (100.0%) | 20 (100.0%) |
Real Estate & Mortgages in Vernon
Real Estate and Mortgage Overview in Vernon
| Characteristic | Without Mortgage | With Mortgage |
| Housing Units | 16 | 13 |
| Median Property Value | - | - |
| Median Household Income | - | - |
| Monthly Housing Costs | - | - |
| Real Estate Taxes | - | - |
Property Value by Mortgage Status in Vernon
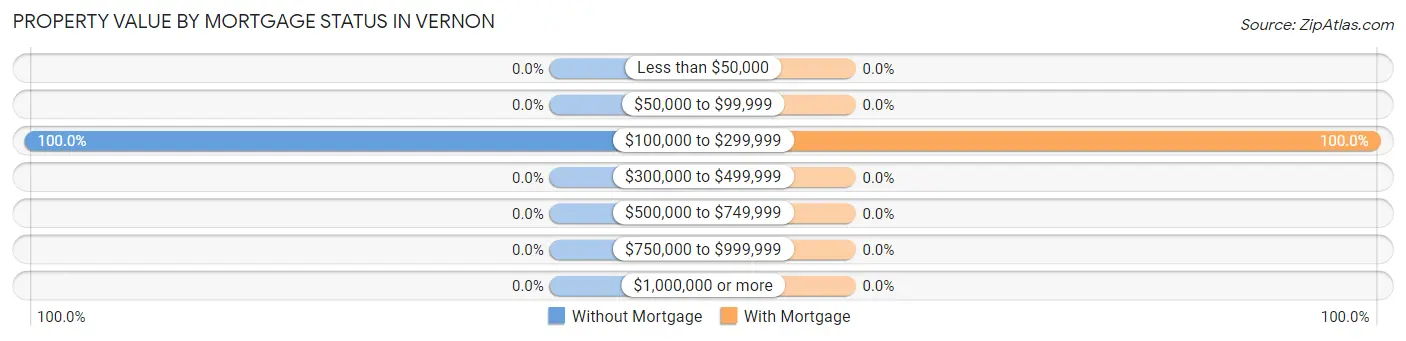
| Property Value | Without Mortgage | With Mortgage |
| Less than $50,000 | 0 (0.0%) | 0 (0.0%) |
| $50,000 to $99,999 | 0 (0.0%) | 0 (0.0%) |
| $100,000 to $299,999 | 16 (100.0%) | 13 (100.0%) |
| $300,000 to $499,999 | 0 (0.0%) | 0 (0.0%) |
| $500,000 to $749,999 | 0 (0.0%) | 0 (0.0%) |
| $750,000 to $999,999 | 0 (0.0%) | 0 (0.0%) |
| $1,000,000 or more | 0 (0.0%) | 0 (0.0%) |
| Total | 16 (100.0%) | 13 (100.0%) |
Household Income by Mortgage Status in Vernon
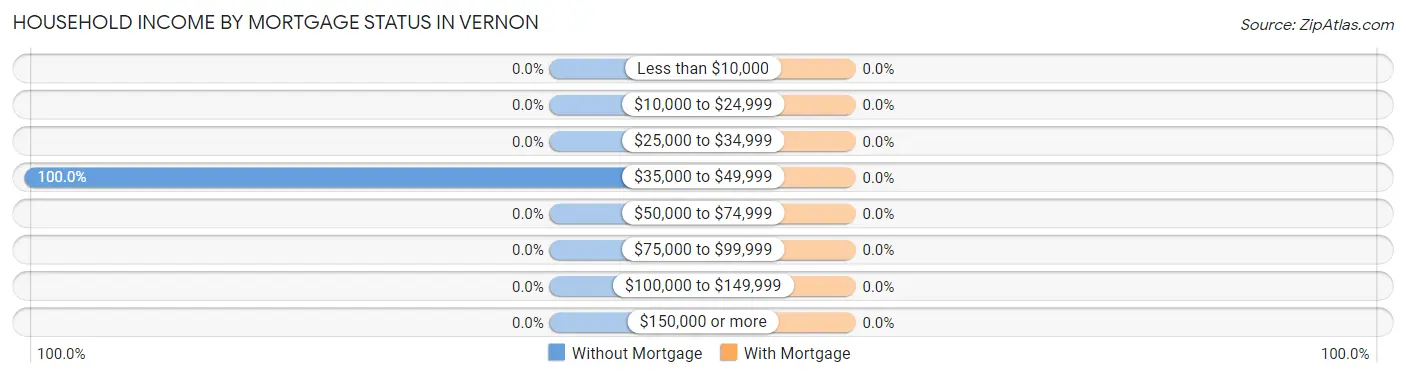
| Household Income | Without Mortgage | With Mortgage |
| Less than $10,000 | 0 (0.0%) | 0 (0.0%) |
| $10,000 to $24,999 | 0 (0.0%) | 0 (0.0%) |
| $25,000 to $34,999 | 0 (0.0%) | 0 (0.0%) |
| $35,000 to $49,999 | 16 (100.0%) | 0 (0.0%) |
| $50,000 to $74,999 | 0 (0.0%) | 0 (0.0%) |
| $75,000 to $99,999 | 0 (0.0%) | 0 (0.0%) |
| $100,000 to $149,999 | 0 (0.0%) | 0 (0.0%) |
| $150,000 or more | 0 (0.0%) | 0 (0.0%) |
| Total | 16 (100.0%) | 13 (100.0%) |
Property Value to Household Income Ratio in Vernon
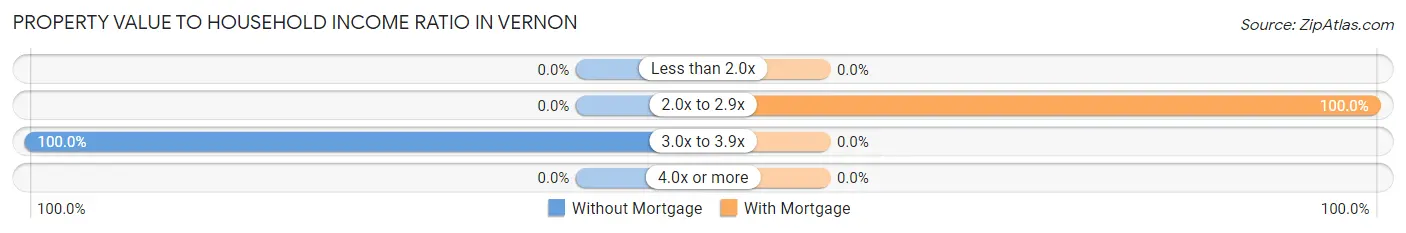
| Value-to-Income Ratio | Without Mortgage | With Mortgage |
| Less than 2.0x | 0 (0.0%) | 0 (0.0%) |
| 2.0x to 2.9x | 0 (0.0%) | 13 (100.0%) |
| 3.0x to 3.9x | 16 (100.0%) | 0 (0.0%) |
| 4.0x or more | 0 (0.0%) | 0 (0.0%) |
| Total | 16 (100.0%) | 13 (100.0%) |
Real Estate Taxes by Mortgage Status in Vernon
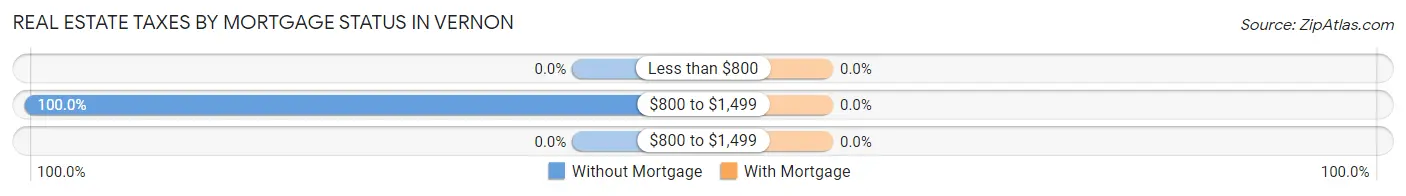
| Property Taxes | Without Mortgage | With Mortgage |
| Less than $800 | 0 (0.0%) | 0 (0.0%) |
| $800 to $1,499 | 16 (100.0%) | 0 (0.0%) |
| $800 to $1,499 | 0 (0.0%) | 0 (0.0%) |
| Total | 16 (100.0%) | 13 (100.0%) |
Health & Disability in Vernon
Health Insurance Coverage by Age in Vernon
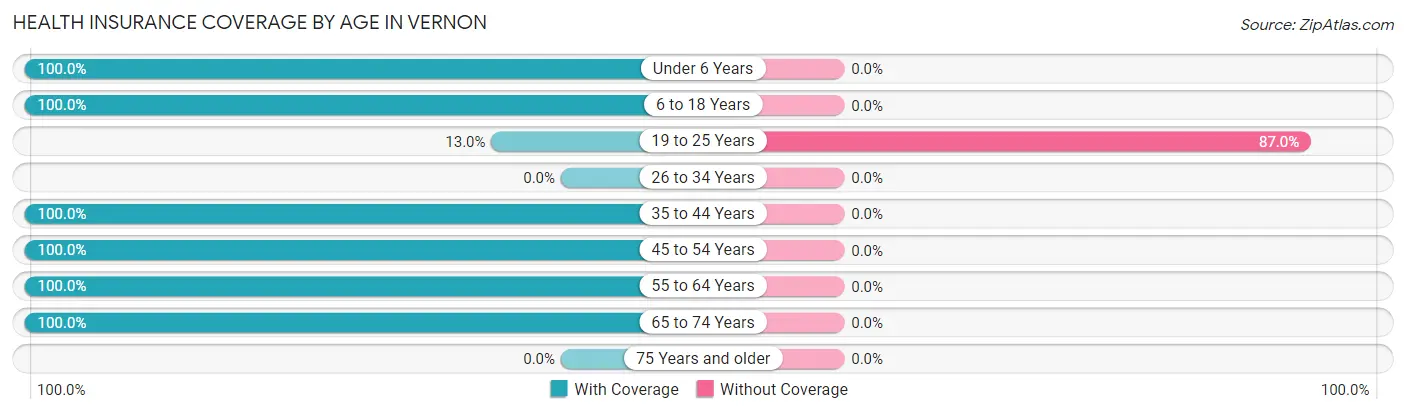
| Age Bracket | With Coverage | Without Coverage |
| Under 6 Years | 58 (100.0%) | 0 (0.0%) |
| 6 to 18 Years | 68 (100.0%) | 0 (0.0%) |
| 19 to 25 Years | 7 (13.0%) | 47 (87.0%) |
| 26 to 34 Years | 0 (0.0%) | 0 (0.0%) |
| 35 to 44 Years | 67 (100.0%) | 0 (0.0%) |
| 45 to 54 Years | 20 (100.0%) | 0 (0.0%) |
| 55 to 64 Years | 29 (100.0%) | 0 (0.0%) |
| 65 to 74 Years | 35 (100.0%) | 0 (0.0%) |
| 75 Years and older | 0 (0.0%) | 0 (0.0%) |
| Total | 284 (85.8%) | 47 (14.2%) |
Health Insurance Coverage by Citizenship Status in Vernon
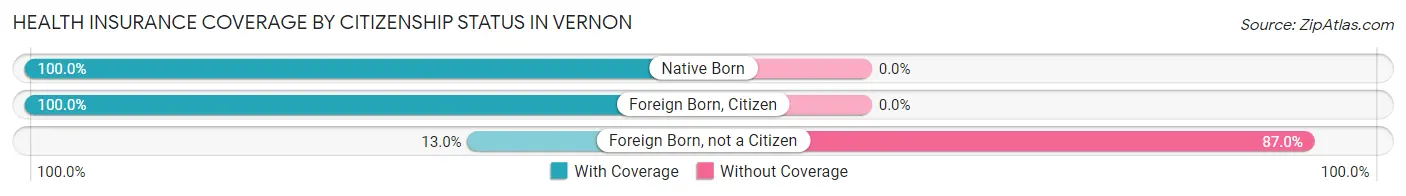
| Citizenship Status | With Coverage | Without Coverage |
| Native Born | 58 (100.0%) | 0 (0.0%) |
| Foreign Born, Citizen | 68 (100.0%) | 0 (0.0%) |
| Foreign Born, not a Citizen | 7 (13.0%) | 47 (87.0%) |
Health Insurance Coverage by Household Income in Vernon
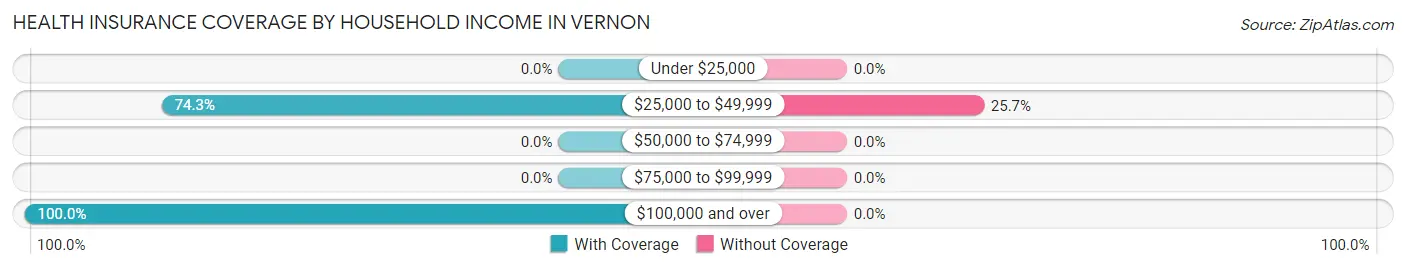
| Household Income | With Coverage | Without Coverage |
| Under $25,000 | 0 (0.0%) | 0 (0.0%) |
| $25,000 to $49,999 | 136 (74.3%) | 47 (25.7%) |
| $50,000 to $74,999 | 0 (0.0%) | 0 (0.0%) |
| $75,000 to $99,999 | 0 (0.0%) | 0 (0.0%) |
| $100,000 and over | 148 (100.0%) | 0 (0.0%) |
Public vs Private Health Insurance Coverage by Age in Vernon
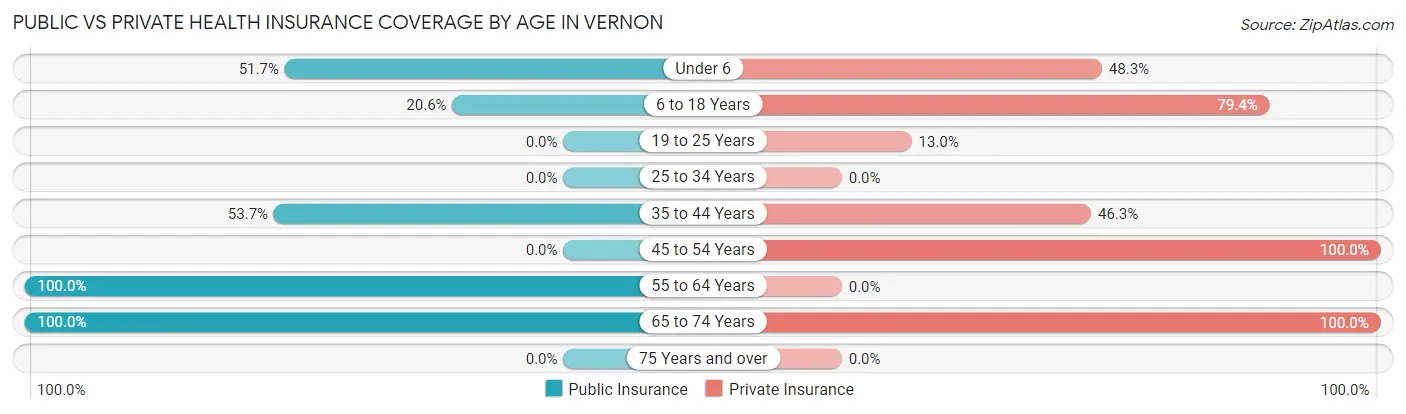
| Age Bracket | Public Insurance | Private Insurance |
| Under 6 | 30 (51.7%) | 28 (48.3%) |
| 6 to 18 Years | 14 (20.6%) | 54 (79.4%) |
| 19 to 25 Years | 0 (0.0%) | 7 (13.0%) |
| 25 to 34 Years | 0 (0.0%) | 0 (0.0%) |
| 35 to 44 Years | 36 (53.7%) | 31 (46.3%) |
| 45 to 54 Years | 0 (0.0%) | 20 (100.0%) |
| 55 to 64 Years | 29 (100.0%) | 0 (0.0%) |
| 65 to 74 Years | 35 (100.0%) | 35 (100.0%) |
| 75 Years and over | 0 (0.0%) | 0 (0.0%) |
| Total | 144 (43.5%) | 175 (52.9%) |
Disability Status by Sex by Age in Vernon
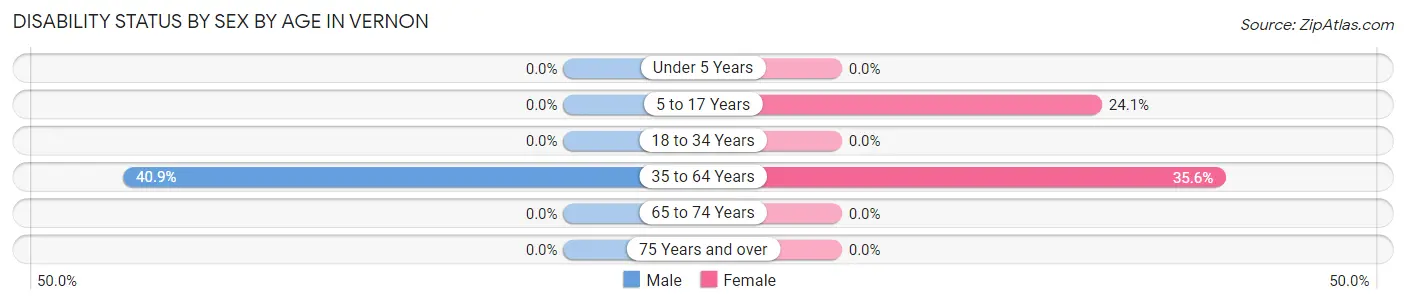
| Age Bracket | Male | Female |
| Under 5 Years | 0 (0.0%) | 0 (0.0%) |
| 5 to 17 Years | 0 (0.0%) | 14 (24.1%) |
| 18 to 34 Years | 0 (0.0%) | 0 (0.0%) |
| 35 to 64 Years | 29 (40.8%) | 16 (35.6%) |
| 65 to 74 Years | 0 (0.0%) | 0 (0.0%) |
| 75 Years and over | 0 (0.0%) | 0 (0.0%) |
Disability Class by Sex by Age in Vernon
Disability Class: Hearing Difficulty
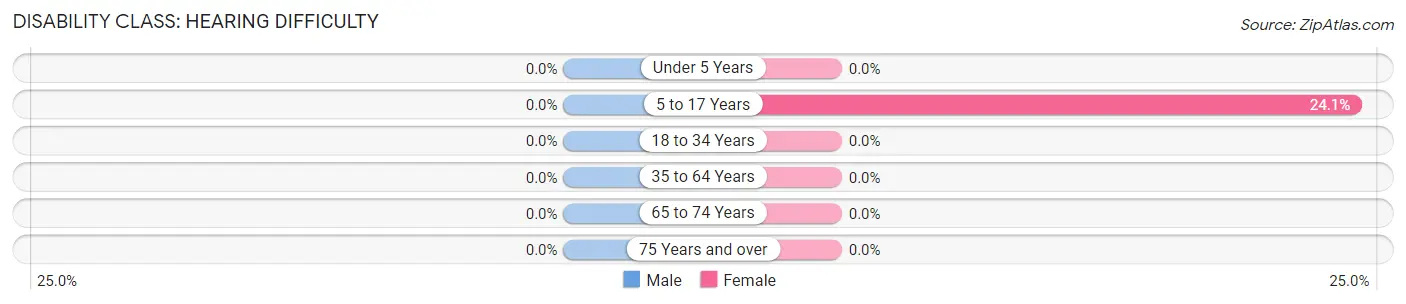
| Age Bracket | Male | Female |
| Under 5 Years | 0 (0.0%) | 0 (0.0%) |
| 5 to 17 Years | 0 (0.0%) | 14 (24.1%) |
| 18 to 34 Years | 0 (0.0%) | 0 (0.0%) |
| 35 to 64 Years | 0 (0.0%) | 0 (0.0%) |
| 65 to 74 Years | 0 (0.0%) | 0 (0.0%) |
| 75 Years and over | 0 (0.0%) | 0 (0.0%) |
Disability Class: Vision Difficulty

| Age Bracket | Male | Female |
| Under 5 Years | 0 (0.0%) | 0 (0.0%) |
| 5 to 17 Years | 0 (0.0%) | 14 (24.1%) |
| 18 to 34 Years | 0 (0.0%) | 0 (0.0%) |
| 35 to 64 Years | 0 (0.0%) | 0 (0.0%) |
| 65 to 74 Years | 0 (0.0%) | 0 (0.0%) |
| 75 Years and over | 0 (0.0%) | 0 (0.0%) |
Disability Class: Cognitive Difficulty
| Age Bracket | Male | Female |
| 5 to 17 Years | 0 (0.0%) | 0 (0.0%) |
| 18 to 34 Years | 0 (0.0%) | 0 (0.0%) |
| 35 to 64 Years | 0 (0.0%) | 0 (0.0%) |
| 65 to 74 Years | 0 (0.0%) | 0 (0.0%) |
| 75 Years and over | 0 (0.0%) | 0 (0.0%) |
Disability Class: Ambulatory Difficulty
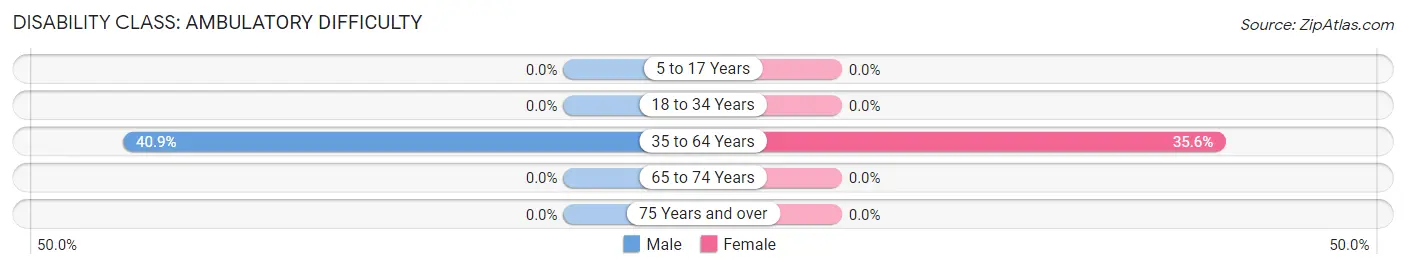
| Age Bracket | Male | Female |
| 5 to 17 Years | 0 (0.0%) | 0 (0.0%) |
| 18 to 34 Years | 0 (0.0%) | 0 (0.0%) |
| 35 to 64 Years | 29 (40.8%) | 16 (35.6%) |
| 65 to 74 Years | 0 (0.0%) | 0 (0.0%) |
| 75 Years and over | 0 (0.0%) | 0 (0.0%) |
Disability Class: Self-Care Difficulty
| Age Bracket | Male | Female |
| 5 to 17 Years | 0 (0.0%) | 0 (0.0%) |
| 18 to 34 Years | 0 (0.0%) | 0 (0.0%) |
| 35 to 64 Years | 0 (0.0%) | 0 (0.0%) |
| 65 to 74 Years | 0 (0.0%) | 0 (0.0%) |
| 75 Years and over | 0 (0.0%) | 0 (0.0%) |
Technology Access in Vernon
Computing Device Access in Vernon
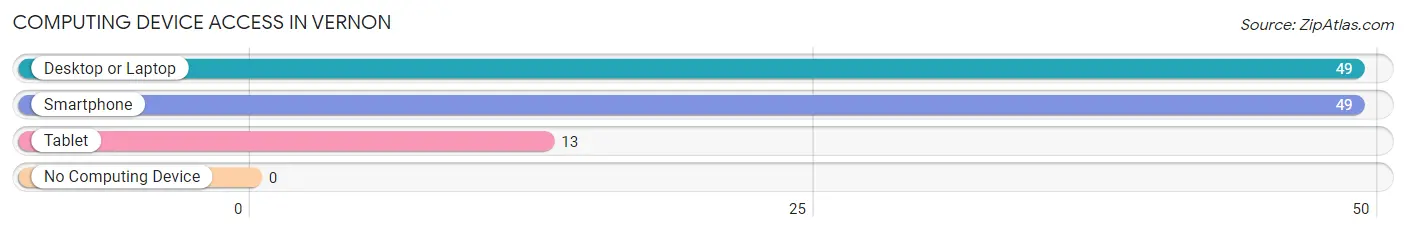
| Device Type | # Households | % Households |
| Desktop or Laptop | 49 | 100.0% |
| Smartphone | 49 | 100.0% |
| Tablet | 13 | 26.5% |
| No Computing Device | 0 | 0.0% |
| Total | 49 | 100.0% |
Internet Access in Vernon
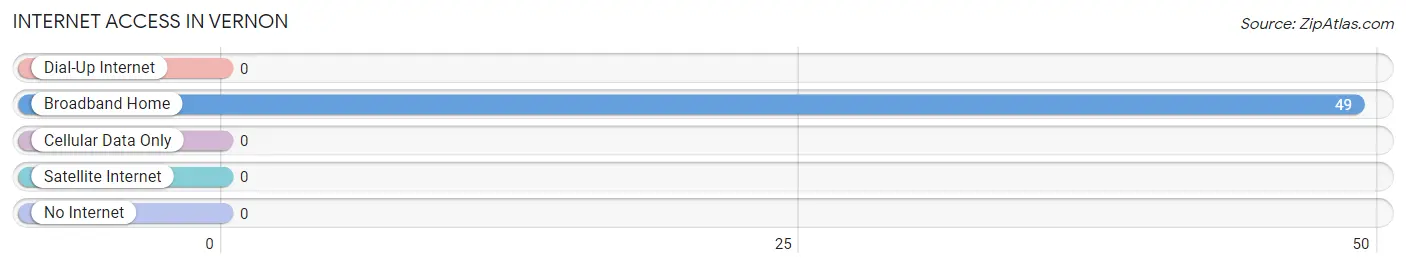
| Internet Type | # Households | % Households |
| Dial-Up Internet | 0 | 0.0% |
| Broadband Home | 49 | 100.0% |
| Cellular Data Only | 0 | 0.0% |
| Satellite Internet | 0 | 0.0% |
| No Internet | 0 | 0.0% |
| Total | 49 | 100.0% |
Vernon Summary
Vernon is a small unincorporated community located in Apache County, Arizona. It is situated in the White Mountains of Arizona, approximately 20 miles east of Show Low. The town is located at an elevation of 6,400 feet and has a population of approximately 200 people.
History
Vernon was founded in 1883 by a group of Mormon settlers from Utah. The settlers were led by John W. Vernon, who was a Mormon bishop from Utah. The settlers chose the area because of its abundance of timber and water. The town was originally called Vernonville, but the name was later changed to Vernon.
The town was initially a farming and ranching community, but it soon became a logging town. The town was home to several sawmills and lumber companies, which provided employment for many of the town’s residents. The town also had a post office, a school, and a general store.
In the early 1900s, the town began to decline as the timber industry moved away. The town’s population decreased and many of the businesses closed. In the 1950s, the town was revitalized when the Arizona State Highway Department built a road through the town. This allowed for easier access to the town and helped to attract new businesses and residents.
Geography
Vernon is located in the White Mountains of Arizona, approximately 20 miles east of Show Low. The town is situated at an elevation of 6,400 feet and is surrounded by the Apache-Sitgreaves National Forest. The town is located in a valley surrounded by mountains and is home to several small lakes and streams.
The climate in Vernon is semi-arid, with hot summers and cold winters. The average annual temperature is approximately 50 degrees Fahrenheit. The town receives an average of 15 inches of precipitation per year, most of which falls in the form of snow.
Economy
The economy of Vernon is largely based on tourism. The town is a popular destination for outdoor recreation, such as fishing, hunting, camping, and hiking. The town is also home to several small businesses, including restaurants, stores, and lodges.
Demographics
As of the 2010 census, the population of Vernon was approximately 200 people. The town is predominantly white, with a small Hispanic population. The median household income is approximately $30,000 per year. The town has a high poverty rate, with approximately 25% of the population living below the poverty line.
Common Questions
What is Per Capita Income in Vernon?
Per Capita income in Vernon is $14,180.
What is the Median Family Income in Vernon?
Median Family Income in Vernon is $48,203.
What is the Median Household income in Vernon?
Median Household Income in Vernon is $48,203.
What is Inequality or Gini Index in Vernon?
Inequality or Gini Index in Vernon is 0.29.
What is the Total Population of Vernon?
Total Population of Vernon is 331.
What is the Total Male Population of Vernon?
Total Male Population of Vernon is 151.
What is the Total Female Population of Vernon?
Total Female Population of Vernon is 180.
What is the Ratio of Males per 100 Females in Vernon?
There are 83.89 Males per 100 Females in Vernon.
What is the Ratio of Females per 100 Males in Vernon?
There are 119.21 Females per 100 Males in Vernon.
What is the Median Population Age in Vernon?
Median Population Age in Vernon is 22.7 Years.
What is the Average Family Size in Vernon
Average Family Size in Vernon is 6.8 People.
What is the Average Household Size in Vernon
Average Household Size in Vernon is 6.8 People.
How Large is the Labor Force in Vernon?
There are 71 People in the Labor Forcein in Vernon.
What is the Percentage of People in the Labor Force in Vernon?
32.9% of People are in the Labor Force in Vernon.