Pinedale, AZ Map & Demographics
Pinedale Map
Pinedale Overview
$44,561
PER CAPITA INCOME
$205,269
AVG FAMILY INCOME
0.41
INEQUALITY / GINI INDEX
543
TOTAL POPULATION
303
MALE POPULATION
240
FEMALE POPULATION
126.25
MALES / 100 FEMALES
79.21
FEMALES / 100 MALES
45.8
MEDIAN AGE
3.2
AVG FAMILY SIZE
2.4
AVG HOUSEHOLD SIZE
222
LABOR FORCE [ PEOPLE ]
59.5%
PERCENT IN LABOR FORCE
Pinedale Zip Codes
Pinedale Area Codes
Income in Pinedale
Income Overview in Pinedale
| Characteristic | Number | Measure |
| Per Capita Income | 543 | $44,561 |
| Median Family Income | 140 | $205,269 |
| Mean Family Income | 140 | $151,142 |
| Median Household Income | 227 | $0 |
| Mean Household Income | 227 | $106,941 |
| Income Deficit | 140 | $0 |
| Wage / Income Gap (%) | 543 | 0.00% |
| Wage / Income Gap ($) | 543 | 100.00¢ per $1 |
| Gini / Inequality Index | 543 | 0.41 |
Earnings by Sex in Pinedale
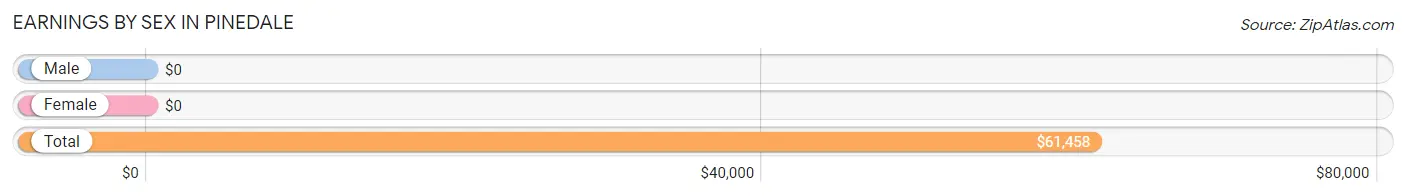
| Sex | Number | Average Earnings |
| Male | 124 (55.9%) | $0 |
| Female | 98 (44.1%) | $0 |
| Total | 222 (100.0%) | $61,458 |
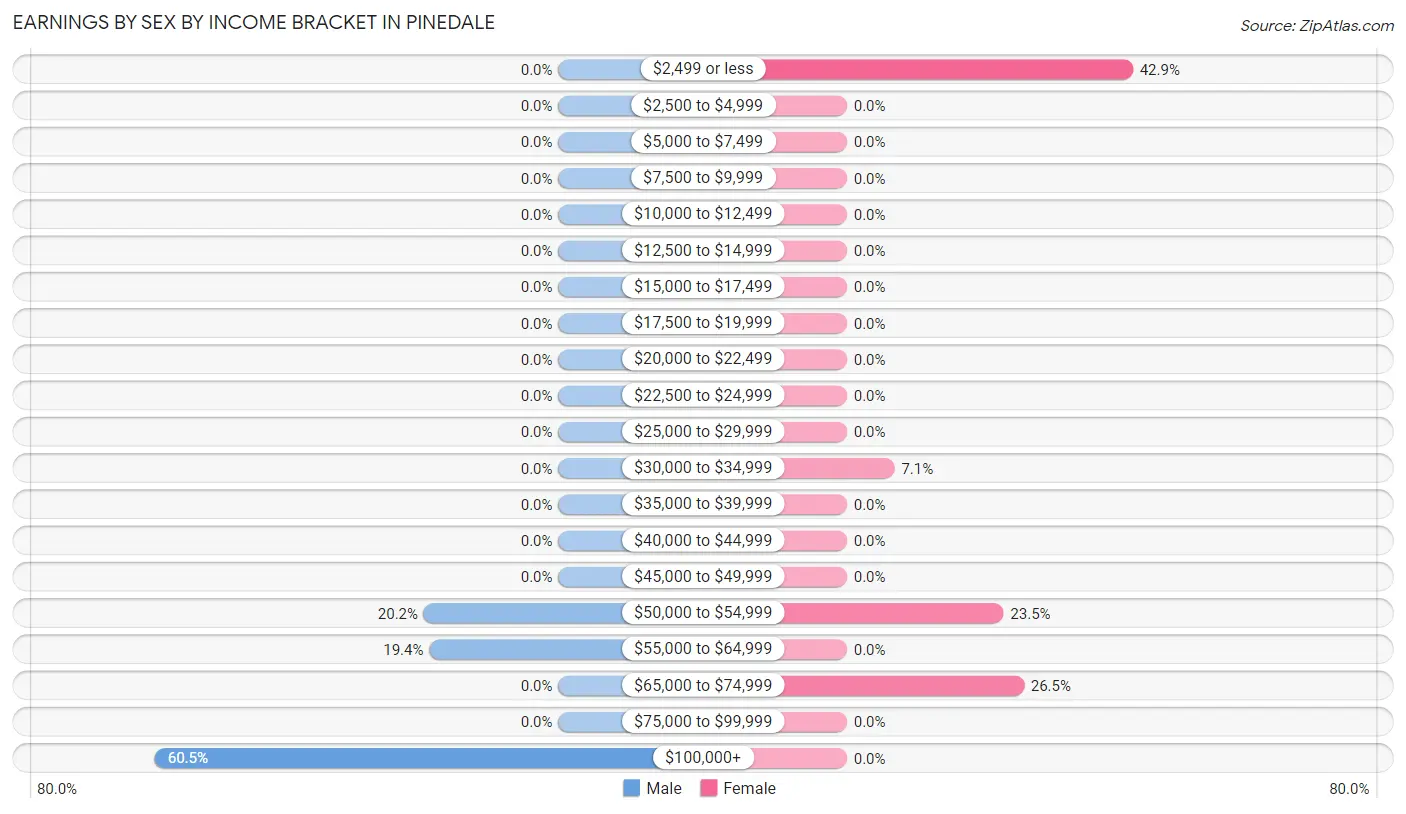
Earnings by Sex by Income Bracket in Pinedale
The most common earnings brackets in Pinedale are $100,000+ for men (75 | 60.5%) and $2,499 or less for women (42 | 42.9%).
| Income | Male | Female |
| $2,499 or less | 0 (0.0%) | 42 (42.9%) |
| $2,500 to $4,999 | 0 (0.0%) | 0 (0.0%) |
| $5,000 to $7,499 | 0 (0.0%) | 0 (0.0%) |
| $7,500 to $9,999 | 0 (0.0%) | 0 (0.0%) |
| $10,000 to $12,499 | 0 (0.0%) | 0 (0.0%) |
| $12,500 to $14,999 | 0 (0.0%) | 0 (0.0%) |
| $15,000 to $17,499 | 0 (0.0%) | 0 (0.0%) |
| $17,500 to $19,999 | 0 (0.0%) | 0 (0.0%) |
| $20,000 to $22,499 | 0 (0.0%) | 0 (0.0%) |
| $22,500 to $24,999 | 0 (0.0%) | 0 (0.0%) |
| $25,000 to $29,999 | 0 (0.0%) | 0 (0.0%) |
| $30,000 to $34,999 | 0 (0.0%) | 7 (7.1%) |
| $35,000 to $39,999 | 0 (0.0%) | 0 (0.0%) |
| $40,000 to $44,999 | 0 (0.0%) | 0 (0.0%) |
| $45,000 to $49,999 | 0 (0.0%) | 0 (0.0%) |
| $50,000 to $54,999 | 25 (20.2%) | 23 (23.5%) |
| $55,000 to $64,999 | 24 (19.4%) | 0 (0.0%) |
| $65,000 to $74,999 | 0 (0.0%) | 26 (26.5%) |
| $75,000 to $99,999 | 0 (0.0%) | 0 (0.0%) |
| $100,000+ | 75 (60.5%) | 0 (0.0%) |
| Total | 124 (100.0%) | 98 (100.0%) |
Earnings by Sex by Educational Attainment in Pinedale
| Educational Attainment | Male Income | Female Income |
| Less than High School | - | - |
| High School Diploma | - | - |
| College or Associate's Degree | - | - |
| Bachelor's Degree | - | - |
| Graduate Degree | - | - |
| Total | - | - |
Family Income in Pinedale
Family Income Brackets in Pinedale
According to the Pinedale family income data, there are 77 families falling into the $200,000+ income range, which is the most common income bracket and makes up 55.0% of all families.
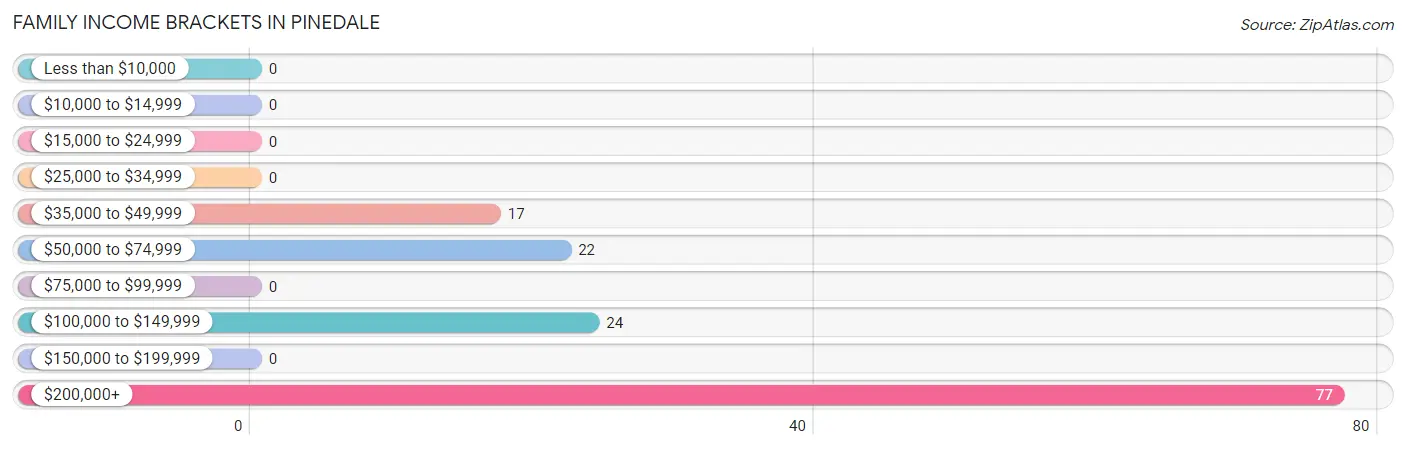
| Income Bracket | # Families | % Families |
| Less than $10,000 | 0 | 0.0% |
| $10,000 to $14,999 | 0 | 0.0% |
| $15,000 to $24,999 | 0 | 0.0% |
| $25,000 to $34,999 | 0 | 0.0% |
| $35,000 to $49,999 | 17 | 12.1% |
| $50,000 to $74,999 | 22 | 15.7% |
| $75,000 to $99,999 | 0 | 0.0% |
| $100,000 to $149,999 | 24 | 17.1% |
| $150,000 to $199,999 | 0 | 0.0% |
| $200,000+ | 77 | 55.0% |
Family Income by Famaliy Size in Pinedale
2-person families (53 | 37.9%) account for the highest median family income in Pinedale with $125,990 per family, while 2-person families (53 | 37.9%) have the highest median income of $62,995 per family member.
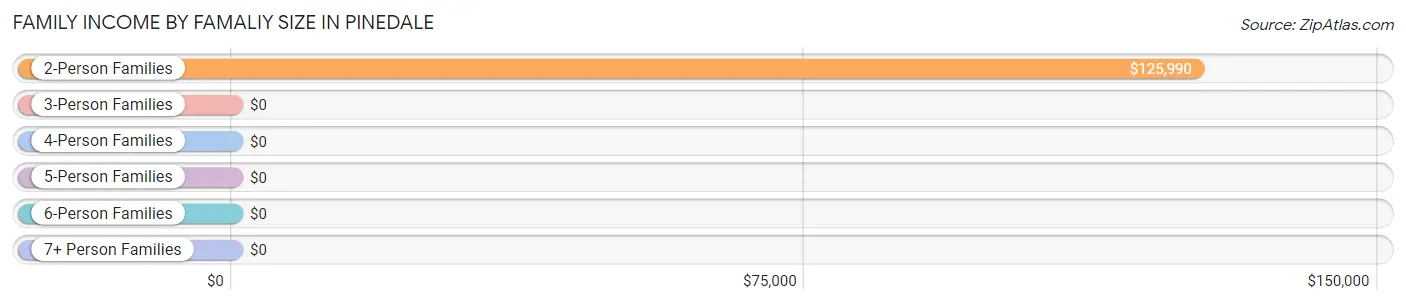
| Income Bracket | # Families | Median Income |
| 2-Person Families | 53 (37.9%) | $125,990 |
| 3-Person Families | 0 (0.0%) | $0 |
| 4-Person Families | 65 (46.4%) | $0 |
| 5-Person Families | 0 (0.0%) | $0 |
| 6-Person Families | 22 (15.7%) | $0 |
| 7+ Person Families | 0 (0.0%) | $0 |
| Total | 140 (100.0%) | $205,269 |
Family Income by Number of Earners in Pinedale
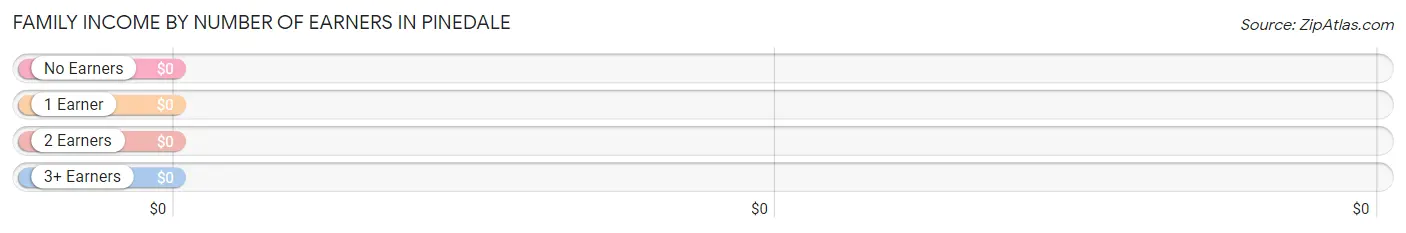
| Number of Earners | # Families | Median Income |
| No Earners | 17 (12.1%) | $0 |
| 1 Earner | 77 (55.0%) | $0 |
| 2 Earners | 46 (32.9%) | $0 |
| 3+ Earners | 0 (0.0%) | $0 |
| Total | 140 (100.0%) | $205,269 |
Household Income in Pinedale
Household Income Brackets in Pinedale
With 77 households falling in the category, the $200,000+ income range is the most frequent in Pinedale, accounting for 33.9% of all households.
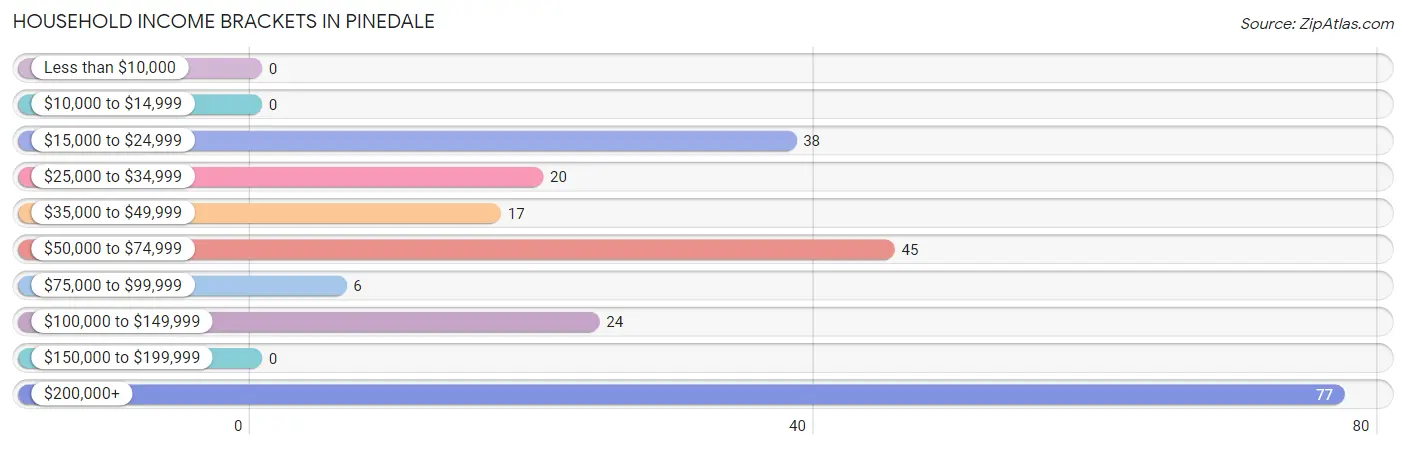
| Income Bracket | # Households | % Households |
| Less than $10,000 | 0 | 0.0% |
| $10,000 to $14,999 | 0 | 0.0% |
| $15,000 to $24,999 | 38 | 16.7% |
| $25,000 to $34,999 | 20 | 8.8% |
| $35,000 to $49,999 | 17 | 7.5% |
| $50,000 to $74,999 | 45 | 19.8% |
| $75,000 to $99,999 | 6 | 2.6% |
| $100,000 to $149,999 | 24 | 10.6% |
| $150,000 to $199,999 | 0 | 0.0% |
| $200,000+ | 77 | 33.9% |
Household Income by Householder Age in Pinedale
| Income Bracket | # Households | Median Income |
| 15 to 24 Years | 22 (9.7%) | $0 |
| 25 to 44 Years | 0 (0.0%) | $0 |
| 45 to 64 Years | 181 (79.7%) | $0 |
| 65+ Years | 24 (10.6%) | $0 |
| Total | 227 (100.0%) | $0 |
Poverty in Pinedale
Income Below Poverty by Sex and Age in Pinedale
| Age Bracket | Male | Female |
| Under 5 Years | 0 (0.0%) | 0 (0.0%) |
| 5 Years | 0 (0.0%) | 0 (0.0%) |
| 6 to 11 Years | 0 (0.0%) | 0 (0.0%) |
| 12 to 14 Years | 0 (0.0%) | 0 (0.0%) |
| 15 Years | 0 (0.0%) | 0 (0.0%) |
| 16 and 17 Years | 0 (0.0%) | 0 (0.0%) |
| 18 to 24 Years | 0 (0.0%) | 0 (0.0%) |
| 25 to 34 Years | 0 (0.0%) | 0 (0.0%) |
| 35 to 44 Years | 0 (0.0%) | 0 (0.0%) |
| 45 to 54 Years | 0 (0.0%) | 0 (0.0%) |
| 55 to 64 Years | 0 (0.0%) | 0 (0.0%) |
| 65 to 74 Years | 0 (0.0%) | 0 (0.0%) |
| 75 Years and over | 0 (0.0%) | 0 (0.0%) |
| Total | 0 (0.0%) | 0 (0.0%) |
Income Above Poverty by Sex and Age in Pinedale
According to the poverty statistics in Pinedale, males aged under 5 years and females aged 6 to 11 years are the age groups that are most secure financially, with 100.0% of males and 100.0% of females in these age groups living above the poverty line.
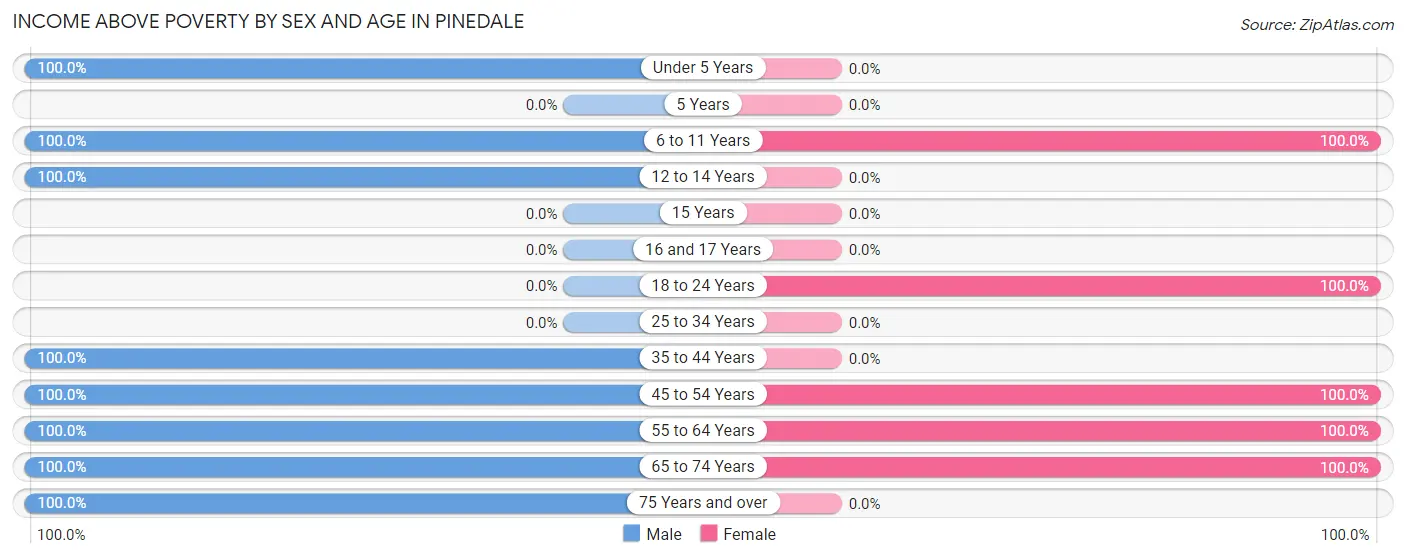
| Age Bracket | Male | Female |
| Under 5 Years | 21 (100.0%) | 0 (0.0%) |
| 5 Years | 0 (0.0%) | 0 (0.0%) |
| 6 to 11 Years | 67 (100.0%) | 52 (100.0%) |
| 12 to 14 Years | 30 (100.0%) | 0 (0.0%) |
| 15 Years | 0 (0.0%) | 0 (0.0%) |
| 16 and 17 Years | 0 (0.0%) | 0 (0.0%) |
| 18 to 24 Years | 0 (0.0%) | 22 (100.0%) |
| 25 to 34 Years | 0 (0.0%) | 0 (0.0%) |
| 35 to 44 Years | 25 (100.0%) | 0 (0.0%) |
| 45 to 54 Years | 75 (100.0%) | 122 (100.0%) |
| 55 to 64 Years | 44 (100.0%) | 37 (100.0%) |
| 65 to 74 Years | 24 (100.0%) | 7 (100.0%) |
| 75 Years and over | 17 (100.0%) | 0 (0.0%) |
| Total | 303 (100.0%) | 240 (100.0%) |
Income Below Poverty Among Married-Couple Families in Pinedale
| Children | Above Poverty | Below Poverty |
| No Children | 53 (100.0%) | 0 (0.0%) |
| 1 or 2 Children | 65 (100.0%) | 0 (0.0%) |
| 3 or 4 Children | 22 (100.0%) | 0 (0.0%) |
| 5 or more Children | 0 (0.0%) | 0 (0.0%) |
| Total | 140 (100.0%) | 0 (0.0%) |
Income Below Poverty Among Single-Parent Households in Pinedale
| Children | Single Father | Single Mother |
| No Children | 0 (0.0%) | 0 (0.0%) |
| 1 or 2 Children | 0 (0.0%) | 0 (0.0%) |
| 3 or 4 Children | 0 (0.0%) | 0 (0.0%) |
| 5 or more Children | 0 (0.0%) | 0 (0.0%) |
| Total | 0 (0.0%) | 0 (0.0%) |
Income Below Poverty Among Married-Couple vs Single-Parent Households in Pinedale
| Children | Married-Couple Families | Single-Parent Households |
| No Children | 0 (0.0%) | 0 (0.0%) |
| 1 or 2 Children | 0 (0.0%) | 0 (0.0%) |
| 3 or 4 Children | 0 (0.0%) | 0 (0.0%) |
| 5 or more Children | 0 (0.0%) | 0 (0.0%) |
| Total | 0 (0.0%) | 0 (0.0%) |
Race in Pinedale
The most populous races in Pinedale are White / Caucasian (402 | 74.0%), and Two or more Races (141 | 26.0%).
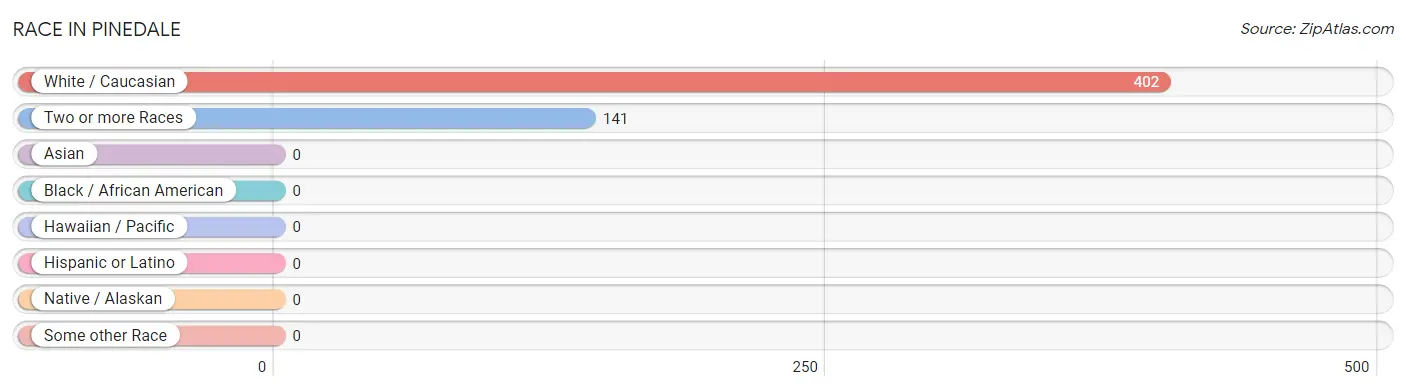
| Race | # Population | % Population |
| Asian | 0 | 0.0% |
| Black / African American | 0 | 0.0% |
| Hawaiian / Pacific | 0 | 0.0% |
| Hispanic or Latino | 0 | 0.0% |
| Native / Alaskan | 0 | 0.0% |
| White / Caucasian | 402 | 74.0% |
| Two or more Races | 141 | 26.0% |
| Some other Race | 0 | 0.0% |
| Total | 543 | 100.0% |
Ancestry in Pinedale
The most populous ancestries reported in Pinedale are Laotian (141 | 26.0%), Irish (139 | 25.6%), Italian (139 | 25.6%), American (100 | 18.4%), and English (61 | 11.2%), together accounting for 106.8% of all Pinedale residents.
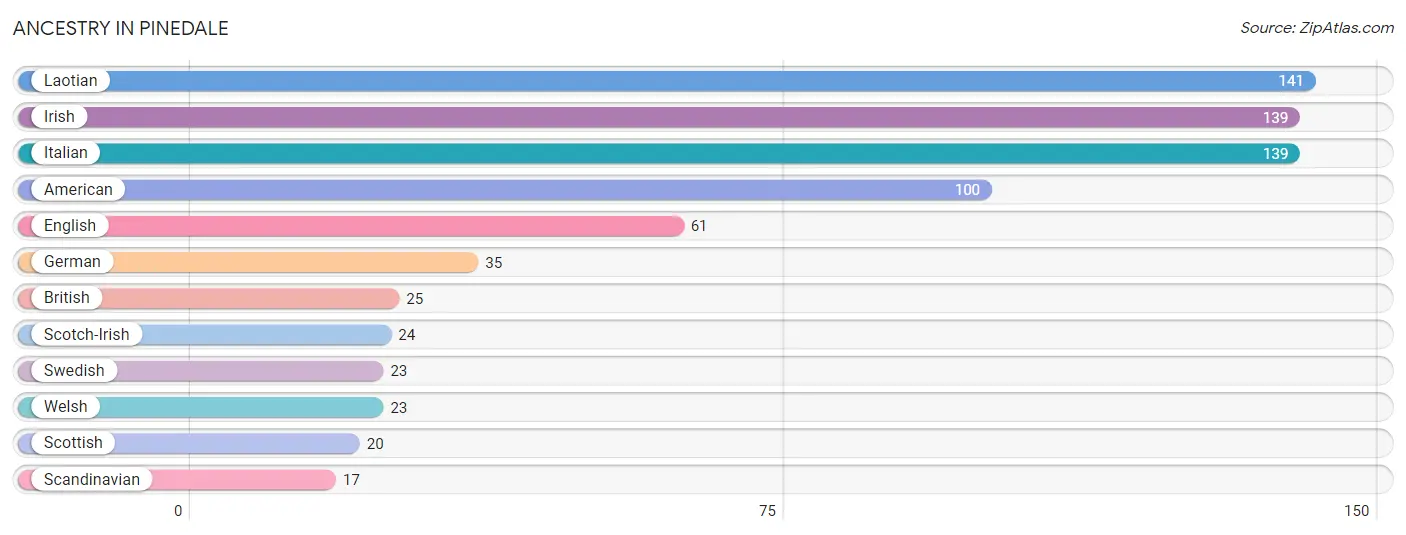
| Ancestry | # Population | % Population |
| American | 100 | 18.4% |
| British | 25 | 4.6% |
| English | 61 | 11.2% |
| German | 35 | 6.5% |
| Irish | 139 | 25.6% |
| Italian | 139 | 25.6% |
| Laotian | 141 | 26.0% |
| Scandinavian | 17 | 3.1% |
| Scotch-Irish | 24 | 4.4% |
| Scottish | 20 | 3.7% |
| Swedish | 23 | 4.2% |
| Welsh | 23 | 4.2% | View All 12 Rows |
Immigrants in Pinedale

| Immigration Origin | # Population | % Population | View All 0 Rows |
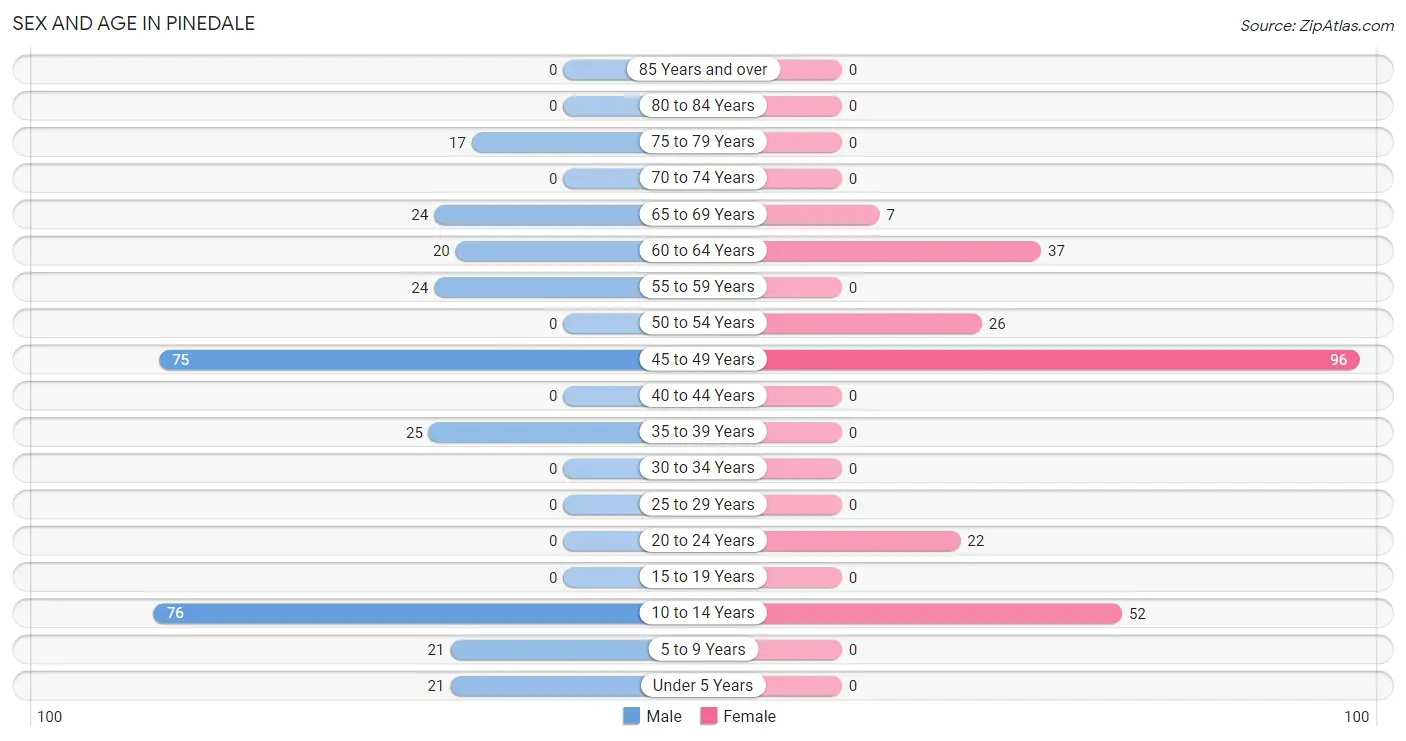
Sex and Age in Pinedale
Sex and Age in Pinedale
The most populous age groups in Pinedale are 10 to 14 Years (76 | 25.1%) for men and 45 to 49 Years (96 | 40.0%) for women.
| Age Bracket | Male | Female |
| Under 5 Years | 21 (6.9%) | 0 (0.0%) |
| 5 to 9 Years | 21 (6.9%) | 0 (0.0%) |
| 10 to 14 Years | 76 (25.1%) | 52 (21.7%) |
| 15 to 19 Years | 0 (0.0%) | 0 (0.0%) |
| 20 to 24 Years | 0 (0.0%) | 22 (9.2%) |
| 25 to 29 Years | 0 (0.0%) | 0 (0.0%) |
| 30 to 34 Years | 0 (0.0%) | 0 (0.0%) |
| 35 to 39 Years | 25 (8.3%) | 0 (0.0%) |
| 40 to 44 Years | 0 (0.0%) | 0 (0.0%) |
| 45 to 49 Years | 75 (24.7%) | 96 (40.0%) |
| 50 to 54 Years | 0 (0.0%) | 26 (10.8%) |
| 55 to 59 Years | 24 (7.9%) | 0 (0.0%) |
| 60 to 64 Years | 20 (6.6%) | 37 (15.4%) |
| 65 to 69 Years | 24 (7.9%) | 7 (2.9%) |
| 70 to 74 Years | 0 (0.0%) | 0 (0.0%) |
| 75 to 79 Years | 17 (5.6%) | 0 (0.0%) |
| 80 to 84 Years | 0 (0.0%) | 0 (0.0%) |
| 85 Years and over | 0 (0.0%) | 0 (0.0%) |
| Total | 303 (100.0%) | 240 (100.0%) |
Families and Households in Pinedale
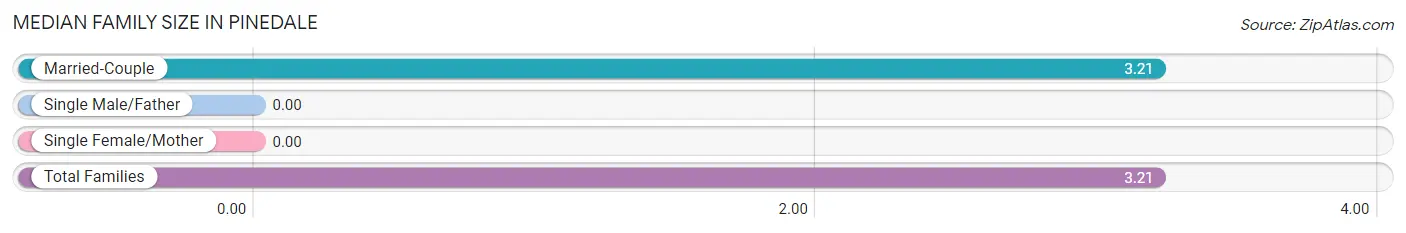
Median Family Size in Pinedale
| Family Type | # Families | Family Size |
| Married-Couple | 140 (100.0%) | 3.21 |
| Single Male/Father | 0 (0.0%) | - |
| Single Female/Mother | 0 (0.0%) | - |
| Total Families | 140 (100.0%) | 3.21 |
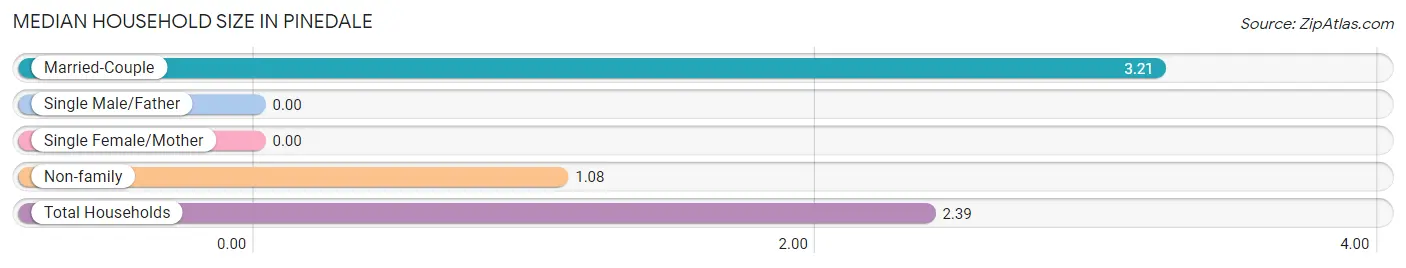
Median Household Size in Pinedale
| Household Type | # Households | Household Size |
| Married-Couple | 140 (61.7%) | 3.21 |
| Single Male/Father | 0 (0.0%) | - |
| Single Female/Mother | 0 (0.0%) | - |
| Non-family | 87 (38.3%) | 1.08 |
| Total Households | 227 (100.0%) | 2.39 |
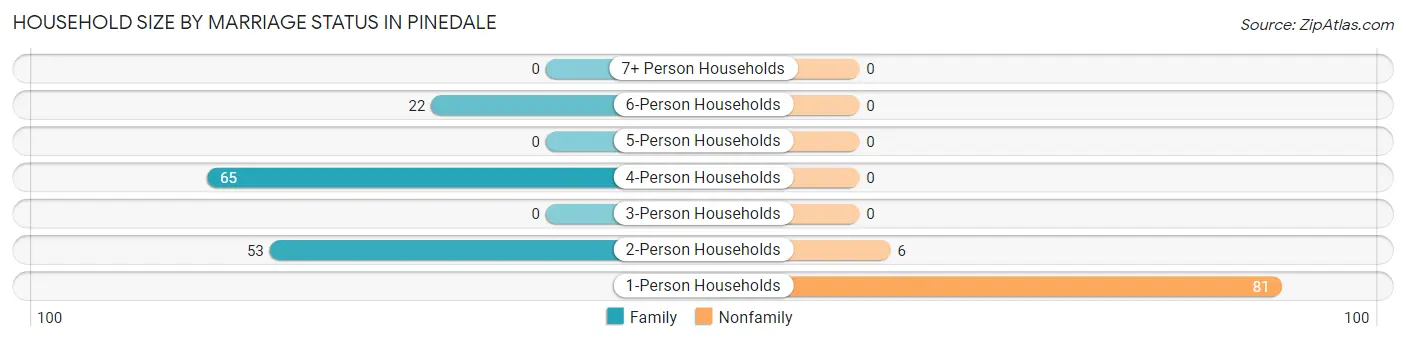
Household Size by Marriage Status in Pinedale
Out of a total of 227 households in Pinedale, 140 (61.7%) are family households, while 87 (38.3%) are nonfamily households. The most numerous type of family households are 4-person households, comprising 65, and the most common type of nonfamily households are 1-person households, comprising 81.
| Household Size | Family Households | Nonfamily Households |
| 1-Person Households | - | 81 (35.7%) |
| 2-Person Households | 53 (23.4%) | 6 (2.6%) |
| 3-Person Households | 0 (0.0%) | 0 (0.0%) |
| 4-Person Households | 65 (28.6%) | 0 (0.0%) |
| 5-Person Households | 0 (0.0%) | 0 (0.0%) |
| 6-Person Households | 22 (9.7%) | 0 (0.0%) |
| 7+ Person Households | 0 (0.0%) | 0 (0.0%) |
| Total | 140 (61.7%) | 87 (38.3%) |
Female Fertility in Pinedale
Fertility by Age in Pinedale
| Age Bracket | Women with Births | Births / 1,000 Women |
| 15 to 19 years | 0 (0.0%) | 0.0 |
| 20 to 34 years | 0 (0.0%) | 0.0 |
| 35 to 50 years | 0 (0.0%) | 0.0 |
| Total | 0 (0.0%) | 0.0 |
Fertility by Age by Marriage Status in Pinedale
| Age Bracket | Married | Unmarried |
| 15 to 19 years | 0 (0.0%) | 0 (0.0%) |
| 20 to 34 years | 0 (0.0%) | 0 (0.0%) |
| 35 to 50 years | 0 (0.0%) | 0 (0.0%) |
| Total | 0 (0.0%) | 0 (0.0%) |
Fertility by Education in Pinedale
| Educational Attainment | Women with Births | Births / 1,000 Women |
| Less than High School | 0 (0.0%) | 0.0 |
| High School Diploma | 0 (0.0%) | 0.0 |
| College or Associate's Degree | 0 (0.0%) | 0.0 |
| Bachelor's Degree | 0 (0.0%) | 0.0 |
| Graduate Degree | 0 (0.0%) | 0.0 |
| Total | 0 (0.0%) | 0.0 |
Fertility by Education by Marriage Status in Pinedale
| Educational Attainment | Married | Unmarried |
| Less than High School | 0 (0.0%) | 0 (0.0%) |
| High School Diploma | 0 (0.0%) | 0 (0.0%) |
| College or Associate's Degree | 0 (0.0%) | 0 (0.0%) |
| Bachelor's Degree | 0 (0.0%) | 0 (0.0%) |
| Graduate Degree | 0 (0.0%) | 0 (0.0%) |
| Total | 0 (0.0%) | 0 (0.0%) |
Employment Characteristics in Pinedale
Employment by Class of Employer in Pinedale
Among the 222 employed individuals in Pinedale, private company employees (124 | 55.9%), not-for-profit organizations (75 | 33.8%), and state government employees (23 | 10.4%) make up the most common classes of employment.
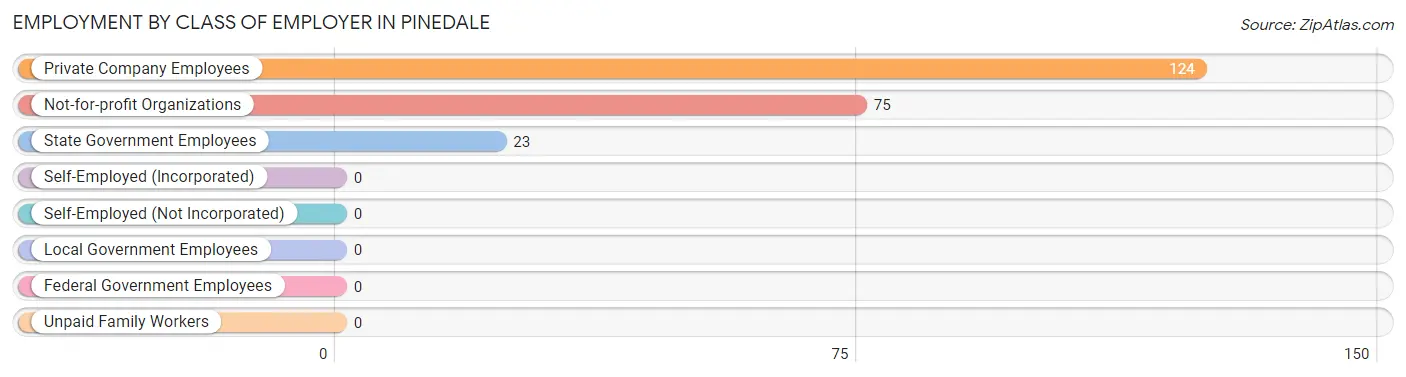
| Employer Class | # Employees | % Employees |
| Private Company Employees | 124 | 55.9% |
| Self-Employed (Incorporated) | 0 | 0.0% |
| Self-Employed (Not Incorporated) | 0 | 0.0% |
| Not-for-profit Organizations | 75 | 33.8% |
| Local Government Employees | 0 | 0.0% |
| State Government Employees | 23 | 10.4% |
| Federal Government Employees | 0 | 0.0% |
| Unpaid Family Workers | 0 | 0.0% |
| Total | 222 | 100.0% |
Employment Status by Age in Pinedale
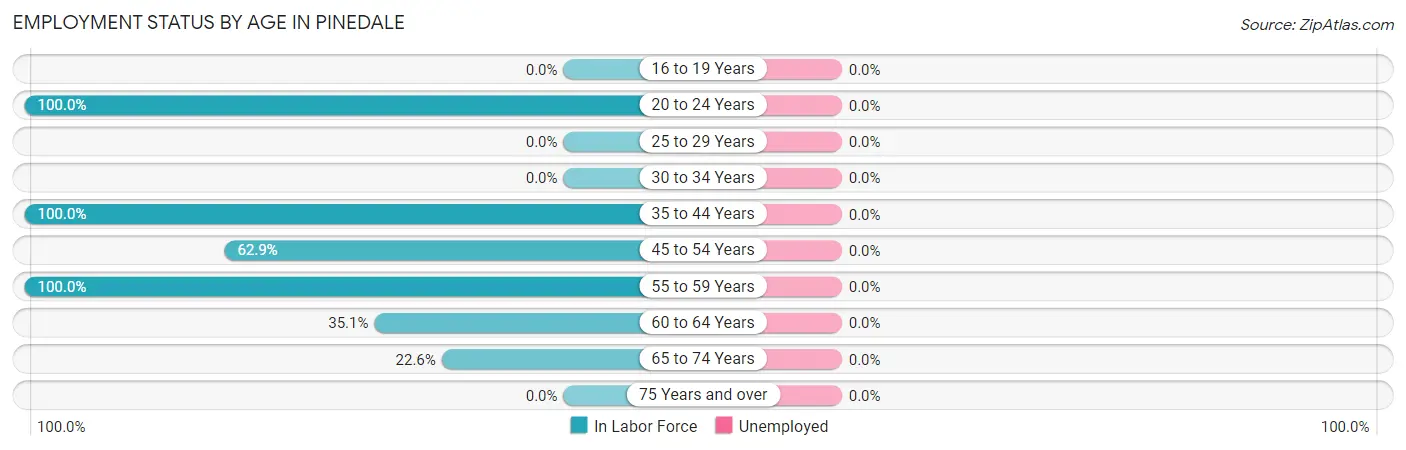
| Age Bracket | In Labor Force | Unemployed |
| 16 to 19 Years | 0 (0.0%) | 0 (0.0%) |
| 20 to 24 Years | 22 (100.0%) | 0 (0.0%) |
| 25 to 29 Years | 0 (0.0%) | 0 (0.0%) |
| 30 to 34 Years | 0 (0.0%) | 0 (0.0%) |
| 35 to 44 Years | 25 (100.0%) | 0 (0.0%) |
| 45 to 54 Years | 124 (62.9%) | 0 (0.0%) |
| 55 to 59 Years | 24 (100.0%) | 0 (0.0%) |
| 60 to 64 Years | 20 (35.1%) | 0 (0.0%) |
| 65 to 74 Years | 7 (22.6%) | 0 (0.0%) |
| 75 Years and over | 0 (0.0%) | 0 (0.0%) |
| Total | 222 (59.5%) | 0 (0.0%) |
Employment Status by Educational Attainment in Pinedale
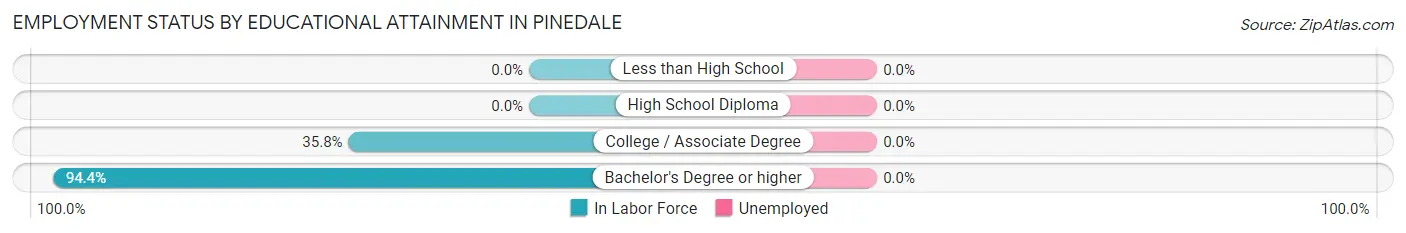
| Educational Attainment | In Labor Force | Unemployed |
| Less than High School | 0 (0.0%) | 0 (0.0%) |
| High School Diploma | 0 (0.0%) | 0 (0.0%) |
| College / Associate Degree | 57 (35.8%) | 0 (0.0%) |
| Bachelor's Degree or higher | 136 (94.4%) | 0 (0.0%) |
| Total | 193 (63.7%) | 0 (0.0%) |
Employment Occupations by Sex in Pinedale
Management, Business, Science and Arts Occupations
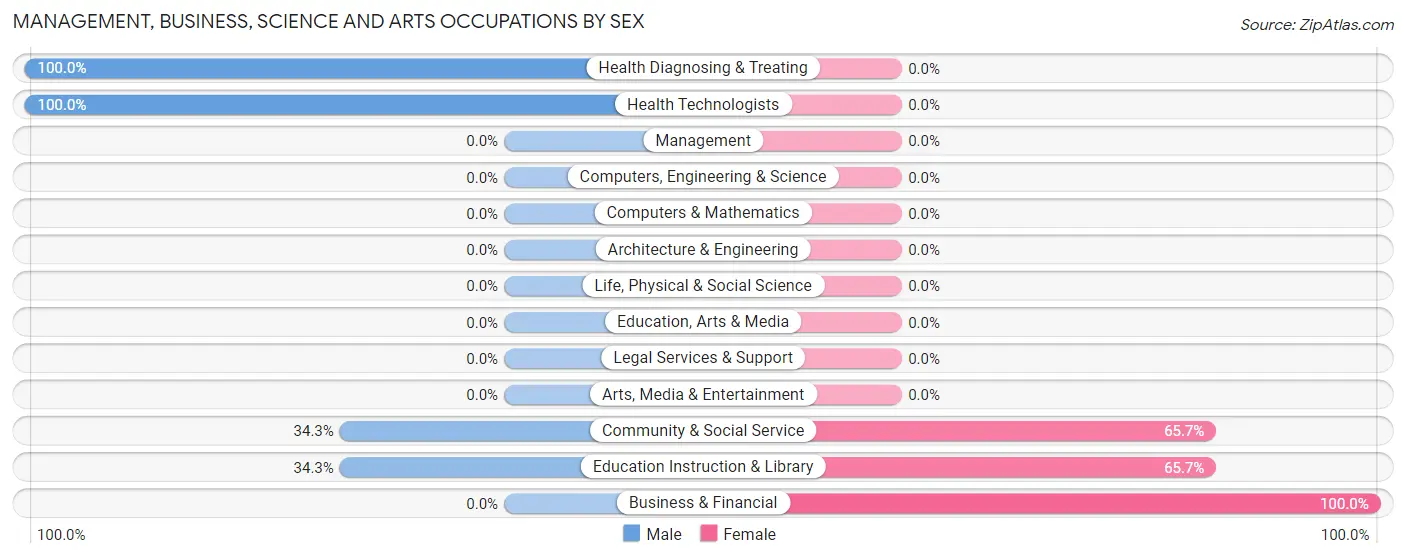
The most common Management, Business, Science and Arts occupations in Pinedale are Health Diagnosing & Treating (88 | 39.6%), Community & Social Service (70 | 31.5%), Education Instruction & Library (70 | 31.5%), Health Technologists (63 | 28.4%), and Business & Financial (23 | 10.4%).
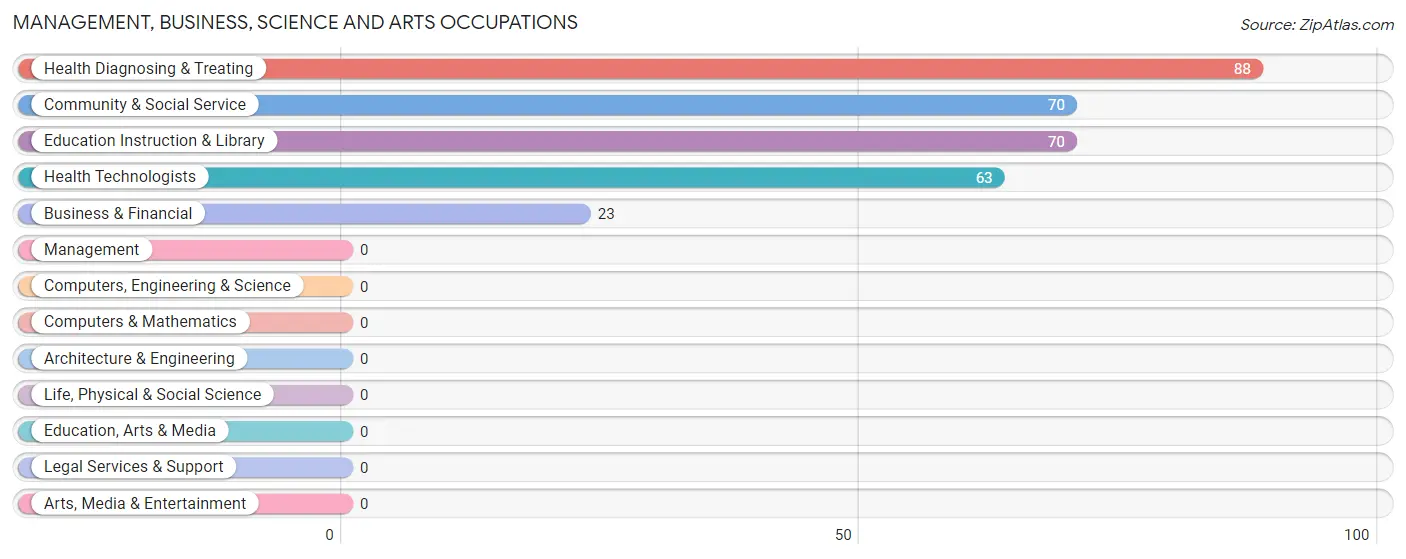
Management, Business, Science and Arts Occupations by Sex
Within the Management, Business, Science and Arts occupations in Pinedale, the most male-oriented occupations are Health Diagnosing & Treating (100.0%), Health Technologists (100.0%), and Community & Social Service (34.3%), while the most female-oriented occupations are Business & Financial (100.0%), Community & Social Service (65.7%), and Education Instruction & Library (65.7%).
| Occupation | Male | Female |
| Management | 0 (0.0%) | 0 (0.0%) |
| Business & Financial | 0 (0.0%) | 23 (100.0%) |
| Computers, Engineering & Science | 0 (0.0%) | 0 (0.0%) |
| Computers & Mathematics | 0 (0.0%) | 0 (0.0%) |
| Architecture & Engineering | 0 (0.0%) | 0 (0.0%) |
| Life, Physical & Social Science | 0 (0.0%) | 0 (0.0%) |
| Community & Social Service | 24 (34.3%) | 46 (65.7%) |
| Education, Arts & Media | 0 (0.0%) | 0 (0.0%) |
| Legal Services & Support | 0 (0.0%) | 0 (0.0%) |
| Education Instruction & Library | 24 (34.3%) | 46 (65.7%) |
| Arts, Media & Entertainment | 0 (0.0%) | 0 (0.0%) |
| Health Diagnosing & Treating | 88 (100.0%) | 0 (0.0%) |
| Health Technologists | 63 (100.0%) | 0 (0.0%) |
| Total (Category) | 112 (61.9%) | 69 (38.1%) |
| Total (Overall) | 124 (55.9%) | 98 (44.1%) |
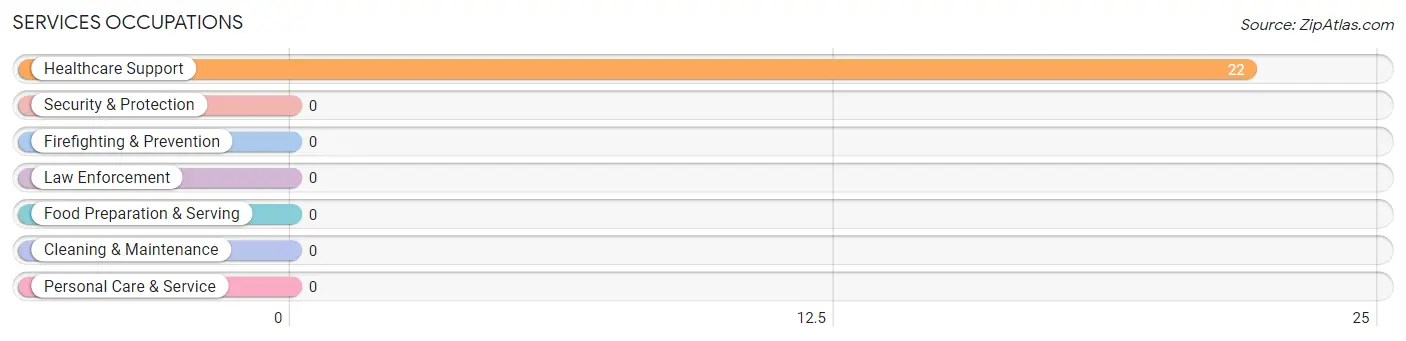
Services Occupations
The most common Services occupations in Pinedale are , and Healthcare Support (22 | 9.9%).
Services Occupations by Sex
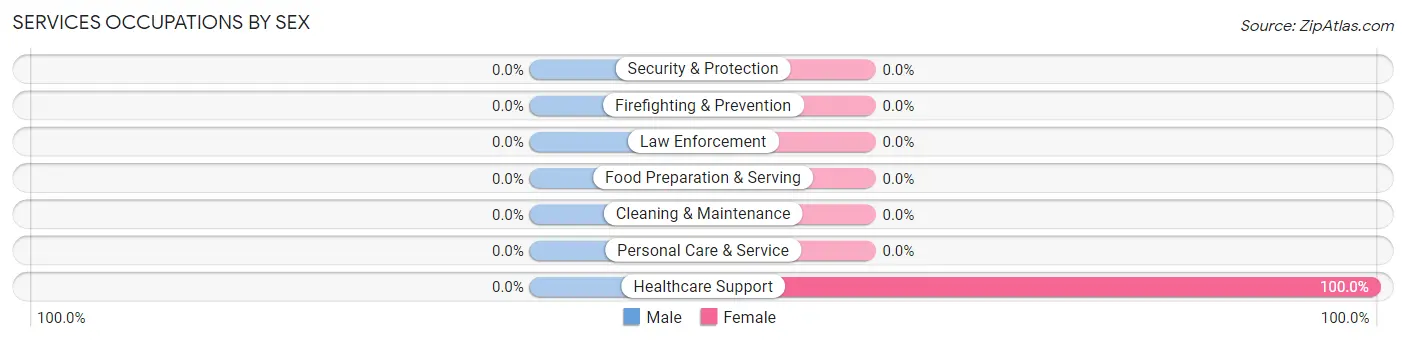
| Occupation | Male | Female |
| Healthcare Support | 0 (0.0%) | 22 (100.0%) |
| Security & Protection | 0 (0.0%) | 0 (0.0%) |
| Firefighting & Prevention | 0 (0.0%) | 0 (0.0%) |
| Law Enforcement | 0 (0.0%) | 0 (0.0%) |
| Food Preparation & Serving | 0 (0.0%) | 0 (0.0%) |
| Cleaning & Maintenance | 0 (0.0%) | 0 (0.0%) |
| Personal Care & Service | 0 (0.0%) | 0 (0.0%) |
| Total (Category) | 0 (0.0%) | 22 (100.0%) |
| Total (Overall) | 124 (55.9%) | 98 (44.1%) |
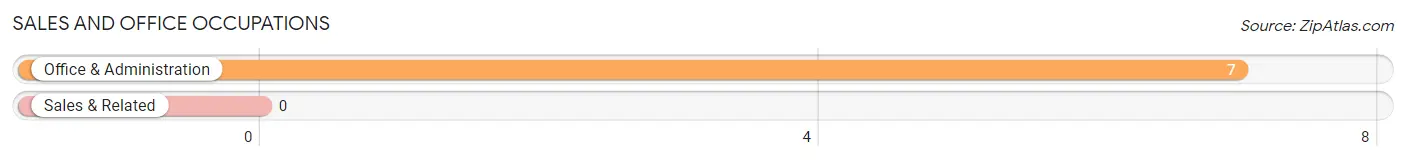
Sales and Office Occupations
The most common Sales and Office occupations in Pinedale are , and Office & Administration (7 | 3.2%).
Sales and Office Occupations by Sex

| Occupation | Male | Female |
| Sales & Related | 0 (0.0%) | 0 (0.0%) |
| Office & Administration | 0 (0.0%) | 7 (100.0%) |
| Total (Category) | 0 (0.0%) | 7 (100.0%) |
| Total (Overall) | 124 (55.9%) | 98 (44.1%) |
Natural Resources, Construction and Maintenance Occupations
The most common Natural Resources, Construction and Maintenance occupations in Pinedale are , and Construction & Extraction (12 | 5.4%).

Natural Resources, Construction and Maintenance Occupations by Sex
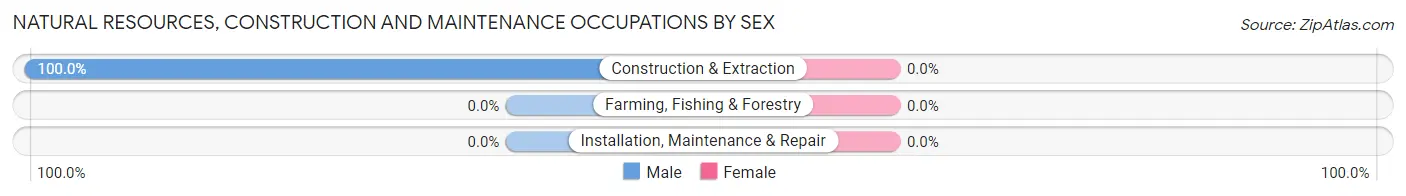
| Occupation | Male | Female |
| Farming, Fishing & Forestry | 0 (0.0%) | 0 (0.0%) |
| Construction & Extraction | 12 (100.0%) | 0 (0.0%) |
| Installation, Maintenance & Repair | 0 (0.0%) | 0 (0.0%) |
| Total (Category) | 12 (100.0%) | 0 (0.0%) |
| Total (Overall) | 124 (55.9%) | 98 (44.1%) |
Production, Transportation and Moving Occupations
Production, Transportation and Moving Occupations by Sex
| Occupation | Male | Female |
| Production | 0 (0.0%) | 0 (0.0%) |
| Transportation | 0 (0.0%) | 0 (0.0%) |
| Material Moving | 0 (0.0%) | 0 (0.0%) |
| Total (Category) | 0 (0.0%) | 0 (0.0%) |
| Total (Overall) | 124 (55.9%) | 98 (44.1%) |
Employment Industries by Sex in Pinedale
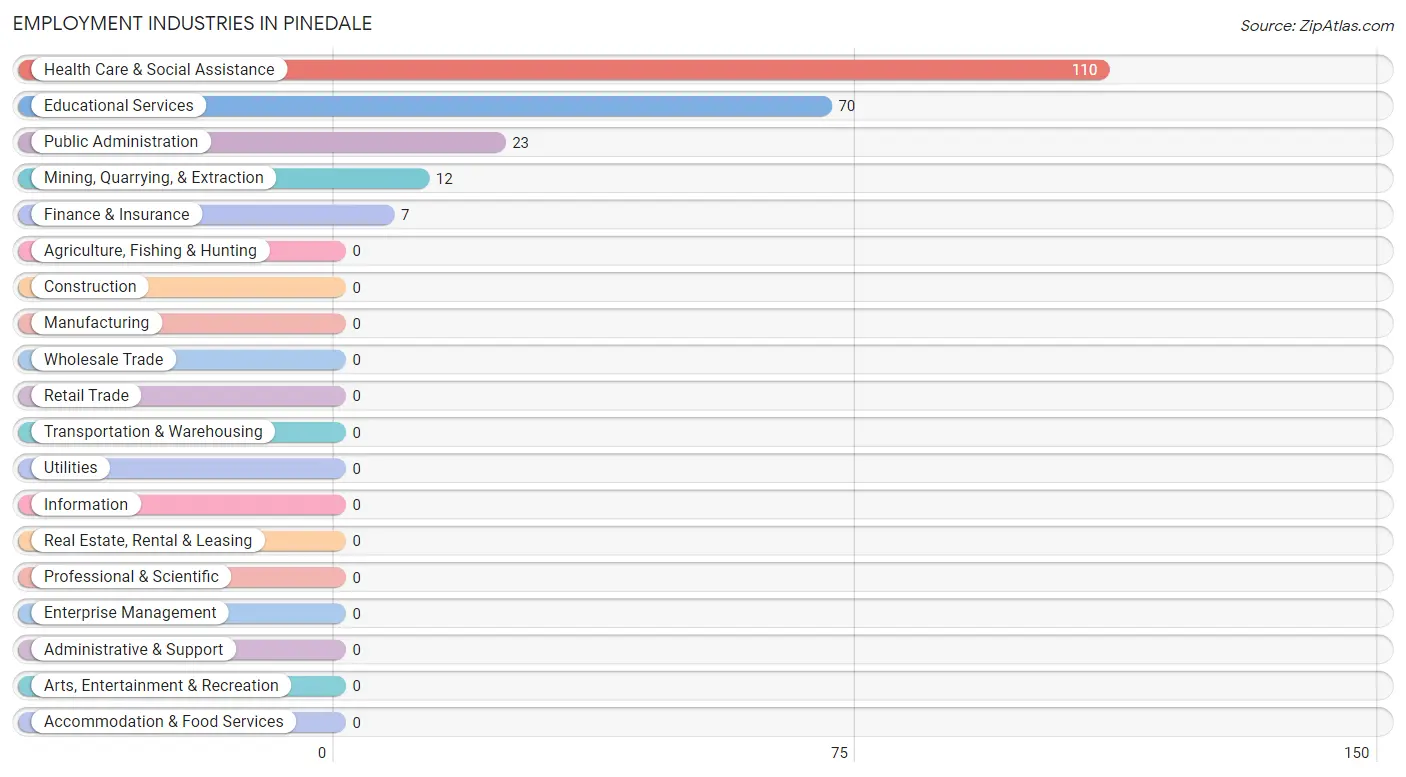
Employment Industries in Pinedale
The major employment industries in Pinedale include Health Care & Social Assistance (110 | 49.5%), Educational Services (70 | 31.5%), Public Administration (23 | 10.4%), Mining, Quarrying, & Extraction (12 | 5.4%), and Finance & Insurance (7 | 3.2%).
Employment Industries by Sex in Pinedale
The Pinedale industries that see more men than women are Mining, Quarrying, & Extraction (100.0%), Health Care & Social Assistance (80.0%), and Educational Services (34.3%), whereas the industries that tend to have a higher number of women are Finance & Insurance (100.0%), Public Administration (100.0%), and Educational Services (65.7%).
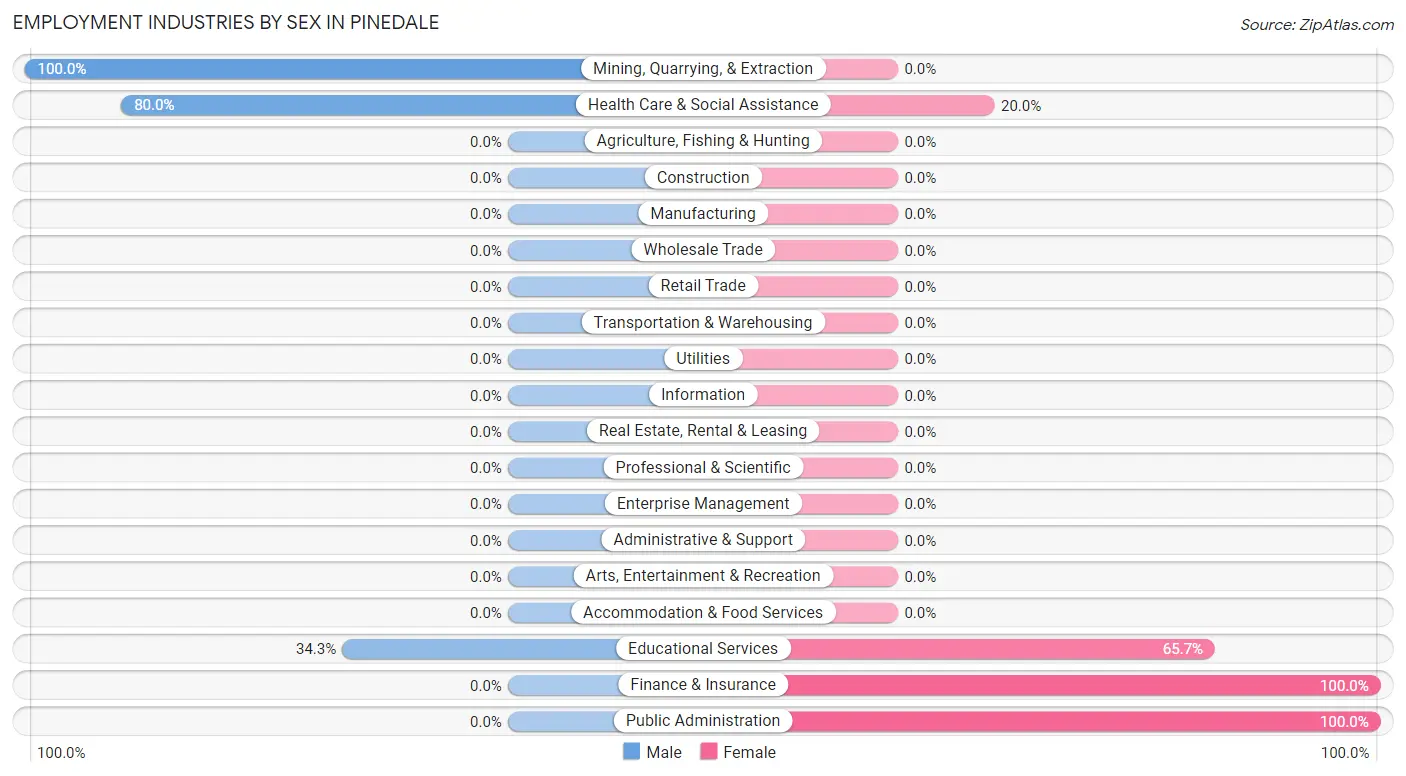
| Industry | Male | Female |
| Agriculture, Fishing & Hunting | 0 (0.0%) | 0 (0.0%) |
| Mining, Quarrying, & Extraction | 12 (100.0%) | 0 (0.0%) |
| Construction | 0 (0.0%) | 0 (0.0%) |
| Manufacturing | 0 (0.0%) | 0 (0.0%) |
| Wholesale Trade | 0 (0.0%) | 0 (0.0%) |
| Retail Trade | 0 (0.0%) | 0 (0.0%) |
| Transportation & Warehousing | 0 (0.0%) | 0 (0.0%) |
| Utilities | 0 (0.0%) | 0 (0.0%) |
| Information | 0 (0.0%) | 0 (0.0%) |
| Finance & Insurance | 0 (0.0%) | 7 (100.0%) |
| Real Estate, Rental & Leasing | 0 (0.0%) | 0 (0.0%) |
| Professional & Scientific | 0 (0.0%) | 0 (0.0%) |
| Enterprise Management | 0 (0.0%) | 0 (0.0%) |
| Administrative & Support | 0 (0.0%) | 0 (0.0%) |
| Educational Services | 24 (34.3%) | 46 (65.7%) |
| Health Care & Social Assistance | 88 (80.0%) | 22 (20.0%) |
| Arts, Entertainment & Recreation | 0 (0.0%) | 0 (0.0%) |
| Accommodation & Food Services | 0 (0.0%) | 0 (0.0%) |
| Public Administration | 0 (0.0%) | 23 (100.0%) |
| Total | 124 (55.9%) | 98 (44.1%) |
Education in Pinedale
School Enrollment in Pinedale
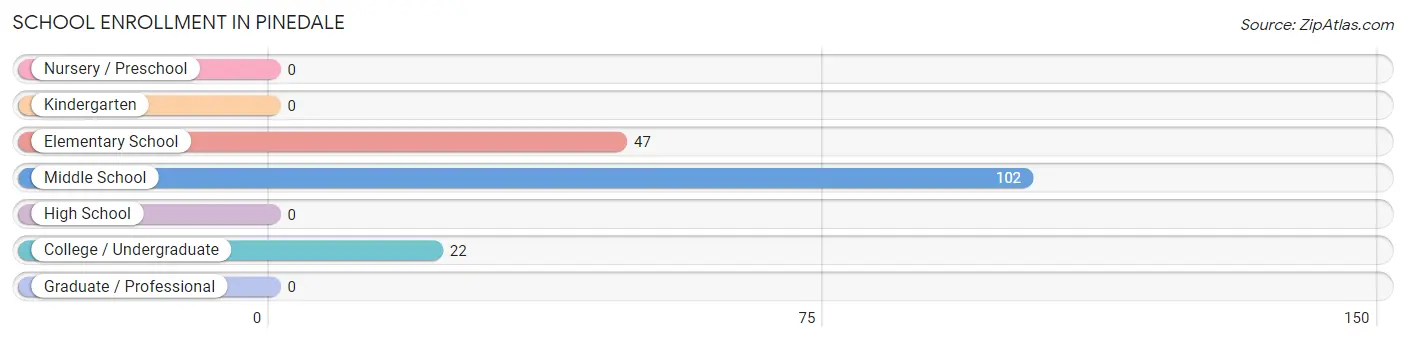
The most common levels of schooling among the 171 students in Pinedale are middle school (102 | 59.7%), elementary school (47 | 27.5%), and college / undergraduate (22 | 12.9%).
| School Level | # Students | % Students |
| Nursery / Preschool | 0 | 0.0% |
| Kindergarten | 0 | 0.0% |
| Elementary School | 47 | 27.5% |
| Middle School | 102 | 59.7% |
| High School | 0 | 0.0% |
| College / Undergraduate | 22 | 12.9% |
| Graduate / Professional | 0 | 0.0% |
| Total | 171 | 100.0% |
School Enrollment by Age by Funding Source in Pinedale
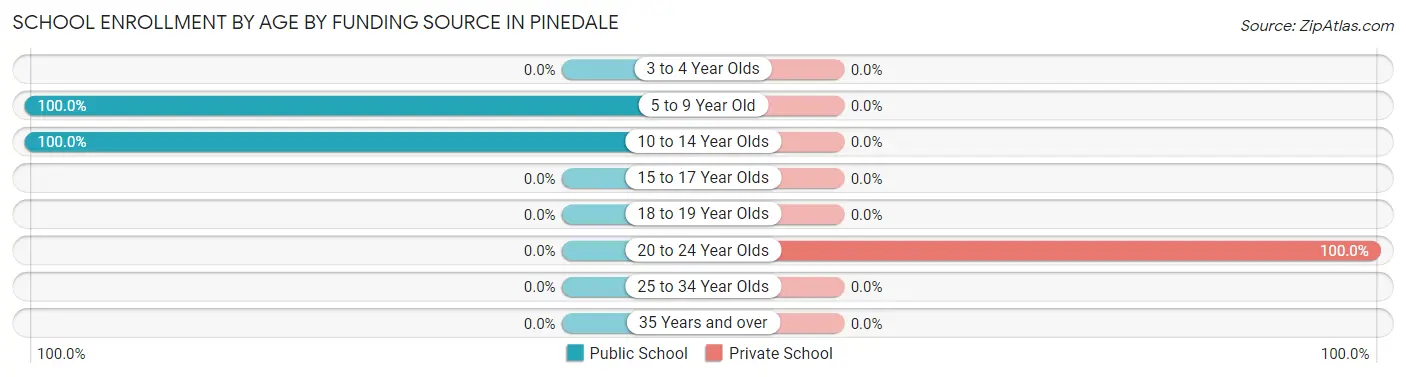
Out of a total of 171 students who are enrolled in schools in Pinedale, 22 (12.9%) attend a private institution, while the remaining 149 (87.1%) are enrolled in public schools. The age group of 20 to 24 year olds has the highest likelihood of being enrolled in private schools, with 22 (100.0% in the age bracket) enrolled. Conversely, the age group of 5 to 9 year old has the lowest likelihood of being enrolled in a private school, with 21 (100.0% in the age bracket) attending a public institution.
| Age Bracket | Public School | Private School |
| 3 to 4 Year Olds | 0 (0.0%) | 0 (0.0%) |
| 5 to 9 Year Old | 21 (100.0%) | 0 (0.0%) |
| 10 to 14 Year Olds | 128 (100.0%) | 0 (0.0%) |
| 15 to 17 Year Olds | 0 (0.0%) | 0 (0.0%) |
| 18 to 19 Year Olds | 0 (0.0%) | 0 (0.0%) |
| 20 to 24 Year Olds | 0 (0.0%) | 22 (100.0%) |
| 25 to 34 Year Olds | 0 (0.0%) | 0 (0.0%) |
| 35 Years and over | 0 (0.0%) | 0 (0.0%) |
| Total | 149 (87.1%) | 22 (12.9%) |
Educational Attainment by Field of Study in Pinedale
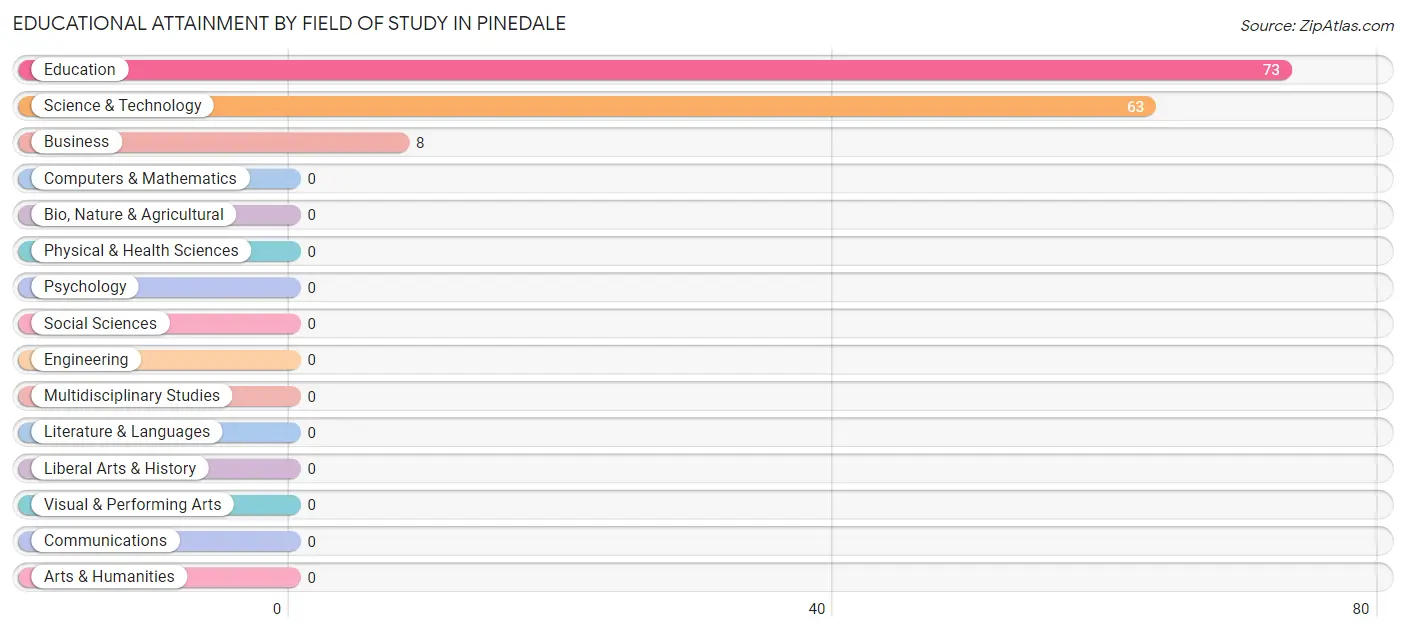
Education (73 | 50.7%), science & technology (63 | 43.8%), and business (8 | 5.6%) are the most common fields of study among 144 individuals in Pinedale who have obtained a bachelor's degree or higher.
| Field of Study | # Graduates | % Graduates |
| Computers & Mathematics | 0 | 0.0% |
| Bio, Nature & Agricultural | 0 | 0.0% |
| Physical & Health Sciences | 0 | 0.0% |
| Psychology | 0 | 0.0% |
| Social Sciences | 0 | 0.0% |
| Engineering | 0 | 0.0% |
| Multidisciplinary Studies | 0 | 0.0% |
| Science & Technology | 63 | 43.8% |
| Business | 8 | 5.6% |
| Education | 73 | 50.7% |
| Literature & Languages | 0 | 0.0% |
| Liberal Arts & History | 0 | 0.0% |
| Visual & Performing Arts | 0 | 0.0% |
| Communications | 0 | 0.0% |
| Arts & Humanities | 0 | 0.0% |
| Total | 144 | 100.0% |
Transportation & Commute in Pinedale
Vehicle Availability by Sex in Pinedale
The most prevalent vehicle ownership categories in Pinedale are males with 2 vehicles (75, accounting for 60.5%) and females with 2 vehicles (7, making up 76.5%).
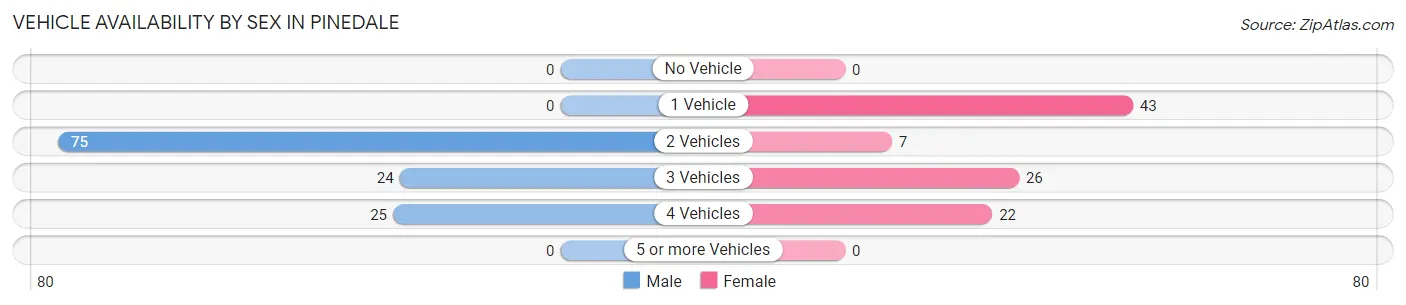
| Vehicles Available | Male | Female |
| No Vehicle | 0 (0.0%) | 0 (0.0%) |
| 1 Vehicle | 0 (0.0%) | 43 (43.9%) |
| 2 Vehicles | 75 (60.5%) | 7 (7.1%) |
| 3 Vehicles | 24 (19.4%) | 26 (26.5%) |
| 4 Vehicles | 25 (20.2%) | 22 (22.5%) |
| 5 or more Vehicles | 0 (0.0%) | 0 (0.0%) |
| Total | 124 (100.0%) | 98 (100.0%) |
Commute Time in Pinedale
The most frequently occuring commute durations in Pinedale are 30 to 34 minutes (75 commuters, 33.8%), 15 to 19 minutes (50 commuters, 22.5%), and 90 or more minutes (45 commuters, 20.3%).
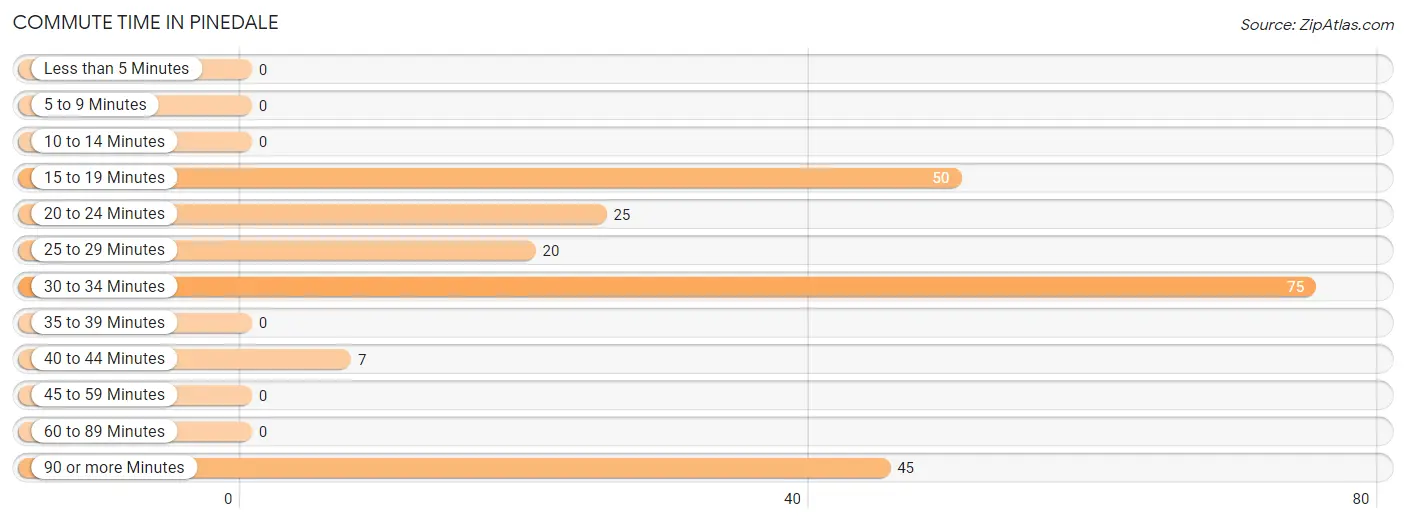
| Commute Time | # Commuters | % Commuters |
| Less than 5 Minutes | 0 | 0.0% |
| 5 to 9 Minutes | 0 | 0.0% |
| 10 to 14 Minutes | 0 | 0.0% |
| 15 to 19 Minutes | 50 | 22.5% |
| 20 to 24 Minutes | 25 | 11.3% |
| 25 to 29 Minutes | 20 | 9.0% |
| 30 to 34 Minutes | 75 | 33.8% |
| 35 to 39 Minutes | 0 | 0.0% |
| 40 to 44 Minutes | 7 | 3.2% |
| 45 to 59 Minutes | 0 | 0.0% |
| 60 to 89 Minutes | 0 | 0.0% |
| 90 or more Minutes | 45 | 20.3% |
Commute Time by Sex in Pinedale
The most common commute times in Pinedale are 30 to 34 minutes (75 commuters, 60.5%) for males and 90 or more minutes (45 commuters, 45.9%) for females.
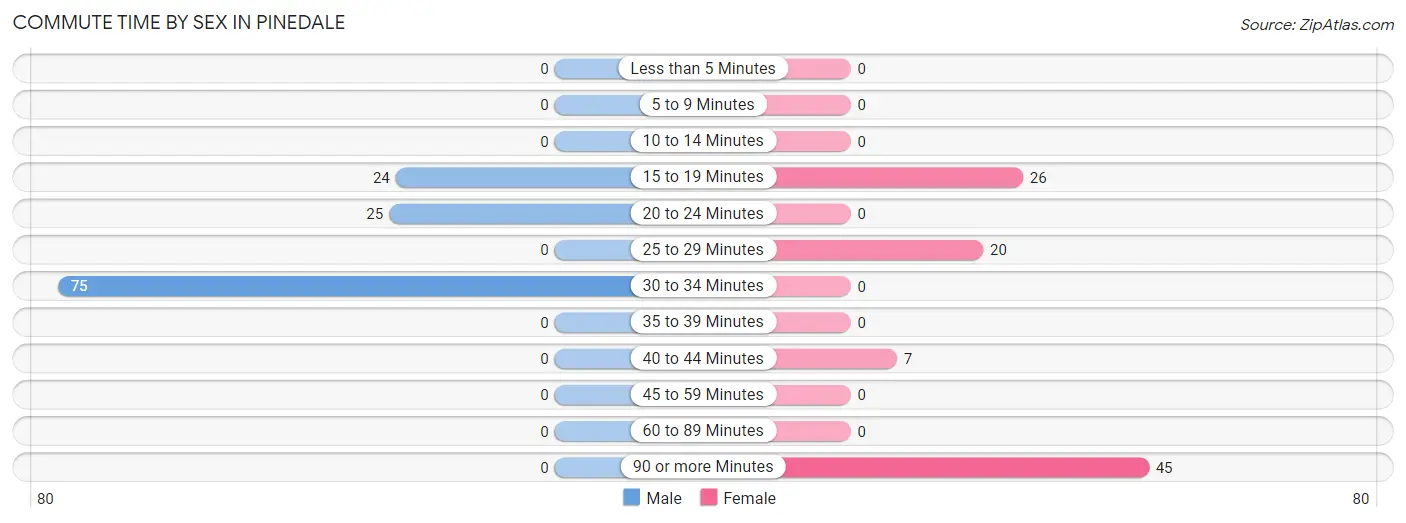
| Commute Time | Male | Female |
| Less than 5 Minutes | 0 (0.0%) | 0 (0.0%) |
| 5 to 9 Minutes | 0 (0.0%) | 0 (0.0%) |
| 10 to 14 Minutes | 0 (0.0%) | 0 (0.0%) |
| 15 to 19 Minutes | 24 (19.4%) | 26 (26.5%) |
| 20 to 24 Minutes | 25 (20.2%) | 0 (0.0%) |
| 25 to 29 Minutes | 0 (0.0%) | 20 (20.4%) |
| 30 to 34 Minutes | 75 (60.5%) | 0 (0.0%) |
| 35 to 39 Minutes | 0 (0.0%) | 0 (0.0%) |
| 40 to 44 Minutes | 0 (0.0%) | 7 (7.1%) |
| 45 to 59 Minutes | 0 (0.0%) | 0 (0.0%) |
| 60 to 89 Minutes | 0 (0.0%) | 0 (0.0%) |
| 90 or more Minutes | 0 (0.0%) | 45 (45.9%) |
Time of Departure to Work by Sex in Pinedale
The most frequent times of departure to work in Pinedale are 12:00 PM to 3:59 PM (75, 60.5%) for males and 8:30 AM to 8:59 AM (45, 45.9%) for females.
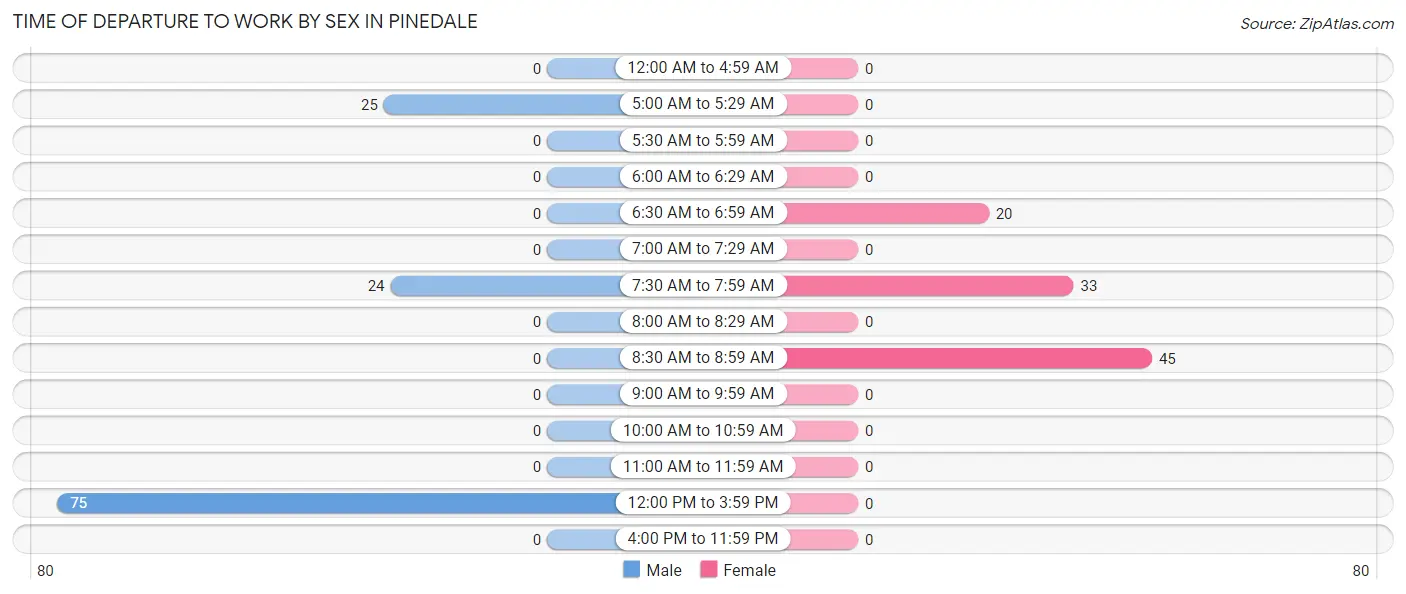
| Time of Departure | Male | Female |
| 12:00 AM to 4:59 AM | 0 (0.0%) | 0 (0.0%) |
| 5:00 AM to 5:29 AM | 25 (20.2%) | 0 (0.0%) |
| 5:30 AM to 5:59 AM | 0 (0.0%) | 0 (0.0%) |
| 6:00 AM to 6:29 AM | 0 (0.0%) | 0 (0.0%) |
| 6:30 AM to 6:59 AM | 0 (0.0%) | 20 (20.4%) |
| 7:00 AM to 7:29 AM | 0 (0.0%) | 0 (0.0%) |
| 7:30 AM to 7:59 AM | 24 (19.4%) | 33 (33.7%) |
| 8:00 AM to 8:29 AM | 0 (0.0%) | 0 (0.0%) |
| 8:30 AM to 8:59 AM | 0 (0.0%) | 45 (45.9%) |
| 9:00 AM to 9:59 AM | 0 (0.0%) | 0 (0.0%) |
| 10:00 AM to 10:59 AM | 0 (0.0%) | 0 (0.0%) |
| 11:00 AM to 11:59 AM | 0 (0.0%) | 0 (0.0%) |
| 12:00 PM to 3:59 PM | 75 (60.5%) | 0 (0.0%) |
| 4:00 PM to 11:59 PM | 0 (0.0%) | 0 (0.0%) |
| Total | 124 (100.0%) | 98 (100.0%) |
Housing Occupancy in Pinedale
Occupancy by Ownership in Pinedale
Of the total 227 dwellings in Pinedale, owner-occupied units account for 184 (81.1%), while renter-occupied units make up 43 (18.9%).
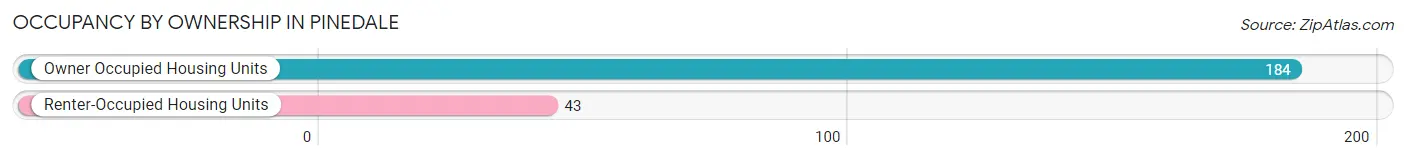
| Occupancy | # Housing Units | % Housing Units |
| Owner Occupied Housing Units | 184 | 81.1% |
| Renter-Occupied Housing Units | 43 | 18.9% |
| Total Occupied Housing Units | 227 | 100.0% |
Occupancy by Household Size in Pinedale
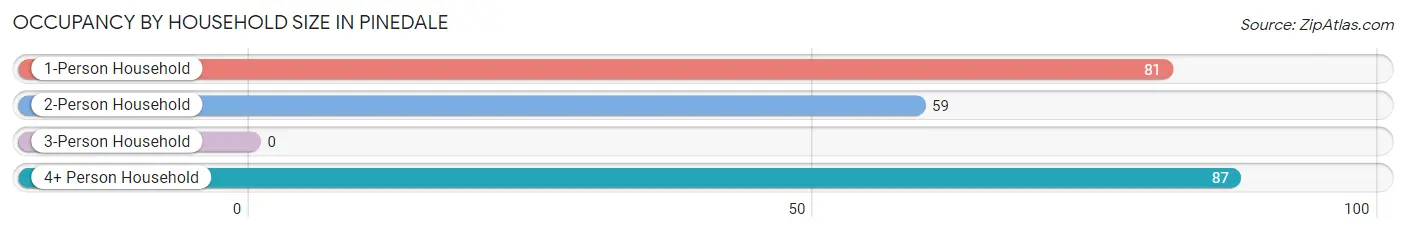
| Household Size | # Housing Units | % Housing Units |
| 1-Person Household | 81 | 35.7% |
| 2-Person Household | 59 | 26.0% |
| 3-Person Household | 0 | 0.0% |
| 4+ Person Household | 87 | 38.3% |
| Total Housing Units | 227 | 100.0% |
Occupancy by Ownership by Household Size in Pinedale
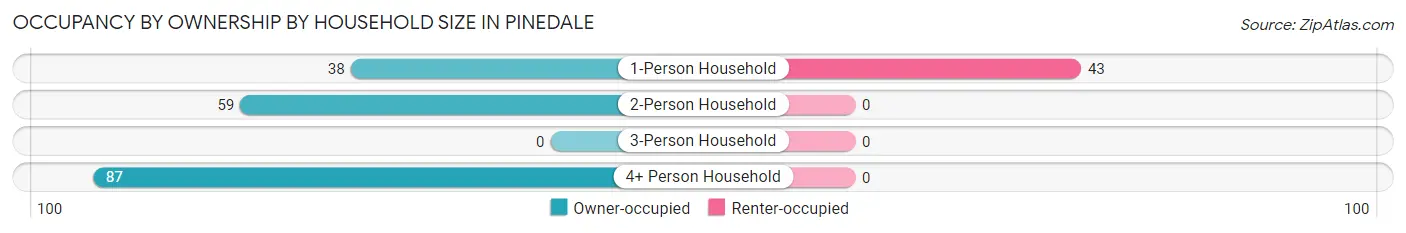
| Household Size | Owner-occupied | Renter-occupied |
| 1-Person Household | 38 (46.9%) | 43 (53.1%) |
| 2-Person Household | 59 (100.0%) | 0 (0.0%) |
| 3-Person Household | 0 (0.0%) | 0 (0.0%) |
| 4+ Person Household | 87 (100.0%) | 0 (0.0%) |
| Total Housing Units | 184 (81.1%) | 43 (18.9%) |
Occupancy by Educational Attainment in Pinedale
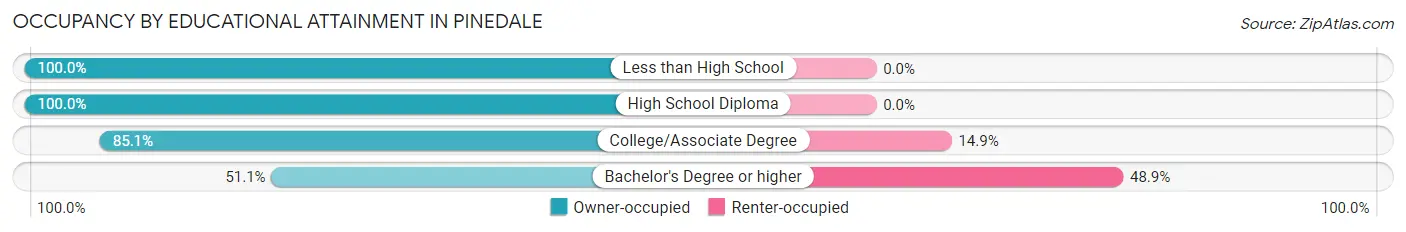
| Household Size | Owner-occupied | Renter-occupied |
| Less than High School | 18 (100.0%) | 0 (0.0%) |
| High School Diploma | 28 (100.0%) | 0 (0.0%) |
| College/Associate Degree | 114 (85.1%) | 20 (14.9%) |
| Bachelor's Degree or higher | 24 (51.1%) | 23 (48.9%) |
Occupancy by Age of Householder in Pinedale
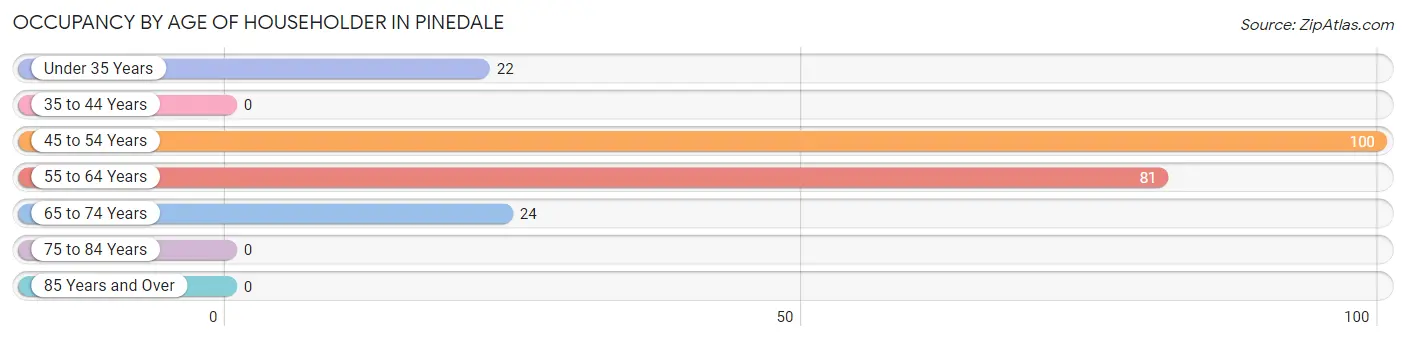
| Age Bracket | # Households | % Households |
| Under 35 Years | 22 | 9.7% |
| 35 to 44 Years | 0 | 0.0% |
| 45 to 54 Years | 100 | 44.1% |
| 55 to 64 Years | 81 | 35.7% |
| 65 to 74 Years | 24 | 10.6% |
| 75 to 84 Years | 0 | 0.0% |
| 85 Years and Over | 0 | 0.0% |
| Total | 227 | 100.0% |
Housing Finances in Pinedale
Median Income by Occupancy in Pinedale
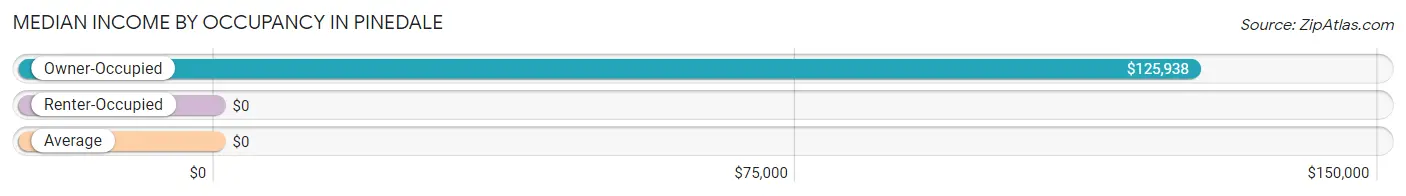
| Occupancy Type | # Households | Median Income |
| Owner-Occupied | 184 (81.1%) | $125,938 |
| Renter-Occupied | 43 (18.9%) | $0 |
| Average | 227 (100.0%) | $0 |
Occupancy by Householder Income Bracket in Pinedale
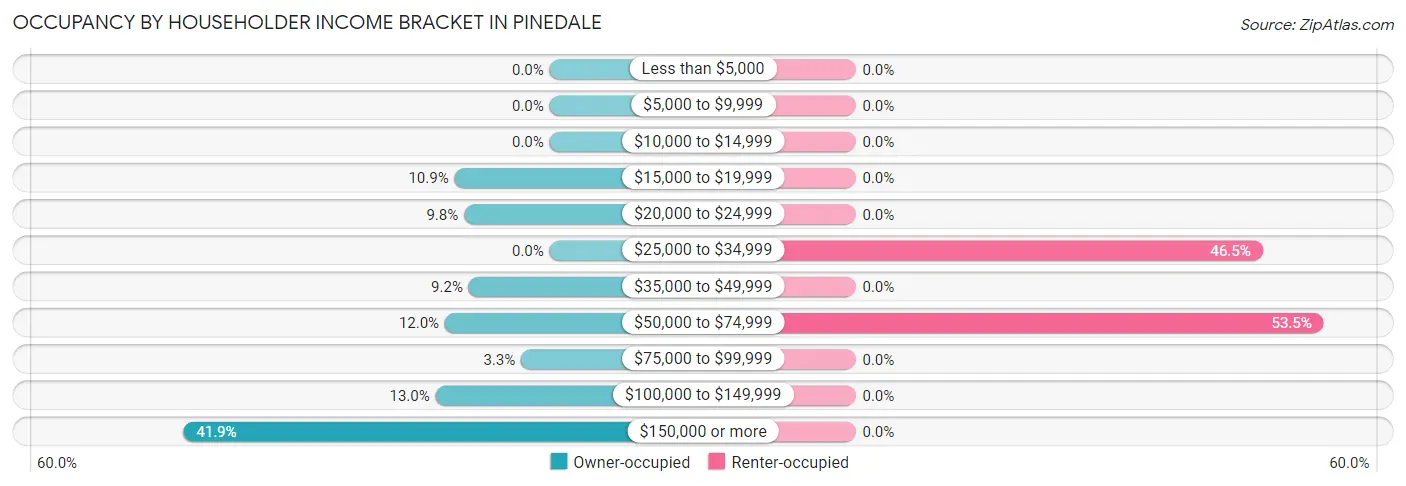
| Income Bracket | Owner-occupied | Renter-occupied |
| Less than $5,000 | 0 (0.0%) | 0 (0.0%) |
| $5,000 to $9,999 | 0 (0.0%) | 0 (0.0%) |
| $10,000 to $14,999 | 0 (0.0%) | 0 (0.0%) |
| $15,000 to $19,999 | 20 (10.9%) | 0 (0.0%) |
| $20,000 to $24,999 | 18 (9.8%) | 0 (0.0%) |
| $25,000 to $34,999 | 0 (0.0%) | 20 (46.5%) |
| $35,000 to $49,999 | 17 (9.2%) | 0 (0.0%) |
| $50,000 to $74,999 | 22 (12.0%) | 23 (53.5%) |
| $75,000 to $99,999 | 6 (3.3%) | 0 (0.0%) |
| $100,000 to $149,999 | 24 (13.0%) | 0 (0.0%) |
| $150,000 or more | 77 (41.8%) | 0 (0.0%) |
| Total | 184 (100.0%) | 43 (100.0%) |
Monthly Housing Cost Tiers in Pinedale
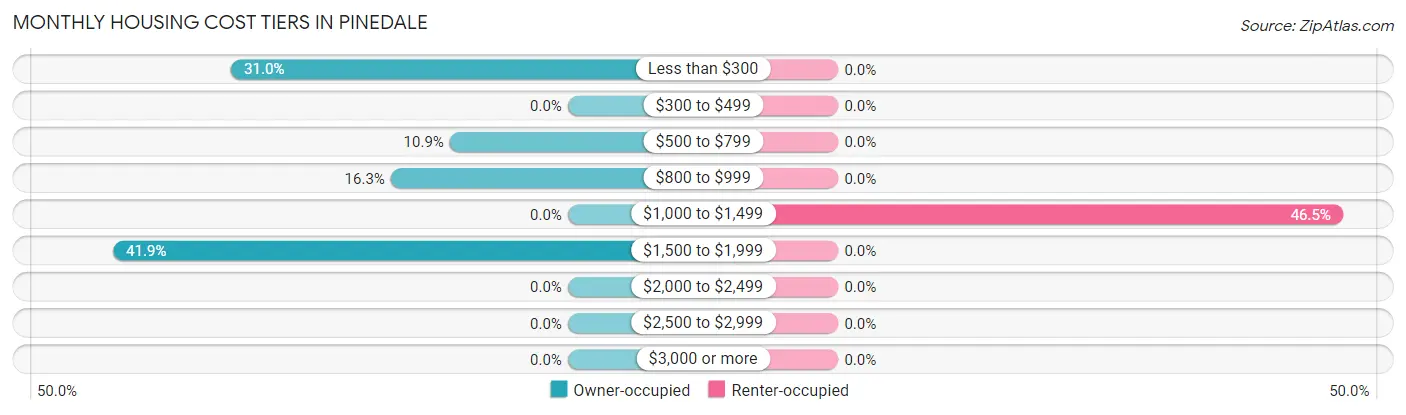
| Monthly Cost | Owner-occupied | Renter-occupied |
| Less than $300 | 57 (31.0%) | 0 (0.0%) |
| $300 to $499 | 0 (0.0%) | 0 (0.0%) |
| $500 to $799 | 20 (10.9%) | 0 (0.0%) |
| $800 to $999 | 30 (16.3%) | 0 (0.0%) |
| $1,000 to $1,499 | 0 (0.0%) | 20 (46.5%) |
| $1,500 to $1,999 | 77 (41.8%) | 0 (0.0%) |
| $2,000 to $2,499 | 0 (0.0%) | 0 (0.0%) |
| $2,500 to $2,999 | 0 (0.0%) | 0 (0.0%) |
| $3,000 or more | 0 (0.0%) | 0 (0.0%) |
| Total | 184 (100.0%) | 43 (100.0%) |
Physical Housing Characteristics in Pinedale
Housing Structures in Pinedale
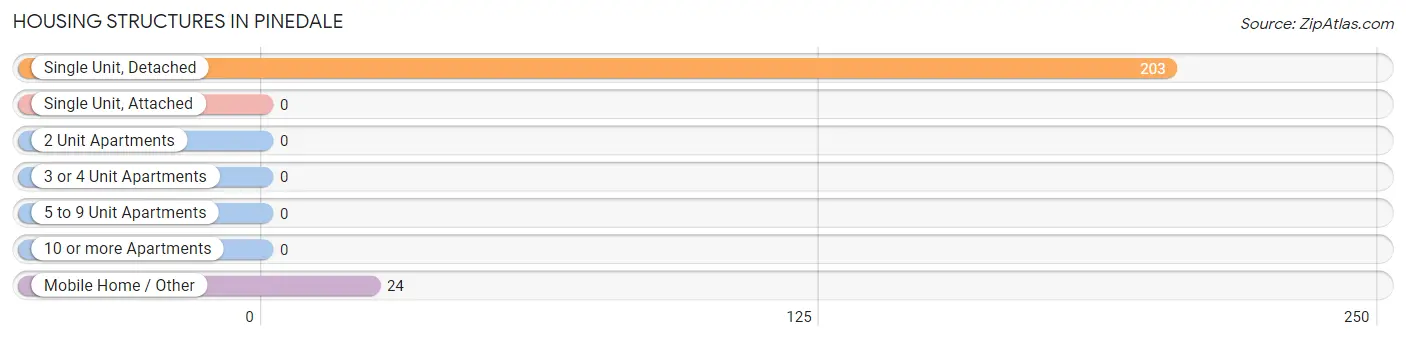
| Structure Type | # Housing Units | % Housing Units |
| Single Unit, Detached | 203 | 89.4% |
| Single Unit, Attached | 0 | 0.0% |
| 2 Unit Apartments | 0 | 0.0% |
| 3 or 4 Unit Apartments | 0 | 0.0% |
| 5 to 9 Unit Apartments | 0 | 0.0% |
| 10 or more Apartments | 0 | 0.0% |
| Mobile Home / Other | 24 | 10.6% |
| Total | 227 | 100.0% |
Housing Structures by Occupancy in Pinedale
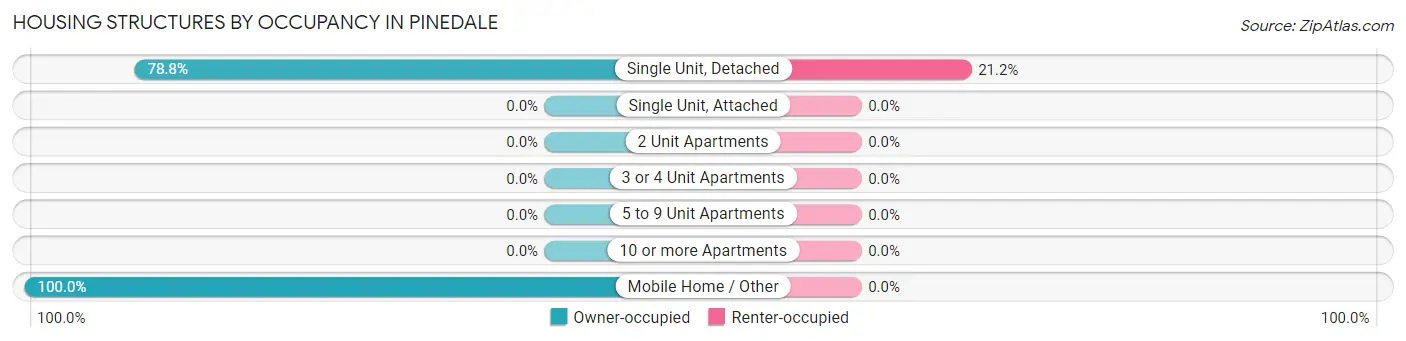
| Structure Type | Owner-occupied | Renter-occupied |
| Single Unit, Detached | 160 (78.8%) | 43 (21.2%) |
| Single Unit, Attached | 0 (0.0%) | 0 (0.0%) |
| 2 Unit Apartments | 0 (0.0%) | 0 (0.0%) |
| 3 or 4 Unit Apartments | 0 (0.0%) | 0 (0.0%) |
| 5 to 9 Unit Apartments | 0 (0.0%) | 0 (0.0%) |
| 10 or more Apartments | 0 (0.0%) | 0 (0.0%) |
| Mobile Home / Other | 24 (100.0%) | 0 (0.0%) |
| Total | 184 (81.1%) | 43 (18.9%) |
Housing Structures by Number of Rooms in Pinedale
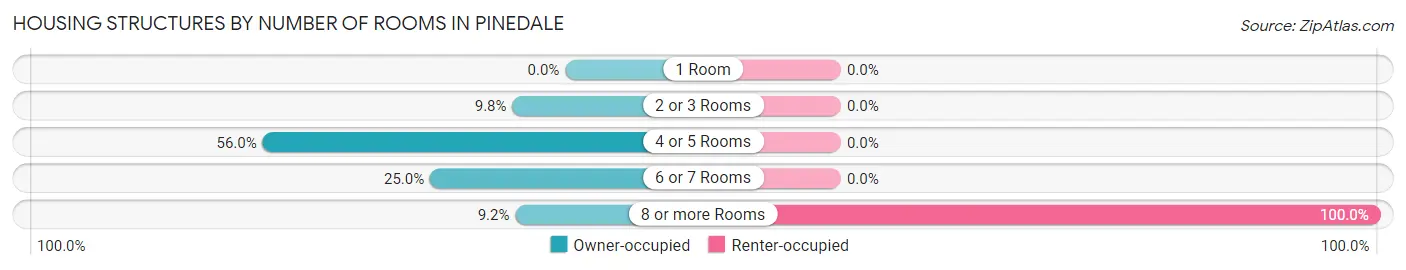
| Number of Rooms | Owner-occupied | Renter-occupied |
| 1 Room | 0 (0.0%) | 0 (0.0%) |
| 2 or 3 Rooms | 18 (9.8%) | 0 (0.0%) |
| 4 or 5 Rooms | 103 (56.0%) | 0 (0.0%) |
| 6 or 7 Rooms | 46 (25.0%) | 0 (0.0%) |
| 8 or more Rooms | 17 (9.2%) | 43 (100.0%) |
| Total | 184 (100.0%) | 43 (100.0%) |
Housing Structure by Heating Type in Pinedale
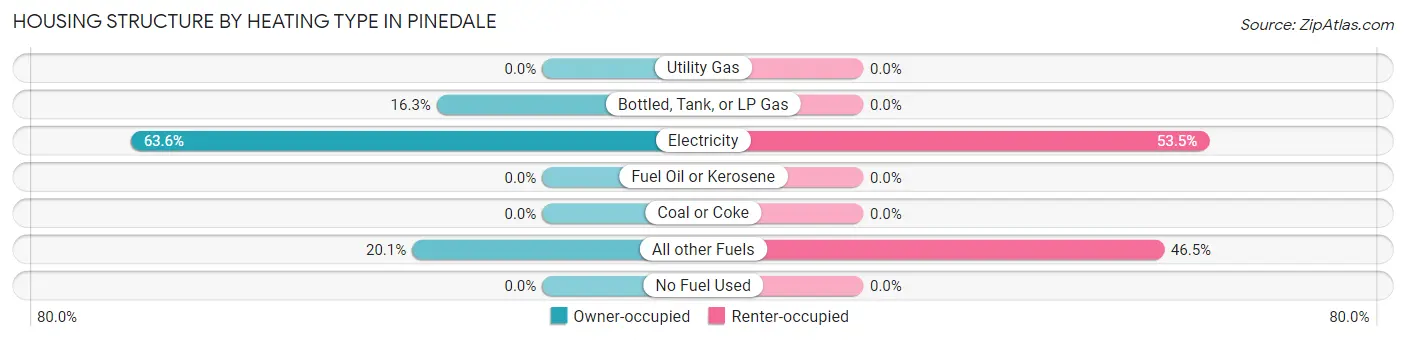
| Heating Type | Owner-occupied | Renter-occupied |
| Utility Gas | 0 (0.0%) | 0 (0.0%) |
| Bottled, Tank, or LP Gas | 30 (16.3%) | 0 (0.0%) |
| Electricity | 117 (63.6%) | 23 (53.5%) |
| Fuel Oil or Kerosene | 0 (0.0%) | 0 (0.0%) |
| Coal or Coke | 0 (0.0%) | 0 (0.0%) |
| All other Fuels | 37 (20.1%) | 20 (46.5%) |
| No Fuel Used | 0 (0.0%) | 0 (0.0%) |
| Total | 184 (100.0%) | 43 (100.0%) |
Household Vehicle Usage in Pinedale
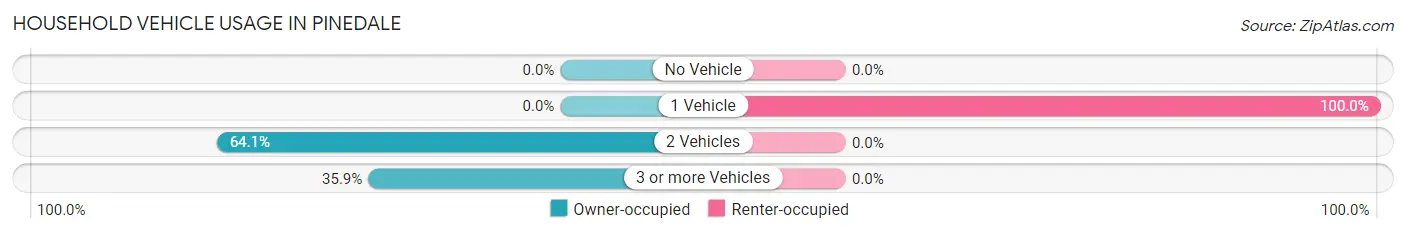
| Vehicles per Household | Owner-occupied | Renter-occupied |
| No Vehicle | 0 (0.0%) | 0 (0.0%) |
| 1 Vehicle | 0 (0.0%) | 43 (100.0%) |
| 2 Vehicles | 118 (64.1%) | 0 (0.0%) |
| 3 or more Vehicles | 66 (35.9%) | 0 (0.0%) |
| Total | 184 (100.0%) | 43 (100.0%) |
Real Estate & Mortgages in Pinedale
Real Estate and Mortgage Overview in Pinedale
| Characteristic | Without Mortgage | With Mortgage |
| Housing Units | 57 | 127 |
| Median Property Value | $273,900 | $317,500 |
| Median Household Income | $44,044 | $77 |
| Monthly Housing Costs | $168 | $0 |
| Real Estate Taxes | - | - |
Property Value by Mortgage Status in Pinedale
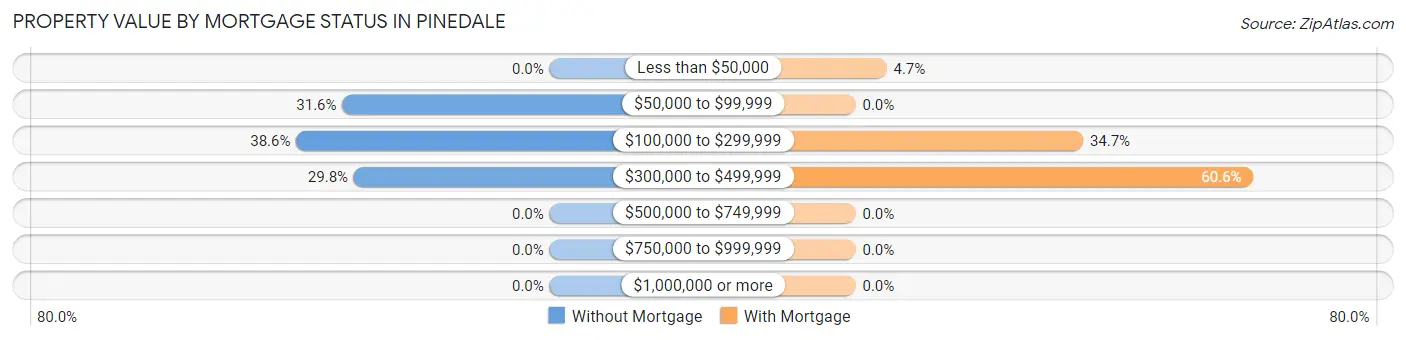
| Property Value | Without Mortgage | With Mortgage |
| Less than $50,000 | 0 (0.0%) | 6 (4.7%) |
| $50,000 to $99,999 | 18 (31.6%) | 0 (0.0%) |
| $100,000 to $299,999 | 22 (38.6%) | 44 (34.6%) |
| $300,000 to $499,999 | 17 (29.8%) | 77 (60.6%) |
| $500,000 to $749,999 | 0 (0.0%) | 0 (0.0%) |
| $750,000 to $999,999 | 0 (0.0%) | 0 (0.0%) |
| $1,000,000 or more | 0 (0.0%) | 0 (0.0%) |
| Total | 57 (100.0%) | 127 (100.0%) |
Household Income by Mortgage Status in Pinedale
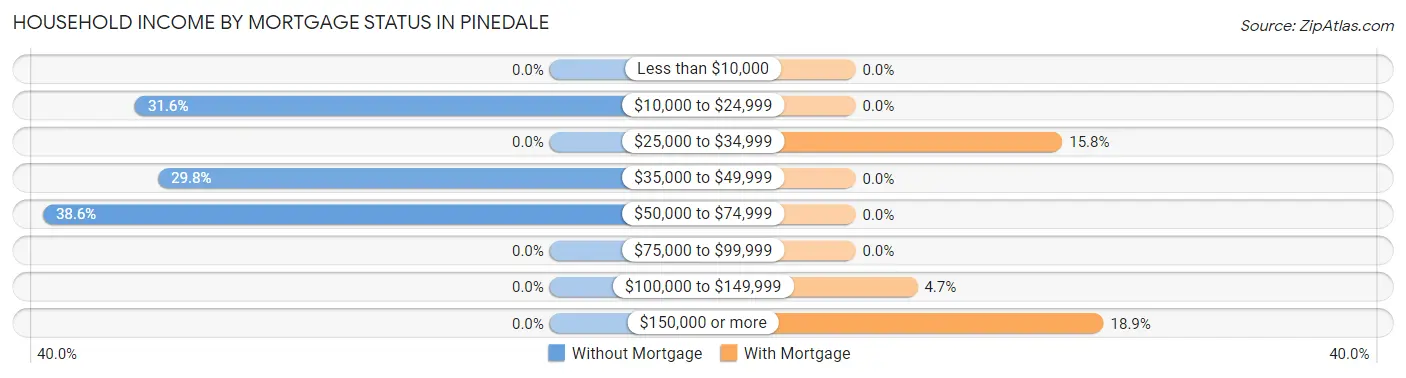
| Household Income | Without Mortgage | With Mortgage |
| Less than $10,000 | 0 (0.0%) | 0 (0.0%) |
| $10,000 to $24,999 | 18 (31.6%) | 0 (0.0%) |
| $25,000 to $34,999 | 0 (0.0%) | 20 (15.8%) |
| $35,000 to $49,999 | 17 (29.8%) | 0 (0.0%) |
| $50,000 to $74,999 | 22 (38.6%) | 0 (0.0%) |
| $75,000 to $99,999 | 0 (0.0%) | 0 (0.0%) |
| $100,000 to $149,999 | 0 (0.0%) | 6 (4.7%) |
| $150,000 or more | 0 (0.0%) | 24 (18.9%) |
| Total | 57 (100.0%) | 127 (100.0%) |
Property Value to Household Income Ratio in Pinedale
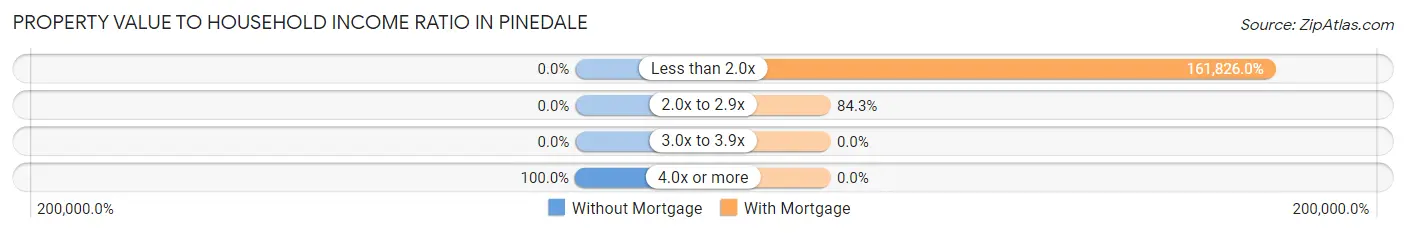
| Value-to-Income Ratio | Without Mortgage | With Mortgage |
| Less than 2.0x | 0 (0.0%) | 205,519 (161,826.0%) |
| 2.0x to 2.9x | 0 (0.0%) | 107 (84.3%) |
| 3.0x to 3.9x | 0 (0.0%) | 0 (0.0%) |
| 4.0x or more | 57 (100.0%) | 0 (0.0%) |
| Total | 57 (100.0%) | 127 (100.0%) |
Real Estate Taxes by Mortgage Status in Pinedale
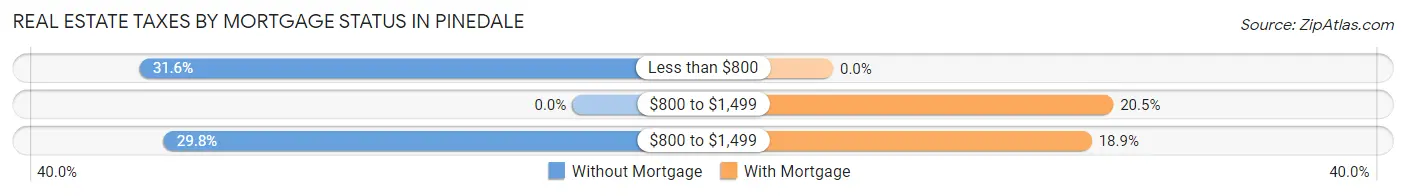
| Property Taxes | Without Mortgage | With Mortgage |
| Less than $800 | 18 (31.6%) | 0 (0.0%) |
| $800 to $1,499 | 0 (0.0%) | 26 (20.5%) |
| $800 to $1,499 | 17 (29.8%) | 24 (18.9%) |
| Total | 57 (100.0%) | 127 (100.0%) |
Health & Disability in Pinedale
Health Insurance Coverage by Age in Pinedale
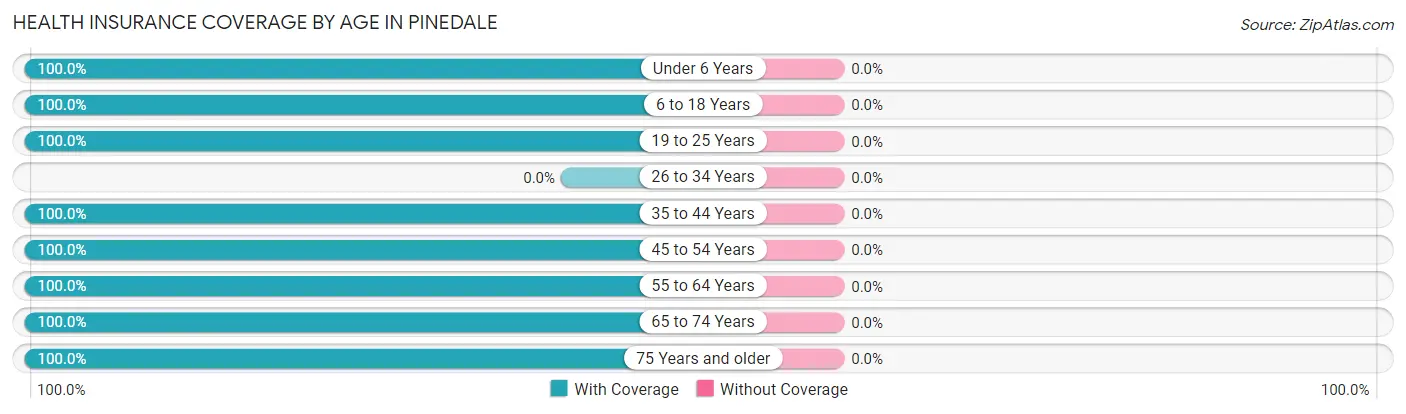
| Age Bracket | With Coverage | Without Coverage |
| Under 6 Years | 21 (100.0%) | 0 (0.0%) |
| 6 to 18 Years | 149 (100.0%) | 0 (0.0%) |
| 19 to 25 Years | 22 (100.0%) | 0 (0.0%) |
| 26 to 34 Years | 0 (0.0%) | 0 (0.0%) |
| 35 to 44 Years | 25 (100.0%) | 0 (0.0%) |
| 45 to 54 Years | 197 (100.0%) | 0 (0.0%) |
| 55 to 64 Years | 81 (100.0%) | 0 (0.0%) |
| 65 to 74 Years | 31 (100.0%) | 0 (0.0%) |
| 75 Years and older | 17 (100.0%) | 0 (0.0%) |
| Total | 543 (100.0%) | 0 (0.0%) |
Health Insurance Coverage by Citizenship Status in Pinedale

| Citizenship Status | With Coverage | Without Coverage |
| Native Born | 21 (100.0%) | 0 (0.0%) |
| Foreign Born, Citizen | 149 (100.0%) | 0 (0.0%) |
| Foreign Born, not a Citizen | 22 (100.0%) | 0 (0.0%) |
Health Insurance Coverage by Household Income in Pinedale
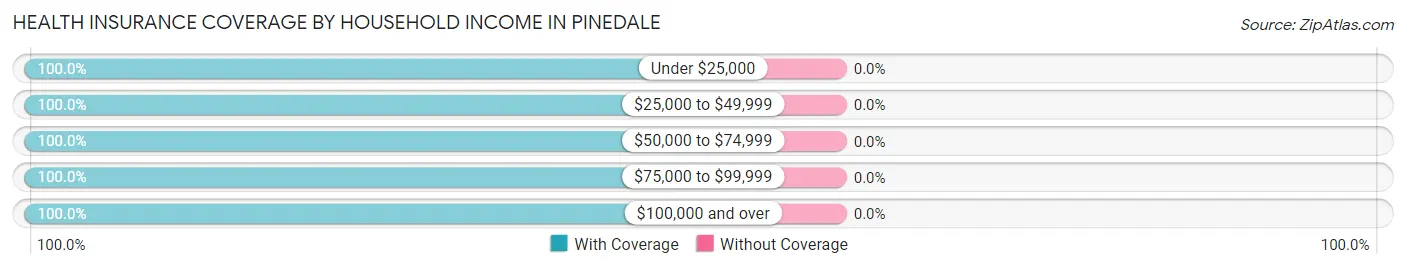
| Household Income | With Coverage | Without Coverage |
| Under $25,000 | 38 (100.0%) | 0 (0.0%) |
| $25,000 to $49,999 | 54 (100.0%) | 0 (0.0%) |
| $50,000 to $74,999 | 164 (100.0%) | 0 (0.0%) |
| $75,000 to $99,999 | 13 (100.0%) | 0 (0.0%) |
| $100,000 and over | 274 (100.0%) | 0 (0.0%) |
Public vs Private Health Insurance Coverage by Age in Pinedale
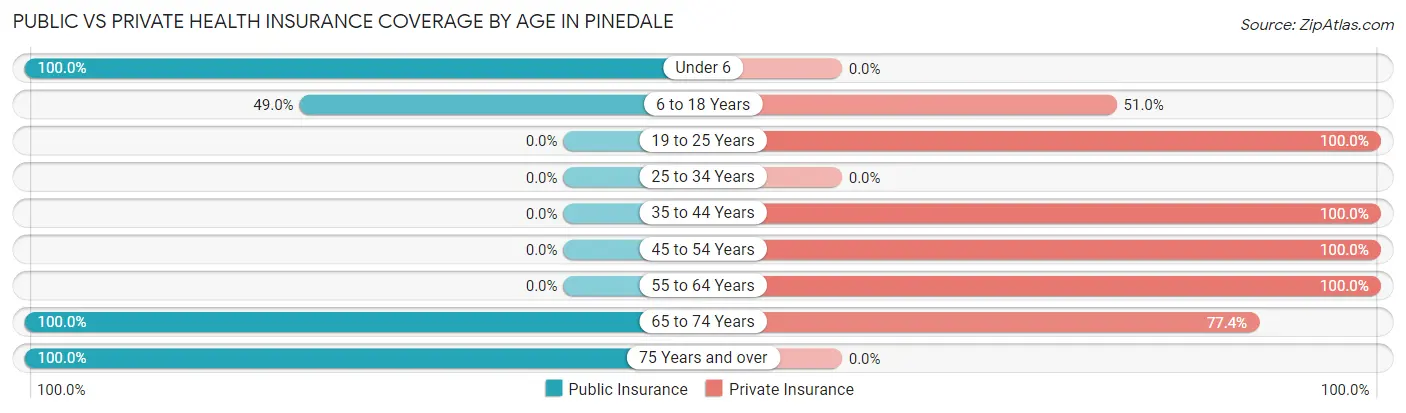
| Age Bracket | Public Insurance | Private Insurance |
| Under 6 | 21 (100.0%) | 0 (0.0%) |
| 6 to 18 Years | 73 (49.0%) | 76 (51.0%) |
| 19 to 25 Years | 0 (0.0%) | 22 (100.0%) |
| 25 to 34 Years | 0 (0.0%) | 0 (0.0%) |
| 35 to 44 Years | 0 (0.0%) | 25 (100.0%) |
| 45 to 54 Years | 0 (0.0%) | 197 (100.0%) |
| 55 to 64 Years | 0 (0.0%) | 81 (100.0%) |
| 65 to 74 Years | 31 (100.0%) | 24 (77.4%) |
| 75 Years and over | 17 (100.0%) | 0 (0.0%) |
| Total | 142 (26.2%) | 425 (78.3%) |
Disability Status by Sex by Age in Pinedale
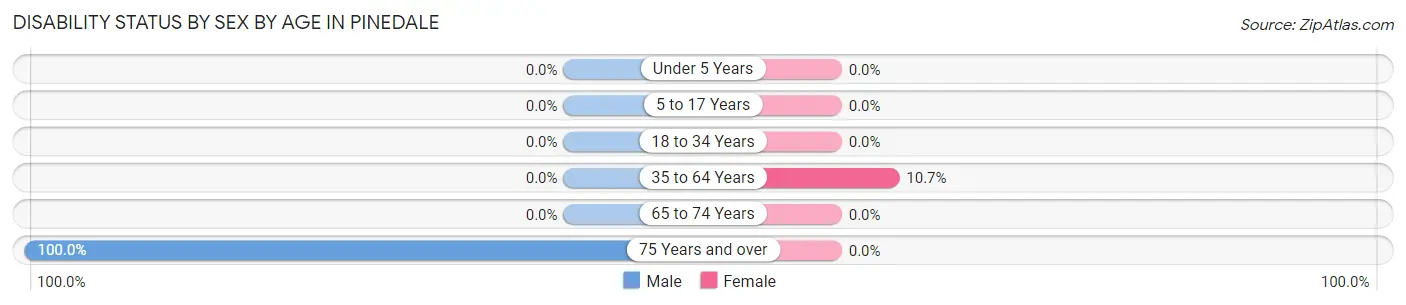
| Age Bracket | Male | Female |
| Under 5 Years | 0 (0.0%) | 0 (0.0%) |
| 5 to 17 Years | 0 (0.0%) | 0 (0.0%) |
| 18 to 34 Years | 0 (0.0%) | 0 (0.0%) |
| 35 to 64 Years | 0 (0.0%) | 17 (10.7%) |
| 65 to 74 Years | 0 (0.0%) | 0 (0.0%) |
| 75 Years and over | 17 (100.0%) | 0 (0.0%) |
Disability Class by Sex by Age in Pinedale
Disability Class: Hearing Difficulty
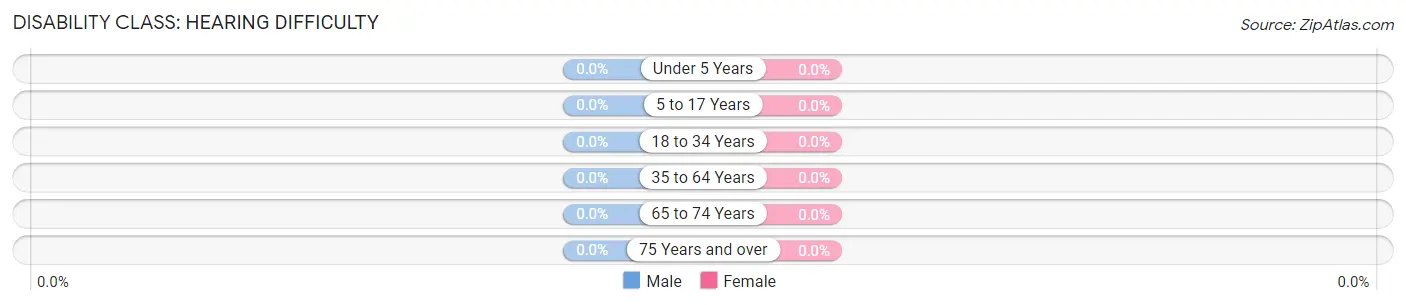
| Age Bracket | Male | Female |
| Under 5 Years | 0 (0.0%) | 0 (0.0%) |
| 5 to 17 Years | 0 (0.0%) | 0 (0.0%) |
| 18 to 34 Years | 0 (0.0%) | 0 (0.0%) |
| 35 to 64 Years | 0 (0.0%) | 0 (0.0%) |
| 65 to 74 Years | 0 (0.0%) | 0 (0.0%) |
| 75 Years and over | 0 (0.0%) | 0 (0.0%) |
Disability Class: Vision Difficulty
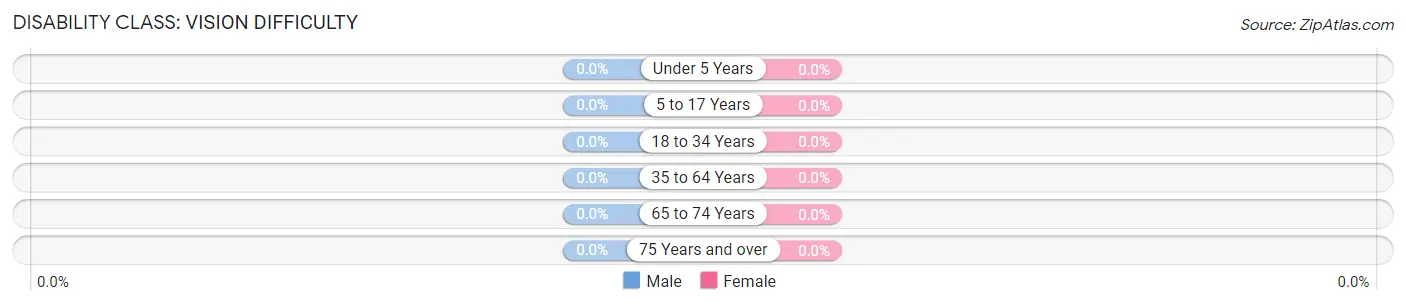
| Age Bracket | Male | Female |
| Under 5 Years | 0 (0.0%) | 0 (0.0%) |
| 5 to 17 Years | 0 (0.0%) | 0 (0.0%) |
| 18 to 34 Years | 0 (0.0%) | 0 (0.0%) |
| 35 to 64 Years | 0 (0.0%) | 0 (0.0%) |
| 65 to 74 Years | 0 (0.0%) | 0 (0.0%) |
| 75 Years and over | 0 (0.0%) | 0 (0.0%) |
Disability Class: Cognitive Difficulty
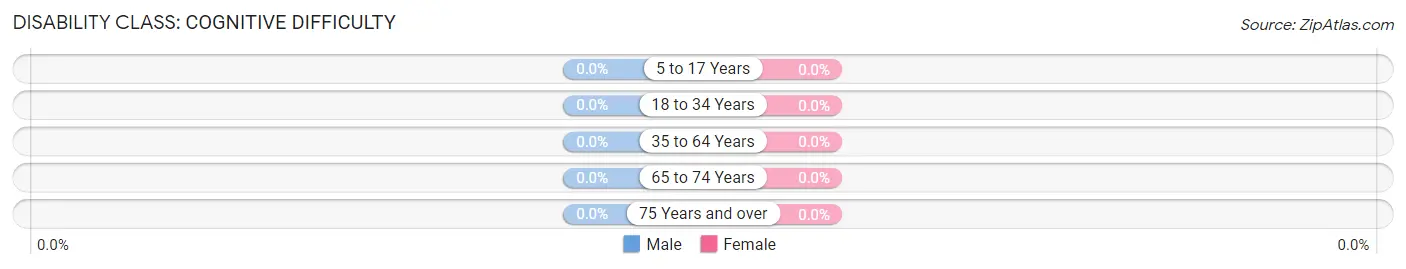
| Age Bracket | Male | Female |
| 5 to 17 Years | 0 (0.0%) | 0 (0.0%) |
| 18 to 34 Years | 0 (0.0%) | 0 (0.0%) |
| 35 to 64 Years | 0 (0.0%) | 0 (0.0%) |
| 65 to 74 Years | 0 (0.0%) | 0 (0.0%) |
| 75 Years and over | 0 (0.0%) | 0 (0.0%) |
Disability Class: Ambulatory Difficulty
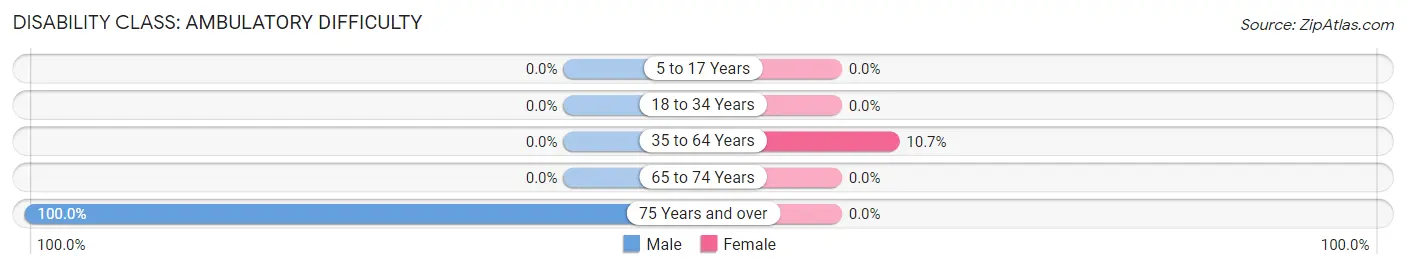
| Age Bracket | Male | Female |
| 5 to 17 Years | 0 (0.0%) | 0 (0.0%) |
| 18 to 34 Years | 0 (0.0%) | 0 (0.0%) |
| 35 to 64 Years | 0 (0.0%) | 17 (10.7%) |
| 65 to 74 Years | 0 (0.0%) | 0 (0.0%) |
| 75 Years and over | 17 (100.0%) | 0 (0.0%) |
Disability Class: Self-Care Difficulty

| Age Bracket | Male | Female |
| 5 to 17 Years | 0 (0.0%) | 0 (0.0%) |
| 18 to 34 Years | 0 (0.0%) | 0 (0.0%) |
| 35 to 64 Years | 0 (0.0%) | 17 (10.7%) |
| 65 to 74 Years | 0 (0.0%) | 0 (0.0%) |
| 75 Years and over | 17 (100.0%) | 0 (0.0%) |
Technology Access in Pinedale
Computing Device Access in Pinedale
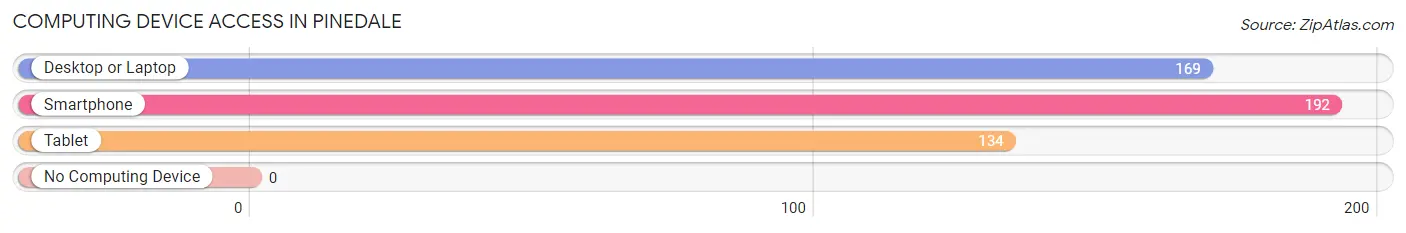
| Device Type | # Households | % Households |
| Desktop or Laptop | 169 | 74.5% |
| Smartphone | 192 | 84.6% |
| Tablet | 134 | 59.0% |
| No Computing Device | 0 | 0.0% |
| Total | 227 | 100.0% |
Internet Access in Pinedale
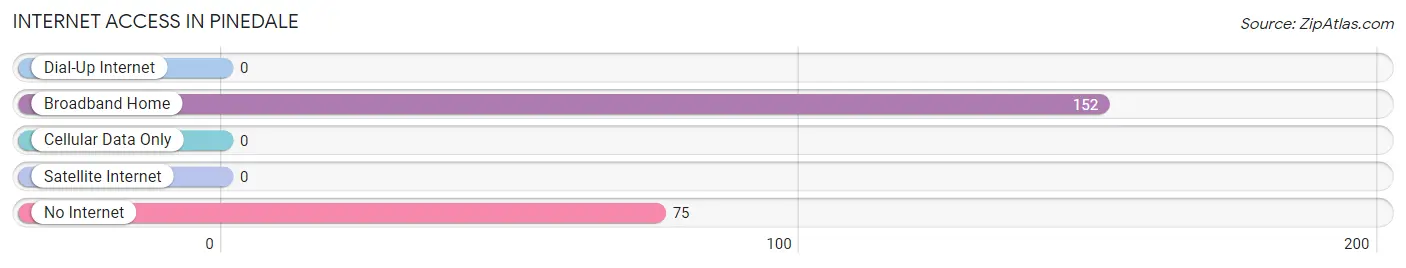
| Internet Type | # Households | % Households |
| Dial-Up Internet | 0 | 0.0% |
| Broadband Home | 152 | 67.0% |
| Cellular Data Only | 0 | 0.0% |
| Satellite Internet | 0 | 0.0% |
| No Internet | 75 | 33.0% |
| Total | 227 | 100.0% |
Pinedale Summary
Pinedale is a small unincorporated community located in Navajo County, Arizona. It is situated in the White Mountains of Arizona, approximately 20 miles east of Show Low. The town is located at an elevation of 6,400 feet and has a population of approximately 1,000 people.
History
Pinedale was established in the late 1800s as a mining camp. The town was named after the abundance of pine trees in the area. The first settlers were miners who were attracted to the area by the discovery of silver and gold. The town grew quickly and by the early 1900s, it had become a bustling mining town with a population of over 1,000 people.
The town was also home to a number of businesses, including a hotel, saloon, general store, and post office. The town was also home to a number of churches, including the First Baptist Church, which was established in 1902.
In the early 1900s, the town began to decline as the mining industry in the area began to decline. By the mid-1900s, the population had dropped to less than 500 people.
Geography
Pinedale is located in the White Mountains of Arizona, approximately 20 miles east of Show Low. The town is situated at an elevation of 6,400 feet and is surrounded by the Apache-Sitgreaves National Forest. The town is located in a valley surrounded by mountains, including the White Mountains, the San Francisco Peaks, and the Mogollon Rim.
The climate in Pinedale is semi-arid, with hot summers and cold winters. The average annual temperature is approximately 50 degrees Fahrenheit. The average annual precipitation is approximately 12 inches.
Economy
The economy of Pinedale is largely based on tourism. The town is a popular destination for outdoor activities such as camping, fishing, hunting, and hiking. The town is also home to a number of businesses, including restaurants, hotels, and stores.
The town is also home to a number of small businesses, including a sawmill, a lumber yard, and a feed store. The town is also home to a number of ranches, which provide employment for many of the town's residents.
Demographics
As of the 2010 census, the population of Pinedale was 1,000 people. The racial makeup of the town was 95.2% White, 0.7% Native American, 0.3% Asian, 0.1% Pacific Islander, 0.1% from other races, and 3.7% from two or more races. The median household income was $35,000.
Conclusion
Pinedale is a small unincorporated community located in Navajo County, Arizona. It is situated in the White Mountains of Arizona, approximately 20 miles east of Show Low. The town is located at an elevation of 6,400 feet and has a population of approximately 1,000 people. The economy of Pinedale is largely based on tourism, with a number of businesses catering to outdoor activities. The town is also home to a number of small businesses, including a sawmill, a lumber yard, and a feed store. The racial makeup of the town is 95.2% White, 0.7% Native American, 0.3% Asian, 0.1% Pacific Islander, 0.1% from other races, and 3.7% from two or more races. The median household income was $35,000. Pinedale is a small but vibrant community that offers a variety of activities and attractions for visitors and residents alike.
Common Questions
What is Per Capita Income in Pinedale?
Per Capita income in Pinedale is $44,561.
What is the Median Family Income in Pinedale?
Median Family Income in Pinedale is $205,269.
What is Inequality or Gini Index in Pinedale?
Inequality or Gini Index in Pinedale is 0.41.
What is the Total Population of Pinedale?
Total Population of Pinedale is 543.
What is the Total Male Population of Pinedale?
Total Male Population of Pinedale is 303.
What is the Total Female Population of Pinedale?
Total Female Population of Pinedale is 240.
What is the Ratio of Males per 100 Females in Pinedale?
There are 126.25 Males per 100 Females in Pinedale.
What is the Ratio of Females per 100 Males in Pinedale?
There are 79.21 Females per 100 Males in Pinedale.
What is the Median Population Age in Pinedale?
Median Population Age in Pinedale is 45.8 Years.
What is the Average Family Size in Pinedale
Average Family Size in Pinedale is 3.2 People.
What is the Average Household Size in Pinedale
Average Household Size in Pinedale is 2.4 People.
How Large is the Labor Force in Pinedale?
There are 222 People in the Labor Forcein in Pinedale.
What is the Percentage of People in the Labor Force in Pinedale?
59.5% of People are in the Labor Force in Pinedale.