Zip Codes with the Highest Percentage of Population Employed in Health Diagnosing & Treating in Peoria, AZ
RELATED REPORTS & OPTIONS
Health Diagnosing & Treating
Peoria
Compare Zip Codes
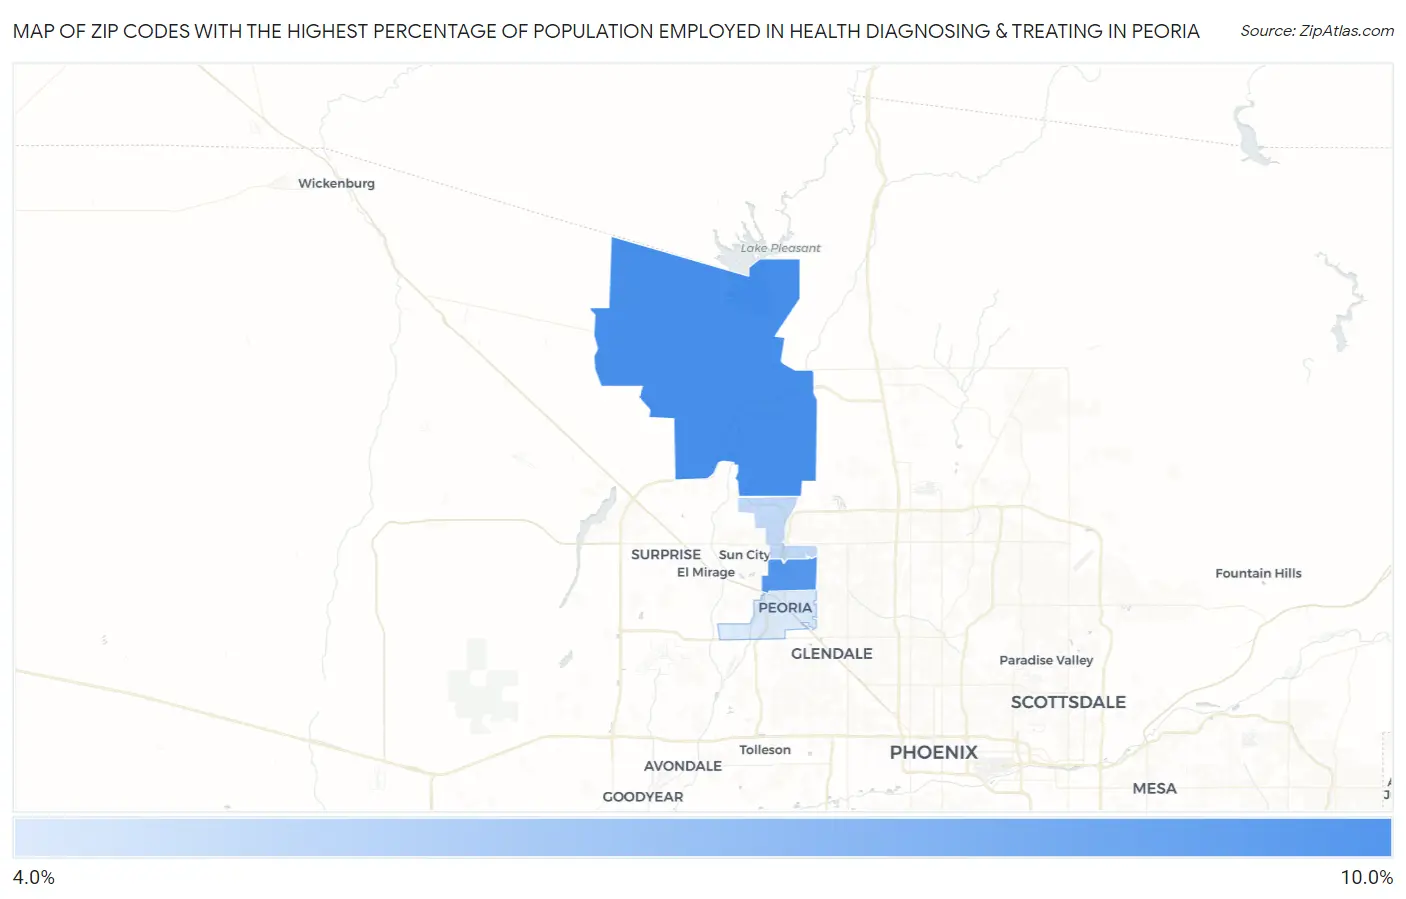
Map of Zip Codes with the Highest Percentage of Population Employed in Health Diagnosing & Treating in Peoria
4.6%
9.9%
Zip Codes with the Highest Percentage of Population Employed in Health Diagnosing & Treating in Peoria, AZ
| Zip Code | % Employed | vs State | vs National | |
| 1. | 85383 | 9.9% | 5.9%(+3.99)#34 | 6.2%(+3.62)#4,035 |
| 2. | 85381 | 9.4% | 5.9%(+3.53)#47 | 6.2%(+3.16)#4,670 |
| 3. | 85382 | 5.6% | 5.9%(-0.251)#177 | 6.2%(-0.615)#15,268 |
| 4. | 85345 | 4.6% | 5.9%(-1.23)#215 | 6.2%(-1.59)#19,066 |
1
Common Questions
What are the Top 3 Zip Codes with the Highest Percentage of Population Employed in Health Diagnosing & Treating in Peoria, AZ?
Top 3 Zip Codes with the Highest Percentage of Population Employed in Health Diagnosing & Treating in Peoria, AZ are:
What zip code has the Highest Percentage of Population Employed in Health Diagnosing & Treating in Peoria, AZ?
85383 has the Highest Percentage of Population Employed in Health Diagnosing & Treating in Peoria, AZ with 9.9%.
What is the Percentage of Population Employed in Health Diagnosing & Treating in Peoria, AZ?
Percentage of Population Employed in Health Diagnosing & Treating in Peoria is 7.4%.
What is the Percentage of Population Employed in Health Diagnosing & Treating in Arizona?
Percentage of Population Employed in Health Diagnosing & Treating in Arizona is 5.9%.
What is the Percentage of Population Employed in Health Diagnosing & Treating in the United States?
Percentage of Population Employed in Health Diagnosing & Treating in the United States is 6.2%.