Zip Codes with the Highest Percentage of Population Employed in Health Diagnosing & Treating in Tucson, AZ
RELATED REPORTS & OPTIONS
Health Diagnosing & Treating
Tucson
Compare Zip Codes
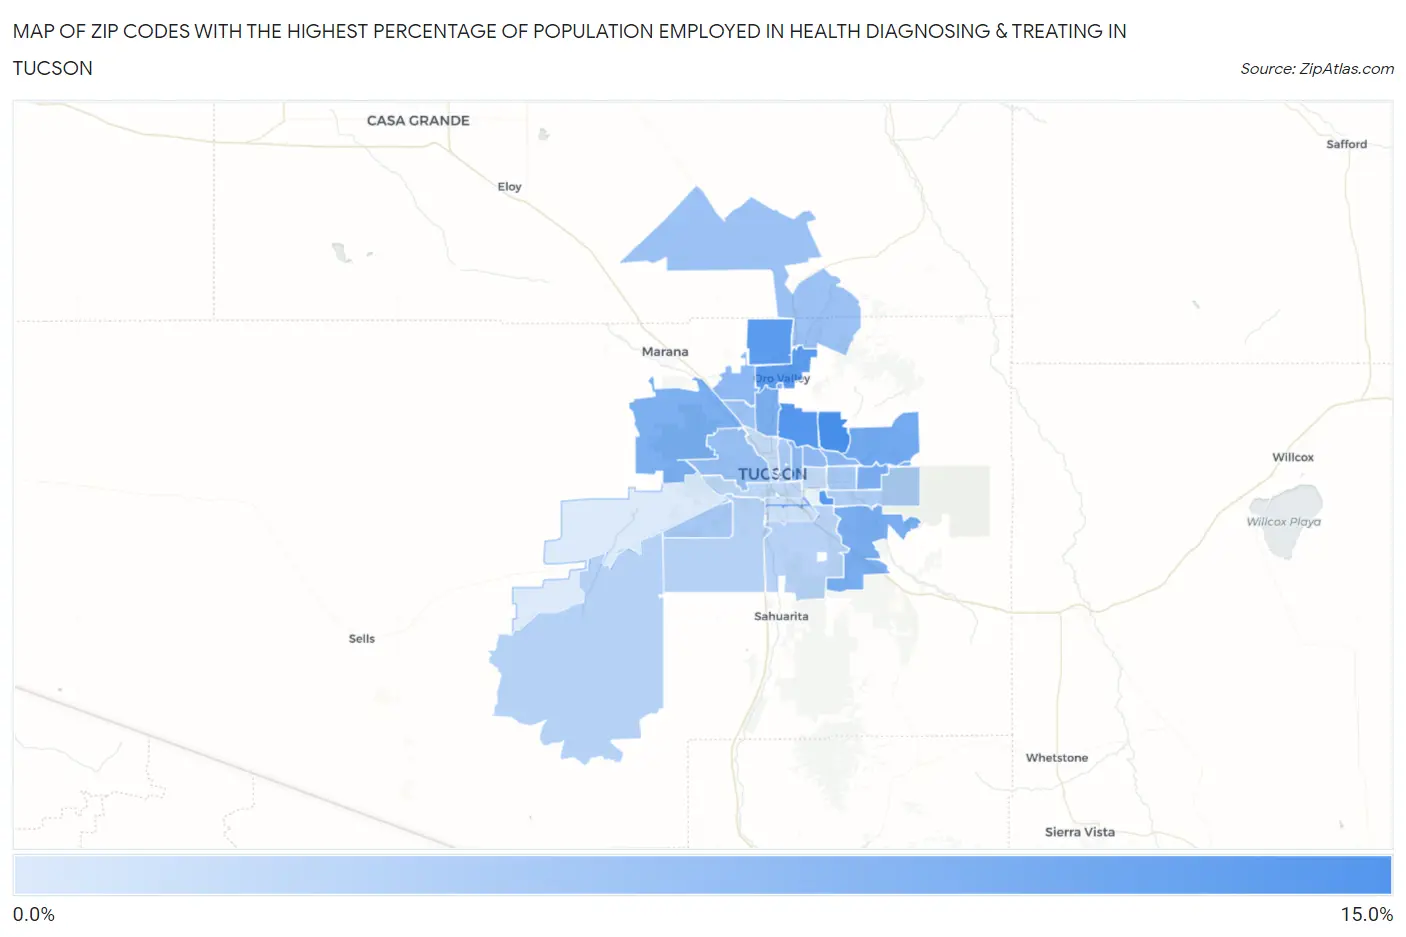
Map of Zip Codes with the Highest Percentage of Population Employed in Health Diagnosing & Treating in Tucson
1.2%
14.2%
Zip Codes with the Highest Percentage of Population Employed in Health Diagnosing & Treating in Tucson, AZ
| Zip Code | % Employed | vs State | vs National | |
| 1. | 85750 | 14.2% | 5.9%(+8.37)#10 | 6.2%(+8.00)#1,341 |
| 2. | 85718 | 12.9% | 5.9%(+7.02)#15 | 6.2%(+6.65)#1,779 |
| 3. | 85708 | 12.7% | 5.9%(+6.84)#16 | 6.2%(+6.47)#1,862 |
| 4. | 85755 | 12.6% | 5.9%(+6.77)#17 | 6.2%(+6.40)#1,890 |
| 5. | 85737 | 12.3% | 5.9%(+6.46)#20 | 6.2%(+6.09)#2,038 |
| 6. | 85749 | 10.3% | 5.9%(+4.40)#32 | 6.2%(+4.03)#3,560 |
| 7. | 85747 | 9.7% | 5.9%(+3.86)#37 | 6.2%(+3.50)#4,201 |
| 8. | 85748 | 9.6% | 5.9%(+3.74)#40 | 6.2%(+3.37)#4,372 |
| 9. | 85704 | 9.5% | 5.9%(+3.59)#44 | 6.2%(+3.22)#4,590 |
| 10. | 85743 | 9.5% | 5.9%(+3.58)#45 | 6.2%(+3.22)#4,597 |
| 11. | 85715 | 8.3% | 5.9%(+2.40)#71 | 6.2%(+2.04)#6,816 |
| 12. | 85716 | 8.3% | 5.9%(+2.40)#72 | 6.2%(+2.03)#6,828 |
| 13. | 85742 | 7.8% | 5.9%(+1.93)#82 | 6.2%(+1.57)#7,963 |
| 14. | 85712 | 7.6% | 5.9%(+1.75)#85 | 6.2%(+1.38)#8,433 |
| 15. | 85745 | 7.1% | 5.9%(+1.24)#105 | 6.2%(+0.881)#9,949 |
| 16. | 85741 | 6.8% | 5.9%(+0.898)#117 | 6.2%(+0.534)#11,064 |
| 17. | 85739 | 6.7% | 5.9%(+0.821)#122 | 6.2%(+0.457)#11,304 |
| 18. | 85757 | 5.8% | 5.9%(-0.042)#168 | 6.2%(-0.406)#14,459 |
| 19. | 85710 | 5.8% | 5.9%(-0.055)#170 | 6.2%(-0.419)#14,497 |
| 20. | 85719 | 5.4% | 5.9%(-0.439)#185 | 6.2%(-0.802)#16,002 |
| 21. | 85730 | 5.1% | 5.9%(-0.822)#199 | 6.2%(-1.19)#17,462 |
| 22. | 85736 | 4.5% | 5.9%(-1.37)#220 | 6.2%(-1.73)#19,596 |
| 23. | 85746 | 4.4% | 5.9%(-1.49)#228 | 6.2%(-1.85)#20,024 |
| 24. | 85756 | 4.2% | 5.9%(-1.68)#240 | 6.2%(-2.04)#20,710 |
| 25. | 85713 | 3.8% | 5.9%(-2.10)#250 | 6.2%(-2.46)#22,047 |
| 26. | 85711 | 3.3% | 5.9%(-2.55)#267 | 6.2%(-2.91)#23,389 |
| 27. | 85705 | 3.2% | 5.9%(-2.63)#269 | 6.2%(-3.00)#23,641 |
| 28. | 85714 | 2.8% | 5.9%(-3.12)#289 | 6.2%(-3.48)#24,905 |
| 29. | 85706 | 2.6% | 5.9%(-3.29)#296 | 6.2%(-3.65)#25,295 |
| 30. | 85701 | 2.1% | 5.9%(-3.77)#305 | 6.2%(-4.13)#26,261 |
| 31. | 85735 | 1.2% | 5.9%(-4.67)#334 | 6.2%(-5.04)#27,580 |
1
Common Questions
What are the Top 10 Zip Codes with the Highest Percentage of Population Employed in Health Diagnosing & Treating in Tucson, AZ?
Top 10 Zip Codes with the Highest Percentage of Population Employed in Health Diagnosing & Treating in Tucson, AZ are:
What zip code has the Highest Percentage of Population Employed in Health Diagnosing & Treating in Tucson, AZ?
85750 has the Highest Percentage of Population Employed in Health Diagnosing & Treating in Tucson, AZ with 14.2%.
What is the Percentage of Population Employed in Health Diagnosing & Treating in Tucson, AZ?
Percentage of Population Employed in Health Diagnosing & Treating in Tucson is 5.5%.
What is the Percentage of Population Employed in Health Diagnosing & Treating in Arizona?
Percentage of Population Employed in Health Diagnosing & Treating in Arizona is 5.9%.
What is the Percentage of Population Employed in Health Diagnosing & Treating in the United States?
Percentage of Population Employed in Health Diagnosing & Treating in the United States is 6.2%.