Round Rock, AZ Map & Demographics
Round Rock Map
Round Rock Overview
$14,939
PER CAPITA INCOME
$56,250
AVG FAMILY INCOME
$45,625
AVG HOUSEHOLD INCOME
6.1%
WAGE / INCOME GAP [ % ]
93.9¢/ $1
WAGE / INCOME GAP [ $ ]
0.45
INEQUALITY / GINI INDEX
590
TOTAL POPULATION
247
MALE POPULATION
343
FEMALE POPULATION
72.01
MALES / 100 FEMALES
138.87
FEMALES / 100 MALES
20.7
MEDIAN AGE
4.9
AVG FAMILY SIZE
4.3
AVG HOUSEHOLD SIZE
187
LABOR FORCE [ PEOPLE ]
48.6%
PERCENT IN LABOR FORCE
11.8%
UNEMPLOYMENT RATE
Round Rock Zip Codes
Round Rock Area Codes
Income in Round Rock
Income Overview in Round Rock
Per Capita Income in Round Rock is $14,939, while median incomes of families and households are $56,250 and $45,625 respectively.
| Characteristic | Number | Measure |
| Per Capita Income | 590 | $14,939 |
| Median Family Income | 117 | $56,250 |
| Mean Family Income | 117 | $65,127 |
| Median Household Income | 137 | $45,625 |
| Mean Household Income | 137 | $57,998 |
| Income Deficit | 117 | $0 |
| Wage / Income Gap (%) | 590 | 6.15% |
| Wage / Income Gap ($) | 590 | 93.85¢ per $1 |
| Gini / Inequality Index | 590 | 0.45 |
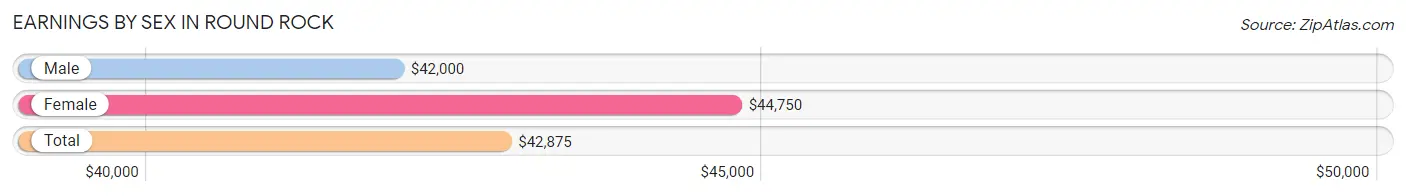
Earnings by Sex in Round Rock
Average Earnings in Round Rock are $42,875, $42,000 for men and $44,750 for women, a difference of 6.1%.
| Sex | Number | Average Earnings |
| Male | 76 (40.6%) | $42,000 |
| Female | 111 (59.4%) | $44,750 |
| Total | 187 (100.0%) | $42,875 |
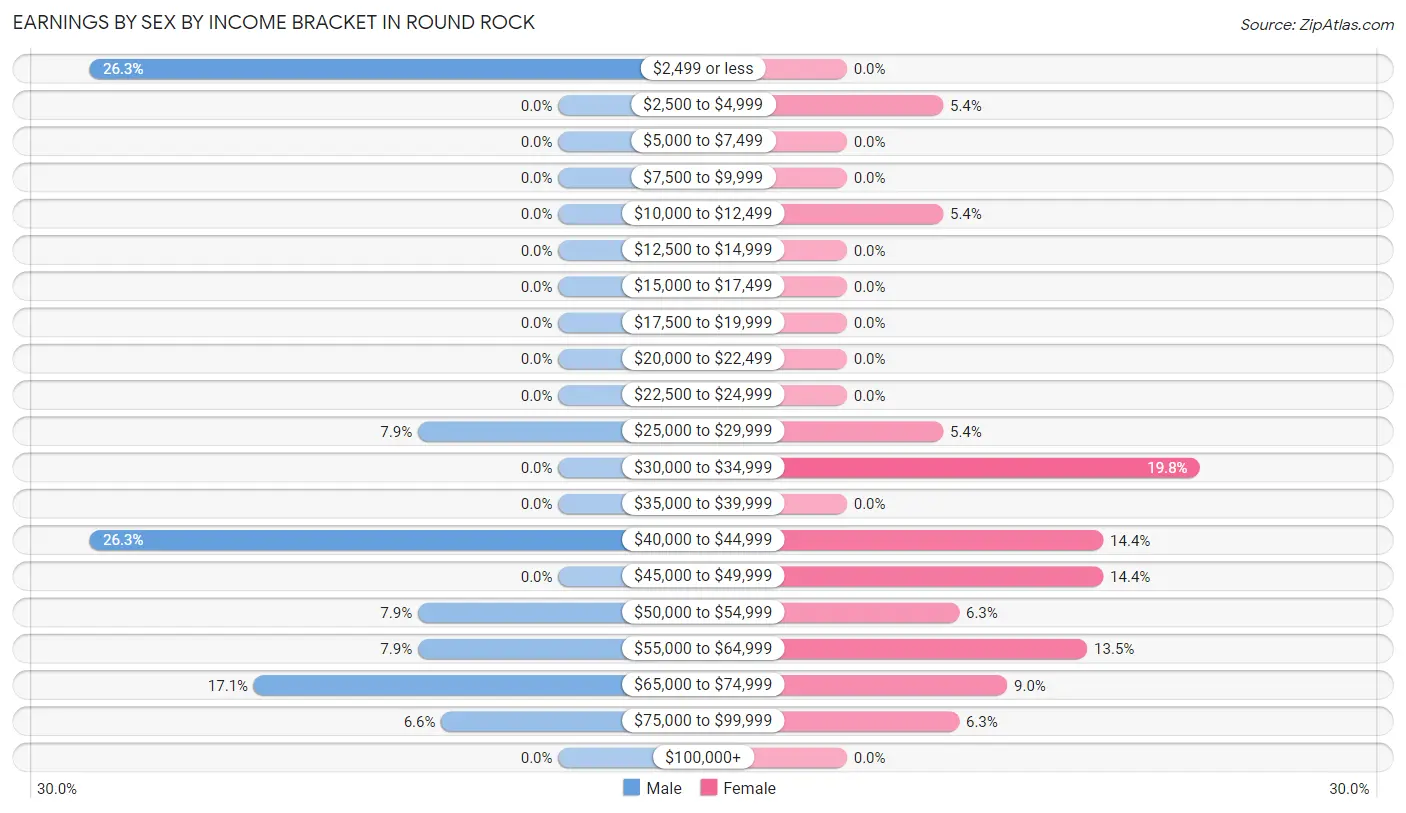
Earnings by Sex by Income Bracket in Round Rock
The most common earnings brackets in Round Rock are $2,499 or less for men (20 | 26.3%) and $30,000 to $34,999 for women (22 | 19.8%).
| Income | Male | Female |
| $2,499 or less | 20 (26.3%) | 0 (0.0%) |
| $2,500 to $4,999 | 0 (0.0%) | 6 (5.4%) |
| $5,000 to $7,499 | 0 (0.0%) | 0 (0.0%) |
| $7,500 to $9,999 | 0 (0.0%) | 0 (0.0%) |
| $10,000 to $12,499 | 0 (0.0%) | 6 (5.4%) |
| $12,500 to $14,999 | 0 (0.0%) | 0 (0.0%) |
| $15,000 to $17,499 | 0 (0.0%) | 0 (0.0%) |
| $17,500 to $19,999 | 0 (0.0%) | 0 (0.0%) |
| $20,000 to $22,499 | 0 (0.0%) | 0 (0.0%) |
| $22,500 to $24,999 | 0 (0.0%) | 0 (0.0%) |
| $25,000 to $29,999 | 6 (7.9%) | 6 (5.4%) |
| $30,000 to $34,999 | 0 (0.0%) | 22 (19.8%) |
| $35,000 to $39,999 | 0 (0.0%) | 0 (0.0%) |
| $40,000 to $44,999 | 20 (26.3%) | 16 (14.4%) |
| $45,000 to $49,999 | 0 (0.0%) | 16 (14.4%) |
| $50,000 to $54,999 | 6 (7.9%) | 7 (6.3%) |
| $55,000 to $64,999 | 6 (7.9%) | 15 (13.5%) |
| $65,000 to $74,999 | 13 (17.1%) | 10 (9.0%) |
| $75,000 to $99,999 | 5 (6.6%) | 7 (6.3%) |
| $100,000+ | 0 (0.0%) | 0 (0.0%) |
| Total | 76 (100.0%) | 111 (100.0%) |
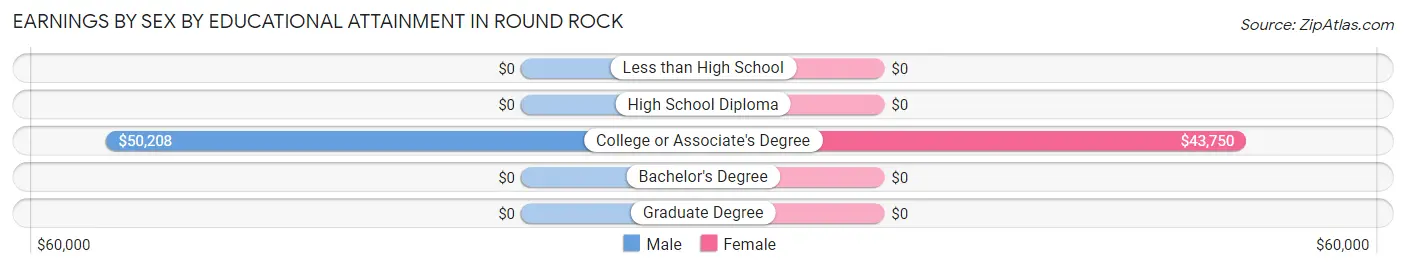
Earnings by Sex by Educational Attainment in Round Rock
Average earnings in Round Rock are $43,500 for men and $45,391 for women, a difference of 4.2%. Men with an educational attainment of college or associate's degree enjoy the highest average annual earnings of $50,208, while those with college or associate's degree education earn the least with $50,208. Women with an educational attainment of college or associate's degree earn the most with the average annual earnings of $43,750, while those with college or associate's degree education have the smallest earnings of $43,750.
| Educational Attainment | Male Income | Female Income |
| Less than High School | - | - |
| High School Diploma | - | - |
| College or Associate's Degree | $50,208 | $43,750 |
| Bachelor's Degree | - | - |
| Graduate Degree | - | - |
| Total | $43,500 | $45,391 |
Family Income in Round Rock
Family Income Brackets in Round Rock
According to the Round Rock family income data, there are 36 families falling into the $100,000 to $149,999 income range, which is the most common income bracket and makes up 30.8% of all families.
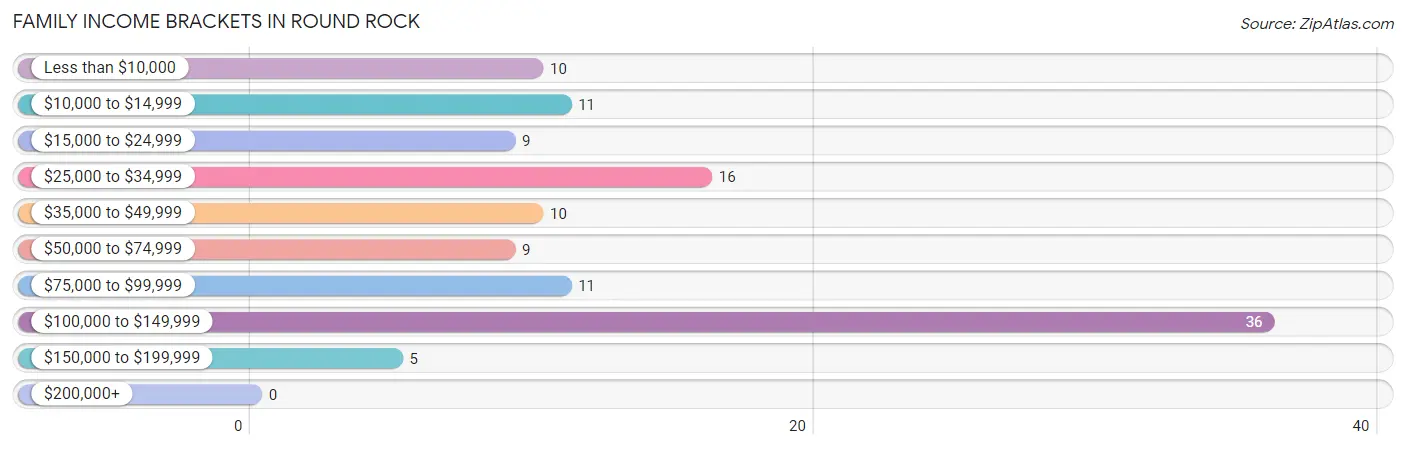
| Income Bracket | # Families | % Families |
| Less than $10,000 | 10 | 8.5% |
| $10,000 to $14,999 | 11 | 9.4% |
| $15,000 to $24,999 | 9 | 7.7% |
| $25,000 to $34,999 | 16 | 13.7% |
| $35,000 to $49,999 | 10 | 8.5% |
| $50,000 to $74,999 | 9 | 7.7% |
| $75,000 to $99,999 | 11 | 9.4% |
| $100,000 to $149,999 | 36 | 30.8% |
| $150,000 to $199,999 | 5 | 4.3% |
| $200,000+ | 0 | 0.0% |
Family Income by Famaliy Size in Round Rock
7+ person families (20 | 17.1%) account for the highest median family income in Round Rock with $112,500 per family, while 2-person families (61 | 52.1%) have the highest median income of $22,625 per family member.
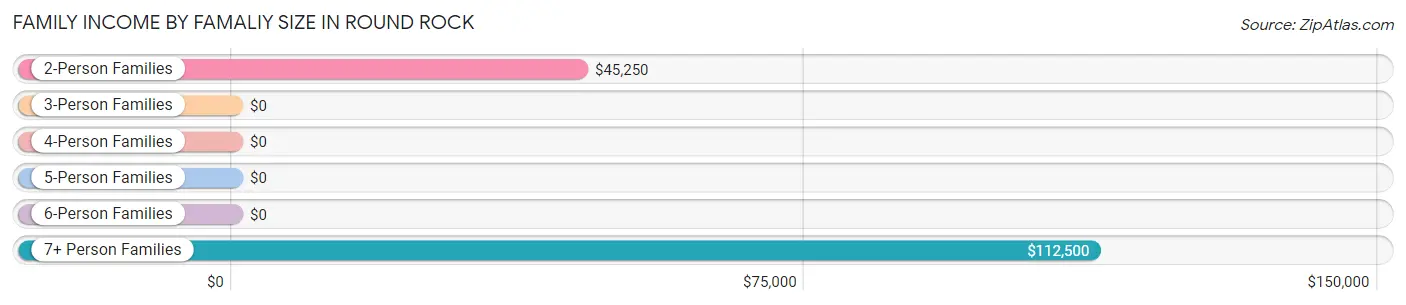
| Income Bracket | # Families | Median Income |
| 2-Person Families | 61 (52.1%) | $45,250 |
| 3-Person Families | 5 (4.3%) | $0 |
| 4-Person Families | 10 (8.6%) | $0 |
| 5-Person Families | 16 (13.7%) | $0 |
| 6-Person Families | 5 (4.3%) | $0 |
| 7+ Person Families | 20 (17.1%) | $112,500 |
| Total | 117 (100.0%) | $56,250 |
Family Income by Number of Earners in Round Rock
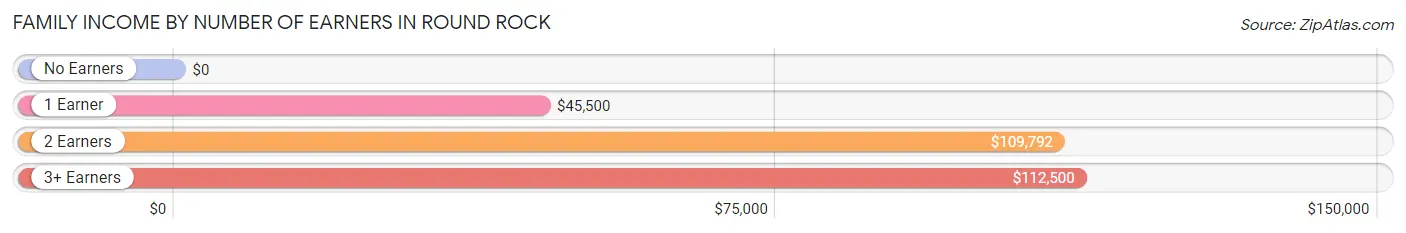
| Number of Earners | # Families | Median Income |
| No Earners | 28 (23.9%) | $0 |
| 1 Earner | 48 (41.0%) | $45,500 |
| 2 Earners | 21 (17.9%) | $109,792 |
| 3+ Earners | 20 (17.1%) | $112,500 |
| Total | 117 (100.0%) | $56,250 |
Household Income in Round Rock
Household Income Brackets in Round Rock
With 36 households falling in the category, the $100,000 to $149,999 income range is the most frequent in Round Rock, accounting for 26.3% of all households.
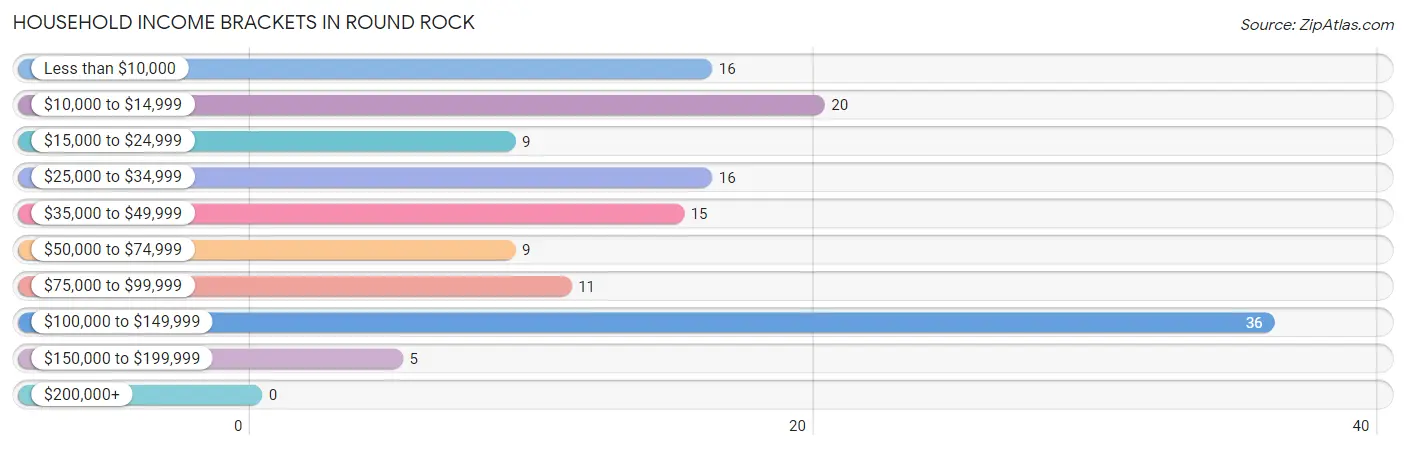
| Income Bracket | # Households | % Households |
| Less than $10,000 | 16 | 11.7% |
| $10,000 to $14,999 | 20 | 14.6% |
| $15,000 to $24,999 | 9 | 6.6% |
| $25,000 to $34,999 | 16 | 11.7% |
| $35,000 to $49,999 | 15 | 10.9% |
| $50,000 to $74,999 | 9 | 6.6% |
| $75,000 to $99,999 | 11 | 8.0% |
| $100,000 to $149,999 | 36 | 26.3% |
| $150,000 to $199,999 | 5 | 3.6% |
| $200,000+ | 0 | 0.0% |
Household Income by Householder Age in Round Rock
The median household income in Round Rock is $45,625, with the highest median household income of $45,250 found in the 65+ years age bracket for the primary householder. A total of 35 households (25.6%) fall into this category.
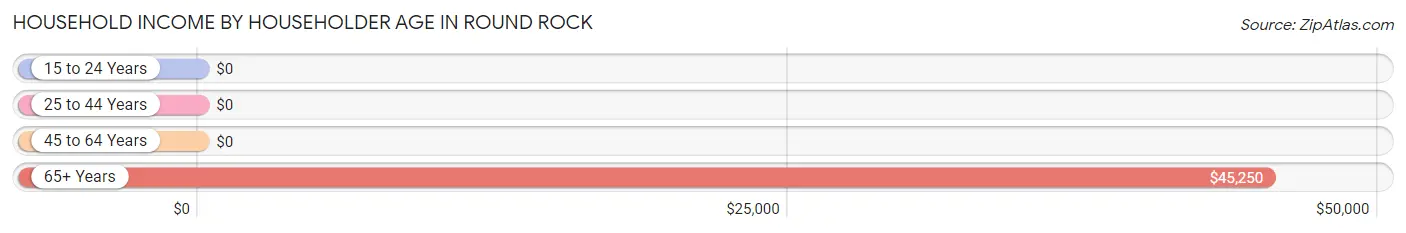
| Income Bracket | # Households | Median Income |
| 15 to 24 Years | 0 (0.0%) | $0 |
| 25 to 44 Years | 44 (32.1%) | $0 |
| 45 to 64 Years | 58 (42.3%) | $0 |
| 65+ Years | 35 (25.6%) | $45,250 |
| Total | 137 (100.0%) | $45,625 |
Poverty in Round Rock
Income Below Poverty by Sex and Age in Round Rock
With 13.8% poverty level for males and 34.1% for females among the residents of Round Rock, 18 to 24 year old males and 16 and 17 year old females are the most vulnerable to poverty, with 10 males (100.0%) and 24 females (80.0%) in their respective age groups living below the poverty level.
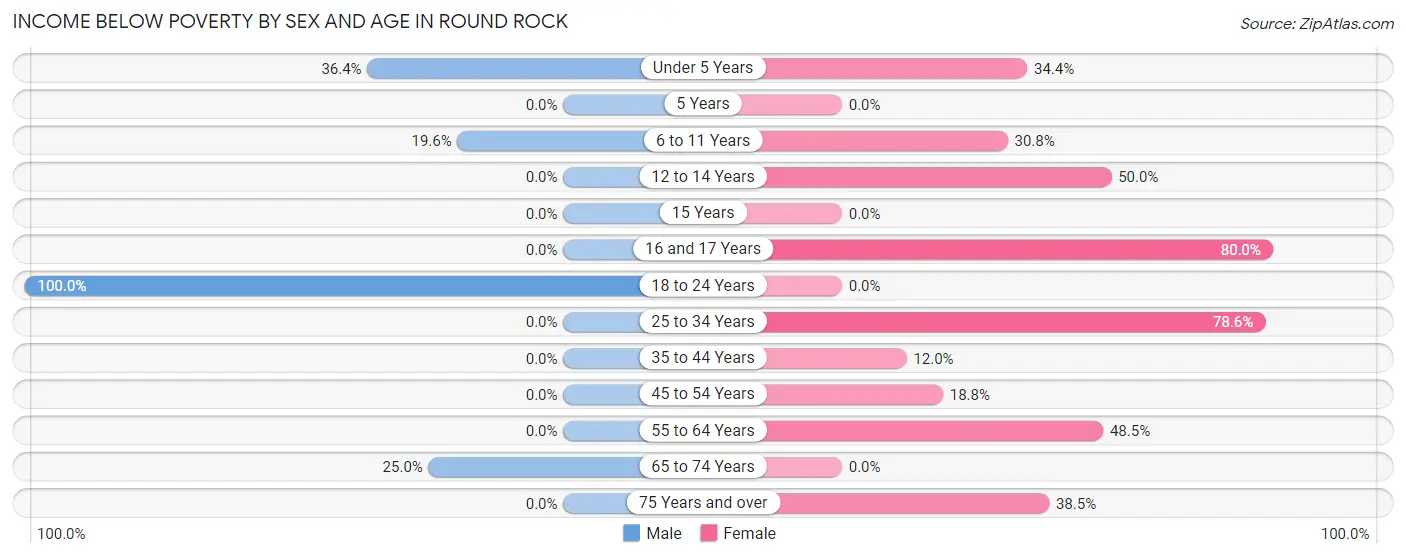
| Age Bracket | Male | Female |
| Under 5 Years | 8 (36.4%) | 11 (34.4%) |
| 5 Years | 0 (0.0%) | 0 (0.0%) |
| 6 to 11 Years | 11 (19.6%) | 8 (30.8%) |
| 12 to 14 Years | 0 (0.0%) | 19 (50.0%) |
| 15 Years | 0 (0.0%) | 0 (0.0%) |
| 16 and 17 Years | 0 (0.0%) | 24 (80.0%) |
| 18 to 24 Years | 10 (100.0%) | 0 (0.0%) |
| 25 to 34 Years | 0 (0.0%) | 22 (78.6%) |
| 35 to 44 Years | 0 (0.0%) | 6 (12.0%) |
| 45 to 54 Years | 0 (0.0%) | 6 (18.8%) |
| 55 to 64 Years | 0 (0.0%) | 16 (48.5%) |
| 65 to 74 Years | 5 (25.0%) | 0 (0.0%) |
| 75 Years and over | 0 (0.0%) | 5 (38.5%) |
| Total | 34 (13.8%) | 117 (34.1%) |
Income Above Poverty by Sex and Age in Round Rock
According to the poverty statistics in Round Rock, males aged 12 to 14 years and females aged 18 to 24 years are the age groups that are most secure financially, with 100.0% of males and 100.0% of females in these age groups living above the poverty line.
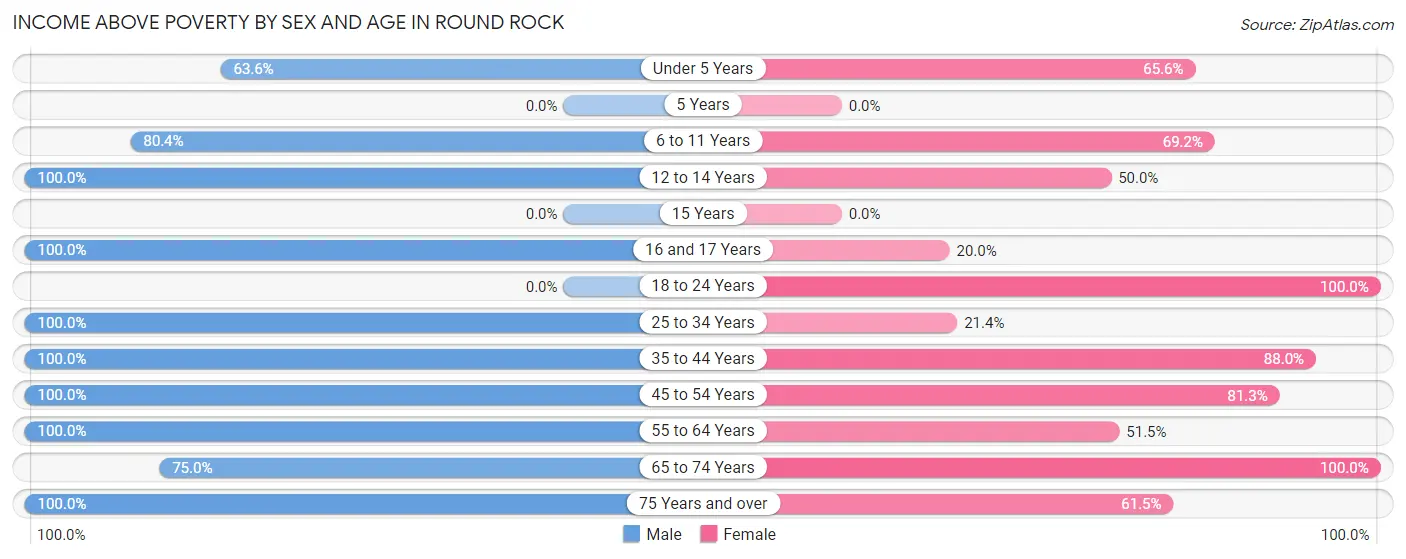
| Age Bracket | Male | Female |
| Under 5 Years | 14 (63.6%) | 21 (65.6%) |
| 5 Years | 0 (0.0%) | 0 (0.0%) |
| 6 to 11 Years | 45 (80.4%) | 18 (69.2%) |
| 12 to 14 Years | 31 (100.0%) | 19 (50.0%) |
| 15 Years | 0 (0.0%) | 0 (0.0%) |
| 16 and 17 Years | 17 (100.0%) | 6 (20.0%) |
| 18 to 24 Years | 0 (0.0%) | 53 (100.0%) |
| 25 to 34 Years | 18 (100.0%) | 6 (21.4%) |
| 35 to 44 Years | 18 (100.0%) | 44 (88.0%) |
| 45 to 54 Years | 37 (100.0%) | 26 (81.2%) |
| 55 to 64 Years | 11 (100.0%) | 17 (51.5%) |
| 65 to 74 Years | 15 (75.0%) | 8 (100.0%) |
| 75 Years and over | 7 (100.0%) | 8 (61.5%) |
| Total | 213 (86.2%) | 226 (65.9%) |
Income Below Poverty Among Married-Couple Families in Round Rock
The poverty statistics for married-couple families in Round Rock show that 11.6% or 5 of the total 43 families live below the poverty line. Families with no children have the highest poverty rate of 27.8%, comprising of 5 families. On the other hand, families with 1 or 2 children have the lowest poverty rate of 0.0%, which includes 0 families.
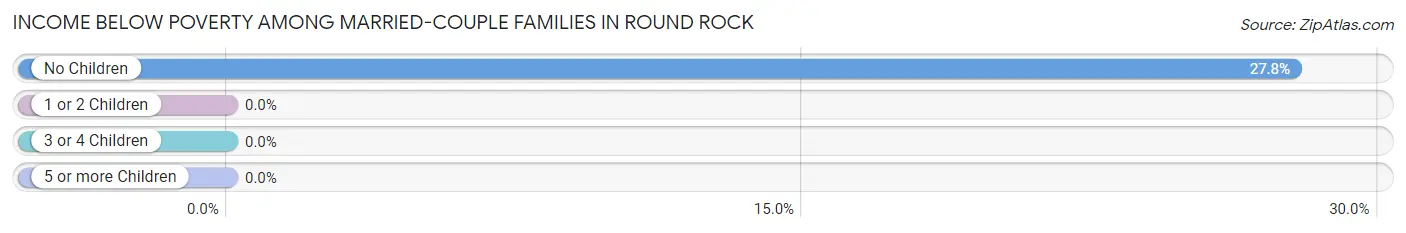
| Children | Above Poverty | Below Poverty |
| No Children | 13 (72.2%) | 5 (27.8%) |
| 1 or 2 Children | 10 (100.0%) | 0 (0.0%) |
| 3 or 4 Children | 0 (0.0%) | 0 (0.0%) |
| 5 or more Children | 15 (100.0%) | 0 (0.0%) |
| Total | 38 (88.4%) | 5 (11.6%) |
Income Below Poverty Among Single-Parent Households in Round Rock
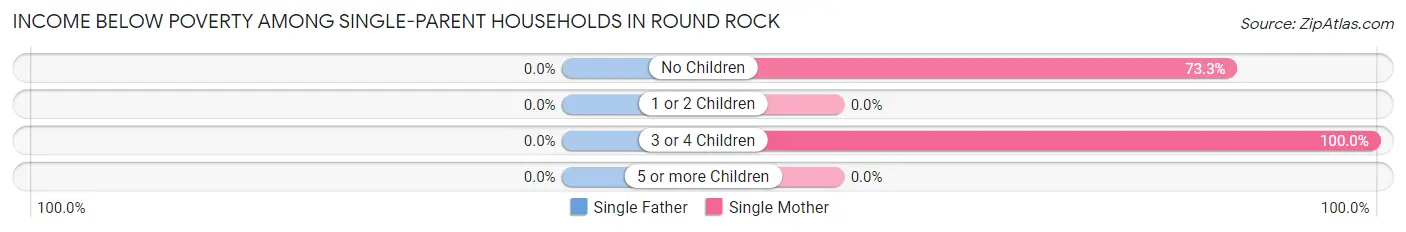
| Children | Single Father | Single Mother |
| No Children | 0 (0.0%) | 11 (73.3%) |
| 1 or 2 Children | 0 (0.0%) | 0 (0.0%) |
| 3 or 4 Children | 0 (0.0%) | 16 (100.0%) |
| 5 or more Children | 0 (0.0%) | 0 (0.0%) |
| Total | 0 (0.0%) | 27 (50.0%) |
Income Below Poverty Among Married-Couple vs Single-Parent Households in Round Rock
The poverty data for Round Rock shows that 5 of the married-couple family households (11.6%) and 27 of the single-parent households (36.5%) are living below the poverty level. Within the married-couple family households, those with no children have the highest poverty rate, with 5 households (27.8%) falling below the poverty line. Among the single-parent households, those with 3 or 4 children have the highest poverty rate, with 16 household (100.0%) living below poverty.
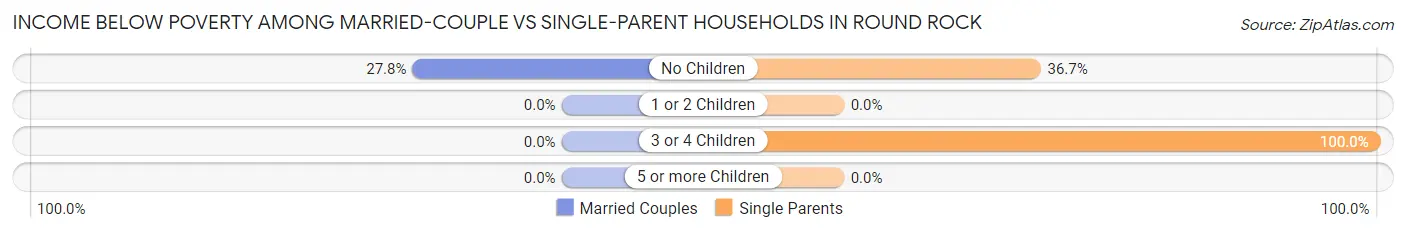
| Children | Married-Couple Families | Single-Parent Households |
| No Children | 5 (27.8%) | 11 (36.7%) |
| 1 or 2 Children | 0 (0.0%) | 0 (0.0%) |
| 3 or 4 Children | 0 (0.0%) | 16 (100.0%) |
| 5 or more Children | 0 (0.0%) | 0 (0.0%) |
| Total | 5 (11.6%) | 27 (36.5%) |
Race in Round Rock
The most populous races in Round Rock are Native / Alaskan (568 | 96.3%), Hispanic or Latino (22 | 3.7%), and Two or more Races (22 | 3.7%).
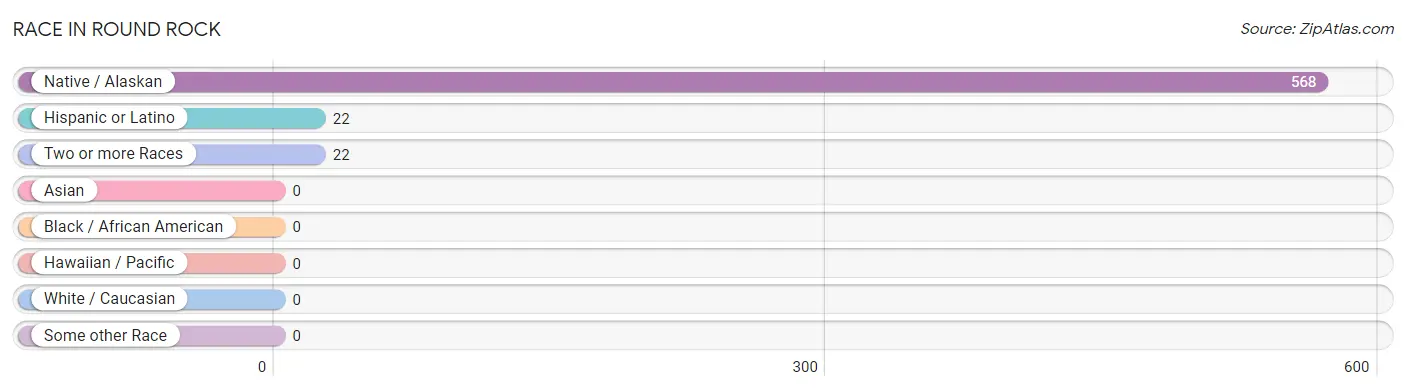
| Race | # Population | % Population |
| Asian | 0 | 0.0% |
| Black / African American | 0 | 0.0% |
| Hawaiian / Pacific | 0 | 0.0% |
| Hispanic or Latino | 22 | 3.7% |
| Native / Alaskan | 568 | 96.3% |
| White / Caucasian | 0 | 0.0% |
| Two or more Races | 22 | 3.7% |
| Some other Race | 0 | 0.0% |
| Total | 590 | 100.0% |
Ancestry in Round Rock
The most populous ancestries reported in Round Rock are Navajo (590 | 100.0%), and Mexican (22 | 3.7%), together accounting for 103.7% of all Round Rock residents.
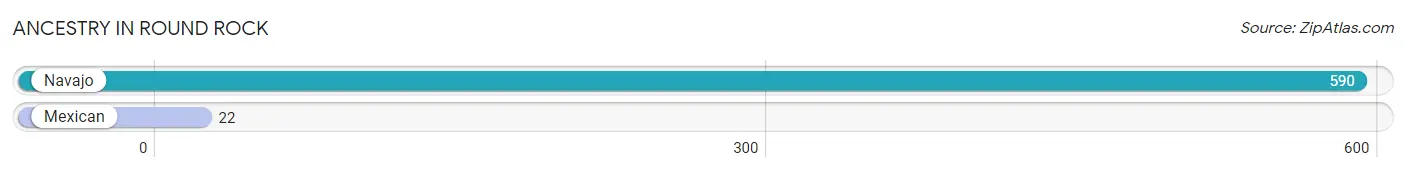
| Ancestry | # Population | % Population |
| Mexican | 22 | 3.7% |
| Navajo | 590 | 100.0% | View All 2 Rows |
Immigrants in Round Rock

| Immigration Origin | # Population | % Population | View All 0 Rows |
Sex and Age in Round Rock
Sex and Age in Round Rock
The most populous age groups in Round Rock are 10 to 14 Years (57 | 23.1%) for men and 15 to 19 Years (52 | 15.2%) for women.
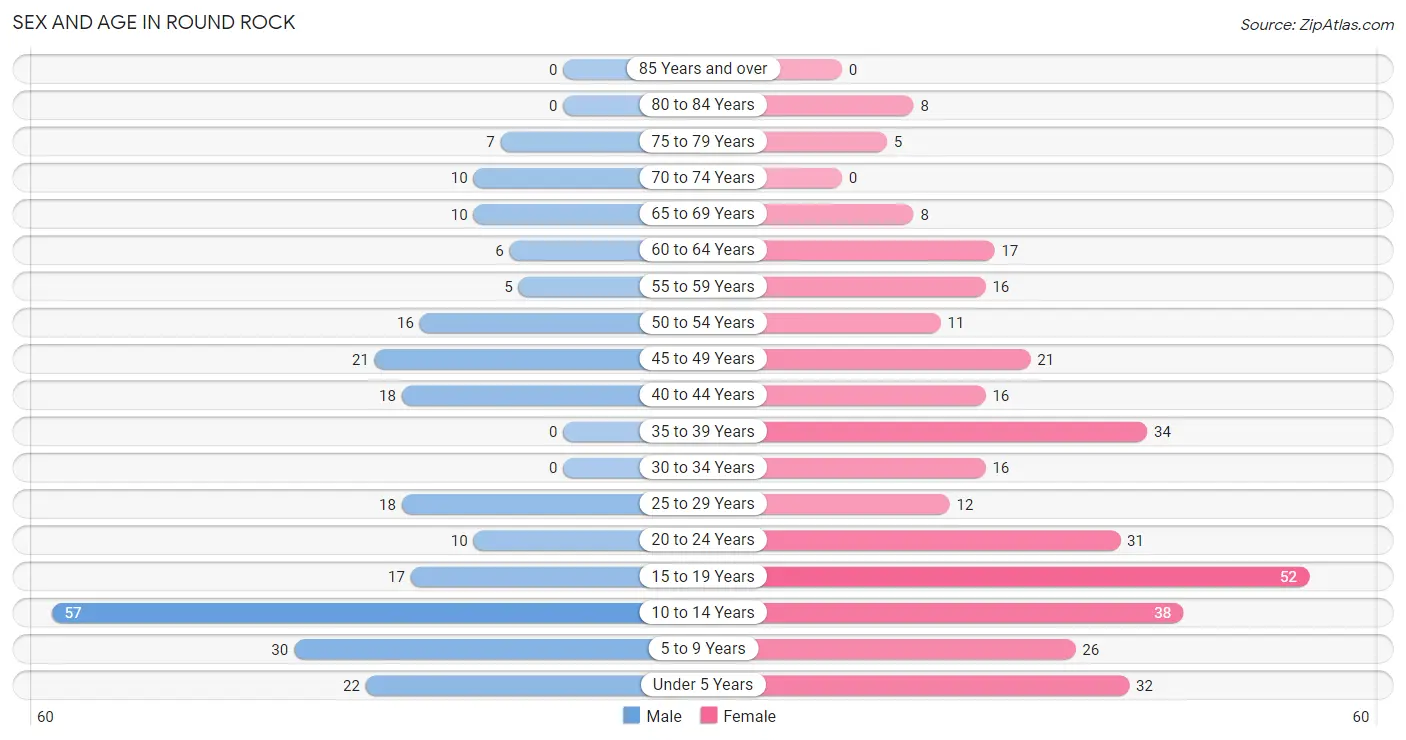
| Age Bracket | Male | Female |
| Under 5 Years | 22 (8.9%) | 32 (9.3%) |
| 5 to 9 Years | 30 (12.1%) | 26 (7.6%) |
| 10 to 14 Years | 57 (23.1%) | 38 (11.1%) |
| 15 to 19 Years | 17 (6.9%) | 52 (15.2%) |
| 20 to 24 Years | 10 (4.1%) | 31 (9.0%) |
| 25 to 29 Years | 18 (7.3%) | 12 (3.5%) |
| 30 to 34 Years | 0 (0.0%) | 16 (4.7%) |
| 35 to 39 Years | 0 (0.0%) | 34 (9.9%) |
| 40 to 44 Years | 18 (7.3%) | 16 (4.7%) |
| 45 to 49 Years | 21 (8.5%) | 21 (6.1%) |
| 50 to 54 Years | 16 (6.5%) | 11 (3.2%) |
| 55 to 59 Years | 5 (2.0%) | 16 (4.7%) |
| 60 to 64 Years | 6 (2.4%) | 17 (5.0%) |
| 65 to 69 Years | 10 (4.1%) | 8 (2.3%) |
| 70 to 74 Years | 10 (4.1%) | 0 (0.0%) |
| 75 to 79 Years | 7 (2.8%) | 5 (1.5%) |
| 80 to 84 Years | 0 (0.0%) | 8 (2.3%) |
| 85 Years and over | 0 (0.0%) | 0 (0.0%) |
| Total | 247 (100.0%) | 343 (100.0%) |
Families and Households in Round Rock
Median Family Size in Round Rock
The median family size in Round Rock is 4.87 persons per family, with single male/father families (20 | 17.1%) accounting for the largest median family size of 5.25 persons per family. On the other hand, single female/mother families (54 | 46.2%) represent the smallest median family size with 4.63 persons per family.
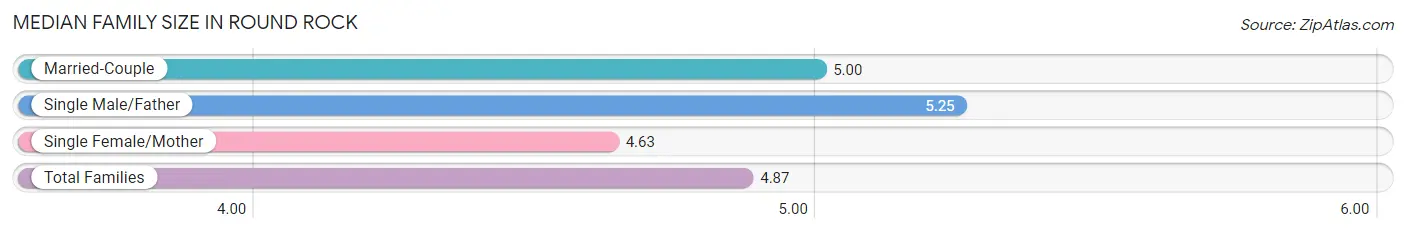
| Family Type | # Families | Family Size |
| Married-Couple | 43 (36.7%) | 5.00 |
| Single Male/Father | 20 (17.1%) | 5.25 |
| Single Female/Mother | 54 (46.2%) | 4.63 |
| Total Families | 117 (100.0%) | 4.87 |
Median Household Size in Round Rock
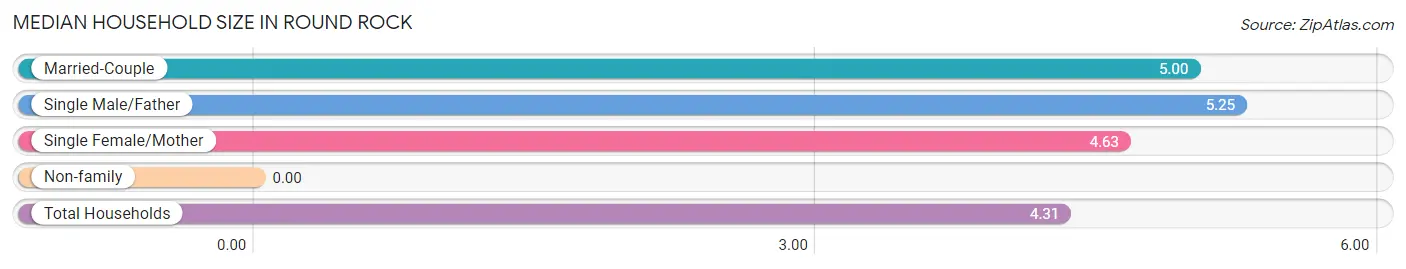
| Household Type | # Households | Household Size |
| Married-Couple | 43 (31.4%) | 5.00 |
| Single Male/Father | 20 (14.6%) | 5.25 |
| Single Female/Mother | 54 (39.4%) | 4.63 |
| Non-family | 20 (14.6%) | - |
| Total Households | 137 (100.0%) | 4.31 |
Household Size by Marriage Status in Round Rock
Out of a total of 137 households in Round Rock, 117 (85.4%) are family households, while 20 (14.6%) are nonfamily households. The most numerous type of family households are 2-person households, comprising 61, and the most common type of nonfamily households are 1-person households, comprising 20.
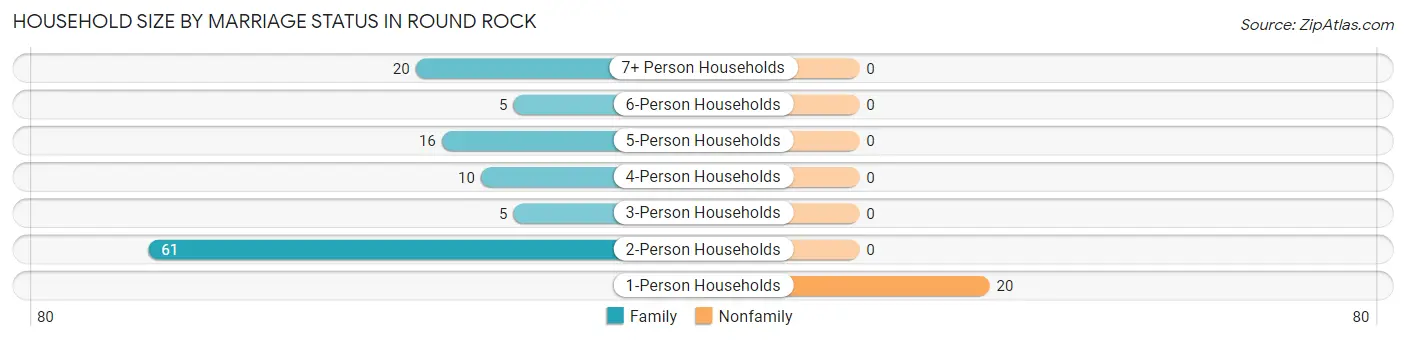
| Household Size | Family Households | Nonfamily Households |
| 1-Person Households | - | 20 (14.6%) |
| 2-Person Households | 61 (44.5%) | 0 (0.0%) |
| 3-Person Households | 5 (3.6%) | 0 (0.0%) |
| 4-Person Households | 10 (7.3%) | 0 (0.0%) |
| 5-Person Households | 16 (11.7%) | 0 (0.0%) |
| 6-Person Households | 5 (3.6%) | 0 (0.0%) |
| 7+ Person Households | 20 (14.6%) | 0 (0.0%) |
| Total | 117 (85.4%) | 20 (14.6%) |
Female Fertility in Round Rock
Fertility by Age in Round Rock
Average fertility rate in Round Rock is 53.0 births per 1,000 women. Women in the age bracket of 20 to 34 years have the highest fertility rate with 169.0 births per 1,000 women. Women in the age bracket of 20 to 34 years acount for 100.0% of all women with births.
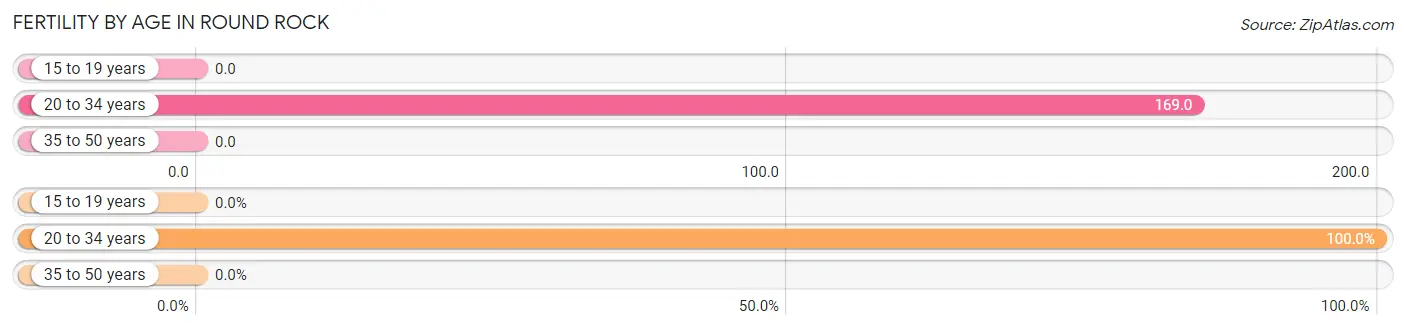
| Age Bracket | Women with Births | Births / 1,000 Women |
| 15 to 19 years | 0 (0.0%) | 0.0 |
| 20 to 34 years | 10 (100.0%) | 169.0 |
| 35 to 50 years | 0 (0.0%) | 0.0 |
| Total | 10 (100.0%) | 53.0 |
Fertility by Age by Marriage Status in Round Rock
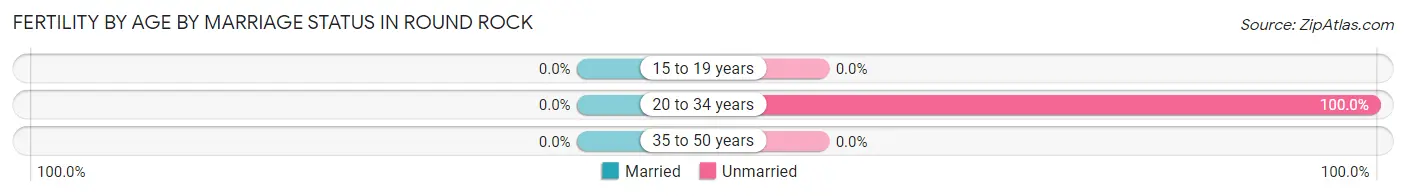
| Age Bracket | Married | Unmarried |
| 15 to 19 years | 0 (0.0%) | 0 (0.0%) |
| 20 to 34 years | 0 (0.0%) | 10 (100.0%) |
| 35 to 50 years | 0 (0.0%) | 0 (0.0%) |
| Total | 0 (0.0%) | 10 (100.0%) |
Fertility by Education in Round Rock
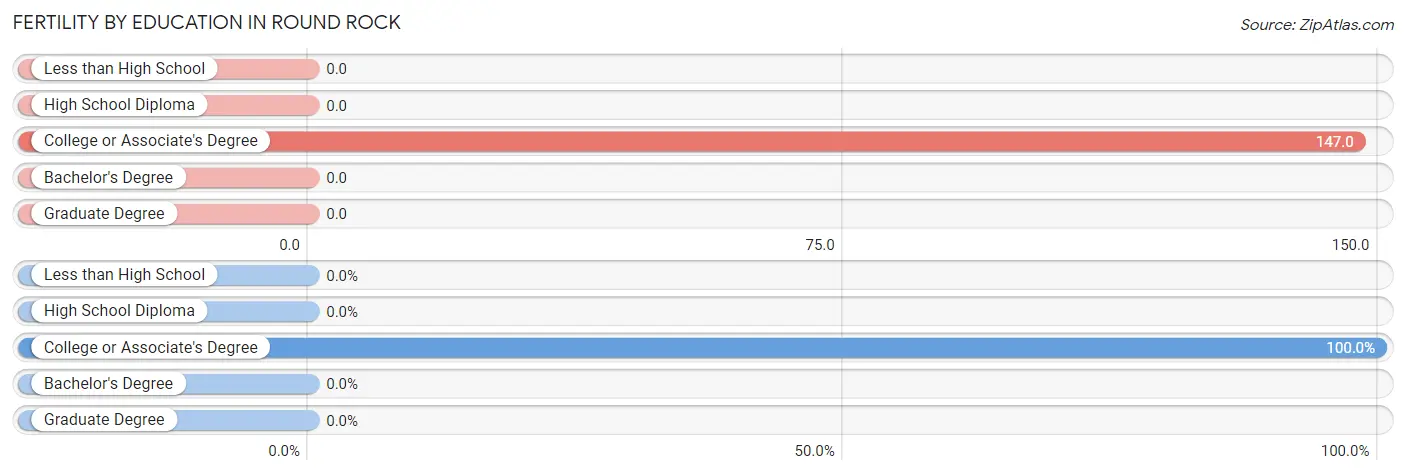
| Educational Attainment | Women with Births | Births / 1,000 Women |
| Less than High School | 0 (0.0%) | 0.0 |
| High School Diploma | 0 (0.0%) | 0.0 |
| College or Associate's Degree | 10 (100.0%) | 147.0 |
| Bachelor's Degree | 0 (0.0%) | 0.0 |
| Graduate Degree | 0 (0.0%) | 0.0 |
| Total | 10 (100.0%) | 53.0 |
Fertility by Education by Marriage Status in Round Rock
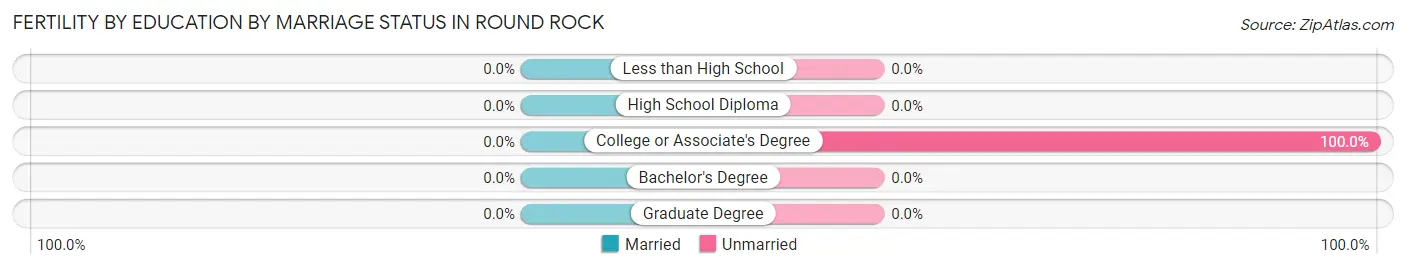
| Educational Attainment | Married | Unmarried |
| Less than High School | 0 (0.0%) | 0 (0.0%) |
| High School Diploma | 0 (0.0%) | 0 (0.0%) |
| College or Associate's Degree | 0 (0.0%) | 10 (100.0%) |
| Bachelor's Degree | 0 (0.0%) | 0 (0.0%) |
| Graduate Degree | 0 (0.0%) | 0 (0.0%) |
| Total | 0 (0.0%) | 10 (100.0%) |
Employment Characteristics in Round Rock
Employment by Class of Employer in Round Rock
Among the 165 employed individuals in Round Rock, local government employees (74 | 44.9%), federal government employees (45 | 27.3%), and private company employees (31 | 18.8%) make up the most common classes of employment.
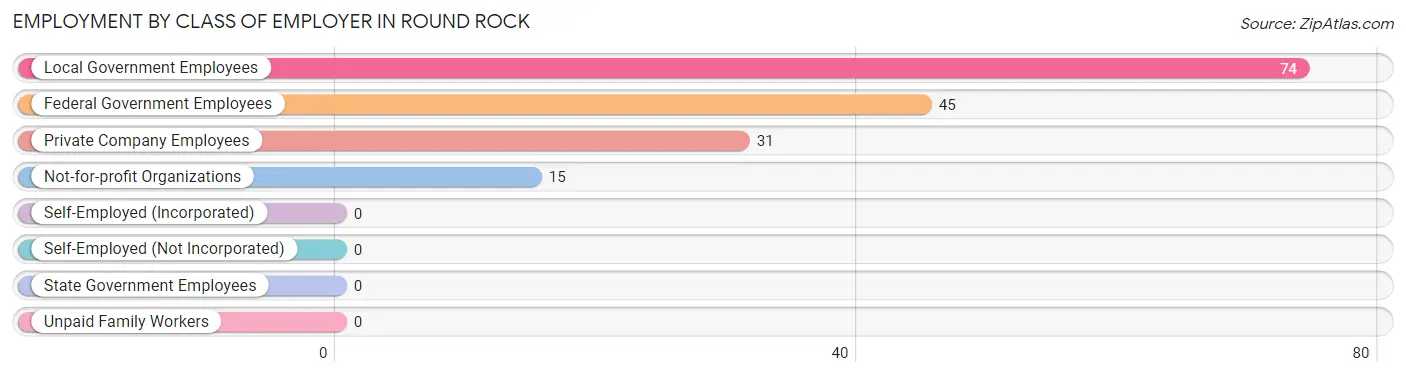
| Employer Class | # Employees | % Employees |
| Private Company Employees | 31 | 18.8% |
| Self-Employed (Incorporated) | 0 | 0.0% |
| Self-Employed (Not Incorporated) | 0 | 0.0% |
| Not-for-profit Organizations | 15 | 9.1% |
| Local Government Employees | 74 | 44.9% |
| State Government Employees | 0 | 0.0% |
| Federal Government Employees | 45 | 27.3% |
| Unpaid Family Workers | 0 | 0.0% |
| Total | 165 | 100.0% |
Employment Status by Age in Round Rock
According to the labor force statistics for Round Rock, out of the total population over 16 years of age (385), 48.6% or 187 individuals are in the labor force, with 11.8% or 22 of them unemployed. The age group with the highest labor force participation rate is 55 to 59 years, with 100.0% or 21 individuals in the labor force. Within the labor force, the 20 to 24 years age range has the highest percentage of unemployed individuals, with 100.0% or 10 of them being unemployed.
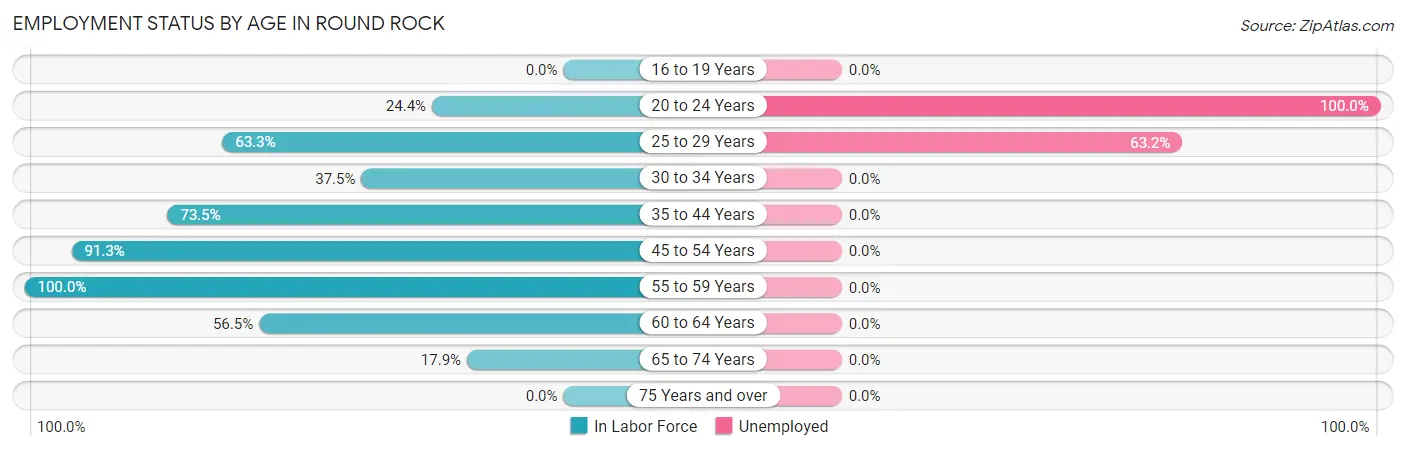
| Age Bracket | In Labor Force | Unemployed |
| 16 to 19 Years | 0 (0.0%) | 0 (0.0%) |
| 20 to 24 Years | 10 (24.4%) | 10 (100.0%) |
| 25 to 29 Years | 19 (63.3%) | 12 (63.2%) |
| 30 to 34 Years | 6 (37.5%) | 0 (0.0%) |
| 35 to 44 Years | 50 (73.5%) | 0 (0.0%) |
| 45 to 54 Years | 63 (91.3%) | 0 (0.0%) |
| 55 to 59 Years | 21 (100.0%) | 0 (0.0%) |
| 60 to 64 Years | 13 (56.5%) | 0 (0.0%) |
| 65 to 74 Years | 5 (17.9%) | 0 (0.0%) |
| 75 Years and over | 0 (0.0%) | 0 (0.0%) |
| Total | 187 (48.6%) | 22 (11.8%) |
Employment Status by Educational Attainment in Round Rock
According to labor force statistics for Round Rock, 75.8% of individuals (172) out of the total population between 25 and 64 years of age (227) are in the labor force, with 7.0% or 12 of them being unemployed. The group with the highest labor force participation rate are those with the educational attainment of bachelor's degree or higher, with 100.0% or 28 individuals in the labor force. Within the labor force, individuals with high school diploma education have the highest percentage of unemployment, with 23.5% or 12 of them being unemployed.
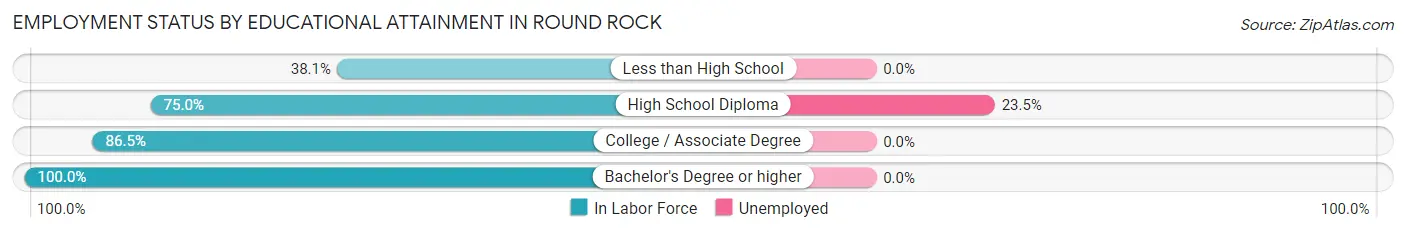
| Educational Attainment | In Labor Force | Unemployed |
| Less than High School | 16 (38.1%) | 0 (0.0%) |
| High School Diploma | 51 (75.0%) | 16 (23.5%) |
| College / Associate Degree | 77 (86.5%) | 0 (0.0%) |
| Bachelor's Degree or higher | 28 (100.0%) | 0 (0.0%) |
| Total | 172 (75.8%) | 16 (7.0%) |
Employment Occupations by Sex in Round Rock
Management, Business, Science and Arts Occupations
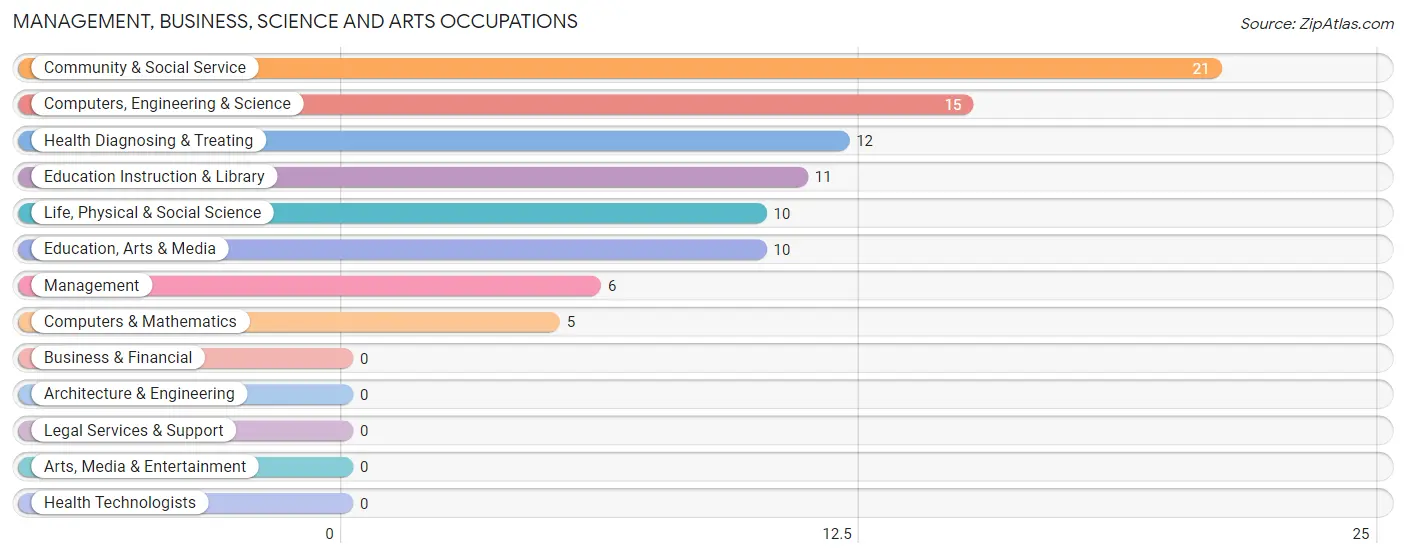
The most common Management, Business, Science and Arts occupations in Round Rock are Community & Social Service (21 | 12.7%), Computers, Engineering & Science (15 | 9.1%), Health Diagnosing & Treating (12 | 7.3%), Education Instruction & Library (11 | 6.7%), and Life, Physical & Social Science (10 | 6.1%).
Management, Business, Science and Arts Occupations by Sex
Within the Management, Business, Science and Arts occupations in Round Rock, the most male-oriented occupations are Management (100.0%), and Health Diagnosing & Treating (58.3%), while the most female-oriented occupations are Computers, Engineering & Science (100.0%), Computers & Mathematics (100.0%), and Life, Physical & Social Science (100.0%).
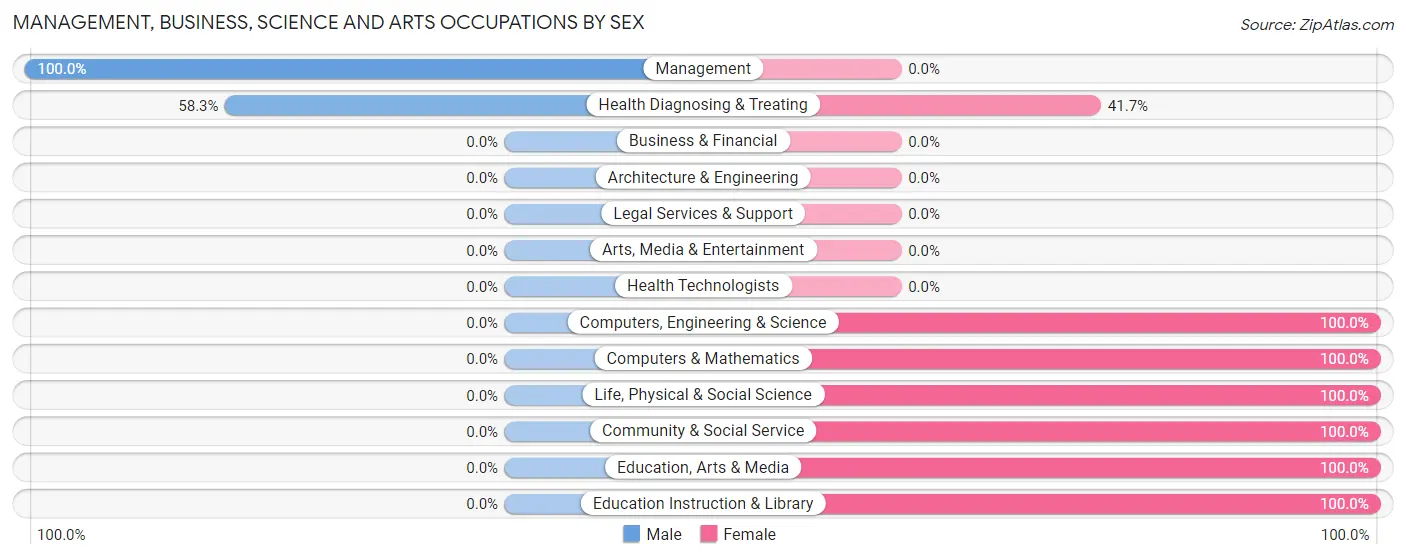
| Occupation | Male | Female |
| Management | 6 (100.0%) | 0 (0.0%) |
| Business & Financial | 0 (0.0%) | 0 (0.0%) |
| Computers, Engineering & Science | 0 (0.0%) | 15 (100.0%) |
| Computers & Mathematics | 0 (0.0%) | 5 (100.0%) |
| Architecture & Engineering | 0 (0.0%) | 0 (0.0%) |
| Life, Physical & Social Science | 0 (0.0%) | 10 (100.0%) |
| Community & Social Service | 0 (0.0%) | 21 (100.0%) |
| Education, Arts & Media | 0 (0.0%) | 10 (100.0%) |
| Legal Services & Support | 0 (0.0%) | 0 (0.0%) |
| Education Instruction & Library | 0 (0.0%) | 11 (100.0%) |
| Arts, Media & Entertainment | 0 (0.0%) | 0 (0.0%) |
| Health Diagnosing & Treating | 7 (58.3%) | 5 (41.7%) |
| Health Technologists | 0 (0.0%) | 0 (0.0%) |
| Total (Category) | 13 (24.1%) | 41 (75.9%) |
| Total (Overall) | 66 (40.0%) | 99 (60.0%) |
Services Occupations
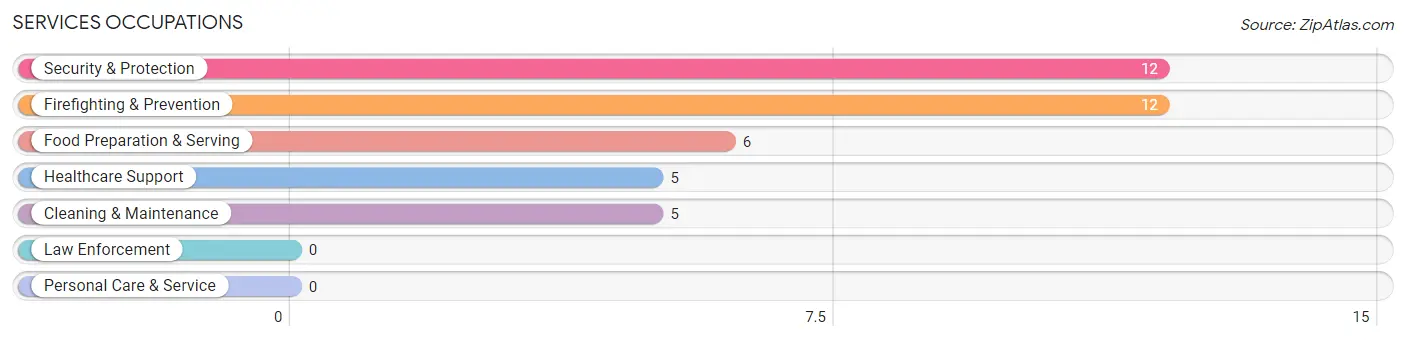
The most common Services occupations in Round Rock are Security & Protection (12 | 7.3%), Firefighting & Prevention (12 | 7.3%), Food Preparation & Serving (6 | 3.6%), Healthcare Support (5 | 3.0%), and Cleaning & Maintenance (5 | 3.0%).
Services Occupations by Sex
Within the Services occupations in Round Rock, the most male-oriented occupations are Cleaning & Maintenance (100.0%), Security & Protection (41.7%), and Firefighting & Prevention (41.7%), while the most female-oriented occupations are Healthcare Support (100.0%), Food Preparation & Serving (100.0%), and Security & Protection (58.3%).
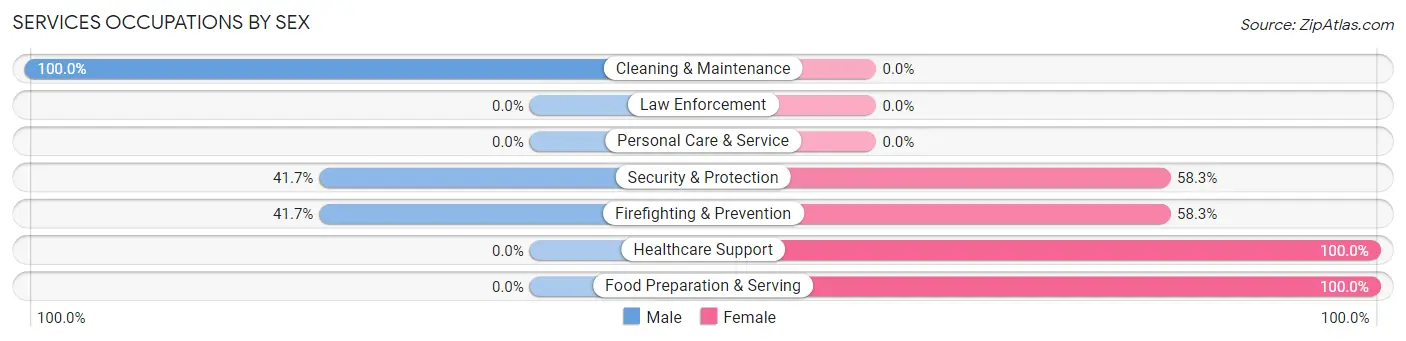
| Occupation | Male | Female |
| Healthcare Support | 0 (0.0%) | 5 (100.0%) |
| Security & Protection | 5 (41.7%) | 7 (58.3%) |
| Firefighting & Prevention | 5 (41.7%) | 7 (58.3%) |
| Law Enforcement | 0 (0.0%) | 0 (0.0%) |
| Food Preparation & Serving | 0 (0.0%) | 6 (100.0%) |
| Cleaning & Maintenance | 5 (100.0%) | 0 (0.0%) |
| Personal Care & Service | 0 (0.0%) | 0 (0.0%) |
| Total (Category) | 10 (35.7%) | 18 (64.3%) |
| Total (Overall) | 66 (40.0%) | 99 (60.0%) |
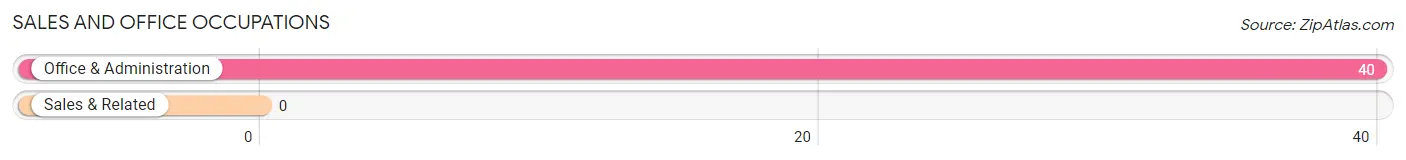
Sales and Office Occupations
The most common Sales and Office occupations in Round Rock are , and Office & Administration (40 | 24.2%).
Sales and Office Occupations by Sex
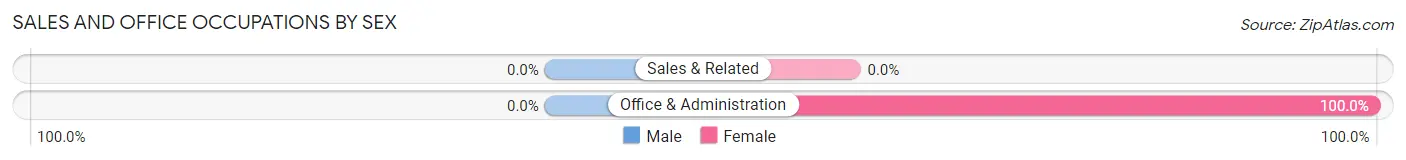
| Occupation | Male | Female |
| Sales & Related | 0 (0.0%) | 0 (0.0%) |
| Office & Administration | 0 (0.0%) | 40 (100.0%) |
| Total (Category) | 0 (0.0%) | 40 (100.0%) |
| Total (Overall) | 66 (40.0%) | 99 (60.0%) |
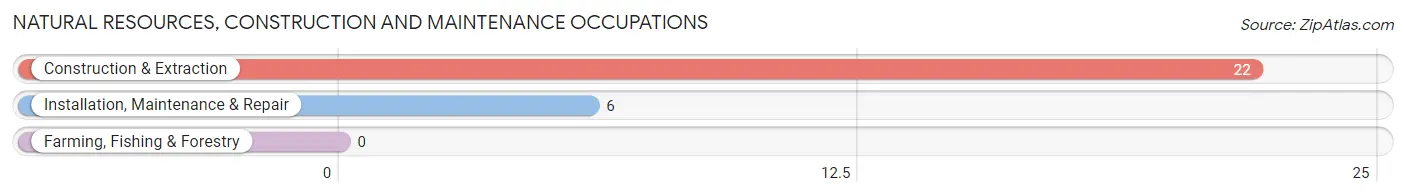
Natural Resources, Construction and Maintenance Occupations
The most common Natural Resources, Construction and Maintenance occupations in Round Rock are Construction & Extraction (22 | 13.3%), and Installation, Maintenance & Repair (6 | 3.6%).
Natural Resources, Construction and Maintenance Occupations by Sex
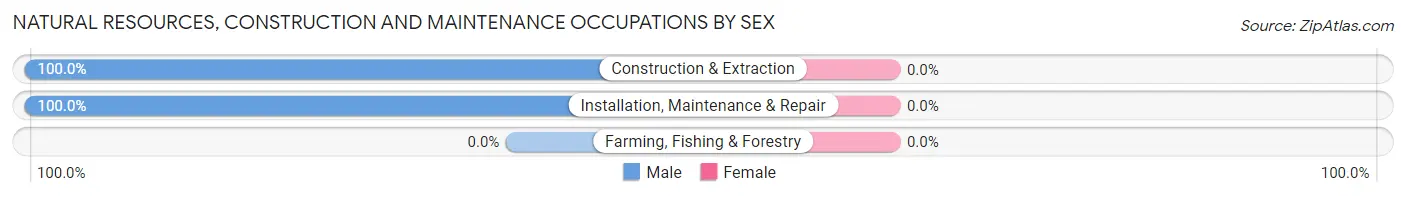
| Occupation | Male | Female |
| Farming, Fishing & Forestry | 0 (0.0%) | 0 (0.0%) |
| Construction & Extraction | 22 (100.0%) | 0 (0.0%) |
| Installation, Maintenance & Repair | 6 (100.0%) | 0 (0.0%) |
| Total (Category) | 28 (100.0%) | 0 (0.0%) |
| Total (Overall) | 66 (40.0%) | 99 (60.0%) |
Production, Transportation and Moving Occupations
The most common Production, Transportation and Moving occupations in Round Rock are Transportation (10 | 6.1%), and Material Moving (5 | 3.0%).
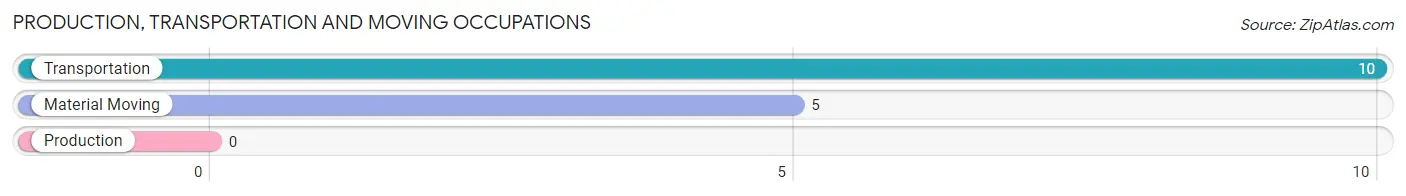
Production, Transportation and Moving Occupations by Sex
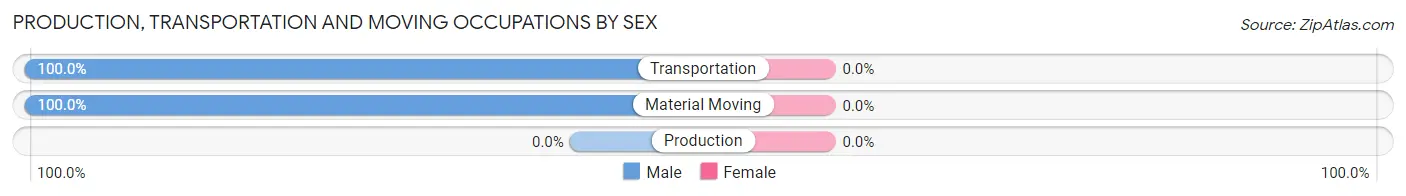
| Occupation | Male | Female |
| Production | 0 (0.0%) | 0 (0.0%) |
| Transportation | 10 (100.0%) | 0 (0.0%) |
| Material Moving | 5 (100.0%) | 0 (0.0%) |
| Total (Category) | 15 (100.0%) | 0 (0.0%) |
| Total (Overall) | 66 (40.0%) | 99 (60.0%) |
Employment Industries by Sex in Round Rock
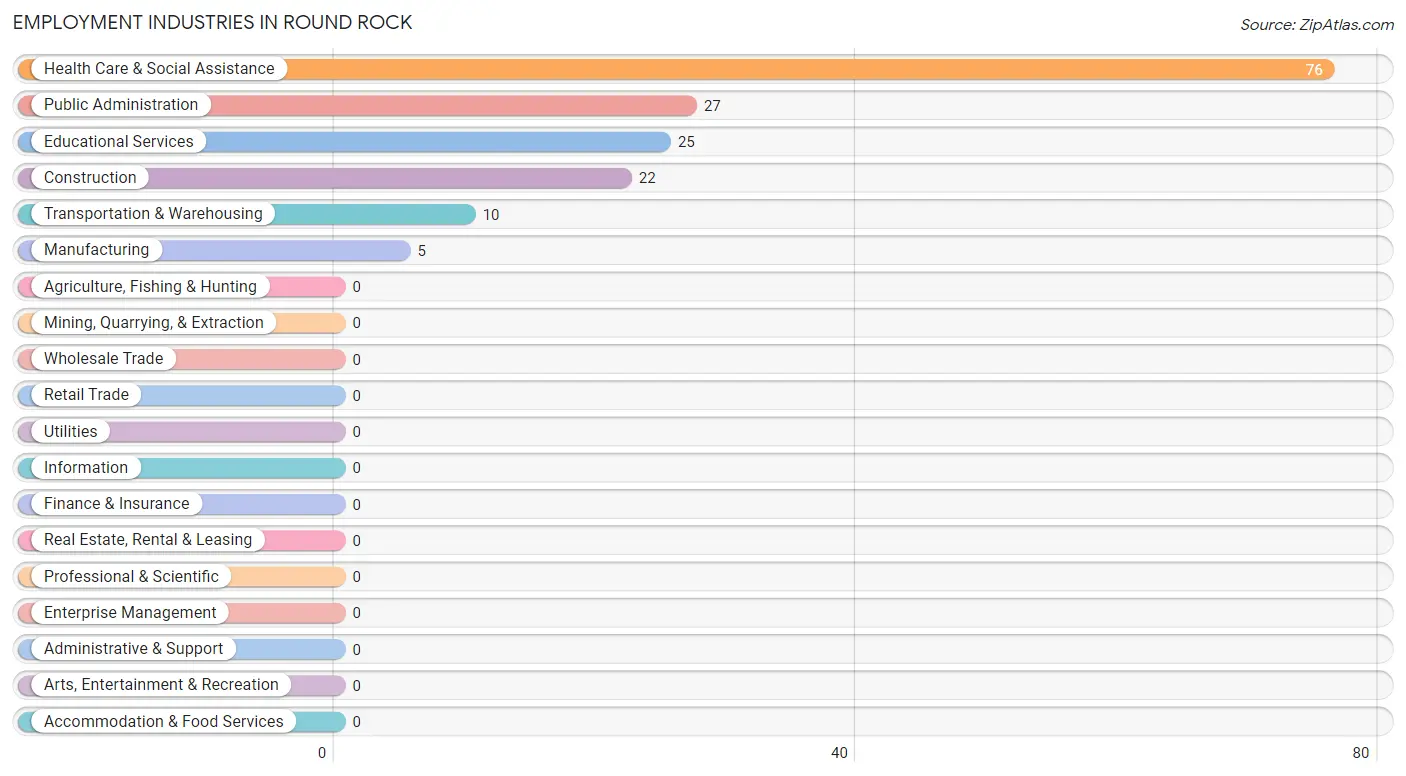
Employment Industries in Round Rock
The major employment industries in Round Rock include Health Care & Social Assistance (76 | 46.1%), Public Administration (27 | 16.4%), Educational Services (25 | 15.1%), Construction (22 | 13.3%), and Transportation & Warehousing (10 | 6.1%).
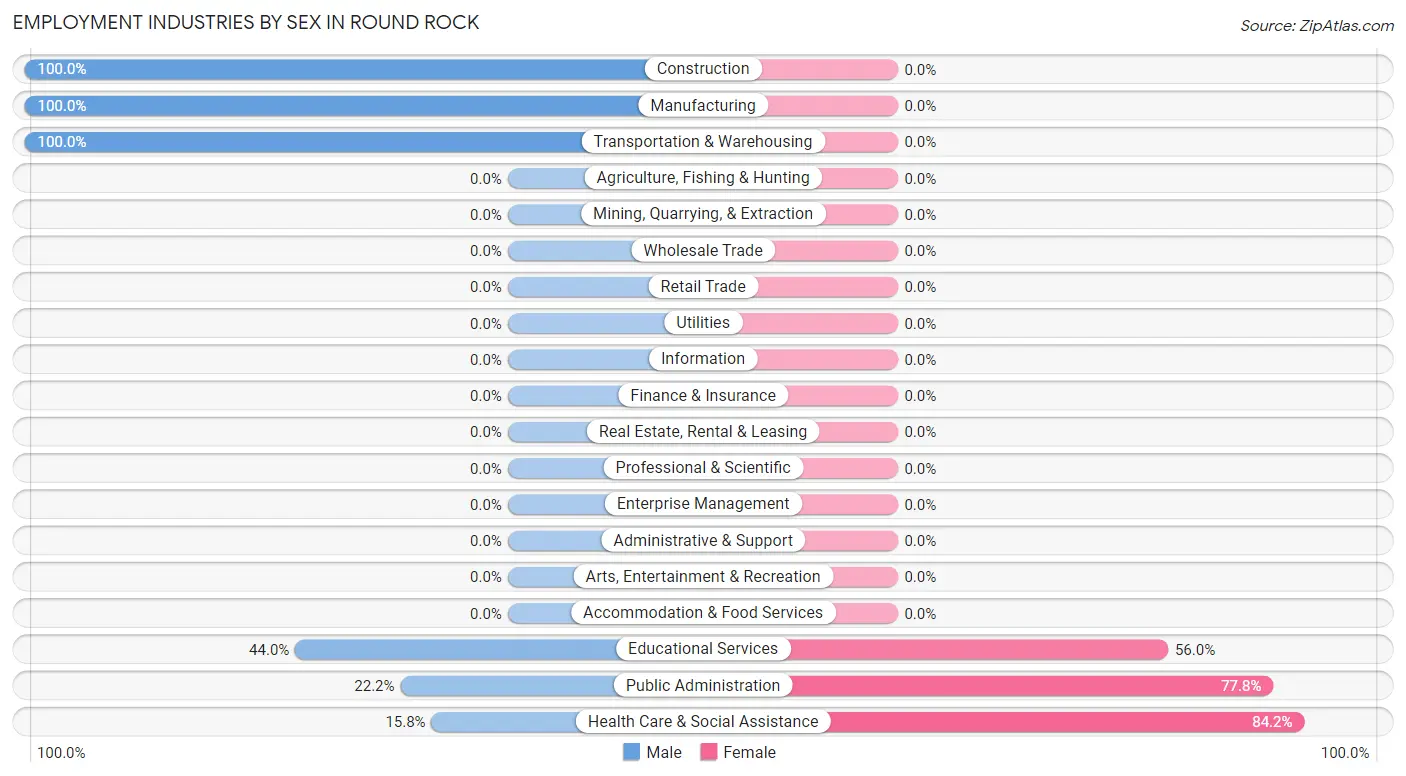
Employment Industries by Sex in Round Rock
The Round Rock industries that see more men than women are Construction (100.0%), Manufacturing (100.0%), and Transportation & Warehousing (100.0%), whereas the industries that tend to have a higher number of women are Health Care & Social Assistance (84.2%), Public Administration (77.8%), and Educational Services (56.0%).
| Industry | Male | Female |
| Agriculture, Fishing & Hunting | 0 (0.0%) | 0 (0.0%) |
| Mining, Quarrying, & Extraction | 0 (0.0%) | 0 (0.0%) |
| Construction | 22 (100.0%) | 0 (0.0%) |
| Manufacturing | 5 (100.0%) | 0 (0.0%) |
| Wholesale Trade | 0 (0.0%) | 0 (0.0%) |
| Retail Trade | 0 (0.0%) | 0 (0.0%) |
| Transportation & Warehousing | 10 (100.0%) | 0 (0.0%) |
| Utilities | 0 (0.0%) | 0 (0.0%) |
| Information | 0 (0.0%) | 0 (0.0%) |
| Finance & Insurance | 0 (0.0%) | 0 (0.0%) |
| Real Estate, Rental & Leasing | 0 (0.0%) | 0 (0.0%) |
| Professional & Scientific | 0 (0.0%) | 0 (0.0%) |
| Enterprise Management | 0 (0.0%) | 0 (0.0%) |
| Administrative & Support | 0 (0.0%) | 0 (0.0%) |
| Educational Services | 11 (44.0%) | 14 (56.0%) |
| Health Care & Social Assistance | 12 (15.8%) | 64 (84.2%) |
| Arts, Entertainment & Recreation | 0 (0.0%) | 0 (0.0%) |
| Accommodation & Food Services | 0 (0.0%) | 0 (0.0%) |
| Public Administration | 6 (22.2%) | 21 (77.8%) |
| Total | 66 (40.0%) | 99 (60.0%) |
Education in Round Rock
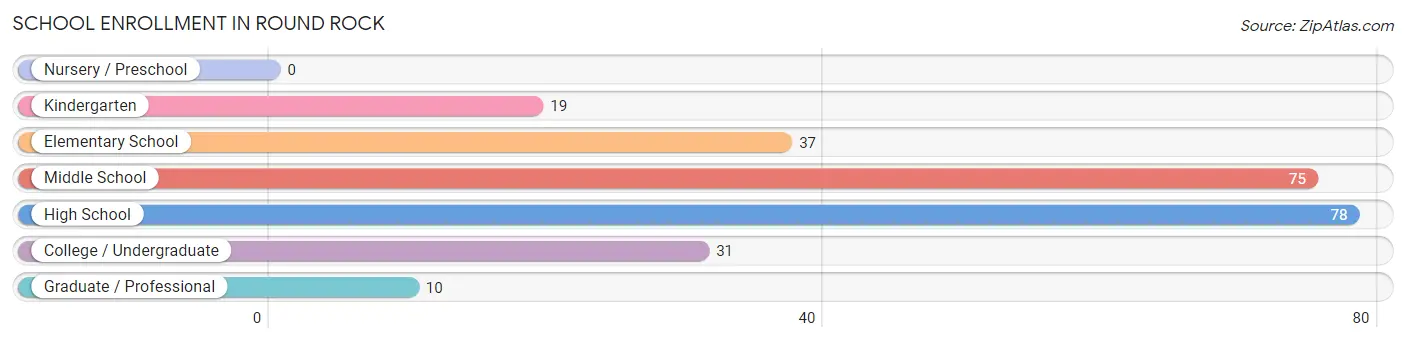
School Enrollment in Round Rock
The most common levels of schooling among the 250 students in Round Rock are high school (78 | 31.2%), middle school (75 | 30.0%), and elementary school (37 | 14.8%).
| School Level | # Students | % Students |
| Nursery / Preschool | 0 | 0.0% |
| Kindergarten | 19 | 7.6% |
| Elementary School | 37 | 14.8% |
| Middle School | 75 | 30.0% |
| High School | 78 | 31.2% |
| College / Undergraduate | 31 | 12.4% |
| Graduate / Professional | 10 | 4.0% |
| Total | 250 | 100.0% |
School Enrollment by Age by Funding Source in Round Rock
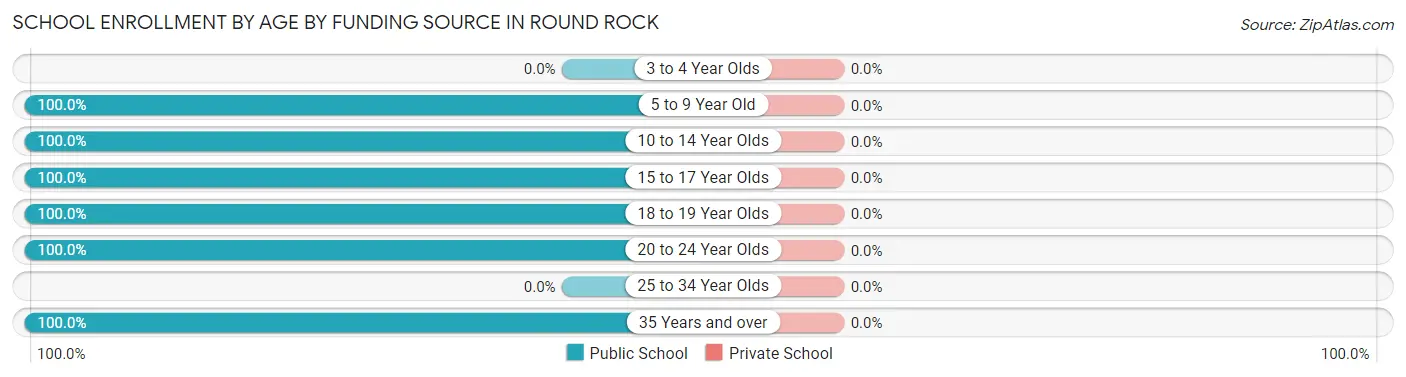
| Age Bracket | Public School | Private School |
| 3 to 4 Year Olds | 0 (0.0%) | 0 (0.0%) |
| 5 to 9 Year Old | 56 (100.0%) | 0 (0.0%) |
| 10 to 14 Year Olds | 95 (100.0%) | 0 (0.0%) |
| 15 to 17 Year Olds | 47 (100.0%) | 0 (0.0%) |
| 18 to 19 Year Olds | 11 (100.0%) | 0 (0.0%) |
| 20 to 24 Year Olds | 20 (100.0%) | 0 (0.0%) |
| 25 to 34 Year Olds | 0 (0.0%) | 0 (0.0%) |
| 35 Years and over | 21 (100.0%) | 0 (0.0%) |
| Total | 250 (100.0%) | 0 (0.0%) |
Educational Attainment by Field of Study in Round Rock
Social sciences (11 | 39.3%), arts & humanities (10 | 35.7%), and education (7 | 25.0%) are the most common fields of study among 28 individuals in Round Rock who have obtained a bachelor's degree or higher.
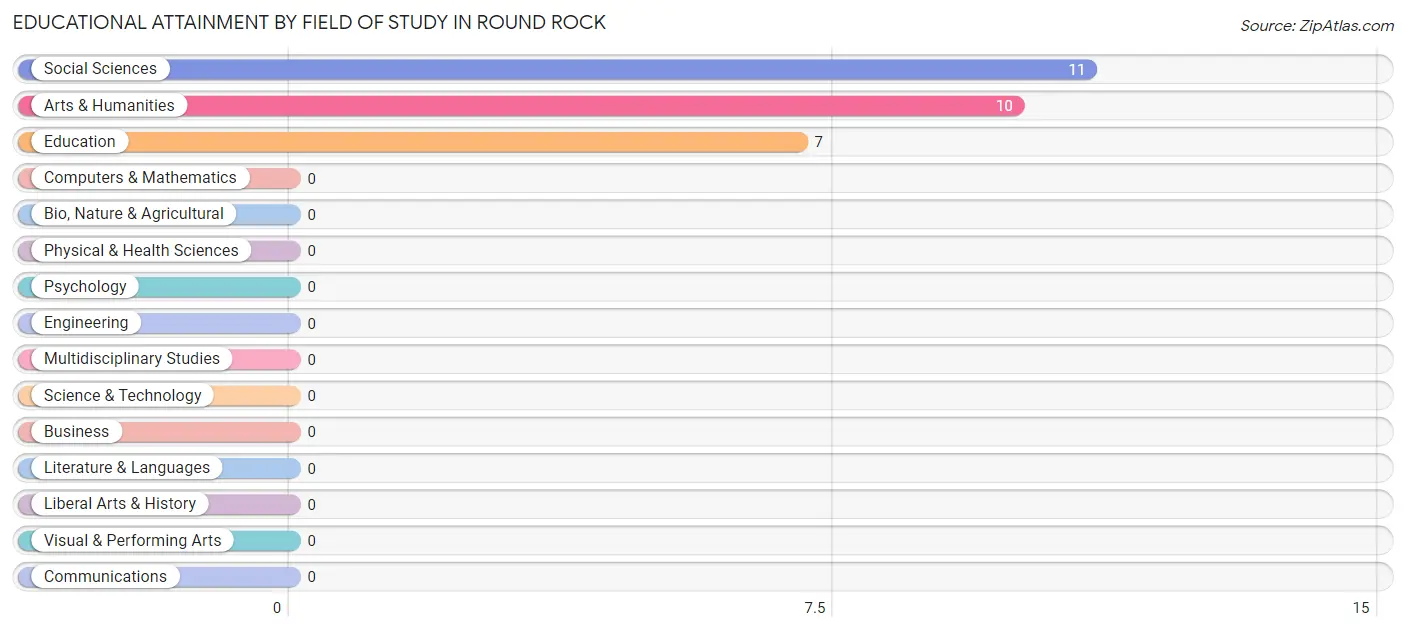
| Field of Study | # Graduates | % Graduates |
| Computers & Mathematics | 0 | 0.0% |
| Bio, Nature & Agricultural | 0 | 0.0% |
| Physical & Health Sciences | 0 | 0.0% |
| Psychology | 0 | 0.0% |
| Social Sciences | 11 | 39.3% |
| Engineering | 0 | 0.0% |
| Multidisciplinary Studies | 0 | 0.0% |
| Science & Technology | 0 | 0.0% |
| Business | 0 | 0.0% |
| Education | 7 | 25.0% |
| Literature & Languages | 0 | 0.0% |
| Liberal Arts & History | 0 | 0.0% |
| Visual & Performing Arts | 0 | 0.0% |
| Communications | 0 | 0.0% |
| Arts & Humanities | 10 | 35.7% |
| Total | 28 | 100.0% |
Transportation & Commute in Round Rock
Vehicle Availability by Sex in Round Rock
The most prevalent vehicle ownership categories in Round Rock are males with 3 vehicles (22, accounting for 33.3%) and females with 3 vehicles (27, making up 22.2%).
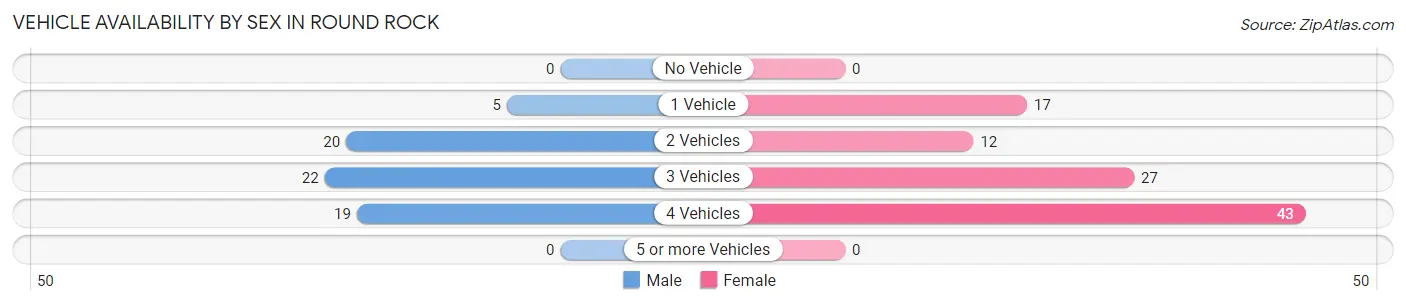
| Vehicles Available | Male | Female |
| No Vehicle | 0 (0.0%) | 0 (0.0%) |
| 1 Vehicle | 5 (7.6%) | 17 (17.2%) |
| 2 Vehicles | 20 (30.3%) | 12 (12.1%) |
| 3 Vehicles | 22 (33.3%) | 27 (27.3%) |
| 4 Vehicles | 19 (28.8%) | 43 (43.4%) |
| 5 or more Vehicles | 0 (0.0%) | 0 (0.0%) |
| Total | 66 (100.0%) | 99 (100.0%) |
Commute Time in Round Rock
The most frequently occuring commute durations in Round Rock are 30 to 34 minutes (44 commuters, 29.3%), 45 to 59 minutes (27 commuters, 18.0%), and 60 to 89 minutes (26 commuters, 17.3%).
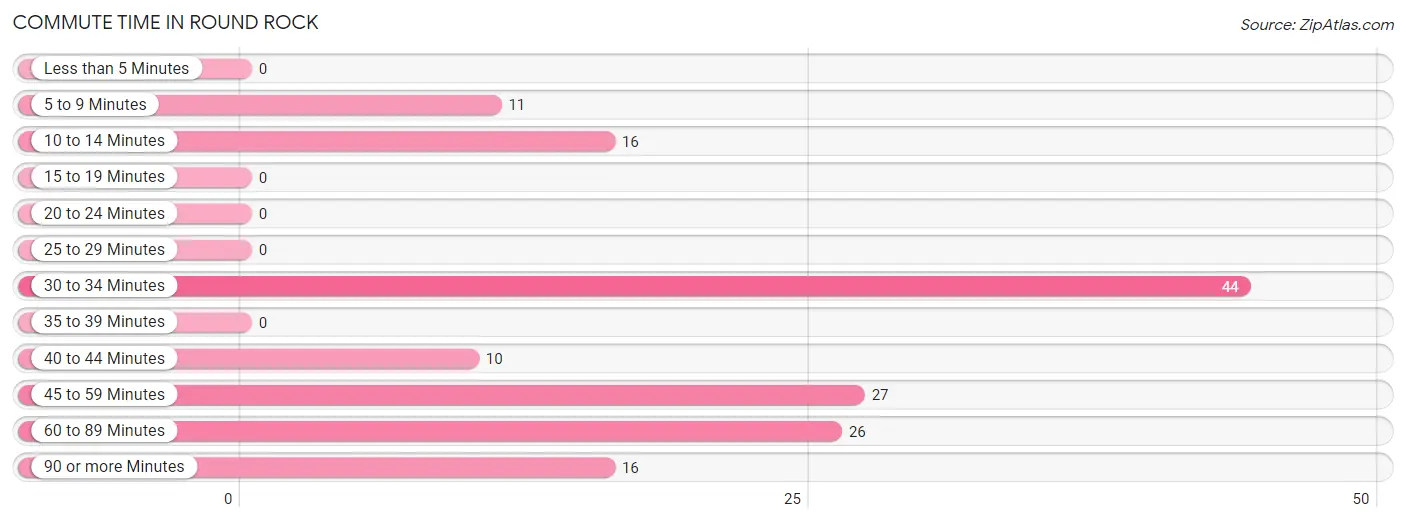
| Commute Time | # Commuters | % Commuters |
| Less than 5 Minutes | 0 | 0.0% |
| 5 to 9 Minutes | 11 | 7.3% |
| 10 to 14 Minutes | 16 | 10.7% |
| 15 to 19 Minutes | 0 | 0.0% |
| 20 to 24 Minutes | 0 | 0.0% |
| 25 to 29 Minutes | 0 | 0.0% |
| 30 to 34 Minutes | 44 | 29.3% |
| 35 to 39 Minutes | 0 | 0.0% |
| 40 to 44 Minutes | 10 | 6.7% |
| 45 to 59 Minutes | 27 | 18.0% |
| 60 to 89 Minutes | 26 | 17.3% |
| 90 or more Minutes | 16 | 10.7% |
Commute Time by Sex in Round Rock
The most common commute times in Round Rock are 30 to 34 minutes (22 commuters, 43.1%) for males and 30 to 34 minutes (22 commuters, 22.2%) for females.
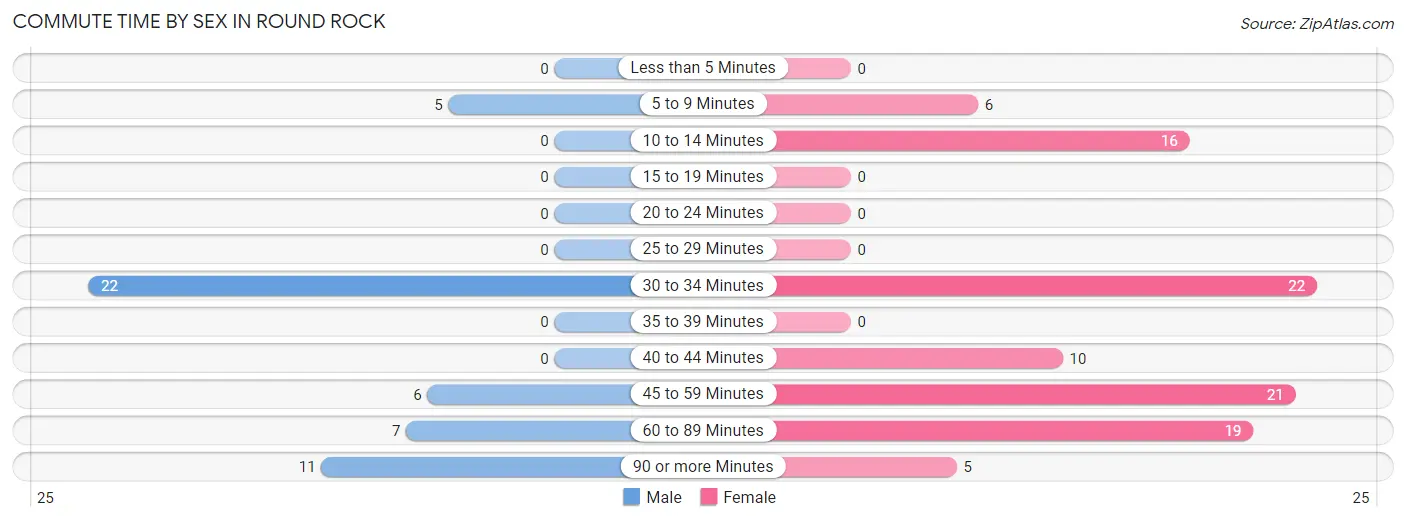
| Commute Time | Male | Female |
| Less than 5 Minutes | 0 (0.0%) | 0 (0.0%) |
| 5 to 9 Minutes | 5 (9.8%) | 6 (6.1%) |
| 10 to 14 Minutes | 0 (0.0%) | 16 (16.2%) |
| 15 to 19 Minutes | 0 (0.0%) | 0 (0.0%) |
| 20 to 24 Minutes | 0 (0.0%) | 0 (0.0%) |
| 25 to 29 Minutes | 0 (0.0%) | 0 (0.0%) |
| 30 to 34 Minutes | 22 (43.1%) | 22 (22.2%) |
| 35 to 39 Minutes | 0 (0.0%) | 0 (0.0%) |
| 40 to 44 Minutes | 0 (0.0%) | 10 (10.1%) |
| 45 to 59 Minutes | 6 (11.8%) | 21 (21.2%) |
| 60 to 89 Minutes | 7 (13.7%) | 19 (19.2%) |
| 90 or more Minutes | 11 (21.6%) | 5 (5.1%) |
Time of Departure to Work by Sex in Round Rock
The most frequent times of departure to work in Round Rock are 7:30 AM to 7:59 AM (21, 41.2%) for males and 7:30 AM to 7:59 AM (35, 35.3%) for females.
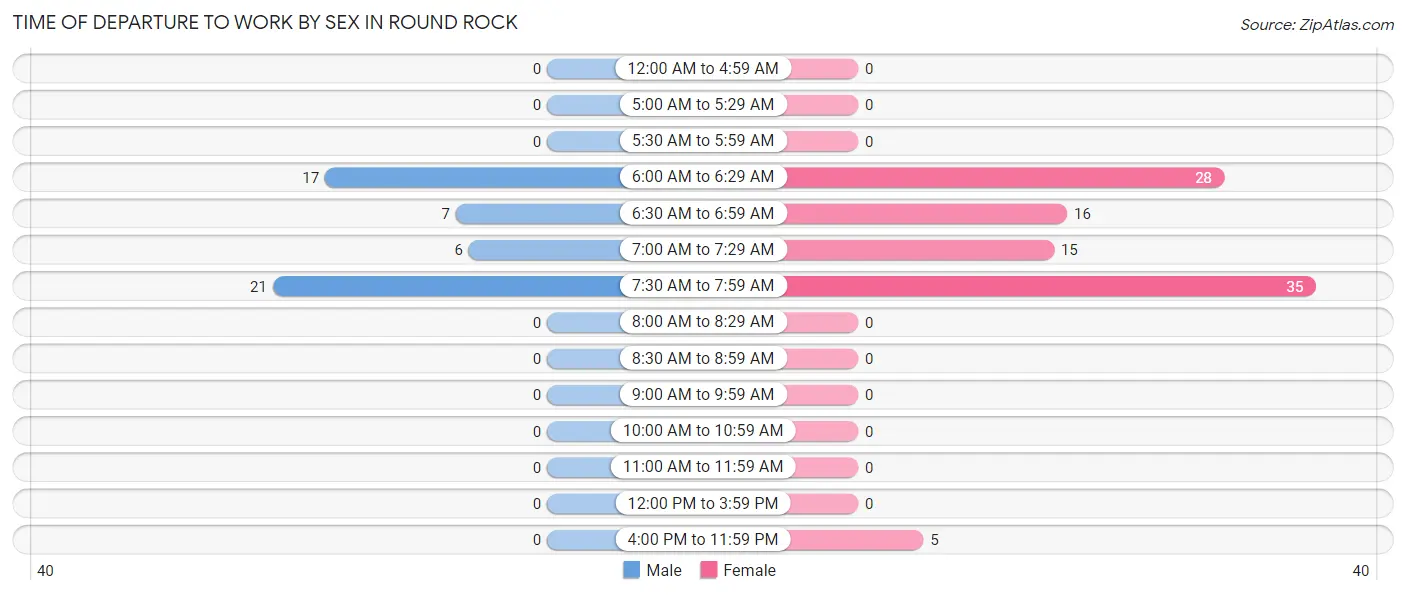
| Time of Departure | Male | Female |
| 12:00 AM to 4:59 AM | 0 (0.0%) | 0 (0.0%) |
| 5:00 AM to 5:29 AM | 0 (0.0%) | 0 (0.0%) |
| 5:30 AM to 5:59 AM | 0 (0.0%) | 0 (0.0%) |
| 6:00 AM to 6:29 AM | 17 (33.3%) | 28 (28.3%) |
| 6:30 AM to 6:59 AM | 7 (13.7%) | 16 (16.2%) |
| 7:00 AM to 7:29 AM | 6 (11.8%) | 15 (15.1%) |
| 7:30 AM to 7:59 AM | 21 (41.2%) | 35 (35.3%) |
| 8:00 AM to 8:29 AM | 0 (0.0%) | 0 (0.0%) |
| 8:30 AM to 8:59 AM | 0 (0.0%) | 0 (0.0%) |
| 9:00 AM to 9:59 AM | 0 (0.0%) | 0 (0.0%) |
| 10:00 AM to 10:59 AM | 0 (0.0%) | 0 (0.0%) |
| 11:00 AM to 11:59 AM | 0 (0.0%) | 0 (0.0%) |
| 12:00 PM to 3:59 PM | 0 (0.0%) | 0 (0.0%) |
| 4:00 PM to 11:59 PM | 0 (0.0%) | 5 (5.1%) |
| Total | 51 (100.0%) | 99 (100.0%) |
Housing Occupancy in Round Rock
Occupancy by Ownership in Round Rock
Of the total 137 dwellings in Round Rock, owner-occupied units account for 116 (84.7%), while renter-occupied units make up 21 (15.3%).
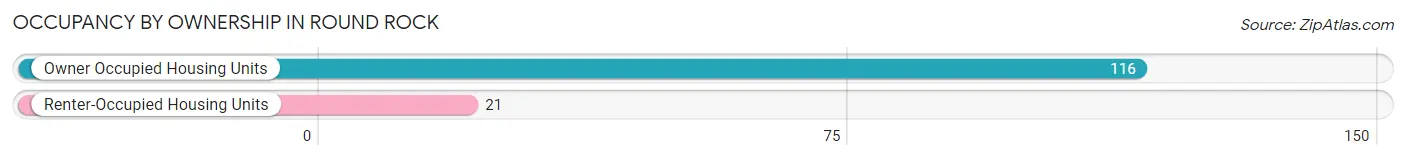
| Occupancy | # Housing Units | % Housing Units |
| Owner Occupied Housing Units | 116 | 84.7% |
| Renter-Occupied Housing Units | 21 | 15.3% |
| Total Occupied Housing Units | 137 | 100.0% |
Occupancy by Household Size in Round Rock
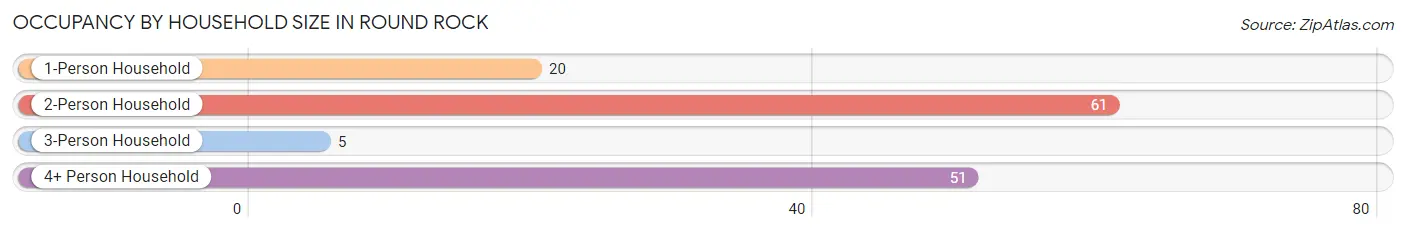
| Household Size | # Housing Units | % Housing Units |
| 1-Person Household | 20 | 14.6% |
| 2-Person Household | 61 | 44.5% |
| 3-Person Household | 5 | 3.6% |
| 4+ Person Household | 51 | 37.2% |
| Total Housing Units | 137 | 100.0% |
Occupancy by Ownership by Household Size in Round Rock
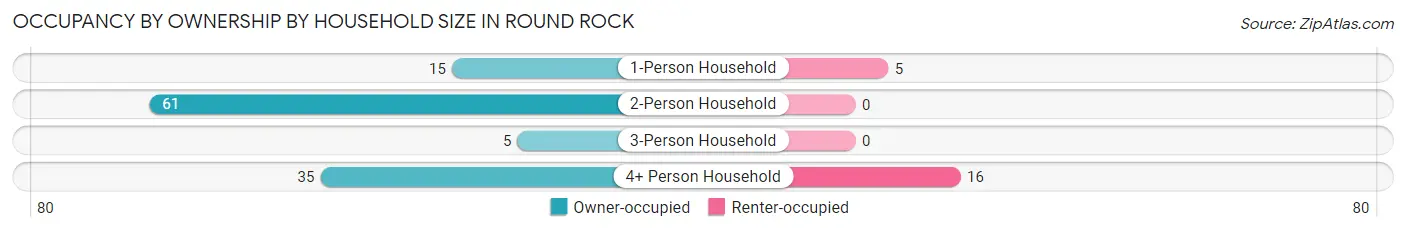
| Household Size | Owner-occupied | Renter-occupied |
| 1-Person Household | 15 (75.0%) | 5 (25.0%) |
| 2-Person Household | 61 (100.0%) | 0 (0.0%) |
| 3-Person Household | 5 (100.0%) | 0 (0.0%) |
| 4+ Person Household | 35 (68.6%) | 16 (31.4%) |
| Total Housing Units | 116 (84.7%) | 21 (15.3%) |
Occupancy by Educational Attainment in Round Rock
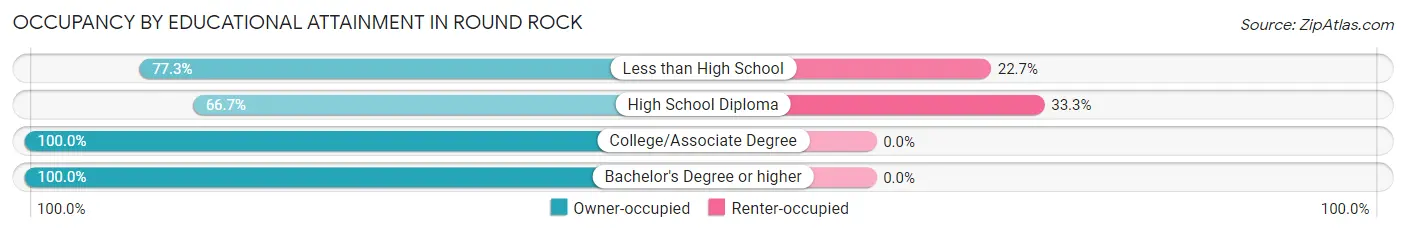
| Household Size | Owner-occupied | Renter-occupied |
| Less than High School | 34 (77.3%) | 10 (22.7%) |
| High School Diploma | 22 (66.7%) | 11 (33.3%) |
| College/Associate Degree | 43 (100.0%) | 0 (0.0%) |
| Bachelor's Degree or higher | 17 (100.0%) | 0 (0.0%) |
Occupancy by Age of Householder in Round Rock
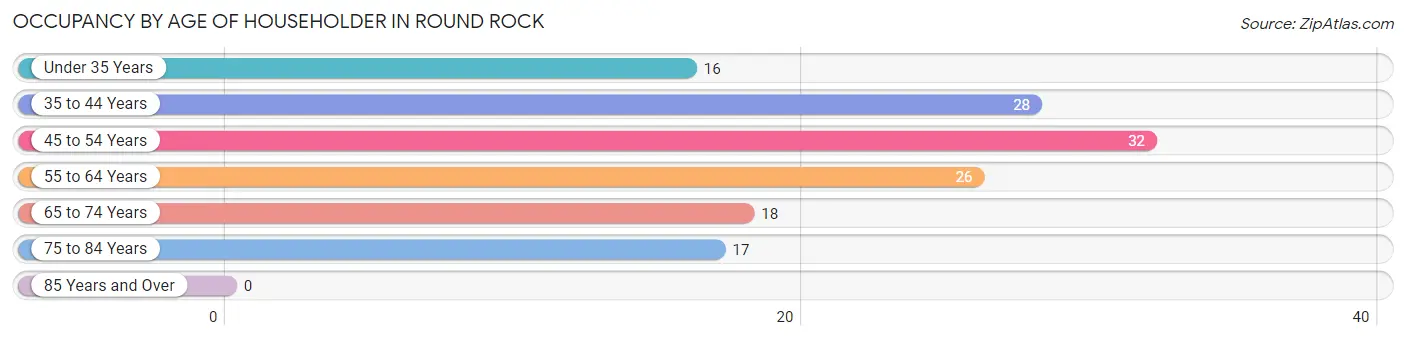
| Age Bracket | # Households | % Households |
| Under 35 Years | 16 | 11.7% |
| 35 to 44 Years | 28 | 20.4% |
| 45 to 54 Years | 32 | 23.4% |
| 55 to 64 Years | 26 | 19.0% |
| 65 to 74 Years | 18 | 13.1% |
| 75 to 84 Years | 17 | 12.4% |
| 85 Years and Over | 0 | 0.0% |
| Total | 137 | 100.0% |
Housing Finances in Round Rock
Median Income by Occupancy in Round Rock
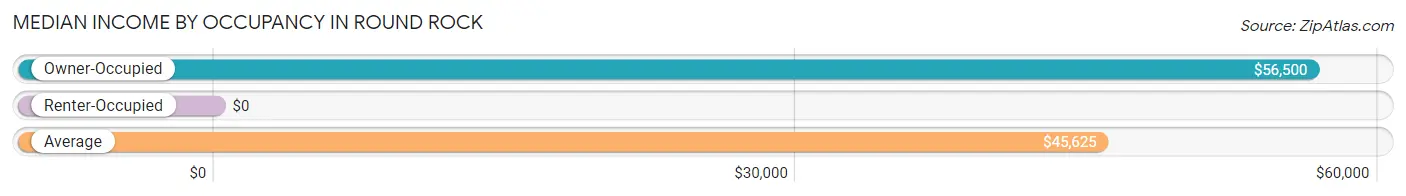
| Occupancy Type | # Households | Median Income |
| Owner-Occupied | 116 (84.7%) | $56,500 |
| Renter-Occupied | 21 (15.3%) | $0 |
| Average | 137 (100.0%) | $45,625 |
Occupancy by Householder Income Bracket in Round Rock
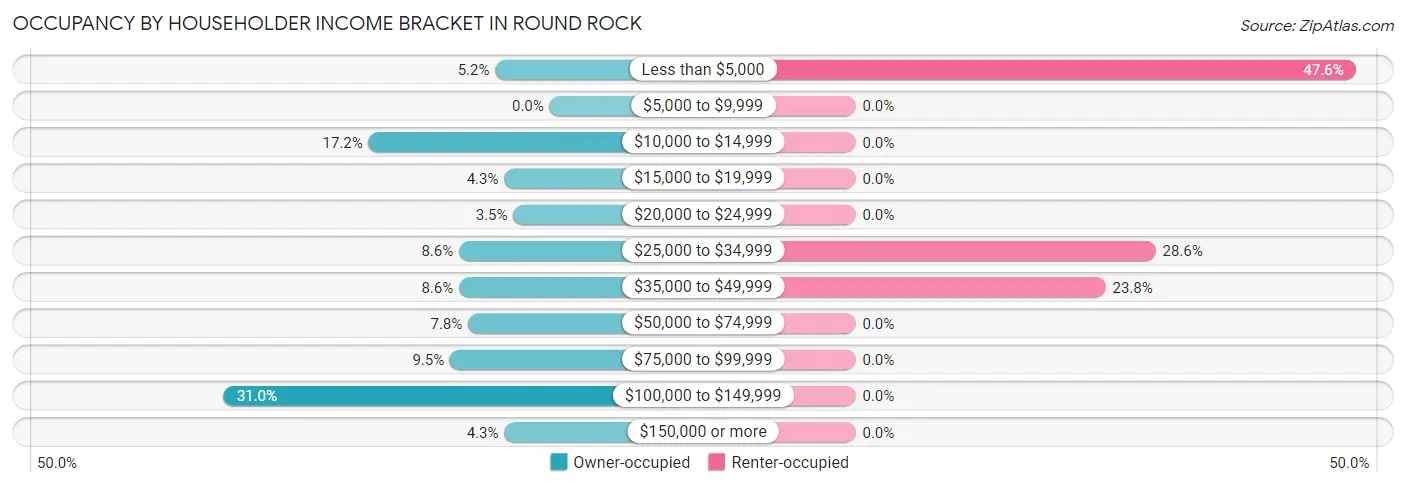
| Income Bracket | Owner-occupied | Renter-occupied |
| Less than $5,000 | 6 (5.2%) | 10 (47.6%) |
| $5,000 to $9,999 | 0 (0.0%) | 0 (0.0%) |
| $10,000 to $14,999 | 20 (17.2%) | 0 (0.0%) |
| $15,000 to $19,999 | 5 (4.3%) | 0 (0.0%) |
| $20,000 to $24,999 | 4 (3.5%) | 0 (0.0%) |
| $25,000 to $34,999 | 10 (8.6%) | 6 (28.6%) |
| $35,000 to $49,999 | 10 (8.6%) | 5 (23.8%) |
| $50,000 to $74,999 | 9 (7.8%) | 0 (0.0%) |
| $75,000 to $99,999 | 11 (9.5%) | 0 (0.0%) |
| $100,000 to $149,999 | 36 (31.0%) | 0 (0.0%) |
| $150,000 or more | 5 (4.3%) | 0 (0.0%) |
| Total | 116 (100.0%) | 21 (100.0%) |
Monthly Housing Cost Tiers in Round Rock
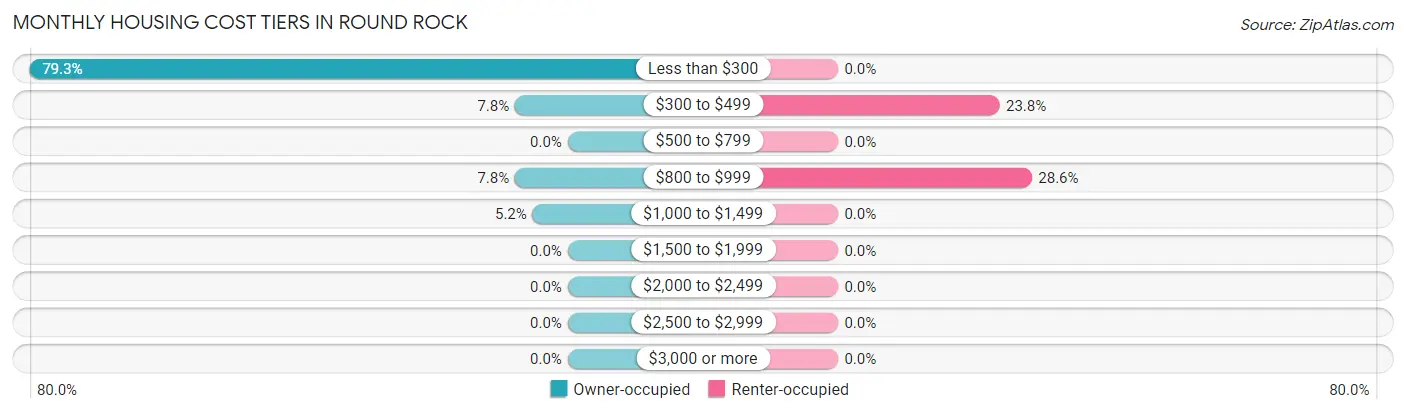
| Monthly Cost | Owner-occupied | Renter-occupied |
| Less than $300 | 92 (79.3%) | 0 (0.0%) |
| $300 to $499 | 9 (7.8%) | 5 (23.8%) |
| $500 to $799 | 0 (0.0%) | 0 (0.0%) |
| $800 to $999 | 9 (7.8%) | 6 (28.6%) |
| $1,000 to $1,499 | 6 (5.2%) | 0 (0.0%) |
| $1,500 to $1,999 | 0 (0.0%) | 0 (0.0%) |
| $2,000 to $2,499 | 0 (0.0%) | 0 (0.0%) |
| $2,500 to $2,999 | 0 (0.0%) | 0 (0.0%) |
| $3,000 or more | 0 (0.0%) | 0 (0.0%) |
| Total | 116 (100.0%) | 21 (100.0%) |
Physical Housing Characteristics in Round Rock
Housing Structures in Round Rock
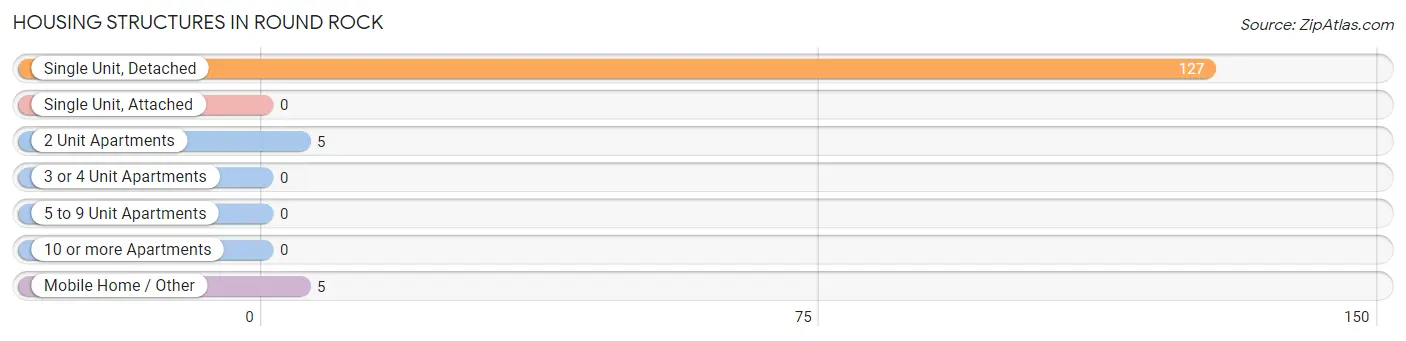
| Structure Type | # Housing Units | % Housing Units |
| Single Unit, Detached | 127 | 92.7% |
| Single Unit, Attached | 0 | 0.0% |
| 2 Unit Apartments | 5 | 3.6% |
| 3 or 4 Unit Apartments | 0 | 0.0% |
| 5 to 9 Unit Apartments | 0 | 0.0% |
| 10 or more Apartments | 0 | 0.0% |
| Mobile Home / Other | 5 | 3.6% |
| Total | 137 | 100.0% |
Housing Structures by Occupancy in Round Rock
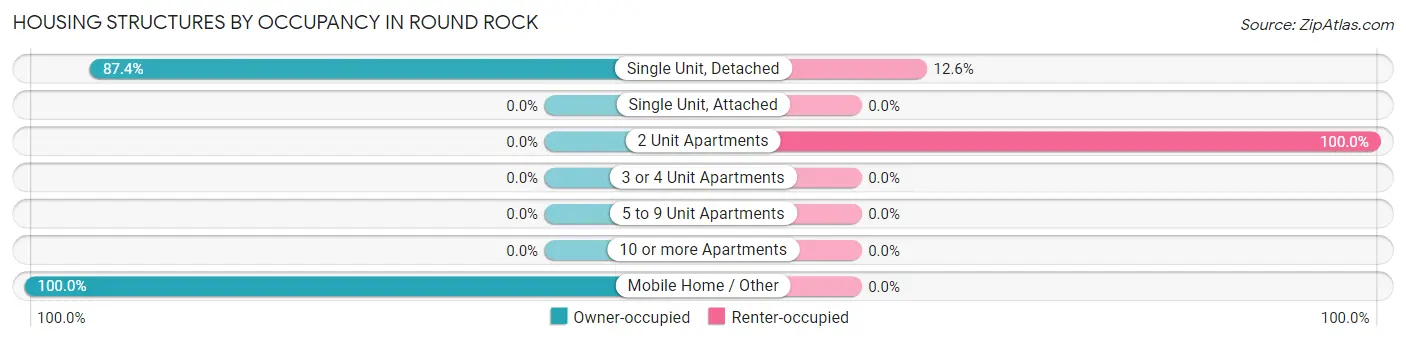
| Structure Type | Owner-occupied | Renter-occupied |
| Single Unit, Detached | 111 (87.4%) | 16 (12.6%) |
| Single Unit, Attached | 0 (0.0%) | 0 (0.0%) |
| 2 Unit Apartments | 0 (0.0%) | 5 (100.0%) |
| 3 or 4 Unit Apartments | 0 (0.0%) | 0 (0.0%) |
| 5 to 9 Unit Apartments | 0 (0.0%) | 0 (0.0%) |
| 10 or more Apartments | 0 (0.0%) | 0 (0.0%) |
| Mobile Home / Other | 5 (100.0%) | 0 (0.0%) |
| Total | 116 (84.7%) | 21 (15.3%) |
Housing Structures by Number of Rooms in Round Rock
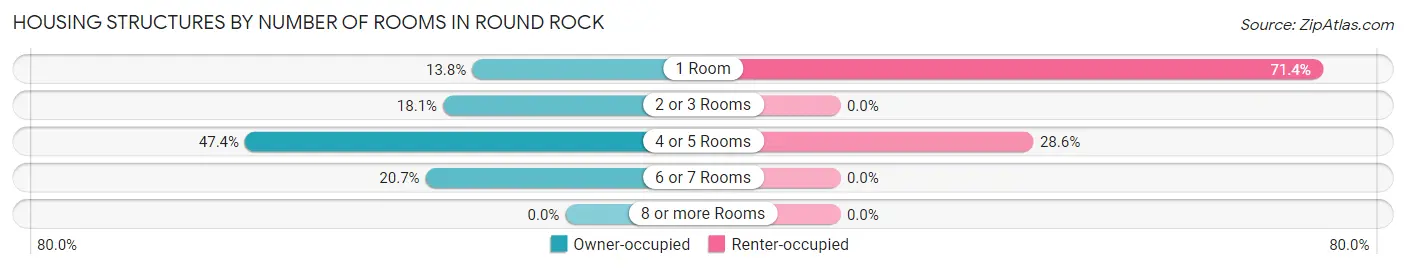
| Number of Rooms | Owner-occupied | Renter-occupied |
| 1 Room | 16 (13.8%) | 15 (71.4%) |
| 2 or 3 Rooms | 21 (18.1%) | 0 (0.0%) |
| 4 or 5 Rooms | 55 (47.4%) | 6 (28.6%) |
| 6 or 7 Rooms | 24 (20.7%) | 0 (0.0%) |
| 8 or more Rooms | 0 (0.0%) | 0 (0.0%) |
| Total | 116 (100.0%) | 21 (100.0%) |
Housing Structure by Heating Type in Round Rock
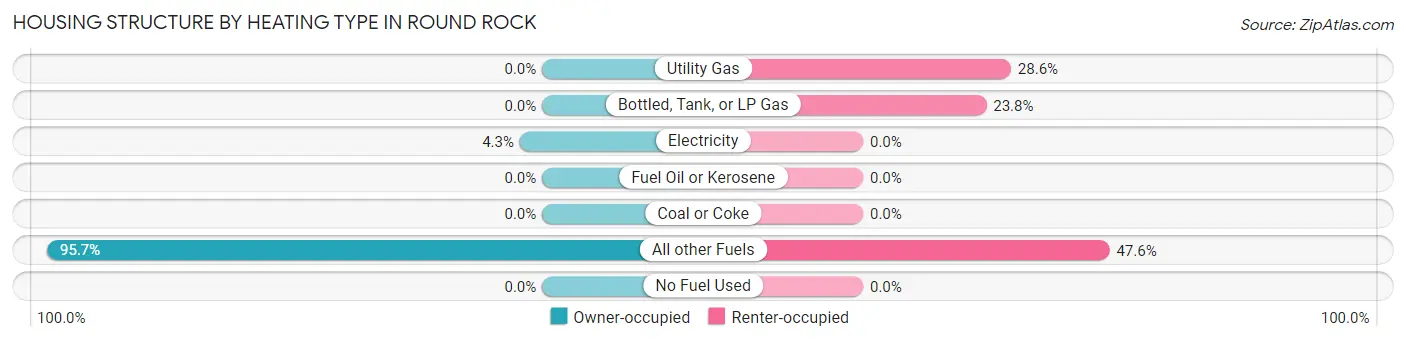
| Heating Type | Owner-occupied | Renter-occupied |
| Utility Gas | 0 (0.0%) | 6 (28.6%) |
| Bottled, Tank, or LP Gas | 0 (0.0%) | 5 (23.8%) |
| Electricity | 5 (4.3%) | 0 (0.0%) |
| Fuel Oil or Kerosene | 0 (0.0%) | 0 (0.0%) |
| Coal or Coke | 0 (0.0%) | 0 (0.0%) |
| All other Fuels | 111 (95.7%) | 10 (47.6%) |
| No Fuel Used | 0 (0.0%) | 0 (0.0%) |
| Total | 116 (100.0%) | 21 (100.0%) |
Household Vehicle Usage in Round Rock
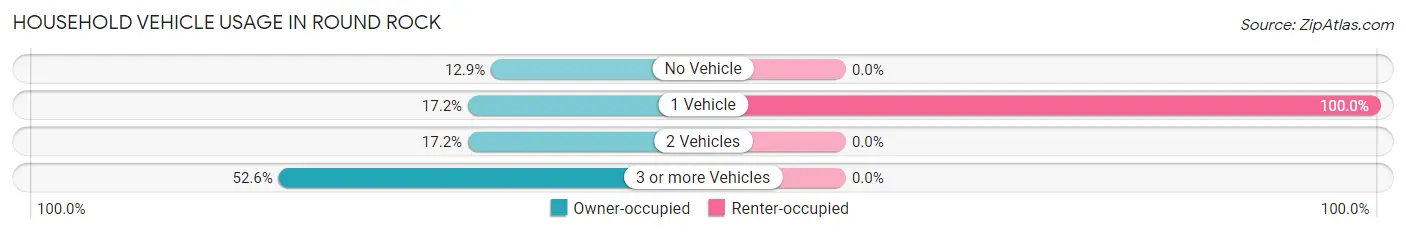
| Vehicles per Household | Owner-occupied | Renter-occupied |
| No Vehicle | 15 (12.9%) | 0 (0.0%) |
| 1 Vehicle | 20 (17.2%) | 21 (100.0%) |
| 2 Vehicles | 20 (17.2%) | 0 (0.0%) |
| 3 or more Vehicles | 61 (52.6%) | 0 (0.0%) |
| Total | 116 (100.0%) | 21 (100.0%) |
Real Estate & Mortgages in Round Rock
Real Estate and Mortgage Overview in Round Rock
| Characteristic | Without Mortgage | With Mortgage |
| Housing Units | 101 | 15 |
| Median Property Value | $49,400 | $96,800 |
| Median Household Income | - | - |
| Monthly Housing Costs | $169 | $0 |
| Real Estate Taxes | - | - |
Property Value by Mortgage Status in Round Rock
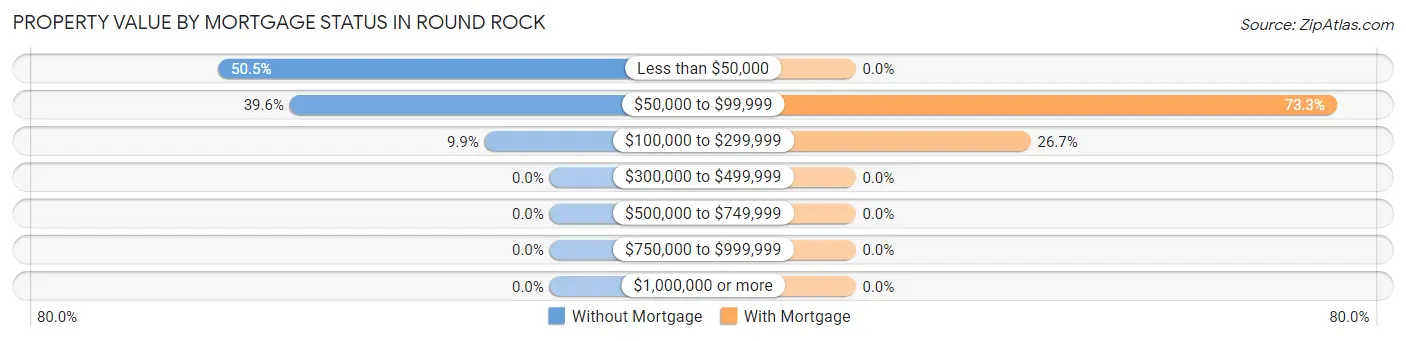
| Property Value | Without Mortgage | With Mortgage |
| Less than $50,000 | 51 (50.5%) | 0 (0.0%) |
| $50,000 to $99,999 | 40 (39.6%) | 11 (73.3%) |
| $100,000 to $299,999 | 10 (9.9%) | 4 (26.7%) |
| $300,000 to $499,999 | 0 (0.0%) | 0 (0.0%) |
| $500,000 to $749,999 | 0 (0.0%) | 0 (0.0%) |
| $750,000 to $999,999 | 0 (0.0%) | 0 (0.0%) |
| $1,000,000 or more | 0 (0.0%) | 0 (0.0%) |
| Total | 101 (100.0%) | 15 (100.0%) |
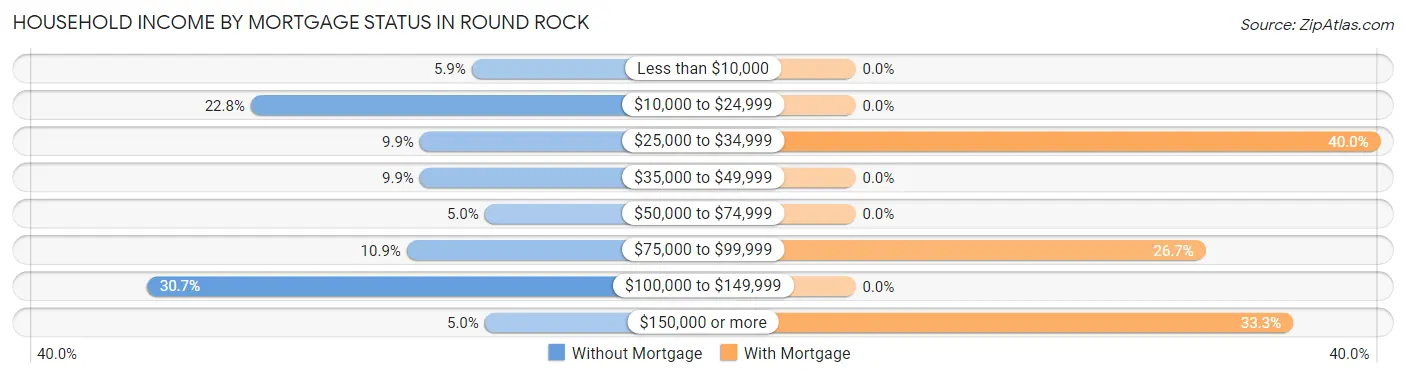
Household Income by Mortgage Status in Round Rock
| Household Income | Without Mortgage | With Mortgage |
| Less than $10,000 | 6 (5.9%) | 0 (0.0%) |
| $10,000 to $24,999 | 23 (22.8%) | 0 (0.0%) |
| $25,000 to $34,999 | 10 (9.9%) | 6 (40.0%) |
| $35,000 to $49,999 | 10 (9.9%) | 0 (0.0%) |
| $50,000 to $74,999 | 5 (5.0%) | 0 (0.0%) |
| $75,000 to $99,999 | 11 (10.9%) | 4 (26.7%) |
| $100,000 to $149,999 | 31 (30.7%) | 0 (0.0%) |
| $150,000 or more | 5 (5.0%) | 5 (33.3%) |
| Total | 101 (100.0%) | 15 (100.0%) |
Property Value to Household Income Ratio in Round Rock
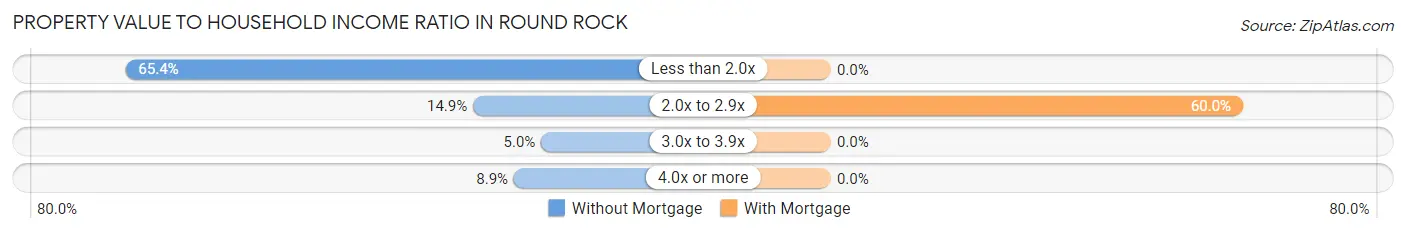
| Value-to-Income Ratio | Without Mortgage | With Mortgage |
| Less than 2.0x | 66 (65.3%) | 0 (0.0%) |
| 2.0x to 2.9x | 15 (14.8%) | 9 (60.0%) |
| 3.0x to 3.9x | 5 (5.0%) | 0 (0.0%) |
| 4.0x or more | 9 (8.9%) | 0 (0.0%) |
| Total | 101 (100.0%) | 15 (100.0%) |
Real Estate Taxes by Mortgage Status in Round Rock
| Property Taxes | Without Mortgage | With Mortgage |
| Less than $800 | 0 (0.0%) | 0 (0.0%) |
| $800 to $1,499 | 0 (0.0%) | 0 (0.0%) |
| $800 to $1,499 | 0 (0.0%) | 0 (0.0%) |
| Total | 101 (100.0%) | 15 (100.0%) |
Health & Disability in Round Rock
Health Insurance Coverage by Age in Round Rock
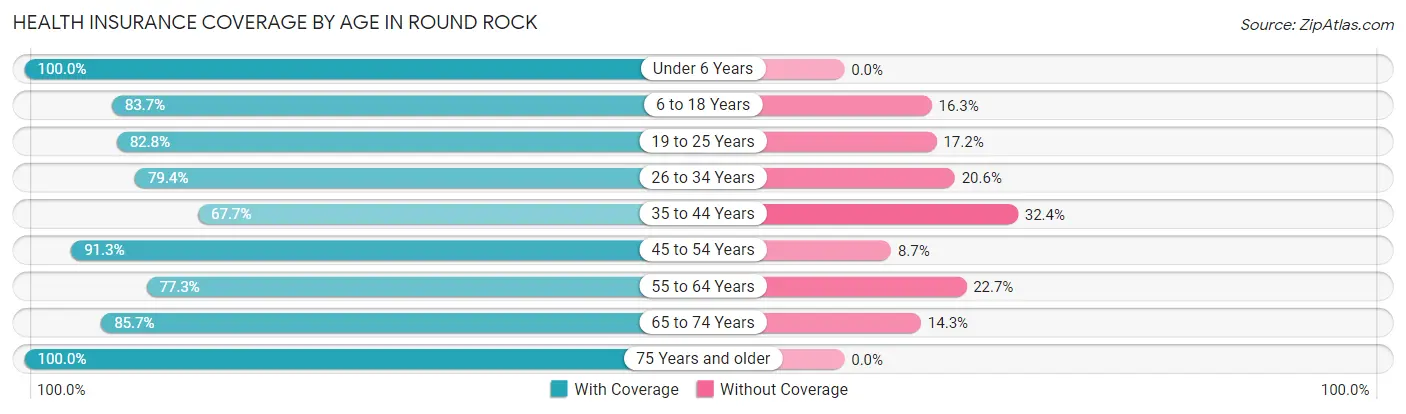
| Age Bracket | With Coverage | Without Coverage |
| Under 6 Years | 54 (100.0%) | 0 (0.0%) |
| 6 to 18 Years | 175 (83.7%) | 34 (16.3%) |
| 19 to 25 Years | 53 (82.8%) | 11 (17.2%) |
| 26 to 34 Years | 27 (79.4%) | 7 (20.6%) |
| 35 to 44 Years | 46 (67.6%) | 22 (32.4%) |
| 45 to 54 Years | 63 (91.3%) | 6 (8.7%) |
| 55 to 64 Years | 34 (77.3%) | 10 (22.7%) |
| 65 to 74 Years | 24 (85.7%) | 4 (14.3%) |
| 75 Years and older | 20 (100.0%) | 0 (0.0%) |
| Total | 496 (84.1%) | 94 (15.9%) |
Health Insurance Coverage by Citizenship Status in Round Rock
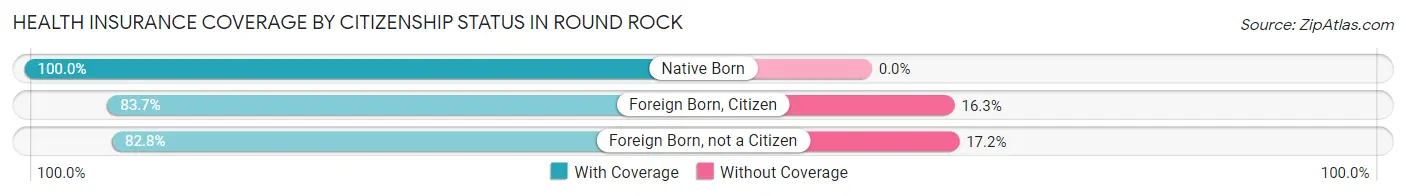
| Citizenship Status | With Coverage | Without Coverage |
| Native Born | 54 (100.0%) | 0 (0.0%) |
| Foreign Born, Citizen | 175 (83.7%) | 34 (16.3%) |
| Foreign Born, not a Citizen | 53 (82.8%) | 11 (17.2%) |
Health Insurance Coverage by Household Income in Round Rock
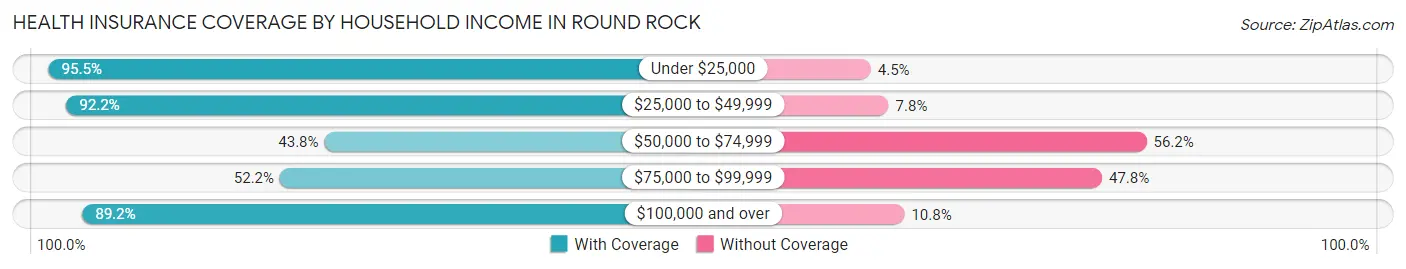
| Household Income | With Coverage | Without Coverage |
| Under $25,000 | 127 (95.5%) | 6 (4.5%) |
| $25,000 to $49,999 | 94 (92.2%) | 8 (7.8%) |
| $50,000 to $74,999 | 32 (43.8%) | 41 (56.2%) |
| $75,000 to $99,999 | 12 (52.2%) | 11 (47.8%) |
| $100,000 and over | 231 (89.2%) | 28 (10.8%) |
Public vs Private Health Insurance Coverage by Age in Round Rock
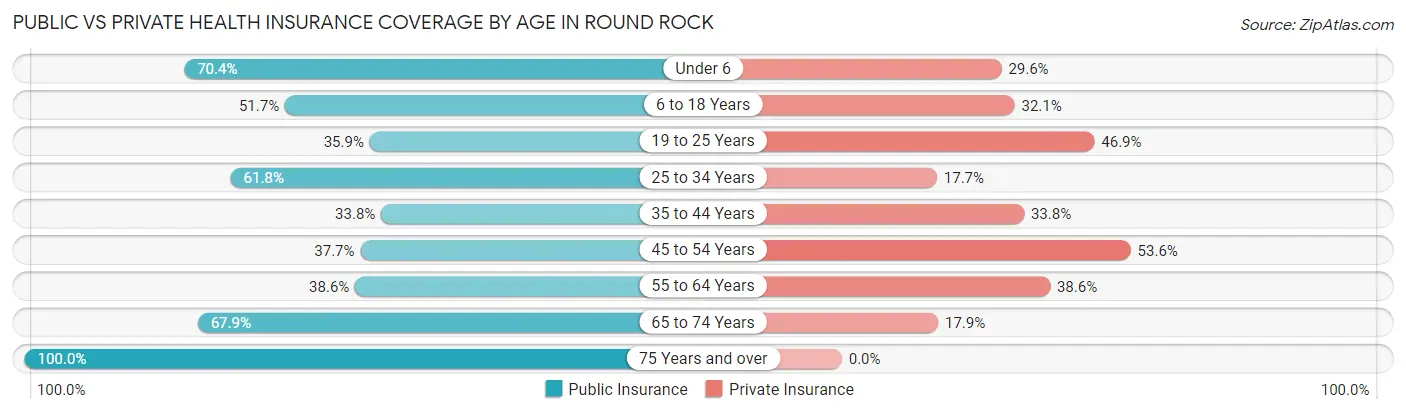
| Age Bracket | Public Insurance | Private Insurance |
| Under 6 | 38 (70.4%) | 16 (29.6%) |
| 6 to 18 Years | 108 (51.7%) | 67 (32.1%) |
| 19 to 25 Years | 23 (35.9%) | 30 (46.9%) |
| 25 to 34 Years | 21 (61.8%) | 6 (17.6%) |
| 35 to 44 Years | 23 (33.8%) | 23 (33.8%) |
| 45 to 54 Years | 26 (37.7%) | 37 (53.6%) |
| 55 to 64 Years | 17 (38.6%) | 17 (38.6%) |
| 65 to 74 Years | 19 (67.9%) | 5 (17.9%) |
| 75 Years and over | 20 (100.0%) | 0 (0.0%) |
| Total | 295 (50.0%) | 201 (34.1%) |
Disability Status by Sex by Age in Round Rock

| Age Bracket | Male | Female |
| Under 5 Years | 0 (0.0%) | 0 (0.0%) |
| 5 to 17 Years | 10 (9.6%) | 0 (0.0%) |
| 18 to 34 Years | 11 (39.3%) | 0 (0.0%) |
| 35 to 64 Years | 0 (0.0%) | 0 (0.0%) |
| 65 to 74 Years | 0 (0.0%) | 0 (0.0%) |
| 75 Years and over | 7 (100.0%) | 0 (0.0%) |
Disability Class by Sex by Age in Round Rock
Disability Class: Hearing Difficulty
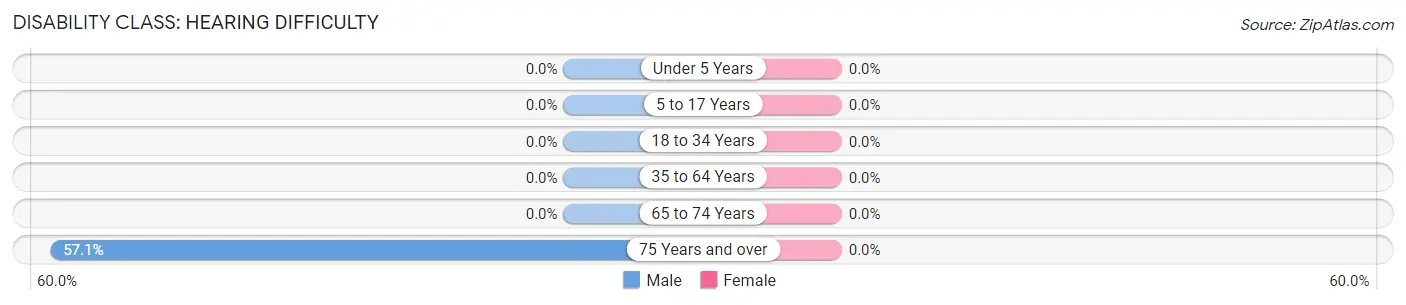
| Age Bracket | Male | Female |
| Under 5 Years | 0 (0.0%) | 0 (0.0%) |
| 5 to 17 Years | 0 (0.0%) | 0 (0.0%) |
| 18 to 34 Years | 0 (0.0%) | 0 (0.0%) |
| 35 to 64 Years | 0 (0.0%) | 0 (0.0%) |
| 65 to 74 Years | 0 (0.0%) | 0 (0.0%) |
| 75 Years and over | 4 (57.1%) | 0 (0.0%) |
Disability Class: Vision Difficulty
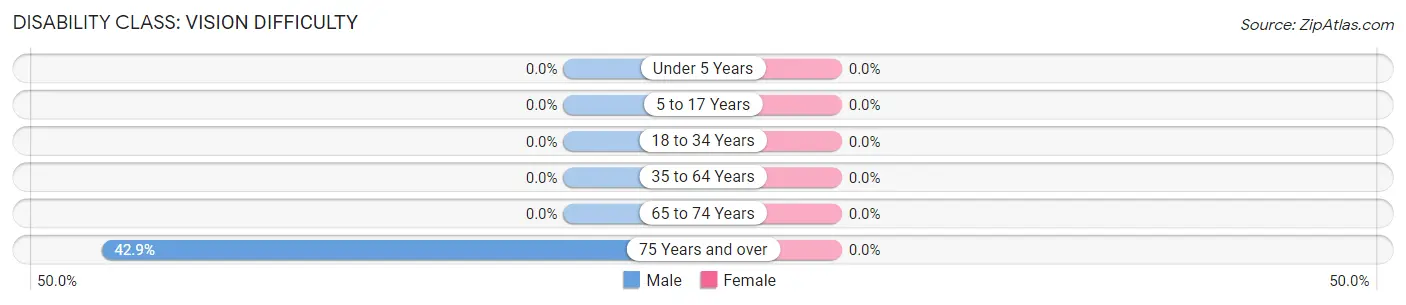
| Age Bracket | Male | Female |
| Under 5 Years | 0 (0.0%) | 0 (0.0%) |
| 5 to 17 Years | 0 (0.0%) | 0 (0.0%) |
| 18 to 34 Years | 0 (0.0%) | 0 (0.0%) |
| 35 to 64 Years | 0 (0.0%) | 0 (0.0%) |
| 65 to 74 Years | 0 (0.0%) | 0 (0.0%) |
| 75 Years and over | 3 (42.9%) | 0 (0.0%) |
Disability Class: Cognitive Difficulty
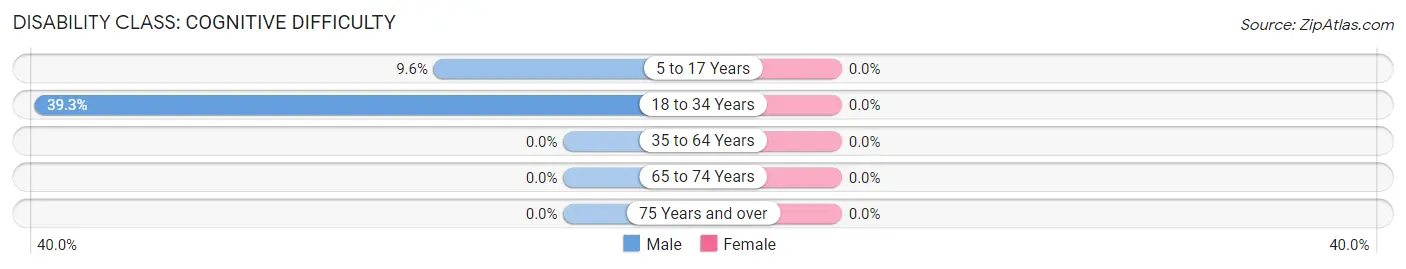
| Age Bracket | Male | Female |
| 5 to 17 Years | 10 (9.6%) | 0 (0.0%) |
| 18 to 34 Years | 11 (39.3%) | 0 (0.0%) |
| 35 to 64 Years | 0 (0.0%) | 0 (0.0%) |
| 65 to 74 Years | 0 (0.0%) | 0 (0.0%) |
| 75 Years and over | 0 (0.0%) | 0 (0.0%) |
Disability Class: Ambulatory Difficulty
| Age Bracket | Male | Female |
| 5 to 17 Years | 0 (0.0%) | 0 (0.0%) |
| 18 to 34 Years | 0 (0.0%) | 0 (0.0%) |
| 35 to 64 Years | 0 (0.0%) | 0 (0.0%) |
| 65 to 74 Years | 0 (0.0%) | 0 (0.0%) |
| 75 Years and over | 0 (0.0%) | 0 (0.0%) |
Disability Class: Self-Care Difficulty
| Age Bracket | Male | Female |
| 5 to 17 Years | 0 (0.0%) | 0 (0.0%) |
| 18 to 34 Years | 0 (0.0%) | 0 (0.0%) |
| 35 to 64 Years | 0 (0.0%) | 0 (0.0%) |
| 65 to 74 Years | 0 (0.0%) | 0 (0.0%) |
| 75 Years and over | 0 (0.0%) | 0 (0.0%) |
Technology Access in Round Rock
Computing Device Access in Round Rock
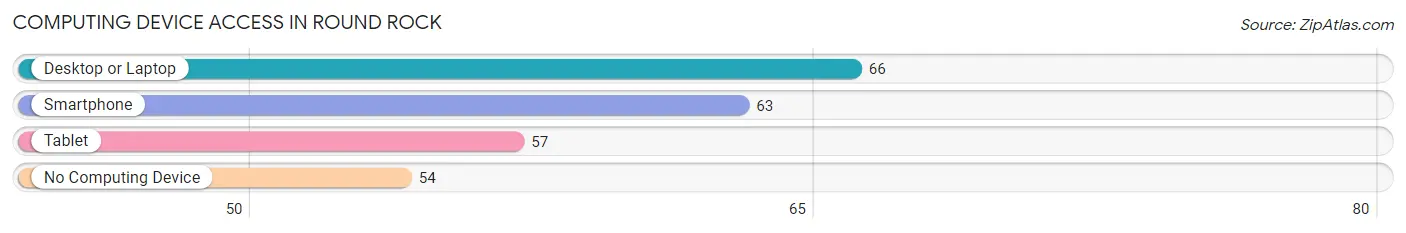
| Device Type | # Households | % Households |
| Desktop or Laptop | 66 | 48.2% |
| Smartphone | 63 | 46.0% |
| Tablet | 57 | 41.6% |
| No Computing Device | 54 | 39.4% |
| Total | 137 | 100.0% |
Internet Access in Round Rock
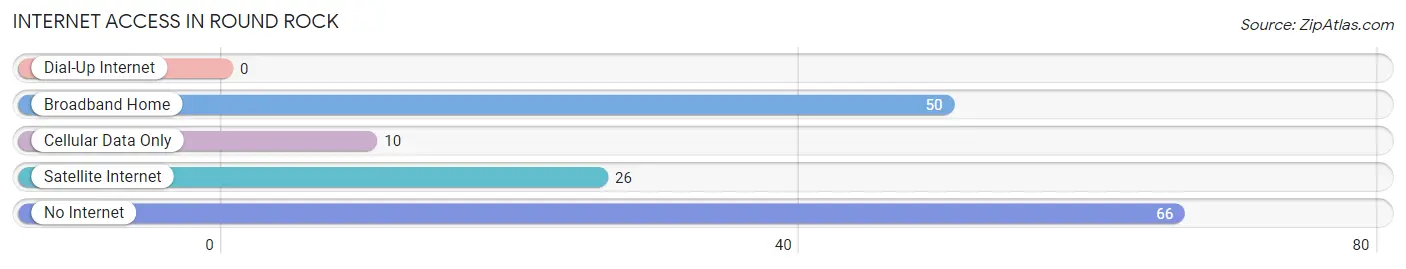
| Internet Type | # Households | % Households |
| Dial-Up Internet | 0 | 0.0% |
| Broadband Home | 50 | 36.5% |
| Cellular Data Only | 10 | 7.3% |
| Satellite Internet | 26 | 19.0% |
| No Internet | 66 | 48.2% |
| Total | 137 | 100.0% |
Round Rock Summary
Round Rock, Arizona is a small town located in the northeastern corner of the state, near the border of New Mexico. It is part of Apache County, and is situated in the White Mountains region of Arizona. The town was founded in 1878 by a group of Mormon settlers, and was named after a nearby round rock formation. The town has a population of just over 1,000 people, and is known for its rural atmosphere and small-town charm.
Geography
Round Rock is located in the White Mountains region of Arizona, in the northeastern corner of the state. It is situated at an elevation of 6,000 feet, and is surrounded by the Apache-Sitgreaves National Forest. The town is located near the border of New Mexico, and is about a two-hour drive from the state capital of Phoenix. The town is situated in a valley, and is surrounded by mountains and hills. The climate in Round Rock is semi-arid, with hot summers and cold winters.
Economy
The economy of Round Rock is largely based on tourism and agriculture. The town is a popular destination for outdoor recreation, and is home to several campgrounds, hiking trails, and fishing spots. The town is also home to several small businesses, including restaurants, shops, and lodging. Agriculture is also an important part of the local economy, with cattle ranching and hay farming being the main industries.
Demographics
As of the 2010 census, the population of Round Rock was 1,037. The racial makeup of the town was 94.3% White, 0.7% Native American, 0.3% Asian, 0.2% African American, and 4.5% from other races. The median household income was $31,250, and the median age was 44.5 years.
History
Round Rock was founded in 1878 by a group of Mormon settlers. The town was named after a nearby round rock formation, and was originally a farming community. The town grew slowly over the years, and by the early 1900s, it had become a popular destination for outdoor recreation. In the 1950s, the town began to attract more tourists, and several businesses opened up to cater to them. In the 1970s, the town was incorporated, and it has remained a small, rural community ever since.
Conclusion
Round Rock, Arizona is a small town located in the northeastern corner of the state, near the border of New Mexico. It is part of Apache County, and is situated in the White Mountains region of Arizona. The town was founded in 1878 by a group of Mormon settlers, and is known for its rural atmosphere and small-town charm. The economy of Round Rock is largely based on tourism and agriculture, and the town is a popular destination for outdoor recreation. The population of Round Rock is just over 1,000 people, and the racial makeup of the town is 94.3% White, 0.7% Native American, 0.3% Asian, 0.2% African American, and 4.5% from other races. Round Rock is a small, rural community that has remained largely unchanged for over a century.
Common Questions
What is Per Capita Income in Round Rock?
Per Capita income in Round Rock is $14,939.
What is the Median Family Income in Round Rock?
Median Family Income in Round Rock is $56,250.
What is the Median Household income in Round Rock?
Median Household Income in Round Rock is $45,625.
What is Income or Wage Gap in Round Rock?
Income or Wage Gap in Round Rock is 6.1%.
Women in Round Rock earn 93.9 cents for every dollar earned by a man.
What is Inequality or Gini Index in Round Rock?
Inequality or Gini Index in Round Rock is 0.45.
What is the Total Population of Round Rock?
Total Population of Round Rock is 590.
What is the Total Male Population of Round Rock?
Total Male Population of Round Rock is 247.
What is the Total Female Population of Round Rock?
Total Female Population of Round Rock is 343.
What is the Ratio of Males per 100 Females in Round Rock?
There are 72.01 Males per 100 Females in Round Rock.
What is the Ratio of Females per 100 Males in Round Rock?
There are 138.87 Females per 100 Males in Round Rock.
What is the Median Population Age in Round Rock?
Median Population Age in Round Rock is 20.7 Years.
What is the Average Family Size in Round Rock
Average Family Size in Round Rock is 4.9 People.
What is the Average Household Size in Round Rock
Average Household Size in Round Rock is 4.3 People.
How Large is the Labor Force in Round Rock?
There are 187 People in the Labor Forcein in Round Rock.
What is the Percentage of People in the Labor Force in Round Rock?
48.6% of People are in the Labor Force in Round Rock.
What is the Unemployment Rate in Round Rock?
Unemployment Rate in Round Rock is 11.8%.