Immigrants from Spain vs Immigrants from Czechoslovakia No Vehicles in Household
COMPARE
Immigrants from Spain
Immigrants from Czechoslovakia
No Vehicles in Household
No Vehicles in Household Comparison
Immigrants from Spain
Immigrants from Czechoslovakia
14.5%
NO VEHICLES IN HOUSEHOLD
0.0/ 100
METRIC RATING
296th/ 347
METRIC RANK
11.8%
NO VEHICLES IN HOUSEHOLD
2.0/ 100
METRIC RATING
247th/ 347
METRIC RANK
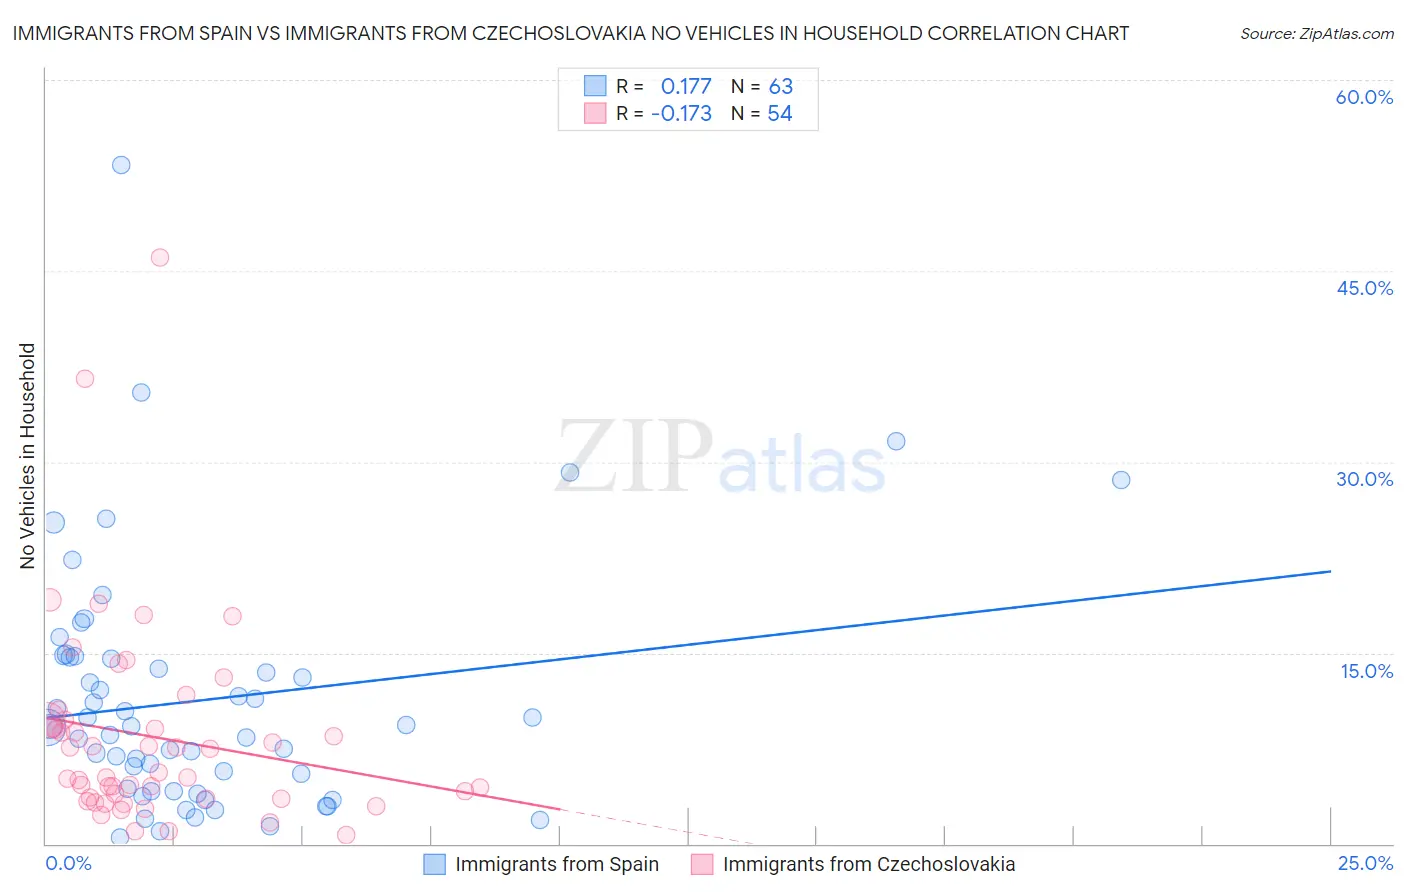
Immigrants from Spain vs Immigrants from Czechoslovakia No Vehicles in Household Correlation Chart
The statistical analysis conducted on geographies consisting of 239,372,096 people shows a poor positive correlation between the proportion of Immigrants from Spain and percentage of households with no vehicle available in the United States with a correlation coefficient (R) of 0.177 and weighted average of 14.5%. Similarly, the statistical analysis conducted on geographies consisting of 195,341,249 people shows a poor negative correlation between the proportion of Immigrants from Czechoslovakia and percentage of households with no vehicle available in the United States with a correlation coefficient (R) of -0.173 and weighted average of 11.8%, a difference of 23.4%.
No Vehicles in Household Correlation Summary
| Measurement | Immigrants from Spain | Immigrants from Czechoslovakia |
| Minimum | 0.51% | 0.65% |
| Maximum | 53.3% | 46.0% |
| Range | 52.8% | 45.4% |
| Mean | 11.3% | 8.4% |
| Median | 9.2% | 5.4% |
| Interquartile 25% (IQ1) | 4.1% | 3.6% |
| Interquartile 75% (IQ3) | 14.6% | 9.7% |
| Interquartile Range (IQR) | 10.5% | 6.1% |
| Standard Deviation (Sample) | 9.6% | 8.1% |
| Standard Deviation (Population) | 9.5% | 8.0% |
Similar Demographics by No Vehicles in Household
Demographics Similar to Immigrants from Spain by No Vehicles in Household
In terms of no vehicles in household, the demographic groups most similar to Immigrants from Spain are Immigrants from Panama (14.6%, a difference of 0.67%), Moroccan (14.7%, a difference of 0.82%), Immigrants from Greece (14.7%, a difference of 1.0%), Paraguayan (14.4%, a difference of 1.3%), and Belizean (14.3%, a difference of 1.5%).
| Demographics | Rating | Rank | No Vehicles in Household |
| Immigrants | Australia | 0.0 /100 | #289 | Tragic 13.8% |
| Indians (Asian) | 0.0 /100 | #290 | Tragic 14.1% |
| Okinawans | 0.0 /100 | #291 | Tragic 14.1% |
| Pima | 0.0 /100 | #292 | Tragic 14.1% |
| Immigrants | Jamaica | 0.0 /100 | #293 | Tragic 14.2% |
| Belizeans | 0.0 /100 | #294 | Tragic 14.3% |
| Paraguayans | 0.0 /100 | #295 | Tragic 14.4% |
| Immigrants | Spain | 0.0 /100 | #296 | Tragic 14.5% |
| Immigrants | Panama | 0.0 /100 | #297 | Tragic 14.6% |
| Moroccans | 0.0 /100 | #298 | Tragic 14.7% |
| Immigrants | Greece | 0.0 /100 | #299 | Tragic 14.7% |
| Yuman | 0.0 /100 | #300 | Tragic 14.9% |
| Immigrants | Ukraine | 0.0 /100 | #301 | Tragic 14.9% |
| Haitians | 0.0 /100 | #302 | Tragic 14.9% |
| Immigrants | Western Africa | 0.0 /100 | #303 | Tragic 15.0% |
Demographics Similar to Immigrants from Czechoslovakia by No Vehicles in Household
In terms of no vehicles in household, the demographic groups most similar to Immigrants from Czechoslovakia are Immigrants from Belgium (11.8%, a difference of 0.010%), Immigrants from Nigeria (11.8%, a difference of 0.040%), Menominee (11.8%, a difference of 0.050%), Immigrants from Honduras (11.8%, a difference of 0.22%), and Paiute (11.8%, a difference of 0.26%).
| Demographics | Rating | Rank | No Vehicles in Household |
| Immigrants | Immigrants | 2.7 /100 | #240 | Tragic 11.7% |
| Eastern Europeans | 2.7 /100 | #241 | Tragic 11.7% |
| Turks | 2.6 /100 | #242 | Tragic 11.7% |
| Cheyenne | 2.4 /100 | #243 | Tragic 11.7% |
| Immigrants | Portugal | 2.2 /100 | #244 | Tragic 11.7% |
| Immigrants | Honduras | 2.1 /100 | #245 | Tragic 11.8% |
| Menominee | 2.0 /100 | #246 | Tragic 11.8% |
| Immigrants | Czechoslovakia | 2.0 /100 | #247 | Tragic 11.8% |
| Immigrants | Belgium | 1.9 /100 | #248 | Tragic 11.8% |
| Immigrants | Nigeria | 1.9 /100 | #249 | Tragic 11.8% |
| Paiute | 1.8 /100 | #250 | Tragic 11.8% |
| Blacks/African Americans | 1.6 /100 | #251 | Tragic 11.9% |
| Immigrants | Serbia | 1.5 /100 | #252 | Tragic 11.9% |
| Egyptians | 1.4 /100 | #253 | Tragic 11.9% |
| Immigrants | Uruguay | 1.3 /100 | #254 | Tragic 11.9% |